Abstract
Pre-mining grouting is an effective means to prevent mine water inrush, while the microseismicity information induced by pre-mining grouting is often ignored. This paper proposes a novel method to predict the danger of mine floor water inrush based on pre-mining grouting-induced microseismicity (PMGIM). The mechanical mechanism and characteristics of PMGIM are explored through mechanical analysis and numerical simulation. Taking 182602 working face in Wutongzhuang coal mine as a case study, the temporal and spatial distribution law of PMGIM is analyzed, and the connection between the grouting process and microseismic energy is established. Based on the PMGIM information, Moran’s index is used for the prediction of water inrush possibility, and the validity of the method is verified by electric monitoring.
1. Introduction
About 27% of China’s proven coal resources are exposed to different degrees of water hazards, of which the floor water inrush hazard is particularly prominent in North China [1,2]. With the gradual increase in the depth of coal mining in China, the spatial relationship between the panel and the aquifer is more complicated, and the environment of geo-stress and permeability pressure is more variable; the severity and frequency of the occurrence of water inrush generally increase. Researchers have made many advances through statistical methods [3,4], mechanical analysis [5,6], numerical simulation [7,8], physical experiments [9,10], and other research methods, which have effectively revealed the mechanism of floor water inrush and proposed a variety of prevention and control methods. All of the above methods make too many assumptions, and the reality of the geological environment is very complex and variable, so there are often limitations for practical problems.
Microseismic monitoring is a non-destructive, real-time, dynamic, large-scale observation measurement technology [11,12], through monitoring the propagation of elastic waves in the stratum, it can reflect the performance of faults, joints, and other discontinuous complex structures, water conduction channels, hydraulic source, and other information [13,14]. With the rapid development of computer technology and three-dimensional visualization in recent years, it has been more widely used in the prevention of coal mine water inrush. Moment tensor inversion (MTI) theory was introduced in early seismic studies [15,16]. Microseismic information can be described mathematically using MTI theory, and so microseismicity due to rock fracture can be expressed as a linear combination of moments, which will be very helpful in understanding the type and mechanism of fracture [17].
In terms of application in the field, Jiang et al. [18] obtained the measured parameters such as the activation pattern of the geological structure, the depth of the floor damage zone, the height of the fractured zone, and the size of the reasonable coal pillar through the three-dimensional display of the microseismic positioning results. Sun and Wang [19] established a prediction model of water-conducting channel based on microseismic monitoring signal mutation analysis by fitting the activation damage depth data from on-site microseismic monitoring. Jin et al. [20] developed a method of identifying water-conducting channels based on the inversion of microseismic energy density and rupture connectivity of the rock layer, and verified it in the field by visual resistivity monitoring data. Zhou et al. [21] utilized microseismic monitoring to classify the water-conducting channels into four types and find the weak areas of the grouting curtain, which compensates well for the weak links of water inrush. The above research results can be used to locate the position and types of water-conducting channels, classify the areas with high water-surge potential, and be applied in the prevention and control of water hazards on the floor and roof dynamic disasters in coal mines through microseismic monitoring. However, they all belong to the monitoring during the process of engineering disturbance and lack of timeliness, which means that violent water inrush accidents cannot be avoided if the water-conducting channel is connected to a water source with high water pressure and high water volume. There is a lack of research on the distribution patterns of microseismicity events induced by other man-made works (floor grouting, etc.) during the period when the working face has not yet been mined, and whether it can be used as an indicator for predicting water inrush. We refer to the microseismicity induced by grouting works prior to coal seam mining as “Pre-mining Grouting-induced Microseismicity, PMGIM”.
The purpose of this study is to propose a method that can predict the water inrush hazardous area in advance through the microseismicity-based information generated by the pre-mining grouting project. The mechanism of pre-mining microseismicity induced by grouting is explained by mechanical analysis and numerical simulation, and the temporal and spatial distribution characteristics and evolutional law of microseismicity induced by grouting area management in the working face during the pre-mining period are obtained by analyzing the measured data on site with the Wutongzhuang 182602 working face as the background. A prediction method of water inrush hazardous areas in the working face is proposed to provide a theoretical basis for the detection of hydrological anomalies and potential water inrush hazardous areas by using PMGIM.
2. PMGIM Induction Mechanism
2.1. Mechanical Analysis
The primary objective of grouting treatment in water-inrush-prone working faces is to utilize high-pressure slurry to displace water, thereby converting fractured aquifers into relatively impermeable barriers. The grouting treatment process can be categorized into three distinct stages: filling grouting, pressure-boost penetration grouting, and high-pressure expansion. During pressurized seepage grouting and high-pressure expansion grouting, the slurry initially permeates into fractures through seepage, gradually filling the fracture spaces [22]. As the amount of grouting increases and due to the incompressibility of the grout, internal pressure is exerted on the fracture walls, generating tangential tensile stress. When this tangential tensile stress surpasses the combined bonding force of secondary weak surfaces and the original tangential stress, the grout causes these weak surfaces to crack and further extends the fractures. The fractures continue to expand and extend until the grouting pressure can no longer induce further extension. Varying degrees of microseismic events are triggered by fracture initiation, propagation, and extension.
In this study, the rock mass is modeled as an elastic semi-infinite body. Assuming the rock mass to be a homogeneous and isotropic elastic medium, the stress state around the grouting hole can be simplified as a plane strain problem. Typically, grouting holes in these projects are circular; therefore, the established model of a flat circular hole is shown in Figure 1. The rock mass surrounding the grouting hole experiences two principal stresses that are unequal and perpendicular to each other in the horizontal direction. Here, δ1 represents the maximum principal stress, and δ3 denotes the minimum principal stress. The rock mass around the circular hole is subjected to radial stress (δr), circumferential stress (δθ), and shear stress (δrθ) at a distance (r) from the hole wall to the center of the grouting hole and at an angle (θ) with the X-axis.
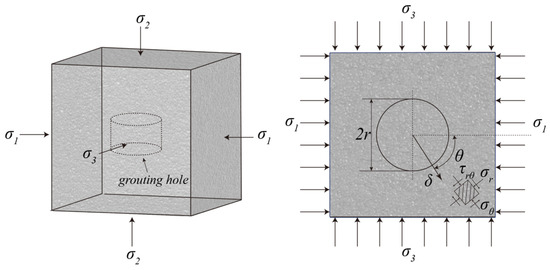
Figure 1.
Stress state of the rock mass around the grouting borehole.
According to elasticity theory, the stress state around an unlined hole in polar coordinates is given by the following:
where r is the radius of the drilling hole, δ is the radial distance, P0 is the grout weight pressure, and Pd is the grouting pump pressure, which is zero during the filling and grouting stage.
When r = δ, the stress state around the hole is as follows:
According to the maximum tensile stress failure criterion, the crack propagates along the path of least resistance. Specifically, when θ = 0° or θ = 180°, δθ = δθmin, and the crack extends in the direction perpendicular to the minimum principal stress. The mechanical criterion for the grouting pump pressure required for crack initiation is as follows:
Considering the increase in tangential stress due to radial seepage of slurry caused by the interaction between grouting pressure and pore water pressure Pi, the criterion for grouting pump pressure required for crack initiation is as follows:
where Δδθ represents the tangential stress increase, B represents the Biot constant of the rock mass, and μ represents the Poisson ratio of the rock mass.
Following crack initiation, as the grouting amount increases continuously and the grouting pump pressure is continuously supplied, primary and secondary cracks in the rock mass expand further. The cracks induced by grouting are considered Griffith cracks, with an extension length of 2L [23].
When the fracture is horizontal, the stress intensity factor KI−1 is as follows:
When the fracture is vertical, the stress intensity factor KI−2 is as follows:
When KI exceeds the critical stress intensity factor KIC, cracks continue to expand and propagate under the influence of pumping pressure, thereby triggering various degrees of microseismic events during this process.
2.2. Numerical Simulation Analysis of PMGIM
2.2.1. Numerical Methods and Modeling
Microseismic monitoring of the mine working face spans kilometers, covering a vast range. Attempting to simulate the entire floor numerically is impractical and could lead to significant errors or experimental failure due to overlooking small joints. Therefore, in this study, we selected a unit size of 160 cm × 160 cm after conducting several numerical simulation experiments, considering the actual grout diffusion radius and factors induced by micro-earthquakes during grouting. This size selection enhances the clarity of grouting engineering’s fragmentation effects and rationalizes microseismic-intensive areas. The numerical simulation employs the parallel cementation model as its constitutive model, complemented by the smooth joint model for handling discontinuous structures like faults and folds.
Initially, a collection of rock particles is generated, and for scenarios involving discontinuous structures, smooth joints with a specified inclination azimuth are strategically inserted. Fluid exchange between domains is facilitated by pipe flow interacting with particles. Contact under the effective stress of particles results in compression or expansion, altering the permeability of the flow conduit. Fluid flow induces changes in pore pressure, thereby altering the effective stress on the particles and achieving fluid-structure coupling.
Initial confined water pressure (pore pressure) is incorporated into the model through boundary condition application. This is achieved using the servo control principle, where the sum of stiffness between the wall and the particle is computed and then applied to the wall. Throughout the grouting process, servo control is consistently maintained, ensuring the stress boundary conditions remain unchanged. Initially, the water pressure transitions to free flow during the grouting process, followed by modification of the grouting hole boundary conditions and application of a fixed grouting pressure of 24.24 MPa.
Model parameters are selected through a trial-and-error method [24], with specific details provided in Table 1 and Table 2. The grouting hole, located centrally, has a diameter of 152.4 mm and contains a total of 17,405 particles, as depicted in Figure 2.

Table 1.
Mesoscopic parameters of parallel cementation model of rock mass.
Table 2.
Mesoscopic parameters of smooth joint (SJ) model of rock mass.
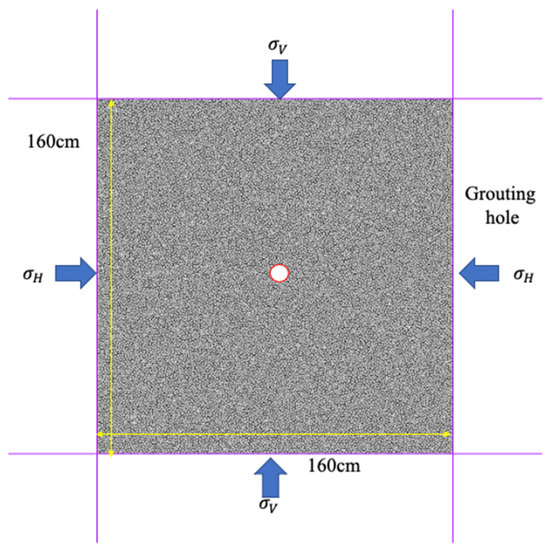
Figure 2.
Model diagram.
The fluid domain was established. Subsequently, the initial confined water pressure (pore pressure) was applied to the model via boundary conditions. The implementation was based on servo-control principles. Specifically, the stiffness summation between the wall and particles was computed, and a velocity boundary condition was imposed on the wall. After a predefined time step, the resultant wall reaction stress could be derived. By dynamically adjusting the servo-control gain to regulate wall velocity, the discrepancy between the reaction stress and the target confining pressure was iteratively minimized. This iterative procedure continued until the reaction stress converged within the specified tolerance threshold, thereby achieving the target in situ stress state. Throughout subsequent grouting operations, servo-control was sustained to maintain constant stress boundary conditions. The grouting process initially transitioned the pore pressure regime to a free-flow state and subsequently adjusted the grouting hole boundaries.
To simplify the microseismic excitation mechanism analysis, the following assumptions were adopted:
- Circular boreholes were treated as a small-strain plane-strain problem;
- Uniform slurry pressure transmission from the borehole base to the surrounding rock mass was presumed;
- Physicochemical interactions between the grout material and rock mass were neglected.
2.2.2. Influence Analysis of Primary Fractures and Structures on PMGIM
- Influence by primary fractures
Natural fractures are widely distributed in strata and are typically characterized using statistical methods. Fracture density serves as one of the key indicators used to describe these fractures. In two-dimensional models, fracture density (represented by ρ) denotes the number of intersecting joints per unit length. This section examines the impact of fracture development on grouting effectiveness. The physical and mechanical properties of the rock mass and ground stress levels remain consistent with those previously discussed. Crack size follows a power law distribution, and crack positions follow a uniform distribution. ρ is categorized into 3 levels: 6, 8, and 10, respectively.
Analysis of fluid injection simulation results reveals a strong correlation between grouting-induced crack distribution and primary crack density. Figure 3 illustrates a significant increase in induced cracks with increasing joint density. At lower primary crack densities, induced cracks exhibit directional morphology, forming three main cracks surrounded by numerous smaller cracks, resulting in a 109.6% increase in total crack count. Increasing primary crack density alters crack morphology, increasing main cracks from 3 to 6 with significantly longer lengths, resulting in a 139.7% increase in total crack count. At a primary crack density of 10, crack numbers increase exponentially, with higher tensile stress concentrations at crack tips. Furthermore, many cracks merge with existing natural cracks, forming a complex crack network totaling 1878 cracks.
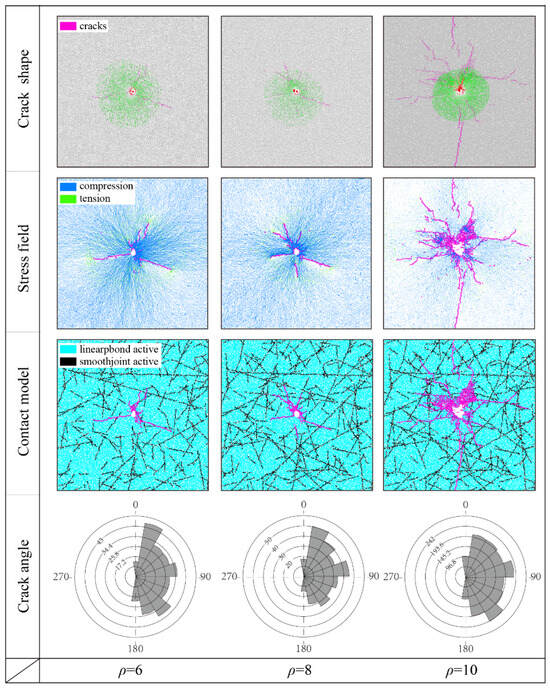
Figure 3.
Crack distribution characteristics under different crack density levels.
- 2.
- Influence by geological structures
Grouting near geological structures results in distinct crack propagation patterns and varying microseismic events compared to more homogeneous areas. To address this issue, three experimental groups were devised to investigate how faults influence the grouting process at distances of 0.5, 0.6, and 0.7 m from the grouting holes, all under a consistent grouting pressure of 24.24 MPa. Figure 4 presents the numerical simulation results.
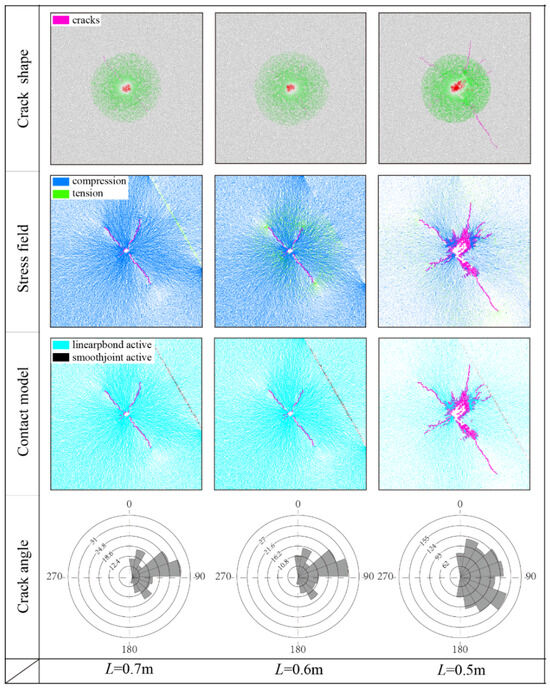
Figure 4.
Distribution characteristics of cracks at different distances from faults.
Analysis of fluid injection simulation results reveals that the distribution of cracks induced by grouting correlates closely with the distance from the fault. As the distance from the fault decreases, the number of induced cracks significantly increases. At larger distances from the fault, induced cracks exhibit clear directional characteristics similar to the background scenario. Three main cracks are present, with their direction deflecting towards the fault. At a distance of 0.5 m from the fault, the number of cracks increases dramatically to 1111, with concentration near the fault. The force chain diagram exhibits a pattern similar to the previous simulation model, with tensile stress concentration observed at the crack tips. However, the force chain on the fault appears nearly blank. The relatively weak surface of the fault hinders force transmission, causing grouting pressure to concentrate in the space between the fault and the grouting hole, resulting in thicker force chains and greater tension stress areas.
3. Spatio-Temporal Distribution Characteristics of PMGIM
3.1. Overview of the Study Area
The 182602 working face is situated in the sixth mining area of Wutongzhuang Mine, with the coal seam buried at depths exceeding 950 m. The strike length of the working face measures 950 m, and it extends 256 m along the dip. The working face predominantly extracts No. 2 coal, which features a stable and straightforward structure. The coal seam averages 3.2 m in thickness and ranges in inclination from 8° to 23°. It is noteworthy that the Yeqing aquifer (YQ) beneath the coal seam exhibits reduced water abundance following grouting reinforcement. The Shanfuqing aquifer (SFQ) directly underlies the 2# coal seam, characterized by strong and heterogeneous water abundance. The Austrian ash aquifer (O2) poses the primary challenge for water damage mitigation in the Wutongzhuang mining area due to its substantial water abundance, extensive distribution, considerable thickness, and robust connectivity.
According to drilling data from the grouting operations at the working face, grouting was applied above the shallow limestone aquifer and the Ordovician limestone aquifer, with a total grout volume of 7066.5 tons. The grouting holes were arranged in a “feather” or “belt” pattern, with adjacent branch holes spaced 50–60 m apart. Details regarding the number of grouting holes and the specifics of the research area are illustrated in Figure 5.
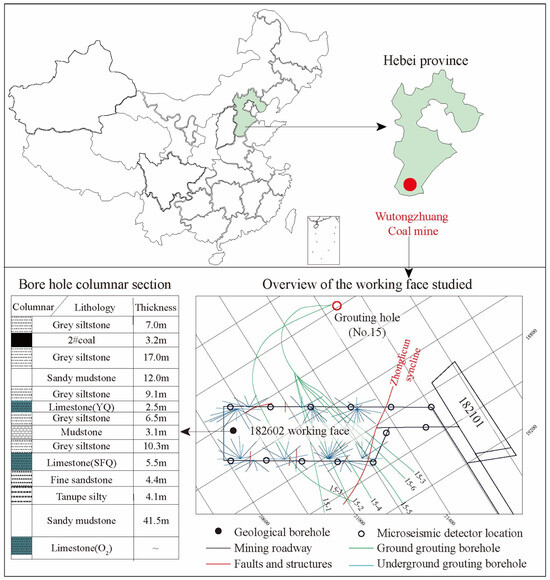
Figure 5.
The 182602 working face overview.
3.2. Analysis of Microseismic Correspondence in Grouting Disturbance Area
Mining at the 182602 working face commenced on 7 November 2018. The microseismic monitoring system was established as early as November 2017 and has been continuously operational for 11 months, providing crucial data for pre-mining safety assessments. During this period, the regional grouting control project triggered varying intensities of microseismic events between the 2# coal seam floor and the Ordovician limestone karst aquifer, forming the focus of this study known as “ PMGIM”.
Through detailed data analysis, we exclude microseismic interference induced by mining activities in the adjacent 182101 face and observe the distribution characteristics of microseismic events over different time periods:
In Figure 6a, a total of 40 microseismic events were detected between January and February 2018, with 70% (28) concentrated within the grouting disturbance area. In subsequent periods (as depicted in Figure 6b–f), spanning January through September 2018, the number of detected microseismic events rose steadily to 337. During this time, the proportion concentrated within the grouting disturbance area fluctuated slightly but generally stabilized between 62.0% and 67.9% as follows: 66.2% from January to February, 66.8% in April, 67.9% in May, 67.6% in July, and 62.0% in September.
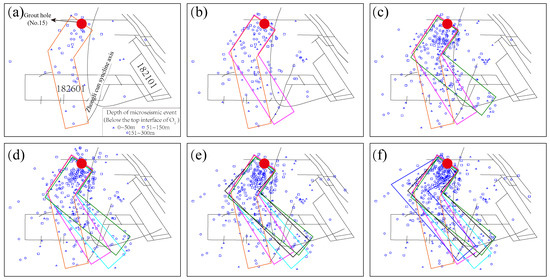
Figure 6.
Plane range of grouting disturbance zone. (a) view of the disturbance area for single-hole grouting (b) view of the disturbance area for double-hole grouting; (c) view of the disturbance area for three-hole grouting; (d) view of the disturbance area for four-hole grouting; (e) view of the disturbance area for five-hole grouting; (f) view of the disturbance area for six-hole grouting.
Furthermore, microseismic events outside the grouting disturbance area exhibited a scattered distribution without a clear clustering trend. The growth rate of these events decreased notably in the later stages of the grouting process (May 2018, September 2018), suggesting effective sealing of cracks as grouting advanced.
From the above analysis, it is evident that there is a strong correlation between primary microseismic events and the grouting disturbance area. Continuous seepage and fracturing caused by grouting lead to the destruction of water storage spaces and karst caves, disrupting the balance of the Austrian ash aquifer and releasing high strain energy. Simultaneously, this process promotes the expansion and propagation of primary and secondary cracks in the rock mass, triggering the clustering of microseismic events. Beyond the grouting disturbance area, as the influence on the Austrian limestone aquifer diminishes, the degree of fracture expansion decreases, resulting in a discontinuous microseismic distribution.
3.3. PMGIM Distribution Law of 182602 Working Face
The occurrence of microseismic events indicates that the stress of the source rock mass decreases and the elastic deformation energy is released within a certain time and space. In order to facilitate the analysis of the time distribution, spatial distribution, and energy characteristics of PMGIM on the working face of 182602, combined with the stop-mining time of the adjacent working face 182101 (22 February 2018), the 182602 face PMGIM can be divided into two periods.
Period 1: involving January and February 2018, affected by the mining of the adjacent 182101 working face and the regional grouting treatment project.
Period 2: involving March, June, and September 2018, affected by regional grouting management projects.
3.3.1. PMGIM Plane Distribution
The kernel density estimation method centers on the location of specific element points and reflects the clustering state of elements in the current space by calculating the density value of each grid under varying search radii. This method is suitable for analyzing the planar distribution patterns of PMGIM, and the calculation formula is as follows [25]:
where Pn(x) represents the kernel density value of the x-th microseismic event in the study area; R is the search radius; n is the number of all microseismic events within the search radius; Ki is the weighting function; (x − xi)2 + (y − yi)2 is the square of the distance between two microseismic events at (x, y) and (xi, yi).
Figure 7 illustrates the kernel density cloud map of microseismic events at the 182602 working face. During period 1, the core density of PMGIM events was centered on the Zhonglicun syncline axis, forming a “V”-shaped, two-center continuous pattern. The high-frequency core density zcenters “A” and “B” were positioned near the main grouting hole and the central region of the 182101 working face, respectively. As a result of continuous grouting, the range of core density center “A” in February 2018 expanded significantly. In period 2, the planar distribution of core densities for microseismic events exhibited phased changes. In March 2018, the nuclear density values displayed a two-center discontinuous pattern extending from the northwest to the southeast. By June 2018, the nuclear density values revealed a central discontinuous pattern oriented from the northwest to the southeast. Compared to March 2018, the density value of core “A” rose by 19.2%, while the density value of core “B” declined by 41.3%. By September 2018, the nuclear density values exhibited a discontinuous layout from northwest to southeast, with the two centers disappearing. Compared to June 2018, the core density value of center “A” decreased by 45.1%, and that of center “B” decreased by 41%. During period 2, there was virtually no microseismic event response in the 182602 working face, indicating effective sealing of the fractures.
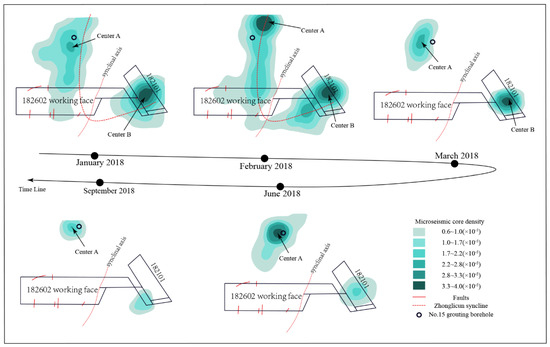
Figure 7.
Nuclear density distribution of PMGIM events at 182602 working face.
3.3.2. Frequency–Energy Characteristics of PMGIM
A total of 900 PMGIM events were recorded on the floor of the coal seam between 10 June and 20 August, prior to mining at the 182602 working face. Figure 8 illustrates how these events are categorized into four distinct stages based on their frequency and energy characteristics, as follows:
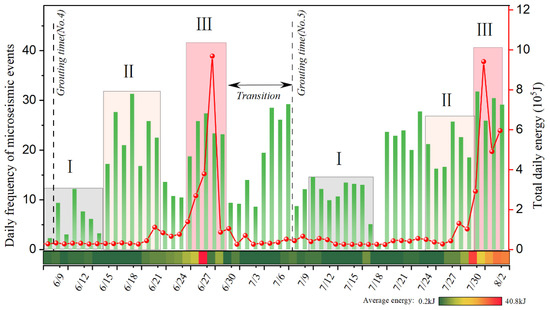
Figure 8.
Characteristics of daily frequency-energy variation of the floor microseismic events.
Phase I: characterized by low frequency and low energy, with a daily frequency < 15, total energy < 105 J, and single event energy < 103 J;
Stage II: characterized by high frequency and low energy, with a frequency ≥ 15, total energy ≤ 2 × 10⁵ J, and 95.8% of events with energy < 103 J;
Phase III: characterized by high frequency and high energy, with a frequency ≥ 20, total energy > 5 × 10⁵ J, and a short duration;
Stage IV: transition stage with large frequency fluctuations, small total energy, maximum < 2 × 10⁵ J, and 87.4% of events with energy < 103 J;
Since 10 July, the microseismic events have repeated the aforementioned phase cycle.
3.3.3. Characteristics of Agglomeration Law
Prior to mining in the working face, PMGIM dynamics adhere to three major patterns: sporadic, clustered, and staged. Sporadic microseismic activity suggests a non-uniform distribution closely related to regional stress variations. For instance, the initiation and cessation of grouting activities significantly impact microseismic frequency, facilitating real-time monitoring of grouting effects. Clustered microseismic events are concentrated in geologically fragile areas, such as fracture zones, indicating tectonic stress anomalies and potential water conductivity risks. The staged patterns of microseismic energy release progress through three phases: “low frequency low energy–high frequency low energy–high frequency high energy”, consistent with the grouting process. Those patterns aid in predicting dangerous periods in the working face, particularly during the “high frequency high energy” stage, when vigilance for water gushing risks is imperative.
4. Prediction of Water Inrush Risk Based on PMGIM
4.1. Agglomeration Evolution of PMGIM
The more developed the natural fractures in the rock mass (comprising various defect structures), the more easily microseismic events are triggered by grouting, leading to the formation of abnormal PMGIM accumulation areas. The source distribution and concentration degree of PMGIM events serve as crucial discrimination indices. Spatial statistical methods are extensively employed in analyzing microseismic event distributions, including Moran’s index, Getis-Ord Gi* statistics, and Kernel Density Estimation (KDE). The global Moran’s index quantifies the overall spatial autocorrelation patterns (clustering, dispersion, or randomness) but lacks resolution for identifying localized spatial associations [26]. To address this limitation, the local Moran’s index is applied to detect statistically significant clusters and spatial outliers, thereby delineating region-specific microseismic distribution characteristics [27].
4.1.1. PMGIM Agglomeration Mechanism
The variation trend of PMGIM is primarily influenced by structural polarization effects and the diffusion effect of grouting. The structural polarization effect, such as faults at the 182602 working face and the Zhonglicun synclinal axis, indicates that the injected slurry increases pore pressure in the formation. Consequently, the corresponding Mohr circle of the rock mass shifts leftward, moving the Mohr-Coulomb circle below the envelope and bringing the Mohr circle closer to the strength line. When the shear stress applied to section MN exceeds the shear strength of the rock mass (τs), shear failure occurs, leading to fracture expansion and triggering microseismic events (see Figure 9).
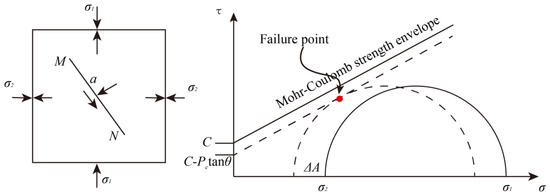
Figure 9.
Diagram of pore pressure and effective stress of rock mass.
The more developed the natural structures are, the more easily microseismic events are stimulated during the grouting process, forming the HH region characterized by high microseismic activity and concentration. The diffusion effect of grout implies that as the grouting process continues, cracks in numerous areas are effectively sealed and rock layers are strengthened. This makes it increasingly difficult to excite microseismic events, resulting in a significant reduction in their occurrence.
4.1.2. Moran’s Index Analysis of PMGIM in 182602 Working Face
The analysis route for identifying the dangerous water inrush areas on the working face using Moran’s index in this study is illustrated in Figure 10.
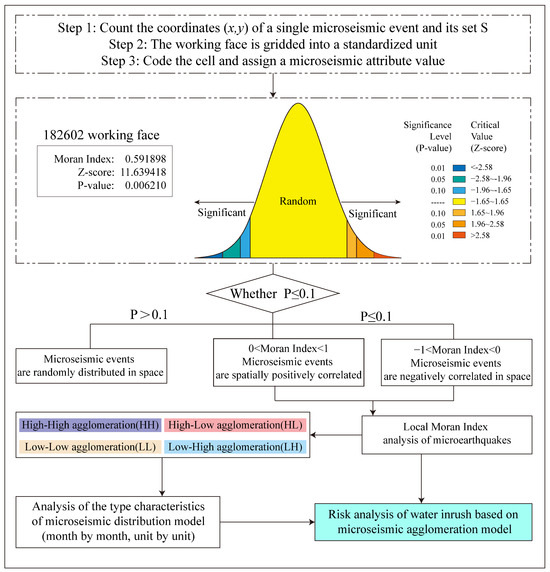
Figure 10.
Analysis of microseismic events based on Moran’s index.
The Moran’s index value of PMGIM event frequency at the 182602 working face is 0.59, indicating a positive spatial correlation and a clustering pattern with 99% confidence. The p value of PMGIM events is 0.006, and the Z value is 11.64, indicating the presence of extreme values (statistically significant hot spots) within the working face. This suggests that PMGIM events are highly locally clustered. Since PMGIM events are concentrated in areas where natural fractures of the rock mass are more developed, these areas with higher concentrations are potential water inrush danger zones.
4.2. Hazard Prediction for the 182602 Working Face
Firstly, the 182602 working face is meshed and coded, and a total of 90 units are set. The local Moran’s index was calculated to determine the specific location of the anomaly area of PMGIM events, and the frequency value of PMGIM events was assigned to each unit, as shown in Figure 11.
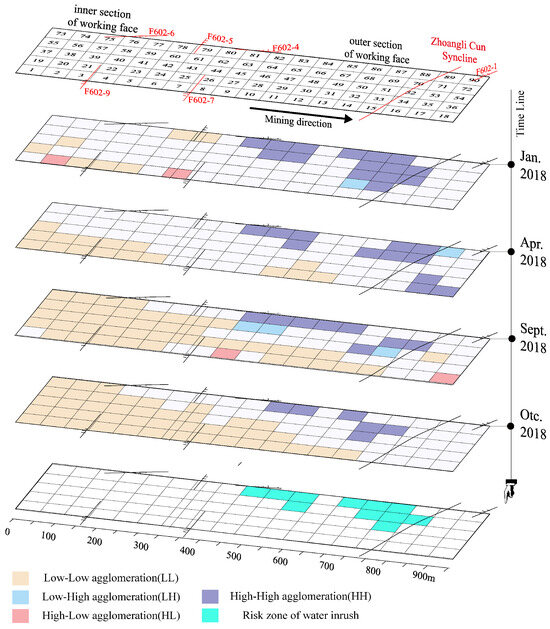
Figure 11.
Regional division of PMGIM distribution types in working face.
In the initial phase of the working face grouting project (January 2018), a higher concentration of HH units was observed, clustered in the 400–800 m section and adjacent to the return air roadway, densely. PMGIM events were predominantly distributed across the working face (with minimal LL units), indicating a poor grouting effect and a significant risk of water inrush.
By the intermediate phase of the working face grouting project (April 2018), HH units remained densely distributed in the 400–800 m section near the return air roadway, but their numbers had significantly decreased. HL and LH elements appeared randomly, while the discrete elements of PMGIM events gradually decreased. This indicates that the grouting project successfully sealed some of the cracks in the working face, improving the overall grouting effect.
In the final phase of the working face area treatment project (October 2018), HH units significantly decreased, although their aggregation location remained unchanged. Basic PMGIM event distribution (LL units) covered most areas of both the inner and outer sections of the working face. At this stage, LL units without microseismic events largely covered the working face, though some HH units persisted, indicating that while grouting reinforcement was largely complete, there remained a risk of water inrush in the HH regions.
According to the PMGIM distribution results using the local Moran’s index, regions at high risk of water inrush were identified. One area includes units 81, 82, 83, 64, and 65 HH, located 400–550 m along the return air lane (near the F602-4 fault area). The other area includes units 85, 86, 87, 68, 69, 70, and 51, located near the Zhong Lishun syncline axis, as illustrated in Figure 11.
4.3. Electrical Survey
The network parallel electrical method is founded on analyzing and interpreting apparent resistivity data of rock mass, where areas of low resistivity typically denote water-rich anomalies or water-bearing structures. Figure 12 depicts the results of parallel electrical geophysical exploration on the 182602 working face. Along the strike, four anomalous areas (AA1, AA2, AA3, and AA4) were identified in the outer section of the working face, confirmed later by drilling to have significant water presence, closely matching the high-risk zones for severe water inrush identified by Moran’s index analysis. Abnormal microseismic events persisted in area AA4 during mining operations, escalating the risk of water inrush. Subsequently, a drainage borehole was constructed, discharging water at a maximum rate of 130 m3/h to prevent water inrush. This underscores the primary PMGIM event as pivotal in delineating areas prone to water inrush.
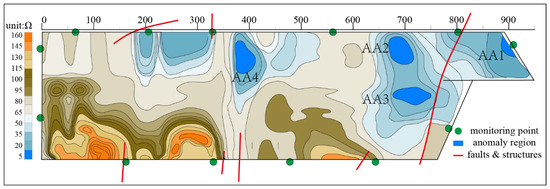
Figure 12.
The 182602 working face electrical geophysical survey results.
5. Discussion
Traditional water inrush early warning systems have predominantly relied on static geological parameters (e.g., permeability coefficients) or single-modality sensor data (e.g., resistivity measurements). In contrast, the Precise Microseismic Geophysical Integrated Monitoring (PMGIM) method has achieved quantitative characterization of fracture network evolution through real-time microseismic event monitoring coupled with spatial clustering analysis using Moran’s index. At Wutongzhuang Mine, this approach successfully identified high-risk water inrush zones within fault areas, as evidenced by statistically significant HH-type clustering patterns.
However, mine water hazard prediction remains a complex systems engineering challenge. The reliability of PMGIM-based diagnostics is inherently constrained by the scientific rigor of field data acquisition protocols. For instance, suboptimal sensor deployment or sampling frequency may introduce spatial bias in clustering results. Thus, PMGIM applications should be synergistically augmented with auxiliary geophysical surveys (e.g., transient electromagnetic imaging) and drilling validation to enhance operational accuracy.
With the continuous development of artificial intelligence (AI), a new direction for future scientific and technological development is to combine microseismic signals, such as PMGIM signals, with advanced technologies like neural networks for on-site early warning analysis. Based on the comprehension of this research, we can look forward to some related research directions.
- AI-Enhanced Early Warning: Integrating PMGIM signals with neural network architectures could enable real-time hazard prediction. This involves deploying edge-computing optimized models for instantaneous waveform analysis and automated risk classification;
- Multisensor Fusion Framework: A unified platform should be developed to harmonize PMGIM with fiber-optic strain sensing and InSAR-derived deformation data, thereby constructing 4D geomechanical risk profiles;
- Digital Twin Optimization: Physics-informed digital twins could simulate fluid-rock interactions under varying stress regimes, providing scenario-based decision support for emergency response.
These advancements would not only extend PMGIM’s applicability to non-coal mining (e.g., metal mines with shear zones) and high-hydrostatic-pressure environments (e.g., deep-sea mining) but also establish it as a cornerstone technology for intelligent mine safety management.
6. Conclusions
In this paper, the concept of Pre-mining Grouting-induced Microseismicity was innovatively proposed. The mechanism of PMGIM is revealed through mechanical analysis; subsequently, the influence of multiple factors on PMGIM is deeply explored by numerical simulation. Taking the 182602 working face in Wutongzhuang coal mine as an example, the temporal and spatial distribution characteristics of PMGIM in this area were summarized in detail. On this basis, we introduced Moran’s index to predict the potential location of water-rush danger in the working face. The main conclusions are as follows:
The interaction between the high-pressure slurry and the surrounding rock body causes tangential tensile stresses on the inner wall of the cracks, which lead to crack initiation and expansion of the cracks. Numerical simulation results show that discontinuous geological structures, such as joints and faults, degrade the mechanical properties of the formation and change the crack initiation and expansion pattern caused by the grouting itself, which is the main reason for the surge of microseismic events.
There is a good correspondence between the PMGIM event and the grouting disturbed area, and the distribution of planar kernel density has an obvious stage, and the stage pattern of energy release of the PMGIM event is consistent with the grouting process, which has gone through the three phases of “low-frequency low-energy, high-frequency low-energy, and high-frequency high-energy”. This spatial and temporal distribution characteristic is helpful to predict the danger period of water breakout in the working face, especially in the stage of “high-frequency and high-energy”.
The location of natural fracture development is more likely to be affected by grouting action, thus stimulating the occurrence of PMGIM events and the formation of PMGIM clustering areas. The Moran’s index analysis was introduced to analyze the evolution law of four types (HH-type, HL-type, LH-type, LL-type) of PMGIM event aggregation zones, and it was determined that the area with a higher degree of PMGIM aggregation is the potential water-surge area.
Author Contributions
Funding acquisition, Q.J. and Z.L. (Zhenhua Li); Investigation, Y.F.; Methodology, E.Z.; Writing—original draft, E.Z.; Writing—review and editing, Z.L. (Zhaoxing Liu). All authors have read and agreed to the published version of the manuscript.
Funding
This research was funded by National Natural Science Fund of China (Grant No. 52074212; U24B2041), Natural Science Foundation of Shaanxi Province (Grant No. 2024JC-YBQN-0528; 2024JC-YBQN-0305), and Shaanxi Province Postdoctoral Research Fund (Grant No. 2023BSHEDZZ295). And The APC was funded by Grant No. 2024JC-YBQN-0528 and 2024JC-YBQN-0305).
Institutional Review Board Statement
Not applicable.
Informed Consent Statement
Not applicable.
Data Availability Statement
The data used to support the findings of this study are available from the corresponding author upon request (qfjia@xust.edu.cn).
Acknowledgments
The authors gratefully acknowledge the helpful comments of Tiantian Li for her advice on the revised manuscript.
Conflicts of Interest
The authors declare that there are no conflicts of interest regarding the publication of this paper.
Abbreviations
The following abbreviations are used in this manuscript:
| PMGIM | pre-mining grouting-induced microseismicity |
| r | radius of the drilling hole |
| δ | radial distance |
| P0 | grout weight pressure |
| Pd | grouting pump pressure |
| Pi | pore water pressure |
| Δδθ | tangential stress increase |
| B | Biot constant of the rock mass |
| μ | Poisson ratio of the rock mass |
| KI−1 | stress intensity factor-(horizontal fracture) |
| KI−2 | stress intensity factor-(vertical fracture) |
| KIC | critical stress intensity factor |
| τs | shear strength of the rock mass |
| MTI | Moment tensor inversion |
| HH | High-High agglomeration |
| HL | High-Low agglomeration |
| LL | Low-Low agglomeration |
| LH | Low-High agglomeration |
References
- Xue, Y.; Zhu, S.; Qiu, H. Refinement Study on the Water-Inrush Risk of Close-Distance Thin Coal Seam Mining with Pressure in the Lower Coal Seam. Mine Water Environ. 2023, 42, 670–686. [Google Scholar] [CrossRef]
- Hu, F.; Zhou, M.; Yan, P.; Li, D.; Lai, W.; Bian, K.; Dai, R. Identification of mine water inrush using laser-induced fluorescence spectroscopy combined with one-dimensional convolutional neural network. RSC Adv. 2019, 9, 7673–7679. [Google Scholar] [CrossRef] [PubMed]
- Huang, P.; Yang, Z.; Wang, X.; Ding, F. Research on Piper-PCA-Bayes-LOOCV discrimination model of water inrush source in mines. Arab. J. Geosci. 2019, 12, 334. [Google Scholar] [CrossRef]
- Atanacković, N.; Štrbački, J.; Živanović, V.; Davidović, J.; Gardijan, S.; Stojadinović, S. Hydrochemistry-Based Statistical Model for Sourcing Groundwater Inrush into Underground Mining Works: A Case Study in Eastern Serbia. Mine Water Environ. 2024, 43, 313–325. [Google Scholar] [CrossRef]
- Zhang, J.; Shen, B. Coal mining under aquifers in China: A case study. Int. J. Rock Mech. Min. Sci. 2004, 41, 629–639. [Google Scholar] [CrossRef]
- Bukowski, P. Water Hazard Assessment in Active Shafts in Upper Silesian Coal Basin Mines. Mine Water Environ. 2011, 30, 302–311. [Google Scholar] [CrossRef]
- Zaidel, J.; Markham, B.; Bleiker, D. Simulating Seepage into Mine Shafts and Tunnels with MODFLOW. Groundwater 2010, 48, 390–400. [Google Scholar] [CrossRef]
- Meier, S.; Bauer, J.F.; Philipp, S.L. Fault zones in layered carbonate successions: From field data to stress field models. Geomech. Geophys. Geo-Energy Geo-Resour. 2017, 3, 61–93. [Google Scholar] [CrossRef]
- Lambropoulos, D.C. Design, construction and evaluation of the Messochora dam grout curtain in Central Greece. Q. J. Eng. Geol. Hydrogeol. 2010, 43, 249–256. [Google Scholar] [CrossRef]
- Li, S.; Liu, B.; Nie, L.; Liu, Z.; Tian, M.; Wang, S.; Su, M.; Guo, Q. Detecting and monitoring of water inrush in tunnels and coal mines using direct current resistivity method: A review. J. Rock Mech. Geotech. Eng. 2015, 7, 469–478. [Google Scholar] [CrossRef]
- Tang, C.; Wang, J.; Zhang, J. Preliminary engineering application of microseismic monitoring technique to rockburst prediction in tunneling of Jinping II project. J. Rock Mech. Geotech. Eng. 2010, 2, 193–208. [Google Scholar] [CrossRef]
- Kushnir, A.; Varypaev, A. Robustness of statistical algorithms for location of microseismic sources based on surface array data. Comput. Geosci. 2017, 21, 459–477. [Google Scholar] [CrossRef]
- Zhang, P.; Yang, T.; Yu, Q.; Xu, T.; Zhu, W.; Liu, H.; Zhou, J.; Zhao, Y. Microseismicity Induced by Fault Activation During the Fracture Process of a Crown Pillar. Rock Mech. Rock Eng. 2015, 48, 1673–1682. [Google Scholar] [CrossRef]
- Xiao, Y.-X.; Feng, X.-T.; Hudson, J.A.; Chen, B.-R.; Feng, G.-L.; Liu, J.-P. ISRM Suggested Method for In Situ Microseismic Monitoring of the Fracturing Process in Rock Masses. Rock Mech. Rock Eng. 2016, 49, 343–369. [Google Scholar] [CrossRef]
- Fitch, T.J.; McCowan, D.W.; Shields, M.W. Estimation of the seismic moment tensor from teleseismic body wave data with applications to intraplate and mantle earthquakes. J. Geophys. Res. 1980, 85, 3817–3828. [Google Scholar] [CrossRef]
- Feignier, B.; Young, R.P. Moment tensor inversion of induced microseismic events: Evidence of non-shear failures in the −4 < M < −2 moment magnitude range. Geophys. Res. Lett. 1992, 19, 1503–1506. [Google Scholar] [CrossRef]
- Linzer, L.M. A Relative Moment Tensor Inversion Technique Applied to Seismicity Induced by Mining. Rock Mech. Rock Eng. 2005, 38, 81–104. [Google Scholar] [CrossRef]
- Jiang, F.; Yin, Y.; Zhu, Q.; Wen, J. Relationship between support and surrounding rock of fully mechanized caving face in thick coal seam of kilometer deep mine based on microseismic monitoring technology. J. Min. Saf. Eng. 2014, 31, 167–174. (In Chinese) [Google Scholar] [CrossRef]
- Sun, J.; Wang, L.G. Floor fault water inrush prediction based on catastrophe analysis of micro-seismic signals. J. China Coal Soc. 2013, 38, 1404–1410. [Google Scholar]
- Jin, D.; Duan, J.; Li, L.; Yan, B.; Mou, W.; Lu, J.; Zhou, L. Microseismicity based research for mining induced fracture propagation and water pathway identification technology of floor. J. Eng. Geol. 2021, 29, 962–971. (In Chinese) [Google Scholar] [CrossRef]
- Zhou, J.-R.; Yang, T.-H.; Zhang, P.-H.; Xu, T.; Wei, J. Formation process and mechanism of seepage channels around grout curtain from microseismic monitoring: A case study of Zhangmatun iron mine, China. Eng. Geol. 2017, 226, 301–315. [Google Scholar] [CrossRef]
- Zhang, Y.; Li, F. Prediction of Water Inrush from Coal Seam Floors Based on the Effective Barrier Thickness. Mine Water Environ. 2022, 41, 168–175. [Google Scholar] [CrossRef]
- Kulikov, A.A.; Nazarov, S.A. Griffith formula for a crack in a piezoelectric body. Dokl. Phys. 2004, 49, 768–771. [Google Scholar] [CrossRef]
- Du, X.; Li, Z.; Fang, H.; Wang, S.; Li, B.; Du, M.; Wang, N.; Xue, B.; Zhao, X. Numerical and practical investigation of the multiple hole grouting repair law of underground drainage pipeline defects. Bull. Eng. Geol. Environ. 2023, 82, 44. [Google Scholar] [CrossRef]
- Lütkenöner, B. A family of kernels and their associated deconvolving kernels for normally distributed measurement errors. J. Stat. Comput. Simul. 2015, 85, 2347–2363. [Google Scholar] [CrossRef]
- Lalor, G.C.; Zhang, C. Multivariate outlier detection and remediation in geochemical databases. Sci. Total Environ. 2001, 281, 99–109. [Google Scholar] [CrossRef]
- Zhang, C.; Luo, L.; Xu, W.; Ledwith, V. Use of local Moran’s I and GIS to identify pollution hotspots of Pb in urban soils of Galway, Ireland. Sci. Total Environ. 2008, 398, 212–221. [Google Scholar] [CrossRef]
Disclaimer/Publisher’s Note: The statements, opinions and data contained in all publications are solely those of the individual author(s) and contributor(s) and not of MDPI and/or the editor(s). MDPI and/or the editor(s) disclaim responsibility for any injury to people or property resulting from any ideas, methods, instructions or products referred to in the content. |
© 2025 by the authors. Licensee MDPI, Basel, Switzerland. This article is an open access article distributed under the terms and conditions of the Creative Commons Attribution (CC BY) license (https://creativecommons.org/licenses/by/4.0/).