Article

Advanced Default Risk Prediction in Small and Medum-Sized Enterprises Using Large Language Models

1
School of Computing and Artificial Intelligence, Southwestern University of Finance and Economics, Chengdu 610074, China
2
Business School, Beijing Normal University, Beijing 100875, China
*
Author to whom correspondence should be addressed.
Appl. Sci. 2025, 15(5), 2733; https://doi.org/10.3390/app15052733
Submission received: 14 October 2024 / Revised: 10 December 2024 / Accepted: 10 December 2024 / Published: 4 March 2025
(This article belongs to the Special Issue Natural Language Processing (NLP) and Applications—2nd Edition)

Abstract

:
Predicting default risk in commercial bills for small and medium-sized enterprises (SMEs) is crucial, as these enterprises represent one of the largest components of a nation’s economic structure, and their financial stability can impact systemic financial risk. However, data on the commercial bills of SMEs are scarce and challenging to gather, which has impeded research on risk prediction for these businesses. This study aims to address this gap by leveraging 38 multi-dimensional, non-financial features collected from 1972 real SMEs in China to predict bill default risk. We identified the most influential factors among these 38 features and introduced a novel prompt-based learning framework using large language models for risk assessment, benchmarking against seven mainstream machine learning algorithms. In the experiments, the XGBoost algorithm achieved the best performance on the Z-Score standardized dataset, with an accuracy of 81.42% and an F1 score of 80%. Additionally, we tested both the standard and fine-tuned versions of the large language model, which yielded accuracies of 75% and 82.1%, respectively. These results indicate that the proposed framework has significant potential for predicting risks in SMEs and offers new insights for related research.

1. Introduction

Accurately predicting corporate default risk is crucial for maintaining financial market stability and preventing systemic risks. SMEs, being the backbone of the national economy, significantly contribute to GDP. For instance, data from China’s National Bureau of Statistics in 2022 shows that the real estate and construction industries contributed approximately 7.38 trillion and 8.33 trillion yuan to the GDP, respectively. Despite SMEs constituting over 90% of Chinese enterprises, their financial conditions are generally more fragile, making them more susceptible to default than larger corporations. However, current research on default risk prediction has largely overlooked these businesses, highlighting the urgent need for deeper investigation into SME default risks.
The main challenges in predicting SME default risk include data scarcity, diverse influencing factors, and high heterogeneity among enterprises, complicating risk forecasting. Default risk prediction has long been a hot research topic. Initially, Black and Scholes (1973) [1] and Merton (1974) [2] developed the KMV model for measuring the credit risk of listed companies based on the U.S. market conditions and system. Cheng et al. (2022) [3] combined the KMV algorithm with the genetic algorithm to propose the GA-KMV algorithm. Moreover, Trustorff et al. (2011) [4] demonstrated that support vector machines significantly outperform logistic regression models in terms of the resolution and reliability of predicting default probabilities under conditions of small training samples and high input data variance. Teles (2020) [5] also found that artificial neural networks are more effective in predicting credit risk than the Naive Bayes (NB) method. Zhao (2022) [6] integrated SVM and BP neural network algorithms to construct models that enhance the accuracy of credit risk prediction. However, these studies mainly rely on the financial data of listed companies and are effective only for specific stages or types of data, lacking flexibility and timeliness, and are difficult to adapt to changes in policies and the international environment.
To address these limitations, this study introduces a novel approach. First, we collect multi-dimensional non-financial data from SMEs, including business registration information, legal documents, news sentiment, and personal information on high-consumption restrictions. Second, leveraging the prompt learning capabilities of large models, we enhance model flexibility and timeliness without retraining by utilizing the general capabilities of large models through prompt learning. This method not only adapts to the evolving market environment but also enables default risk prediction at different stages, providing financial institutions and decision-makers with more accurate and real-time risk assessment tools. The innovative contributions of this study can be enumerated as follows:
  • Innovating an indicator system: This study engages with company bill default data and emphasizes non-financial data, such as registration information, legal documentation, and sentiment assessed in news articles. This approach helps us to formulate a new barometer for risk assessment.
  • Evaluating the effectiveness of different data standardization techniques: This study explores the impact of three unique data standardization methods on the experimental outcomes, offering new insights for enterprise risk analysis. Identifying the most suitable standardization technique to optimize the model represents an innovative addition to the research.
  • Incorporating large language models: Our cutting-edge combination of large language model prompts into company credit risk assessment offers a novel research perspective. This serves as an innovative approach towards corporate risk prediction.
The subsequent research sections are structured as follows: Section 2 reviews related work, highlighting gaps in current risk analysis studies for small and medium-sized enterprises (SMEs) and introducing the potential of large language models to enhance analytical capabilities in this area. Section 3 provides a detailed description of the data sources, formats, cleaning processes, and methods employed in the experiments. Section 4 outlines the experiments and results, showcasing the performance of multiple models on the dataset. Section 5 concludes this study by summarizing key findings and analyzing experimental results. It discusses the implications of this research, acknowledges its limitations, and offers directions for future work based on these insights.

2. Related Work

In current financial research, the assessment of credit risk in real estate enterprises has become a highly prominent issue. Numerous scholars focus on the credit risks and financial crises of real estate enterprises, employing diverse models and methods to delve into and accurately predict credit risks for domestic real estate companies. Furthermore, large language models have been proven to hold immense application value in the financial sector, offering new perspectives and strategies for risk prevention and control.
Firstly, there are studies utilizing statistical or mathematical models to analyze risks. For instance, Li et al. [7] assessed the credit risk of listed companies in China using the Zero Price Probability (ZPP) model, comparing it with the KMV model. Experiments showed that the performance of ZPP surpassed that of the KMV model. Chen et al. [8] analyzed the default risk of 138 Chinese listed real estate companies between 2007 and 2012 using the KMV model and time-varying correlation model, concluding that a high asset–liability ratio could lead to higher default risk. Yi et al. [9] studied the financial risk of 40 listed real estate companies in China using the Z-score model, achieving an accuracy rate of 80%. However, due to the small sample size, generalization of these findings may be challenging. These studies mainly focus on empirical analysis and prediction based on listed companies and their financial data or macroeconomic indicators. Although these methods are robust, they may not be suitable for micro and small enterprises lacking financial data.
Technological advancements have provided new tools for risk assessment. For example, Li et al. [10] predicted the financial risks of 50 listed real estate companies between 2006 and 2010, using K-means clustering to classify the size of enterprise risks, obtaining more accurate classification results. Patel and Vlamis [11] studied the default situation of 112 real estate companies in the UK using the BSM model and KMV framework. Empirical results indicated that high leverage and high asset volatility were two drivers of defaults. To investigate the impact of financial performance on bankruptcy risk, Nguyen et al. [12] obtained 308 observations from 44 listed real estate companies in Vietnam from 2011 to 2017 using logistic regression, with a predictive rate of 90%. These studies employing new computer data analysis technologies show that although new methods are adopted, the main research objects and data have remained largely unchanged. The primary research subjects are still listed companies and their financial data, thus imposing limitations on research on risks of micro and small enterprises.
Correspondingly, innovation in models is also at the core of research. Cheng et al. [3] analyzed the credit risk of China’s real estate industry, utilizing annual financial and stock trading data from 108 listed real estate companies between 2010 and 2019, proposing the GA-KMV algorithm combining the KMV algorithm and genetic algorithm. Experimental results showed that the model aligned well with actual economic development.
As machine learning methodologies continue to evolve and mature, they are increasingly making their mark in the domain of financial risk prediction [13,14,15,16]. Svabova et al. [17] utilized real data from the 2016–2018 Amadeus database to develop a financial distress prediction model for small and medium-sized enterprises in Slovakia, achieving an overall prediction accuracy of over 90% using discriminant analysis and logistic regression. Yu et al. [18] constructed a credit risk assessment system for small and medium-sized manufacturing enterprises using machine learning algorithms, finding that the random forest algorithm provides more accurate evaluation of supply chain finance credit risks. The COVID-19 pandemic has driven a surge in demand for supply chain finance among SMEs. Yang et al. [19] demonstrated that employing the lasso–logistic model to identify and predict critical credit risk factors effectively promotes sustainable supply chain finance. Ref. [20] employed BP neural networks and K-means clustering to study the financial risks of listed mining companies, achieving significant predictive outcomes. Ref. [21] proposed a graph-based supply chain mining method, addressing the issue of data scarcity in financial risk analysis of micro and small enterprises, providing new insights for risk prediction using machine learning methods. Additionally, refs. [22,23,24] also applied machine learning methods to risk prediction for micro and small enterprises. Concerning factors influencing risk prediction, refs. [12,25] verified the importance of core financial indicators such as debt ratio, current ratio, and income growth rate for default prediction from a financial perspective, while research on bill default prediction remains relatively limited.
Recently, large language models (LLMs) based on the transformer architecture [26] have achieved significant breakthroughs, demonstrating strong reasoning and generalization capabilities across diverse domains, including law, education, programming, and healthcare [27,28,29,30]. LLMs are also increasingly being applied in financial research. Researchers explored the application potential of ChatGPT in portfolio selection, particularly in stock picking. Compared to quantitative investment models, ChatGPT excels in stock selection, though the weight allocation still requires further optimization [31]. Shijie Wu and colleagues trained a large-scale language model, BloombergGPT, with 363 billion tokens of financial data and 345 billion tokens of public data, amounting to 500 billion parameters. This model performs exceptionally well on financial tasks and remains competitive in general NLP tasks [32]. Niszczota and Abbas assessed the performance of GPT as a financial intelligence advisor in financial literacy tests. The results showed that GPT-4 achieved a high score of 99% in the financial literacy test, while GPT-3.5 (Davinci) and GPT-3.5 (ChatGPT) scored 66% and 65%, respectively, highlighting financial literacy as a new strength of the latest model [33].
To provide a comprehensive overview of the progress and limitations of existing research, we present a detailed comparison in Table 1. This table highlights the key aspects of related work, including research objects, data types, methods/models, innovations, and flexibility. By analyzing these aspects, it is clear that most existing research focuses mainly on financial data from large or listed companies, with limited adaptability to the unique characteristics of SMEs. In contrast, the proposed method emphasizes the integration of non-financial data and uses the flexibility of large language model prompt learning. This innovation not only addresses the issue of data scarcity but also provides a more dynamic and real-time solution for predicting default risks in SMEs.

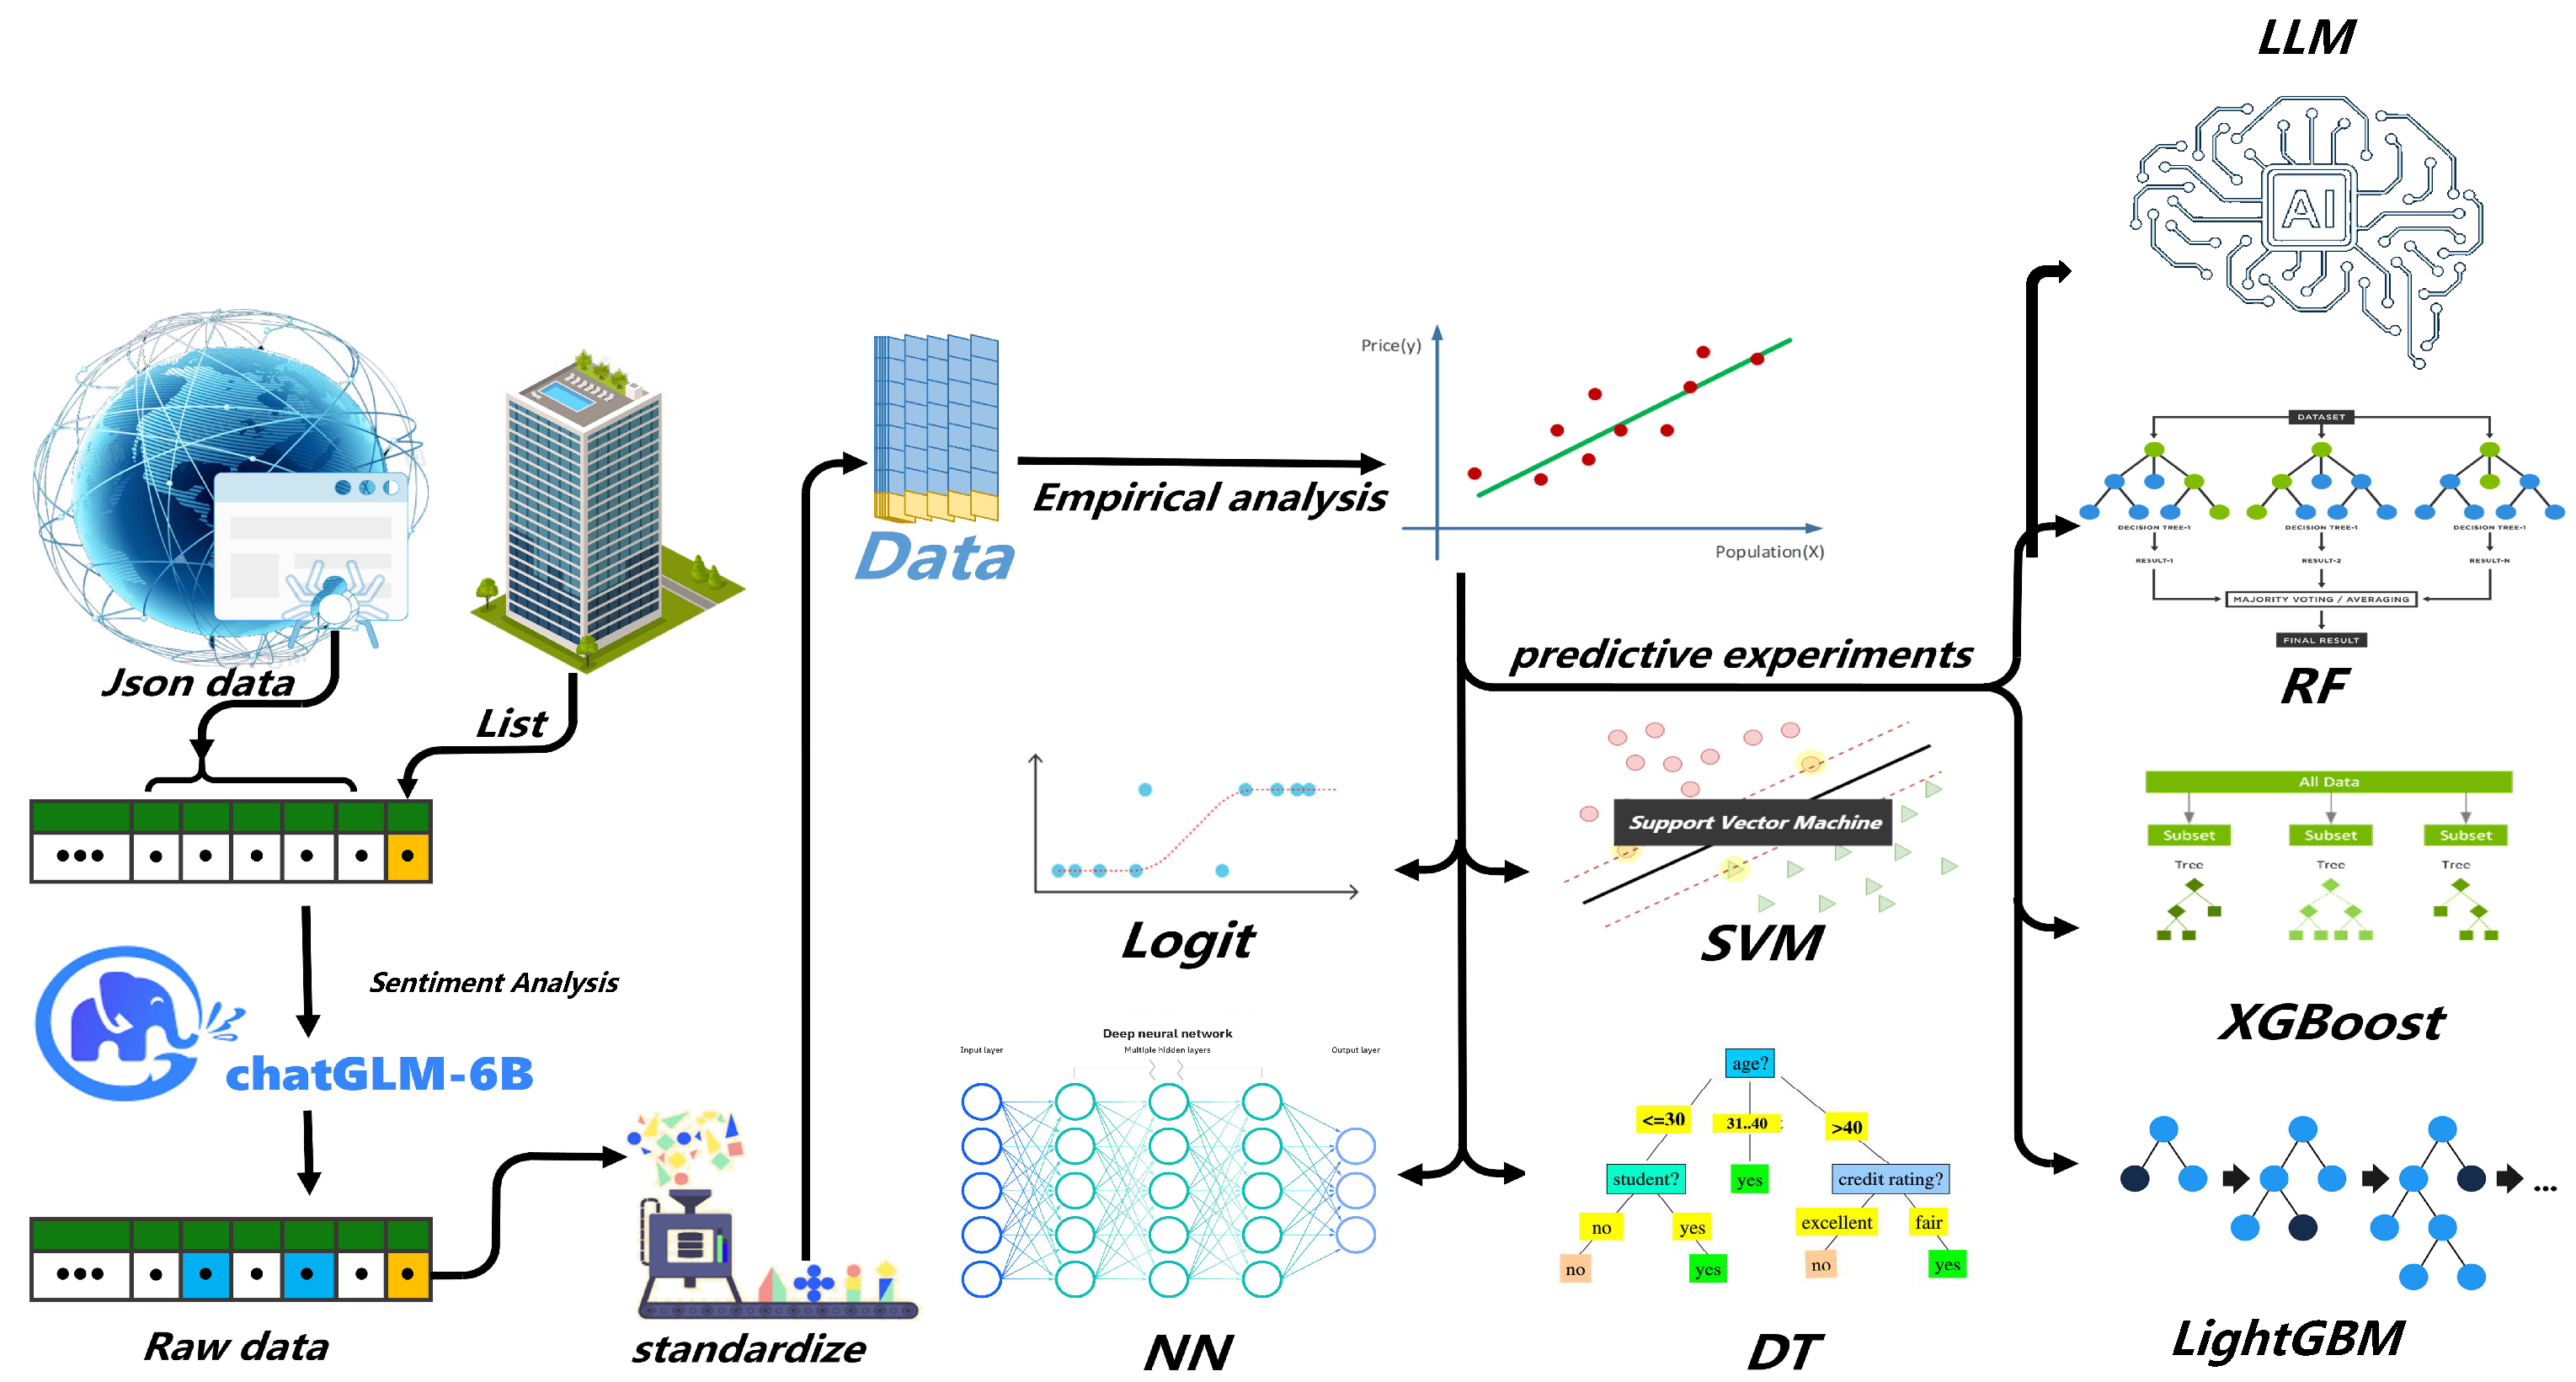
3. Dataset and Methods

In this section, we will provide a detailed overview of the data sources and processing methods for the Date dataset, as well as the methodologies employed for analyzing and predicting corporate default risk. The overall research framework is illustrated in Figure 1.

3.1. Dataset

The dataset employed in this study is exceptionally unique, encompassing non-financial information related to commercial bills and default data provided by partner companies. This deviation from the traditional reliance on financial data for risk analysis underscores the dataset’s distinctiveness. It also indicates significant challenges in acquiring this dataset. After processing, the dataset includes 38 dimensions across 1972 companies, with “2022 refuse num” as the target variable, as shown in Table 2. Notably, these values exhibit substantial variation, necessitating standardization methods for subsequent data processing. These data provide a robust foundation for detailed corporate risk analysis. This section will elucidate the dimensions and sources of the collected non-financial information and the data processing procedures utilized.

3.1.1. Data Types and Sources

Commercial Paper Data

Commercial paper is a temporary pledge certificate used for short-term business financing, reflecting a company’s ability to meet its payment obligations. In this study, the commercial paper data come from the “Eagle Eye” system developed by Sichuan Investment Cloud Chain Company. The original dataset includes 15 types of information and was initially presented in a scattered panel data format. Since the data come from different time periods (2020 to 2022), each company generates a timestamp when it accepts commercial paper in the system. The number and timing of acceptances vary among companies, so it cannot be used as traditional panel data directly. Therefore, this study extracts the latest query status for each company as its final commercial paper data, involving 1972 companies, mainly small and medium-sized enterprises in the real estate and construction sectors, along with various other industries. Additionally, this study creates two new features, “proportion of total rejection amounts” and “overall rejection rate”, using the total refused amount, total acceptance amount, total refusal count, and total acceptance count, resulting in a total of nine feature dimensions. Table 3 shows some sample data entries. From left to right, the features represent: company ID, total number of acceptances, number of settled cases, number of unsettled cases, total number of rejections, total number of rejections this year, total number of rejections last year, proportion of total rejection amounts, and overall rejection rate.

Corporate Business Data

In the realm of information science, corporate business data serve as an integral knowledge repository exhibiting the fundamental framework, operational performance, and creditworthiness of enterprises. These quintessential elements are invaluable to stakeholders such as investors, creditors, corporate associates, and regulatory entities. The fundamental components encompass data related to enterprise registration, shareholder composition, financial strength, and historical transition records. The quasi-imperative role of corporate business data in this research leverages a specific enterprise information inquiry portal as our primary source. Using strategically formulated coding sequences based on a pre-established list of enterprise search parameters, we accomplished successful extraction of industrial and commercial data pertinent to our target corporations from this portal.

Judicial Document Data

The litigation data from judicial documents is a pivotal resource for exploring corporate litigation risks and economic confliction. These texts offer comprehensive accounts of economic disagreements involving corporations, such as violations, victimization, and contractual disputes, thereby providing essential material for corporate legal risk analysis. The judicial document data employed in this research are mainly sourced from a particular enterprise information enquiry platform, supplemented by data from the judicial document portal, thereby ensuring data completeness and precision. While it does not encapsulate the entire content of the judicial documents, it adequately facilitates preliminary investigations. Furthermore, this research also procured and examined the defendant count from the website, typically derived from cases and involving defendants engaged in severe economic disputes. These data not only facilitate the comprehension of a company’s litigation history but also establish a crucial foundation for risk evaluation.

Corporate News Data

Corporate news data serve as a seminal information repository, mirroring the business’s digital footprint and encapsulating multifarious facets such as significant developments, conflicts, and disputes. A meticulous analysis of these news articles can draw inferences about the company’s emotional value and subsequently affirm its risk quotient. The news corpus in this research primarily originates from a specific business inquiry platform and various search engines. Due to the scarcity of news data for certain companies on the former platform, a supplementary approach was employed via search engines, thereby ensuring that the volume of news articles per company is maintained between 50 and 100. This mitigates the probability of analytical discrepancies. With the advent of sophisticated large language models, sentiment classification of news has transcended from a theoretical concept to a tangible reality. This research capitalizes on these models to delve deeper into the emotional worth of companies by dissecting news data. The following section will elucidate the utilization of these large language models in processing and classifying news data.

3.1.2. Data Processing

Data Format Transformation

This study employs Python for the analysis and processing of raw JSON-formatted data. Due to the multi-layered nesting in the data, a step-by-step traversal approach is employed to extract content, followed by regularization to ensure uniformity in data format. Upon regularization, essential data dimensions are extracted from the JSON file and stored using DataFrame, a data storage format in the pandas library, with predefined dimension titles and quantified representations. Different feature dimensions necessitate varied processing approaches, such as statistical computation for total filing counts, keyword extraction and counting for plaintiff and defendant quantities, and summing amounts for executed funds. Some data dimensions contain extensive information, requiring further iterative traversal. Upon completion of company dimension data traversal, the data are stored in the DataFrame and subsequently saved as an Excel spreadsheet for further analysis.
During data processing, challenges were encountered regarding missing data dimensions and format errors. To address format errors, an error-jumping approach was adopted, and zero-padding was applied for missing company dimensions. Following the statistical analysis of data dimensions, attention shifts to the analysis of enterprise news data. News data are sourced from two parts: website-packaged data and search engine-derived data. These are merged into a single list for subsequent iterative traversal operations.

Data Normalization Process

Before conducting model analysis, it is necessary to preprocess and normalize the original data to address significant data variations. The normalization methods used in this study are as follows:
  • MinMax Scaling
    This method scales features to a specified range, usually between 0 and 1. It is suitable when features have similar ranges or when a specific range is required.
  • Z-Score Normalization
    This method adjusts data to be centered at zero with a standard deviation of one. It is useful for models sensitive to input scales, allowing each feature to have equal influence in distance calculations.
  • Log Scaling
    Log transformation reduces data skewness and mitigates the effects of outliers, making the data distribution more symmetric. It is particularly effective for data spanning multiple orders of magnitude.

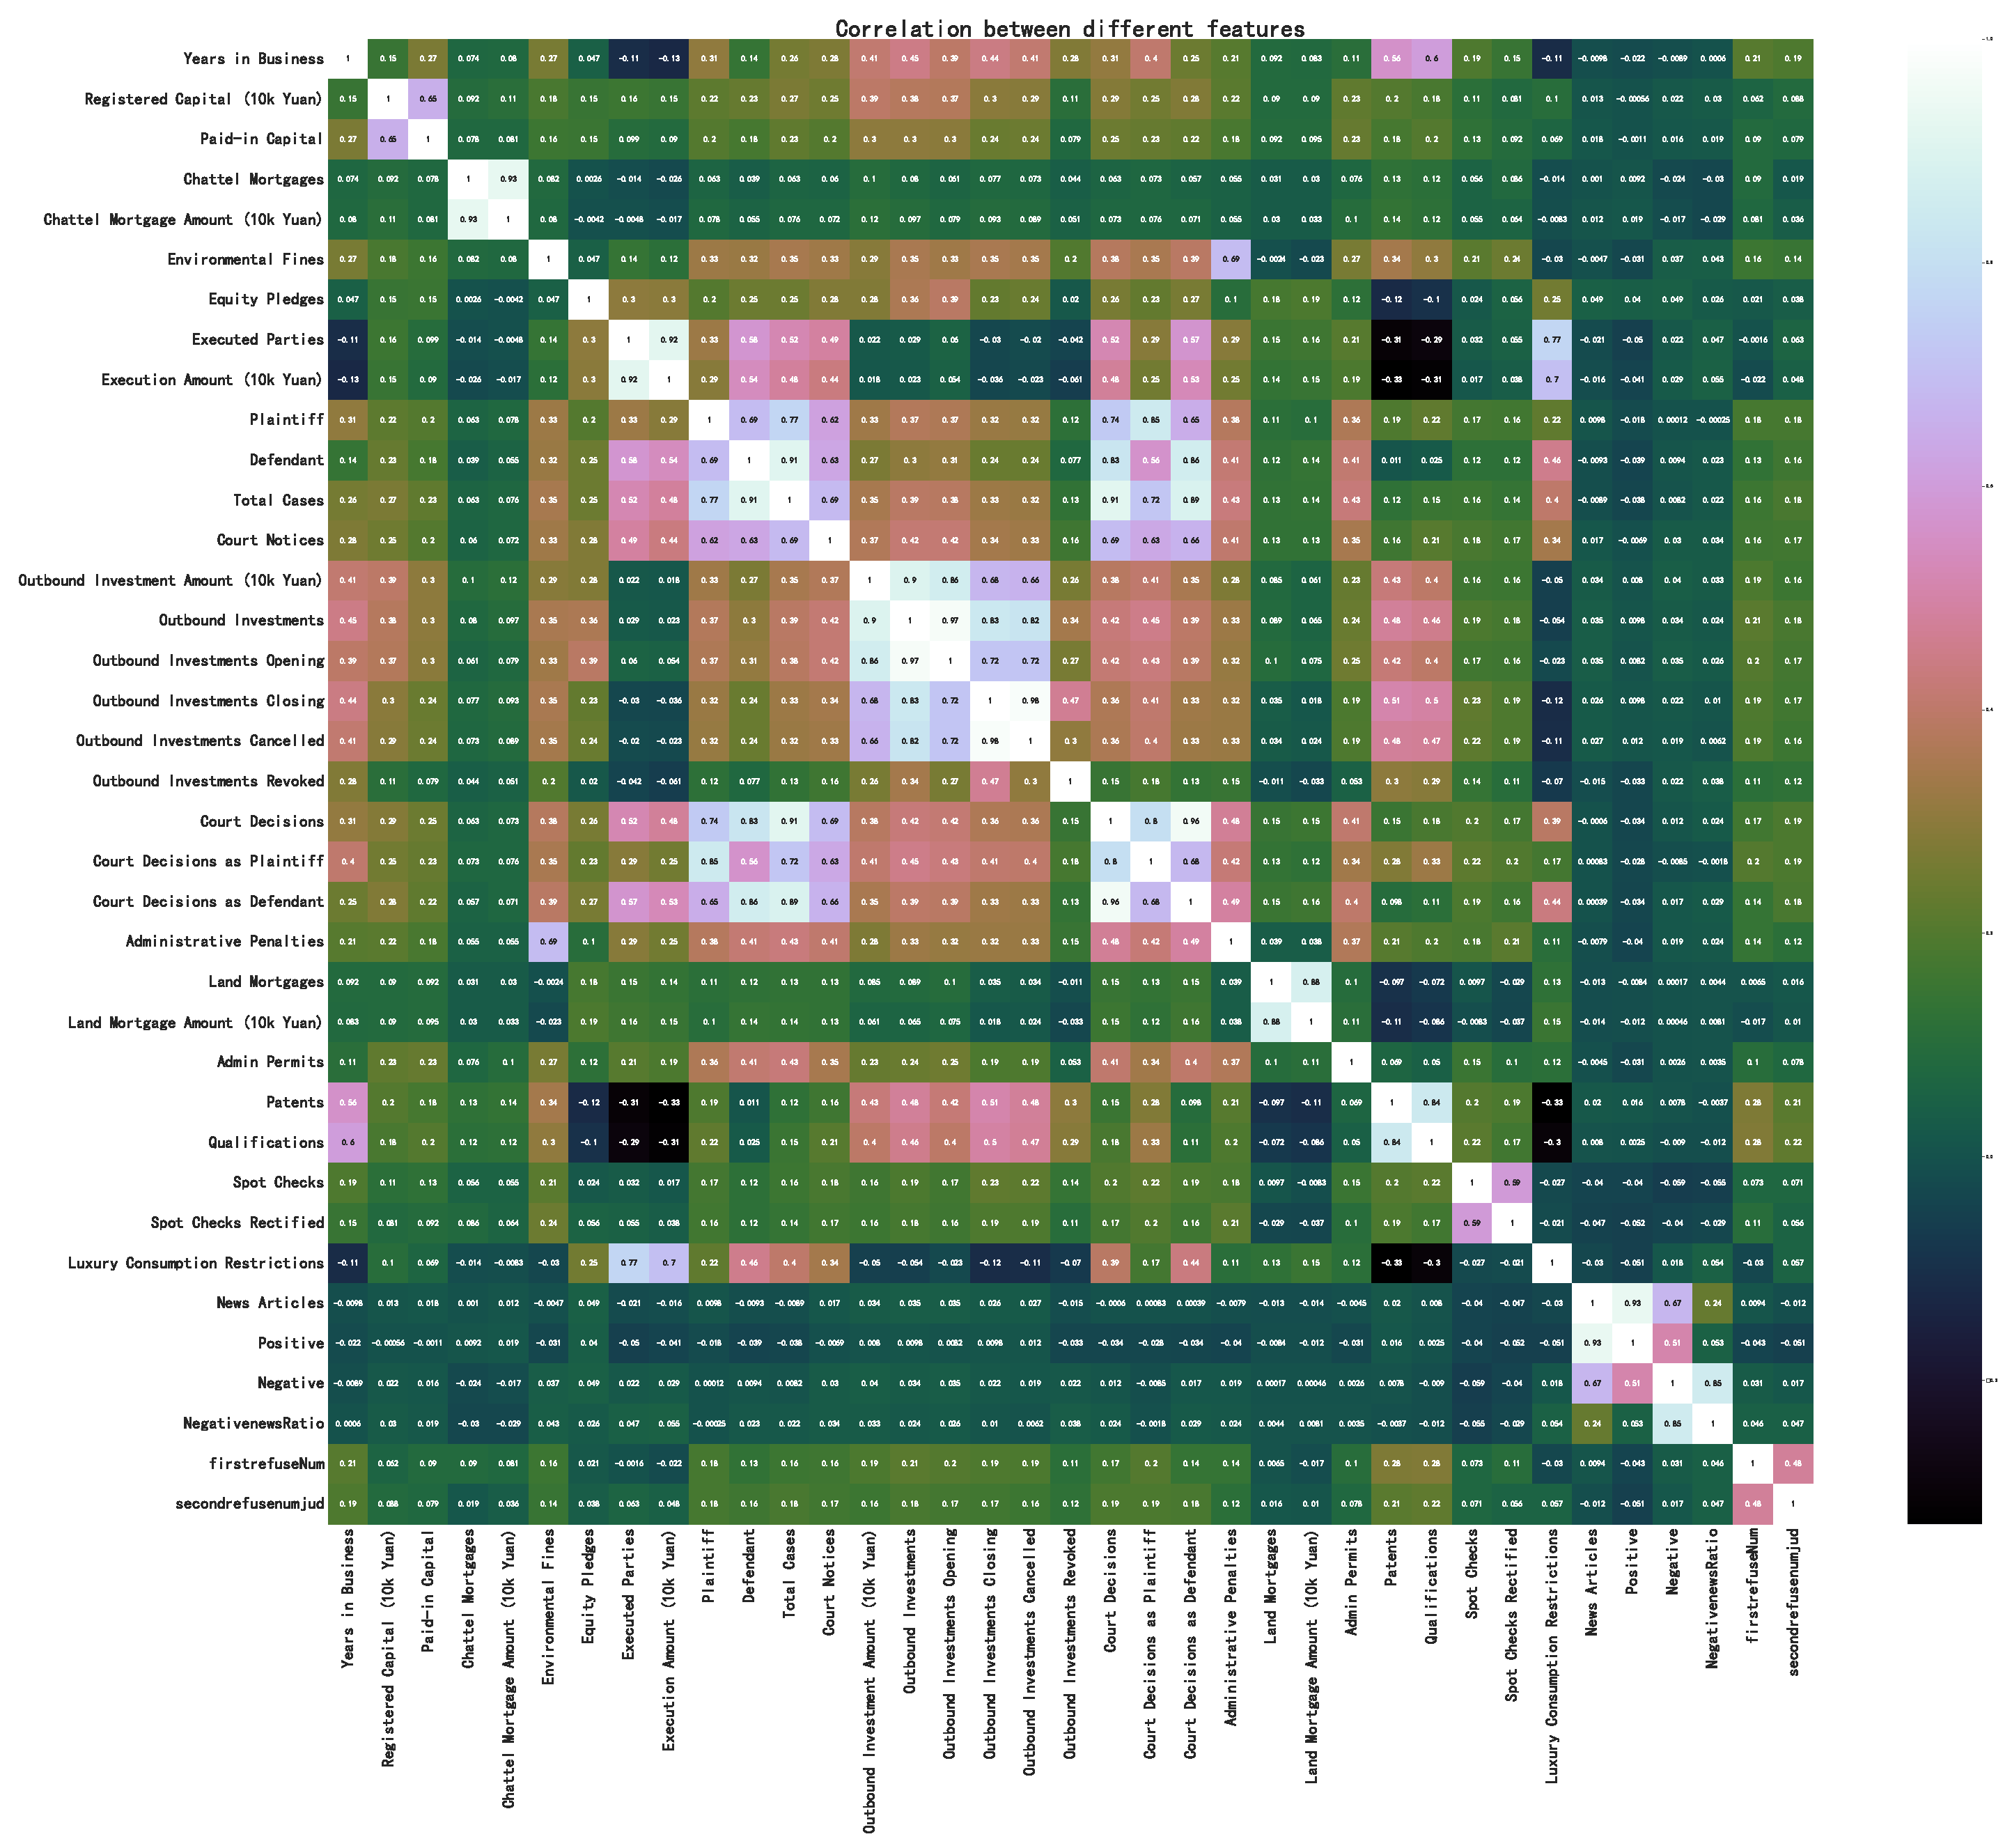
3.1.3. Correlation Analysis of Data

This study employs the Pearson correlation analysis, as per the following formula:
r = Σ x i x ¯ y i y ¯ Σ x i x ¯ 2 Σ y i y ¯ 2
where x i and y i embody the observed values of two variables, contrasted with their respective means, x ¯ and y ¯ . In this context, a correlation examination is performed on the pre-normalized data. The resulting correlation heatmap is portrayed in Figure 2, with darker hues denoting lower correlations among data dimensions, and lighter ones signifying higher correlations.
Reviewing the original data reveals weak linear correlations with defaults, highlighting the constraints of data acquisition for SMEs (small and medium-sized enterprises). To boost non-financial data analysis precision, this study integrates multidimensional data for thorough examination.
After logarithmic normalization, data correlations are amplified, fostering subsequent data inquiry and projection. Figure 3 reveals the correlation evolution after logarithmic normalization.

3.2. Methods

In this section, various methods used for experimentation in this paper will be detailed. They can be broadly categorized into three types: empirical analysis, machine learning algorithms, and large language models.

3.2.1. Empirical Analysis

Econometric Regression

Due to the numerous data dimensions in this study, this approach can mitigate the influence of confounding factors and investigate the key variables affecting corporate bill default. Subsequent methodologies employing large language models will experiment with the key variables determined through regression analysis rather than incorporating all data dimensions.

3.2.2. Machine Learning Methods

Logistic Regression

Logistic regression, originating from the field of econometrics, stands as a powerful tool for handling classification problems, particularly excelling in binary classification scenarios [34]. Its evolution enables the machine learning domain to predict the probability of event occurrences using this model, thereby furnishing an effective mathematical approach for classification decisions. Logistic regression not only boasts a concise and comprehensible model form but also provides a probabilistic interpretation of the model’s prediction results, which is a crucial reason for selecting this method in this study.

Support Vector Machines

Support Vector Machine (SVM) is a powerful supervised learning algorithm that is primarily utilized for classification prediction [35]. Its core concept involves finding the optimal separating hyperplane within the dataset; one that maximizes the margin between datapoints of different classes. By incorporating kernel tricks, SVM effectively handles linearly inseparable data. Given the presence of numerous features in the dataset, SVM can handle high-dimensional data and performs well even in cases of linearly inseparable or nonlinear data, enabling effective classification prediction.

Neural Networks

Neural networks, inspired by the structure and functionality of the human brain, represent a computational model [36]. This approach often excels in capturing patterns and regularities hidden within datasets with complex structures and numerous features. Given the multifaceted nature of non-financial enterprise data in this study’s dataset, neural networks can effectively learn intricate relationships among these data and handle various types of feature data.

Decision Tree

The decision tree is a widely adopted machine learning algorithm utilized for classification and regression tasks [37]. Decision trees are renowned for their ease of comprehension and interpretation, while also exhibiting relative insensitivity to missing values and irrelevant features. Considering the possibility of irrelevant features or missing values within the dataset, decision trees can effectively handle such scenarios. Additionally, owing to their intuitive nature, they contribute to the interpretation and explanation of the data.

Random Forests

Random Forest [38] is an influential ensemble learning methodology designed to enhance prediction accuracy and resilience by amalgamating the forecast results of numerous decision trees. This approach notably enhances prediction accuracy and robustness, especially when confronted with noise and anomalies within the dataset.
In the financial domain, the random forest finds utility in detecting corporate credit risks or the likelihood of default. As evidenced by several studies, this algorithm can scrutinize a company’s historical financial data, credit records, and market activities to discern intricate patterns and relationships indicative of future default events, thereby ensuring superior accuracy and reliability compared to individual decision trees [39,40].

XGBoost

XGBoost is another efficient and powerful gradient boosting framework that is widely employed across various practical applications, acclaimed for its outstanding performance and speed. Its advantages lie in optimizing the computational efficiency and resource consumption of traditional gradient boosting algorithms while enhancing model accuracy. In the realm of enterprise credit risk prediction within the financial domain, XGBoost stands out as a potentially highly effective tool. Its capability to handle vast arrays of features enables it to probabilistically identify key factors influencing corporate credit ratings [41,42].

LightGBM

LightGBM (light gradient boosting machine) [43] is an efficient gradient boosting framework renowned for its superior speed, heightened efficiency, and reduced memory footprint. Leveraging a histogram-based decision tree algorithm, it discretizes the values of continuous features into histogram bins, thereby diminishing computational load while upholding high precision. In the financial domain, LightGBM can also be employed for enterprise credit risk prediction. By analyzing a company’s financial information, legal data, market environment, and other pertinent information, LightGBM may discern key factors potentially leading to credit default.

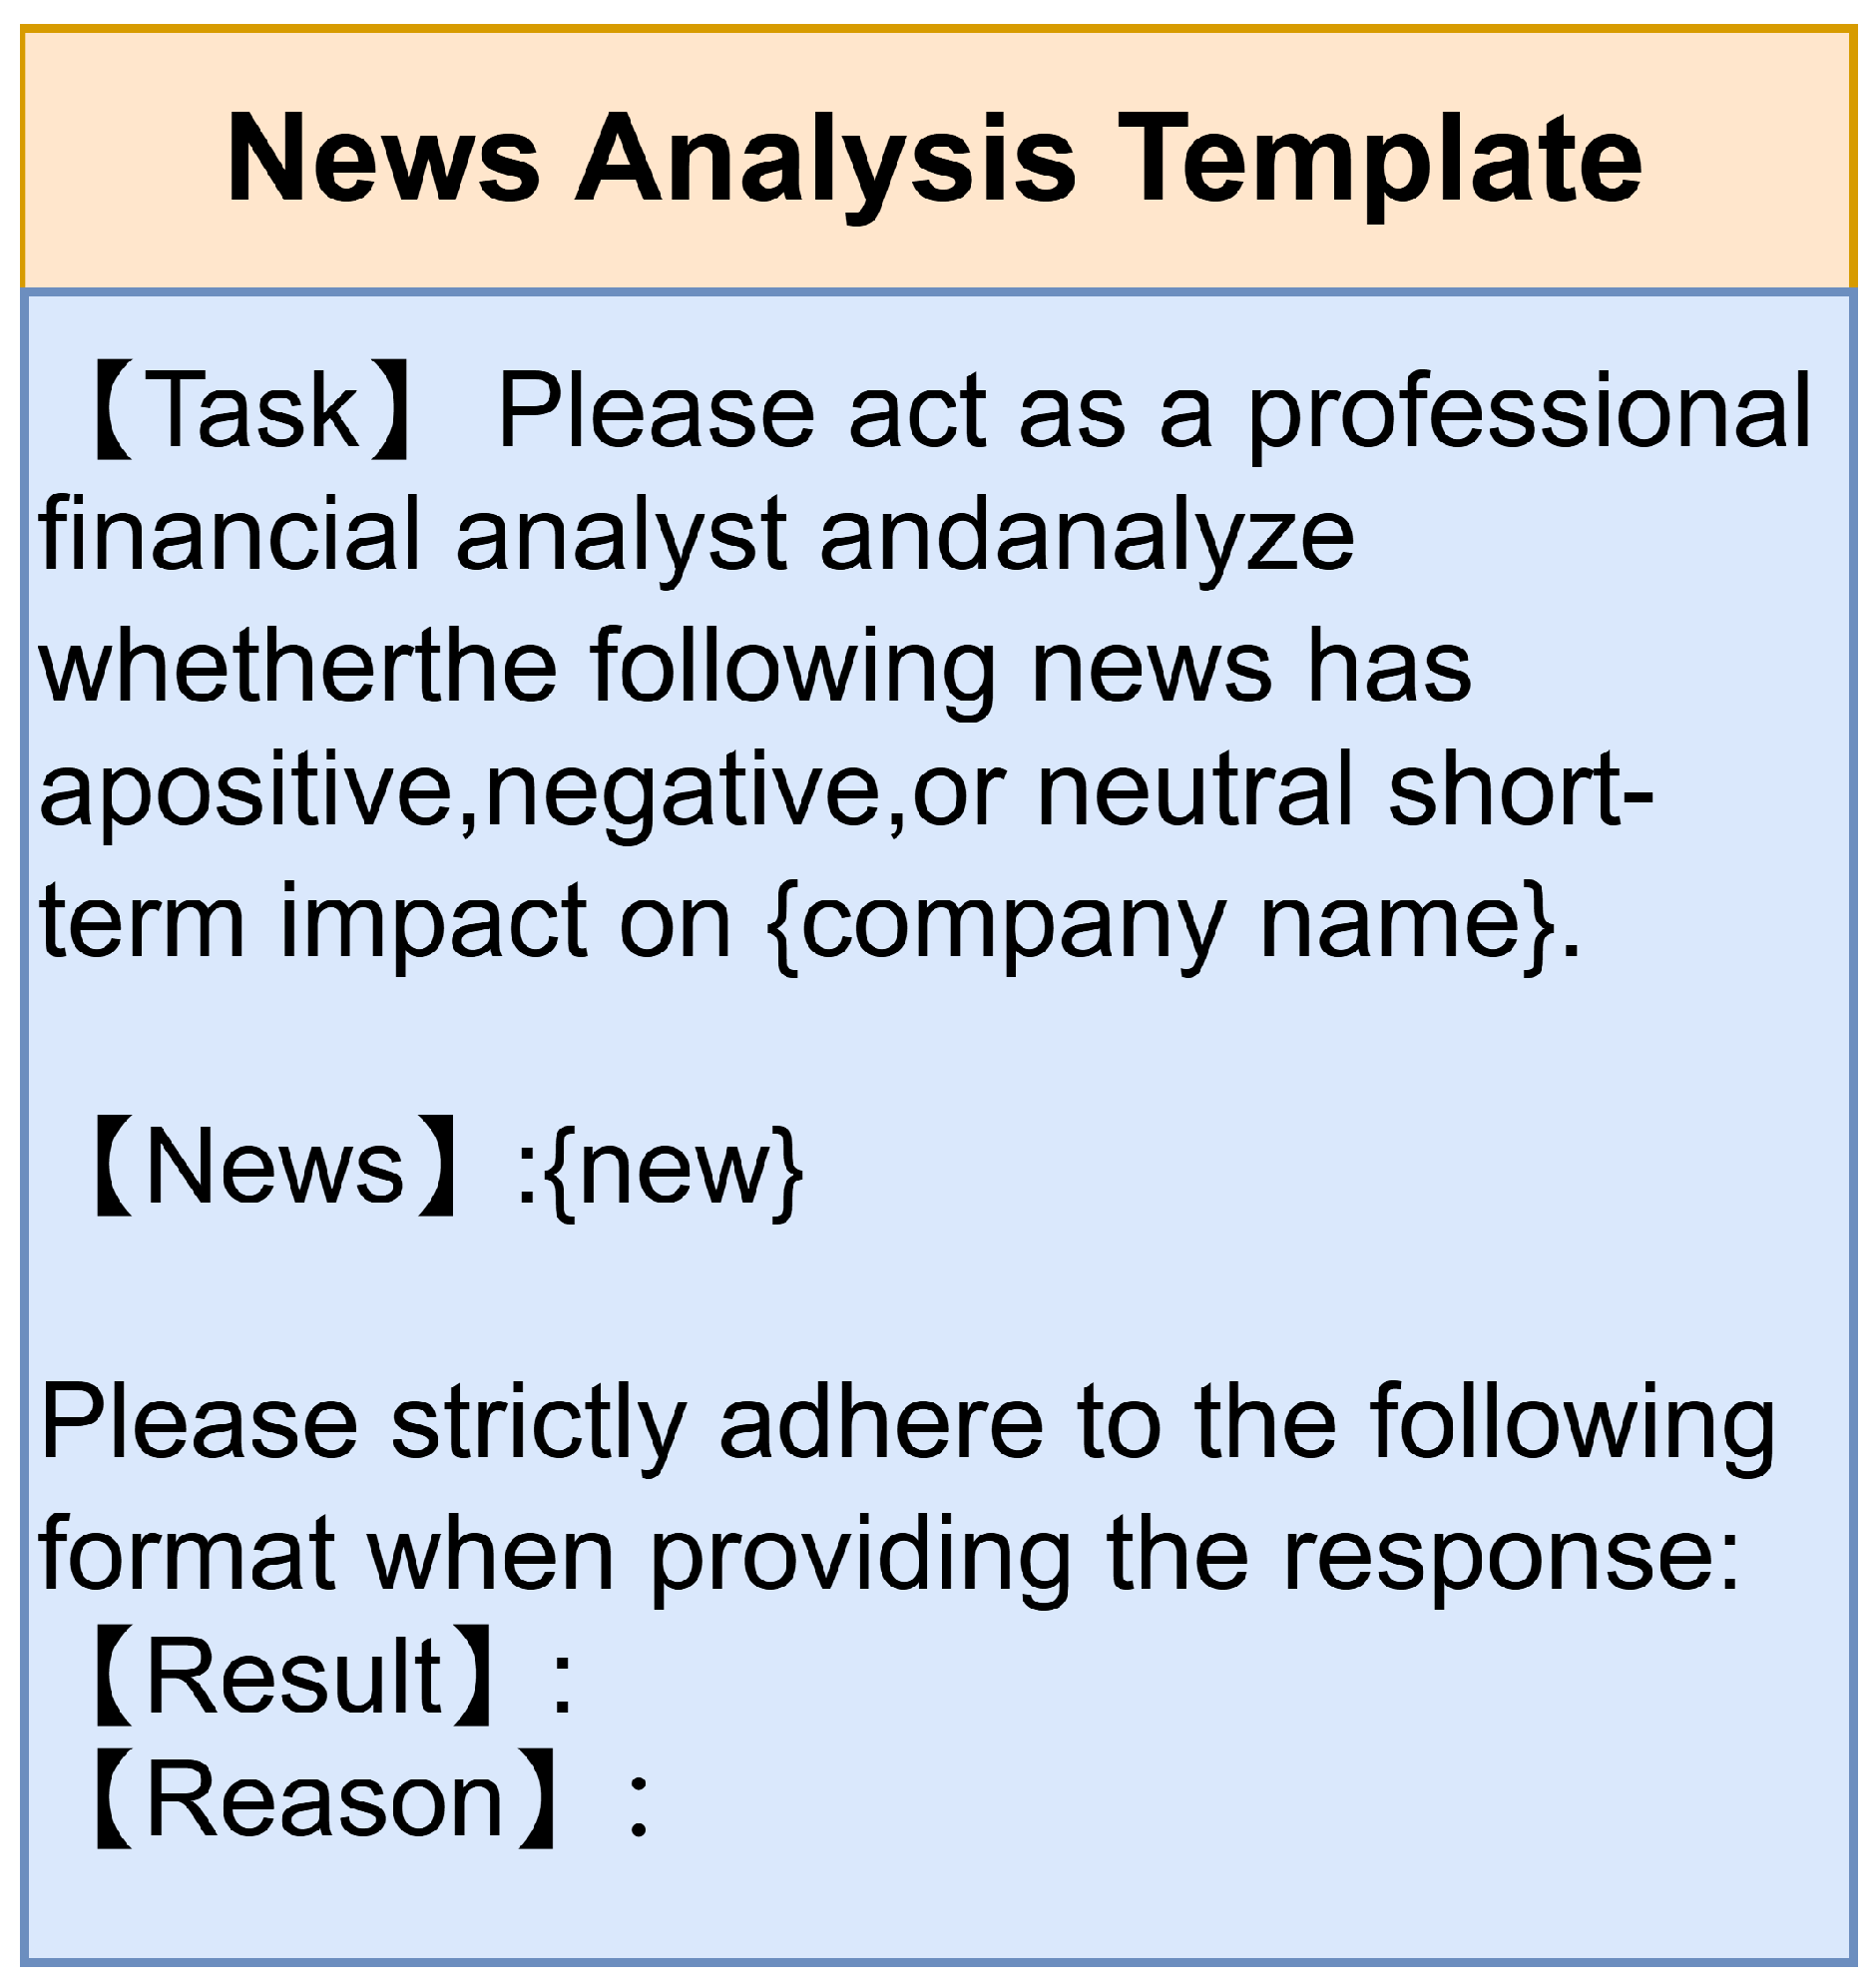
3.2.3. Prompt Learning of Large Language Models

Large language models (LLMs) possess exceptional general-purpose capabilities, meaning they can handle a wide range of tasks and problems without the need for specialized training for each task. Several factors contribute to this generalization ability: they are trained on vast amounts of data, have a large number of parameters, and they possess zero-shot learning and context comprehension abilities. By using prompt learning, we can guide these models to generate the desired answers or solutions, effectively transforming various tasks into generation tasks. Ruifan Li et al. [44] proposed an enhanced prompt learning method (EPL4FTC) that transforms text classification tasks into a natural language inference prompt-based learning format, significantly improving classification accuracy across multiple datasets. Building on this work, this paper constructs prompt templates, treating prediction tasks as instructions and incorporating company-specific data metrics as contextual information. This enables the large model to analyze and assess a company’s default risk.

3.2.4. LLM Sentiment Analysis

Sentiment analysis of news holds significant importance in the modern financial and business environment, particularly in predicting corporate default risks. By analyzing the sentiment trends in news reports, it is possible to capture the market’s emotional responses to a company, providing additional insights into the company’s financial health. Sentiment analysis has long been a critical research topic in the field of natural language processing (NLP). Ruifan Li et al. [45] proposed the Dual Graph Convolutional Network (DualGCN) model for aspect-based sentiment analysis, which addresses dependency parsing errors and the complexity of online reviews by combining syntactic and semantic information, outperforming existing methods on multiple datasets. Shuqin Ye et al. [46] introduced the EMRC method, which formalizes the task of aspect sentiment quadruplet extraction as a multi-turn machine reading comprehension task. By effectively learning the relationships among subtasks and employing a hierarchical classification strategy, this approach significantly enhances performance. However, with the emergence of large language models (LLMs) that possess general-purpose capabilities, LLMs have surpassed most models in sentiment analysis performance.
This paper leverages the capabilities of the local budding ChatGLM3-6b Large Language Model (LLM). The model’s advanced language understanding makes it an ideal choice for the sentiment analysis undertaken in this paper. Bolstering its precision, the model offers comprehensive justifications for its assessments during news sentiment evaluation. The template prompts for sentiment analysis can be found in Figure 4, with specific examples provided in Table A1 of Appendix A. Upon receiving the model’s output, a comprehensive keyword statistical examination of the responses occurs, totaled once all companies’ news analysis are completed. We then compiled the number of positive and negative sentiments observed into a summarized table.

4. Experiments and Results

The experiment section of this paper mainly involves empirical studies and predictive studies. It is necessary to conduct empirical research on core variables before conducting predictive studies, which can make the experiment more informative. In subsequent predictive studies, a single algorithm alone may not achieve optimal performance, so it is also necessary to conduct comparative studies of multiple algorithms in order to find the optimal predictive algorithm.

4.1. Quantitative Analysis

4.1.1. Indicator Selection and Model Design

Due to the high dimensionality of enterprise data, including all indicators in the regression analysis is impractical, and some dimensions exhibit endogeneity issues. Therefore, this study prioritizes the selection of core indicators to mitigate high endogeneity.
This research posits that paid-in capital is related to a firm’s risk resilience, the number of defendants in legal judgments correlates with enterprise risk, the proportion of negative news is associated with risk, and restrictions on high consumption are significant risk indicators. Additionally, historical default records reflect the long-term creditworthiness of the firm. Consequently, the core explanatory variables include enterprise age, the number of defendants, the proportion of negative news, last year’s default status, and the number of high consumption restrictions. Given that the variables underwent logarithmic transformation, the regression model is as follows:
S r = β 0 + β 1 A g e + β 2 P l a + β 3 N n r + β 4 F r n + β 5 L c r + ε
In this model, Age symbolizes company age, Pla represents the number of times a company has been a plaintiff, Nnr portrays the ratio of negative news (negative news ratio), Frn stands for the previous year’s default status (first refusal number), and Lcr signifies the count of individuals subject to luxury consumption restrictions. Sr is the dependent variable, indicating the current year’s default status (second refusal number).

4.1.2. Baseline Regression Results

A regression analysis on the normalized data was executed, and the results are displayed in Table 4. The coefficient represents the magnitude and direction of the impact that the independent variable has on the dependent variable. A positive value indicates a positive impact, while a negative value indicates a negative impact. T-value is used to determine the significance of the coefficient; the larger the T-value, the more significant the effect of the independent variable on the dependent variable. The regression results show that the key variables identified in this paper have a significant impact on corporate bill defaults. The age of a company has a significant positive effect on its default risk. Startups are riskier, but as companies enter the growth and maturity phases, the risk decreases. However, when companies reach old age or decline, the risk increases again. Most companies in the sample are over 10 years old, which may mean they have passed their peak, leading to an increase in default risk. The number of defendants and the ratio of negative news are significantly positively related to default risk. When a company is a defendant, it often faces more defaults. Negative news reflects the company’s operating conditions and public opinion, indicating increased risk. Additionally, limiting high consumption is a serious measure that reveals possible dishonest behavior or financial crises, which is also significantly positively related to risk. The number of defaults last year serves as a temporal variable, reflecting the company’s historical credit status. If a company has a record of defaults, the probability of defaulting again increases, similar to how insurance premiums rise after a claim.
Overall, the core variables studied in this paper are significantly positively related to corporate default risk. Except for last year’s default numbers, other indicators are easy to obtain, which is important for researching the default risk of small and medium-sized enterprises.

4.1.3. Heteroscedasticity Analysis

Our dataset comprises business information drawn from diverse industries such as real estate, construction, etc., thus offering ample industry-specific data for heteroscedasticity examination. Table 5 meticulously delineates the outcomes of the analysis.
In the heterogeneity test, except for last year’s default situation, the other variables did not consistently show significance. If we ignore the significance indicator, the effect of company age on default risk is always positively correlated. However, the number of times a company is a defendant shows a negative correlation in real estate companies, which is difficult to explain and may be an error. The ratio of negative news has a higher correlation with risk for real estate and construction companies. The number of people restricted from high consumption is more related to the risk for real estate and construction companies, with a greater elastic effect.

4.1.4. Robustness Test

Upon first establishing the baseline regression, this study adopted the number of defaults over the previous year as the pivotal dependent variable. The current model, however, has replaced this factor with the overall default rate, detailing every instance of default across the entirety of commercial bill acceptance operations for the given enterprises. Notwithstanding these adjustments, the regression model retains its original form. The robustness test results of the modified regression are outlined in Table 6.
The robustness analysis indicates a marginal lessening in the significance of firm age and defendant count, likely due to their comparatively trivial influence on the cumulative default rate. Nevertheless, a substantial positive correlation persists among variables such as negative news frequency, prior year’s default count, and restrictions on excessive consumption, aligning with our antecedent hypotheses.
The heatmap concisely displays the relatively low correlation between each dataset and default label. This elucidates the difficulty in predicting SME default rates, given the unavailability of significant financial disclosures often inherent to SMEs. Our objective is to discern indicators that influence bond defaults among SMEs drawn from publicly available data, thereby bringing relevance to our research. After data standardization, it was inputted into a variety of machine learning models for predictive analytics, and the optimal hyperparameters were estimated using a grid search.

4.2. Machine Learning Methodology

4.2.1. Experimental Setup
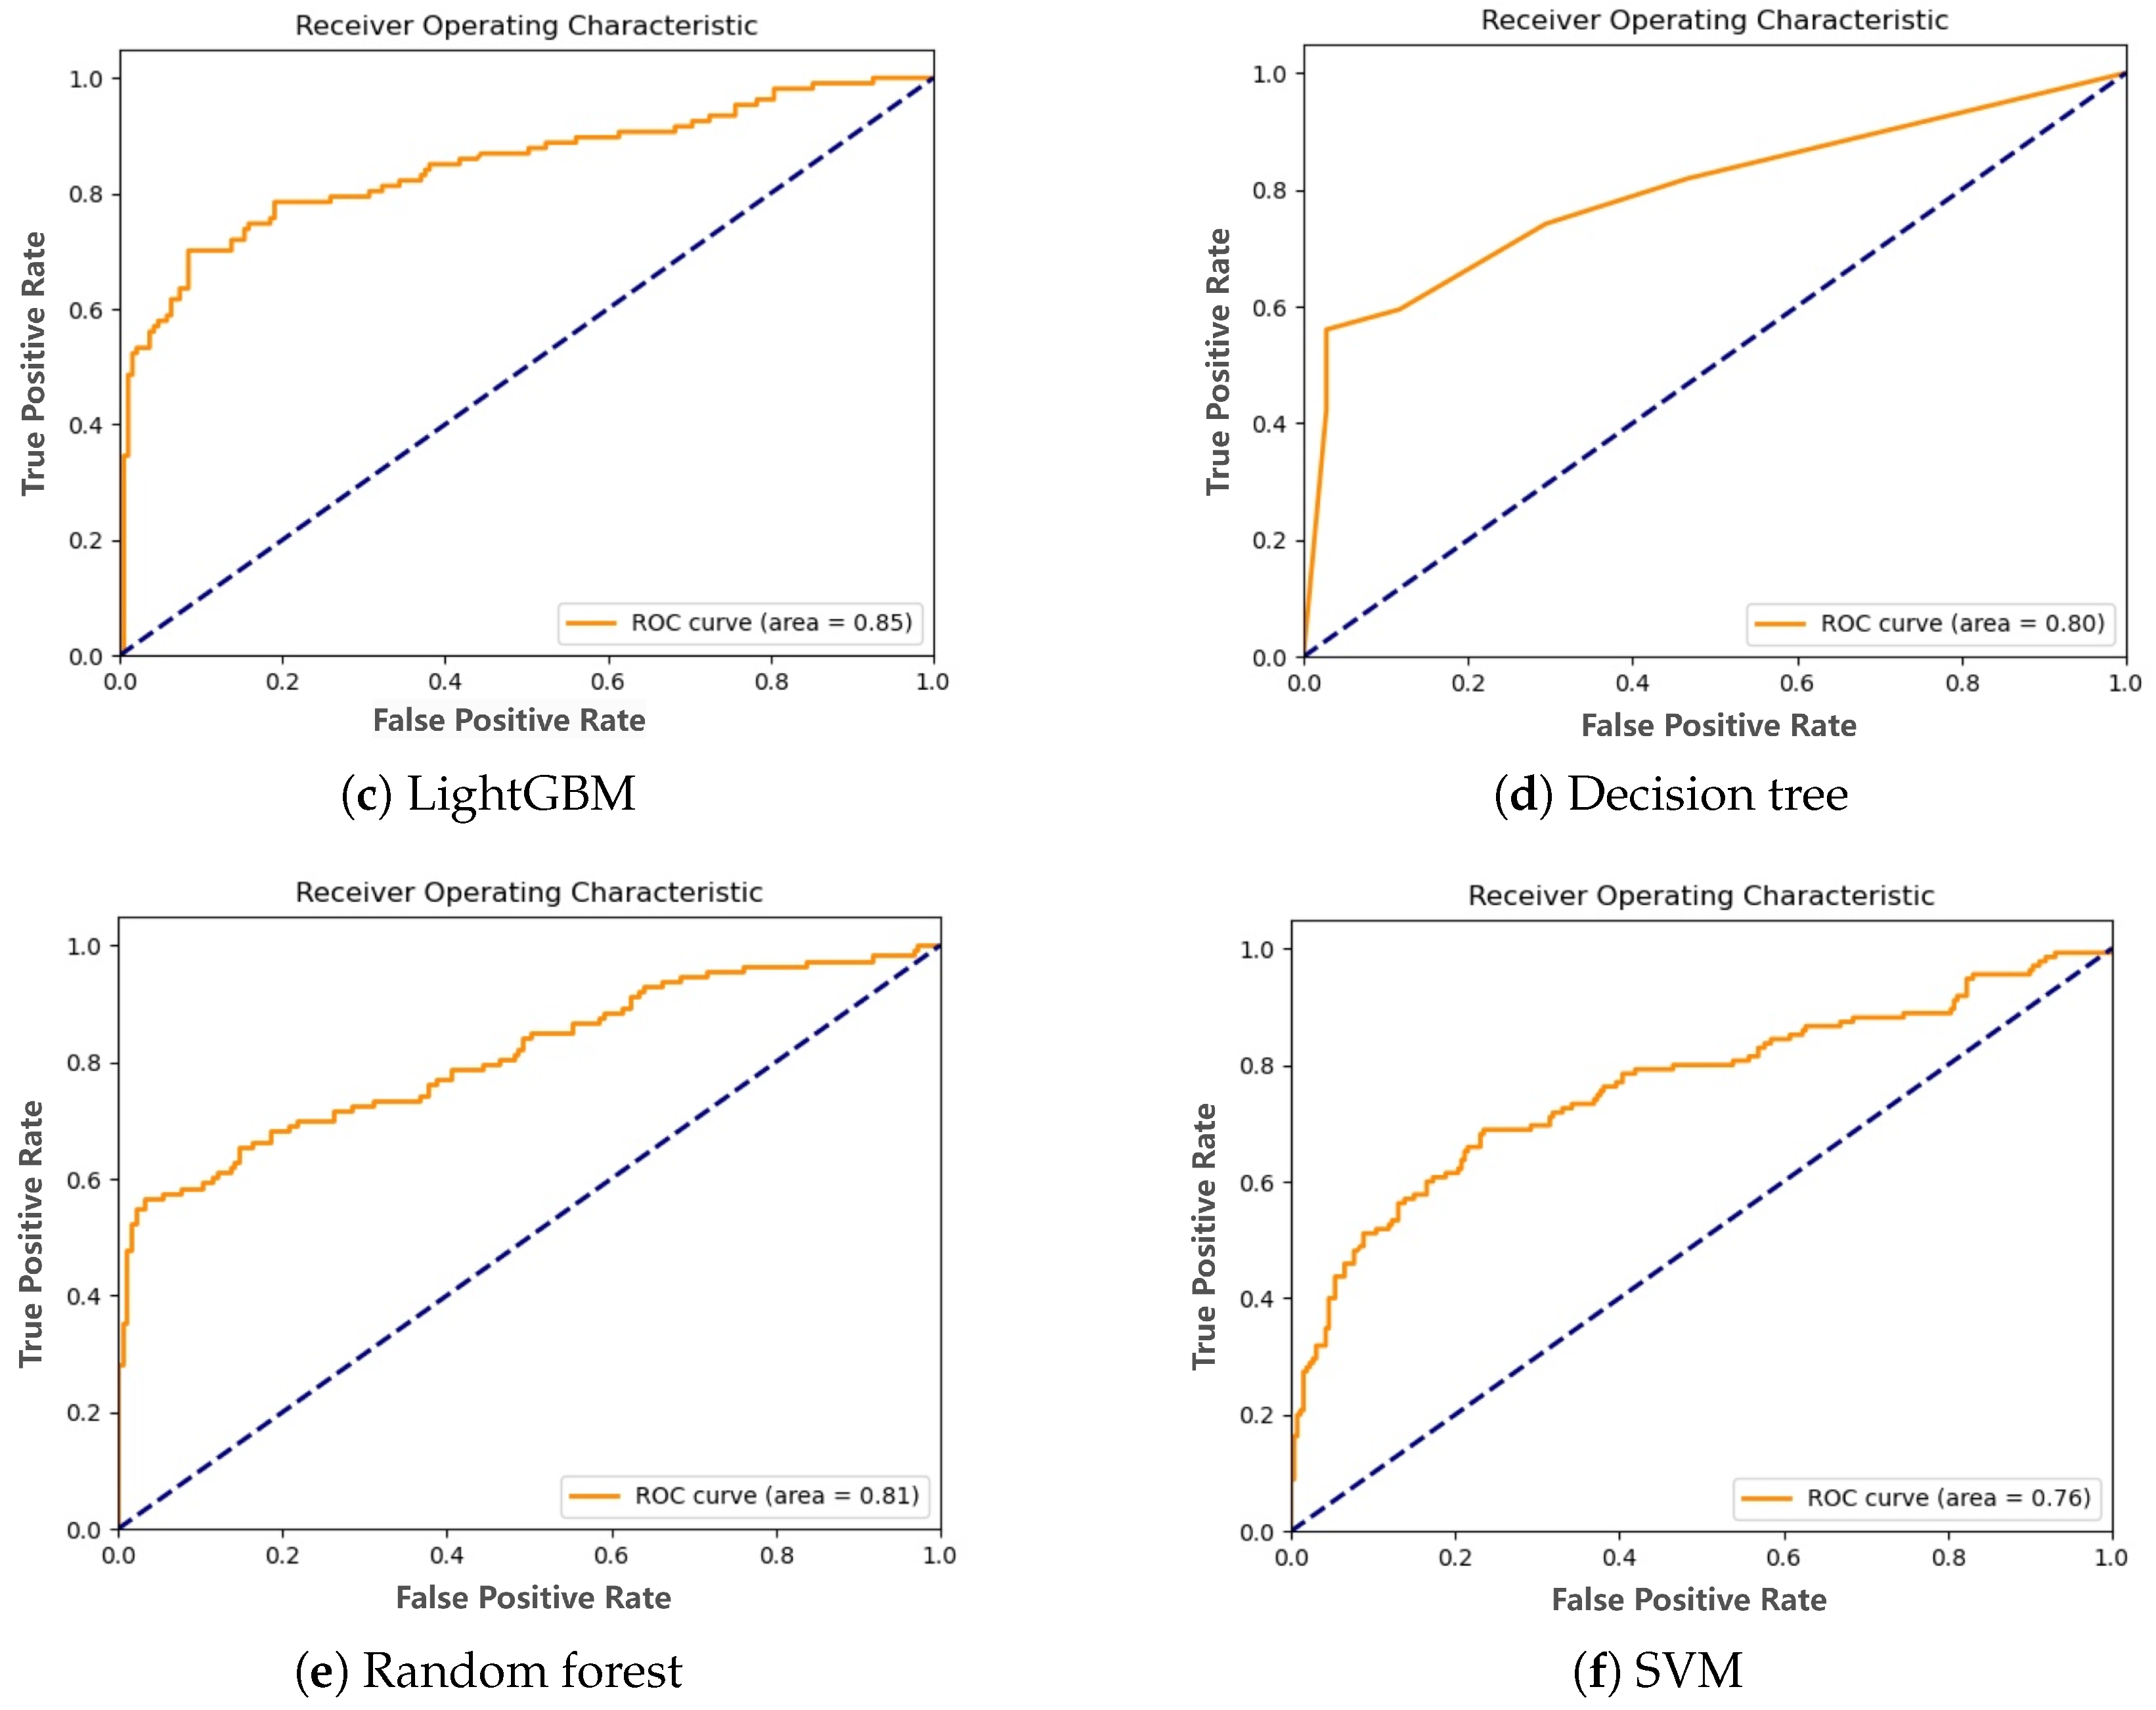
In this section, we conducted experiments on a carefully curated non-financial dataset of 1972 small and medium-sized enterprises. We utilized seven commonly used machine learning algorithms for financial risk prediction and evaluated each method’s performance using accuracy, precision, recall, F1 score and ROC. The bold values in the table below represent the highest value achieved by the model for each indicator, reflecting the model’s optimal performance.

4.2.2. Results

The experiment incorporated diverse datasets and machine learning algorithms for training and evaluation. The evaluation metrics were computed using a weighted average approach, accounting for the two-label distribution in the dataset. Detailed results are presented in Table 7.
Initially, the machine learning models registered moderate performance across multiple datasets. Concretely, XGBoost demonstrated superior performance in the measures of accuracy and F1 score, while the random forest algorithm excelled in precision. Similarly, LightGBM outperformed the other models in recall. It is important to highlight that each of these three models resonates with distinct data normalization techniques: Log scaling aligns with the random forest, MinMax scaling is fitting for LightGBM, and Z-score scaling is most suitable for XGBoost. Additionally, this paper also calculates the average values of differences caused by different datasets for each model to assess the comprehensive performance of the models. The average values of each evaluation metric for the models are shown in Table 8.
The performance analysis suggests stable and robust evaluation by the random forest algorithm across various datasets, outperforming the XGBoost algorithm. Hence, irrespective of the dataset standardization methodology employed, the random forest algorithm proves a reliable solution for default prediction.
This study utilizes the XGBoost algorithm in conjunction with the multi:softmax method, which does not support the return of predicted probabilities, precluding the potential to plot the ROC curve for optimal model performance, as illustrated in Figure 5. Based on the curves’ contour, the random forest and LightGBM algorithms demonstrate superior performance, evidenced by their ROC curves’ proximity to the top-left corner.

4.3. LLM Section

4.3.1. Experimental Setup

In this experiment, only six key data dimensions identified in the regression analysis were utilized, rather than all dimensions. Due to the inherent instability in the LLM’s responses, we generated three answers for each sample and selected the most frequently occurring response as the final prediction. However, this approach triples the cost, so we only conducted experiments on 1000 randomly selected samples. The template prompts for risk prediction can be found in Figure 6, with specific examples provided in Table A2 of Appendix A.
Additionally, to better adapt the model to the task of corporate default risk prediction, we conducted instruction tuning [47] on the LLM, resulting in the fine-tuned model LLM-FT. The specific fine-tuning process is illustrated in Figure 7.

4.3.2. Fine-Tuning Procedure

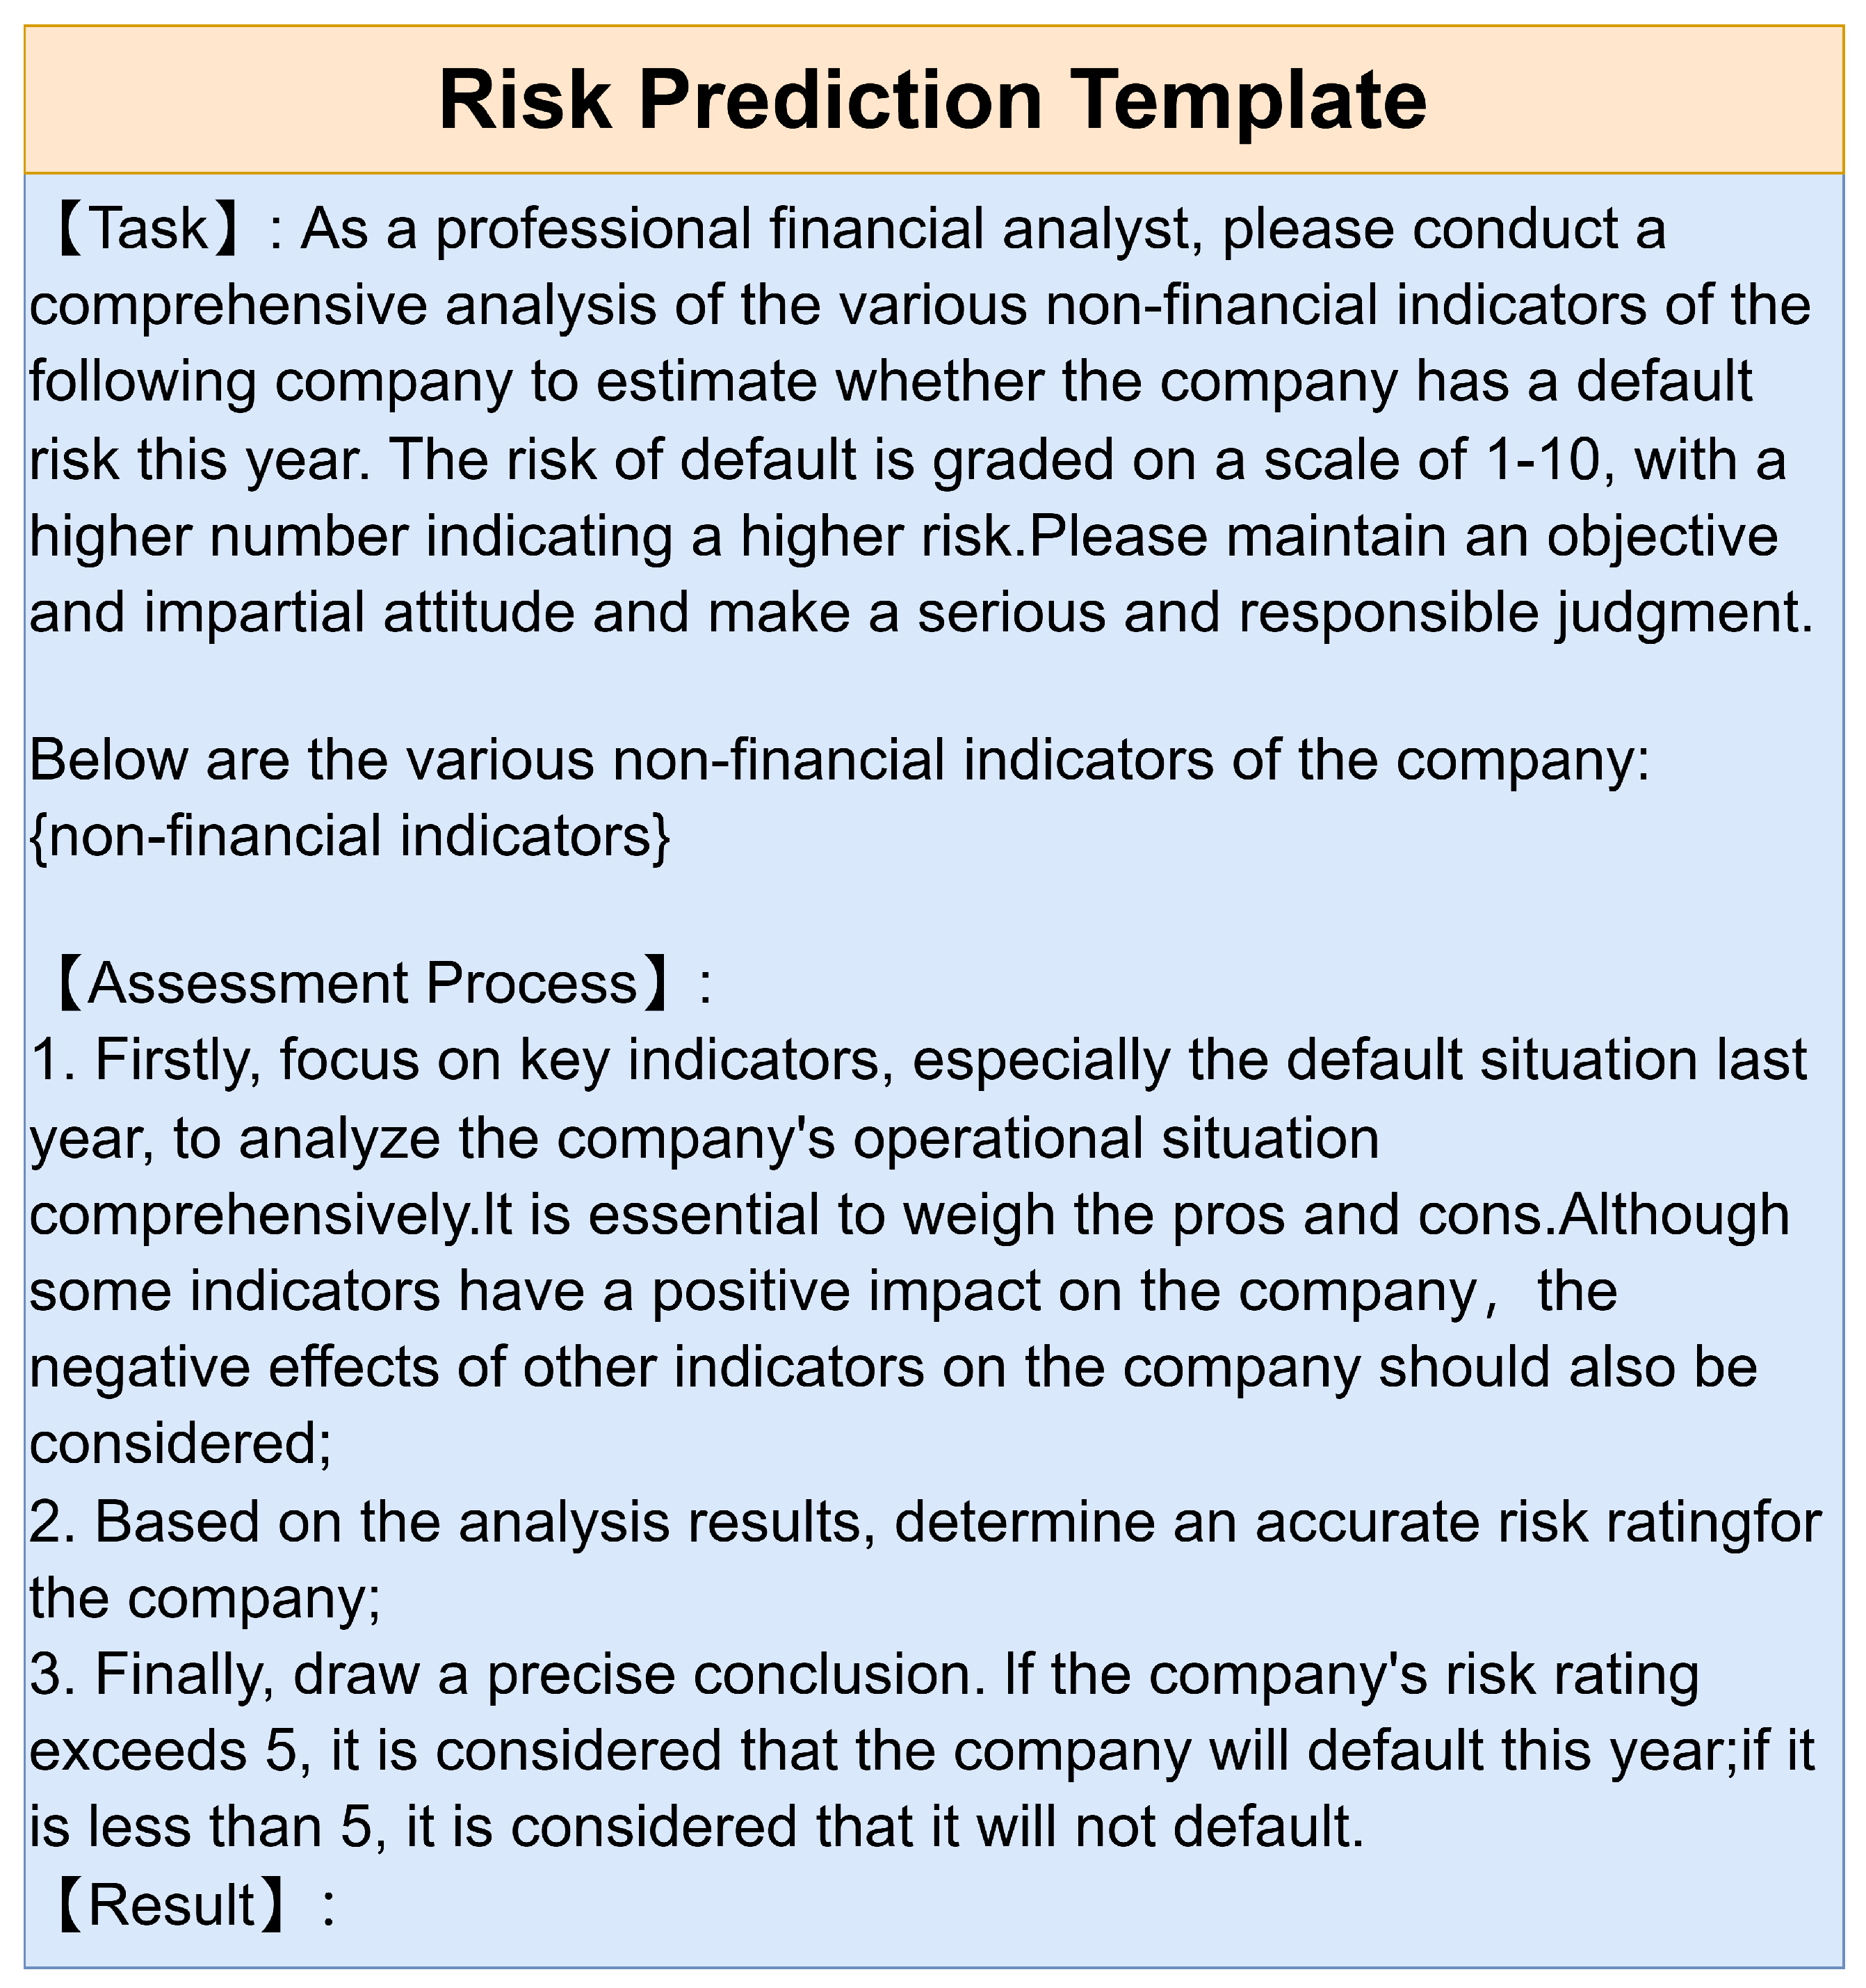
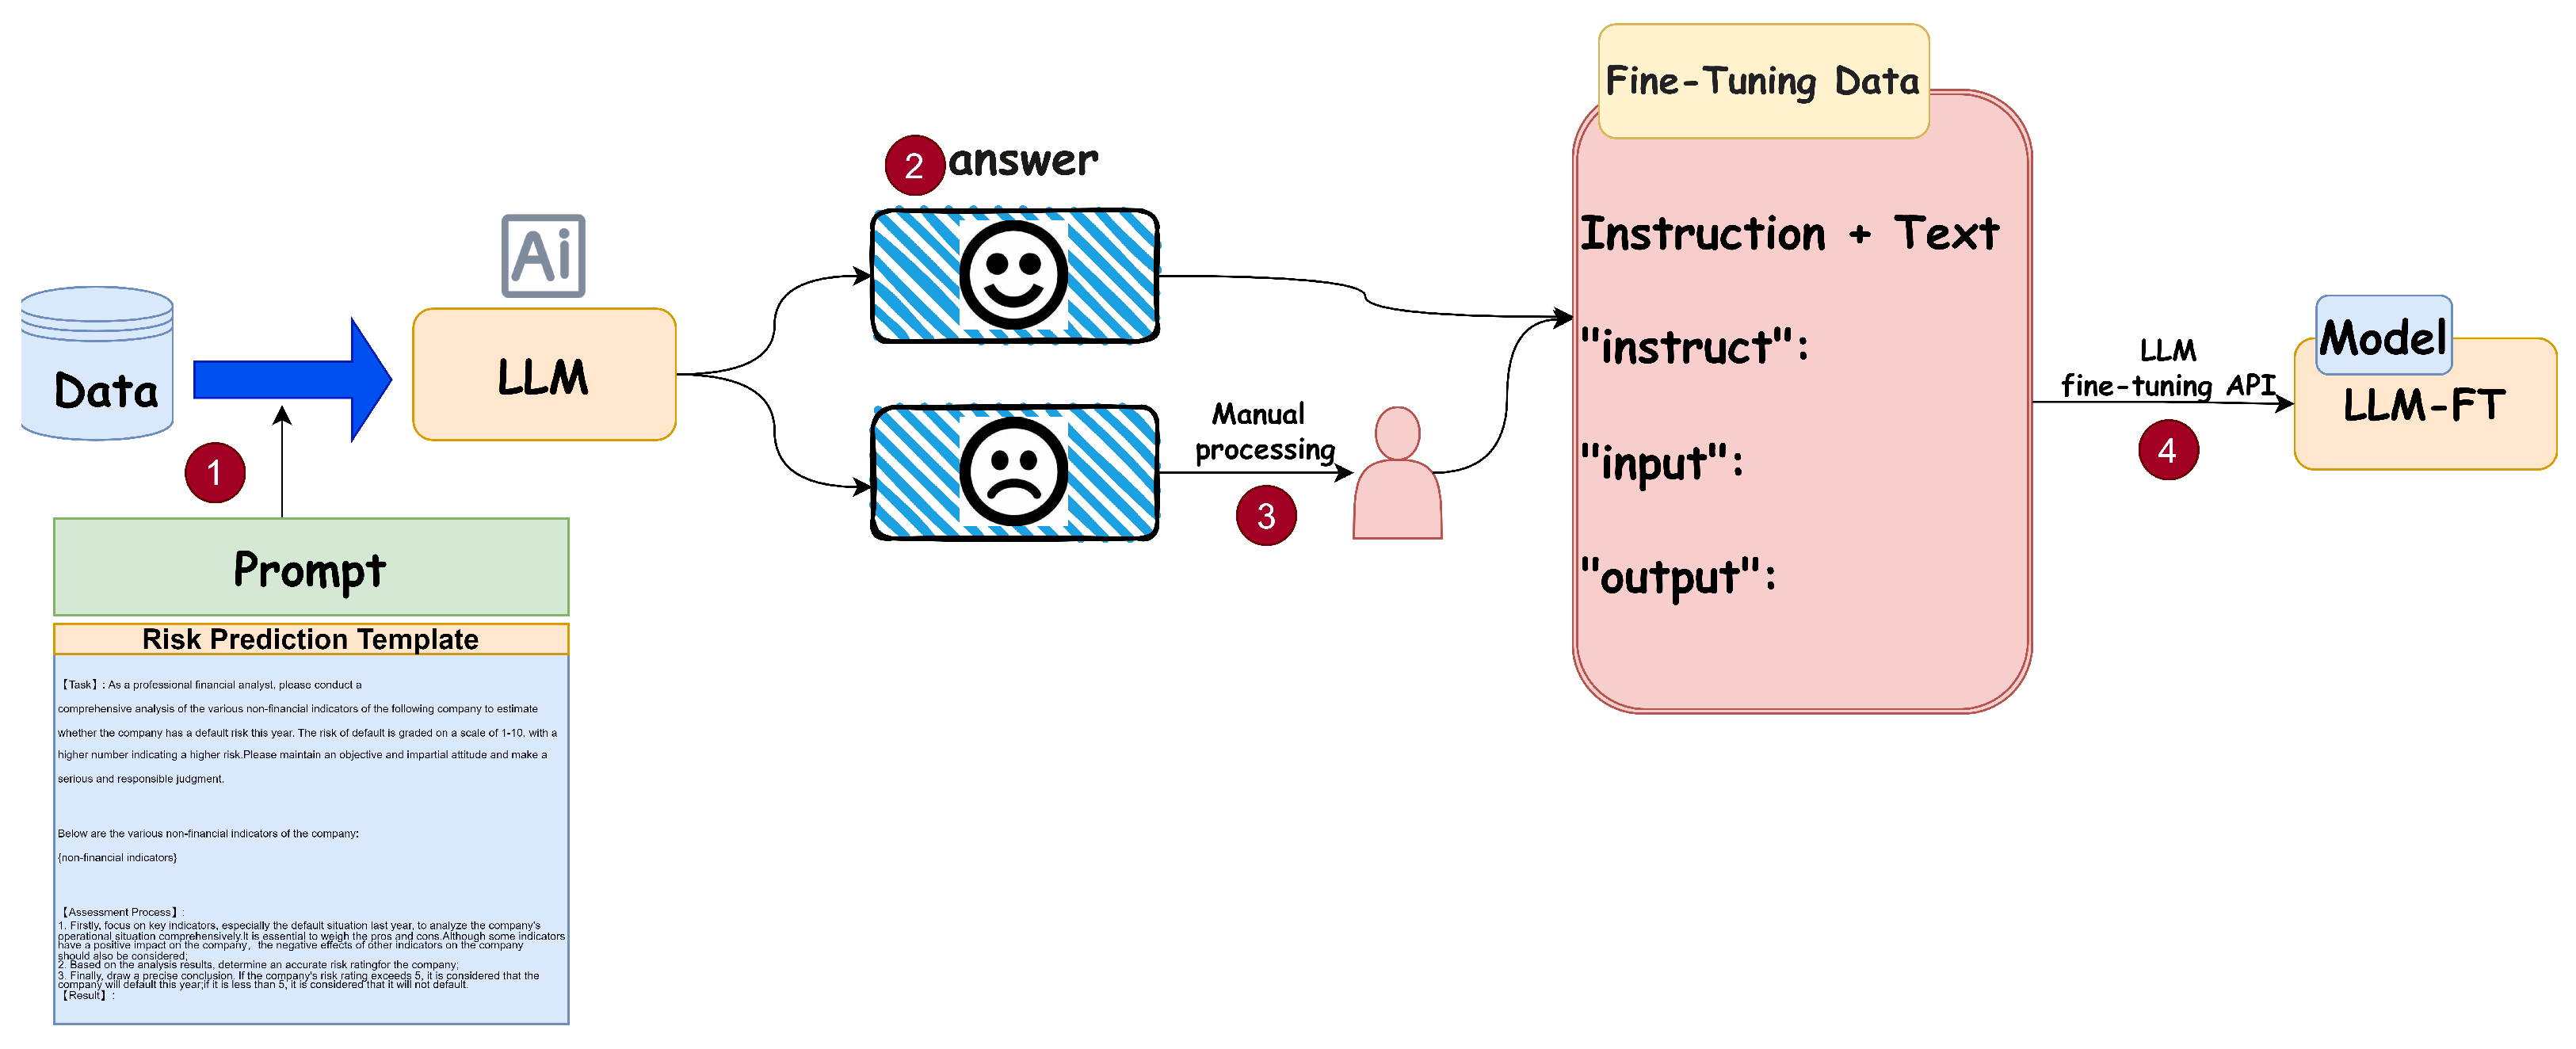
  • Construct a prompt template based on the dataset.
  • Randomly select 1000 samples and utilize the LLM to obtain their risk prediction results.
  • Directly employ correctly predicted results; manually correct the incorrect ones to obtain the fine-tuned dataset.
  • Invoke the LLM fine-tuning API to train the model. Firstly, upload and format the fine-tuned dataset, then train the model, and finally employ the model. Specific fine-tuning procedures can be referenced from OpenAI’s official documentation. (https://platform.openai.com/docs/guides/fine-tuning (accessed on 6 August 2024)).

4.3.3. Results

In Table 9, the experimental results reveal a performance comparison between two key models: the LLM and LLM-FT. It can be observed from these data that although the original LLM model performed moderately in terms of accuracy, reaching only 75%, which is not particularly outstanding compared to some traditional machine learning models, after targeted fine-tuning, the LLM-FT model achieved significant improvements in multiple performance metrics. Specifically, the accuracy of the LLM-FT model increased to 82.10%; an improvement of approximately 7.1 percentage points over the LLM model. This improvement not only surpasses the original LLM model but also exceeds some traditional machine learning models, demonstrating its strong competitiveness. Additionally, the LLM-FT model also performs well in recall and F1 score, reaching 84.30% and 80.41%, respectively. These improvements further demonstrate the effectiveness of the fine-tuning strategy. It is worth noting that although the LLM-FT model achieved significant improvements in certain performance metrics, its precision remained consistent with the LLM model at 75%. This may mean that during the fine-tuning process, the model did not sacrifice its ability to identify positive samples while improving overall accuracy.
In summary, the fine-tuned LLM-FT model demonstrated excellent performance in financial risk prediction tasks. These findings not only validate the great potential of large language models in specific domains but also emphasize the importance of task-specific model fine-tuning. As technology continues to advance and optimize, we have reason to believe that such models will play a greater role in more fields in the future.

5. Conclusions

This study addresses the research gap in the default risk of commercial bills among small and medium-sized enterprises (SMEs) by collecting multidimensional non-financial data and combining traditional machine learning techniques with advanced large language models. It offers new research insights for both academia and practical applications. The findings demonstrate the potential of large language models in financial risk prediction and provide an innovative analytical approach. Empirical analysis reveals that factors such as enterprise age, the number of legal disputes, the proportion of negative news, last year’s default count, and the number of individuals subject to consumption restrictions are significantly correlated with the recent default count of commercial bills. However, enterprise age and the number of legal disputes did not exhibit robust significance in subsequent tests, highlighting the challenges of obtaining information about SMEs. Overall, researchers can acquire non-financial information about SMEs through public channels and select for the data that are most relevant to enterprise risk. In traditional machine learning methods, ensemble learning typically outperforms single classifiers. Specifically, XGBoost achieved the best results on the Z-score standardized dataset, with an accuracy and F1 score of 81.42% and 80%, respectively. In contrast, the random forest algorithm exhibited greater stability across various standardization methods, with average accuracy and F1 scores reaching 80.54% and 79.35%. Thus, when disregarding the data standardization approach, utilizing the random forest algorithm for default prediction is a more prudent choice. During the large language model phase, the fine-tuned model achieved an accuracy and F1 score of 82.1% and 84.3%, surpassing all traditional machine learning algorithms and showcasing the formidable reasoning capabilities of large language models.
This study demonstrates feasibility but has limitations. Commercial bill default data are proprietary and only accessible through partnerships with financial institutions, which contrasts with the goal of using open, easily accessible data for SME risk research. Additionally, the correlation between the collected multi-dimensional data and corporate risk is relatively low. Certain non-financial indicators perform inconsistently across conditions, limiting the model’s predictive accuracy to about 80%, which falls short of the results typically obtained with financial metrics.
This study offers significant potential for expansion. Large language models could extend beyond sentiment analysis to deeper assessments of legal documents and court announcements, using advanced multimodal analysis for comprehensive sentiment insights. Enhancing current machine learning models through ensemble, deep learning, and reinforcement learning approaches—integrating temporal data—can refine risk predictions. Further, establishing an adaptive SME risk prediction platform with an up-to-date enterprise database could automate data retrieval, risk report generation, and leverage language models for interactive AI-driven user guidance and query resolution. In summary, this study not only offers a new perspective on risk management for SMEs but also lays a foundation for future research.

Author Contributions

Methodology, J.L.; Formal analysis, H.H.; Data curation, S.C.; Writing—original draft, H.H.; Writing—review & editing, C.Z.; Supervision, X.C.; Investigation, X.W. All authors have read and agreed to the published version of the manuscript.

Funding

This research was funded by the National Natural Science Foundation of China under Grant 62302400, 62376227, and the Fundamental Research Funds for the Central Universities. Sichuan Science and Technology Program under Grant Nos. 2023NSFSC0114, 2023NSFSC0032, and Guanghua Talent Project of Southwestern University of Finance and Economics.

Institutional Review Board Statement

Not applicable.

Informed Consent Statement

Not applicable.

Data Availability Statement

The raw data supporting the conclusions of this article will be made available by the authors on request.

Acknowledgments

The authors would like to acknowledge the support of this work by the National Natural Science Foundation of China under Grants No. 62302400 and 62376227, and the Fundamental Research Funds for the Central Universities. Additionally, this research was also supported in part by the Sichuan Science and Technology Program under Grant Nos. 2023NSFSC0114 and 2023NSFSC0032, as well as the Guanghua Talent Project of Southwestern University of Finance and Economics. The authors are grateful for the financial support provided by these organizations, which has been instrumental in the completion of this study.

Conflicts of Interest

The authors declare no conflict of interest.

Appendix A

Table A1 and Table A2 present the ability of ChatGLM3-6B to analyze sentiment in news and specific examples of using the LLM to predict corporate default risk, respectively.
Table A1. Utilizing ChatGLM3-6B for news sentiment analysis.
InputOutput
Task: Please act as a professional financial analyst and analyze whether the following news has a positive, negative, or neutral short-term impact on Hainan Agile Property Development Co., Ltd.
News: According to reports, recently, during a network inspection conducted by the Hainan Internet Information Office, it was discovered that Hainan Agile Property Development Co., Ltd., and related real estate service websites have been persistently posting false advertisements online, suspected of misleading public consumption and causing adverse effects. Upon investigation, Hainan Agile Property Development Co., Ltd., and related…
Please strictly adhere to the following format when responding:
Reason:
Result:
Reason:The news of Hainan Agile Property Development Co., Ltd. being found posting false advertisements online and suspected of misleading public consumption is likely to have a negative short-term impact on the company. Such actions can undermine the company’s reputation and erode investor confidence. Investors may perceive the company as engaging in unethical or deceitful practices, which could lead to decreased demand for its properties, potential regulatory scrutiny, and even legal consequences. As a result, the company’s stock price may face downward pressure in the short term.
Result: Negative
Table A2. Predicting corporate default risk with an LLM: non-financial indicator analysis.
InputOutput
Task: As a professional financial analyst, please conduct a comprehensive analysis of the various non-financial indicators of the following company to estimate whether the company has a default risk this year. The risk of default is graded on a scale of 1–10, with a higher number indicating a higher risk. Please maintain an objective and impartial attitude and make a serious and responsible judgment.
   Below are the various non-financial indicators of the company:
       Years in Business: 6.7
       NegativenewsRatio: 0.0
       firstrefuseNum: 0
       Luxury Consumption Restrictions: 0
       Defendant: 1
       Plaintiff: 8
Assessment Process:
  • Firstly, focus on key indicators, especially the default situation last year, to analyze the company’s operational situation comprehensively. It is essential to weigh the pros and cons. Although some indicators have a positive impact on the company, the negative effects of other indicators on the company should also be considered;
  • Based on the analysis results, determine an accurate risk rating for the company;
  • Finally, draw a precise conclusion. If the company’s risk rating exceeds 5, it is considered that the company will default this year; if it is less than 5, it is considered that it will not default.
   Based on the provided non-financial indicators and the assessment process outlined, let’s analyze each indicator and its potential impact on the default risk of the company:
  • Years in Business (6.7 years): The company’s relatively short duration in business suggests it’s still in its growth phase. Typically, younger companies face higher default risks due to operational uncertainties and limited financial resources.
  • Negative News Ratio (0.0): A lack of negative news can be interpreted positively, indicating a favorable public image and potentially lower default risk. However, it’s essential to consider other factors contributing to the company’s overall risk profile.
  • First Refusal Number (0): The absence of defaults last year is a positive sign, suggesting the company successfully met its obligations. However, past performance is not always indicative of future behavior, especially for younger companies.
  • Luxury Consumption Restrictions (0): The absence of restrictions on luxury consumption is generally favorable, as it implies financial stability and responsible spending practices, reducing default risk.
  • Defendant (1): Being a defendant in legal proceedings could signal potential legal liabilities or disputes, which may increase default risk. However, the impact depends on the nature and severity of the legal issues.
  • Plaintiff (8): Acting as a plaintiff in legal actions may indicate the company’s proactive approach to protecting its interests. However, being involved in litigation can still pose risks, including legal costs and potential reputational damage.
Risk Rating: Given the balanced assessment, I would assign the company a risk rating of 4. While there are some concerning indicators, such as legal involvement and the company’s relatively young age, the absence of defaults and negative news, along with responsible spending practices, suggest a moderate default risk.
Conclusions: Based on the risk rating falling below 5, it’s unlikely that the company will default this year. However, continuous monitoring of financial and non-financial indicators is crucial to assess evolving risks accurately.

References

  1. Black, F.; Scholes, M. The pricing of options and corporate liabilities. J. Polit. Econ. 1973, 81, 637–654. [Google Scholar] [CrossRef]
  2. Merton, R.C. On the pricing of corporate debt: The risk structure of interest rates. J. Financ. 1974, 29, 449–470. [Google Scholar]
  3. Cheng, X.; Sun, Z.; Bao, W. Study on credit risk of real estate industry based on genetic algorithm KMV model. J. Phys. Conf. Ser. 2020, 1629, 012072. [Google Scholar] [CrossRef]
  4. Trustorff, J.H.; Konrad, P.M.; Leker, J. Credit risk prediction using support vector machines. Rev. Quant. Financ. Account. 2011, 36, 565–581. [Google Scholar] [CrossRef]
  5. Teles, G.; Rodrigues, J.; Rabê, R.A.; Kozlov, S.A. Artificial neural network and Bayesian network models for credit risk prediction. J. Artif. Intell. Syst. 2020, 2, 118–132. [Google Scholar] [CrossRef]
  6. Zhao, Y.; Wei, S.; Guo, Y.; Yang, Q.; Kou, G. FisrEbp: Enterprise Bankruptcy Prediction via Fusing its Intra-risk and Spillover-Risk. arXiv 2022, arXiv:2202.03874. [Google Scholar]
  7. Li, L.; Yang, J.; Zou, X. A study of credit risk of Chinese listed companies: ZPP versus KMV. Appl. Econ. 2016, 48, 2697–2710. [Google Scholar] [CrossRef]
  8. Chen, Y.; Chu, G. Estimation of Default Risk Based on KMV Model—An Empirical Study for Chinese Real Estate Companies. J. Financ. Risk Manag. 2014, 3, 40–49. [Google Scholar] [CrossRef]
  9. Yi, W. Z-score Model on Financial Crisis Early-Warning of Listed Real Estate Companies in China: A Financial Engineering Perspective. Syst. Eng. Procedia 2012, 3, 153–157. [Google Scholar] [CrossRef]
  10. Li, S.; Lin, H.; Chen, L. Factor-cluster analysis of financial risk evaluation of real estate listed enterprise. In Proceedings of the 2011 2nd International Conference on Artificial Intelligence, Management Science and Electronic Commerce (AIMSEC), Zhengzhou, China, 8–10 August 2011; pp. 1120–1123. [Google Scholar]
  11. Patel, K.; Vlamis, P. An Empirical Estimation of Default Risk of the UK Real Estate Companies. J. Real Estate Financ. Econ. 2006, 32, 21–40. [Google Scholar] [CrossRef]
  12. Nguyen, C.V.; Nguyen, T.N.; Le, T.T.O.; Nguyen, T.T. Determining the impact of financial performance factors on bankruptcy risk: An empirical study of listed real estate companies in Vietnam. Invest. Manag. Financ. Innov. 2019, 16, 307. [Google Scholar]
  13. Kumar, D.; Meghwani, S.S.; Thakur, M. Proximal support vector machine based hybrid prediction models for trend forecasting in financial markets. J. Comput. Sci. 2016, 17, 1–13. [Google Scholar] [CrossRef]
  14. Sukono, A.S.; Mamat, M.; Prafidya, K. Credit scoring for cooperative of financial services using logistic regression estimated by genetic algorithm. Appl. Math. Sci. 2014, 8, 45–57. [Google Scholar] [CrossRef]
  15. Wang, D.n.; Li, L.; Zhao, D. Corporate finance risk prediction based on LightGBM. Inf. Sci. 2022, 602, 259–268. [Google Scholar] [CrossRef]
  16. Liu, C.; Chan, Y.; Alam Kazmi, S.H.; Fu, H. Financial fraud detection model: Based on random forest. Int. J. Econ. Financ. 2015, 7, 178–188. [Google Scholar] [CrossRef]
  17. Svabova, L.; Michalkova, L.; Durica, M.; Nica, E. Business failure prediction for Slovak small and medium-sized companies. Sustainability 2020, 12, 4572. [Google Scholar] [CrossRef]
  18. Xia, Y.; Xu, T.; Wei, M.X.; Wei, Z.K.; Tang, L.J. Predicting chain’s manufacturing SME credit risk in supply chain finance based on machine learning methods. Sustainability 2023, 15, 1087. [Google Scholar] [CrossRef]
  19. Yang, Y.; Chu, X.; Pang, R.; Liu, F.; Yang, P. Identifying and predicting the credit risk of small and medium-sized enterprises in sustainable supply chain finance: Evidence from China. Sustainability 2021, 13, 5714. [Google Scholar] [CrossRef]
  20. Sun, X.; Lei, Y. Research on financial early warning of mining listed companies based on BP neural network model. Resour. Policy 2021, 73, 102223. [Google Scholar] [CrossRef]
  21. Yang, S.; Zhang, Z.; Zhou, J.; Wang, Y.; Sun, W.; Zhong, X.; Fang, Y.; Yu, Q.; Qi, Y. Financial Risk Analysis for SMEs with Graph-based Supply Chain Mining. In Proceedings of the Twenty-Ninth International Joint Conference on Artificial Intelligence, Yokohama, Japan, 7–15 January 2021; pp. 4661–4667. [Google Scholar]
  22. Kaya, O. Determinants and consequences of SME insolvency risk during the pandemic. Econ. Model. 2022, 115, 105958. [Google Scholar] [CrossRef]
  23. Gao, Y.; Jiang, B.; Zhou, J. Financial Distress Prediction for Small and Medium Enterprises Using Machine Learning Techniques. arXiv 2023, arXiv:2302.12118. [Google Scholar]
  24. Kou, G.; Xu, Y.; Peng, Y.; Shen, F.; Chen, Y.; Chang, K.; Kou, S. Bankruptcy prediction for SMEs using transactional data and two-stage multiobjective feature selection. Decis. Support Syst. 2021, 140, 113429. [Google Scholar] [CrossRef]
  25. Atidhira, A.T.; Yustina, A.I. The Influence of Return on Asset, Debt to Equity Ratio, Earnings per Share, and Company Size on Share Return in Property and Real Estate Companies. J. Appl. Account. Financ. 2017, 1, 128–146. [Google Scholar]
  26. Vaswani, A.; Shazeer, N.; Parmar, N.; Uszkoreit, J.; Jones, L.; Gomez, A.N.; Kaiser, Ł.; Polosukhin, I. Attention is all you need. In Proceedings of the 31st Conference on Neural Information Processing Systems (NIPS 2017), Long Beach, CA, USA, 4–9 December 2017; Volume 30. [Google Scholar]
  27. Cheong, I.; Xia, K.; Feng, K.K.; Chen, Q.Z.; Zhang, A.X. (A) I Am Not a Lawyer, But...: Engaging Legal Experts towards Responsible LLM Policies for Legal Advice. In Proceedings of the The 2024 ACM Conference on Fairness, Accountability, and Transparency, Rio de Janeiro, Brazil, 3–6 June 2024; pp. 2454–2469. [Google Scholar]
  28. Orenstrakh, M.S.; Karnalim, O.; Suarez, C.A.; Liut, M. Detecting LLM-generated text in computing education: Comparative study for ChatGPT cases. In Proceedings of the 2024 IEEE 48th Annual Computers, Software, and Applications Conference (COMPSAC), Osaka, Japan, 2–4 July 2024; pp. 121–126. [Google Scholar]
  29. Nejjar, M.; Zacharias, L.; Stiehle, F.; Weber, I. LLMs for science: Usage for code generation and data analysis. J. Softw. Evol. Process. 2023, e2723. [Google Scholar] [CrossRef]
  30. Fan, Z.; Tang, J.; Chen, W.; Wang, S.; Wei, Z.; Xi, J.; Huang, F.; Zhou, J. Ai hospital: Interactive evaluation and collaboration of llms as intern doctors for clinical diagnosis. arXiv 2024, arXiv:2402.09742. [Google Scholar]
  31. Romanko, O.; Narayan, A.; Kwon, R.H. ChatGPT-Based Investment Portfolio Selection. Oper. Res. Forum 2023, 4, 91. [Google Scholar] [CrossRef]
  32. Wu, S.; Irsoy, O.; Lu, S.; Dabravolski, V.; Dredze, M.; Gehrmann, S.; Kambadur, P.; Rosenberg, D.; Mann, G. Bloomberggpt: A large language model for finance. arXiv 2023, arXiv:2303.17564. [Google Scholar]
  33. Niszczota, P.; Abbas, S. GPT has become financially literate: Insights from financial literacy tests of GPT and a preliminary test of how people use it as a source of advice. Financ. Res. Lett. 2023, 58, 104333. [Google Scholar] [CrossRef]
  34. Hosmer, D.W.; Lemeshow, S. Applied Logistic Regression; John Wiley & Sons: Hoboken, NJ, USA, 1991. [Google Scholar]
  35. Cortes, C.; Vapnik, V. Support-Vector Networks. Mach. Learn. 1995, 20, 273–297. [Google Scholar] [CrossRef]
  36. Goodfellow, I.; Bengio, Y.; Courville, A. Deep Learning; MIT Press: Cambridge, MA, USA, 2016; Available online: http://www.deeplearningbook.org (accessed on 18 November 2016).
  37. Hunt, E.B.; Marin, J.; Stone, P.J. Experiments in induction. Am. J. Psychol. 1966, 80. [Google Scholar]
  38. Breiman, L. Random Forests. Mach. Learn. 2001, 45, 5–32. [Google Scholar] [CrossRef]
  39. Arora, N.; Kaur, P.D. A Bolasso based consistent feature selection enabled random forest classification algorithm: An application to credit risk assessment. Appl. Soft Comput. 2020, 86, 105936. [Google Scholar] [CrossRef]
  40. Rao, C.; Liu, M.; Goh, M.; Wen, J. 2-stage modified random forest model for credit risk assessment of P2P network lending to “Three Rurals” borrowers. Appl. Soft Comput. 2020, 95, 106570. [Google Scholar] [CrossRef]
  41. Liu, J.; Zhang, S.; Fan, H. A two-stage hybrid credit risk prediction model based on XGBoost and graph-based deep neural network. Expert Syst. Appl. 2022, 195, 116624. [Google Scholar] [CrossRef]
  42. Rao, C.; Liu, Y.; Goh, M. Credit risk assessment mechanism of personal auto loan based on PSO-XGBoost Model. Complex Intell. Syst. 2023, 9, 1391–1414. [Google Scholar] [CrossRef]
  43. Ke, G.; Meng, Q.; Finley, T.; Wang, T.; Chen, W.; Ma, W.; Ye, Q.; Liu, T.Y. Lightgbm: A highly efficient gradient boosting decision tree. Adv. Neural Inf. Process. Syst. 2017, 30, 52. [Google Scholar]
  44. Ruifan, L.; Zhiyu, W.; Yuantao, F.; Shuqin, Y.; Guangwei, Z. Enhanced Prompt Learning for Few-shot Text Classification Method. Beijing Xue Xue Bao 2024, 60, 1–12. [Google Scholar]
  45. Li, R.; Chen, H.; Feng, F.; Ma, Z.; Wang, X.; Hovy, E. DualGCN: Exploring syntactic and semantic information for aspect-based sentiment analysis. IEEE Trans. Neural Netw. Learn. Syst. 2022, 35, 7642–7656. [Google Scholar] [CrossRef]
  46. Ye, S.; Zhai, Z.; Li, R. Enhanced machine reading comprehension method for aspect sentiment quadruplet extraction. In Proceedings of the 26th European Conference on Artificial Intelligence 2023, Kraków, Poland, 30 September–4 October 2023; IOS Press: Amsterdam, The Netherlands, 2023; pp. 2874–2881. [Google Scholar]
  47. Chung, H.W.; Hou, L.; Longpre, S.; Zoph, B.; Tay, Y.; Fedus, W.; Li, Y.; Wang, X.; Dehghani, M.; Brahma, S.; et al. Scaling instruction-finetuned language models. J. Mach. Learn. Res. 2024, 25, 1–53. [Google Scholar]
Figure 1. Commercial paper default research framework.
Applsci 15 02733 g001
Figure 2. Heatmap of the raw data dimensions without standardization.
Applsci 15 02733 g002
Figure 3. Heatmap of the data dimensions after standardization.
Applsci 15 02733 g003
Figure 4. Template for sentiment analysis of news articles.
Applsci 15 02733 g004
Figure 5. ROC curves of the optimal performance of the model under different standardizations.The yellow curve (ROC curve) represents the classification performance of the model, illustrating the relationship between the True Positive Rate (TPR) and the False Positive Rate (FPR) at various thresholds. A curve closer to the top-left corner indicates better performance. The blue dashed line represents the baseline of a random classifier, which assumes the model has no classification ability and makes random predictions.
Applsci 15 02733 g005aApplsci 15 02733 g005b
Figure 6. Template for default risk prediction.
Applsci 15 02733 g006
Figure 7. Specific process of LLM fine-tuning.
Applsci 15 02733 g007
Table 1. Comparison of the proposed method with related work.
Li et al. (2016) [7]Chen et al. (2014) [8]Nguyen et al. (2019) [12]Cheng et al. (2022) [3]Proposed Method
Research ObjectChinese listed companiesChinese listed real estate companiesVietnamese listed real estate companiesChinese listed real estate companiesChinese SMEs
Data TypeFinancial dataFinancial dataFinancial dataFinancial and stock trading dataNon-financial data (e.g., registration info, news sentiment)
Method/ModelKMV modelKMV model + time-varying correlation modelLogistic regressionGA-KMV algorithmPrompt learning with large language models
InnovationProposed Zero Price Probability (ZPP) modelCombined KMV with time-varying correlation modelDeveloped logistic regression frameworkIntegrated genetic algorithm into KMVEmphasized non-financial data + introduced LLM-based prompt learning
FlexibilityLimitedLimitedLimitedHighHigh, supports multi-scenario real-time prediction
Table 2. Summary statistics.
VariableMeanStd. Dev.MinMax
Years in business14.9210410.07476174
Registered capital (10k Yuan)98,666.12634,863.502.25 × 107
Paid-in capital81,820.22626,695.602.25 × 107
Chattel mortgages0.05527380.5111517013
Chattel mortgage amount4117.529100,311.803,930,000
Environmental fines1.79006110.804030270
Equity pledges1.89604512.619270407
Executed parties9.22718133.904680609
Execution amount (10k Yuan)13,191.18161,705.404,633,389
Plaintiff13.6272852.0461501243
Defendant51.98884166.790803701
Total cases84.93966242.649904735
Court notices12.3950342.508080960
Outbound investment amount78,123.92491,030.201.18 × 107
Outbound investments5.60294120.31830283
Outbound investments opening4.51724117.456480248
Outbound investments closing1.08573.582649061
Outbound investments canceled0.95638953.400111061
Outbound investments revoked0.09584180.458797507
Court decisions109.4204324.514905064
Court decisions as plaintiff19.1622766.4739501734
Court decisions as defendant78.49949256.393804852
Administrative penalties2.1374248.8067870138
Land mortgages0.18255581.566111037
Land mortgage amount5218.09757129.7101,385,002
Admin permits78.69422245.457705130
Patents139.6121484.299508129
Qualifications16.77282128.490203000
Spot checks1.3737328.3184820279
Spot checks rectified0.17647061.653769046
Luxury consumption restrictions7.19320538.166340900
News articles74.7124722.8119218100
Positive19.263696.156132029
Negative2.6648071.62043010
Neg news ratio0.03444770.018280700.1064
2021 refuse num6.73275939.850850707
2022 refuse num12.6186670.3879601419
Total refuse ratio0.03563610.107003900.9437
Table 3. Processed commercial paper acceptance data.
CIDTNANSCNUCTRNTRTYTRLYPTRORR
No.1949150799471220.41350.4963
No.247263858868433950.01140.0091
No.38509699415156655722000.08670.0782
No.4274119817601674180630.24870.6107
No.524761964512945117680.24690.3817
No.6942569373340510.2090.3609
No.7645423222175600.38250.2713
No.810497153349692370.64120.9237
No.98885783107093000.72280.7984
No.10398205193154100.33530.3869
Table 4. Baseline regression results.
VariableCoefficientT-Value
Age0.1267214 ***3.33
Pla0.0376407 *2.12
Nnr2.881501 *2.25
Frn0.8146282 ***39.34
Lcr0.088054 ***4.59
Constant−0.1043378−0.99
N: 1972
R-Square: 0.4776
Adj R-Square: 0.4763
Note: *** p < 0.01, * p < 0.1.
Table 5. Heteroscedasticity test results.
VariableReal EstateConstructionOther Industries
Age0.0122840.36447520.0881954
(0.17)(1.71)(1.56)
Pla−0.02251640.01373610.0929062 *
(−0.95)(0.19)(3.21)
Nnr3.005627 *8.4284411.619403
(1.50)(1.63)(0.73)
Frn1.04326 ***0.8155993 ***0.7177915 ***
(28.30)(13.08)(24.36)
Lcr0.111097 ***0.1653752 *0.0162129
(5.35)(2.36)(0.37)
Constant0.1352571−0.9222780.0761388
(0.82)(−1.61)(0.43)
N958127887
R-Square0.49370.66530.4335
Adj R-Square0.49110.65150.4303
Note: *** p < 0.01, * p < 0.1.
Table 6. Regression results of robustness test.
VariableCoefficientT-Value
Age0.0001710.06
Pla−0.0022124−1.58
Nnr0.8228015 ***8.14
Frn0.019433 ***11.88
Lcr0.0134422 ***8.86
Constant−0.0126499−1.52
N: 1972
R-Square: 0.1333
Adj R-Square: 0.1311
Note: *** p < 0.01.
Table 7. Prediction results of different machine learning models.
ModelStandardAccuracyPrecisionRecallF1 Score
LogisticLog75.68%77.29%69.37%73.45%
MinMax68.58%70.43%59.73%63.21%
Z-score71.62%72.45%62.67%67.75%
SVMLog76.96%76.48%70.75%75.74%
MinMax71.14%70.38%61.16%67.33%
Z-score68.35%66.16%57.80%63.90%
XGBoostLog80.41%80.61%73.94%79.18%
MinMax79.05%80.28%71.22%77.07%
Z-score81.42%82.70%74.89%80.00%
DTLog79.29%78.74%73.97%78.62%
MinMax77.03%76.98%73.91%76.35%
Z-score78.72%78.47%73.97%78.06%
RFLog81.08%82.77%76.41%79.90%
MinMax79.73%80.91%75.14%78.55%
Z-score80.81%80.89%73.92%79.59%
NNLog71.21%72.36%69.13%71.64%
MinMax72.22%70.70%63.98%70.34%
Z-score72.22%69.08%62.41%69.32%
LightGBMLog80.07%81.13%72.46%78.32%
MinMax81.08%82.56%75.25%79.72%
Z-score76.35%76.92%68.99%74.26%
Table 8. Average values for different datasets across models.
ModelAccuracyPrecisionRecallF1 Score
Logistic71.96%73.39%63.92%68.14%
SVM72.15%71.01%63.24%68.99%
XGBoost80.29%81.20%73.35%78.75%
DT78.35%78.06%73.95%77.68%
RF80.54%81.52%75.16%79.35%
NN71.88%70.71%65.17%70.43%
LightGBM79.17%80.20%72.23%77.43%
Table 9. Experimental results of LLM and LLM-FT.
ModelAccuracyPrecisionRecallF1 Score
LLM75.00%75.00%76.50%75.74%
LLM-FT82.10%77.00%84.30%80.41%
Disclaimer/Publisher’s Note: The statements, opinions and data contained in all publications are solely those of the individual author(s) and contributor(s) and not of MDPI and/or the editor(s). MDPI and/or the editor(s) disclaim responsibility for any injury to people or property resulting from any ideas, methods, instructions or products referred to in the content.

