Article

Modeling and Reliability Evaluation of the Motion and Fluid Flow Characteristics of Spark Bubbles in a Tube

by
Yuxin Gou
*,
Dongyan Shi
* and
Jiuqiang Wang
College of Mechanical and Electrical Engineering, Harbin Engineering University, Harbin 150001, China
*
Authors to whom correspondence should be addressed.
Appl. Sci. 2025, 15(5), 2569; https://doi.org/10.3390/app15052569
Submission received: 13 January 2025 / Revised: 22 February 2025 / Accepted: 26 February 2025 / Published: 27 February 2025
(This article belongs to the Special Issue Data-Enhanced Engineering Structural Integrity Assessment and Design)

Abstract

:
Bubbles in pipes are widely present in marine engineering, transmission, and fluid systems with complex environments. This paper divides tubes into short, longer, and long tubes due to different lengths. In short tubes, the formation, development, and stability of spark bubbles are deeply analyzed through numerical simulation and experimental measurement, and the morphology and period of vortex rings generated in the surrounding fluid are studied. The results show that bubbles in tubes are significantly elongated compared with those in free fields. Changing the parameters of tubes can affect the size and oscillation speed of vortex rings. Secondary cavitation is found in asymmetric positions in longer tubes. The conditions, positions, and periods of multiple secondary cavitations are summarized in a series of experiments on long tubes. It is found that bubbles in tubes are related to the γ t and γ L tube parameters. More secondary cavitation is easily generated in thinner and longer tubes. In addition, the pumping effect brought about by the movement of bubbles in tubes is studied. By designing reasonable tube parameters, the life cycle of bubbles can be changed, and the pumping efficiency can be improved. This study provides important theoretical support for the reliability of the movement of bubbles and surrounding fluid in tubes and lays a foundation for the optimization and promotion of this technology in practical applications.

1. Introduction

Cavitation is caused by local pressure reduction, increased flow rate, increased temperature, and impurities in the liquid, resulting in pressure cavitation, bubble cavitation, and turbulent cavitation. In the laboratory, high-speed rotation, pressure drop, and temperature change are used to generate cavitation for research. Cavitation may occur in certain parts of the pipeline (such as valves, elbows, pump suction ports, etc.) and affect the stability and efficiency of liquid flow and the long-term durability of the pipeline. Studying how to avoid unnecessary cavitation or control the occurrence of cavitation under appropriate circumstances is an important direction in pipeline design. The behavior of spark bubbles and their effect on fluid flow have always been important research topics, especially in tubes. These bubbles may exhibit various phenomena during their movement in tubes, such as pumping effects, cavitation, vortex ring effects, etc. The stability, collapse characteristics, and secondary cavitation of bubbles may affect the long-term stability and working efficiency of the system. Therefore, in-depth theoretical and experimental research on the formation, evolution, and reliability of spark bubbles in circular tubes can provide valuable references for improving the design and performance of related systems. In the fields of shipbuilding and marine engineering, as well as everyday life, bubble collapse and jet dynamics in pipelines are utilized in various applications. During the exploration of high-pressure bubble guns, bubbles may form near the gun nozzle, leading to their collapse. Similarly, when cylindrical propellers are used, a large number of bubbles is generated at the propeller opening, which subsequently collapse at the cylinder’s boundary. The presence and collapse of bubbles can significantly impact the propeller’s efficiency. In drainage or transmission pipelines, bubbles can form both inside and at the outlet. During drainage, bubble formation generates noise, while in the transmission process, bubbles may induce a pumping effect. Studying the morphology of bubbles within the pipeline is crucial for understanding the water flow dynamics. In clinical applications, biomedicine, drug delivery, and vascular rupture are all associated with elastic tubes. Studying the deformation and movement of bubbles within biological tissues can offer valuable insights for medical applications. Understanding the impact of bubbles on the surrounding environment is crucial, especially when simulating treatments in confined spaces, such as the ureters.
The development and formation of bubbles often occur in confined spaces. The influence of the surrounding walls on these bubbles is critical and can be the most significant factor in determining dynamic behavior. Recent research on confined areas can generally be categorized into studies of bubble dynamics between flat plates and within tubes. These tube studies are further divided into investigations involving ordinary round tubes, specially shaped tubes, and elastic tubes. A visual representation of bubble characteristics in confined spaces is shown in Figure 1.
The most common process and application of cavitation collapse in the gap between two walls is in engineering. Ishida et al. [1] studied the bubble motion characteristics between two horizontal walls through experiments, analyzed the influence of the distance between the walls and the distance between the bubble and the wall on the bubble motion characteristics, and simulated them using the boundary element method. Kawa M. A. Manmi [2] researched bubble oscillations between two curved, rigid plates experiencing a planar acoustic field using the boundary integral method (BIM). The results show that the jet velocity, maximum bubble radius, and total energy are not significantly affected by the wave direction, but the jet direction and high-pressure area have a greater impact on them. Cui Xiongwei [3] experimentally studied the complex dynamics of underwater explosion bubbles between two parallel plates. As the distance increases, the bubble splits into two sub-bubbles before collapsing, and the reverse jet penetrates the sub-bubbles. The first pulsation period of an underwater explosion bubble between two parallel plates is 30% to 50% larger than that of a free-field bubble. S.W. Gong [4] studied the interaction between bubbles generated by electric sparks and a double-layer composite beam (constrained at both ends) consisting of an aluminum sheet coated with an elastic layer. Numerical simulations achieved good agreement with experimental observations, indicating that the bubble collapse time was greatly affected by the nearby two-layer composite beam. When two cavitation bubbles exist in a limited space, the interaction between the bubbles significantly affects the dynamic behavior characteristics of the bubbles. A. Soroureddin [5] presented a numerical study of the dynamic behavior of vapor bubbles in narrow channels filled with viscous liquids. Numerical results show that the lifetime of the bubble increases with increased the viscosity of the liquid surrounding the vapor bubble. Silvestre [6] reported experimental and numerical studies of the expansion and collapse of cavitation bubbles in narrow gaps. High-speed recordings and numerical simulations show an unexpected enhancement of the jet velocity, a translation of the center of mass, and a sharp increase in the wall shear stress. Claus-Dieter Ohl [7,8] and his team studied the dynamics of cavitation bubbles and induced jets in a liquid gap bounded by two rigid walls. The impact velocity of the liquid jet on the wall can reach more than 200 m/s and depends strongly on the gap height and the bubble position. Emil-Alexandru Brujan [9] experimentally and numerically studied the jet behavior and migration characteristics of laser-induced cavitation bubbles in rectangular channels. Numerical calculations show that the maximum velocity reached by the liquid jet directed toward the channel sidewall is 100 m/s, while the peak velocity of the liquid jet directed toward the channel end wall is about 55 m/s. The conclusions of the study on the restrictive region between parallel rigid walls can be analogized to the study of bubble dynamics in tubes. Cavitation in tubes is a common phenomenon in engineering.
The safety and reliability of pipelines are crucial for the stable operation of complex systems [10,11]. Cavitation in pipelines is a basic problem in the fields of hydraulic engineering and bioengineering. In particular, cavitation in rigid pipelines has a non-negligible impact on fluid systems and system components such as hydraulic systems and water conservancy systems. Cavitation bubble pulsation under restricted conditions has complex dynamic characteristics and wide applications in various fields, such as liquid pumping, underwater propulsion, and clinical applications. H Yuan and A Prosperetti [12,13] simulated the growth and collapse of one or more bubbles in a finite tube connecting two liquid reservoirs. The results show that, within certain parameter ranges, the system is capable of a net pumping action, moving liquid from one reservoir to another, even in the presence of unfavorable pressure differentials. Ni Baoyu [14] simulated the growth, expansion, and collapse of bubbles in narrow tubes through experimental and numerical studies. The jet was generated by the attraction of the Bjerknes force on the tube wall and was directed towards the tube wall. Zou Jun et al. [15] used a high-speed camera to study the interaction phenomenon between two oscillating steam bubbles in a rigid, narrow tube. The bubbles were generated by low-voltage electric sparks, and the bubbles occurred in glass tubes of different inner diameters. The bubbles not only deformed greatly during the first oscillation cycle but also caused liquid flow in all directions after rupture. His student, Ji Chen [16], conducted an experimental study on the oscillation of bubbles generated by a single spark in a rigid tube with the help of a hydrophone. Under an asymmetric state, secondary cavitation was observed to occur in the tube. Wang Shiping et al. [17] placed a tube horizontally in a water tank filled with water, generated electric spark bubbles in the tube, and used a high-speed camera to capture the expansion, rupture, and rebound of the bubbles. When the bubble position is eccentric in the tube, it will migrate to the distal part of the tube at the end of the collapse, and a jet will form in that direction. Hongchen Li [18] studied the dynamic behavior of laser-induced bubbles in a tube under different initial conditions. Numerical simulation based on the fluid volume method was implemented using open-source OpenFOAM code. According to experimental observations and numerical analysis, an axial jet pointing toward the front end of the tube was generated during the contraction of the bubble. A. Hajizadeh Aghdam [19] used high-speed photography to study the dynamics of bubbles generated by electric sparks in a vertical rigid tube. The bubble behavior is affected, to some extent, by the proximity to the tube wall, and the presence of a tube greatly increases the lifetime of the bubble. Guifu Zhang [20] conducted experimental and theoretical studies on liquid jets generated by electric explosions in water in a centimeter-wide circular tube. The study found that the jet pattern is mainly affected by the tube diameter, with narrow tubes producing conical jets and wide tubes producing annular jets. The jet maintains an almost constant velocity, which increases with the explosion energy and decreases with the tube diameter and the spacing distance. Ren Zibo [21] studied the dynamics of cavitation bubbles in a typical type of open tube with different cross-sections. The bubble generates a weak jet in the funnel-shaped part, an inverted cone-shaped jet near the throat, and a cylindrical jet with a rounded end in the funnel-shaped tube. Under the action of internal flow, bubbles seriously threaten the safety of equipment. In order to analyze the movement and deformation of bubbles in the fluid flow inside a pipeline, Luo Xiao [22] established a corresponding boundary-element numerical model based on the potential flow theory. Different flow velocity directions lead to different deformations of the later annular bubbles. If the dimensionless parameter of the pipe radius is greater than 5, the influence of the pipe on the bubble can be ignored.
In the field of clinical applications, the study of elastic tubes is of great significance in biomedicine, drug delivery, and vascular rupture. The study of the deformation and movement of bubbles in biological tissues can provide guidance for their application in medicine. Yasuhiro Sugimoto and Masamichi Hamamoto [23] studied the impact of bubbles on the surrounding environment by simulating treatment in narrow spaces. In the case where bubbles are formed near the elastic wall, the bubbles come into contact with the elastic wall during growth, and severe large deformation of the elastic wall is observed when the bubbles collapse. By presenting the deformation and temperature increase of the elastic wall, the safety of treatment in narrow spaces can be improved. Neo W. Jang [24] proposed the use of ultrasound-excited microbubbles in blood vessels for various clinical applications. Axisymmetric coupled boundary-element and finite-element codes and experiments were used to study the effect of the surrounding tubing on the response of the bubbles to acoustic excitation. Yanyang Liu [25] focused on the mechanism of microscopic damage to the vessel wall caused by the evolution of cavitation bubbles in blood vessels. Cavitation bubbles were generated in 0.9% sodium chloride saline by a low-pressure discharge method, and container models with wall thicknesses of 0.7–2 mm were made by a 3D lamination process. The interaction between cavitation bubbles and container models with different wall thicknesses was observed using high-speed photography. With the increase in container wall thickness, the cavitation bubble morphology and rupture time first increased, then stabilized. Wang Shiping [26,27] used potential flow theory and the boundary-element method to model both blood flow inside the blood vessel and tissue flow outside the blood vessel and numerically analyzed bubble oscillation, jet formation, and bubble penetration, as well as vascular wall deformation in terms of ultrasonic amplitude and vessel radius. Yaqian Xie [28] theoretically and experimentally studied stress-induced vascular damage caused by ultrasonic cavitation and constructed a bubble-fluid container coupling model to study the interaction of the coupled system. The severity of vascular damage is related to acoustic parameters, bubble–wall distance, microbubble size, and acoustic wave duration. Although some results have been achieved in the study of bubble morphology in confined areas, there has been no in-depth research on asymmetric bubbles and bubbles in longer pipes. In addition, further research is needed on the pumping effect and jet state caused by asymmetric bubbles in pipes.
In this study, Section 2 introduces the experimental setup and dimensionless parameters. Section 3 shows the comparison of experimental and simulation results, verifies the correctness of numerical simulation, and applies it to subsequent research. The results and discussion of the dynamic characteristics of bubble in tubes are presented in Section 4, Section 5 and Section 6. Finally, the research is summarized, and suggestions are made on the reliability of the bubble in tube system.

2. Materials and Methods

2.1. Experimental Setup

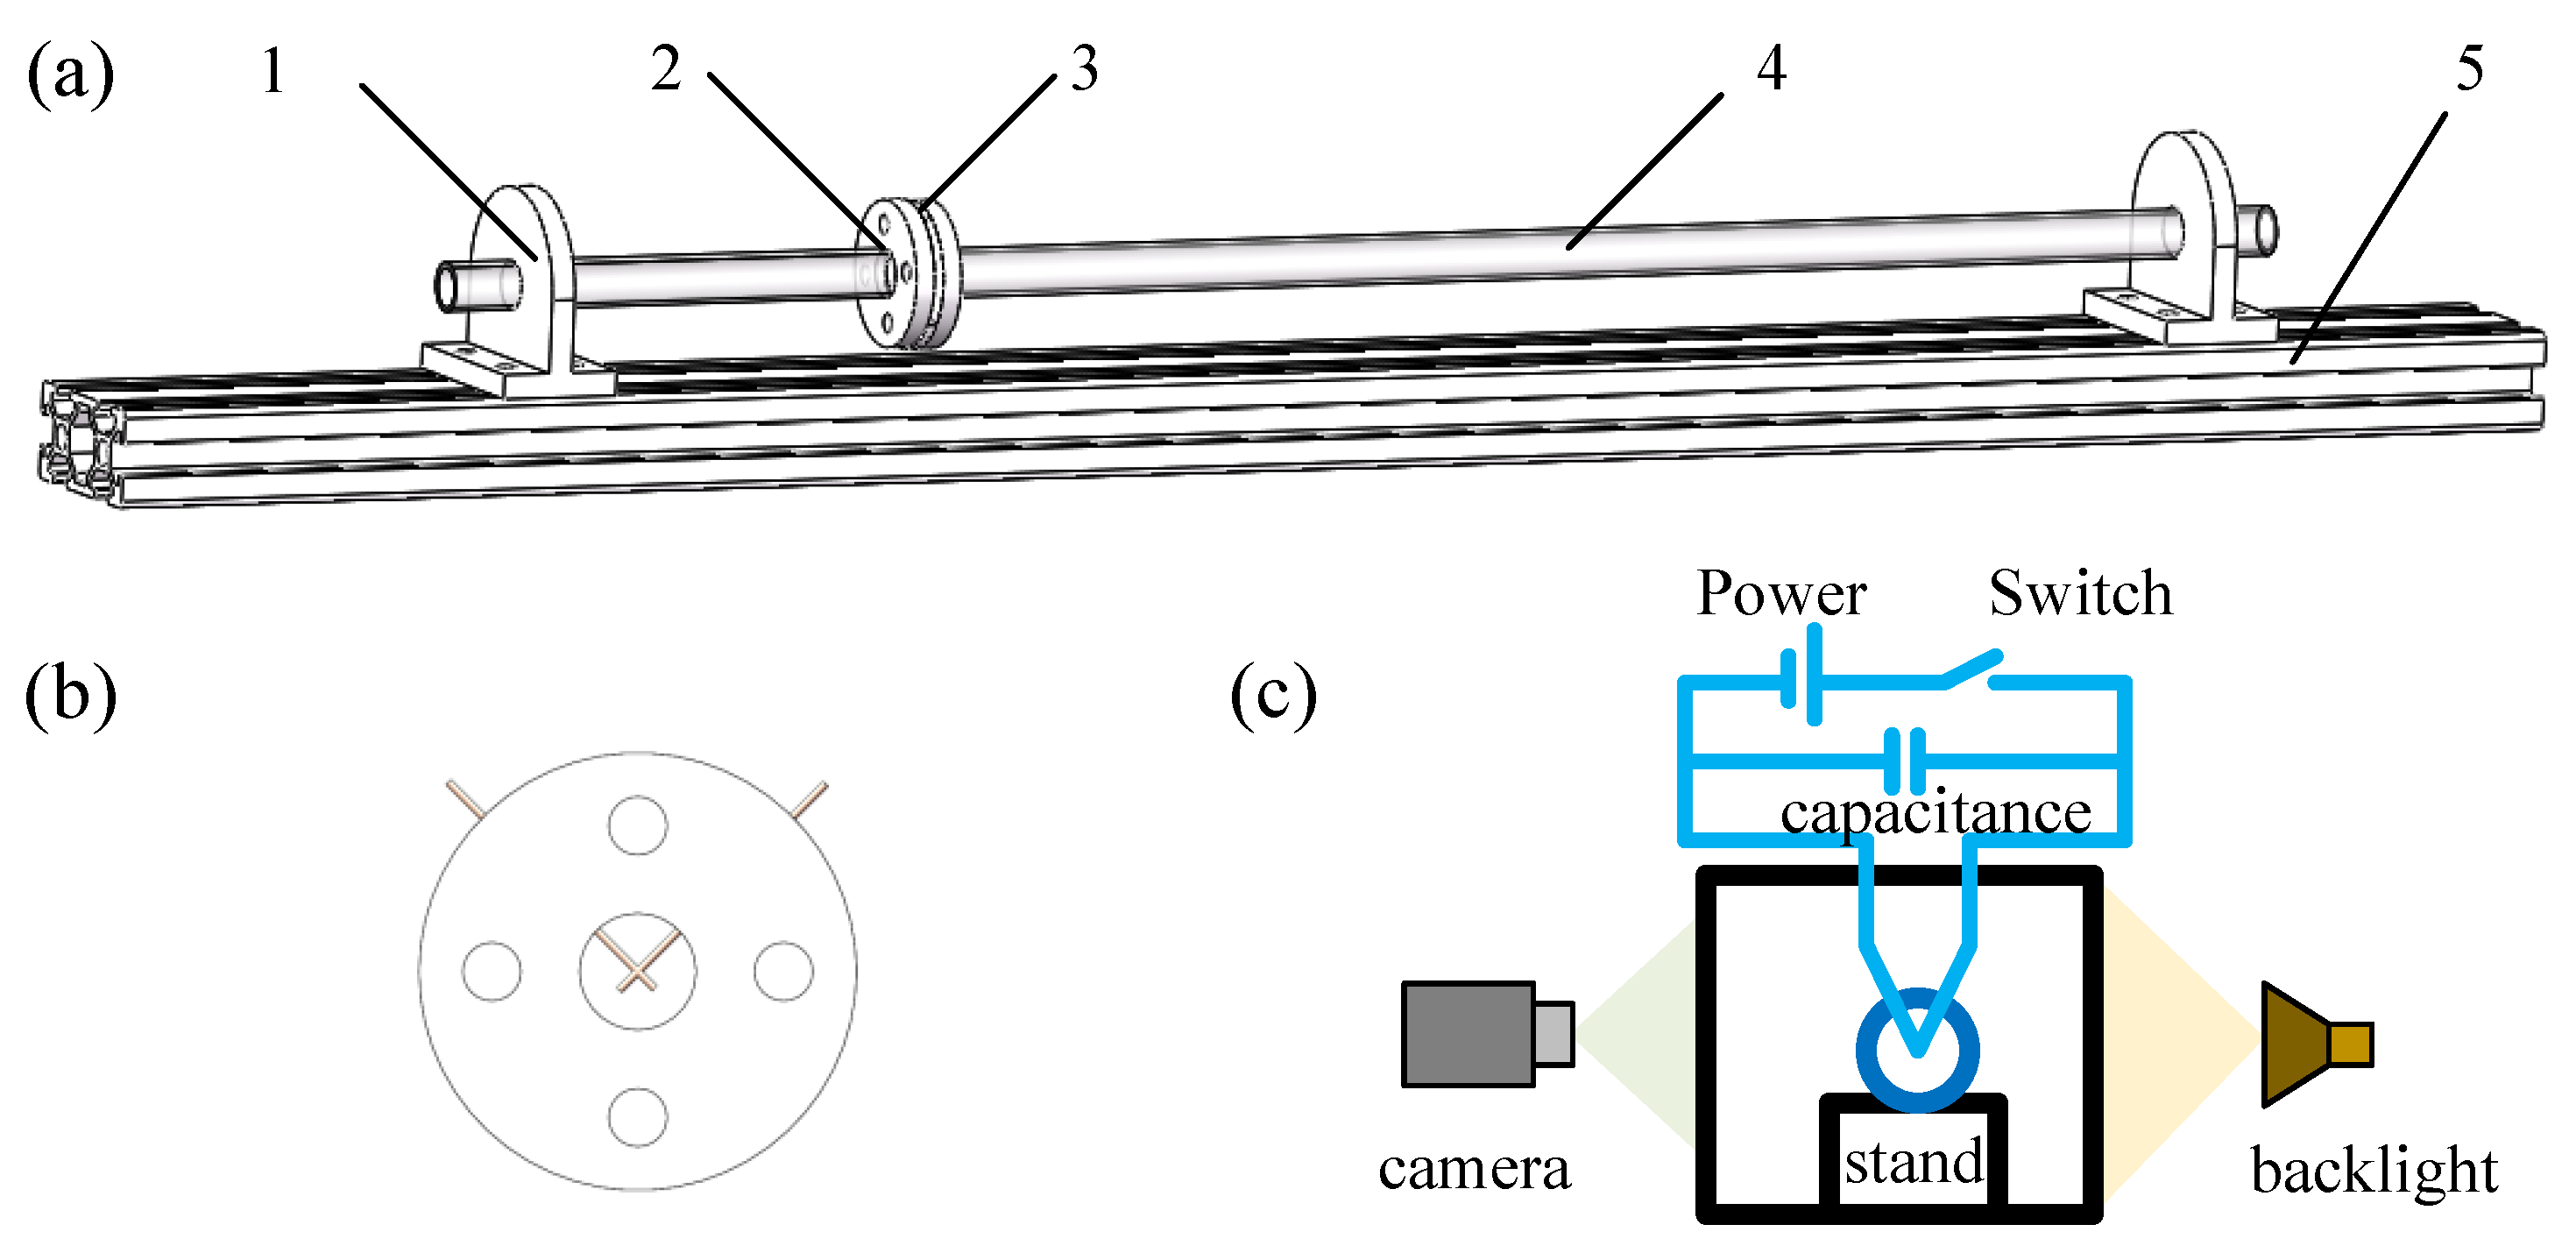
In the experiment, a 220 V alternating current is converted into an adjustable 60–120 V adjustable direct current, and the size of the bubbles can be changed by adjusting the voltage. The short circuit of two wires generates instantaneous high temperature and produces spark bubbles. The cavitation bubbles were generated by shorting the adjustable direct current voltage carried by two thin wires 0.14 mm in diameter. The entire experimental setup is placed in a water tank, the size of which ensures that the free surface of the water and the wall surface of the water tank do not affect the jet direction of the air bubbles. The size of the bubble is much larger than the diameter of the wire, and the influence of the wire on the bubble is very small and can be ignored. At the same time, high-speed photography is used to capture the bubble morphology in the tube and the cavitation effect in the tube caused by bubble movement. The model of the high-speed camera is Phantom VEO 1010L, US, and the shooting rate is set to 30,000 frames per second. A schematic diagram of the experimental device for multiple cavitation in the circular tube is shown in Figure 2a, where the serial numbers correspond to (1) tube stand, (2) flange connector, (3) bubble generation bracket, (4) tube, and (5) base. The entire device is placed in a transparent water tank, and a continuous light source with a power of 600 W(HSPY-400-01) is selected and placed opposite the high-speed camera, as showns in Figure 2c.
As shown in Figure 2, the entire experimental device is installed on a length of 2040 aluminum profile. The weight of the aluminum profile can maintain the stability of the fixation. In addition, the size of the remaining processing fixtures can be designed according to the parameters of the aluminum profile, which also reduces part of the design workload. Since the designed experiment is for a longer pipe and needs to be kept fixed during the experiment, a stand is designed to support the two ends of the two round tubes, which is also conducive to the shooting in the experiment.
For a tube with a smaller diameter, first, it is difficult to fix the two electrodes of the bubble at the specified position; secondly, the size of the electrode affects the shape of the bubble and the movement of the fluid in the tube. Therefore, the flange connector (2) and the bubble generator bracket (3) are designed so that the electrode no longer needs to be inserted from the end of the tube, and the bubble generator bracket (3) is used to fix the bubble generation position. By changing the length of the tubes on both sides, the initial bubble generation position can be changed, and the intersection of the electrodes, that is, the center of the discharge, can also be kept at the center of the tube, as shown in Figure 2b. After connecting the tube (4) to the flange connector (2), the two connected tubes are connected to the bubble generator bracket (3). In order to ensure sealing at the connection position, the sealing gasket is placed between the flange connector and the bubble generator bracket before assembly. The entire experimental device for bubble dynamics in a tube is assembled.

2.2. Dimensionless Parameters

The variables in this experiment are the size of the bubble and the size of the tube, where the size of the tube includes length and diameter. In the experiment, three different experimental voltages were used to change the size of the bubble: 60 V, 100 V, and 150 V. The average maximum diameter of the bubble in the free field corresponding to the different voltages was 11.5 mm, 18.6 mm, and 29.2 mm, respectively. The lengths of the experimental circular tubes were 100 mm, 200 mm, 400 mm, and 500 mm. In this paper, the 100 mm tube is defined as a short tube, the 200 mm tube is defined as a longer tube, and the 400 mm and 500 mm tubes are defined as long tubes. The vertical axis is the diameter of the circular tube, and the horizontal axis is the initial bubble generation position. For example, a circular tube with a length of 100 mm and a diameter of 6 mm, that is, the left-end tube length is 10 mm and the right-end tube length is 90 mm, is connected with a flange connector and combined with the bubble generation bracket to form a complete experimental device, as shown in the Figure 2.
The key parameters in the experiment are shown in Figure 3. At the initial bubble generation moment, the time (t) is set to 0, and the oscillation period of the bubble generated by the electric spark is T 0 . The axial position along the tube is represented by the x coordinate, the right end of the tube is x = 0 , the left end is x = L t , and the inner diameter of the tube is D t .
The horizontal coordinate of the initial bubble is X B , and the dimensionless parameter of the initial bubble occurrence position relative to the length of the tube is
η b = X B L t
Dimensionless diameter of the tube relative to the maximum radius of the bubble is
γ t = D t R m a x
where R m a x is the maximum radius of the bubble under free-field conditions. Another parameter of the tube is the length. The dimensionless length of the tube length relative to the maximum radius of the bubble is
γ L = L t R m a x
In addition, the concept of tube diameter ratio is introduced here, corresponding to the ratio of the length of the tube to the diameter:
Λ = L t D t

3. Numerical Simulation Verification of Bubble Morphology in Tubes

Due to the experimental structure setting in this paper, the bubble generation bracket blocks the light and shooting angle, and the overall structural image of the bubble cannot be obtained. Therefore, the supplement of numerical simulation is particularly important in the study of bubble morphology. Numerical simulation technology is an effective method for analyzing structural reliability and has been widely used in structural design [29,30,31]. The images in Wang Shiping’s paper [17] are compared with the numerical simulation results. Figure 4a shows the morphology and jet state of the bubble after the electric spark bubble is generated at the center of the tube when the length is 200 mm, the diameter is 20 mm, and the maximum radius of the bubble R m a x is 13.6 mm. The dimensionless parameters are η b = 0.5 , γ t = 1.47 , γ L = 14.7 . The morphological evolution of the bubble is shown in Figure 4a, and the subscript is the time corresponding to the experimental image. Figure 4b shows some results of simulation using Abaqus2024 commercial software. The simulation in this paper adopts the CEL method. The domain, mesh, and boundary conditions are all included in the model, which has been published on Github. Link is in the Appendix A. The figure shows an image of the cross-section of the bubble in the tube in the y-axis direction. It can be seen from the figure that the simulation image corresponds well to some forms of the experimental image. Due to the action of the wall in the cylinder, the bubble expands in an ellipsoidal shape until the bubble volume is the largest. At this time, the velocity in the middle of the bubble is zero; then, the bubble enters the collapse cycle. During the collapse process, the short axis of the ellipsoidal bubble begins to collapse first, and the collapse direction is to move toward the middle along the axis, forming two jets in opposite directions. With the collapse of the bubble and the continuous movement of the jet, the bubble is penetrated and cut into a ring until the first bubble cycle ends.
Both the experiment and the numerical simulation experienced the above-mentioned changes in bubble morphology, such as an ellipsoidal shape during expansion, a “counter-jet” during collapse, and an annular bubble in the late stage of collapse. Overall, within the allowable error range, the numerical solution is consistent with the experimental value, especially for the stage before the bubble burst. The good agreement between the two not only reveals the dynamic changes of bubbles under the action of the annular boundary but also verifies the feasibility of the experimental model and the numerical algorithm. In the next tube experiment, this simulation method is used to supplement the experimental conditions, such as the central shape of the obscured bubble and the water flow velocity.

4. Dynamic Characteristics of a Bubble in Short Tubes

This section first shows the bubble morphology in the short tube under symmetrical and asymmetrical states, then analyzes the wall pressure of the bubble in the short tube and summarizes the vortex ring law generated outside the short tube.

4.1. Bubble Collapse

4.1.1. Symmetric Bubble Collapse

The following shows and discusses the movement of bubbles at the symmetric center of a 100 mm tube with the initial bubble generation position at η b = 0.5 . Figure 5 shows the bubble morphology of a tube with a diameter of 10 mm ( γ t = 0.685 , γ L = 6.85 , and Λ = 10 ). The image at 0 ms is the initial state. It was mentioned in the previous statement that in order to ensure the location of the initial bubble, the installation of the position remains consistent and stable. The use of the bubble generation bracket causes the middle position of the image to be opaque, but this does not affect the observation of the overall shape of the bubble. The disadvantage is that the collapse moment of the initial bubble cannot be accurately observed. The bubble begins to expand inside the tube. At 1.50 ms, it is shown that the middle section fills the tube and the two ends are ellipsoidal, as shown by the red curve in the figure. After that, the bubble gradually elongates, and at 4.07 ms, the bubble reaches the maximum volume, the curvature of the bubble end face decreases, and the overall shape is basically cylindrical. When the bubble enters the collapse stage, the two ends of the bubble begin to collapse first. This state is shown in the image at 6.57 ms, that is, the two ends first produce an inward depression. This is because the curvature of the bubble shape at the two ends is greater than that of the middle bubbles, and there is no direct contact with the boundary. Until the collapse ends, the bubble shape in the tube remains symmetrical. The vortex ring generated by the movement of the bubble at the tube end also moves symmetrically.
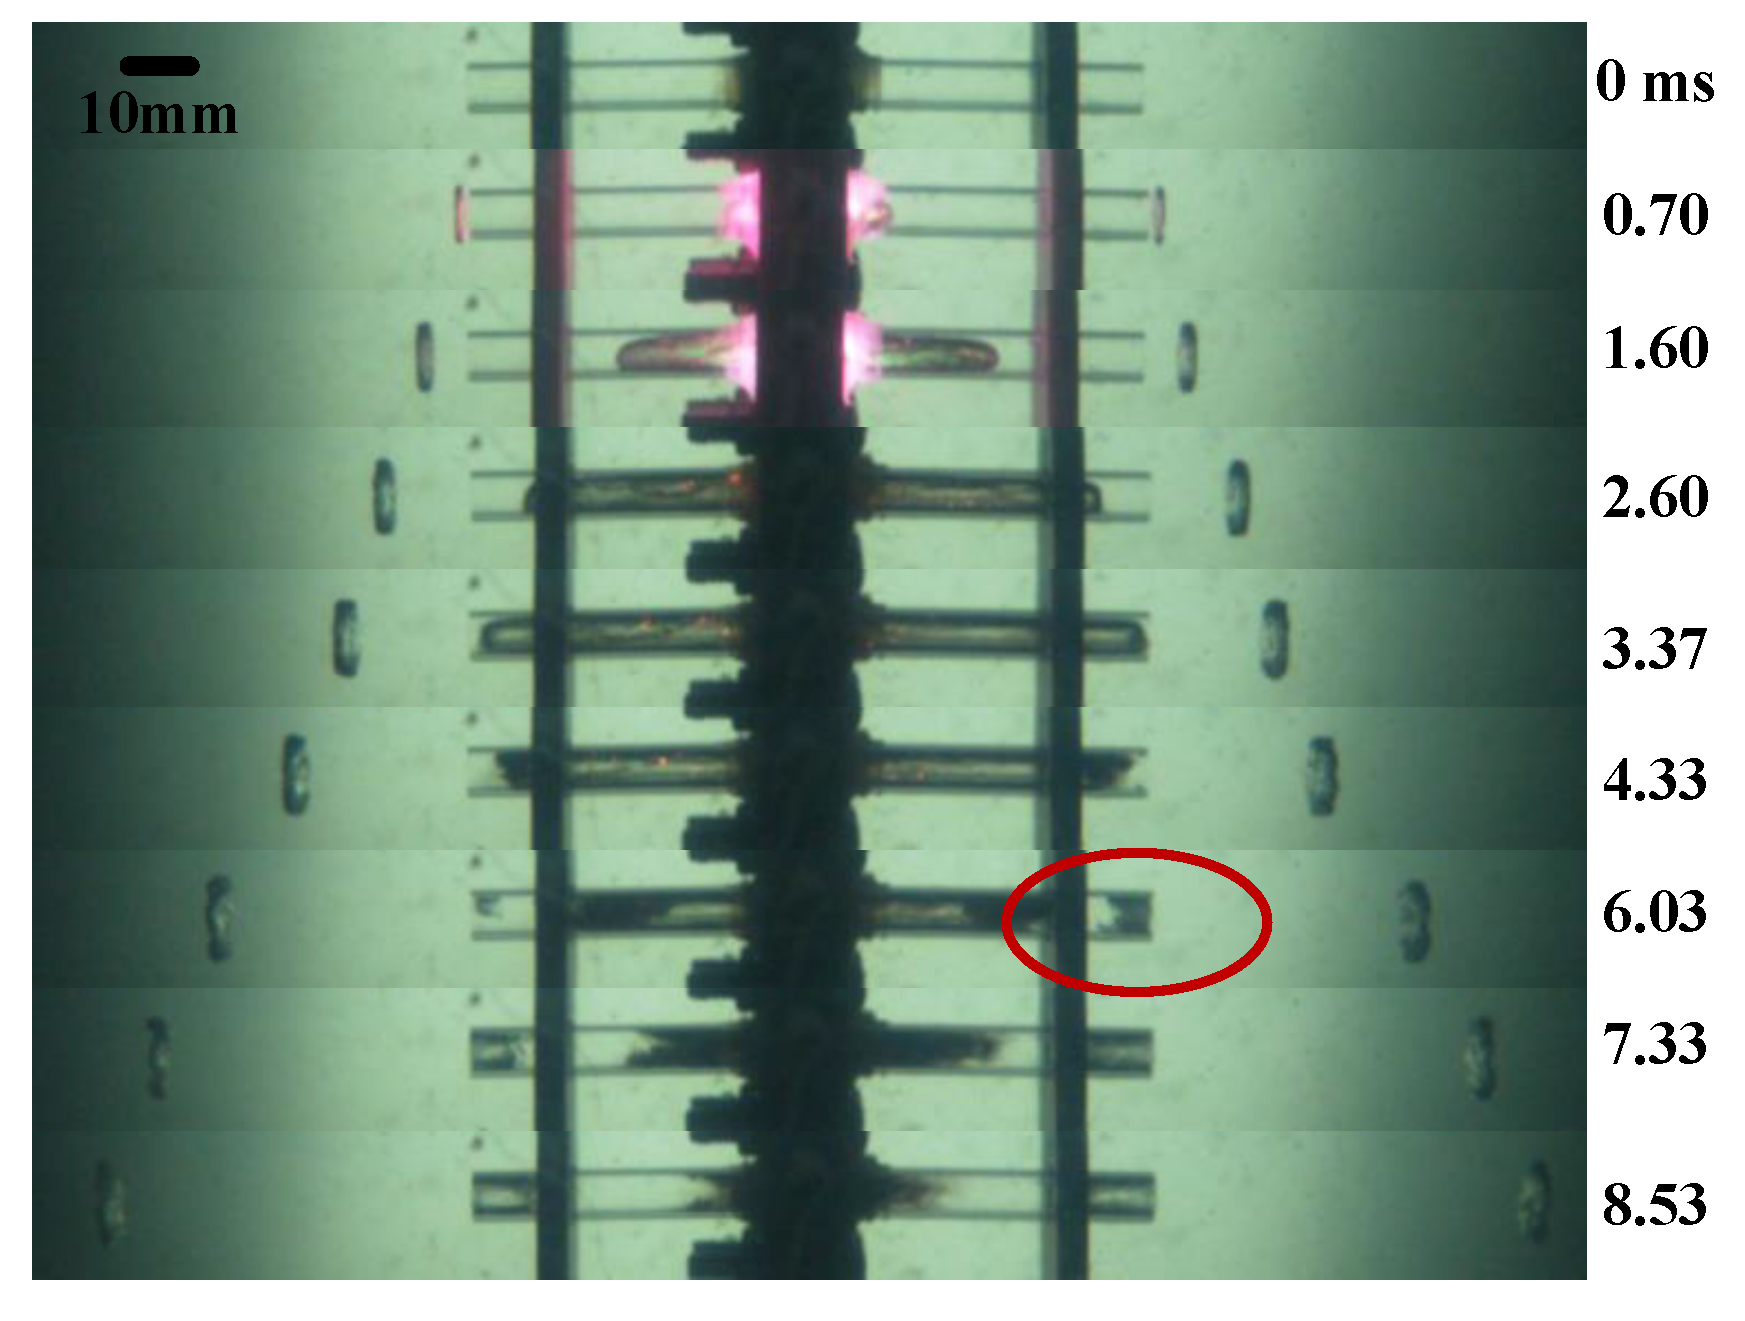
Figure 6 shows the bubble morphology in a tube with a diameter of 8 mm ( η b = 0.5 , γ t = 0.548 , γ L = 6.85 , and Λ = 10 ). Its basic movement process is the same as that of a 10 mm tube, which is a centrally symmetrical movement. Due to the decrease in γ t , the elongation of the bubble morphology is more obvious, and the width of the vortex ring generated at the tube end is also increased compared with the 10 mm diameter tube. The collapse of the bubble changes the flow direction of the liquid around the tube, and when the diameter of the tube is small, liquid attracted into the tube appears as shown in the 6.03 ms image.

4.1.2. Asymmetric Bubble Collapse

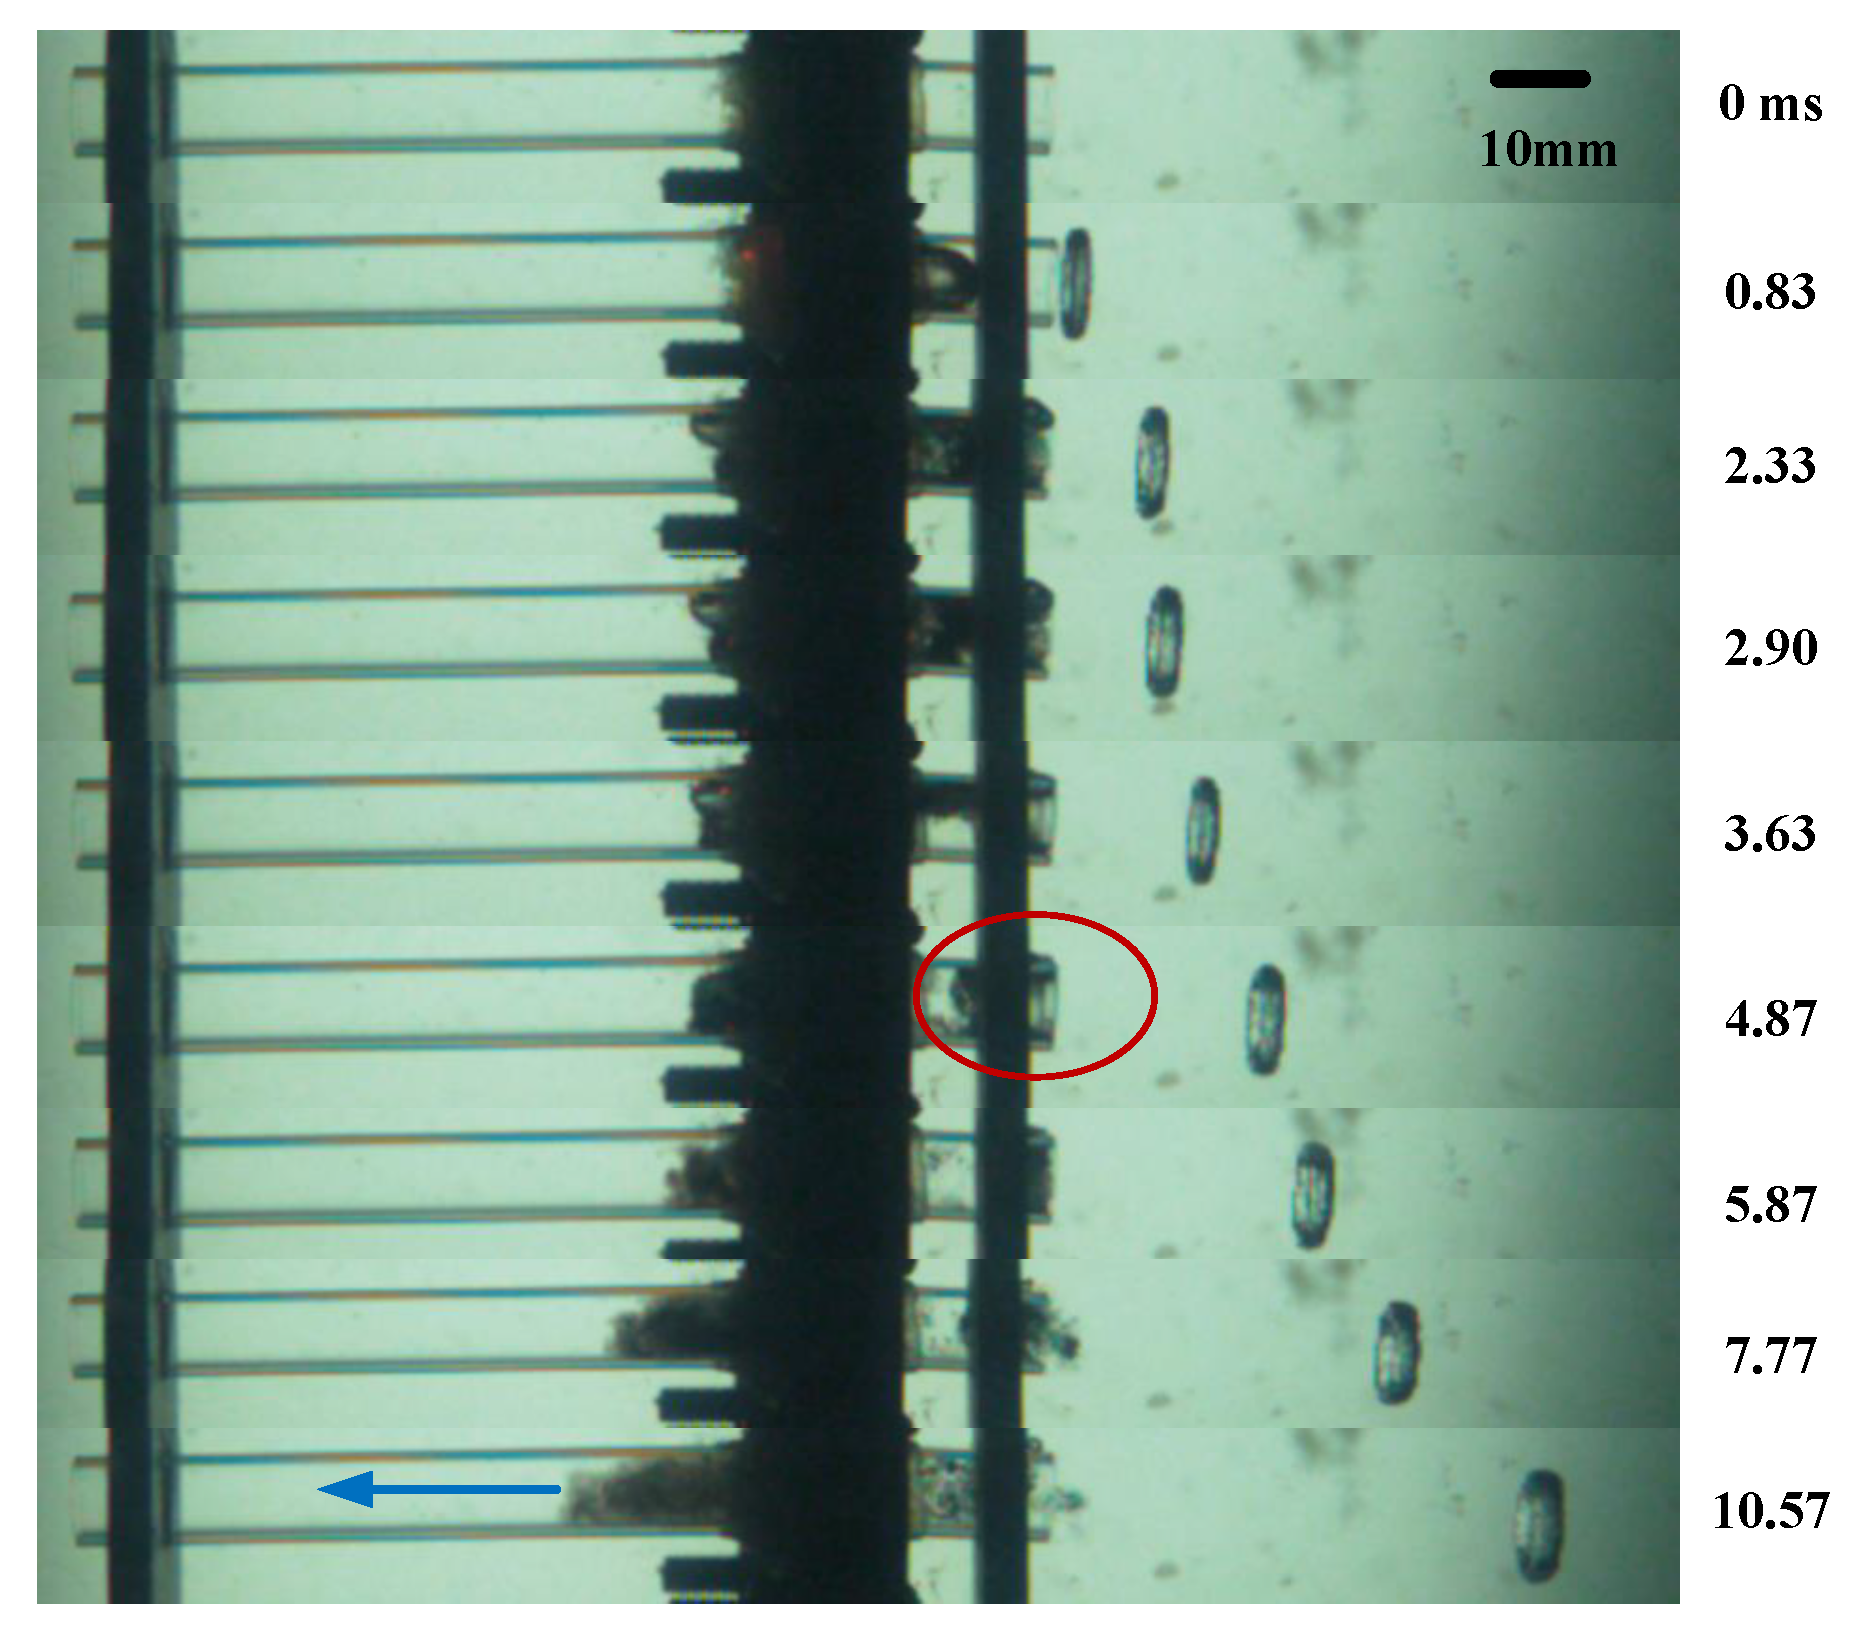
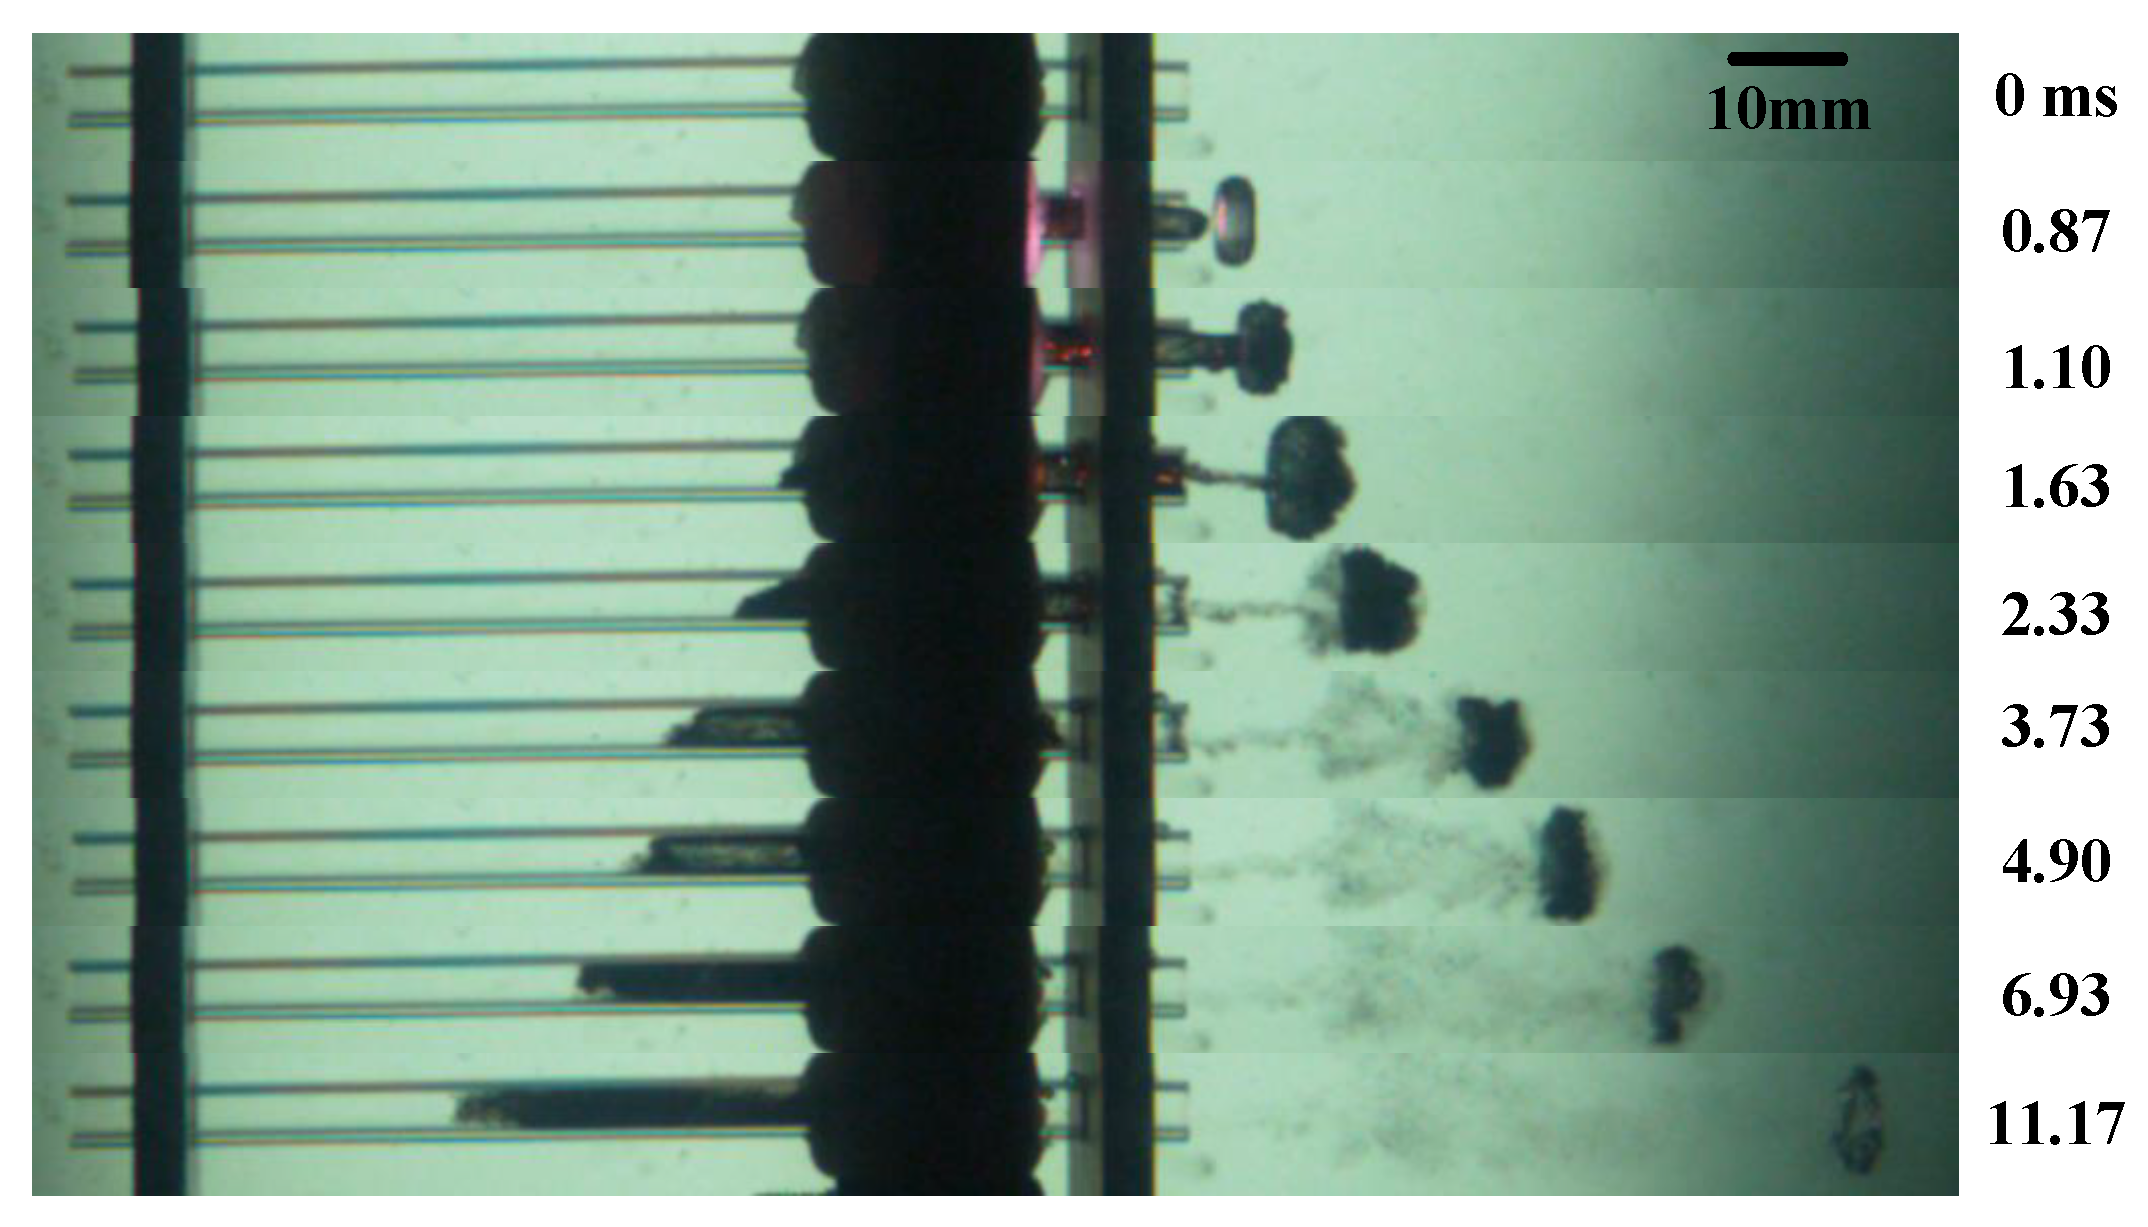
When the bubble is no longer in the middle position, the bubble is no longer symmetrical, and the shape is related to the location of the initial bubble ( η b ) and the size of the tube. Figure 7 shows the bubble motion state in the tube when the length is 100 mm at η b = 0.2 . As shown in the image at 0.83 ms, the initial bubble is no longer symmetrical, and the volume of the bubble on the side with a shorter tube length is larger, which is shown in the image as a longer length, and the end face of the bubble is ellipsoidal. At 2.33 ms, the bubble reaches its maximum volume, then enters the collapse stage. After the bubble begins to collapse, the change in the pressure in the tube causes the change in the direction of the water flow, which attracts the liquid at the tube end to flow into the tube, as shown in the 3.63 ms and 4.87 ms images. It can be seen that the side of the cavitation closer to the tube end develops faster during the expansion process, and the outer side begins to concave and shrink first. The collapse speed of the outer side is higher than that of the inner side, and after the collapse, a jet is formed in the opposite direction of the initial bubble position. This jet continues to make the liquid in the pipe flow in one direction after the cavitation collapses, playing a pumping role. The vortex ring generated by the bubble movement periodically moves away from the tube.
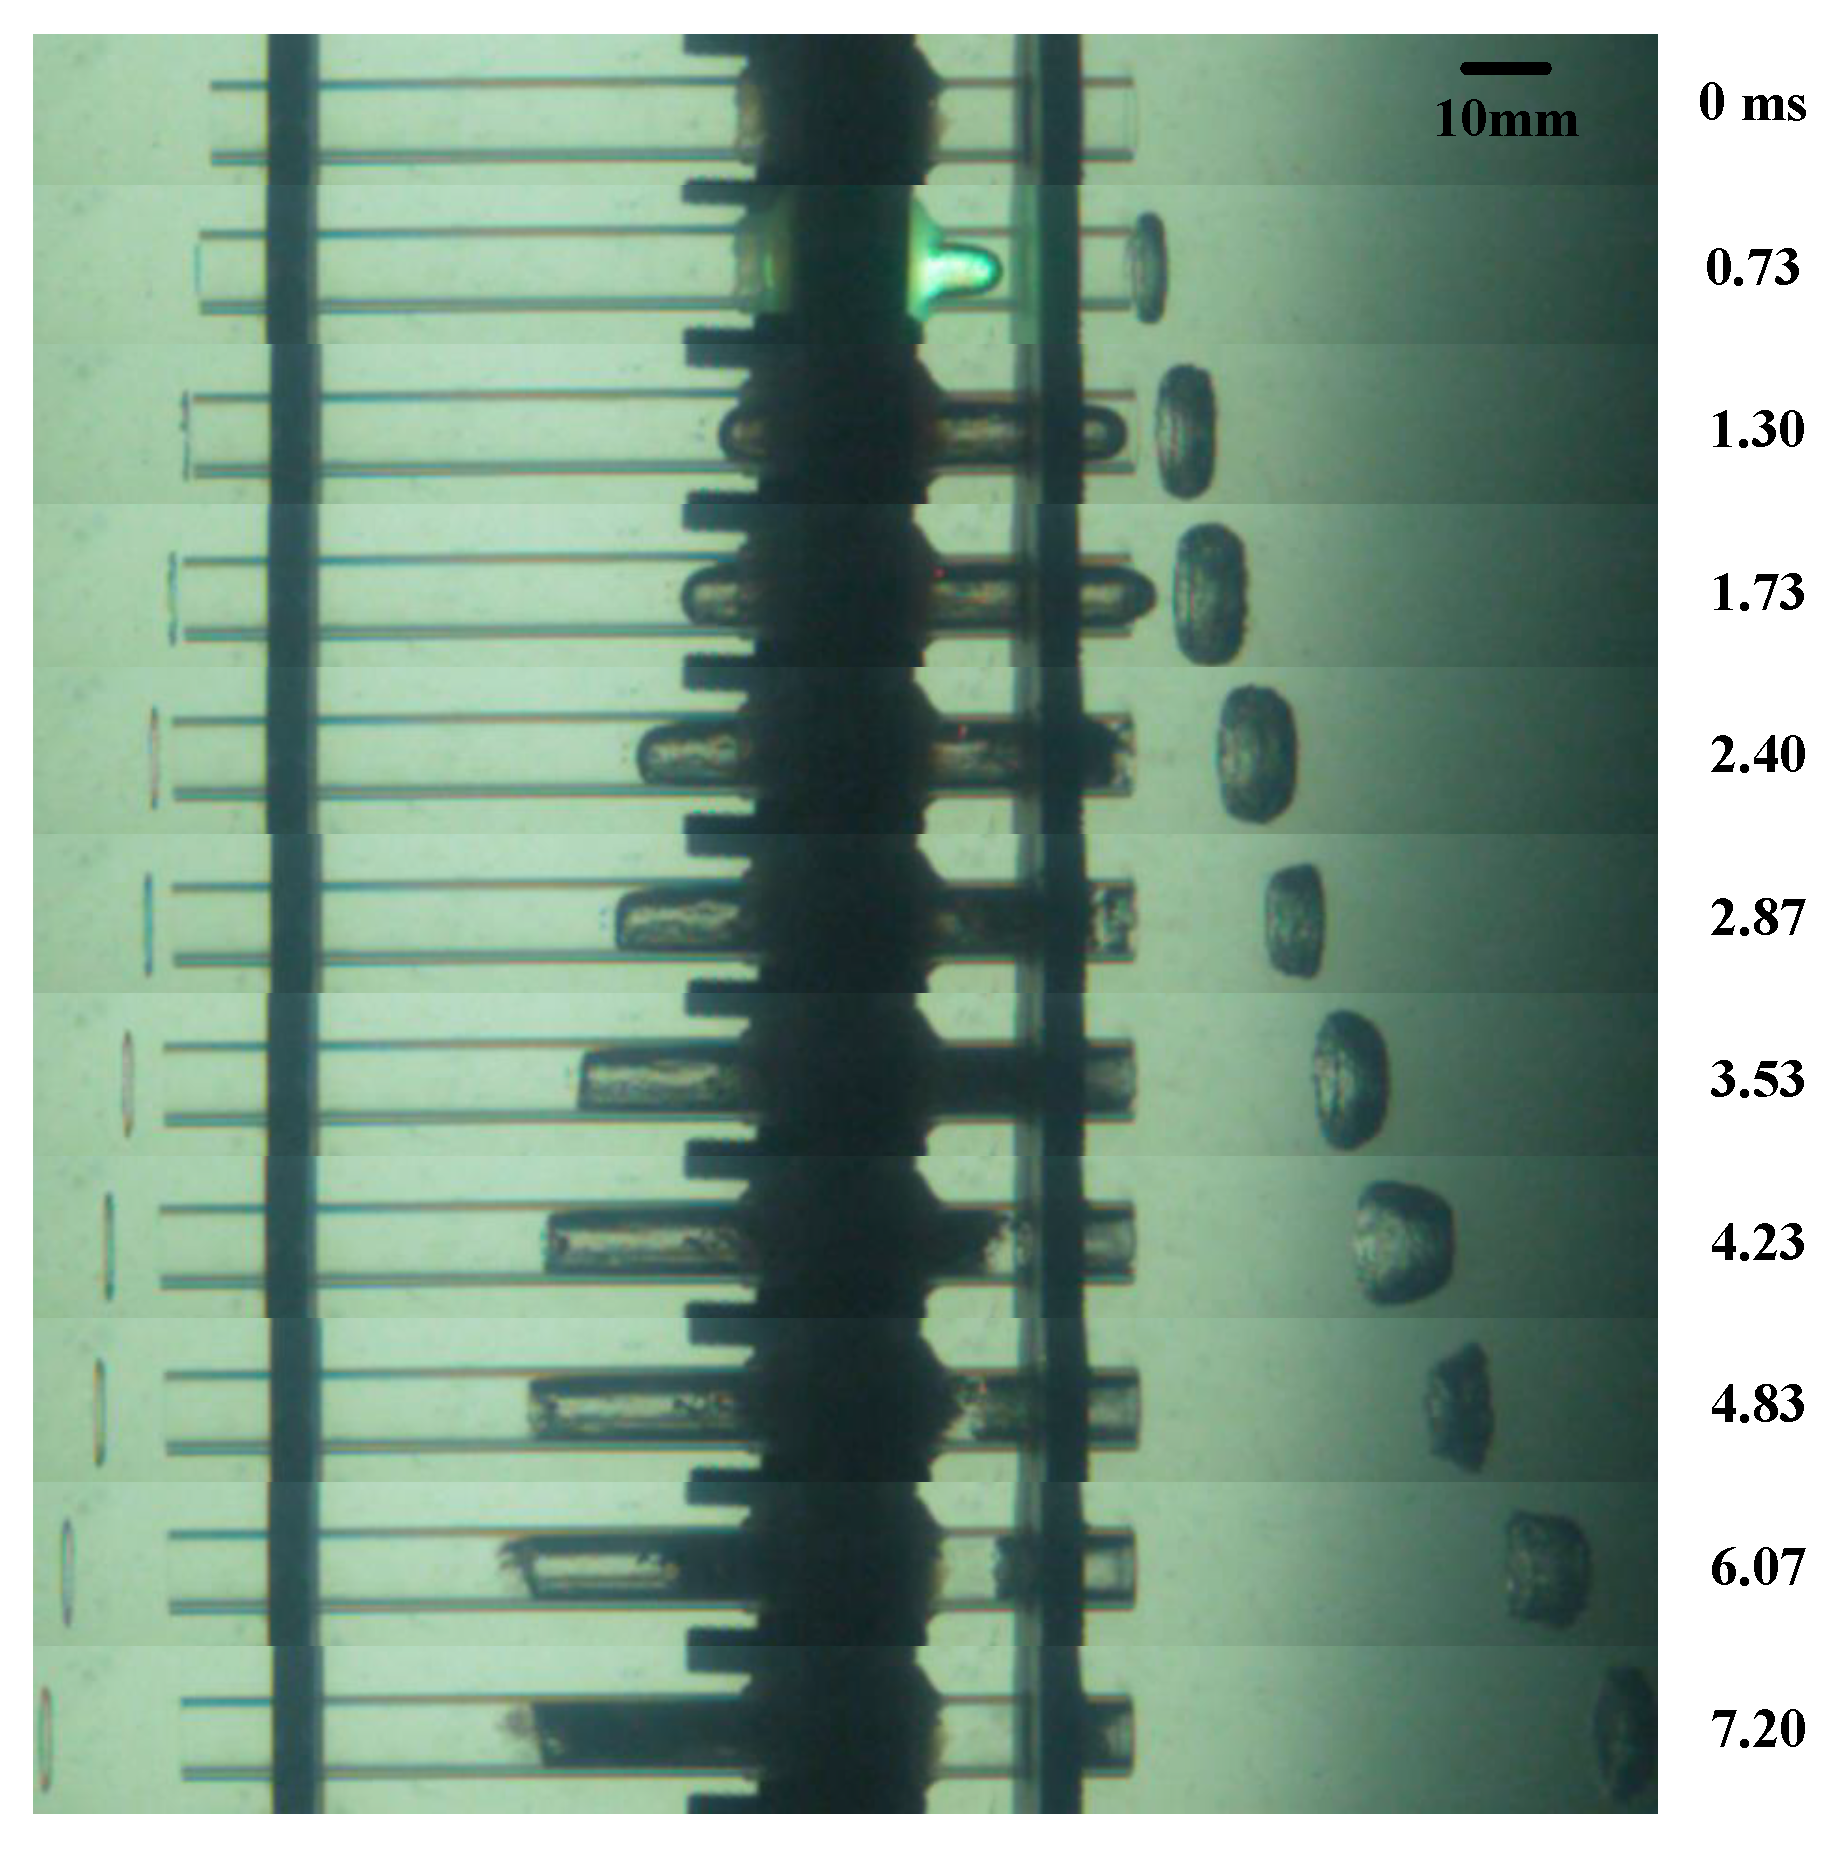
In order to compare the difference in bubble morphology caused by the different initial bubble generation positions, Figure 8 provides the bubble images in a tube with a tube length of 100 mm at η b = 0.3 . Compared with Figure 7, due to the growth of the right end of the tube, the initial bubble has more space to stretch in the tube, and the volume of the bubble also increases accordingly. It can be clearly seen that the bubble at one end of the shorter tube is longer, and the bubble volume reaches the maximum at 1.73 ms. Even at the maximum volume, the end face of the bubble is still ellipsoidal. In addition, during the collapse process, on the one hand, the right side of the initial bubble attracts the liquid at the tube end to flow into the tube, and on the other hand, the left side of the bubble collapses slower than the right side and still moves toward the long tube end. At the same time, the collapsed right tube bubble gradually fills the bubble in the left tube, as shown in the 6.07 ms and 7.20 ms images. After the initial bubble cycle ends, the direction of the water flow in the tube is the same as before, which is toward the side of the longer tube. For the vortex ring generated by the movement of bubbles in the tube, first of all, vortex rings are generated at both ends of the tube. The vortex ring on the right side of the tube is stronger than that of the left sideand always moves away from the tube. The width of the vortex ring on the right side of the tube is increased significantly compared with η = 0.2 .
In order to compare the effect of the tube size on the bubble morphology, Figure 9 shows the image of the bubble in the tube under the conditions of η b = 0.2 , γ t = 0.411 ,   γ L = 6.85 , and Λ = 16.67 with a tube length of 100 mm and a tube diameter of 6 mm. As can be seen from the figure, the basic movement morphology of the bubble is similar. Compared with Figure 7, the bubble on the right stretches longer, and the bubble even comes into contact with the vortex ring at 1.10 ms. At 1.63 ms, it can be seen from the figure that there is still a liquid connection between the bubble and the vortex ring. After the collapse, as the vortex ring moves away and the bubble collapses, the change in the direction of movement gradually disconnects the connection between the bubble and the vortex ring. The bubble on the right collapses faster and moves toward the left, finally filling the entire left side of the initial bubble, and the liquid in the tube moves to the left side of the tube together. After reducing γ t , the period of the initial bubble increases, and the speed difference on both sides of the bubble increases, which enhances the speed change of the fluid in the tube caused by the bubble movement in the tube. In addition, the vortex ring generated by the bubble movement has a wider initial width than the working condition of γ t = 0.685 . After contacting the initial bubble, the vortex ring no longer maintains a smooth ring shape, and there is still energy exchange between the bubble and the vortex ring. The bubble and the vortex ring gradually separate, and the width of the vortex ring after separation gradually decreases due to energy dissipation. And without the interference of bubbles, the movement of the vortex ring away from the tube end gradually becomes stable, and it moves continuously in the direction away from the tube.

4.2. Pressure in the Tube

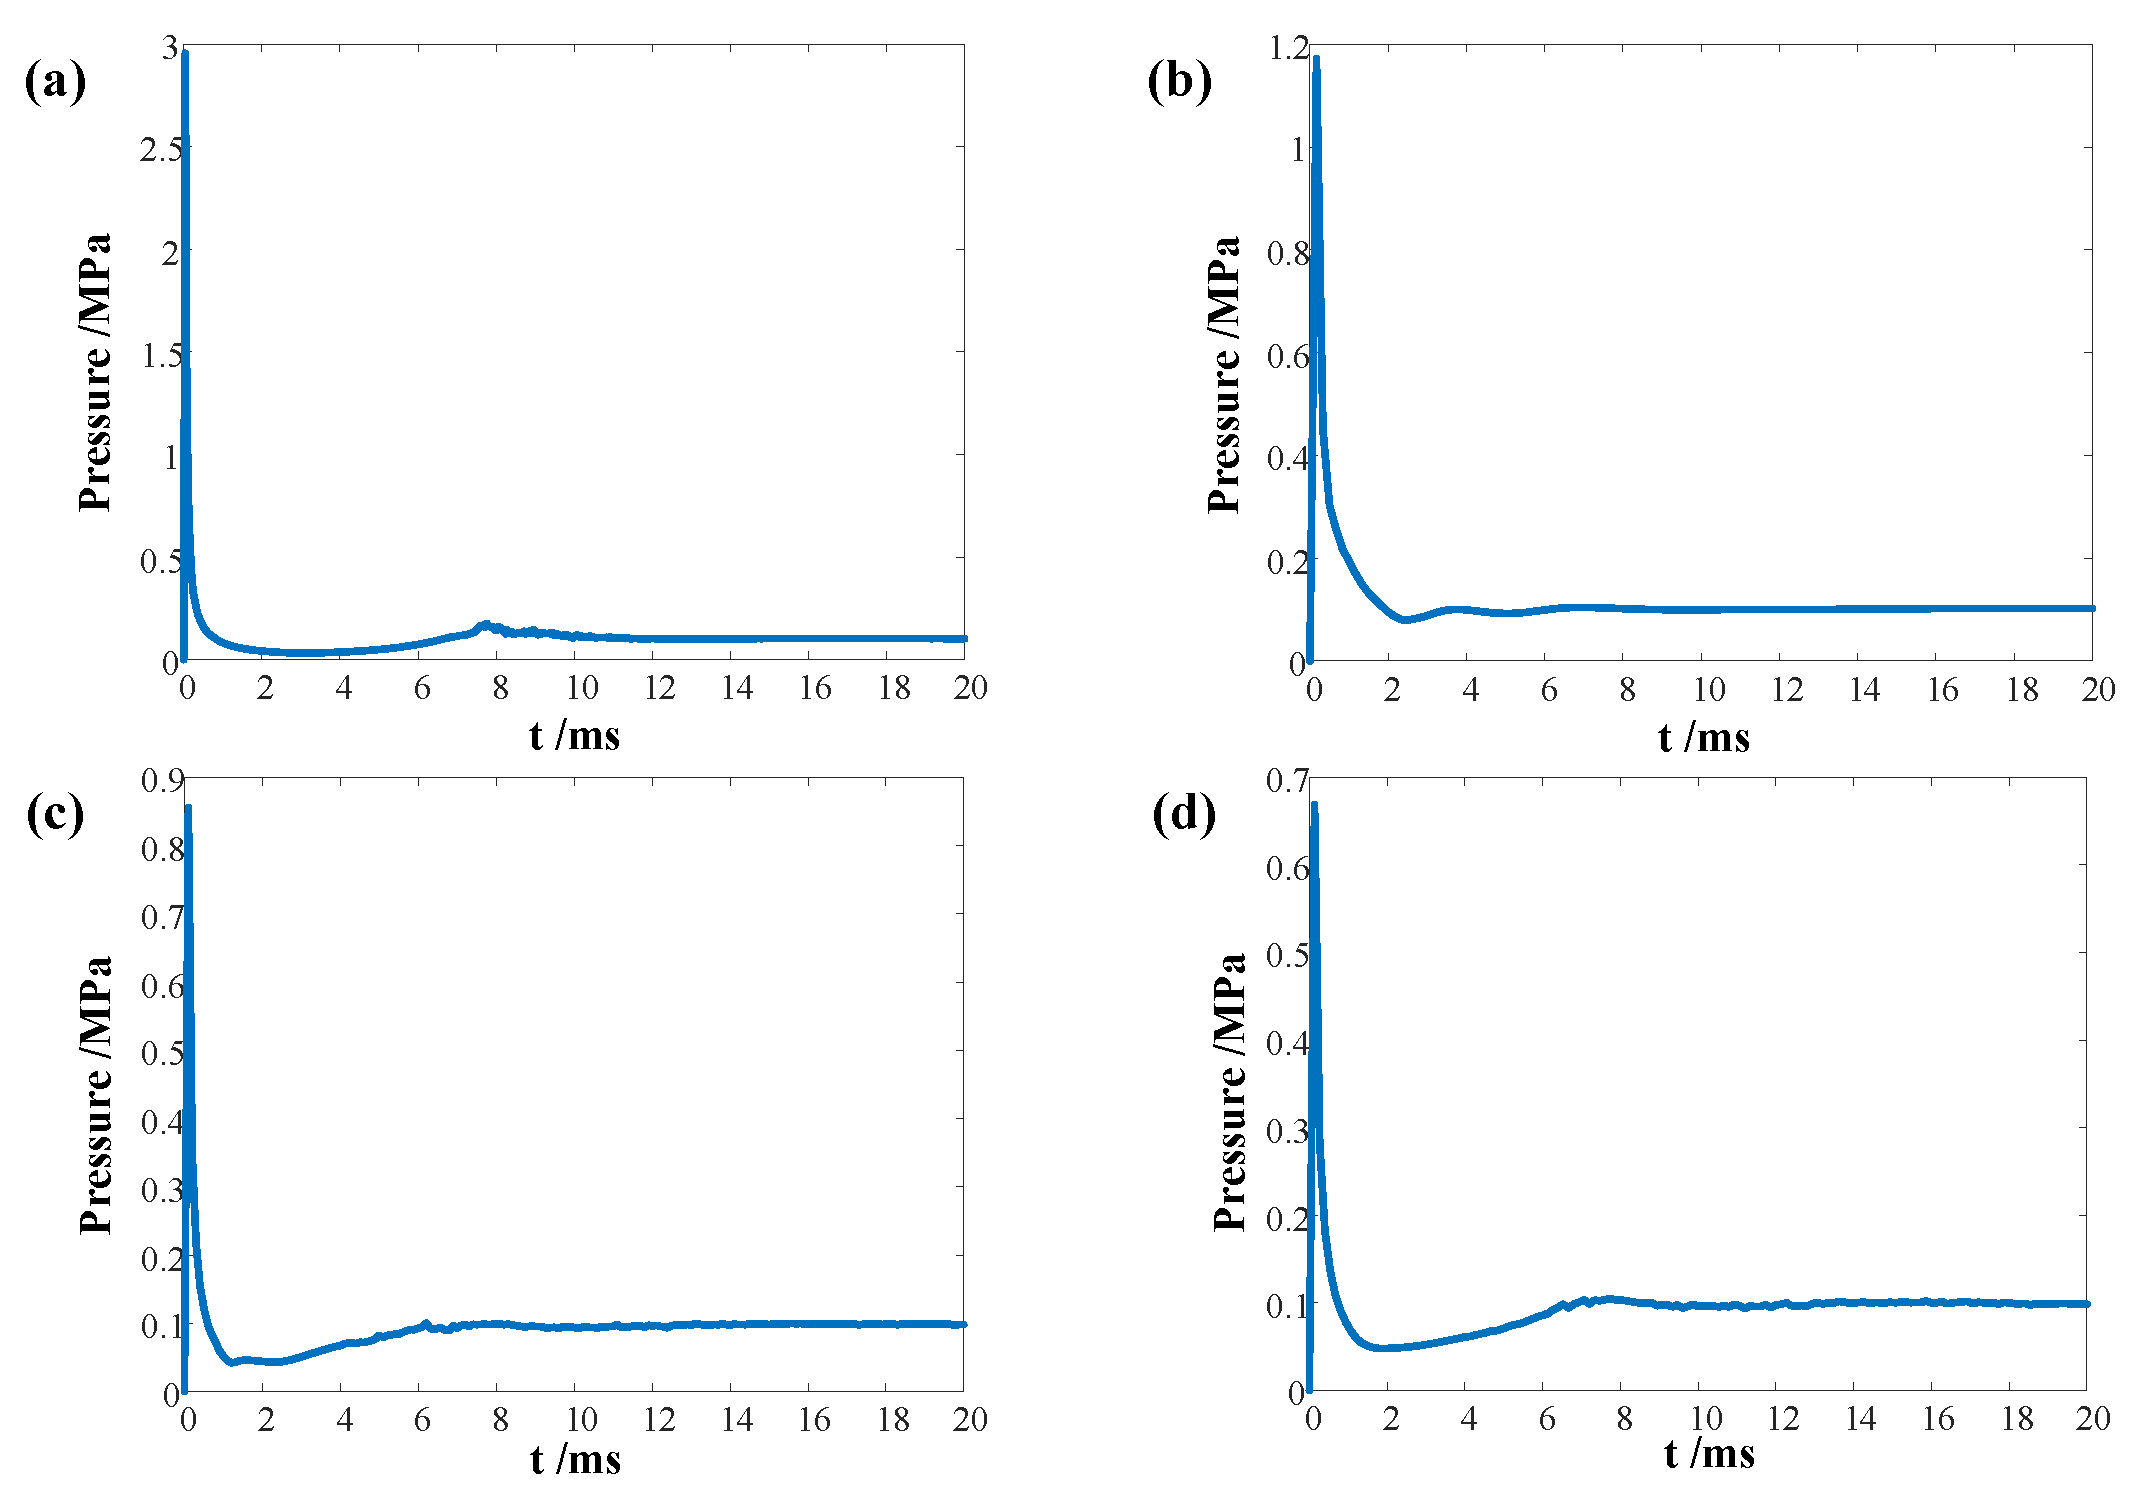
In the study of the 100 mm tube, experiments and numerical simulations were carried out under the conditions of different tube diameters ( γ t ) and different initial bubble occurrence positions ( η b ). Figure 10a shows the pressure change over time at the center of the bubble occurrence position when the tube length is 100 mm and the tube diameter is 10 mm at η b = 0.5. As shown in the figure, the pressure increases instantly upon the initial generation of the bubble. The bubble bursts at about 8 ms, and the flow field is instantly disturbed at this time. The pressure is weaker than the initial pressure peak, then decays and disappears. The pressure at the center of the initial bubble when the tube diameter is 6 mm is shown in Figure 10b. Compared with the 10 mm tube, the initial pressure is reduced, and the bubble cycle is prolonged. When the diameter exceeds a certain value, the effect of the wall is weak and can be basically ignored, and the movements form of the bubble and the jet are basically consistent with the free field. Whether it is a horizontal wall, a curved wall, or a cylindrical boundary, the distance parameter ( γ t ) has a great influence on the bubble form and jet behavior. The smaller γ t is, the greater the obstruction of the fluid by the boundary and the longer the bubble pulsation period. In addition, when the initial bubble occurs at different locations, the first thing that comes is the difference in bubble form, which causes changes in the surrounding fluid and the pressure in the tube. Figure 10c,d show the pressure changes at the center of the initial bubble under the conditions of η b = 0.2 and 0.3. The first thing that can be observed is the sudden increase in pressure at the initial moment. However, unlike the bubble occurring at the symmetric center, there is no trend of pressure increase and decrease at the moment of bubble collapse as in the condition of η b = 0.5. This is because the bubbles are generated at an eccentric position, and the expansion and collapse of the bubbles on both sides are not symmetrical. When the bubbles collapse, the bubbles on the right collapse earlier than the bubbles on the left. The bubbles on the left have not yet collapsed, and the collapsed bubbles on the right have moved to the inside of the bubbles on the left. For the phenomenon of a bubble bursting in the cylinder, the initial position of the bubble ( η b ) also greatly affects its dynamic behavior; the smaller the η b , the longer the length of the cylinder on the right, the stronger the obstruction of the fluid, the longer the corresponding bubble period, and the smaller the generated jet velocity, guided by the jet of the first collapsed bubble on the left to move.
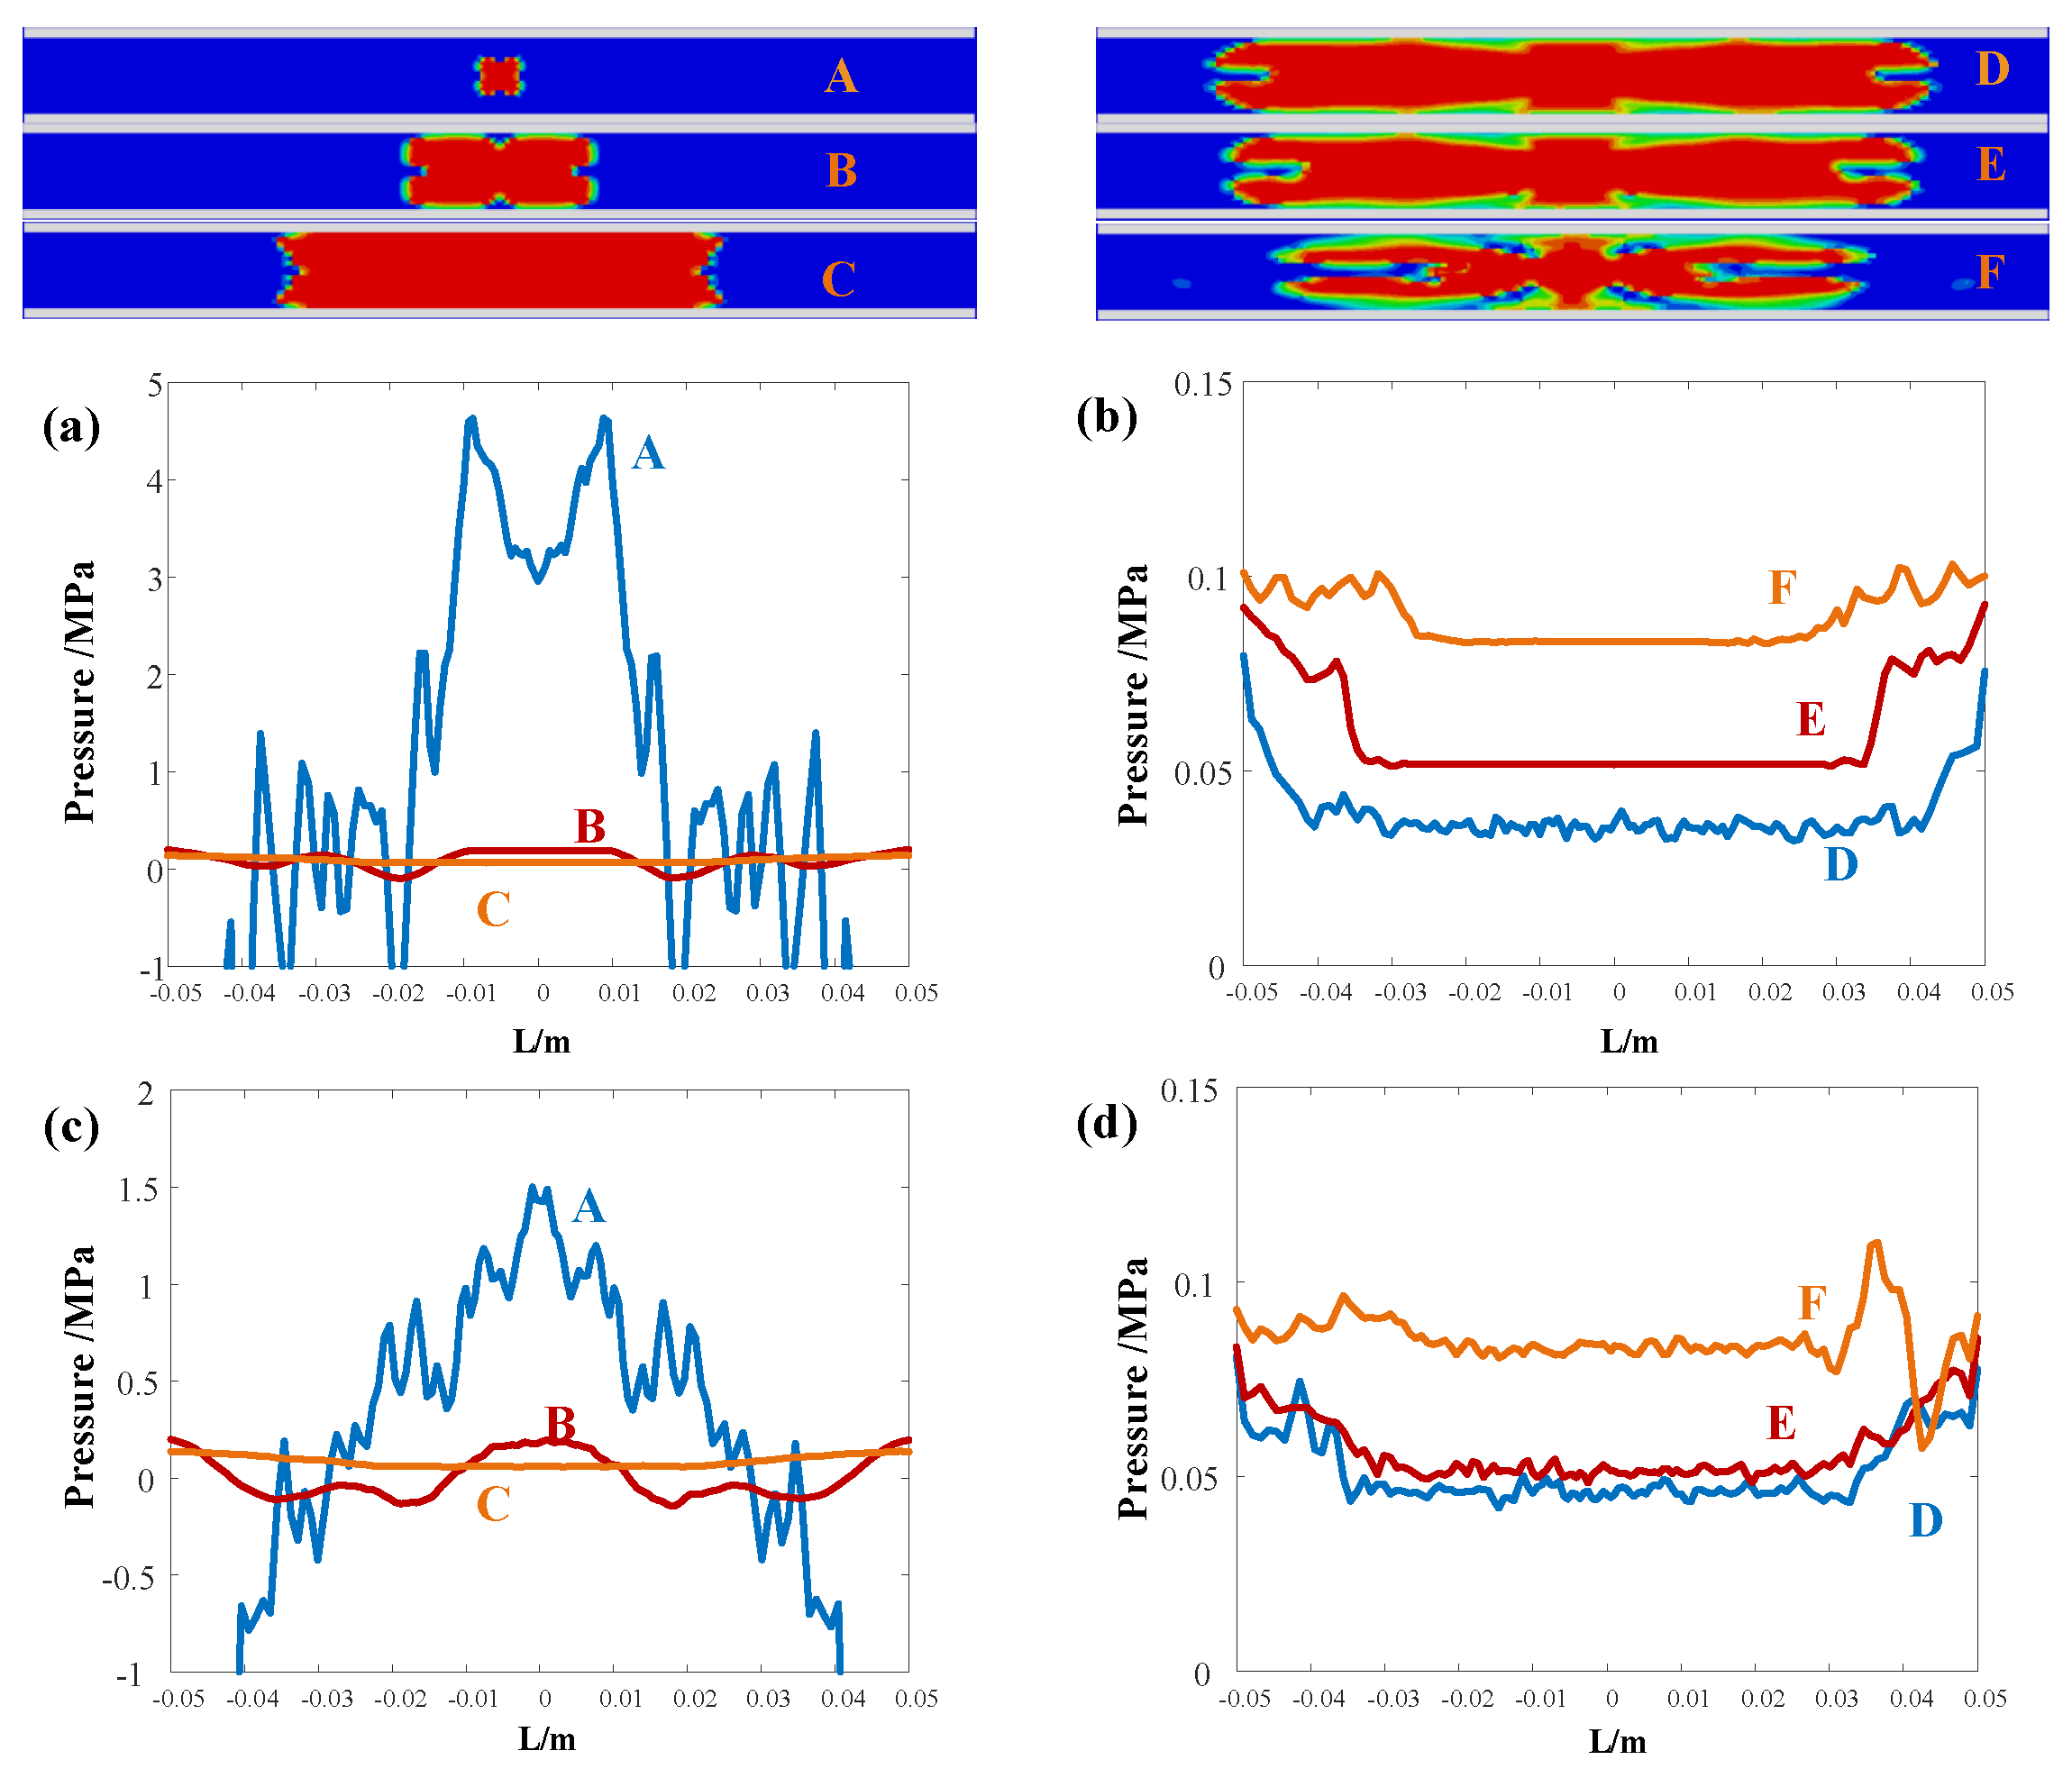
Figure 11 shows the pressure curves at several typical moments on the center line and generatrix of the tube when the initial bubble occurs at the symmetric center position, the tube length is 100 mm, and the diameter is 10 mm. This result is obtained by numerical simulation. Images A, B, and C on the left above are bubble graphics during expansion, and images D, E, and F on the right are bubble graphics during collapse. Figure 11a,b are the pressures at the center line of the tube. It can be seen from Figure 11a that at time A, the pressure at the bubble boundary is the largest, and due to the initial formation of the bubble, it causes pressure fluctuations in the tube. Then, the bubble gradually expands, the pressure fluctuation is no longer obvious, and this state lasts for a long time. In Figure 11b, during bubble collapse, the pressure at the center line gradually increases, and the wall pressure does not return to the initial pressure until the bubble collapses. In Figure 11c, A is the initial formation moment of the bubble, the pressure at the centerline point of the wall is the largest, and the pressure on the point on the wall farther away from the bubble is smaller, roughly in a parabolic distribution. B is the process of bubble expansion; the pressure on the wall drops to within the reference pressure, and the pressure in the area corresponding to the bubble diameter is higher. At moment C, the expansion speed of the bubble gradually decreases, and the pressure on the wall close to the bubble is less than the pressure at the far point, which means that the closer to the center of symmetry, the lower the pressure, and the closer to the tube end, the greater the pressure. Figure 11d shows the pressure on the wall during the bubble collapse process. As the collapse proceeds, the pressure in the tube gradually increases as a whole, and the pressure at the tube end is always greater than the pressure at the center. The shape of the pressure curve changes slightly during the collapse process but is basically the same.
After considering the changes in bubble morphology and wall pressure in the tube, the state of the vortex ring outside the tube caused by the circular tube pressure is further studied numerically. Figure 12 shows the pressure and velocity of the surrounding liquid when the initial bubble occurs at the symmetry center, the tube length is 100 mm, and the tube diameter is 10 mm. Figure 12a shows the pressure change caused by the movement of the bubble. When the bubble is first generated, due to the instantaneous energy change, expansion waves as shown in the figure appear on both sides of the tube. During the expansion of the bubble, the tube end expands, generating pressure away from the tube. In the figure, periodic annular pressure changes can be observed, that is, the vortex ring outside the tube is generated due to the movement of the bubble. Figure 12b shows the velocity of the liquid around the tube. In the figure, it can be observed that at the moment of the initial generation of the bubble, the bubble did not develop, so it did not push the liquid in the tube to flow. As the bubble expands, due to the increase in the volume of the bubble, the liquid around the bubble is expelled from the tube, generating a velocity gradient. When the bubble collapses, the direction of acceleration changes. Since the liquid is away from the tube end for a distance, it may affect the movement of the liquid at this time. This is related to the parameters of the tube and the bubble. However, it does not affect the overall flow direction of the liquid. The flow direction of the liquid is consistent with the movement of the vortex ring.

4.3. Vortex Ring Oscillation Period

Vortex ring cavitation caused by underwater jets is a less common phenomenon that makes the jet more erosive than a single-phase liquid jet. Due to the frequent changes in the pressure field, the pressure oscillation of the cavitation bubble can enhance the erosion effect. When the pressure inside the vortex ring core is lower than the vapor pressure of the surrounding liquid, a cavity appears, presenting a clear gas–liquid interface. In the analysis of the bubble movement in the short tube, it can be seen that the movement of the bubble causes the pressure of the liquid to change, resulting in the generation of vortex rings. Vortex ring cavitation occurs when the pressure of the annular core of the vortex ring is lower than the vapor pressure of the surrounding liquid. By generating bubbles in a rigid tube, a pressure difference between the inside and outside of the tube is created so that a vortex ring is generated outside the tube. The experimental results show that under the influence of the surrounding vortex flow field, the vortex ring maintains a state of continuous oscillation, and the period of oscillation depends largely on the maximum cross-sectional radius of the vortex ring and the circulation effect of the vortex flow.
The physical properties of spherical cavitation bubbles can be established by numerical models, but there are few studies on the behavior of vortex rings. The appearance of vortex rings depends largely on the velocity of the jet. Chahine and Genoux (1983a) [32] proposed a theoretical model of vortex rings and provided a method to predict the oscillation period and amplitude of their cross-section. Figure 13 is a schematic diagram of vortex ring parameters.
As shown in the figure, the cavitation volume is simplified into an axisymmetric annular cavity with a circular cross-sectional shape. The average radius of its cross-sectional area (R) can be calculated as follows:
R ( t ) = 1 2 H ( t )
where H ( t ) is the average thickness of the annular cavity measured from the image, as shown in Figure 13. The total radius ( A ( t ) ) of the center line of the cavity is estimated to be
A ( t ) = 1 2 ( D ( t ) H ( t ) )
where D ( t ) is the outer diameter of the annular cavity. A 0 , R 0 , H 0 , and D 0 represent the maximum values of A ( t ) , R ( t ) , H ( t ) , and D ( t ) , respectively. The shape factor ( ϵ ) is defined to describe the ratio of the transverse radius of the annular cavity to the total radius ( ϵ = R 0 / A 0 ). The axial distance between the annular cavity and the nearest tube end is recorded as S ( t ) .
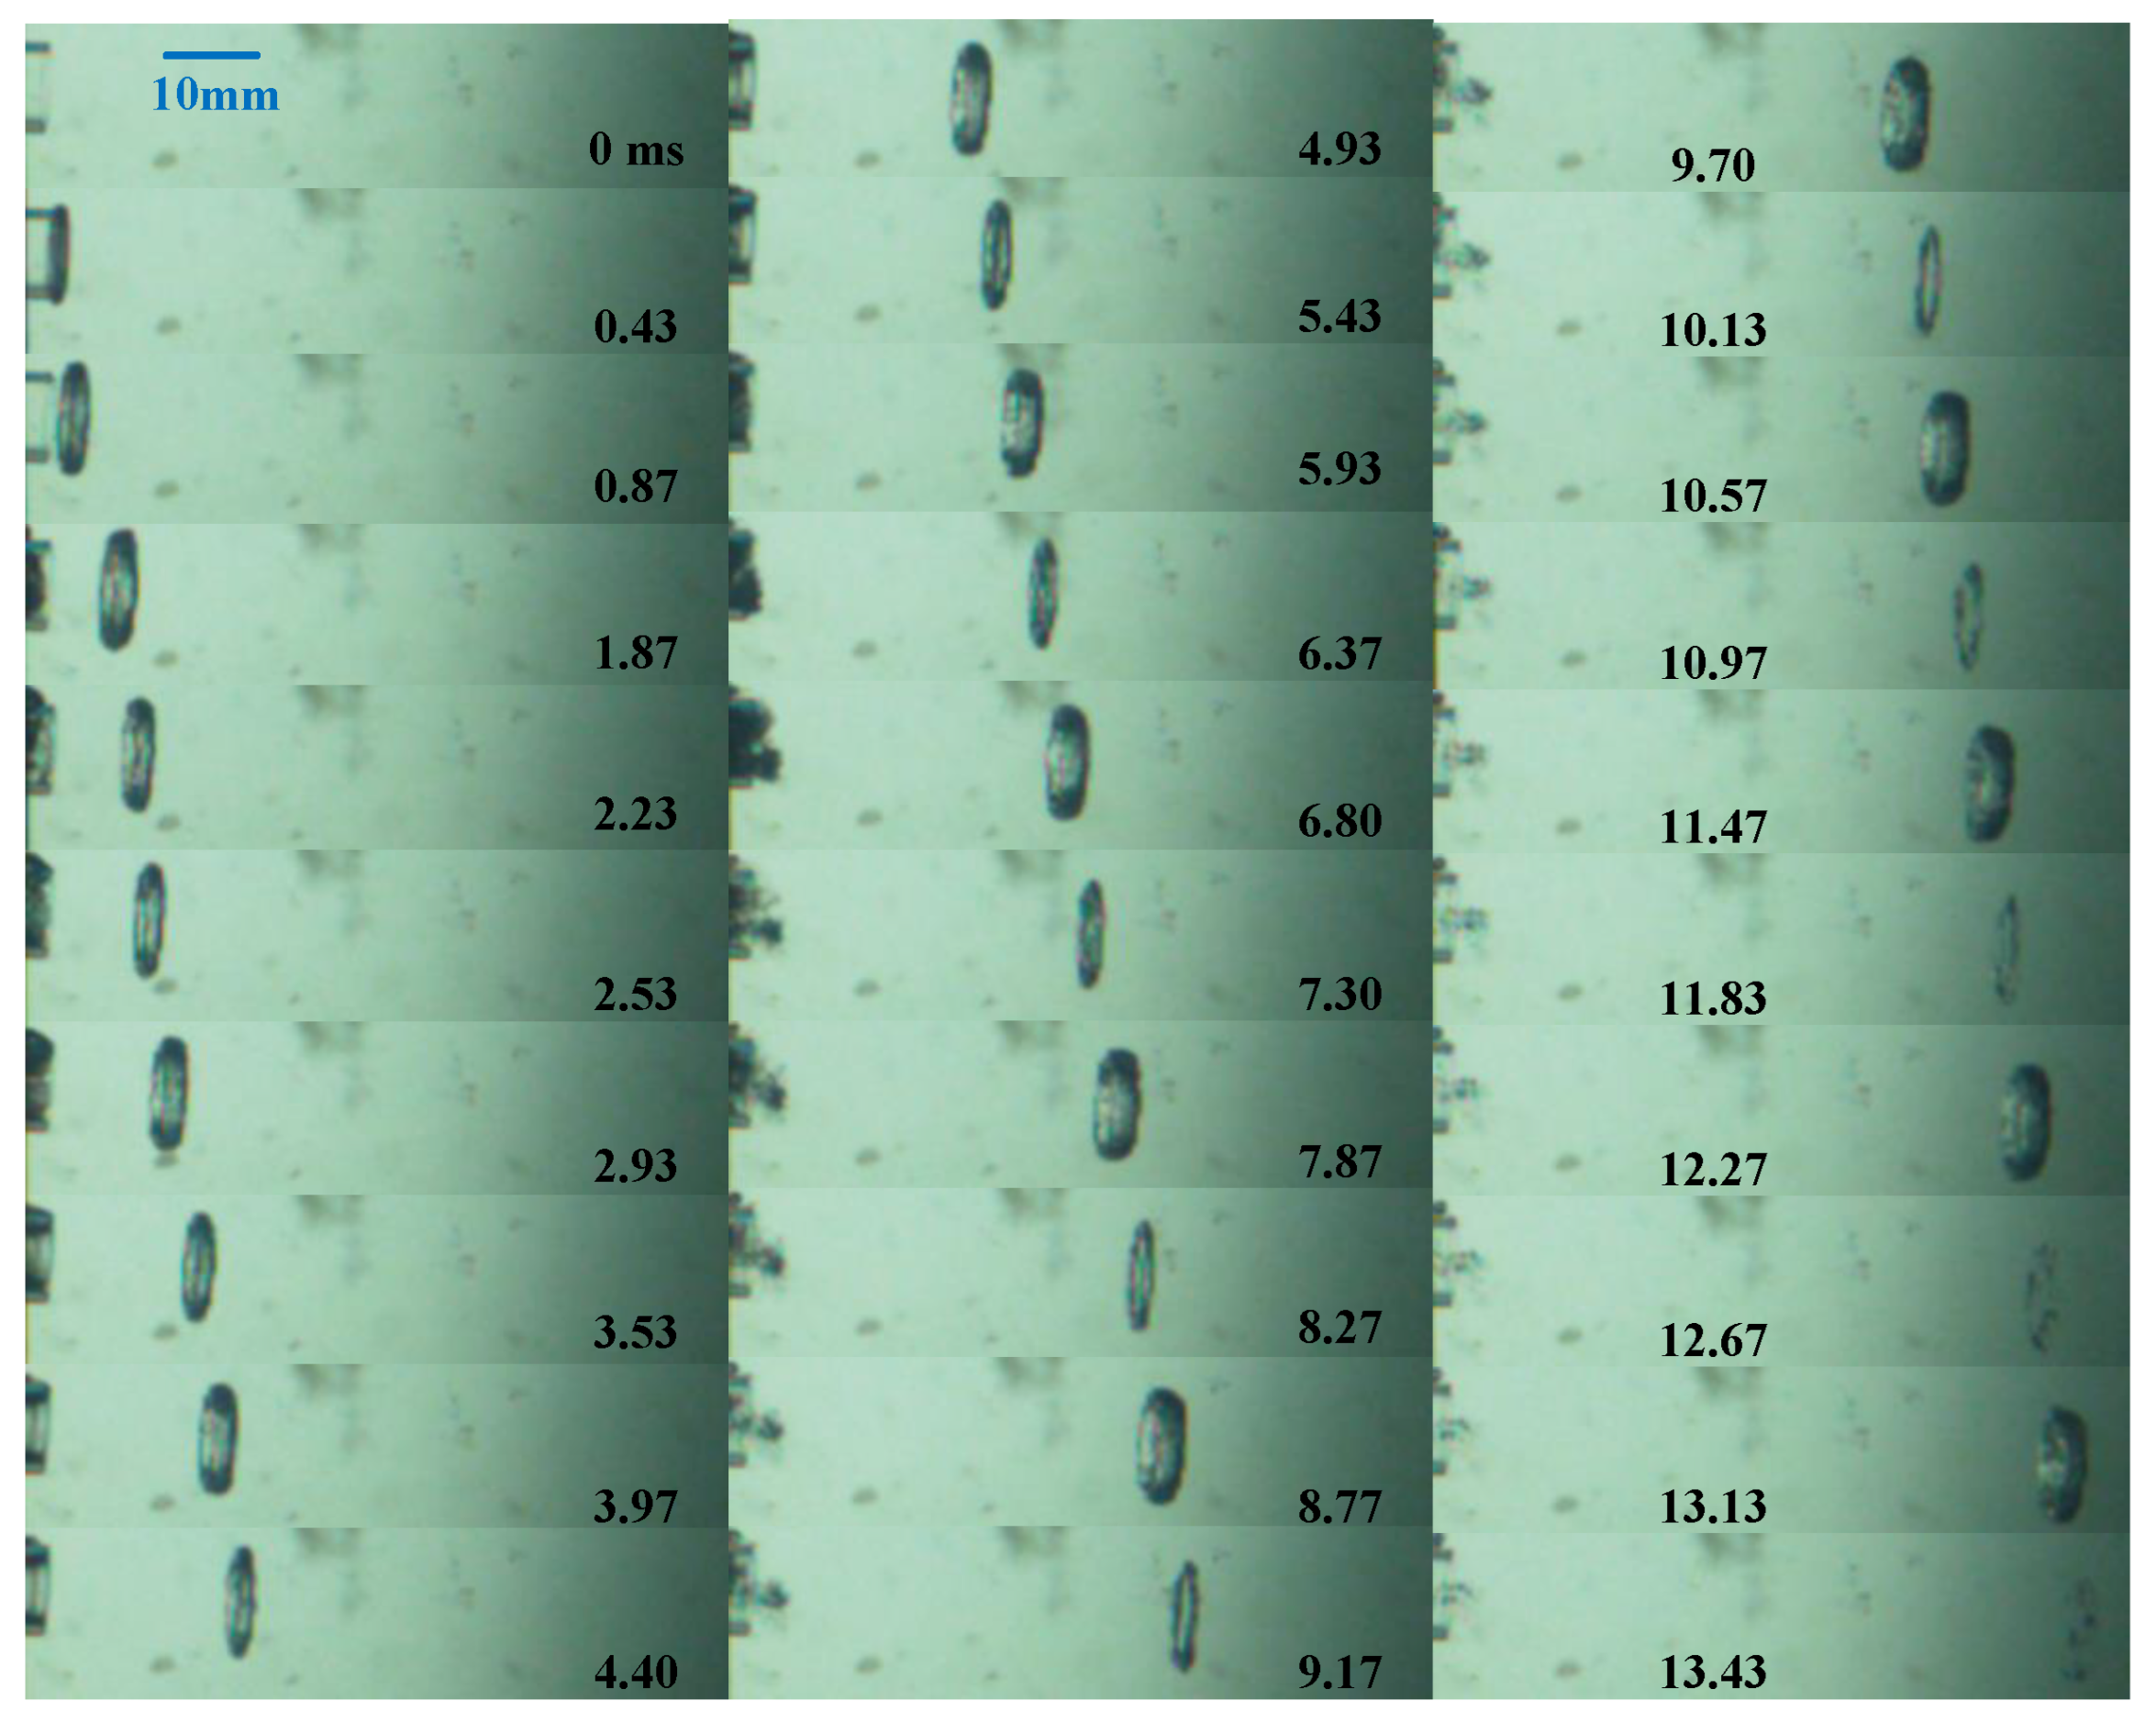
For the free oscillation of the vortex ring generated by the influence of the spark bubble in the tube, the typical development of the vortex ring is shown in Figure 7, where the bubble occurs at t = 0 . As shown in the figure, at t = 0.83 ms, a vortex ring is formed near the end of the tube, and the bubble in the tube is in an expanding state. After the vortex ring is generated, it continues to move in the axial direction away from the tube. When the vortex ring first appears, the total radius (A) of the vortex ring is close to the radius of the tube. When the bubble reaches the maximum volume at 2.33 ms, the vortex ring begins to shrink. In addition, the axial direction of the vortex ring does not move significantly compared with 2.90 ms. This is due to the attraction of the bubbles in the tube to the fluid around the tube during the collapse process. In the movement after the vortex ring, the rebound of the bubbles in the tube is weak, and the effect on the vortex ring can be ignored. The vortex ring continues to move in the axial direction away from the tube, and at the same time, it also oscillates in the radial direction.
Figure 14 shows the multiple periods of vortex rings generated by the electric spark bubbles in the tube in Figure 7.
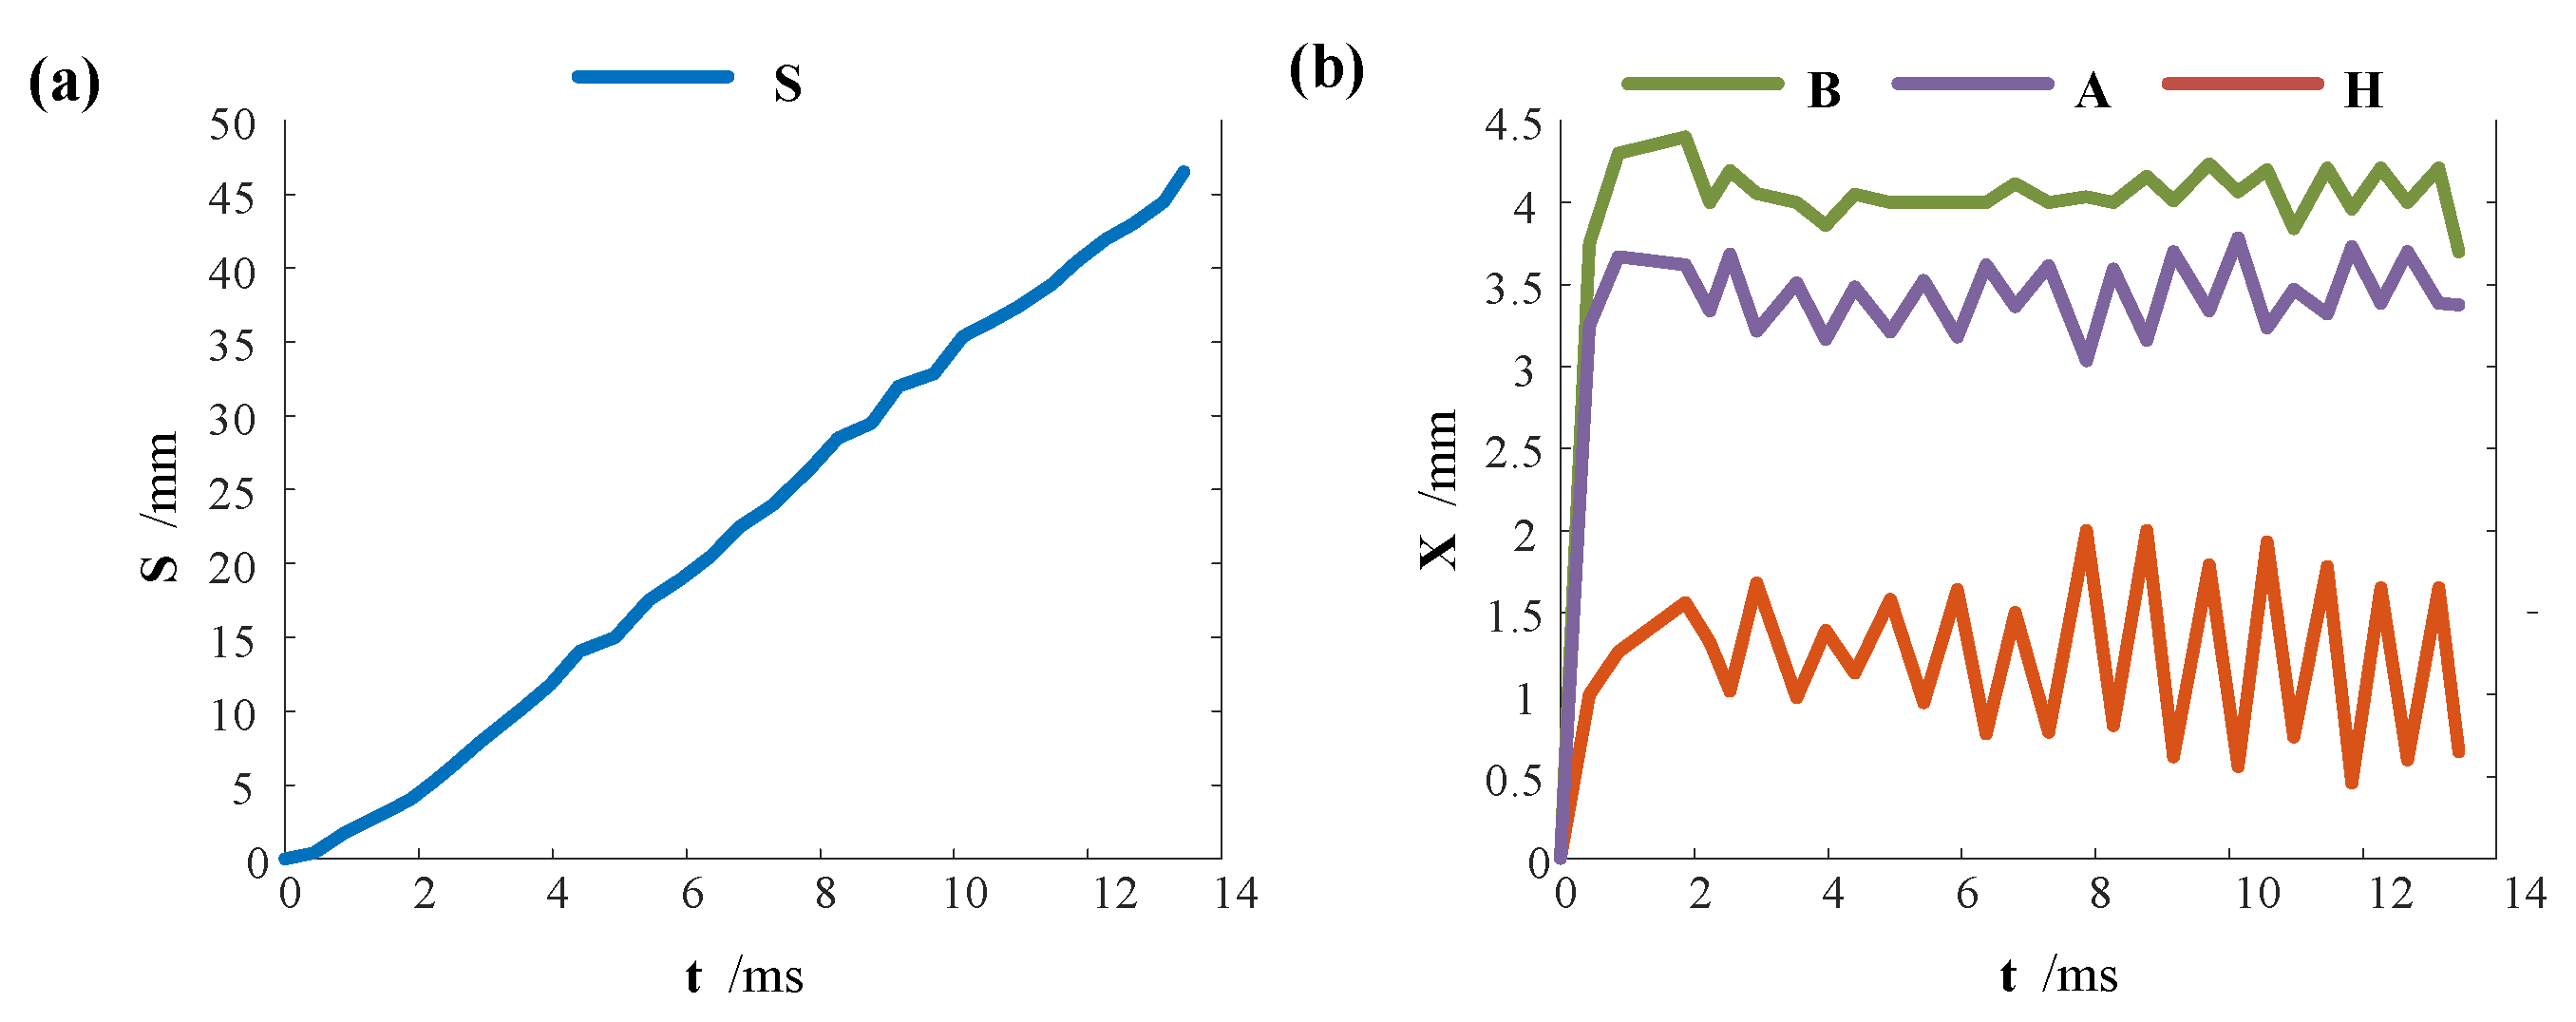
In order to analyze the shape and movement of the vortex ring, the relationship between the vortex ring displacement (S) and the vortex ring thickness and time is plotted as shown in Figure 15. Figure 15a shows the relationship between the distance (S) between the tube and the vortex ring and time, which is approximately a regular ramp function, which means that the vortex ring translates at an approximately constant speed ( V t ). The average speed of the vortex ring in this case is about 3.46 m/s. In addition, it shows, from another perspective, that the expansion and collapse process of the bubble in the tube does not affect the moving speed of the vortex ring. At t = 3.63 ms, the bubble in the tube collapses to the minimum volume. The oscillation of the vortex ring is divided into three parts. In the early stage, the vortex ring is affected by the movement of the bubbles in the tube, producing several irregular cycles. For example, sometimes, the bubbles in the tube contact the primary vortex ring, affecting the thickness and total radius of the vortex ring. In the middle stage of the oscillation, the dissipation of energy weakens the influence of the bubbles in the tube on the vortex ring, and the average thickness and amplitude become stable.
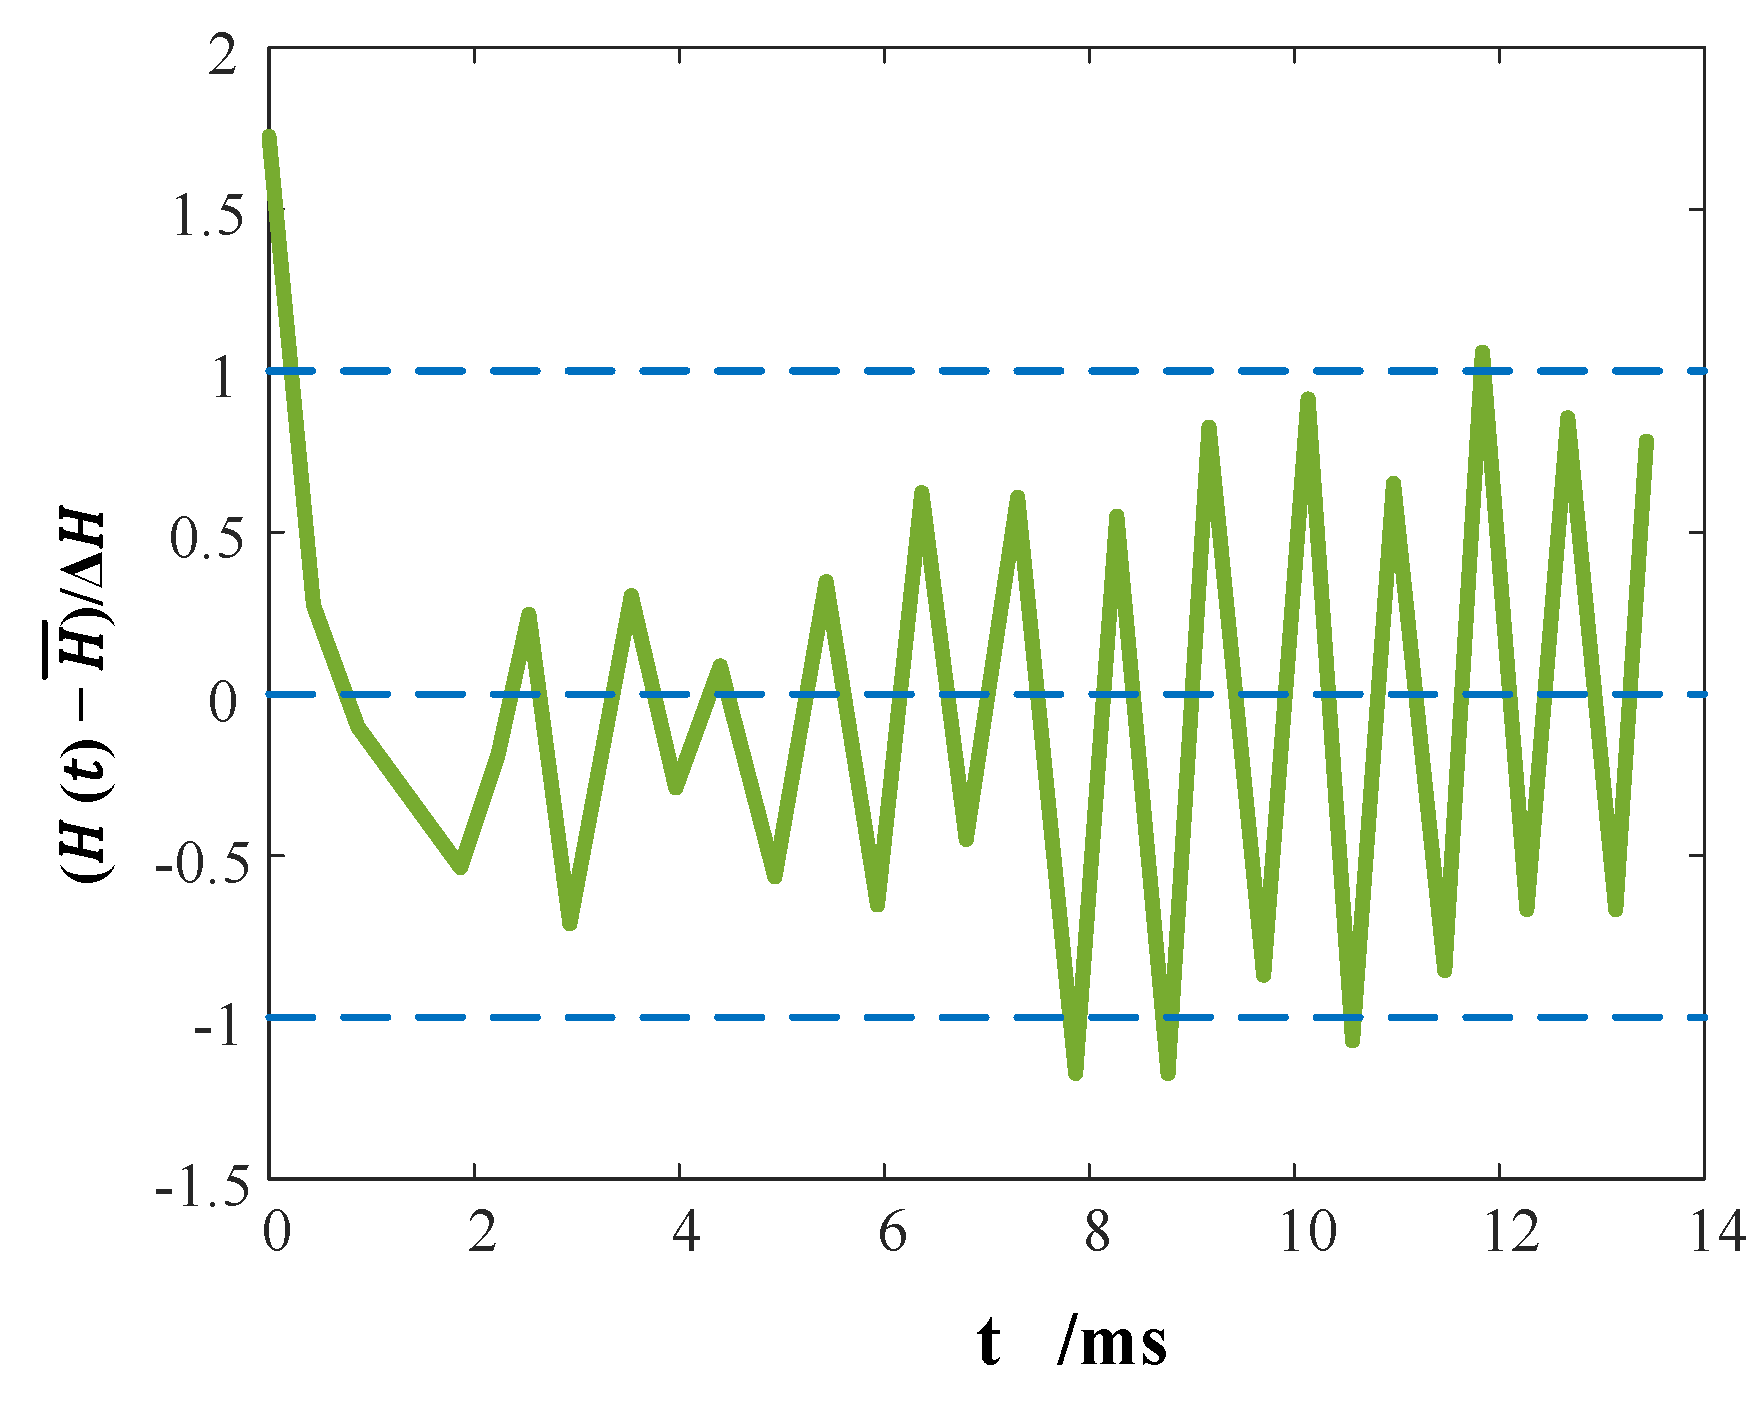
At this stage, the outer radius ( B ( t ) ), thickness ( H ( t ) ), and total radius ( A ( t ) ) show similar oscillation periods, but the oscillation periods of H ( t ) and A ( t ) are almost opposite. In the later stage of oscillation, the axial motion of the vortex ring still maintains a roughly consistent speed. The total radius of the vortex ring itself remains basically stable, but the amplitude of the thickness ( H ( t ) ) of the vortex ring changes more, which is caused by the long-term dissipation of motion energy. The transverse radial oscillations are measured in units using the dimensionless thickness ( ( H ( t ) H ¯ ) / Δ H ), as shown in Figure 16, which describes the average thickness and oscillation amplitude during the vortex ring process.

5. Dynamic Characteristics of a Bubble in Longer Tubes

Similar to the study of bubble morphology in short tubes, the bubble morphology in the tube is observed and explained from the symmetric and asymmetric states, and the flow field changes in the tube caused by bubbles are discussed.

5.1. Bubble Collapse

5.1.1. Symmetric Bubble Collapse

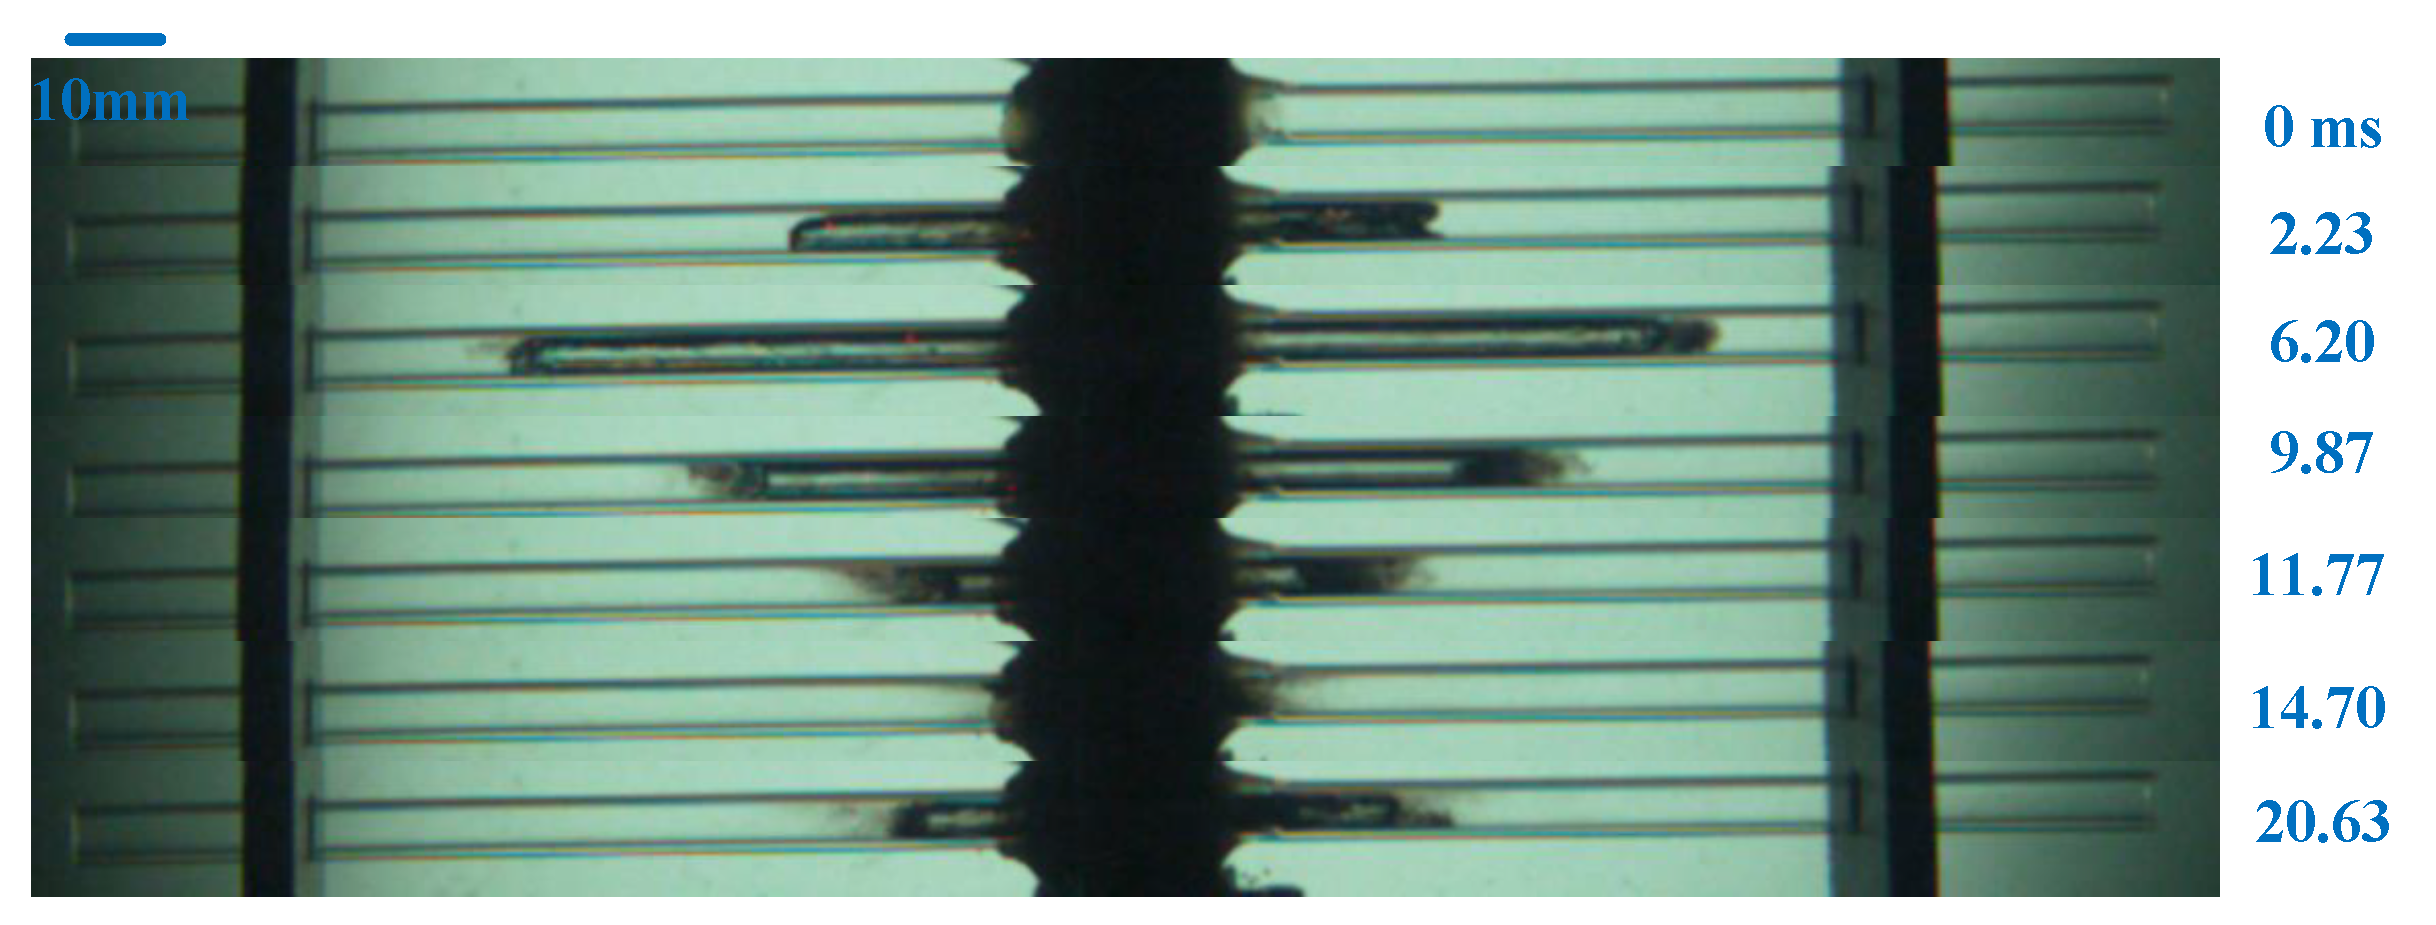
Figure 17 shows the experimental results of a tube with a diameter of 6 mm when the initial bubble is at the symmetry center ( η b = 0.5 ). It can be seen that during the expansion process, the bubble expands in the tube along the symmetry center and drives the water flow in the tube to move. At 6.20 ms, the bubble reaches the maximum volume in the tube. Similar to the description in the previous section, the expansion speed of the two ends of the bubble is significantly greater than that of the middle section, and the bubble gradually changes from an ellipsoid to a cylindrical shape, which is related to the diameter of the tube and the size of the bubble. Afterwards, the bubble enters the collapse stage, and the bubble is also symmetrical during this process. During the collapse process, the two ends of the bubble begin to collapse first. In addition, after the bubble is completely collapsed, it continues to expand in the second cycle. As shown in Figure 17, at 20.63 ms, the bubble shape is still symmetrical. Under this parameter, no vortex ring is generated at the end of the tube, and no other jet phenomenon is observed in the tube. There is no pumping effect in the subsequent movement process.

5.1.2. Asymmetric Bubble Collapse

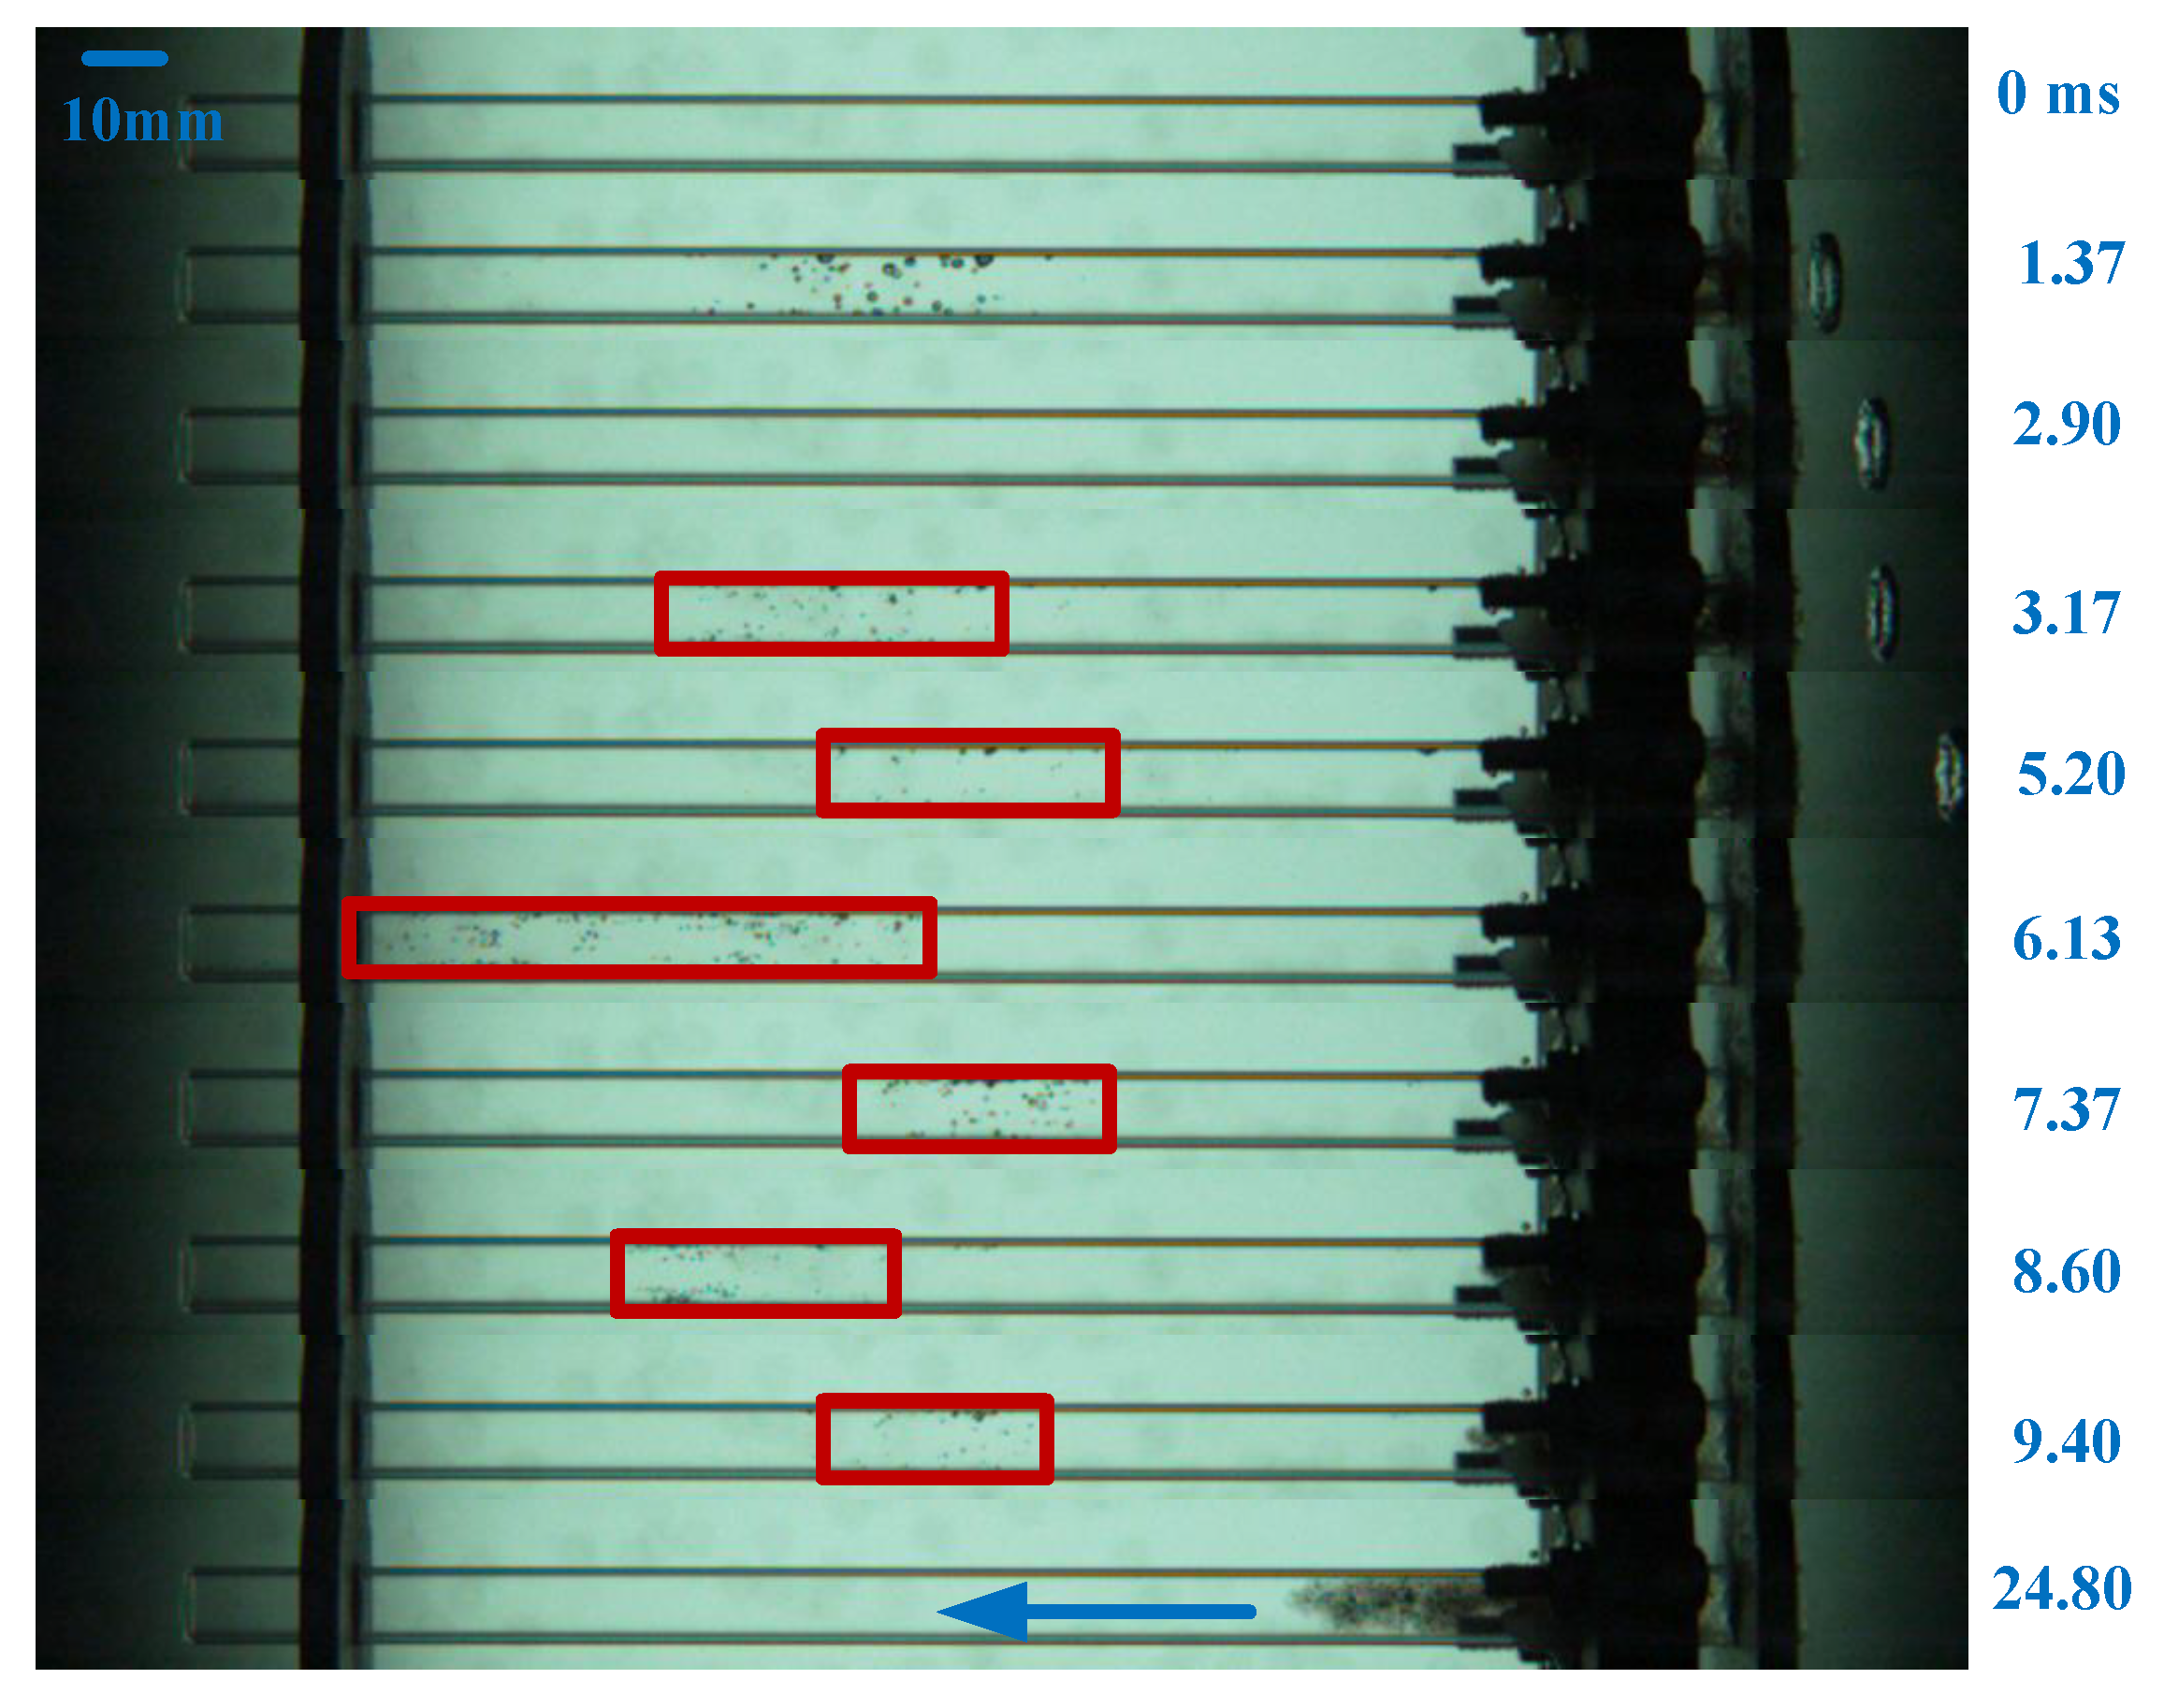
For bubbles in a tube under asymmetric conditions, bubble collapse is described and studied by changing the diameter of the tube ( γ t ) and the location of the initial bubble ( η b ). Figure 18, Figure 19, Figure 20 and Figure 21 are the bubble morphologies in the tube under the conditions of η b = 0.2 , with a diameters of 6 mm, 20 mm, 30 mm, and 50 mm, respectively. Figure 17 and Figure 18 are comparisons of symmetric and asymmetric bubble collapse under the same tube diameter. As shown in the figure, at 3.33 ms, the volume of the bubble on the right is larger, the length of the liquid column in the right area is smaller than that in the left area, and the bubble movement speed in the right area is faster. When the bubble collapses asymmetrically, the position of the collapse point shifts toward the center of the tube. Since the electric spark bubble used in this paper has impurities after collapse, the movement of the impurities can be used to determine the flow direction of the liquid in the tube after collapse. At 8.03 ms, the bubble on the right collapses first, and the collapse speed is faster than that of the bubble on the left. At 13.93 ms, the collapsed bubble on the right has moved to the left and pushed the entire bubble toward the long tube end. At 31.03 ms, the flow direction of the liquid in the tube can be more clearly observed; the direction of the blue arrow is the movement direction of the fluid in the tube guided by the jet and the pressure in the tube.
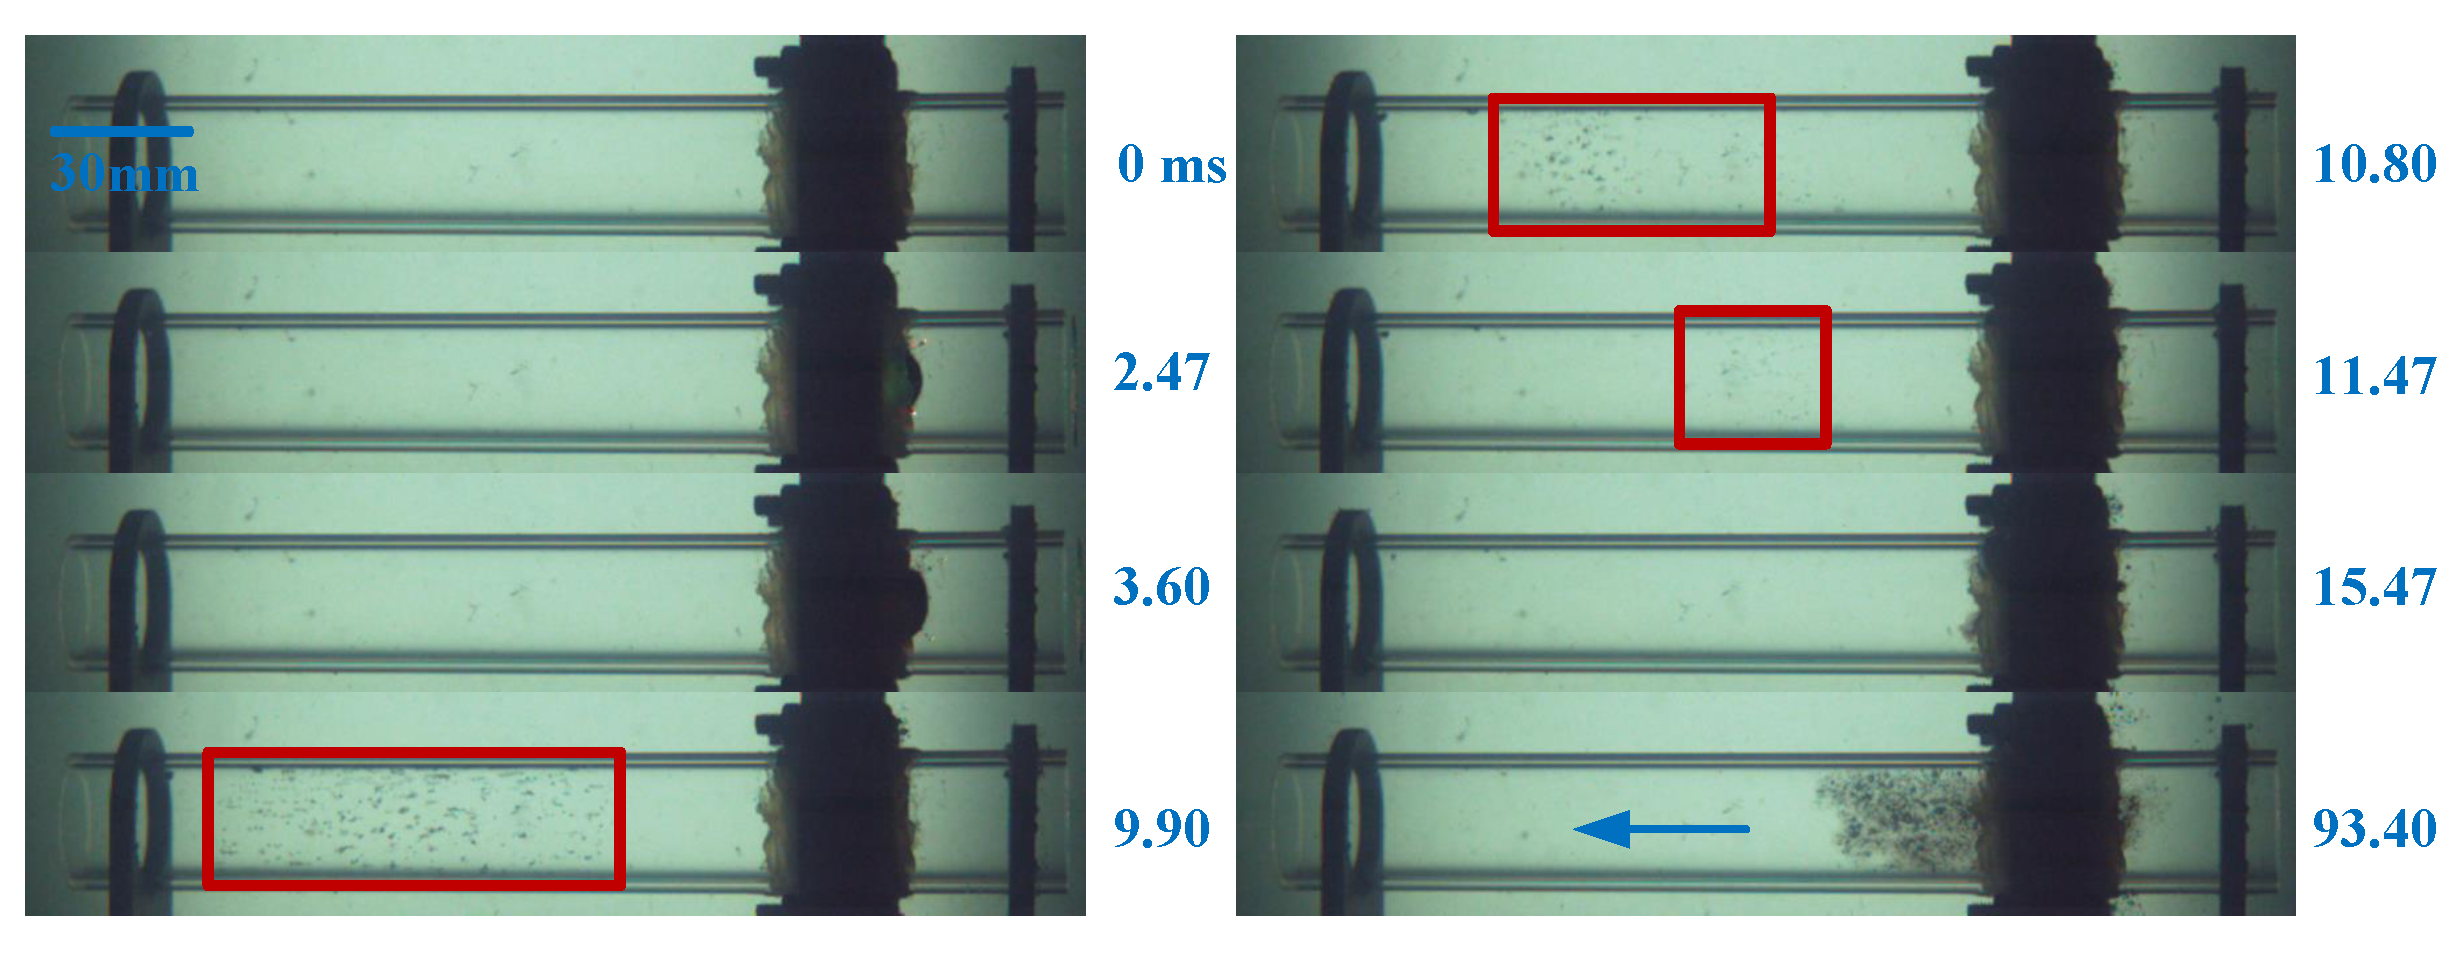
Figure 19 and Figure 20 show the morphology of bubbles and the flow law of liquid in the tube under the condition of a larger tube diameter of γ t = 1.37 . Unlike Figure 18, secondary cavitation is found in the tube. When the bubbles in the tube collapse and rebound, a large number of bubbles is formed in the tube. These bubbles are caused by the pulsating pressure after the initial bubble collapse, so they are called secondary cavitation. As shown in Figure 19, the tiny bubble group in the red frame at 10.10 ms in the tube is the secondary cavitation phenomenon in the tube.
Secondary cavitation exists in the form of a large number of small bubbles in groups. The small bubbles gradually grow larger, and the area becomes smaller. Under the conditions of continuous movement of bubbles in the tube and changes in pressure, multiple cavitations also occur, as shown in the 10.73 ms, 11.43 ms, and 11.97 ms images. The study of the cycle and position of multiple cavitations is discussed in the next section. In addition, after the secondary cavitation collapses, the impurities of the initial bubble collapse move to the left end of the tube, which means that a jet is formed in the tube, guiding the liquid in the tube to move. Figure 20 shows the bubble morphology in the longer tube and the jet direction caused by it when the diameter is 30 mm. Its state is similar to that in Figure 19. The bubble expands asymmetrically and generates multiple secondary cavitations in the long tube area after collapse. After the secondary cavitation collapses, it moves in the opposite direction of the initial bubble, that is, the long tube direction indicated by the blue arrow.
Figure 21 shows the bubble morphology and the jet-direction state caused by the longer tube when the diameter of the tube is 50 mm. The tube diameter at this time is relatively large, which is different from the bubble state in the previous tube. Under this condition, the diameter of the bubble is smaller than the tube. At this time, the bubble deforms due to the existence of the boundary, but it does not produce a more obvious elongation effect similar to the above bubbles. The formation of secondary cavitation can still be observed at 5.40 ms, but the number is significantly reduced. Subsequently, the change in the pressure of the bubble in the tube causes a vortex ring to appear, which continues to move toward the long tube, as shown in Figure 21 (9.47–32.97 ms). This is also due to the change in the pressure in the tube caused by the collapse of the initial bubble. For a tube with a smaller diameter, this paper calculates the velocity of the fluid in the tube as the ratio of the motion displacement of the impurities of the collapsed bubble to the time, but it is not applicable to the situation where the inner vortex ring is generated. The movement of the vortex ring is not only affected by the fluid velocity but also by the combined effect of the oscillation period of the vortex ring itself.
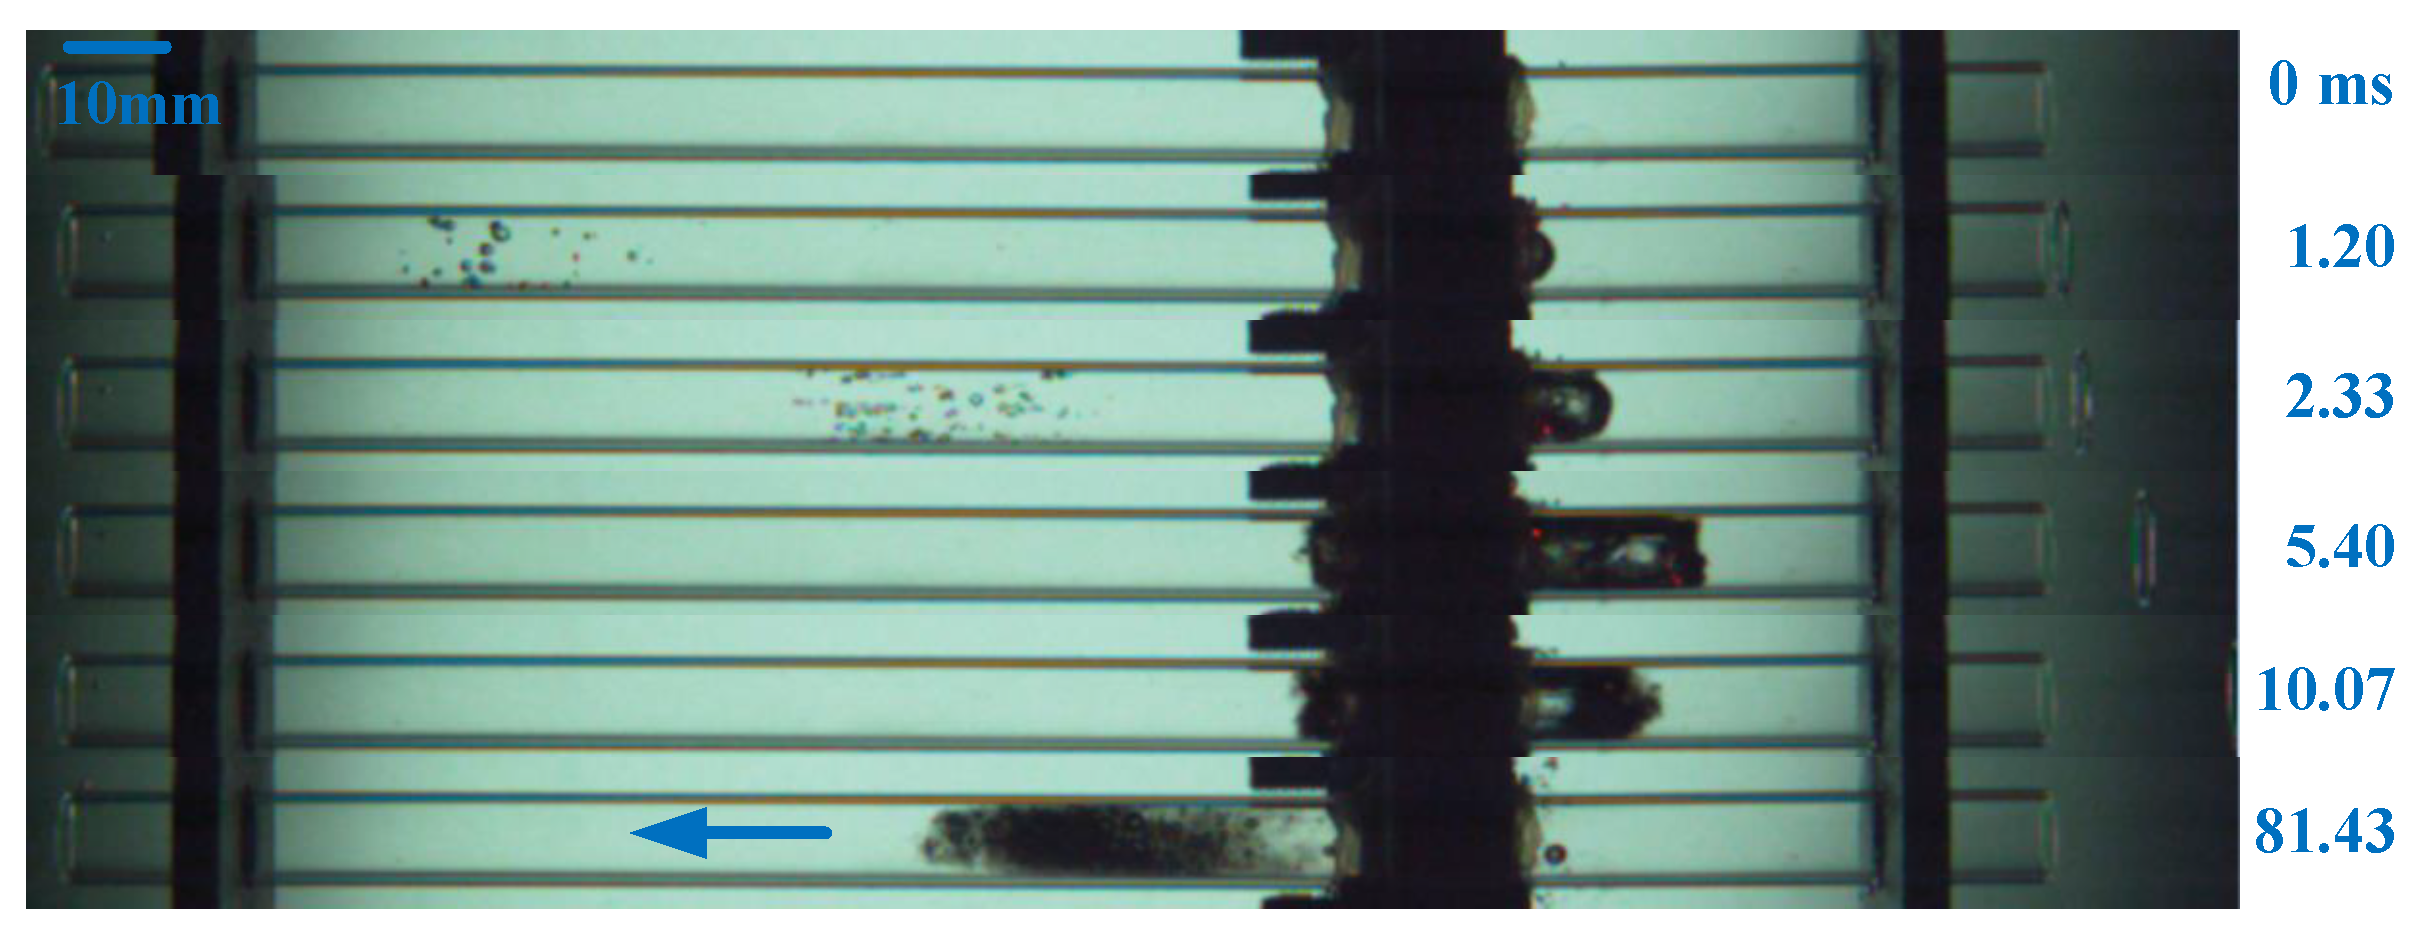
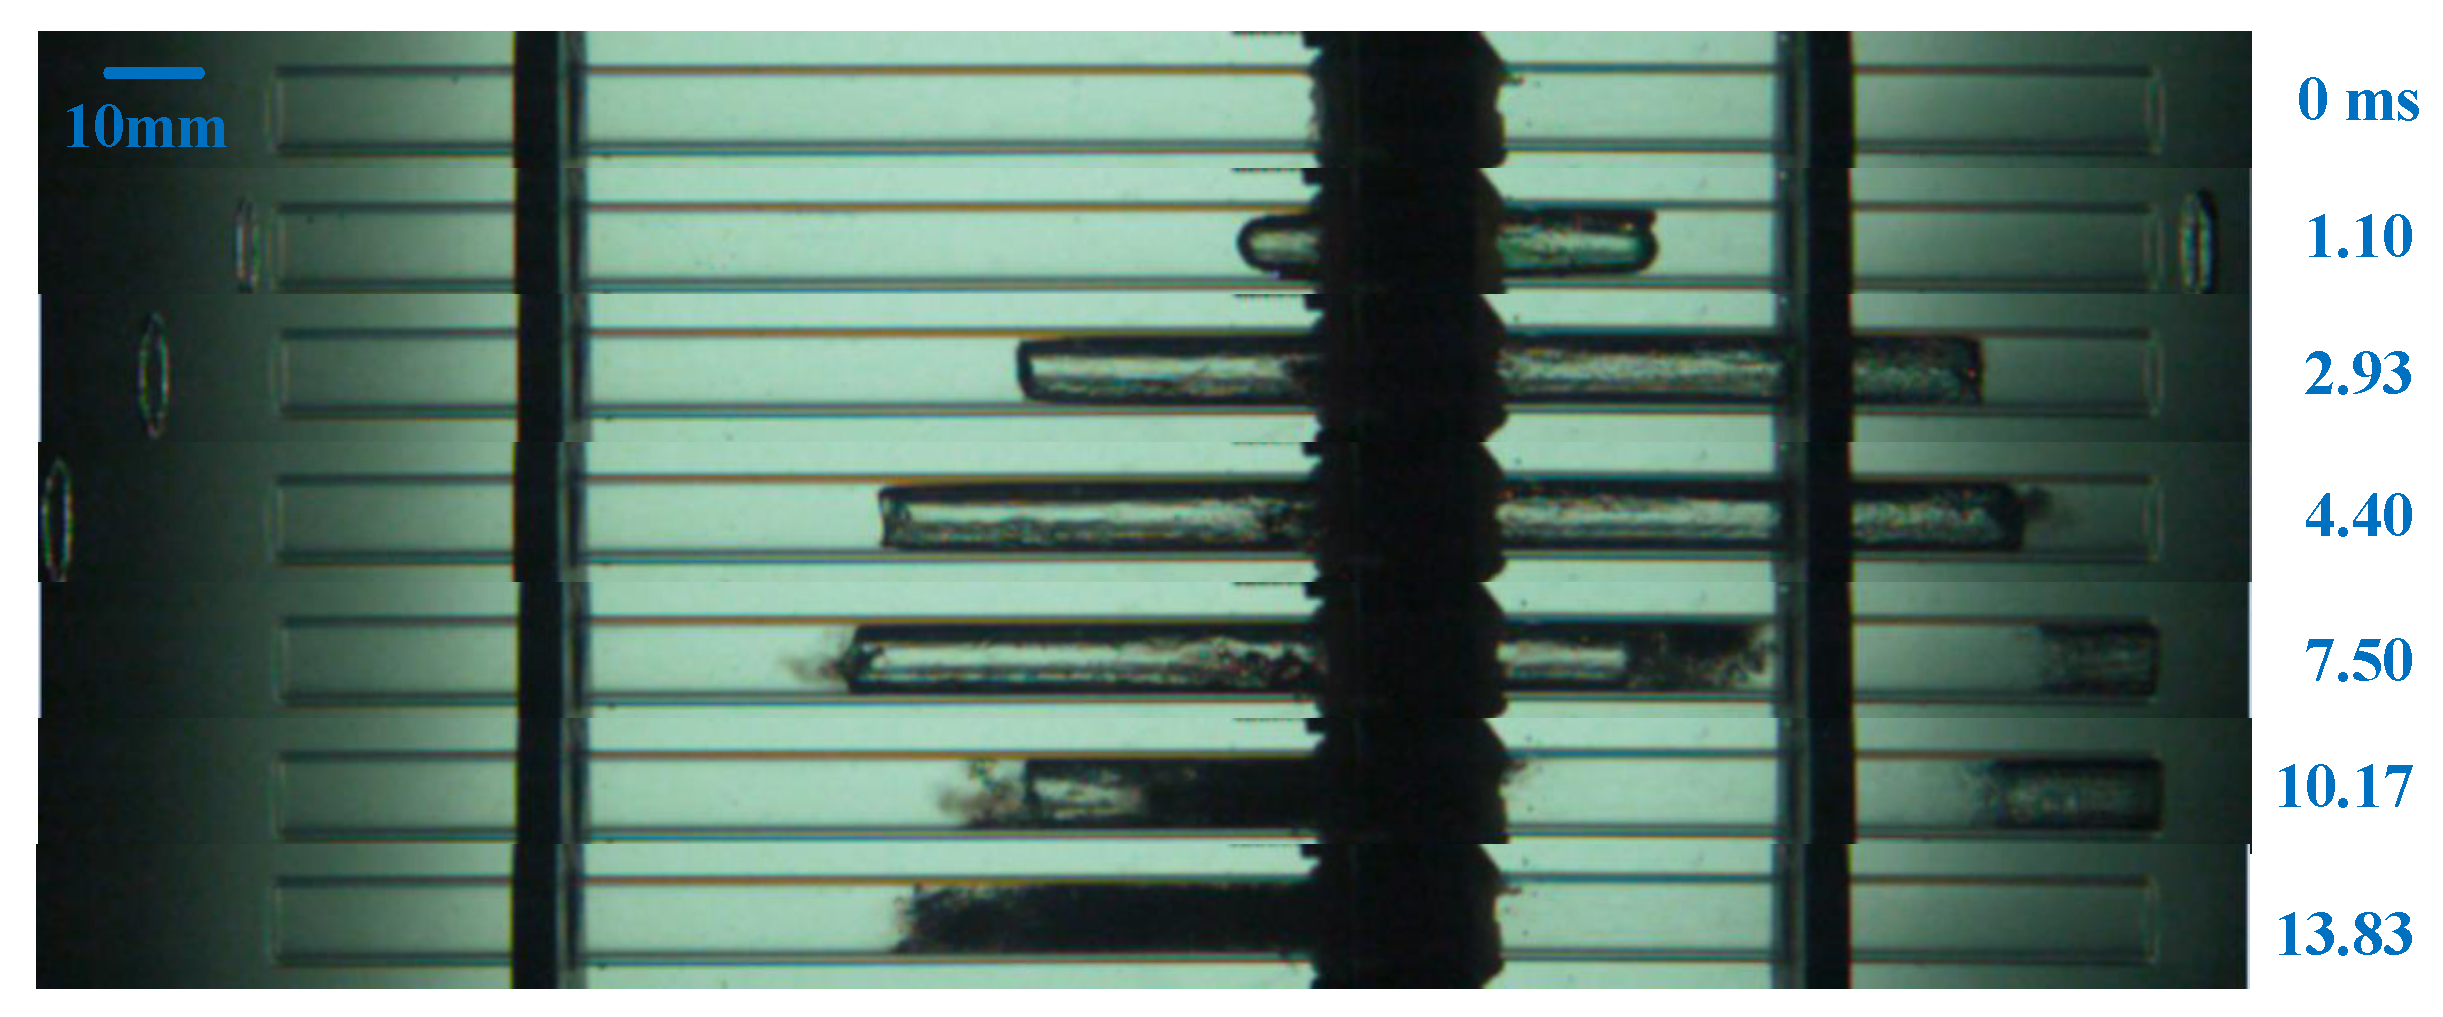
This paper also presents the bubble morphology and jet images in the tube with the same parameters of γ t and γ L but a different η b . Figure 22, Figure 23 and Figure 24 are the experimental results when the diameter of the tube is 10 mm and η b is 0.1, 0.3, and 0.4, respectively. As shown in Figure 22, due to the expansion of the bubble and the smaller size on the right, a vortex ring is generated outside the tube at the tube end, and the pressure change caused by the expansion of the bubble causes a pressure difference inside the tube, resulting in the cavitation shown at 1.37 ms. The definition of secondary cavitation in this paper is the pressure change caused by the instantaneous pressure of the bubble in the circular tube after collapse, so the cavitation at this moment is not secondary cavitation. Relatively speaking, the cavitation at 3.17 ms is the secondary cavitation defined in this paper. Under this condition, there are multiple secondary cavitations. As time increases, the direction of water flow in the tube is opposite to the initial bubble. Under this condition, the number of generated secondary cavitations is large, which means that they are more likely to occur when the tube has a small η b and the number of secondary cavitations increases.
Figure 23 and Figure 24 verify the previous argument that when the diameters of the two tubes are the same, the increase in the ratio of the two tubes makes it less likely for secondary cavitation to occur.
Figure 24 shows the bubble shape in the tube better. The right side has a larger bubble volume, indicating that the expansion and collapse speed of the initial bubble on the right side are greater than those for the long tube section. At 4.40 ms, the initial bubble in the tube reaches the maximum volume. At 7.50 ms, it can be observed that as the bubble collapses, the liquid at the tube mouth is attracted to flow into the tube. The bubble at the long tube end is still elongated, which is caused by the thrust of the collapse of the short tube end. At 10.17 ms, the collapsed bubble on the right moves to the left and gradually fills the incompletely collapsed bubble on the left. Finally, the bubble that has completed collapse moves in the opposite direction of the initial bubble, as shown in Figure 24 at 13.83 ms.

5.2. Discovery of Secondary Cavitation

Typical secondary cavitation in a rigid tube with D t = 10 mm is in Figure 22. The bubble expands to its maximum volume at 2.90 ms, at which time the right surface of the bubble begins to shrink first. The right bubble collapses earlier than the left bubble. This phenomenon is caused by the momentum imbalance of the liquid column in the two asymmetric tubes separated by the spark bubble. The first secondary cavitation appears 3.17 ms after the initial bubble collapses. At a position far away from the initial bubble, a cavitation cloud composed of a group of small bubbles can be observed. This cavitation cloud gradually shrinks with time and ultimately disappears. Under this condition, “secondary cavitation” generated again at another position in the tube until the end. In addition, Ji [16] systematically studied the phenomenon of secondary cavitation. Here, some experiments reported in this article are compared with the experimental results of Ji. Due to the difference in experimental devices, the positions of the left and right edges of the secondary cavitation are mainly compared, as shown in the Figure 25. It can be found in the figure that due to the differences in tube diameter and bubble size, the time of secondary cavitation generation is deviated. However, for the occurrence position of the initial bubble ( η b = 0.2 ), the edge change trend of the secondary cavitation is the same, and the position where the secondary cavitation ends is basically the same, which is in good agreement with Ji’s experimental phenomenon.
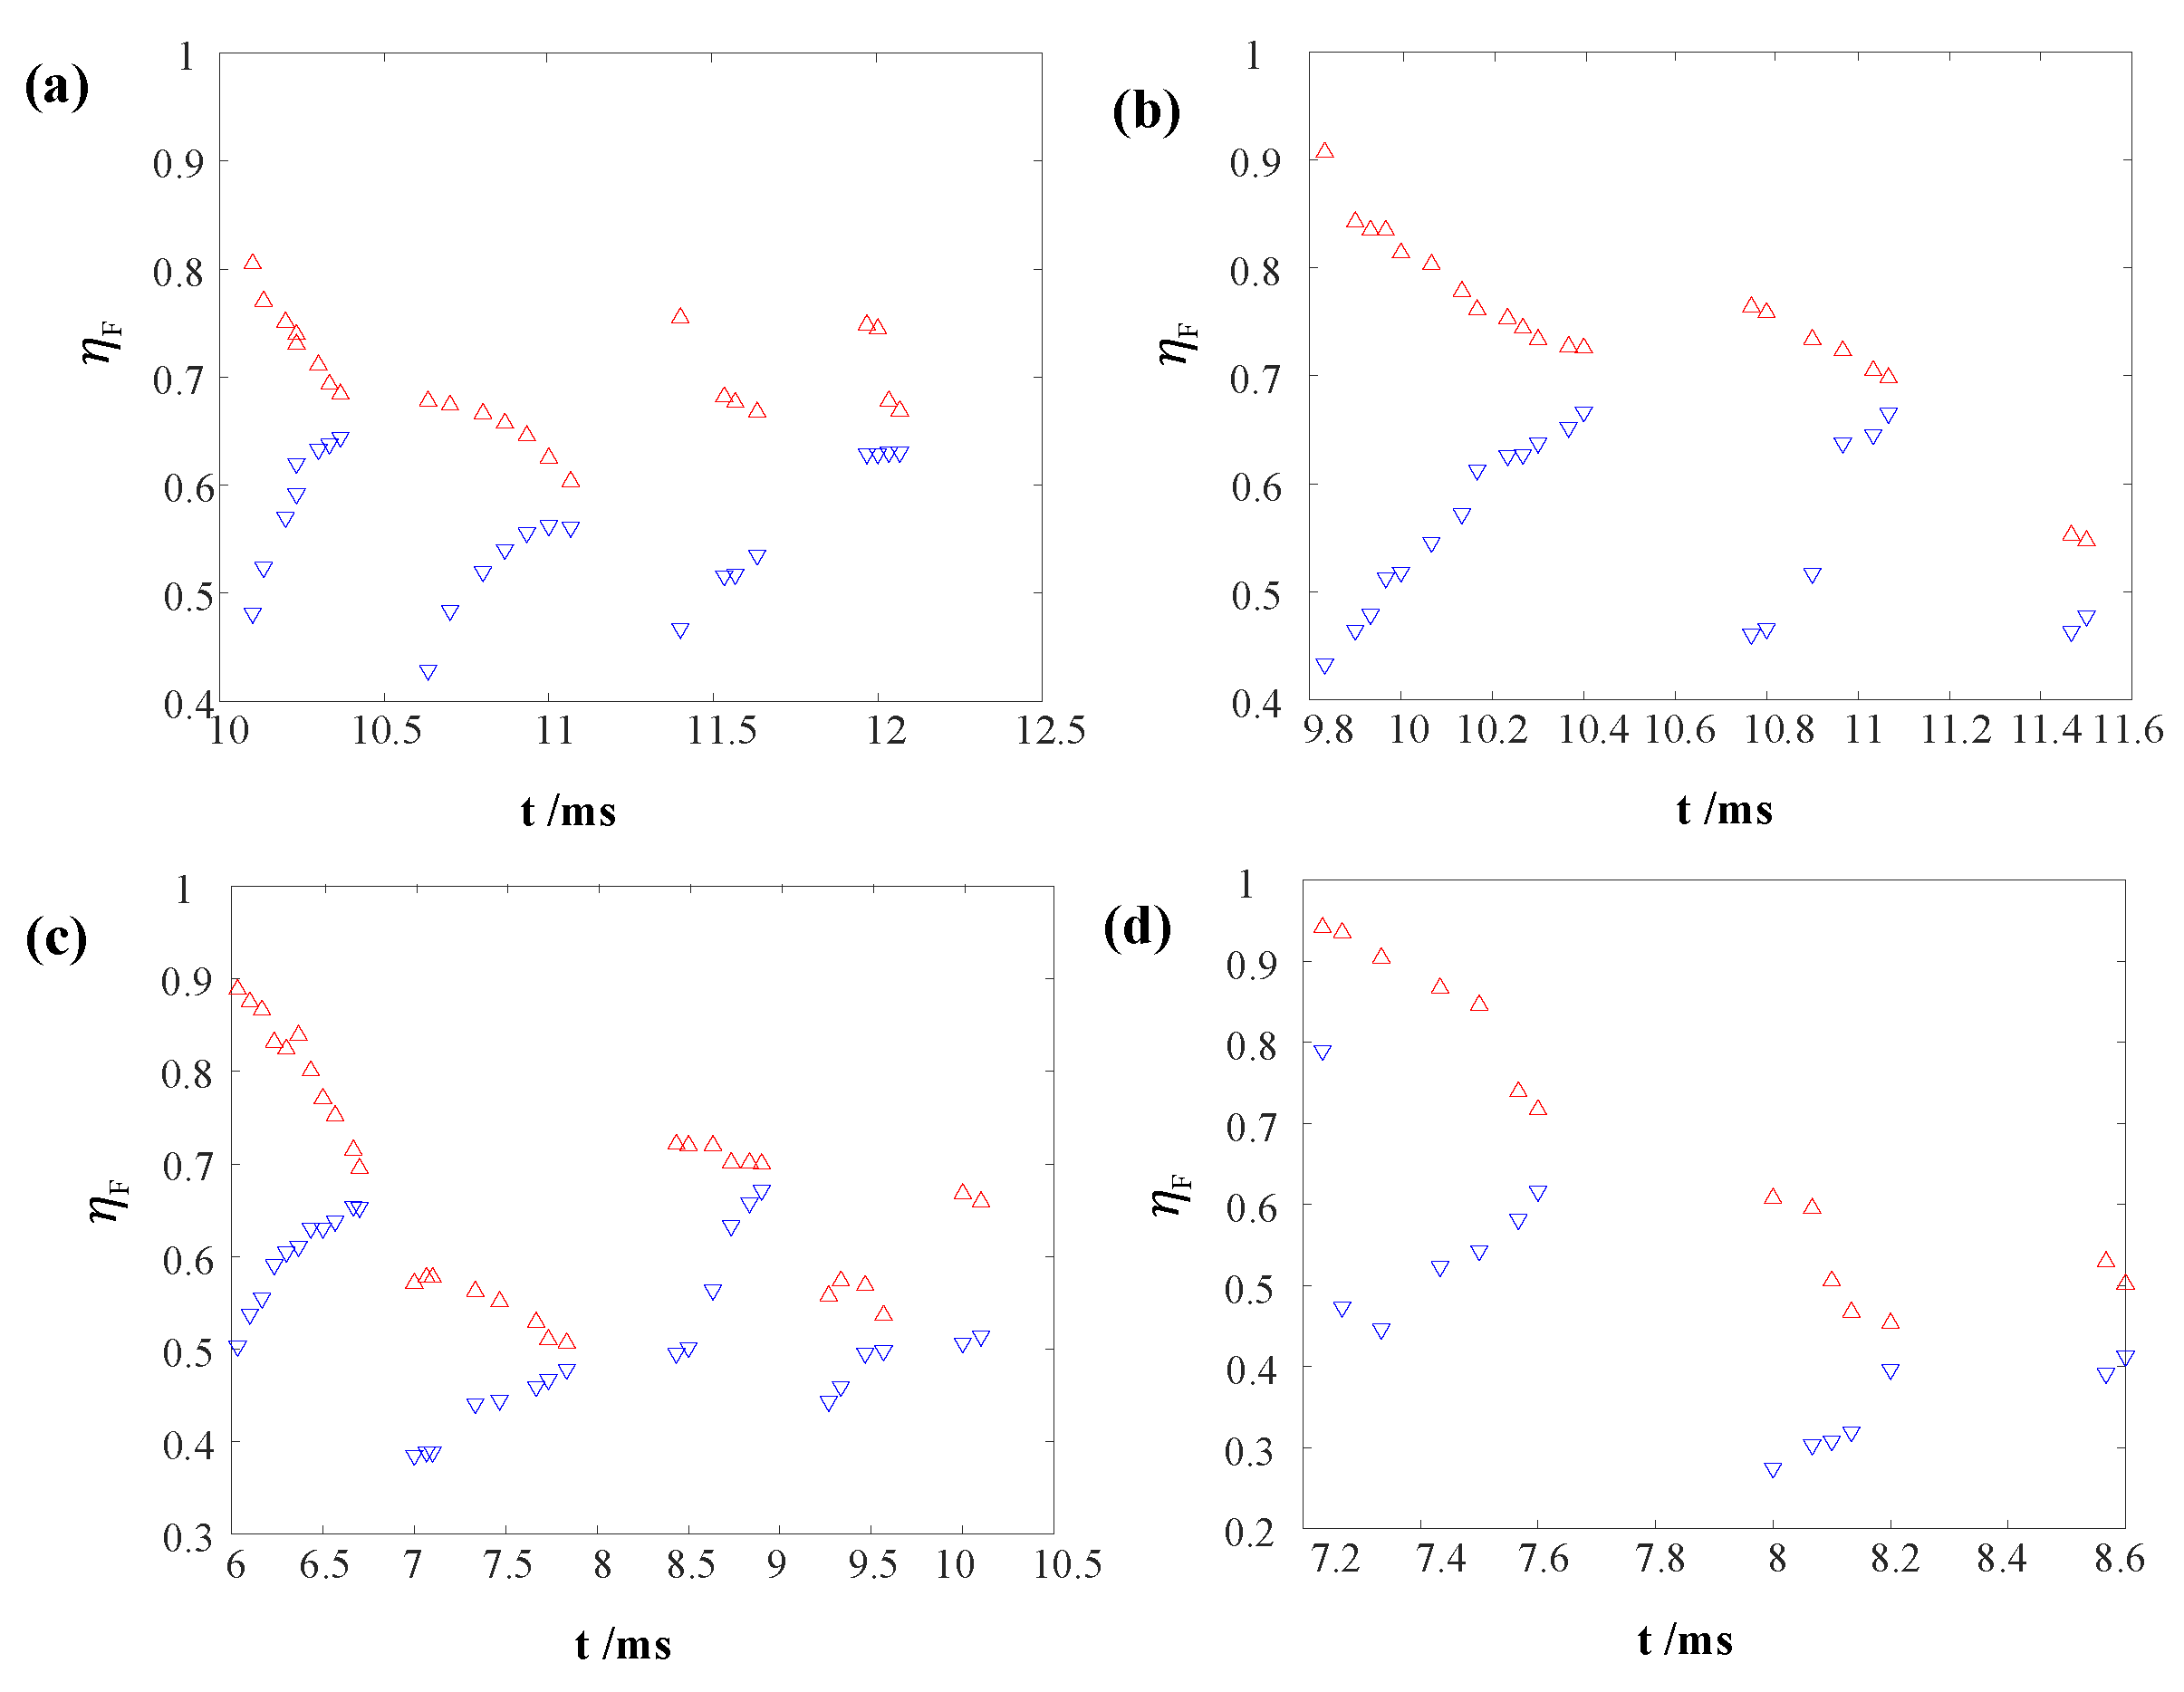
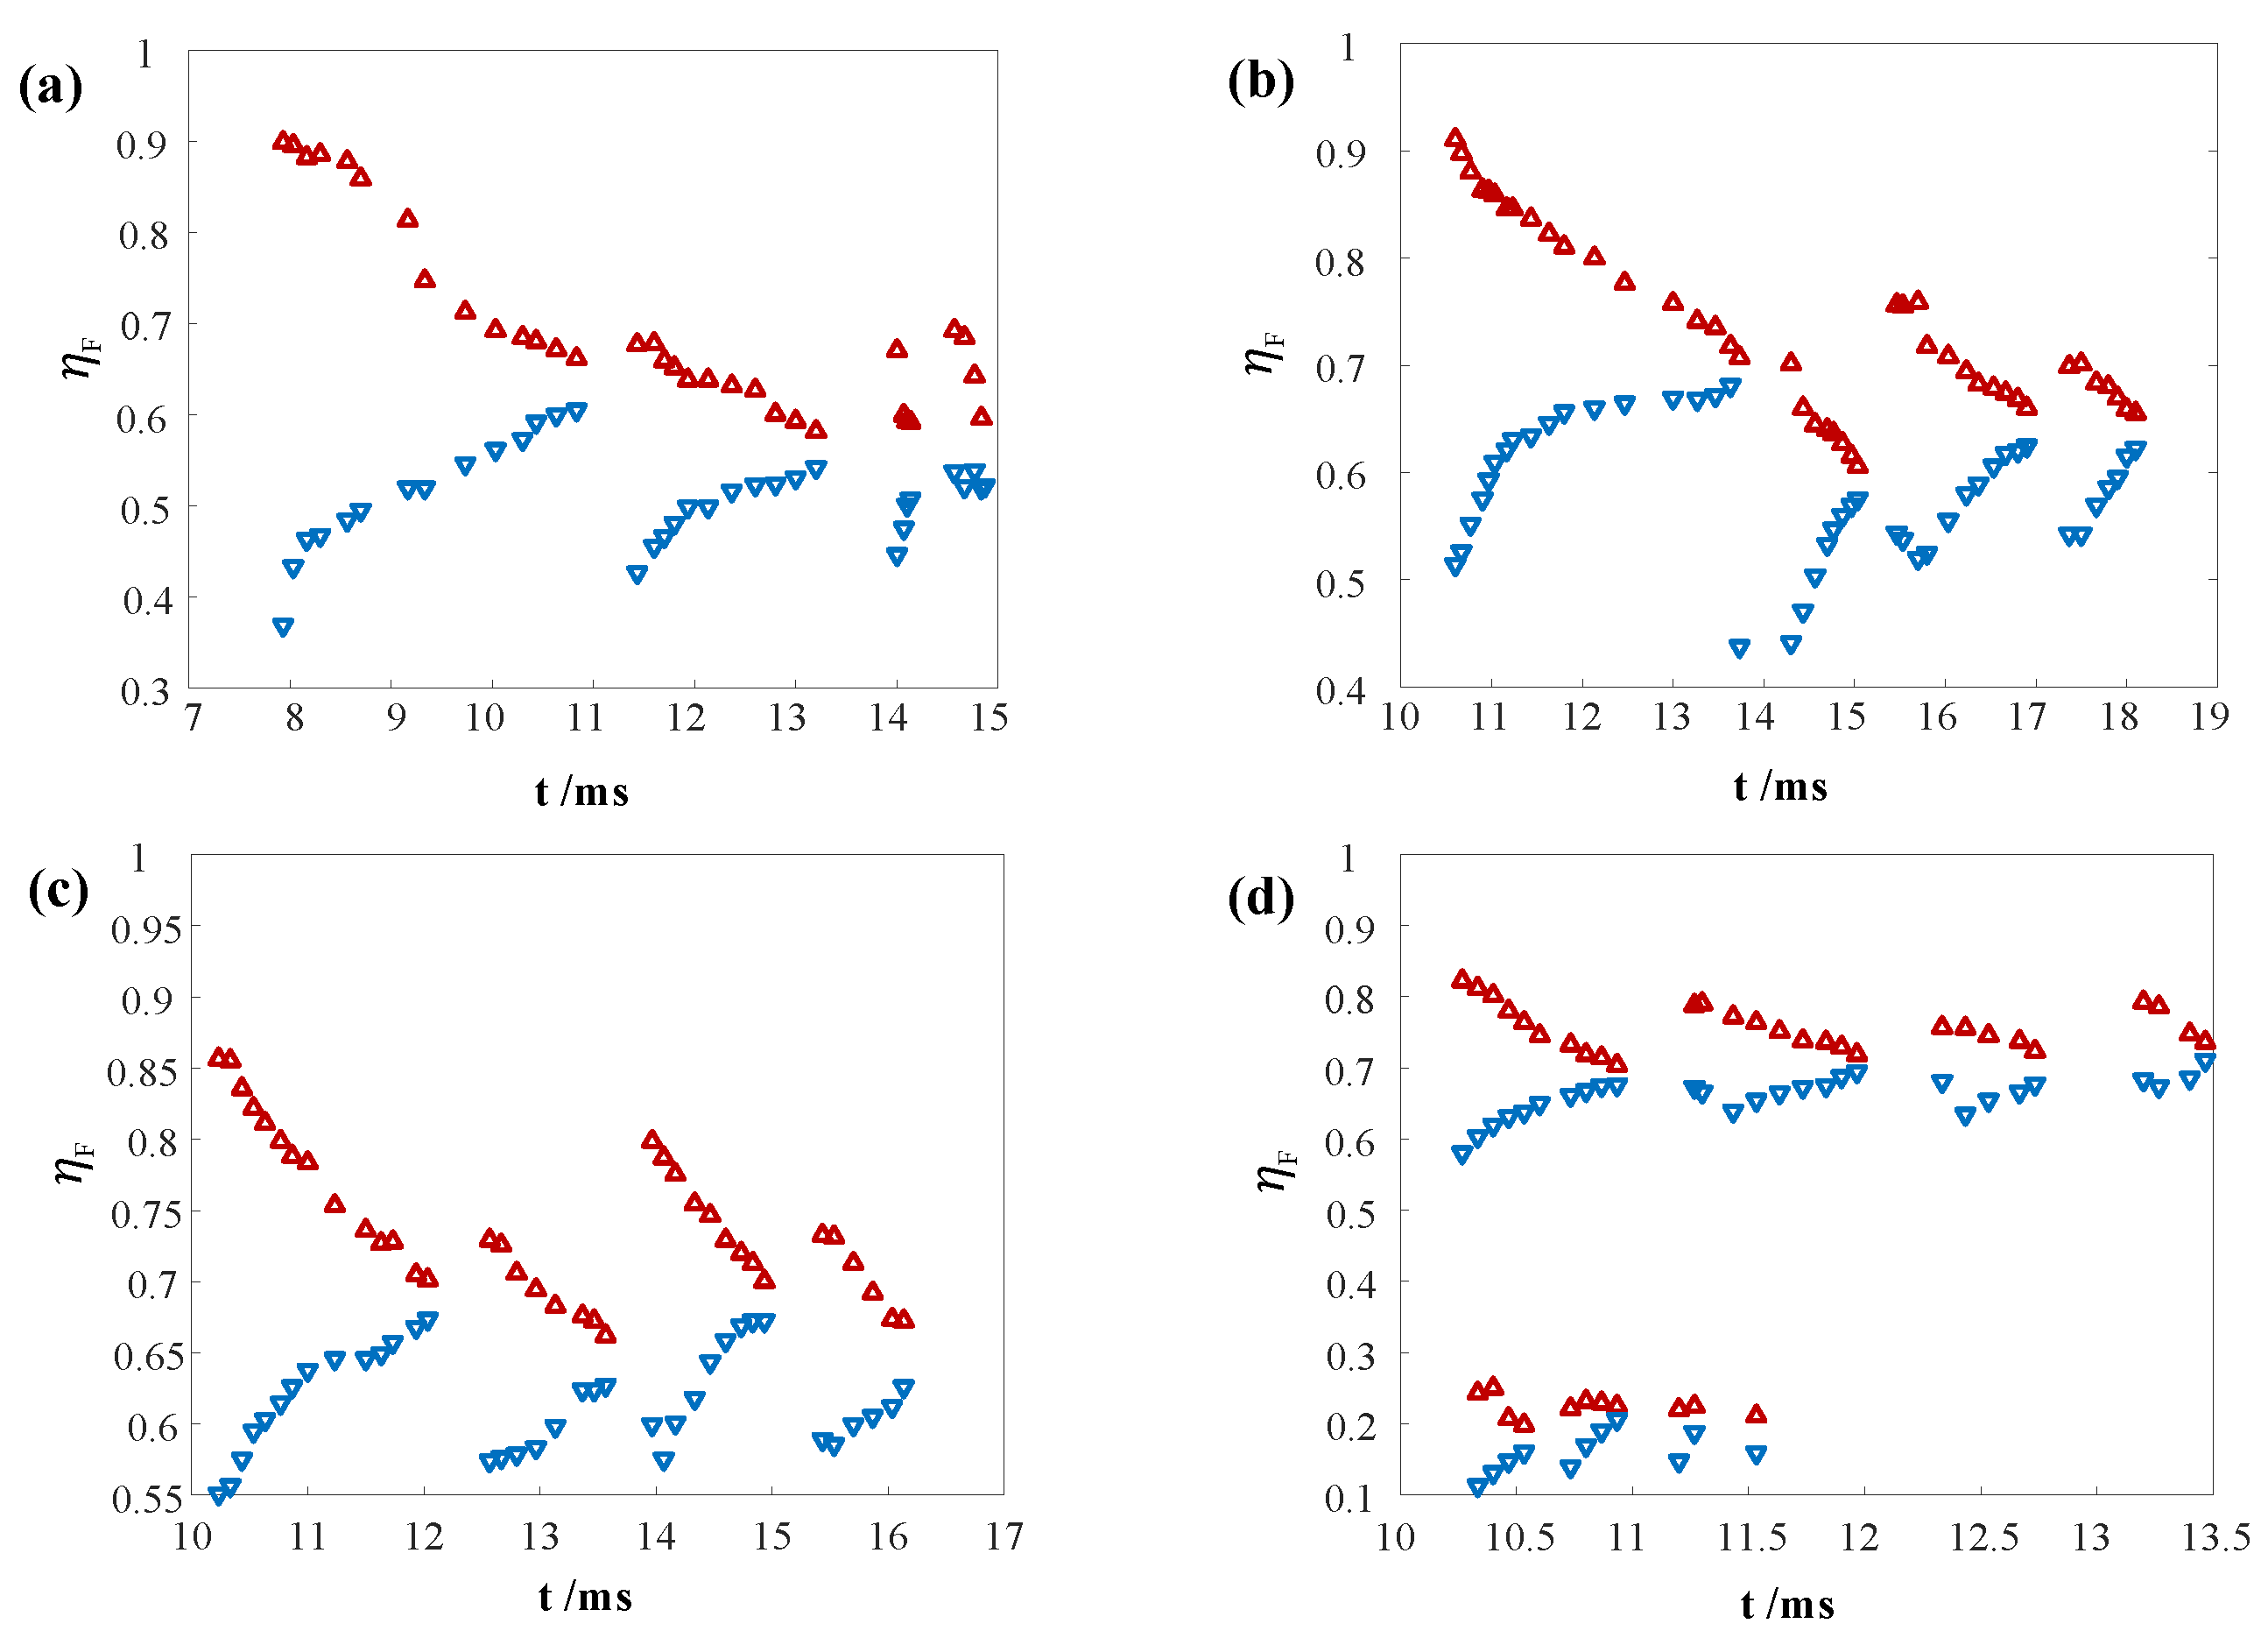
In order to discuss the law of multiple secondary cavitations, the evolution of secondary cavitation shown in Figure 26 is drawn.
The blue upper triangle is the left end of the secondary cavitation bubble, and the red lower triangle is the right end of the secondary cavitation bubble. As shown in Figure 26a, for the first occurrence of secondary cavitation, both ends of the secondary cavitation gradually shrink toward its center. Multiple secondary cavitations oscillate left and right at the end of the long tube, and the length of the secondary cavitation gradually decreases. Comparing Figure 26a–d, the two working conditions are the number and occurrence time of secondary cavitation under different tube diameter conditions. For initial bubbles of the same size, when the bubble generation positions are consistent, a larger tube diameter reduces the number of secondary cavitations and shortens the time of secondary cavitation. Comparing Figure 26a,d, the two working conditions are the number and time of secondary cavitations with the same tube diameter but different ratios of the tubes. When the ratio is smaller, the time of the first secondary cavitation is shorter, and the number of secondary cavitations is also reduced compared to when the ratio of the tubes is larger.
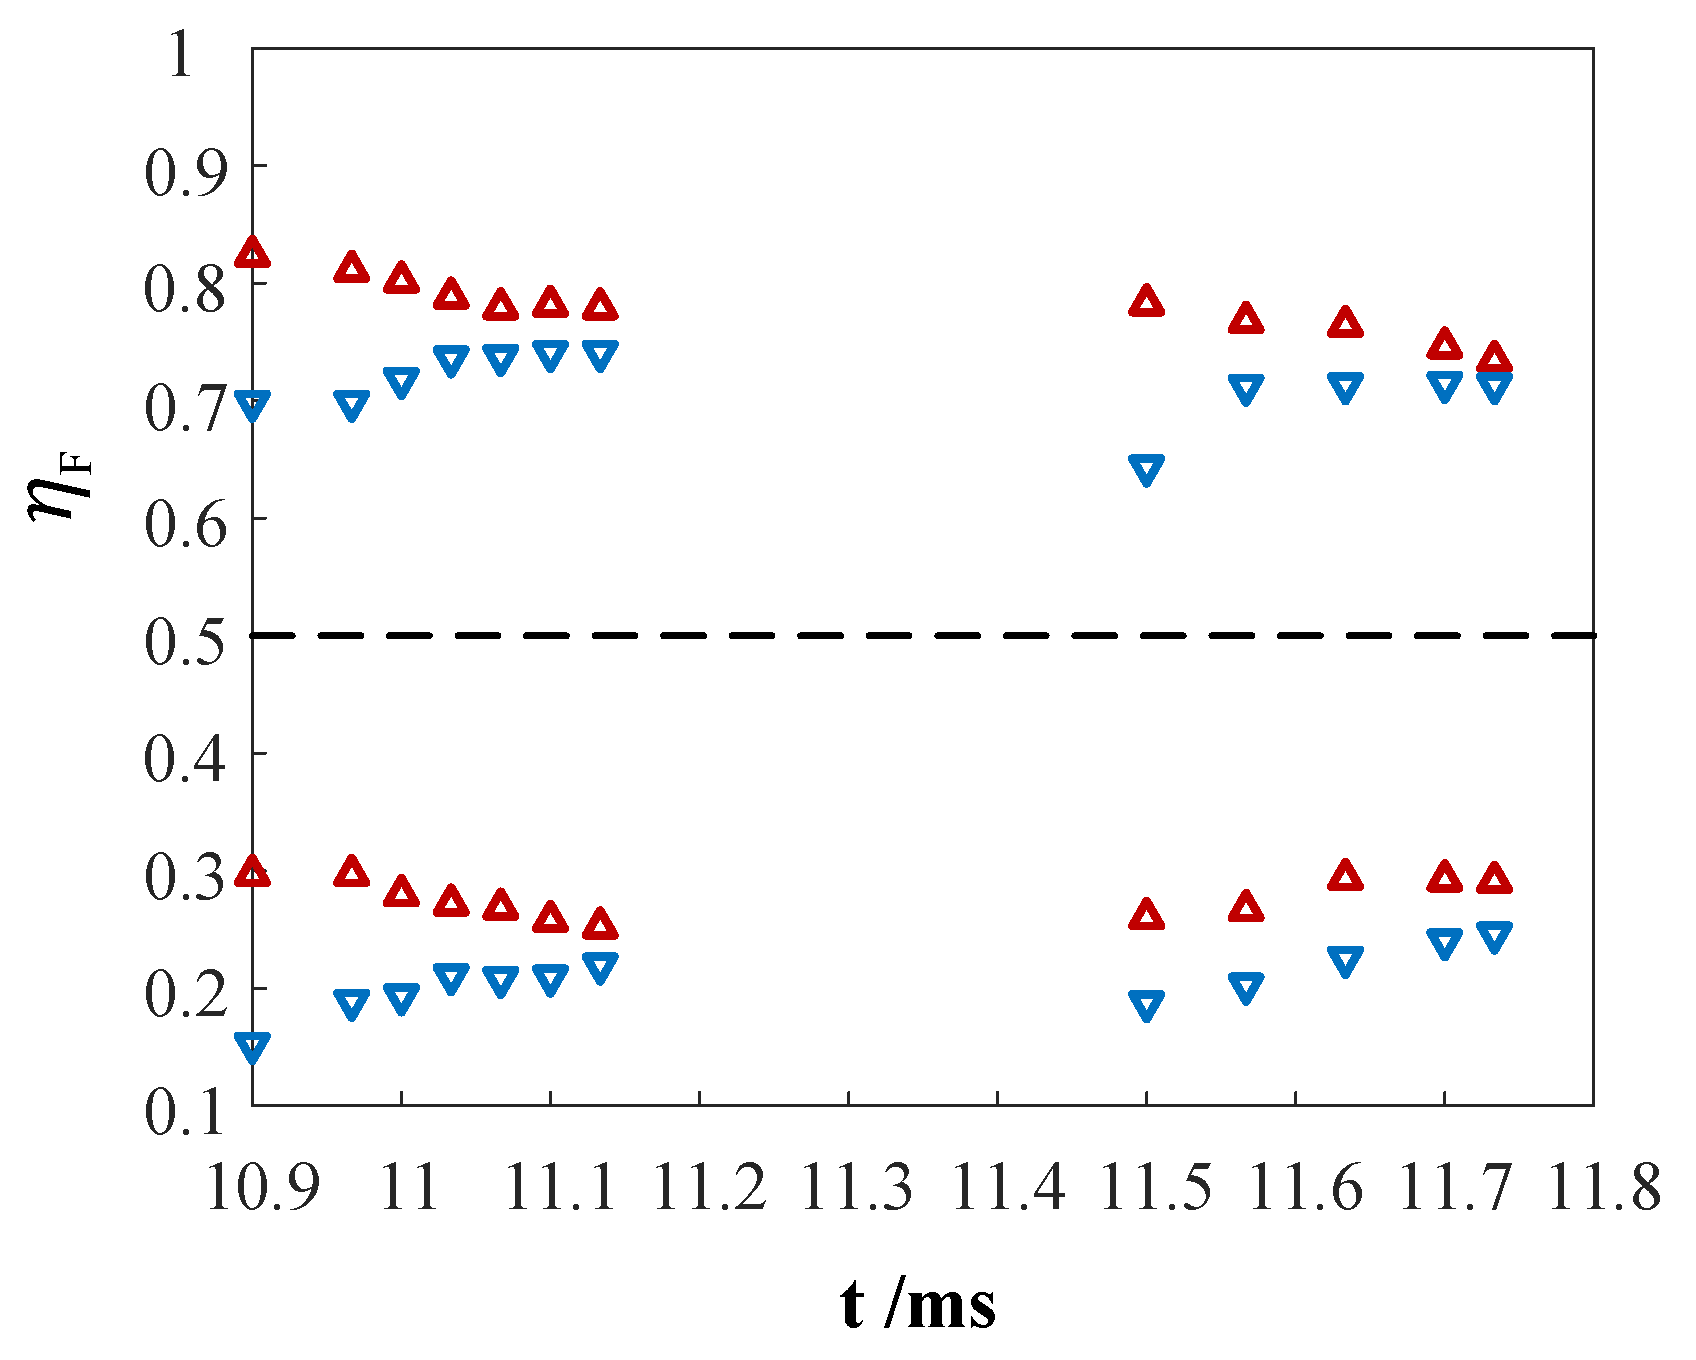
Secondary cavitation is a ubiquitous phenomenon that is the result of a short low-pressure region after the initial bubble collapses in a rigid tube. Observations of the 200 mm tube show that in the case of asymmetric bubble collapse, secondary cavitation occurs in most experiments, and the closer the initial bubble position is to the symmetric center of the tube, the fewer cavitations occur. The results show that the collapse position of the initial bubble has a significant effect on the position of the secondary cavitation, and a smaller η b causes the secondary cavitation to be closer to the tube end on the other side. This relationship shows that the generation of secondary cavitation in the experiment is caused by the convergence of two rarefaction waves, which are generated by the reflection of the shock wave at the two ends of the tube. The shock wave is first generated at the collapse position of the initial bubble, then propagates to the two tube ports. Subsequently, due to the sudden expansion of the flow channel at the end of the tube, a compression shock wave is reflected in the opposite direction in the form of a rarefaction wave. Assuming that the shock wave propagates at the same speed in both directions, the reflected rarefaction wave should first converge at a position symmetrical to the position where the initial bubble occurs. In Figure 27, the horizontal axis is time (t), and the vertical axis is the relative position ( η F = X F / L T ).
η F = 0.5 is the symmetry center of the tube. All the first secondary cavitations occur at the left end of the circular pipe, which is consistent with the previous inference about the convergence position of the rarefaction wave, and is generated in the opposite direction of the initial bubble and the symmetry center. In addition, it can be observed from the image that multiple secondary cavitations oscillate left and right, but this does not refer to left and right oscillations along the symmetry center. The orange arrows in Figure 27 indicate the cavitation center and times of multiple cavitations in the tube drawn by the orange curve. As time changes, multiple cavitations oscillate according to the left–right–left–right law. Other working conditions have similar laws. After the diameter of the tube increases, the oscillation of multiple cavitations is also left and right multiple times, but the position of the first secondary cavitation center is located on the left side of the symmetry center of the circular pipe.
For the several working conditions shown in Figure 27, when the initial bubble collapses near the end of the tube, since some bubbles may extend out of the tube during the expansion process, the propagation of the shock wave in the tube may be affected, thereby affecting the initial position of the secondary cavitation. In addition, the position of the secondary cavitation center is also different when the tube diameter is larger, the tube diameter is larger than the bubble, and the tube is no longer blocked, resulting in two unbalanced liquid columns, which is different from the propagation mode of the wave when the initial bubble expands into a long cylinder. For the initial bubble at the symmetry center of the 200 mm tube, no secondary cavitation was found, but in the experiment reported in this paper, when the initial bubble was located at the symmetry center of the 500 mm tube, multiple symmetrical cavitations were found, which shows that the occurrence of secondary cavitation is related to the tube’s diameter ratio.

6. Dynamic Characteristics of a Bubble in Long Tubes

The different positions of the initial bubble generation and the multiple cavitations caused by them are discussed. In addition, the pumping effect caused by the initial bubble and multiple cavitations can be clearly observed in the long tube, so the law of the direction and speed of the pumping is subsequently studied.

6.1. Bubble Collapse

6.1.1. Symmetrical Bubble Collapse

The experimental images under two working conditions with a length of 400 mm and tube diameters of 8 mm and 30 mm are presented. Figure 28 shows the bubble and cavitation images in the tube when the diameter is 8 mm.
As shown in the 0.23 ms image, the pressure wave is released at the moment of bubble expansion. The end face of the tube generates a reflection wave due to the sudden expansion, which generates low pressure in an area of the tube, thereby generating a local cavitation cloud. When the bubble is symmetrical, the local cavitation cloud area generated in the tube is also symmetrical. During this period, the bubble is always in the process of expansion until 7.40 ms. It can be observed that the bubble shape during this period is symmetrical. When the diameter of the tube ( γ t ) is small, the shape of the bubble in the tube approaches a cylinder. Looking back at the definition of secondary cavitation used in this paper, it is a cavitation cloud generated by the convergence of the rarefaction waves of the two ends of the tube and the bubble after the bubble collapses. Therefore, no secondary cavitation phenomenon was observed in this situation.
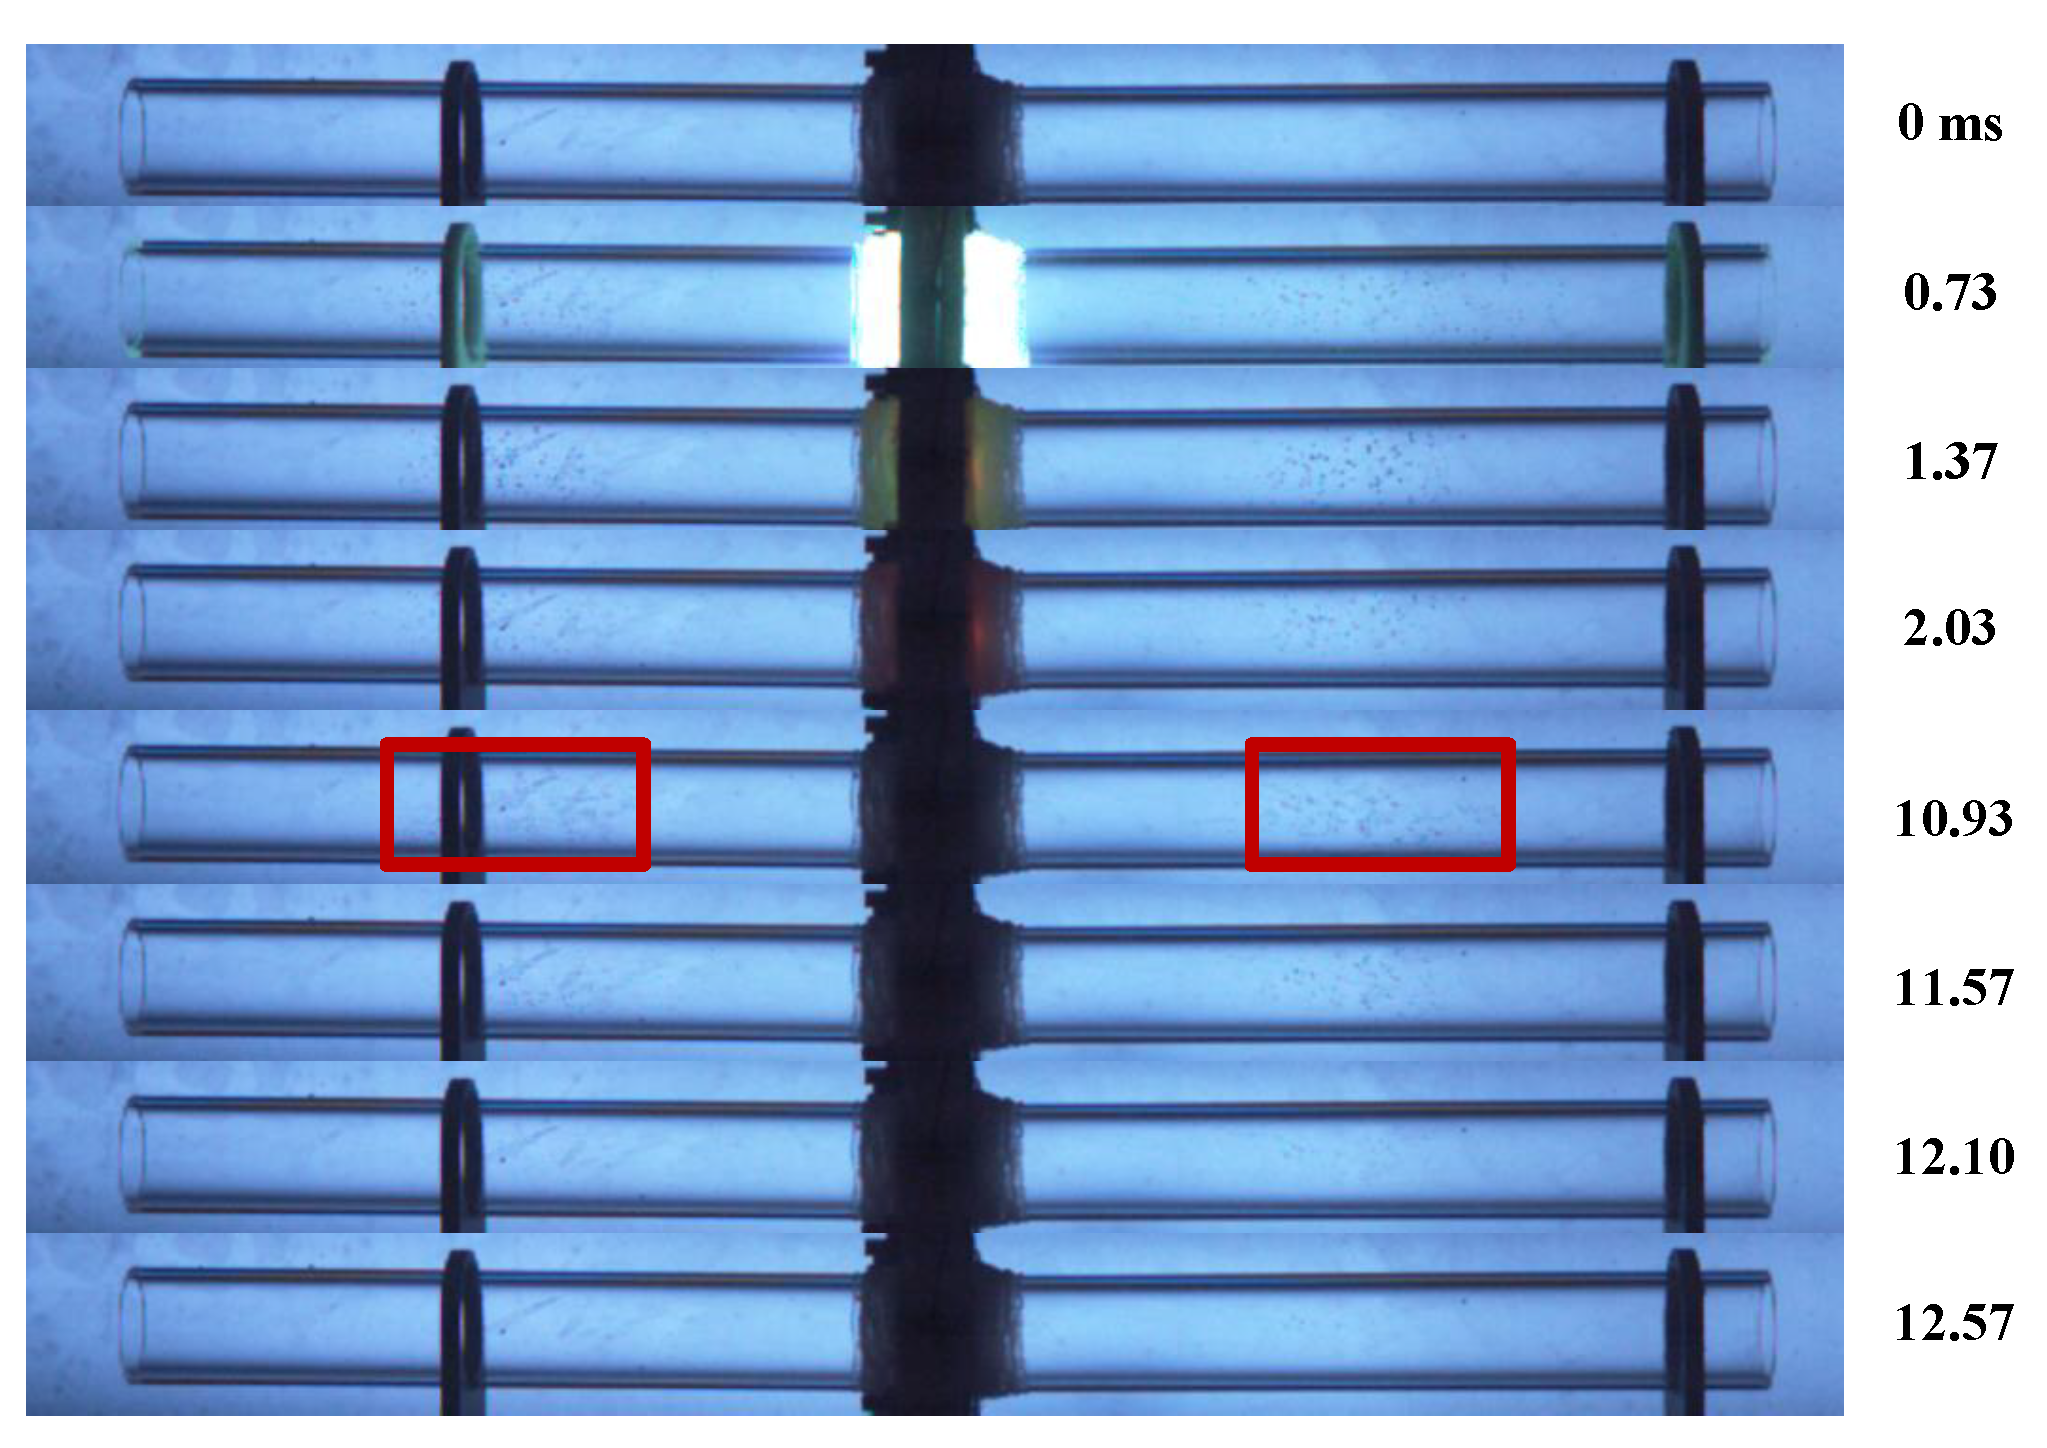
Now, we compare the bubbles in the tube and the secondary cavitation effect caused by the bubbles under two symmetrical conditions: an 8 mm tube (Figure 28) and a 30 mm tube (Figure 29). Upon the initial expansion of the bubble, cavitation occurs, but compared with the 8 mm tube, the cavitation group does not form obvious aggregation, all of which is in the form of tiny bubbles. The volume of the cavitation group is the largest at the beginning, then gradually decreases until it disappears. It is worth noting that, as shown in the 10.93 ms image, after the collapse of the bubble is completed, secondary cavitation occurs in the tube, and the cavitation is symmetrical along the center, that is, the tube diameter ratio and bubble ratio are such that bubbles generated at the central symmetrical position also produce secondary cavitation. The multiple cavitations after bubble collapse also have periodicity, and as the number of times increases, the cavitation group gradually weakens until it disappears. The bubbles after complete collapse do not produce separate displacements or displacements pointing in a certain direction, which is related to the initial bubble being located at the symmetry center.

6.1.2. Asymmetric Bubble Collapse

For asymmetric bubbles in short tubes, due to η b and the parameters of the circular tube ( γ t , γ L ), the bubble cannot expand completely in the tube, and some bubbles extend out of the tube, so the bubble morphology in the tube cannot be systematically studied. In addition, no secondary cavitation is generated. For asymmetric bubbles in longer tubes, obvious changes in the overall bubble morphology can be observed in this series of experiments, and the existence of secondary cavitation is found in many experiments. The generation of secondary cavitation is related to dimensionless parameters such as the tube diameter ratio and bubble ratio. Under the same tube diameter ratio and bubble ratio conditions, the multiple cavitation phenomena and their laws caused by the different initial bubble locations are studied in this section. The working conditions used in this section are tubes with a diameter of 30 mm and a length of 400 mm.
Figure 30 shows images of multiple cavitations caused by initial bubbles in a tube when the initial bubble generation position η b = 0.1 .
The position of the initial bubble corresponds to 0 ms. The luminescence of the spark bubble can first be observed at 0.80 ms. At this time, the bubble has generated a shock wave, and a cavitation group is generated in the tube due to the generation of the wave. The size and intensity of the cavitation group gradually weaken with the development of the bubble. It is proposed, again, that this type of cavitation should not considered secondary cavitation in this paper, although the cause of the generation is extremely rapid pressure changes. The period of 8.13–10.57 ms corresponds to the morphological change of the cavitation cloud for the first secondary cavitation after collapse. At 8.13 ms, the cavitation cloud appears as a group of tiny bubbles; then, the number of bubbles decreases, the volume of each bubble increases, and the overall volume of the cavitation cloud decreases. The shrinking direction is the center of the cavitation cloud. The 11.70–13.00 ms images show the cavitation cloud morphology of the second cycle. The occurrence position is rightward relative to the first one, and the volume of the cavitation cloud is smaller than when it first appeared. The morphological changes of the entire second cycle are similar to those of the first cycle, gradually shrinking toward the center and finally disappearing. The following four images are typical bubble cloud morphologies of the following cycles. First of all, it can be seen that the position of the cavitation cloud basically no longer changes, and the cycle of the cavitation cloud gradually decreases before finally disappearing. The 23.37 ms image shows the flow direction of the fluid in the tube after bubble movement and the movement of the cavitation cloud end. The fluid carries the impurities generated by the spark bubbles and moves toward the long tube. The short tube end has a larger bubble volume, and the bubbles at the short tube end shrink faster. The fluid in the tube produces a higher flow rate pointing to the long tube end, and the fluid in the tube finally moves toward the long tube.
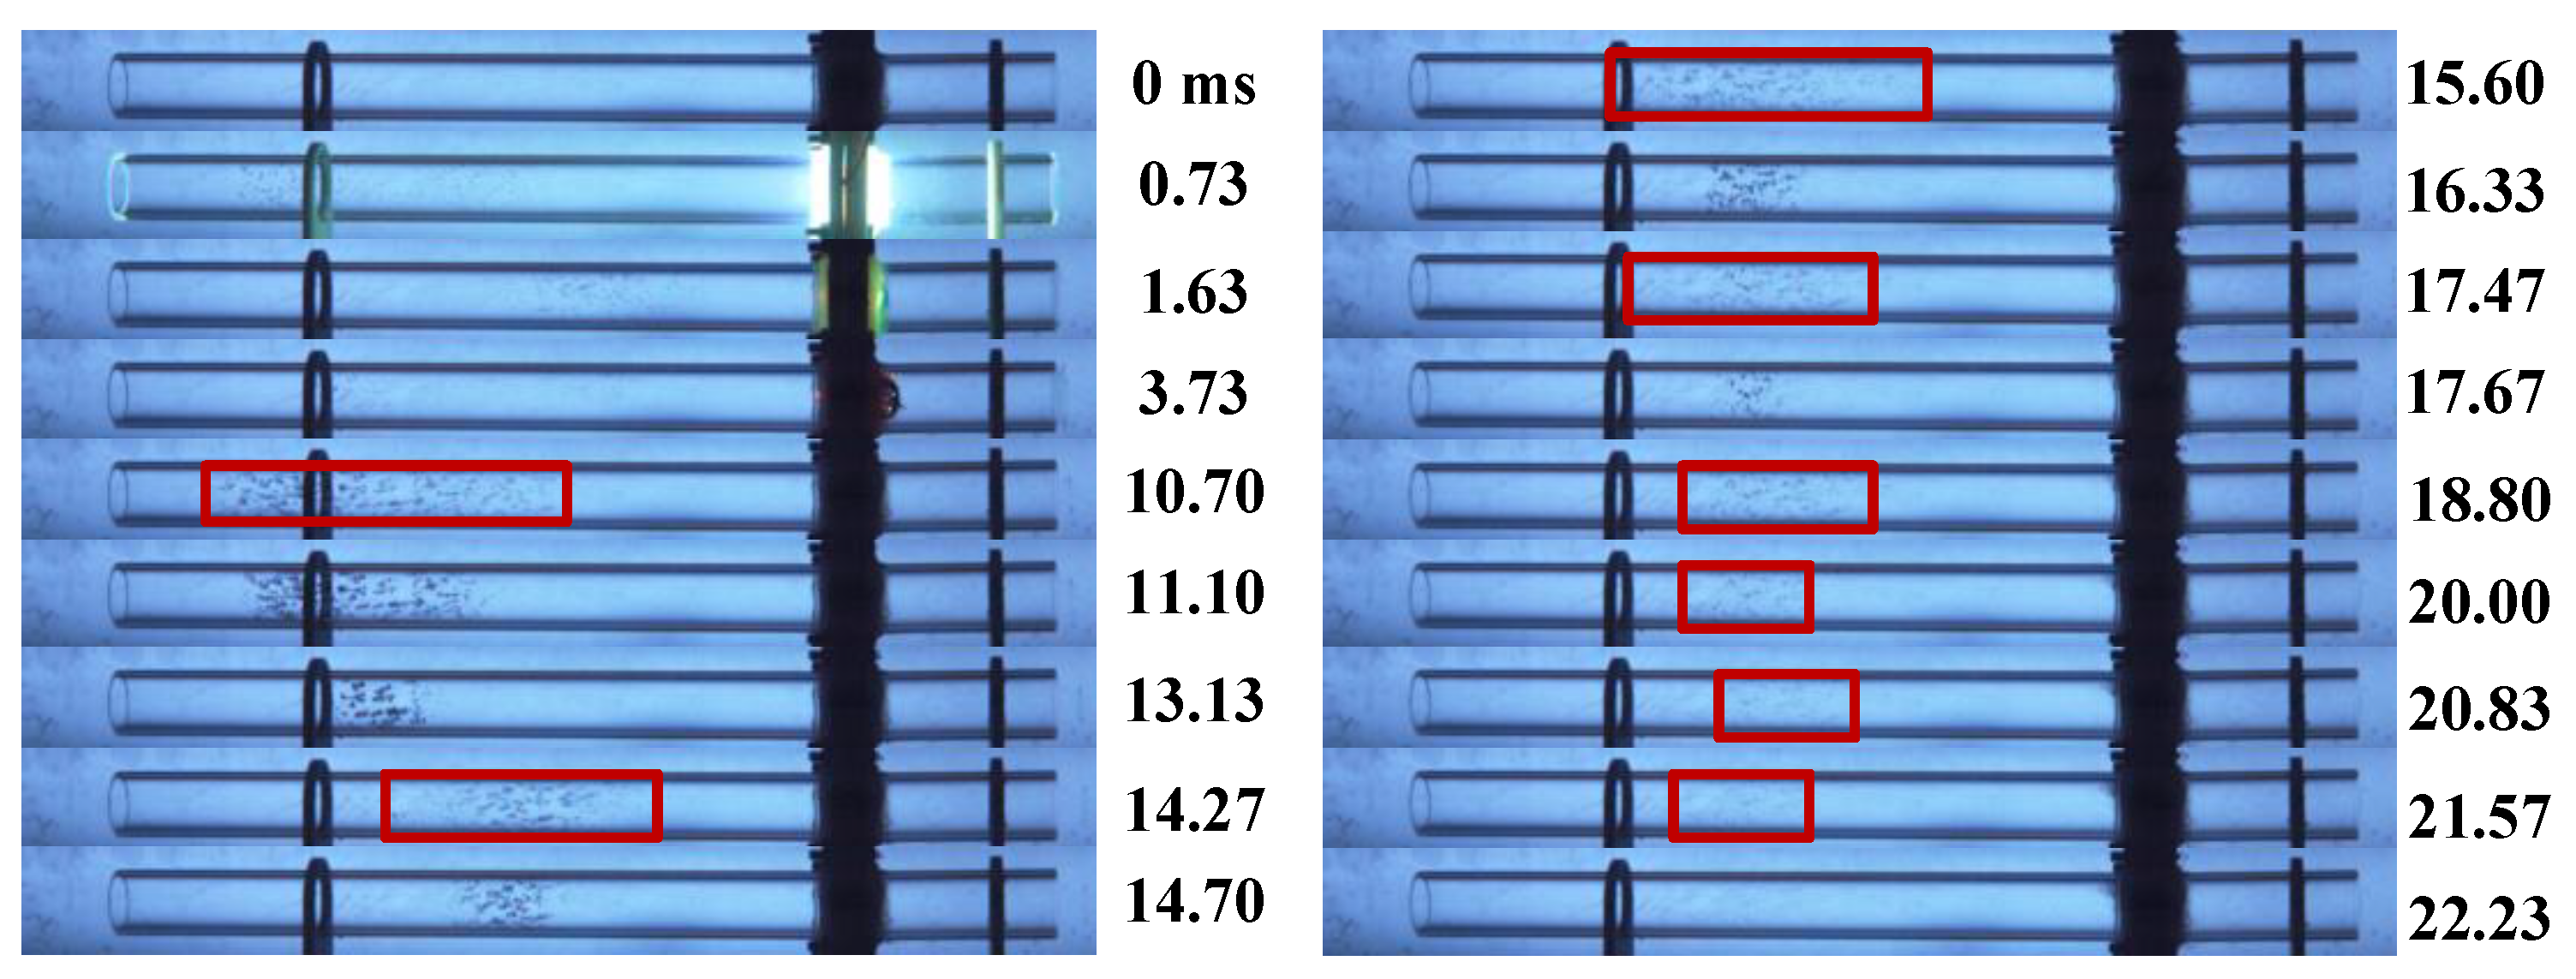
Figure 31 shows the initial bubble shape in the tube when η b = 0.2 and the resulting images of the multiple cavitation effects. Compared with Figure 30, the basic development process of the bubble in the tube is similar. In the early stage, the expansion wave generated by its own expansion causes the pressure in the tube to change, thereby causing cavitation. After the bubble collapses, the image at 10.70 ms shows the state of the first secondary cavitation. The overall size of the cavitation cloud is reduced. The period of 10.70–13.13 ms corresponds to the morphological change in the first cycle of secondary cavitation. The size gradually shrinks toward the cavitation center until it disappears. Then, the second cycle of cavitation occurs as shown at 14.27 ms and 14.70 ms. From the figure, it can be clearly observed that the shape and center of the cavitation cloud shift to the right. For the subsequent cycles, there is always a situation where the center of the cavitation cloud moves. In the last few cycles, it basically maintains a stable position, but the intensity of the cavitation cloud gets weaker and weaker, accompanied by the shortening of the cavitation cloud cycle time.
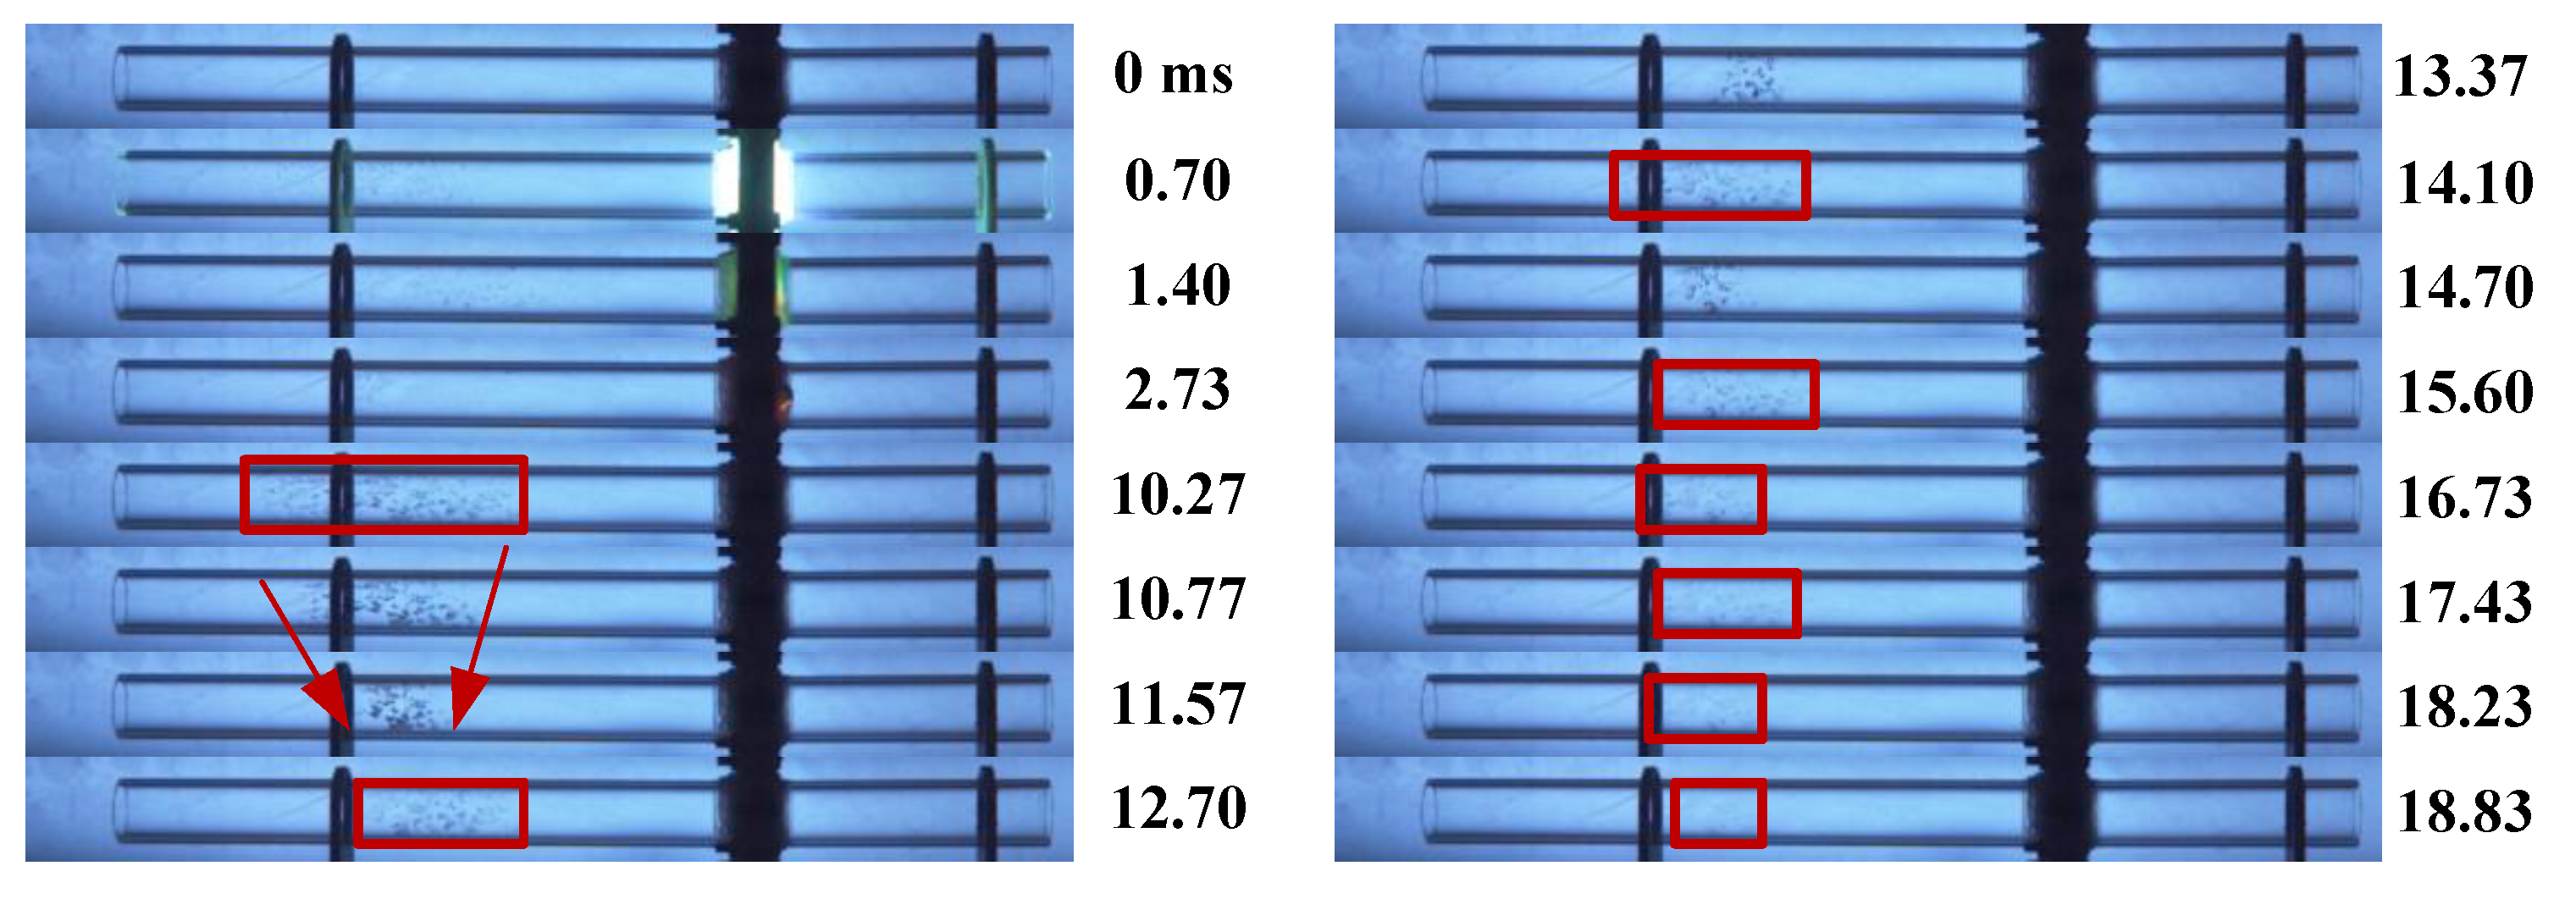
Images of multiple cavitations caused by the initial bubble in the tube under the condition of η b = 0.3 are shown in Figure 32. The three images at 10.27–11.57 ms in the figure show the first occurrence of secondary cavitation, which occurs after the initial bubble collapses. Compared with the previous working condition, the cavitation center of this working condition is more to the right, which is related to the location of the initial bubble. During this period, the overall volume of the cavitation group gradually shrinks before disappearing; then, the bubble cloud of the second cavitation period shown in the images at 12.70 and 13.37 ms is ushered in. The center of the cavitation cloud moves to the right, and the intensity weakens, which is consistent with the previous working condition. After several cycles, the period of the cavitation cloud gradually decreases; becomes almost invisible; and, finally, disappears completely.
Figure 33 shows the images of multiple cavitations at η b = 0.4 . The morphology and periodic changes after the initial bubble collapse are similar to those of the previous several working conditions. It can be clearly observed that the intensity of the first cavitation is very weak at this time, and the edge of the cavitation cloud is no longer obvious, but it still has the characteristics of periodicity and left–right movement of the cavitation center.
When the tube length ( L t ) is the same, under symmetric conditions, when the bubble ratio ( γ t ) is small, secondary cavitation does not occur, and when the bubble ratio is increased, multiple cavitations symmetrical to the center may occur. Under asymmetric conditions, the initial bubbles in the tube cause multiple cavitations, the intensity of multiple cavitations gradually weakens over time, and the period decreases. The first cavitation occurs near the left tube end, then moves left and right. In addition, the intensity and size of the first cavitation are related to the location where the initial bubble occurs.

6.2. Multiple Cavitation

For multiple cavitations generated by the movement of the initial bubble in the tube, the period and size of the cavitation cloud are related to the location of the initial bubble position, the tube diameter ratio, and the bubble ratio. The conditions for the generation of multiple cavitations is studied, the law of the relationship between the location of the initial cavitation and the location of the initial bubble is systematically summarized, and the period of multiple cavitations is discussed.

6.2.1. Conditions for the Generation of Multiple Cavitations

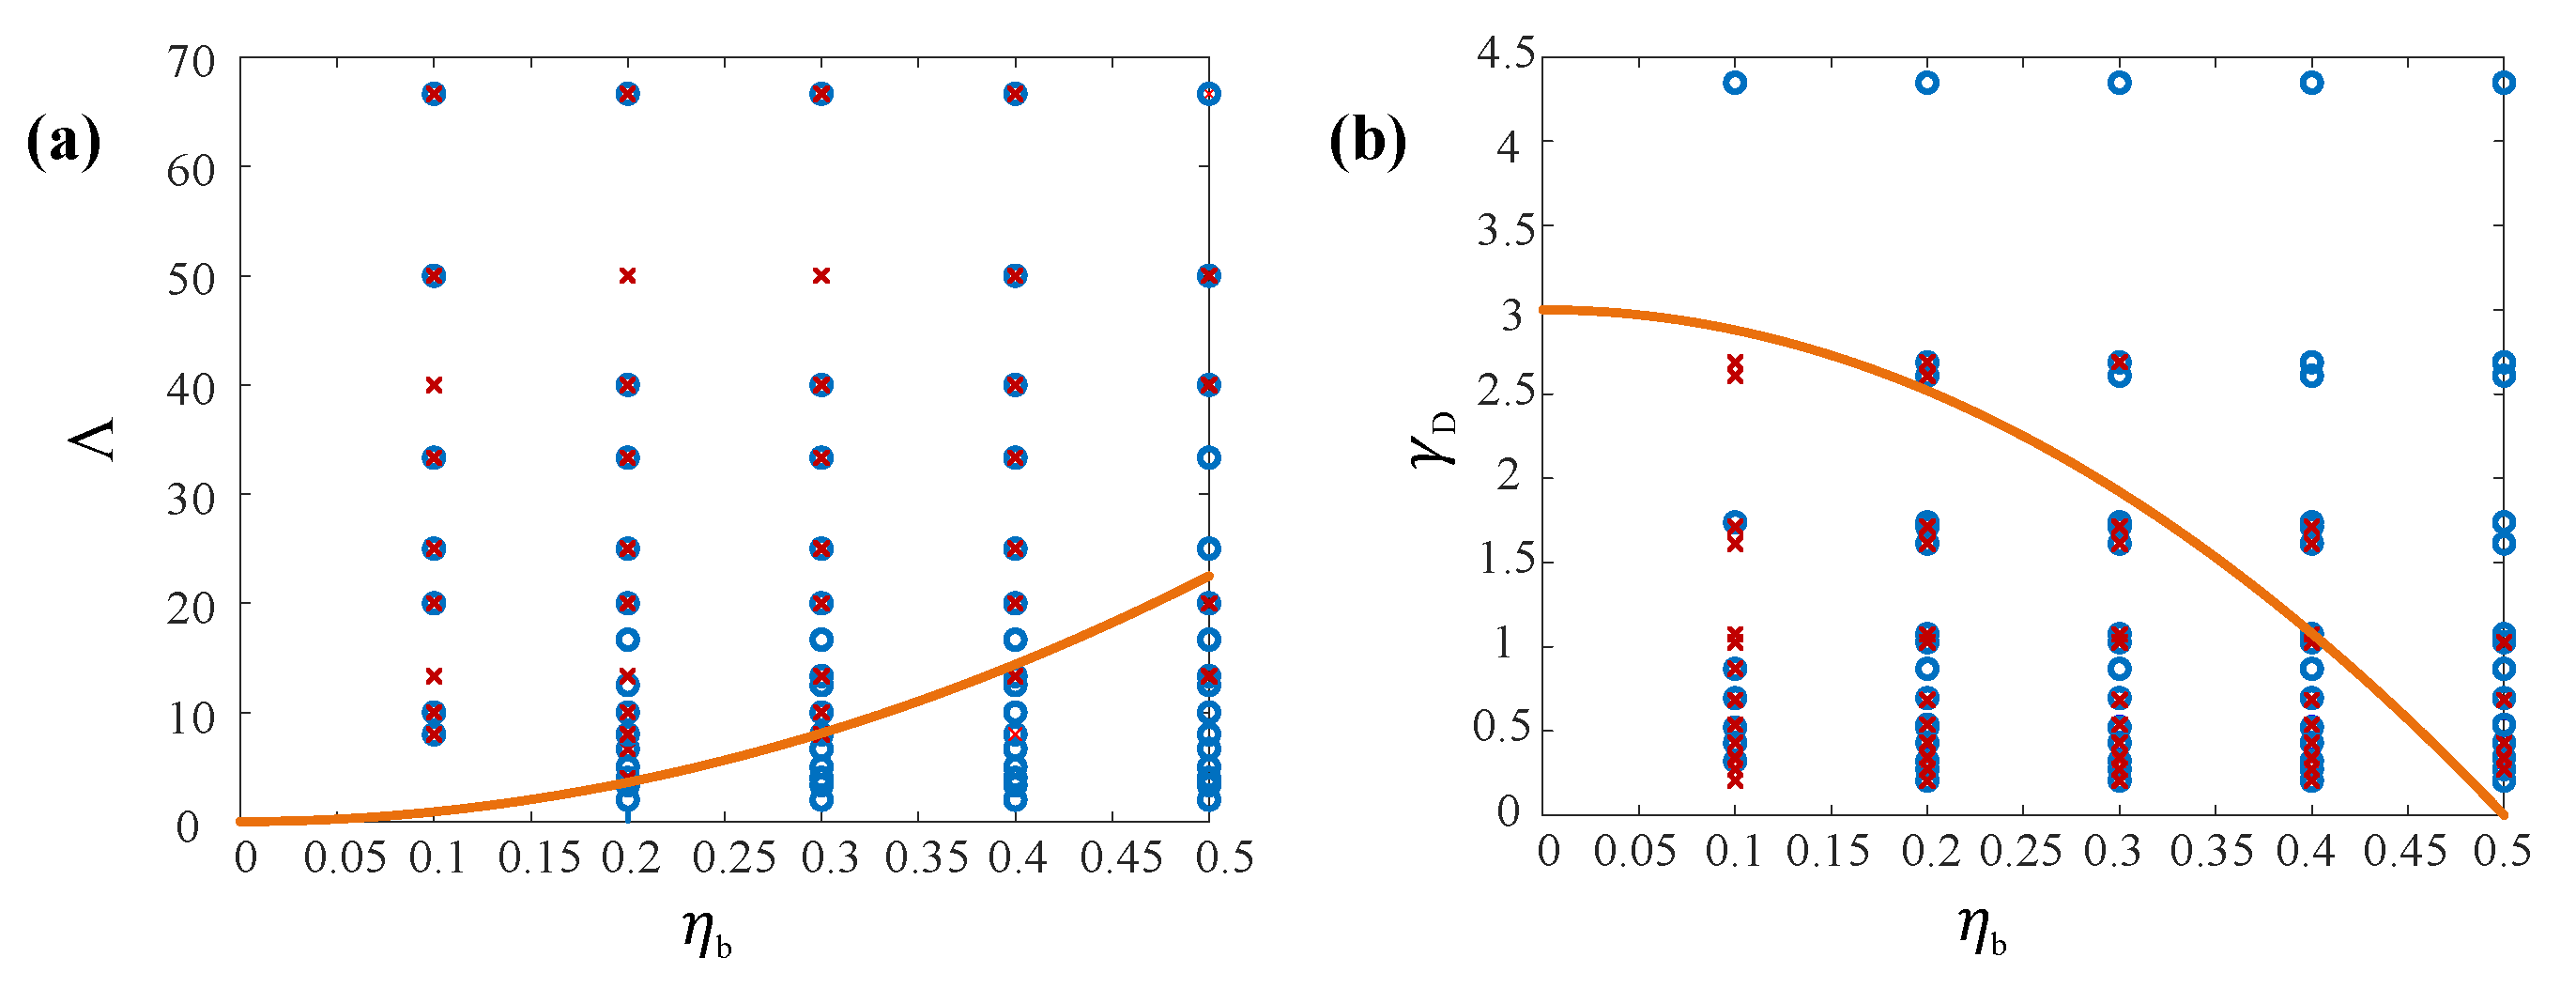
Not all bubbles in a tube cause secondary cavitation, and the generation of secondary cavitation is related to the tube diameter ratio and the bubble ratio. The images shown in Figure 34 are drawn to determine whether cavitation is generated in the tube, where the red asterisk indicates the situation where cavitation is generated and the blue dot indicates the situation where cavitation is not generated.
The horizontal coordinate of Figure 34a is the ratio of the initial bubble position to the tube length ( η b = X B / L t ), and the vertical coordinate is the tube diameter ratio ( Λ   =   L t / D t ). In the processing of the experimental results, the orange solid line is the dividing line of whether secondary cavitation occurs in the tube. The image is divided into two areas, the area above the boundary is the area where cavitation occurs, and the area below is the area where cavitation basically does not occur. After fitting the points on the image, the orange boundary equation is obtained as follows:
Λ = 90 η b 2
It shows that secondary cavitation is more likely to occur when the initial bubble is closer to the edge and the tube diameter is smaller.
The horizontal coordinate of Figure 34b is η b , the vertical coordinate is the bubble ratio, and the dimensionless parameter of the tube diameter relative to the bubble size is γ = D t / R m a x . In the processing of the experimental results, the orange solid line is the dividing line of whether secondary cavitation occurs in the tube. The image is divided into two areas; the area above the boundary is the area where cavitation occurs, and the area below is the area where cavitation basically does not occur. After fitting the points on the image, the orange boundary equation is obtained as follows:
γ t = 3 12 η b 2
The area and boundary provided by Figure 34 can predict the occurrence of secondary cavitation in the tube to a certain extent.

6.2.2. Multiple Cavitation Generation Position

According to the description of cavitation in the tube, the volume of the cavitation cloud gradually decreases within the period. As the period increases, the intensity of the cavitation cloud weakens, and the position also changes. Figure 35 and Figure 36 show the left and right positions of the cavitation cloud ( η F = X F / L t ), respectively, caused by the initial bubble in the circular tube under symmetric and asymmetric conditions. The blue upper triangle is the left end of the cavitation cloud, and the red lower triangle is the right end of the cavitation cloud.
Figure 35 shows the positions of the left and right ends of the cavitation cloud under the working condition shown in Figure 29.
Under this condition, the initial bubble occurs at the symmetry center of the tube. At the same time, the distance between the blue equilateral triangle and the red inverted triangle is the length of the cavitation cloud. The length gradually decreases, which is consistent with the experimental situation shown in Figure 29, that is, the cavitation cloud in the same cycle has the largest size when it is initially generated, then gradually shrinks, and the shrinking direction is the middle of the cavitation cloud. The length of the cavitation cloud in the second cycle is less than that of the first cycle, the time of the second cycle is shorter, and the position of the cavitation cloud after collapse in the second cycle is closer to the symmetry center of the circular tube. For secondary cavitation under symmetrical conditions, the first secondary cavitation occurs at the symmetrical position.
Figure 36 shows the position of the two sides of the multiple cavitation cloud when the initial bubble is in the asymmetric position.
In most cases, multiple cavitations are only generated on one side of the tube, as shown in Figure 36a–c, which correspond to the working conditions of Figure 30, Figure 31, and Figure 32, respectively. Figure 36a shows the morphological changes of the four cycles after the initial bubble collapses. The size of the first secondary cavitation is the largest, and its intensity is the strongest. For the first secondary cavitation, the size gradually decreases and collapses to the center of the cavitation cloud. The center of multiple cavitations moves left and right, and the center of the cavitation basically does not change in the later period. For Figure 36b,c in Figure 36, there are several cavitation cycles in the tube at different positions of the initial bubble. First, after comparing the first cavitation cycle of several working conditions, the rules of cavitation cloud intensity, position, and period are found. The closer the initial bubble is to the center of the circular tube, the weaker the intensity of the cavitation cloud, which is manifested as the difference between the left and right ends of the cavitation cloud gradually decreasing. By comparing the lengths of cavitation clouds under several working conditions, it can be verified that the intensity of cavitation clouds is weakened. The farther the initial bubble is from the center of the circular tube, the farther the center of the first cavitation cloud is from the symmetry center of the tube. Multiple cavitation cycles cause the center of the cavitation cloud to swing left and right and, finally, oscillate at a certain position.
The initial bubble generation position ( X B ) and the position of the cavitation cloud center ( X F ) generated by the initial cavitation after bubble collapse are plotted on the same image, and the image shown in Figure 37a is obtained. The farther to the right the initial bubble generation position is, the closer the cavitation center is to the symmetry center of the circular tube, as shown in the trend of the red curve in Figure 37a. In addition, the relationship between the total length of the first cavitation and the initial bubble generation position is plotted as shown in Figure 37b. The farther the initial bubble generation position is from the symmetry center of the tube, the longer the relative length of the first cavitation is, as shown in the trend of the red curve in the figure.

6.2.3. Multiple Cavitation Cycles

A shock wave is generated at the moment of spark-bubble generation. At this time, the shock wave is an expansion wave. When the wave is transmitted to the end of the tube, a rebound rarefaction wave is generated. The expansion wave and the rarefaction wave meet, resulting in a decrease in the pressure in the local area of the tube, thereby generating a cavitation group. In this paper, secondary cavitation is defined as the cavitation cloud generated in the tube after the initial bubble collapses. A shock wave is also generated when the bubble collapses. After the bubble bursts, the compression wave continues to propagate. After propagating to the end of the tube, it reflects and generates a rebound rarefaction wave. The rarefaction waves generated at both ends of the initial bubble meet at a certain point; then, the secondary cavitation described and demonstrated in this paper is generated.
The time interval between the initial bubble collapse and the first cavitation can be calculated by the wave velocity formula of a water hammer:
a = ( K / ρ ) ( 1 + K D t / E t δ )
where α is the wave velocity and K and ρ represent the elastic modulus and density of the fluid, respectively. D t , E t , and δ are the diameter, elastic modulus, and thickness of the tube, respectively. In this example, K = 2.06 × 10 3 MPa ,   ρ = 998 kg / m 3 ,   D t = 20 mm ,   E t = 3 × 10 3 MPa , and δ = 18 mm . From the formula, we can see that the wave velocity is α = 547.23 m/s. Theoretically, the time when cavitation starts should be the moment when the two rarefaction waves meet. The moment of complete collapse of the initial bubble cannot be observed, but the moment when secondary cavitation starts can be observed. The above the time interval between the initial bubble collapse and the secondary cavitation calculated above is negligible compared with the period of the initial bubble and the period of the secondary cavitation. Therefore, in the description and data processing of this paper, these two moments are positioned as the same moment, that is, the moment when the initial bubble collapses is the moment when the first secondary cavitation starts.
The period of the initial bubble is defined as T 0 . The period of secondary cavitation is recorded as T c . Based on this, the period of the first secondary cavitation is T c 1 , and the period of the second secondary cavitation is T c 2 . In most cases, secondary cavitation inhibits the rebound process of the initial bubble. The relationship between the initial bubble cycle and the first secondary cavitation cycle is drawn as Figure 38a. The relationship between the first secondary cavitation cycle and the second secondary cavitation cycle is drawn as Figure 38b. By fitting the experimental results, the relationship of the period coefficient (K) can be observed. The period of the first secondary cavitation is compared with the period of the initial bubble, and a linear correlation between T 0 and T c 1 is observed.
E is the initial mechanical energy of the bubble. The smaller the tube diameter, the greater the energy of the secondary cavitation bubble group and the stronger the cavitation effect. When the bubble diameter is larger than the diameter of the tube, the liquid columns on both sides collide in a nearly planar manner after the cavitation collapses, and the resulting shock waves propagate to both sides in the shape of plane waves. When the bubble diameter is smaller than the diameter of the tube, the shock waves caused by the cavitation collapse spread to the surroundings in a spherical manner. Therefore, in theory, the smaller the cross-section of the circular tube, the stronger the reflection effect of the pipeline on the shock wave of cavitation collapse, the greater the energy when the two shock waves collide, and the stronger the intensity of the secondary cavitation.
After the first cycle of the initial bubble ends, according to the law of energy conservation,
E 0 = E S + E R + Δ E
where E 0 is the initial energy of the bubble; E S is the energy of the shock wave, that is, the energy dissipated by the bubble collapse through the shock wave; E R is the residual energy of the rebound bubble; and Δ E is the viscosity loss and internal energy change during the initial bubble movement. According to Tinguely, the energy distribution between the shock wave and the rebound of a spherical collapsing bubble is determined by a simple dimensionless parameter ( ξ ):
K S = E S E 0 = f ( ξ )
where
ξ = Δ p γ 6 P g 0 1 / γ ( p c 2 ) 1 1 / γ
where c, ρ , and γ represent the speed of sound, fluid density, and specific heat, respectively. Δ p is the pressure difference between the ambient pressure and the saturated vapor pressure, and P g 0 is the pressure of the gas at the maximum bubble radius. From Equation (12), it can be observed that E S increases with the increase in ξ , while the value of ξ has nothing to do with the maximum size of the bubble ( R m a x ). Under free oscillation conditions, Tinguely believes that T c / T 0 E R / E 0 1 K S , ignoring the changes in viscosity loss and internal energy. For the case where the bubble oscillates near the rigid boundary, the ratio of T c / T 0 is affected by the dimensionless distance ( γ ) between the bubble and the rigid wall. The rigid wall causes the change in the jet intensity, thereby causing the change in the shockwave energy. The wall situation at this time is more complicated than the free field and the horizontal rigid wall. The energy of secondary cavitation comes entirely from the reflected rarefaction wave, so
K = T c 1 T 0 = K r e f E S E 0 K r e f K S
where K is the ratio of the first secondary cavitation to the initial bubble period and K r e f represents the ratio of the energy transferred by the rarefaction wave to the secondary cavitation. The interaction between the rarefaction wave and the secondary cavitation is too complicated, including the influence of the later oscillation of the initial bubble, so it is impossible to accurately simulate a definite value.
Since the reflection of the rarefaction wave is caused by the sudden expansion of the tube end, the qualitative analysis shows that K r e f and K decrease with an increase in the tube diameter ( D t ). Therefore, this paper draws the image as shown in Figure 39 to study the influence of the size of the tube on the secondary cavitation period. Figure 39a takes the axial relative size of the cavitation bubble as the horizontal coordinate and the ratio of the first secondary cavitation period to the initial bubble period as the vertical coordinate. It can be seen from the figure that as the tube diameter changes from small to large, the energy dissipation of the shockwave reflection in the tube is large, and the energy converted into secondary cavitation is reduced, resulting in low secondary cavitation energy, low intensity, and a short period. However, when the diameter of the tube is small and does not change much, there may be a suitable γ t to maximize the period of secondary cavitation. Another parameter of the tube is the relative length of the circular tube ( γ L ). An image of the relationship with the period is shown in Figure 39b. It can be seen from the figure that as the length of the tube in the horizontal coordinate increases, the secondary cavitation period shows a trend of first increasing, then decreasing. When the length of the tube is the same, the smaller the diameter, the larger the secondary cavitation period, which is basically consistent with the conclusion in Figure 39a.
The period of bubbles in the tube is related to the size and occurrence position of the initial bubbles, and the period of secondary cavitation is also related to the position of the bubbles and the tube diameter ratio. As for the interaction between the reflected wave of the initial bubble, secondary cavitation, and the periodic oscillation of the initial bubble, further experimental and numerical work is needed to fully understand bubble oscillation in the tube.

6.3. Pumping Effect and Speed

In the structure of this experiment, the liquid is pumped to the side of the longer liquid column, that is, the area opposite the initial bubble position in the tube. In addition, the premise of secondary cavitation or pumping is that the length of the liquid column is much larger than the diameter of the tube. The fact that no secondary cavitation was found in the short tube ( L t = 100 mm ) experiment in this paper can also verify this conclusion. Therefore, the research on pumping speed is only for longer tubes ( L t = 200 mm ) and long tubes ( L t = 400 mm and 500 mm ). According to the previous inference, the initial bubble can only reach the maximum value when it is generated at the end of the tube, at which time the length of the liquid column on the right is 0. However, the energy dissipation of the bubble at this time does not meet the inference of the cavitation cycle. When the initial bubble occurs in the range of 0.1 < η b < 0.9 , the initial bubble expansion process has already pushed the liquid columns on both sides to move, and the conversion to the collapse process has changed the direction of movement. However, due to secondary cavitation and liquid inertia, the whole eventually oscillates in the opposite direction of the initial bubble. When the maximum diameter of the bubble is smaller than the inner diameter of the tube, the bubble is not forced to stretch in the tube.
This section qualitatively describes the effect of the tube and the location of the initial bubble, as shown in Figure 40. Figure 40a,b represent the expansion and collapse stages of the initial bubble, respectively.
The circles in the figure represent bubbles, and L 1 and L 2 are the lengths of the liquid columns on either side of the initial bubble, where the time for the liquid column to change its velocity direction is t 1 and t 2 , respectively. When the initial bubble appears at the symmetric center of the circular tube ( L 1 / L 2 = 1 , that is, t 1 / t 2 = 1 ), the initial bubble does not cause the liquid in the tube to produce a pumping effect. This is because bubbles can cause changes in the direction of liquid movement in the tube during expansion and collapse and cannot make the liquid in the tube flow in the same direction as a whole. For the bubble at the right end of the tube ( L 1 / L 2 > 1 , that is, t 1 / t 2 > 1 ), the liquid column with a length of L 1 does not have enough time to respond to the collapse process of the bubble, which helps to continuously pump the liquid. Within the parameter range studied in this paper, the larger the value of t 1 / T 0 , the weaker the response to the change in the direction of movement of the initial bubble on the left side, and it is more likely to cause pumping. The larger the value of L 1 / L 2 , the greater the pumping speed.
Figure 41a,b show the effects of the diameter and length of the tube on the pumping speed of the liquid, respectively, under the same initial bubble size. It is found that the experimental results are consistent with the previous conclusion that the larger the L 1 / L 2 value, the greater the pumping speed.
When the initial bubble is closer to the symmetrical center of the tube, the interaction between the secondary cavitation and the initial bubble becomes more complicated, affecting the pumping speed, which is manifested as an increase in the pumping speed in the experimental results.

7. Conclusions

In this work, we conducted experimental research on bubbles in tubes with different parameters. The jet is generated by the expansion of bubbles in the short tube, and the jet forms a vortex ring at the tube end. After the initial bubble collapses in the tube, the vortex ring moves away from the tube at an almost constant speed. The movement speed is related to the parameters of the bubble and the tube. The smaller the tube diameter, the greater the speed.
In addition, the vibration period of the vortex ring remains almost unchanged. For the initial bubble movement in the slightly longer tube, secondary cavitation caused by bubble collapse was found. Multiple secondary cavitations were studied in long tubes, and the conditions and locations of secondary cavitation were studied and discussed. For the period of secondary cavitation, under asymmetric conditions, the period of the first secondary cavitation and the initial bubble are approximately linearly related, which is related to the period coefficient (K), which is related to the tube diameter ratio ( γ t ) and the tube length ratio ( γ L ). In addition, the oscillation period of the first and second secondary cavitations was studied, and it was found that the two periods were in an obvious linear relationship. When far away from the center of symmetry, the smaller the value of η b —that is, the larger the ratio of the tube length on both sides of the bubble—the greater the pumping speed of the liquid in the tube; when close to the center of symmetry, due to the complex effects of bubble movement and secondary cavitation, the pumping speed is affected or even increased.
According to the research results of this paper, the intensity of the vortex ring effect can be reduced by reasonably controlling the expansion and contraction process of bubbles or adding appropriate control agents, which can reduce its impact on the stability of the system. In addition, secondary cavitation often leads to violent oscillations and pressure waves in the system. Long-term oscillations aggravate the wear of pipelines and equipment, resulting in reduced equipment reliability. By properly controlling the frequency and intensity of spark discharge, excessive secondary cavitation can be suppressed, thereby improving the stability of the pumping effect. On the contrary, stable bubble dynamics can effectively improve fluid transmission efficiency and reduce damage to the system structure. Reasonable structural pipeline and equipment design and optimization of the fluid path and bubble dynamics can also help improve the stability of the pumping effect and the long-term reliability of the system. For example, the flow rate can be increased by connecting pipelines in series or multiple structures in parallel, thereby increasing the pressure in the pipe to improve the pumping efficiency. How to make good use of multiple secondary cavitations is worth studying.

Author Contributions

Conceptualization, Y.G. and D.S.; methodology, Y.G.; software, Y.G. and J.W.; validation, J.W.; formal analysis, Y.G. and D.S.; resources, Y.G.; writing—original draft preparation, Y.G.; writing—review and editing, D.S.; funding acquisition, D.S. All authors have read and agreed to the published version of the manuscript.

Funding

This research was funded by the National Natural Science Foundation of China (Grant No. 12172100).

Data Availability Statement

The original contributions presented in this study are included in the article. Further inquiries can be directed to the corresponding authors.

Conflicts of Interest

The authors declare no conflicts of interest.

Appendix A

The simulation model reported in this paper has been uploaded to Github and can be downloaded from the following link. The mesh, boundary conditions, and parameters of each material are included in the model. The link is as follows: https://github.com/gouyvxin/G.

References

  1. Ishida, H.; Nuntadusit, C.; Kimoto, H.; Nakagawa, T.; Yamamoto, T. Cavitation bubble behavior near solid boundaries. cav2001: SessionA5. 003. 2001. Available online: https://resolver.caltech.edu/CAV2001:sessionA5.003 (accessed on 1 February 2025).
  2. Manmi, K.M.; Aziz, I.A.; Arjunan, A.; Saeed, R.K.; Dadvand, A. Three-dimensional oscillation of an acoustic microbubble between two rigid curved plates. J. Hydrodyn. 2021, 33, 1019–1034. [Google Scholar] [CrossRef]
  3. Su, B.; Yao, X.; Cui, X. Experimental research of underwater explosion bubble dynamics between two parallel plates with various distances. Appl. Ocean. Res. 2022, 122, 103081. [Google Scholar] [CrossRef]
  4. Gong, S.; Ohl, S.; Klaseboer, E.; Khoo, B. Interaction of a spark-generated bubble with a two-layered composite beam. J. Fluids Struct. 2018, 76, 336–348. [Google Scholar] [CrossRef]
  5. Soroureddin, A.; Shervani-Tabar, M.T.; Aminfar, H. Numerical investigation into the effect of viscosity on bubble dynamics in a narrow channel. Sci. Iran. 2020, 27, 2419–2432. [Google Scholar]
  6. Gonzalez-Avila, S.R.; Van Blokland, A.C.; Zeng, Q.; Ohl, C.D. Jetting and shear stress enhancement from cavitation bubbles collapsing in a narrow gap. J. Fluid Mech. 2020, 884, A23. [Google Scholar] [CrossRef]
  7. Zeng, Q.; Gonzalez-Avila, S.R.; Ohl, C.D. Splitting and jetting of cavitation bubbles in thin gaps. J. Fluid Mech. 2020, 896, A28. [Google Scholar] [CrossRef]
  8. Mohammadzadeh, M.; Li, F.; Ohl, C.D. Shearing flow from transient bubble oscillations in narrow gaps. Phys. Rev. Fluids 2017, 2, 014301. [Google Scholar] [CrossRef]
  9. Brujan, E.A.; Zhang, A.M.; Liu, Y.L.; Ogasawara, T.; Takahira, H. Jetting and migration of a laser-induced cavitation bubble in a rectangular channel. J. Fluid Mech. 2022, 948, A6. [Google Scholar] [CrossRef]
  10. Yang, S.; De Jesus, A.M.; Meng, D.; Nie, P.; Darabi, R.; Azinpour, E.; Zhu, S.P.; Wang, Q. Very high-cycle fatigue behavior of steel in hydrogen environment: State of the art review and challenges. Eng. Fail. Anal. 2024, 166, 108898. [Google Scholar] [CrossRef]
  11. Yang, S.; Meng, D.; Díaz, A.; Yang, H.; Su, X.; Jesus, A.M.d. Probabilistic modeling of uncertainties in reliability analysis of mid-and high-strength steel pipelines under hydrogen-induced damage. Int. J. Struct. Integr. 2025, 16, 39–59. [Google Scholar] [CrossRef]
  12. Yuan, H.; Prosperetti, A. The pumping effect of growing and collapsing bubbles in a tube. J. Micromechan. Microeng. 1999, 9, 402. [Google Scholar] [CrossRef]
  13. Ory, E.; Yuan, H.; Prosperetti, A.; Popinet, S.; Zaleski, S. Growth and collapse of a vapor bubble in a narrow tube. Phys. Fluids 2000, 12, 1268–1277. [Google Scholar] [CrossRef]
  14. Ni, B.Y.; Zhang, A.M.; Wang, Q.X.; Wang, B. Experimental and numerical study on the growth and collapse of a bubble in a narrow tube. Acta Mech. Sin. 2012, 28, 1248–1260. [Google Scholar] [CrossRef]
  15. Zou, J.; Li, B.; Ji, C. Interactions between two oscillating bubbles in a rigid tube. Exp. Therm. Fluid Sci. 2015, 61, 105–112. [Google Scholar] [CrossRef]
  16. Ji, C.; Li, B.; Zou, J. Secondary cavitation in a rigid tube. Phys. Fluids 2017, 29, 082107. [Google Scholar] [CrossRef]
  17. Wang, S.P.; Wang, Q.; Zhang, A.M.; Stride, E. Experimental observations of the behaviour of a bubble inside a circular rigid tube. Int. J. Multiph. Flow 2019, 121, 103096. [Google Scholar] [CrossRef]
  18. Li, H.; Huang, J.; Wu, X.; Zhang, J.; Wang, J.; Wang, Y.; Huang, C. Dynamic behaviors of a laser-induced bubble and transition mechanism of collapse patterns in a tube. AIP Adv. 2020, 10, 035210. [Google Scholar] [CrossRef]
  19. Aghdam, A.H.; Khoo, B.; Farhangmehr, V.; Shervani-Tabar, M. Experimental study on the dynamics of an oscillating bubble in a vertical rigid tube. Exp. Therm. Fluid Sci. 2015, 60, 299–307. [Google Scholar] [CrossRef]
  20. Zhang, G.; Zhu, Y.; Yang, J.; Sun, M. Liquid jets produced by an immersed electrical explosion in round tubes. Phys. Fluids 2017, 29, 062102. [Google Scholar] [CrossRef]
  21. Ren, Z.; Li, B.; Xu, P.; Wakata, Y.; Liu, J.; Sun, C.; Zuo, Z.; Liu, S. Cavitation bubble dynamics in a funnel-shaped tube. Phys. Fluids 2022, 34. [Google Scholar] [CrossRef]
  22. Luo, X.; Chen, T.; Xiao, W.; Yao, X.; Liu, J. The dynamics of a bubble in the internal fluid flow of a pipeline. Phys. Fluids 2022, 34. [Google Scholar] [CrossRef]
  23. Sugimoto, Y.; Hamamoto, M. Measurements of laser induced bubble behavior in elastic tube and temperature around bubble in TUL treatment. J. Flow Control. Meas. Vis. 2020, 8, 134. [Google Scholar] [CrossRef]
  24. Jang, N.W.; Gracewski, S.M.; Abrahamsen, B.; Buttaccio, T.; Halm, R.; Dalecki, D. Natural frequency of a gas bubble in a tube: Experimental and simulation results. J. Acoust. Soc. Am. 2009, 126, EL34–EL40. [Google Scholar] [CrossRef]
  25. Liu, Y.; Luo, J. Experimental study on damage mechanism of blood vessel by cavitation bubbles. Ultrason. Sonochem. 2023, 99, 106562. [Google Scholar] [CrossRef] [PubMed]
  26. Wang, S.; Zhang, A.; Liu, Y.; Zeng, D. Numerical simulation of bubble dynamics in an elastic vessel. Eur. Phys. J. E 2013, 36, 119. [Google Scholar] [CrossRef] [PubMed]
  27. Wang, S.; Wang, Q.; Leppinen, D.; Zhang, A.; Liu, Y. Acoustic bubble dynamics in a microvessel surrounded by elastic material. Phys. Fluids 2018, 30. [Google Scholar] [CrossRef]
  28. Xie, Y.; Hu, J.; Lei, W.; Qian, S. Prediction of vascular injury by cavitation microbubbles in a focused ultrasound field. Ultrason. Sonochem. 2022, 88, 106103. [Google Scholar] [CrossRef]
  29. Meng, D.; Yang, S.; De Jesus, A.M.; Fazeres-Ferradosa, T.; Zhu, S.P. A novel hybrid adaptive Kriging and water cycle algorithm for reliability-based design and optimization strategy: Application in offshore wind turbine monopile. Comput. Methods Appl. Mech. Eng. 2023, 412, 116083. [Google Scholar] [CrossRef]
  30. Yang, S.; Meng, D.; Yang, H.; Luo, C.; Su, X. Enhanced soft Monte Carlo simulation coupled with SVR for structural reliability analysis. In Proceedings of the Institution of Civil Engineers-Transport; Emerald Publishing Limited: Bingley, UK, 2024; pp. 1–41. [Google Scholar]
  31. Meng, D.; Yang, H.; Yang, S.; Zhang, Y.; De Jesus, A.M.; Correia, J.; Fazeres-Ferradosa, T.; Macek, W.; Branco, R.; Zhu, S.P. Kriging-assisted hybrid reliability design and optimization of offshore wind turbine support structure based on a portfolio allocation strategy. Ocean. Eng. 2024, 295, 116842. [Google Scholar] [CrossRef]
  32. Johnson, V.E., Jr.; Chahine, G.L.; Lindenmuth, W.T.; Conn, A.F.; Frederick, G.S.; Giacchino, G.J., Jr. Cavitating and Structured Jets for Mechanical Bits to Increase Drilling Rateart I: Theory and Concepts. J. Energy Resour. Technol. 1984, 106, 282–288. [Google Scholar] [CrossRef]
Figure 1. Images of experiments studying bubbles in a confined area: (a) Between the two boards, (b) In a ridid tube, (c) In a soft tube.
Applsci 15 02569 g001
Figure 2. (a) Schematic diagram of the cavitation experiment in a tube; (b) schematic diagram of the bubble generation bracket; (c) Position of camera and light.
Applsci 15 02569 g002
Figure 3. Schematic diagram of experimental cavitation parameters in a tube.
Applsci 15 02569 g003
Figure 4. (a) Experimental results in a tube; (b) Abaqus numerical simulation results.
Applsci 15 02569 g004
Figure 5. Images of a bubble in a tube under the conditions of η b = 0.5 , γ t = 0.685 , γ L = 6.85 , and Λ = 10 .
Applsci 15 02569 g005
Figure 6. Images of a bubble in a tube under the conditions of η b = 0.5 , γ t = 0.548 , γ L = 6.85 , and Λ = 12.5 (The red circle shows the flow direction in the edge of the tube).
Applsci 15 02569 g006
Figure 7. Images of a bubble in a tube under the conditions of η b = 0.2 , γ t = 0.685 , γ L = 6.85 , and Λ = 10 .
Applsci 15 02569 g007
Figure 8. Image of a bubble in a tube under the conditions of η b = 0.3 , γ t = 0.685 , γ L = 6.85 , and Λ = 10 .
Applsci 15 02569 g008
Figure 9. Images of a bubble in a tube under the conditions of η b = 0.2 , γ t = 0.411 , γ L = 6.85 , and Λ = 16.67 .
Applsci 15 02569 g009
Figure 10. (a,c,d) Pressures at the initial bubble positions of η b = 0.5 , η b = 0.2 , and η b = 0.3 and γ t = 0.685 , γ L = 6.85 , and Λ = 10 ; (b) pressures at the initial bubble positions of η b = 0.5 , γ t = 0.411 , γ L = 6.85 , and Λ = 16.67 .
Applsci 15 02569 g010
Figure 11. The pressure on the center line and wall generatrix of the circular tube under working conditions of η b = 0.5 , γ t = 0.685 , γ L = 6.85 , and Λ = 10 (ABCDEF are the moments of typical bubble shapes, and (a)–(d) are the pressure states at these moments.).
Applsci 15 02569 g011
Figure 12. The surrounding liquid pressure and velocity under the conditions of η b = 0.5 , γ t = 0.685 ,   γ L = 6.85 , and Λ = 10 (a) Pressure, (b) velocity.
Applsci 15 02569 g012
Figure 13. Schematic diagram of vortex ring parameters.
Applsci 15 02569 g013
Figure 14. Images of multiple vortex ring periods under the conditions of η b = 0.2 , γ t = 0.685 ,   γ L = 6.85 , and Λ = 10 .
Applsci 15 02569 g014
Figure 15. (a) Vortex ring displacement–time relationship; (b) vortex ring thickness–time relationship.
Applsci 15 02569 g015
Figure 16. Radial oscillation of the dimensionless thickness of the vortex ring.
Applsci 15 02569 g016
Figure 17. Bubble morphology under the conditions of η b = 0.5 , γ t = 0.411 , γ L = 13.70 , and Λ = 33.33 .
Applsci 15 02569 g017
Figure 18. Bubble morphology under the conditions of η b = 0.2 , γ t = 0.411 , γ L = 13.70 , and Λ = 33.33 .
Applsci 15 02569 g018
Figure 19. Bubble morphology under the conditions of η b = 0.2 , γ t = 1.37 , γ L = 13.70 , and Λ = 10 .
Applsci 15 02569 g019
Figure 20. Bubble morphology under the conditions of η b = 0.2 , γ t = 1.37 , γ L = 13.70 , and Λ = 6.67 .
Applsci 15 02569 g020
Figure 21. Figure of bubble morphology under the conditions of η b = 0.2 , γ t = 3.42 , γ L = 13.70 , and Λ = 4 .
Applsci 15 02569 g021
Figure 22. Bubble morphology under the conditions of η b = 0.1 , γ t = 0.68 , γ L = 13.70 , and Λ = 20 .
Applsci 15 02569 g022
Figure 23. Bubble morphology under the conditions of η b = 0.3 , γ t = 0.68 , γ L = 13.70 , and Λ = 20 .
Applsci 15 02569 g023
Figure 24. Bubble morphology under the conditions of η b = 0.4 , γ t = 0.68 , γ L = 13.70 , and Λ = 20 .
Applsci 15 02569 g024
Figure 25. Secondary cavitation position compared with data from Ji [16] (initial bubble position: η b = 0.2 ).
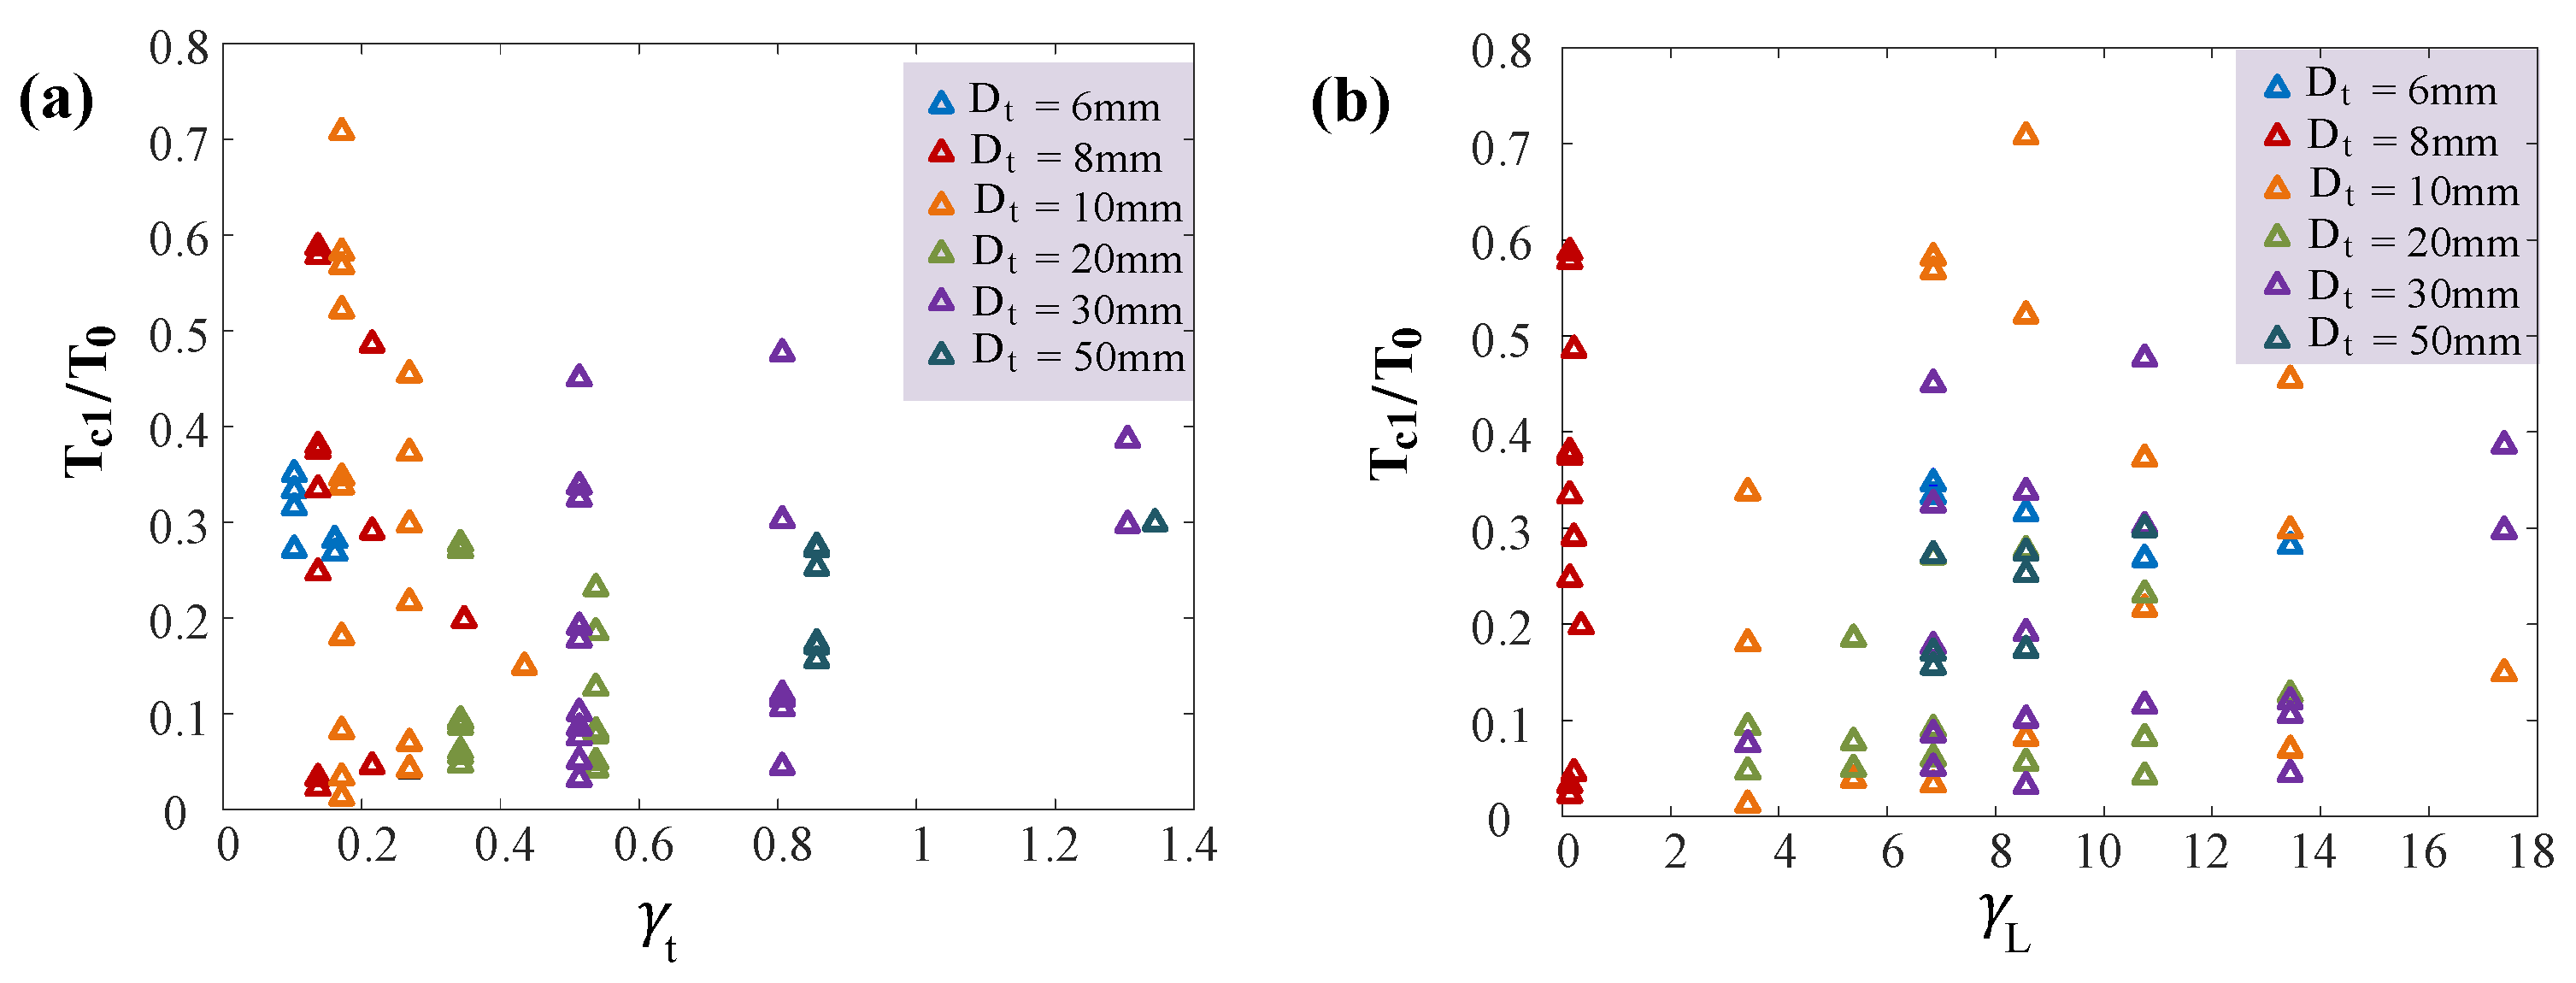
Applsci 15 02569 g025
Figure 26. Secondary cavitation deformation process: (a) η b = 0.2 , γ t = 1.37 , γ L = 13.70 , and Λ = 10 ; (b) η b = 0.2 , γ t = 2.05 , γ L = 13.70 , and Λ = 6.67 ; (c) η b = 0.1 , γ t = 0.685 , γ L = 13.70 , and Λ = 10 ; (d) η b = 0.1 , γ t = 1.37 , γ L = 13.70 , and Λ = 10 .
Applsci 15 02569 g026
Figure 27. Locations of multiple secondary cavitations under several typical working conditions.
Applsci 15 02569 g027
Figure 28. Bubble morphology under the conditions of η b = 0.5 , γ t = 0.548 , γ L = 27.40 , and Λ = 50 .
Applsci 15 02569 g028
Figure 29. Bubble morphology under the conditions of η b = 0.5 , γ t = 2.05 , γ L = 27.40 , and Λ = 13.33 .
Applsci 15 02569 g029
Figure 30. Bubble morphology under the conditions of η b = 0.1 , γ t = 2.05 , γ L = 27.40 , and Λ = 13.33 .
Applsci 15 02569 g030
Figure 31. Bubble morphology under the conditions of η b = 0.2 , γ t = 2.05 , γ L = 27.40 , and Λ = 13.33 .
Applsci 15 02569 g031
Figure 32. Bubble morphology under the conditions of η b = 0.3 , γ t = 2.05 , γ L = 27.40 , and Λ = 13.33 .
Applsci 15 02569 g032
Figure 33. Bubble morphology under the conditions of η b = 0.4 , γ t = 2.05 , γ L = 27.40 , and Λ = 13.33 .
Applsci 15 02569 g033
Figure 34. Boundary conditions for the occurrence of secondary cavitation (a) Relationship between tube length to tube diameter ratio and secondary cavitation difference, (b) Relationship between bubble generation location and bubble size and secondary cavitation.
Applsci 15 02569 g034
Figure 35. Multiple secondary cavitation deformation under the conditions of η b = 0.5 ,   γ t = 2.05 , γ L = 27.40 , and Λ = 13.33 (The red upper triangle is the left edge of the cavitation, and the blue lower triangle is the right edge of the cavitation).
Applsci 15 02569 g035
Figure 36. Multiple secondary cavitation deformation under the conditions of γ t = 2.05 ,   γ L = 27.40 , and Λ = 13.33 : (a) η b = 0.1 ; (b) η b = 0.2 ; (c) η b = 0.3 ; (d) η b = 0.4 .
Applsci 15 02569 g036
Figure 37. (a) The center position of the first secondary cavitation; (b) the length of the first secondary cavitation.
Applsci 15 02569 g037
Figure 38. (ac) The relationship between the initial bubble cycle and the first secondary cavitation cycle; (df) the relationship between the first secondary cavitation cycle and the second secondary cavitation cycle.
Applsci 15 02569 g038
Figure 39. (a) The relationship between the secondary cavitation period and the relative diameter of the circular tube; (b) the relationship between the secondary cavitation period and the relative length of the circular tube.
Applsci 15 02569 g039
Figure 40. Schematic diagram of pumping of bubbles moving in a tube.
Applsci 15 02569 g040
Figure 41. Relationship between secondary cavitation pumping speed and circular tube parameters. (a,b) D m a x = 18.6 ; (c,d) D m a x = 29.2 .
Applsci 15 02569 g041
Disclaimer/Publisher’s Note: The statements, opinions and data contained in all publications are solely those of the individual author(s) and contributor(s) and not of MDPI and/or the editor(s). MDPI and/or the editor(s) disclaim responsibility for any injury to people or property resulting from any ideas, methods, instructions or products referred to in the content.