Article

YOLO-SR: A Modified YOLO Model with Strip Pooling and a Rectangular Self-Calibration Module for Defect Segmentation in Smart Card Surfaces


Department of Computer Science, Chungbuk National University, Chungdae-ro 1, Seowon-gu, Cheongju 28644, Republic of Korea
*
Author to whom correspondence should be addressed.
Appl. Sci. 2025, 15(24), 12980; https://doi.org/10.3390/app152412980
Submission received: 28 October 2025 / Revised: 1 December 2025 / Accepted: 4 December 2025 / Published: 9 December 2025
(This article belongs to the Section Computing and Artificial Intelligence)

Abstract

Detecting fine, weak-textured defects with discontinuous boundaries on complex industrial surfaces is challenging due to interference from background textures and characters, as well as the scarcity of labeled data. To address this issue, we propose YOLO-SR, an engineering modification of YOLO11 tailored to defect segmentation on smart-card surfaces. Rather than introducing a new detection architecture, YOLO-SR reuses the backbone–neck–head design of YOLO11 and only adjusts a few modules to better capture elongated, low-contrast defects. The approach comprises two key components: first, embedding Strip Pooling (SP) within the C3K2 module to form C3K2_SP; second, a Rectangular Self-Calibration Module (RCM) is interposed after the top-level semantic layer. RCM generates rectangular gates to spatially recalibrate local responses, suppressing interference from complex textures and characters. To mitigate data scarcity and distributional bias, a texture-adaptive procedural defect synthesis strategy was developed. This strategy generates defect samples that conform to the background texture statistics of high-quality backgrounds. Experiments on the integrated circuit chip (ICChip) and signature plate (SignPlate) datasets show that YOLO-SR outperforms the YOLO11 baseline. Results indicate that SP and RCM complement each other by integrating directional priors from mid-to-high layers with top-level shape self-calibration. This enhances the visibility and localization stability of elongated defects while maintaining efficient inference.

1. Introduction

1.1. Research Background

Recently, artificial intelligence (AI), particularly deep learning technology, has achieved significant breakthroughs in image understanding, language processing, and automated control, and continues to be implemented in industrial manufacturing scenarios [1]. As a crucial branch of AI, computer vision (CV), leveraging its strong representational capabilities for images or videos, is gradually becoming a key enabling technology for smart manufacturing [2]. However, at the implementation level in industrial manufacturing scenarios, a gap remains between automation levels and algorithmic progress. Surface defect detection in many scenarios still relies primarily on manual visual inspection. While manual methods allow focused re-examination of specific areas, they are overall time-consuming, labor-intensive, inefficient, and costly. Moreover, they are prone to oversight in complex operating conditions [3,4]. These limitations make it difficult to meet the demands of modern large-scale, high-speed production.
To enhance inspection efficiency, the industry has widely adopted traditional machine learning paradigms for defect identification and classification, such as support vector machines, decision trees, and naive Bayes methods [5,6]. However, these approaches typically rely on manually designed features and fine-tuned threshold parameters, which render them sensitive to background variations, fluctuations in imaging conditions, and defect morphological diversity, thereby limiting their generalization capabilities. On actual production lines at similar manufacturing stages, rule-based, template-based, and difference-based automated optical inspection (AOI) systems are also widely adopted. In standardized scenarios characterized by single product categories, fixed clamping postures, controlled lighting and lens parameters, and stable background textures, inspection efficiency can be significantly enhanced. However, when confronted with complex backgrounds, diverse defect types, and minute imperfections, both false positives and false negatives frequently occur simultaneously. Moreover, the chain reaction of issues stemming from overkill, such as manual re-inspection and escalating costs, becomes particularly pronounced [7]. Existing studies have also pointed out that the pass rate of traditional AOI systems is relatively high, and enterprises are often forced to introduce manual re-inspections, thereby further increasing human and time costs [8]. Additionally, practical challenges such as the difficulty of detecting small defects, multi-scale target recognition, and data scarcity or class imbalance further limit the applicability and adoption speed of existing inspection solutions on real production lines [9]. As product appearances and manufacturing processes continue to diversify, these pain points become increasingly prominent. Consequently, an urgent need for a more robust visual inspection solution with stronger generalization capabilities exists to address scenarios involving small objects and subtle defects in complex backgrounds.

1.2. Critical Areas and Verification Challenges of Smart Cards

In numerous industrial applications, smart card production lines demand exceptionally stringent consistency in both appearance and functionality. The coexistence of multi-material laminated structures (substrate, laminate, metal contacts, or ink) and high-speed production rates exacerbates challenges posed by complex backgrounds, small targets, and minute scratches or foreign particles. This study focuses on two critical areas in smart card manufacturing: the ICChip zone and the SignPlate panel zone. The ICChip zone serves as the core functional area for achieving electrical contact and secure computing in smart cards, primarily responsible for tasks such as information storage, identity authentication, and encrypted communication. Its structure comprises multiple layers formed through processes including metal contact surface preparation, encapsulation, substrate formation, and soldering (or conductive adhesives) [10]. In actual production, defects in this area, such as encapsulation cracks, solder joint failures, chip or contact misalignment, foreign particle contamination, or surface scratches, can trigger varying degrees of functional failure. Minor issues may cause increased contact resistance, leading to unstable data read or write operations, while more serious malfunctions may cause encrypted handshake failures, transaction interruptions, or even complete card rejection [11].
In contrast, the SignPlate panel area is located on the card’s reverse side. As a critical medium for compliance verification and manual comparison, its surface is typically constructed through lamination, coating, and printing processes to form a uniform, writable, and scratch-resistant substrate. However, abnormalities in this area, such as scratches, stains, indentations, localized delamination, or uneven edges, not only compromise the card’s aesthetic quality and brand perception but may also reduce SignPlate legibility. This will disrupt the subsequent identification process and significantly increase the risks of rework and scrapping [12].

1.3. Objectives and Methodology Overview

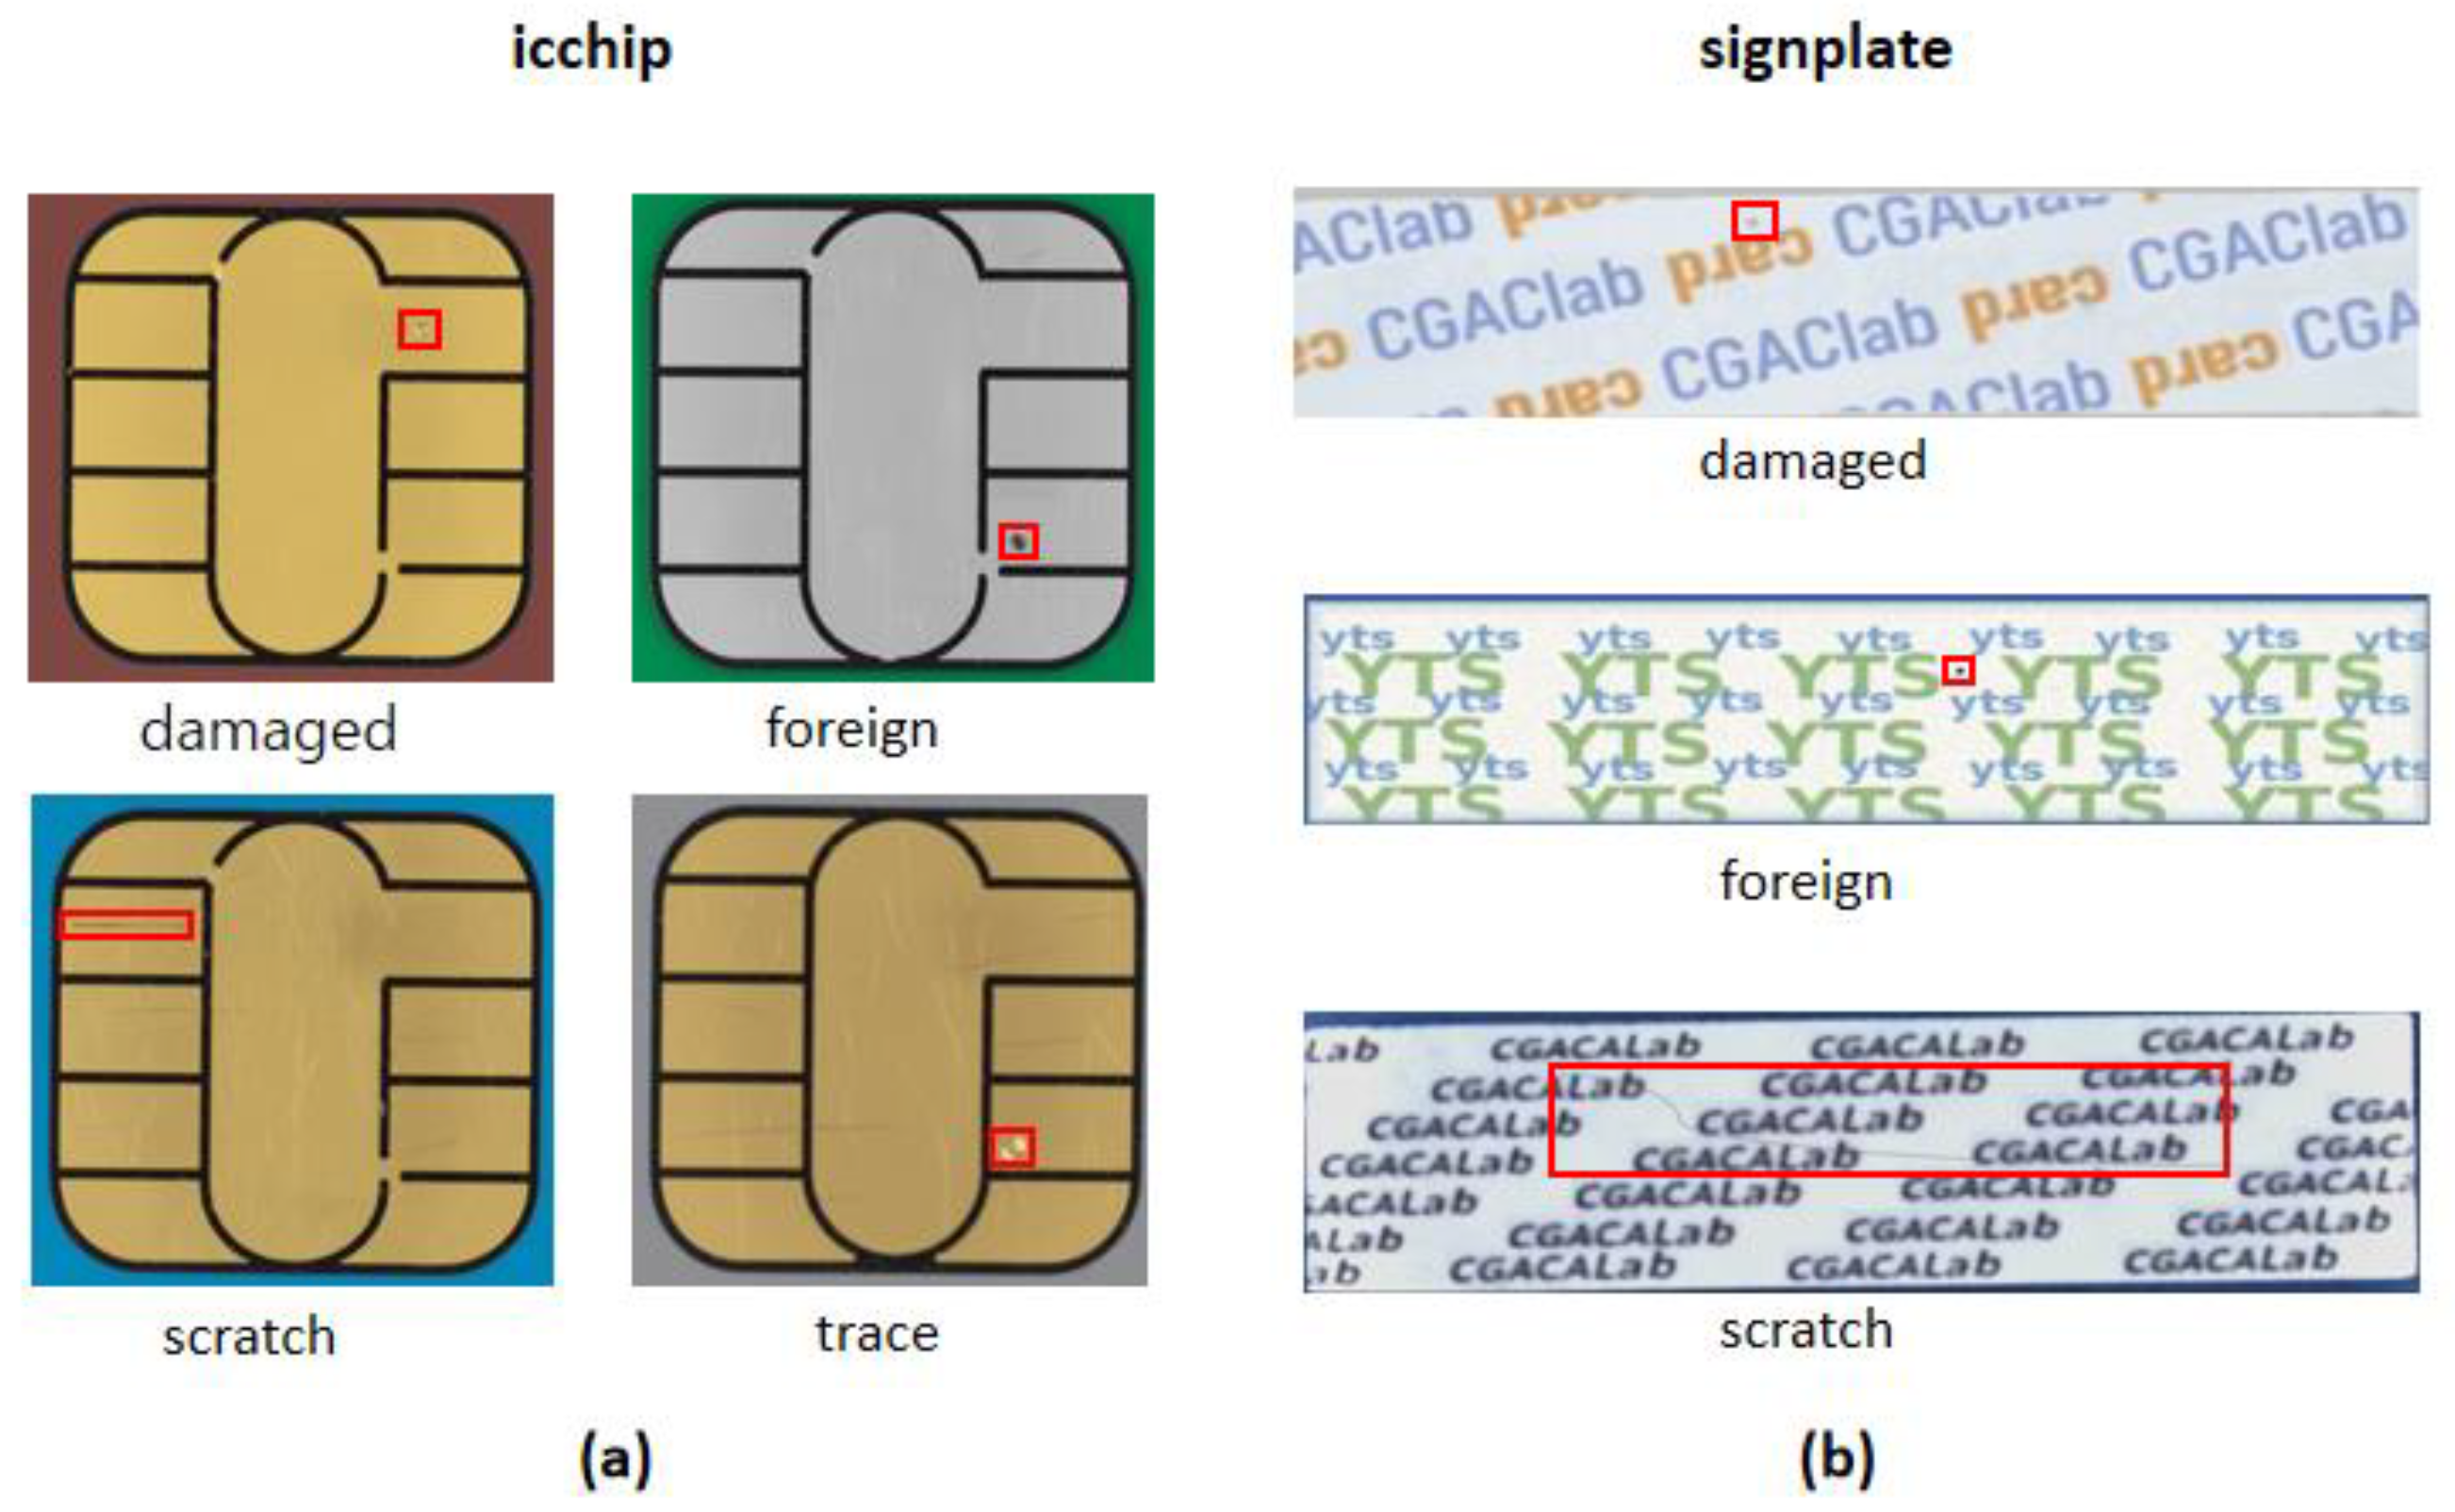
In summary, both the ICChip and SignPlate areas in smart card quality inspection are subject to dual constraints of functional reliability and appearance or compliance, making them key targets for quality inspection systems. Simultaneously, due to the material and process characteristics of these areas (such as high reflectivity of metal surfaces, textural variations, and the presence of localized minute defects), detecting small-scale and elongated defects poses higher precision requirements and robustness challenges. In the ICChip region, “Damaged” mainly corresponds to coating peel-off, “Foreign” refers to tiny contaminating particles, “Scratch” denotes fine hairline scratches, and “Trace” indicates shallow press marks that can be easily confused with the highly reflective metal background. In the SignPlate region, “Damaged” manifests as coating damage, “Foreign” consists of residual dot-like particles, and “Scratch” appears as elongated, low-contrast lines along the grain direction (Figure 1).
Compared to general surface inspection tasks, the primary challenges in actual production environments center on identifying small defects. First, the small scale and low contrast of defect targets make them highly susceptible to confusion with complex backgrounds such as metal reflections, process textures, and printing noise. Second, some defects manifest as elongated, strip-like, or discontinuous fine lines with extremely thin profiles and fragmented or unstable boundaries, leading to issues such as incomplete contours and discontinuous localization during detection [13]. Finally, sample scarcity and imbalanced class distribution are prevalent, making model training susceptible to bias and resulting in insufficient recall [14].
Against this backdrop, achieving stable and reliable small defect detection performance requires models not only to exhibit directional sensitivity toward slender structures but also to effectively enhance the signal-to-noise ratio of defects against complex backgrounds. Concurrently, reasonable data augmentation and task design strategies must mitigate the adverse effects of limited data scale and imbalanced distribution, thereby ensuring the robustness and generalization capability of detection systems in real-world production environments.
To address this, we propose an overarching solution along two main lines. First, on the data side, we construct a small defect sample library centered around target defect types. By employing a locally texture-adaptive defect synthesis strategy, we mitigate the impact of limited data scale and category imbalance. Second, on the model side, we unify the task as instance segmentation, introducing direction-sensitive context aggregation to enhance the perception of slender structure continuity. Combined with rectangular-shaped self-calibration to suppress boundary consistency degradation caused by complex backgrounds, this approach simultaneously improves small target separability and contour stability. These designs aim to achieve higher Recall and more robust localization performance in complex real-world production backgrounds with minimal structural modifications, providing a practical solution for automated quality inspection in financial card manufacturing. In terms of related work, traditional card-defect inspection mostly relies on geometric alignment, rule-based AOI, and thresholding, which are sensitive to layout and illumination variations and struggle with low-contrast, fine-line defects. More recent studies have introduced deep-learning-based pipelines for bank card detection and number recognition, often building on YOLO-style detectors, but they primarily focus on whole-card layouts and character regions rather than tiny, elongated defects in local areas such as ICChip and SignPlate. On the data side, a variety of augmentation and defect-synthesis strategies have been explored for industrial surfaces; however, most of them are not tailored to small ROIs with complex reflections and strong texture–illumination coupling. Section 2 provides a detailed review of these approaches and positions our work in this context.
This paper is organized into six sections. Section 1 and Section 2 jointly provide the introduction and state-of-the-art background. Section 3 and Section 4 describe the materials and methods, including the datasets, the texture-adaptive defect synthesis strategy, and the proposed YOLO-SR model. Section 5 presents the experimental results and discussion. Section 6 concludes the paper and outlines the limitations of this study and directions for future work.

2. Related Work

Traditional card defect detection primarily relies on geometric alignment and thresholding rules. Chen et al. proposed reconstructing high-fidelity reference images based on film layers and substrates, combining AKAZE features, perspective correction, and CLAHE differential Canny algorithms to detect scratches and hair in ID card images [15]. However, such methods are highly sensitive to thresholds and templates, requiring frequent recalibration across layouts and batches. They also struggle to isolate low-contrast, fine-line defects on complex textures, making them unsuitable for supporting layout and imaging variations in large-scale production lines. End-to-end pipelines for bank cards have also been validated. Lin et al. constructed a complex-scenario bank card dataset, employing YOLOv3 for card detection and classification while integrating number recognition workflows, significantly enhancing overall recognition accuracy and robustness [16]. As a representative of single-stage object detection, the YOLO series achieves both classification and localization simultaneously in a single forward pass through end-to-end dense regression and a multi-scale feature pyramid. Balancing accuracy and real-time performance, recent YOLOv3–v11 variants have become mainstream baselines for whole-card detection and character-region localization in industrial inspection [17]. Other approaches couple object detection with sequence recognition or lightweight classification to reduce misclassification and deployment costs, such as using YOLOv3 for initial number region localization followed by lightweight classifiers or sequence networks for character recognition [18,19]. These approaches target whole-card detection and character reading, focusing on the main body and number block. In contrast, our focus areas—the SignPlate panel and ICChip—occupy less than 5% of the card, suffer from sample scarcity, and are sensitive to boundary consistency. Generic detectors exhibit insufficient Recall on such “small, thin-boundary, low-texture” regions and lack modeling for elongated defects.
Traditional geometric and illumination enhancements, such as rotation, flipping, scaling, brightness or contrast perturbations, etc., improve generalization for general tasks but easily disrupt layout and physical lighting consistency in card scenarios, diluting the boundaries of fine lines or weak texture defects [20]. Mosaic, MixUp, and Copy-Paste enrich scale and background combinations, but for ROIs less than 5% (e.g., SignPlate and ICChip), they often introduce unrealistic blended edges and mismatched backgrounds, hindering the learning of true defect boundaries and highlight patterns [20,21]. AutoAugment and RandAugment employ generic strategy search without ROI awareness and are prone to distribution drift in scenarios relying on micro-scale texture-illumination coupling [22]. CutPaste and GAN-synthesized defects are effective under unsupervised and few-shot conditions but struggle to accurately reproduce metallic highlights, local normals, and substrate textures. They are prone to artifacts and false edges and do not fully align with the supervised multi-class segmentation framework proposed herein [23,24]. To overcome the above limitations of generic and unsupervised augmentation methods in card defect scenarios, this paper adopts a constrained enhancement strategy that combines local texture adaptation, ROI control, and replicable overlay. This strategy aims to generate defect samples that preserve boundary authenticity and controllable distributions, while remaining compatible with the supervised instance segmentation paradigm used in this work.
Location information is crucial for generating spatial selective attention maps. Recently, Coordinate Attention (CA), which decomposes attention along height and width directions, has explicitly encoded location information in channel attention through two one-dimensional global aggregation branches, balancing lightweight processing with long-range dependencies [25]. In industrial defect detection tasks, integrating directionally decomposed global aggregation into YOLO has been validated to enhance detection performance for small objects and complex textured backgrounds. For instance, incorporating CA with a decoupled detection head in steel plate surface defect detection yields stable real-time accuracy gains, demonstrating the value of axial directional perception for surface defects [26]. A conceptually similar approach, Strip Pooling (SP), employs 1 × N or N × 1 strip pooling to explicitly aggregate horizontal or vertical long-range context, enhancing elongated structures and boundary details. It demonstrates strong modeling capabilities for strip or linear targets in both semantic segmentation and subsequent defect detection adaptations, while seamlessly integrating into trunk and neck modules [27]. However, relying solely on axial direction aggregation often fails to adapt to target geometry and robustly align foregrounds within rectangular device regions and extremely low-texture environments. This approach is prone to boundary jitter and local fragmentation when encountering strong specular highlights or sparsely textured backgrounds. Existing segmentation work indicates that subsampling and simple stitching degrade boundary quality without shape boundary constraints or specialized boundary modeling, necessitating compensation through shape flow or boundary refinement [28,29]. Furthermore, directly cascading multi-level features using single-branch attention—either channel-wise or spatial—struggles to fully recover and reconstruct spatial details lost during downsampling. Consequently, channel × spatial collaborative attention is widely employed to enhance fine-grained localization and improve semantic and boundary consistency during cross-layer fusion. For instance, in thin-layer, fine-boundary tasks, such as clouds or cloud shadows, combining strip-based attention with global attention reduces boundary roughness and improves contour continuity [14,30]. Based on these observations, we further introduce Rectangular Calibration Modules (RCM) to supplement directional aggregation with shape calibration and foreground alignment. RCM first performs global pooling along horizontal and vertical axes to obtain dual-axis context, then adjusts attention shapes via a rectangular calibration function (large-kernel strip convolutions) and fuses them lightly with local details, making attention more aligned with foreground geometry and boundaries while simultaneously enabling axis-wise global context aggregation at the semantic pyramid level. This enhances discriminative power for weakly textured and small targets while improving boundary stability during feature abstraction [31]. This approach has been validated across multiple downstream tasks. In real-time smoke detection Transformers, the RCM-based foreground-focused pyramid significantly boosts detection rates and robustness for small smoke plumes with weak texture and fine-scale features [32]. In remote sensing, as well as industrial and crop detection, embedding RCM into YOLO or decoders suppresses complex backgrounds, enhances foreground saliency, and facilitates cross-scale interactions, yielding higher mAP or mIoU and more stable boundary performance [33,34,35]. Therefore, we employ a complementary design combining SP to provide a directional prior for axial one-dimensional global aggregation and RCM to achieve rectangular shape self-calibration and foreground alignment. The former enhances directional sensitivity to elongated defects, while the latter amplifies the presence of small, weak defect targets, particularly elongated stripes and defects with fuzzy boundaries in complex backgrounds. Working synergistically with the segmentation head, this approach achieves overall performance improvement without altering the three-scale inference topology or real-time constraints. Recently, the object-detection and segmentation landscape has continued to evolve rapidly with the introduction of YOLOv8–11 and transformer-based detectors. For example, MCRS-YOLO focuses on multi-aggregation cross-scale feature fusion for remote sensing targets [33], WMC-RTDETR leverages lightweight transformer decoders for real-time plant disease detection [34], and a YOLOv11-based cotton leaf disease detector demonstrates the practical advantages of the latest YOLO family in agricultural inspection tasks [35]. These works highlight a general trend toward strengthening multi-scale representation and long-range context while maintaining real-time performance. In this context, our YOLO-SR is positioned as an application-oriented adaptation on top of the YOLO11 framework. We integrate SP and RCM blocks together with a defect-synthesis pipeline to better handle tiny, elongated defects in small ROIs on smart-card surfaces under industrial deployment constraints.

3. Materials and Methods: Dataset and Data Augmentation

In this study, the smart card defect dataset we constructed initially faced two common challenges: a relatively small overall dataset size and significant sample imbalance across defect categories. To enhance the deep learning model’s ability to recognize different defect types while mitigating overfitting and training bias, we designed and implemented customized data augmentation strategies specifically for the SignPlate area and the ICChip area.
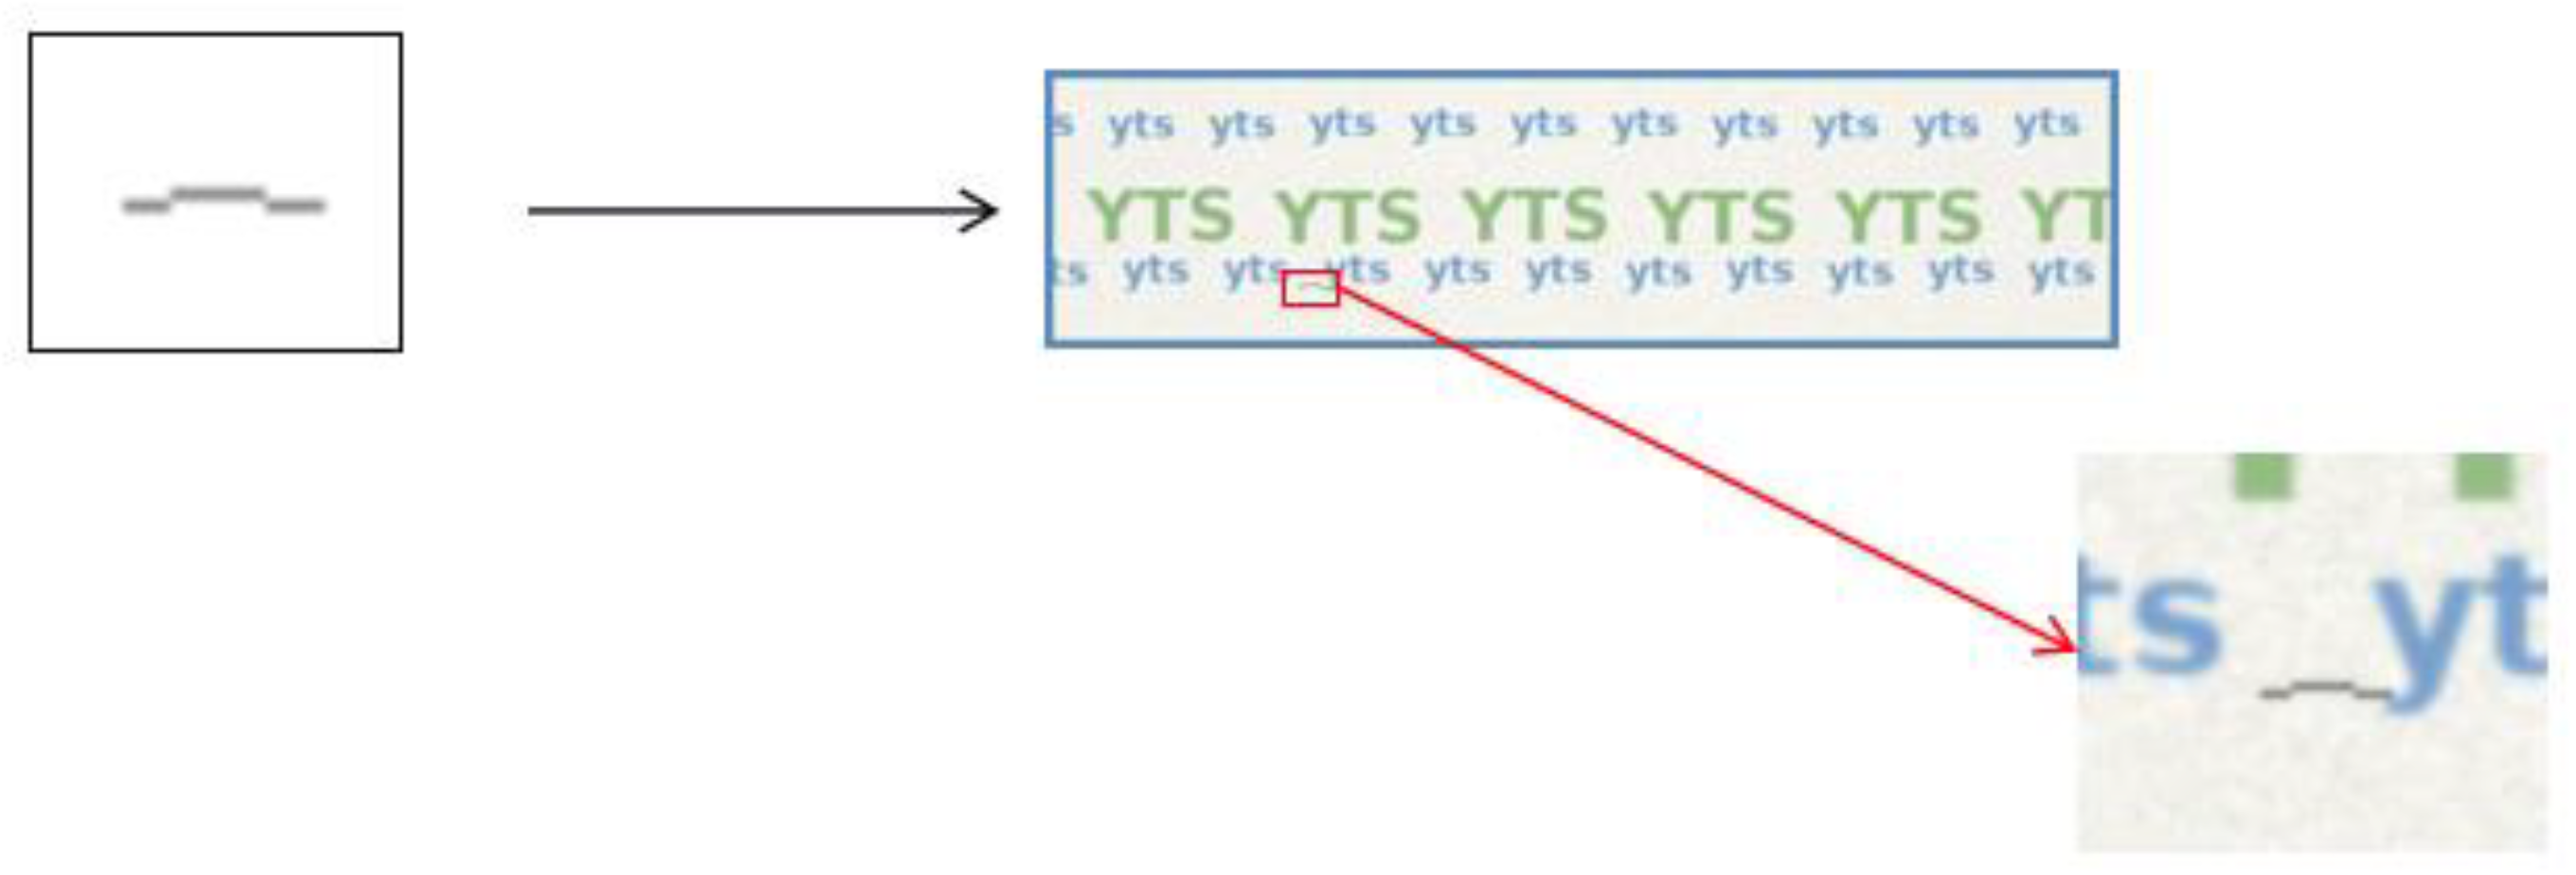
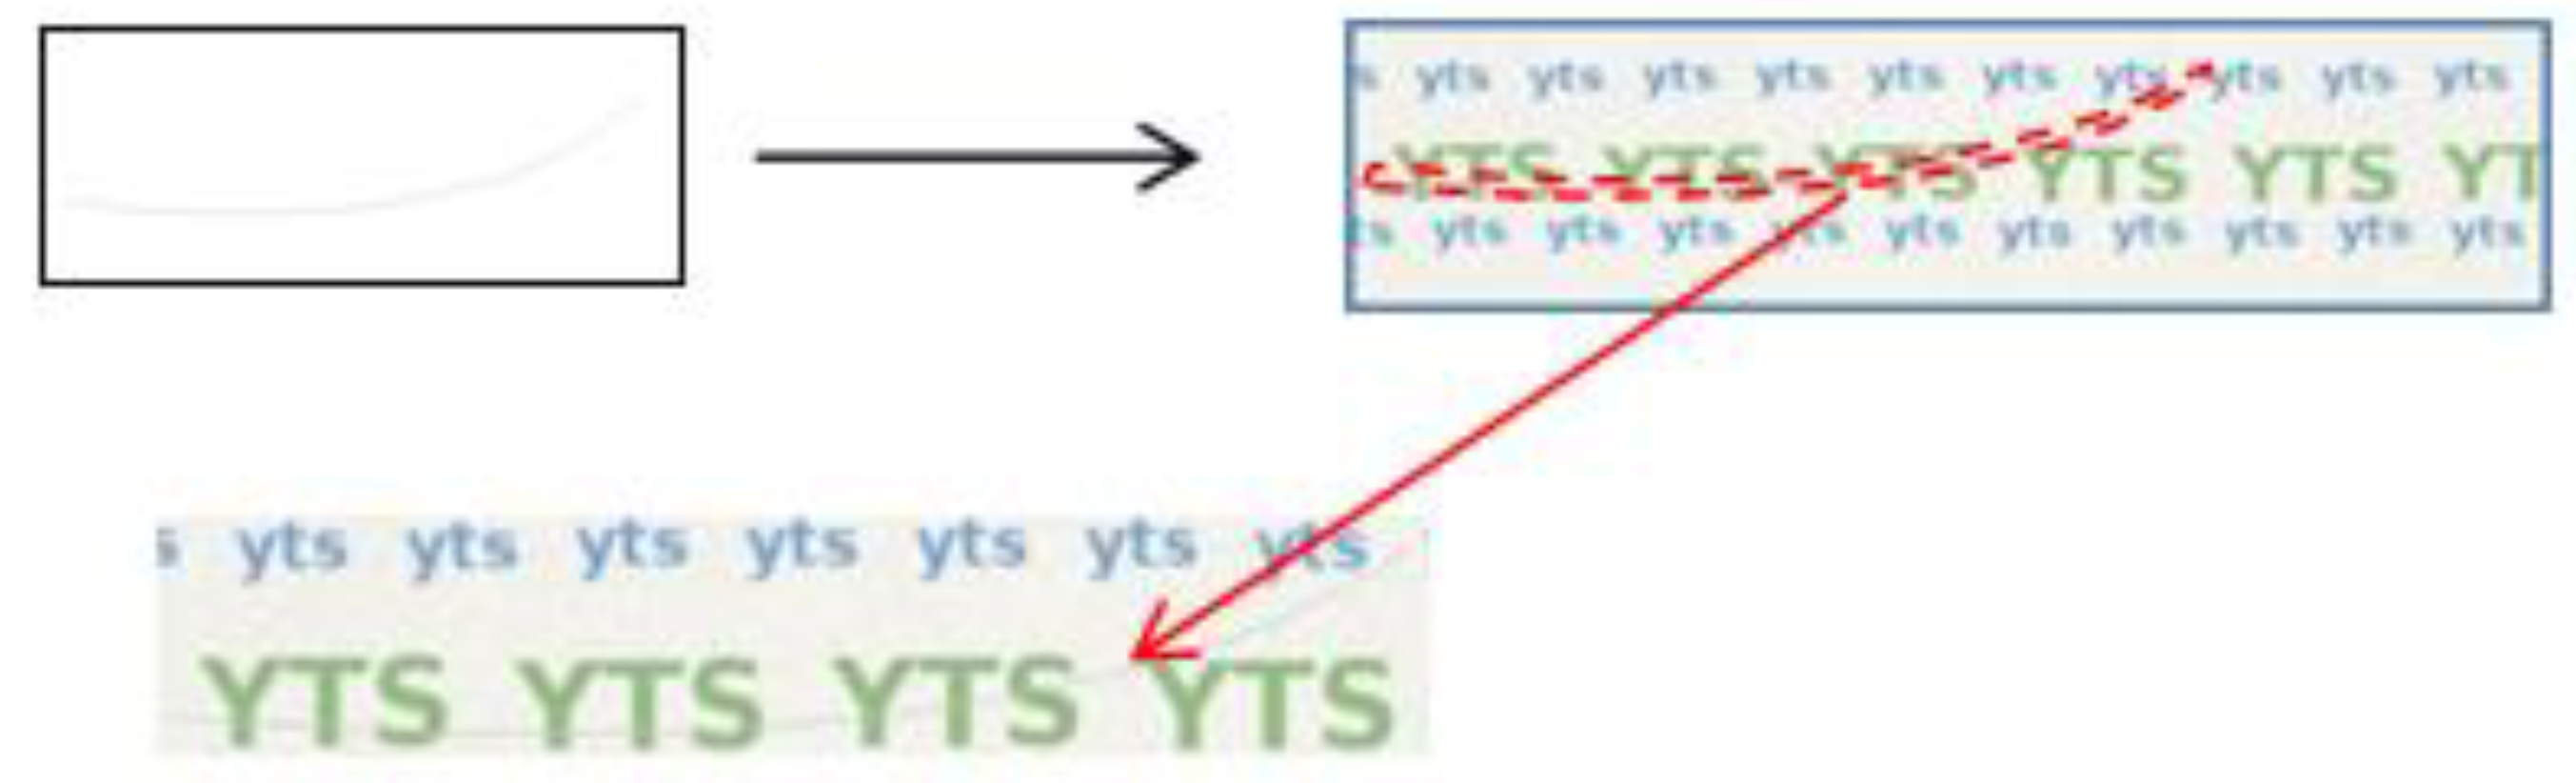
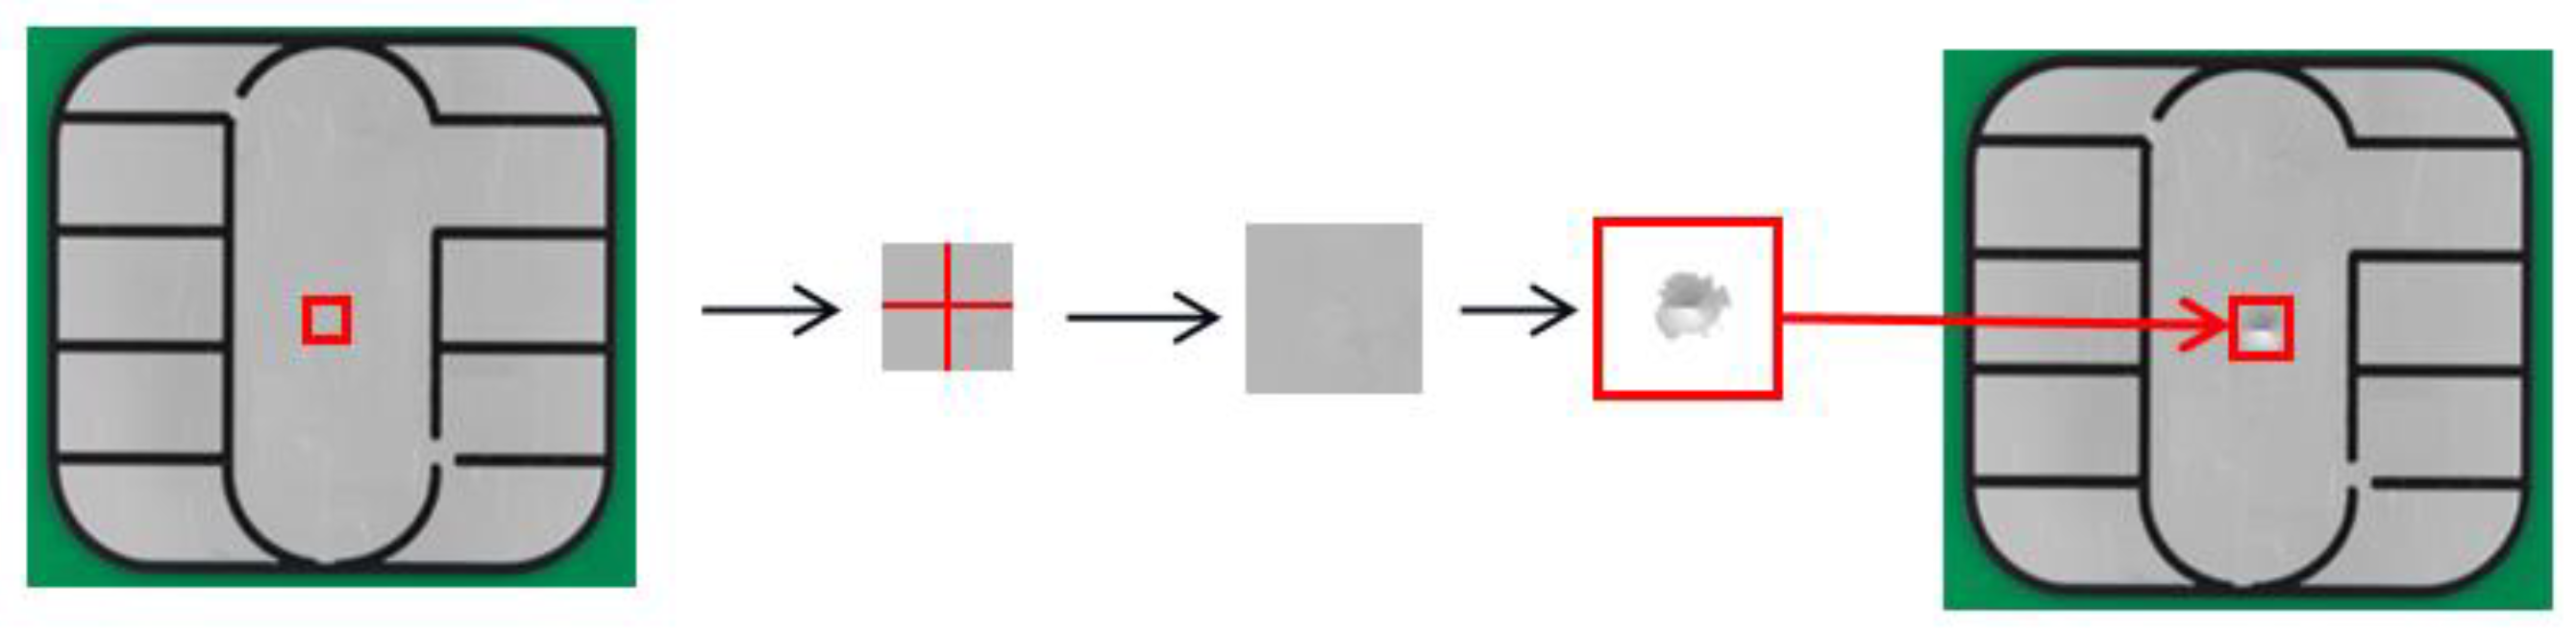
For SignPlate areas, we categorize defects into three types: damaged, foreign, and scratch. Given the diversity of card styles and substantial variation in background textures, naively pasting defect patches often causes background mismatch and edge-blending artifacts, hindering learning. We therefore adopt a texture-adaptive defect synthesis scheme in which, using OpenCV and PIL, defects are rendered directly inside the SignPlate panel ROI to match the statistics of the underlying texture. Specifically, for the damaged class, we randomly sample small locations in the ROI, generate irregular polygons from perturbed circles, and fill them using the mean of a 2 × 2-pixel patch taken from the image’s upper-left corner as a dynamic texture reference (Figure 2). For the foreign class, we draw 1–3 dark polyline segments with 1–2 px width from random starting points to mimic hair- or fiber-like thin debris (Figure 3). For the scratch class, we render light-gray straight lines or quadratic Bézier curves with 1–3 px width and retain slight curvature and intermittency to approximate shallow scratches (Figure 4). This strategy preserves background consistency and natural edge transitions while, under limited data, improving sensitivity and learning efficiency for thin-line and low-contrast defects.
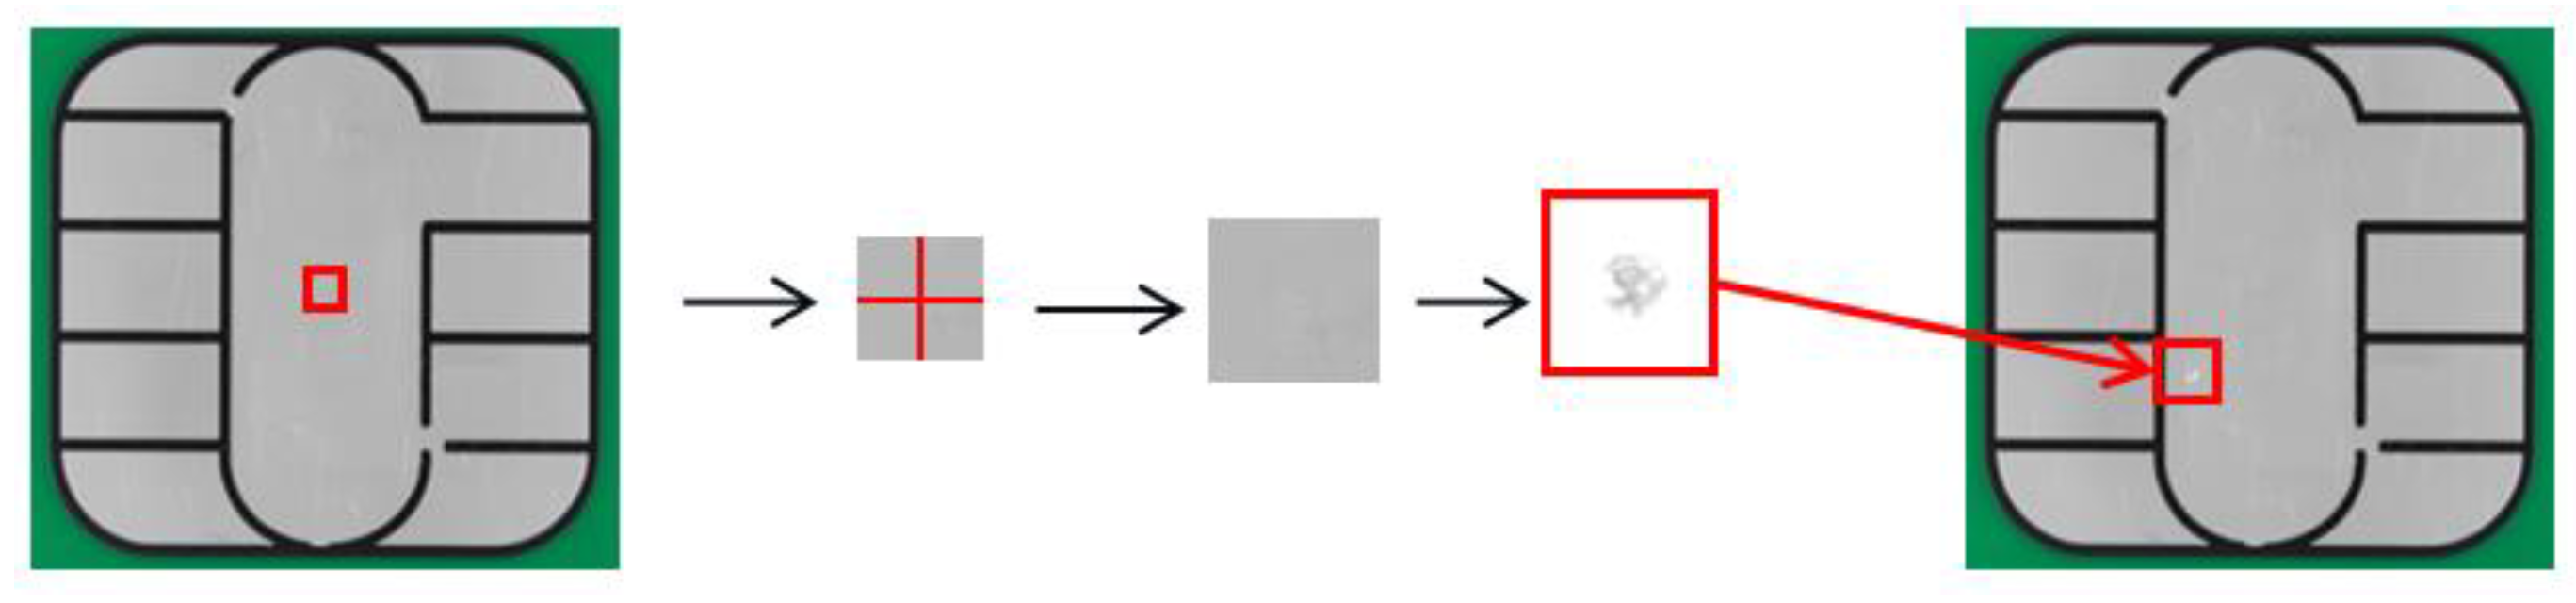
For ICChip areas, defects are classified as damaged, foreign, scratch, and trace. Given the strong specular and weak diffuse reflection characteristics of metal contact surfaces, generating defects using the global background mean (calculated as the 2 × 2 mean of the upper-right corner) is impractical. Therefore, this paper employs a locally adaptive, brightness-aware synthesis strategy. For the damaged category, an irregular outline is generated within the ROI by applying a convex hull to a perturbed point set. This is first filled with a low-opacity, soft-edged base layer using the 2 × 2 mean of the centroid neighborhood. Subsequently, within the same mask, contour brightening along the incident direction and sparse edge highlights or soft glows are synchronously overlaid. A small number of directionally consistent bright and dark fine short lines are added to depict metal brush strokes and micro-scratches. The intensity and scale of each element adapt to resolution and local brightness to conform to the reflective properties of metal surfaces, avoiding “gray patches” and hard-edge artifacts (Figure 5). Trace-type elements generate irregular polygons, similarly establishing base colors via 2 × 2 mean centroid averaging. Pixel-level brightness mapping based on distance to center and polar angle is then applied, injected with micro-noise to yield low-intensity, discontinuous, directionally pronounced micro-traces and fine scratch appearances. The generation of foreign and scratch defects mirrors the SignPlate surface: 1–2 px dark multi-segment broken-line hairline fibers and 1–3 px straight or quadratic Bézier light gray scratches, respectively. All compositing occurs strictly within the chip ROI, defaulting to edge avoidance with coordinate and intensity clipping. This ensures statistical consistency with substrate texture illumination, natural edge transitions, and absence of significant artifacts (Figure 6).
All generation processes are confined within the chip’s ROI, with default edge avoidance and coordinate or intensity clipping. This ensures texture adaptation and natural edge transitions while preventing significant artifacts. Additionally, to address class imbalance, we employ a class-balanced sampling strategy during data augmentation, expanding each defect image category to an equal number of samples. This significantly mitigates the original data’s uneven distribution.

4. Materials and Methods: YOLO-SR Model

4.1. Overall Structure of the Proposed Method

Through this augmentation workflow, we not only expanded the dataset’s scale and diversity but also ensured that the generated images visually resemble real defect scenarios. This strategy effectively enhances model robustness and convergence speed during training. Subsequent experiments demonstrate clear improvements in model performance for detecting small-target defects and boundary details, providing a more robust data foundation and helping to enhance generalization for defect detection across all regions of smart cards.
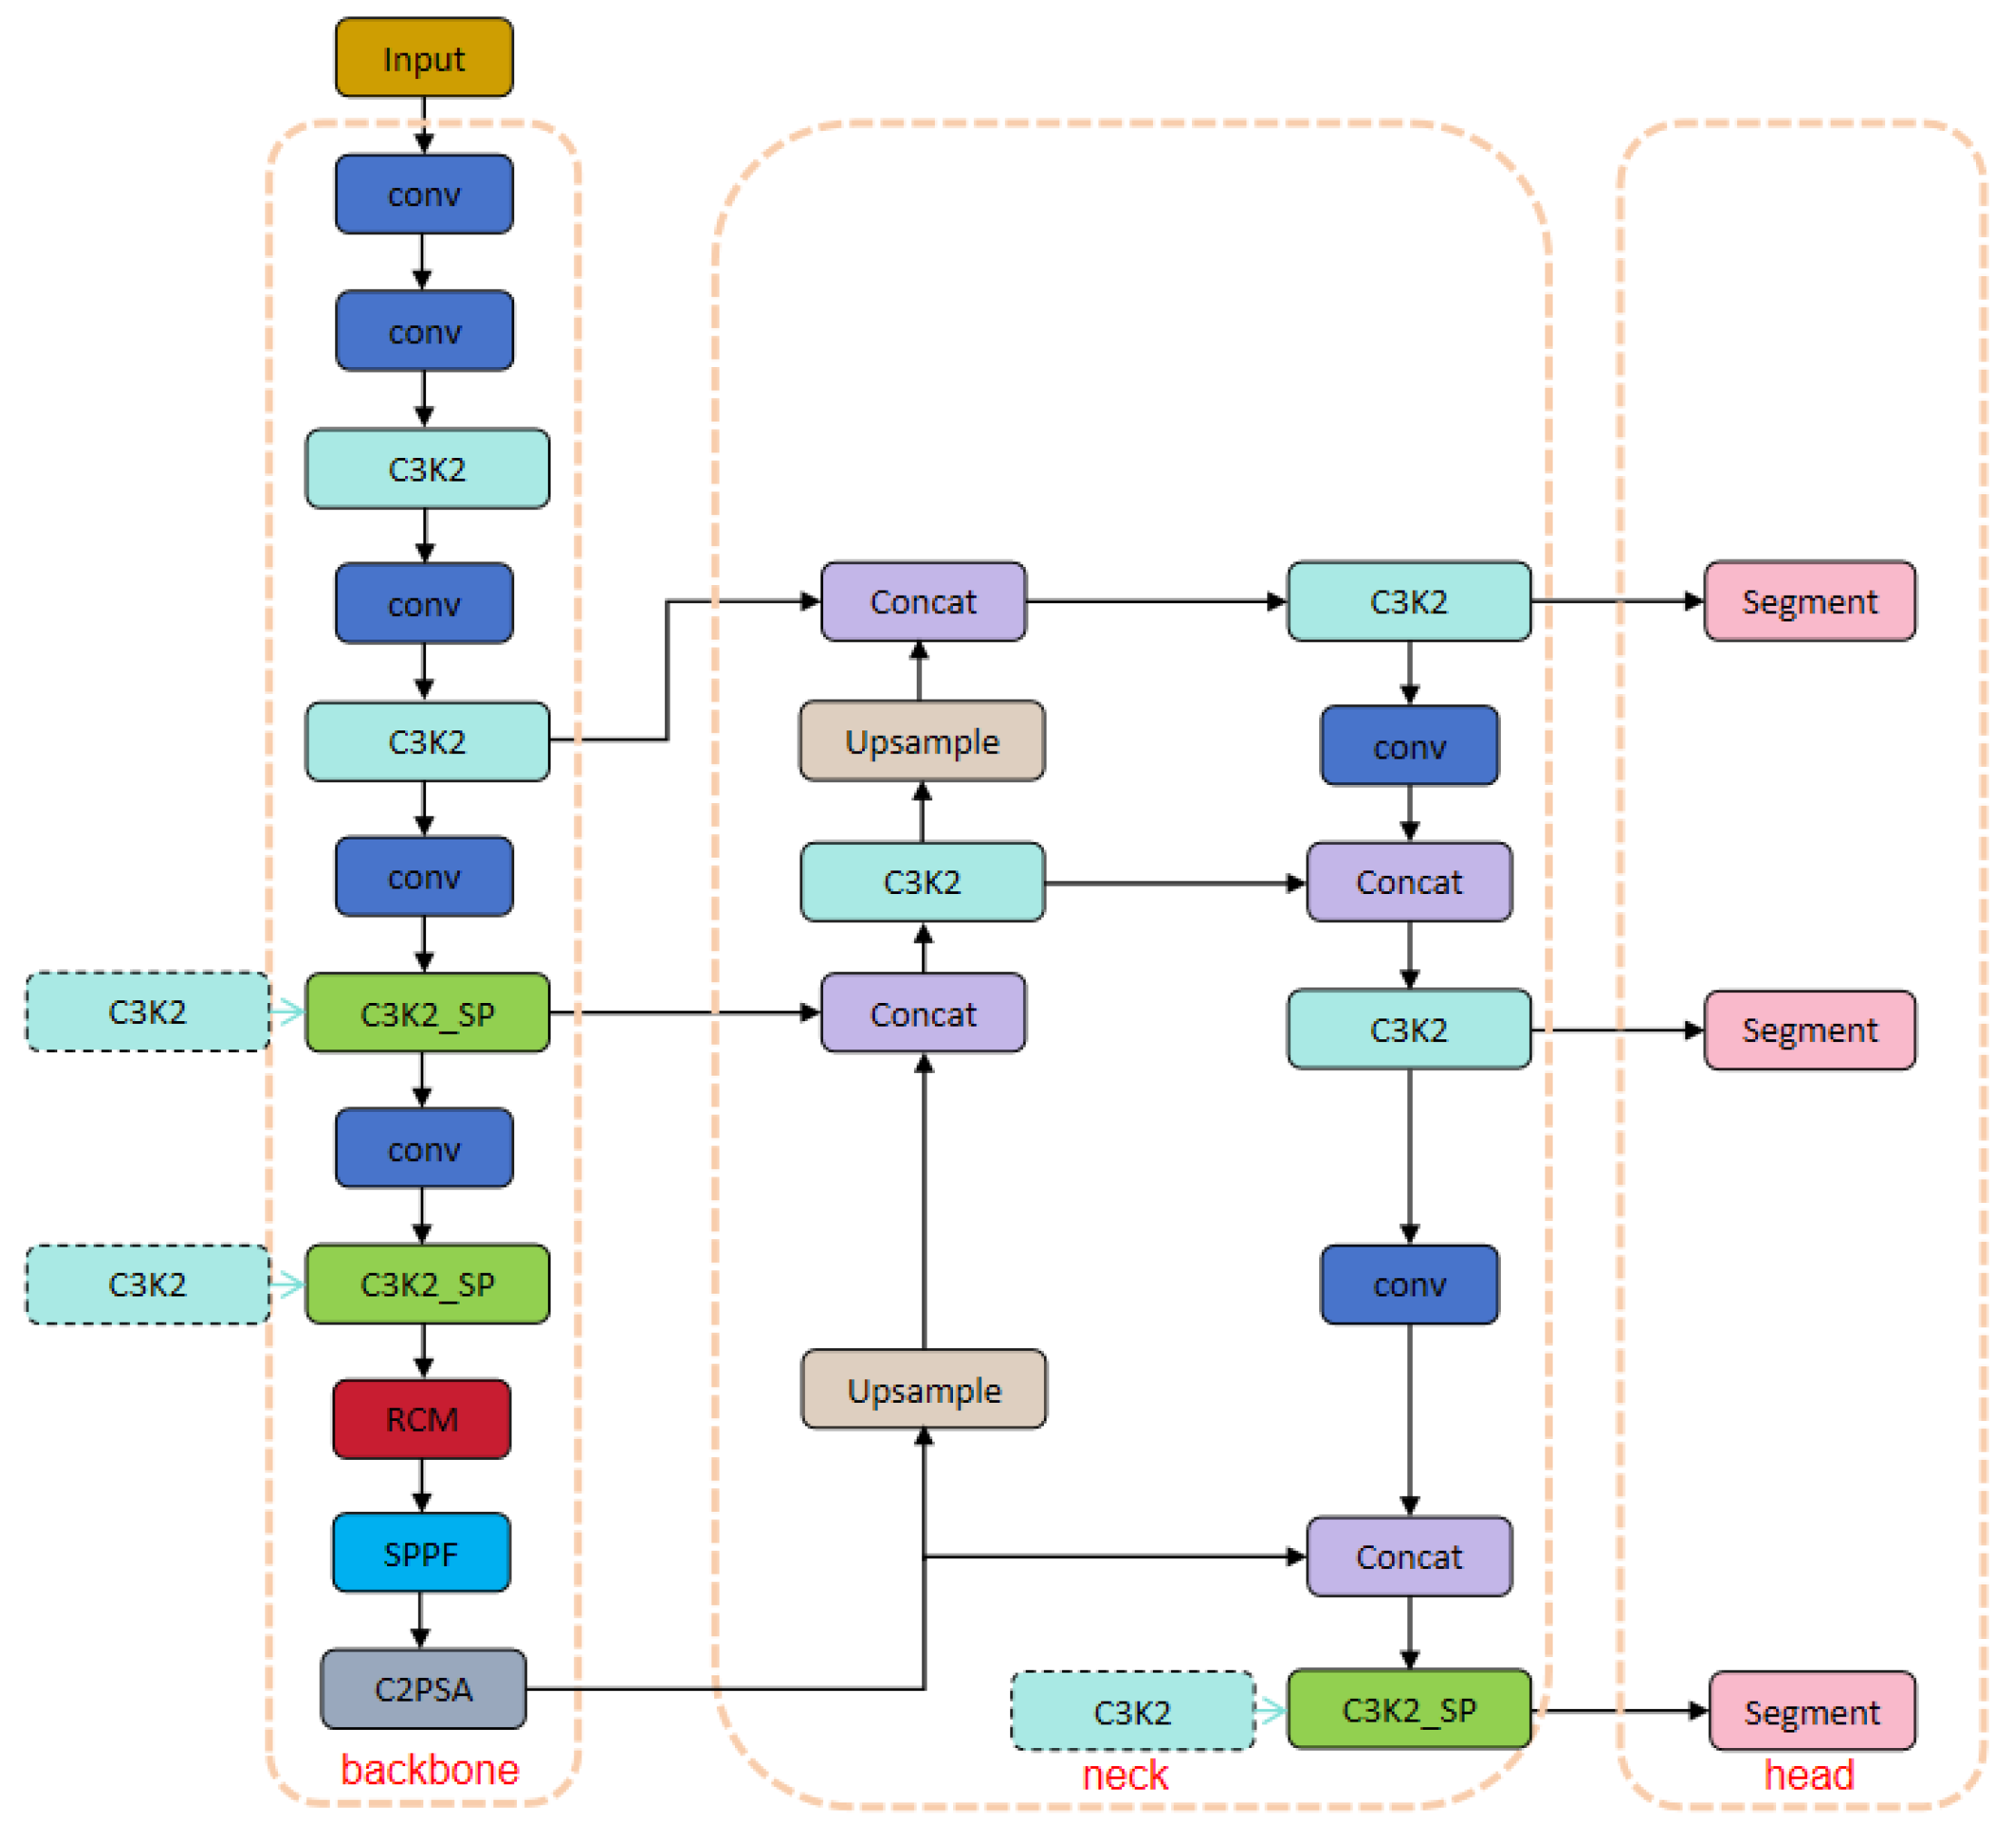
As the latest member of the YOLO family, YOLO11 inherits the efficiency and accuracy of its predecessors. Yet conventional YOLO models still struggle with long-range dependencies and small objects in cluttered backgrounds. To address this, we propose YOLO-SR, which retains YOLO11’s backbone–neck–head design and leaves the three-scale decoder and segmentation heads unchanged but introduces two local architectural changes: (1) SP is embedded per-layer as C3K2_SP in the backbone and selected neck blocks to explicitly aggregate long-range context along the horizontal and vertical axes while preserving local resolution and injecting directional priors; (2) a Rectangular Self-Calibration Module (RCM) is inserted between the top-level semantic features and SPPF to perform bi-axial global aggregation and shape self-calibration, suppressing background noise and stabilizing boundaries. Together, these components strengthen spatial dependency modeling for slender structures, improve boundary consistency, and yield more stable multi-scale localization (Figure 7). This configuration distributes directional priors uniformly across all detection scales via C3K2_SP, while confining the more global and expensive rectangular gating to a single top-level semantic map, thereby balancing representation quality and computational cost. For SP, we activate C3K2_SP mainly at mid- to high-level stages where feature maps already encode region-level and contour-level information of slender defects (P4–P5 and the top decoder branch). Applying SP at very shallow stages was empirically found to over-smooth fine local textures and bring limited benefits for elongated structures. Therefore, we retain plain C3K2 blocks at early layers and only activate SP where long-range context is most beneficial. For RCM, the rectangular self-calibration mechanism requires semantically rich and spatially coarse features to construct reliable foreground shapes from dual-axis global pooling. Placing RCM at the top semantic level, right before the SPPF block, allows it to operate on the most abstracted representation and to globally reshape responses before multi-scale fusion. Preliminary experiments with RCM inserted at shallower positions yielded smaller gains and higher overhead, hence we adopt the top-level placement to balance accuracy and efficiency.

4.2. C3K2_SP Module

SignPlate panels and IC areas on smart cards commonly exhibit elongated and weakly textured minor defects. Traditional square convolutions or square pooling struggle to penetrate these stretched structures without enlarging kernel sizes, resulting in response discontinuities and boundary irregularities. SP introduces long-range dependencies and directional cues without downsampling by performing strip-wise pooling along two orthogonal axes, demonstrating particular sensitivity to elongated targets [18].
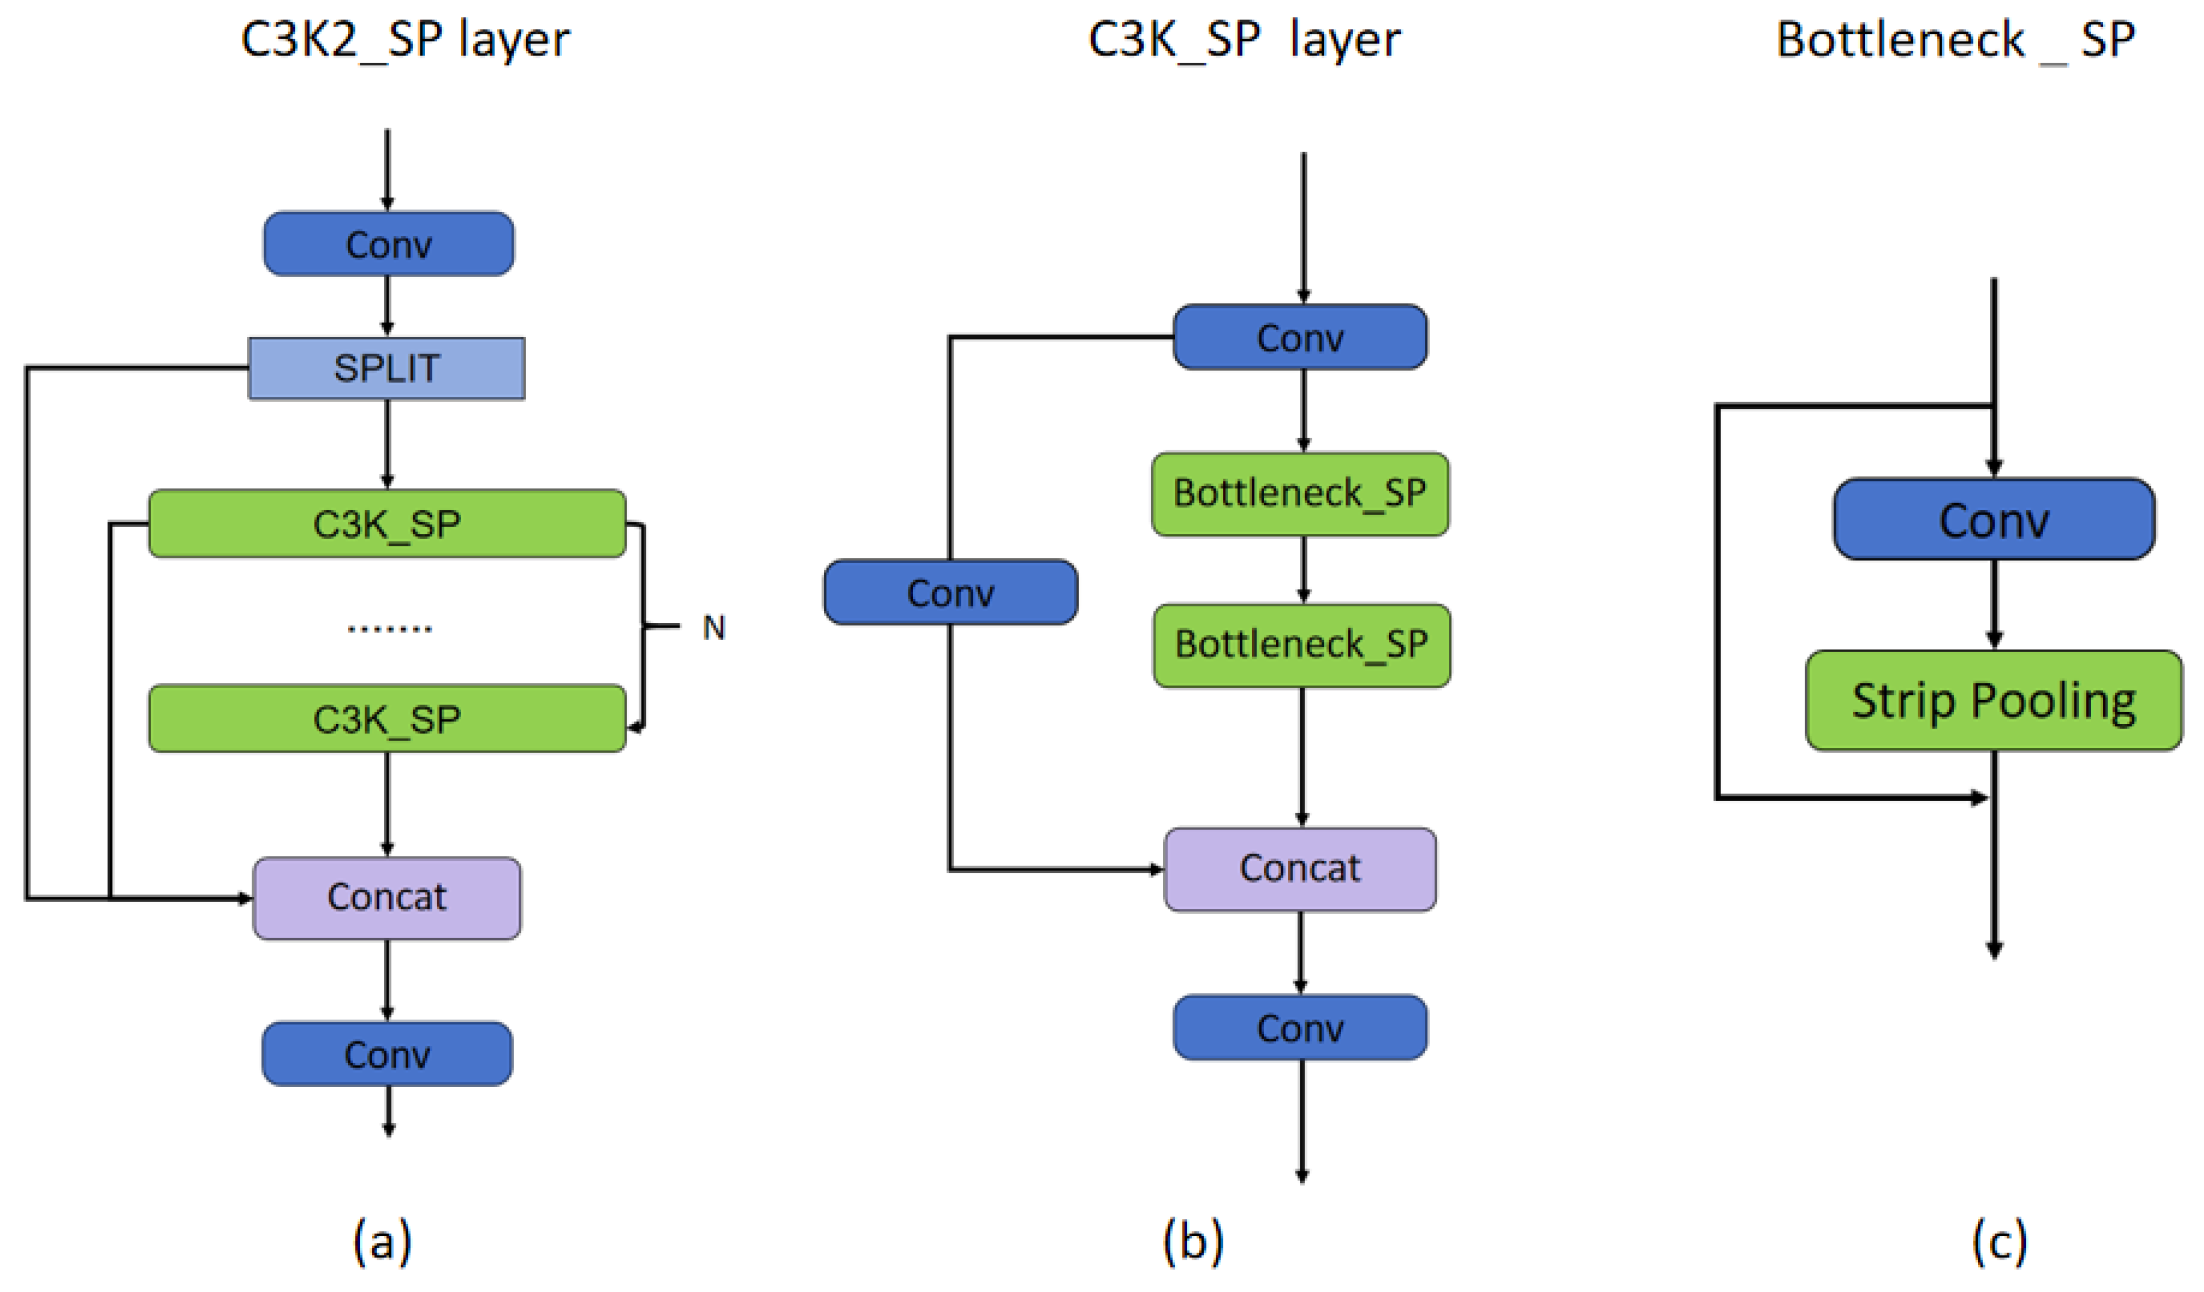
The new C3K2_SP module is formed by incorporating SP into the C3K2 module of YOLO11 (Figure 8). We retain the standard C3K2 topology unchanged (Conv → Split → (N × C3K) → Concat → 1 × 1Conv) while replacing the C3K main branch within the block with C3K_SP (Figure 8b). C3K_SP further replaces the standard bottleneck with Bottleneck_SP (Figure 8c), which inserts the SP module after the Conv in the main branch.
In practice, C3K2_SP is parameterized by a binary flag controlling whether the SP branch is activated. When the flag is set to False, the module degenerates to the original C3K/C3K2 structure used in YOLO11, incurring no extra strip-pooling operations; when the flag is True, SP is inserted into the main branch as described in Figure 8 and Figure 9, enabling directional context aggregation inside that bottleneck. Accordingly, Figure 7 only labels those blocks where the SP branch is actually enabled as C3K2_SP (green), while the remaining stages stay as vanilla C3K2. In this way, SP is selectively applied to mid- and high-level blocks where slender defect structures are prominent, whereas shallow layers are intentionally kept unchanged to avoid unnecessary overhead.
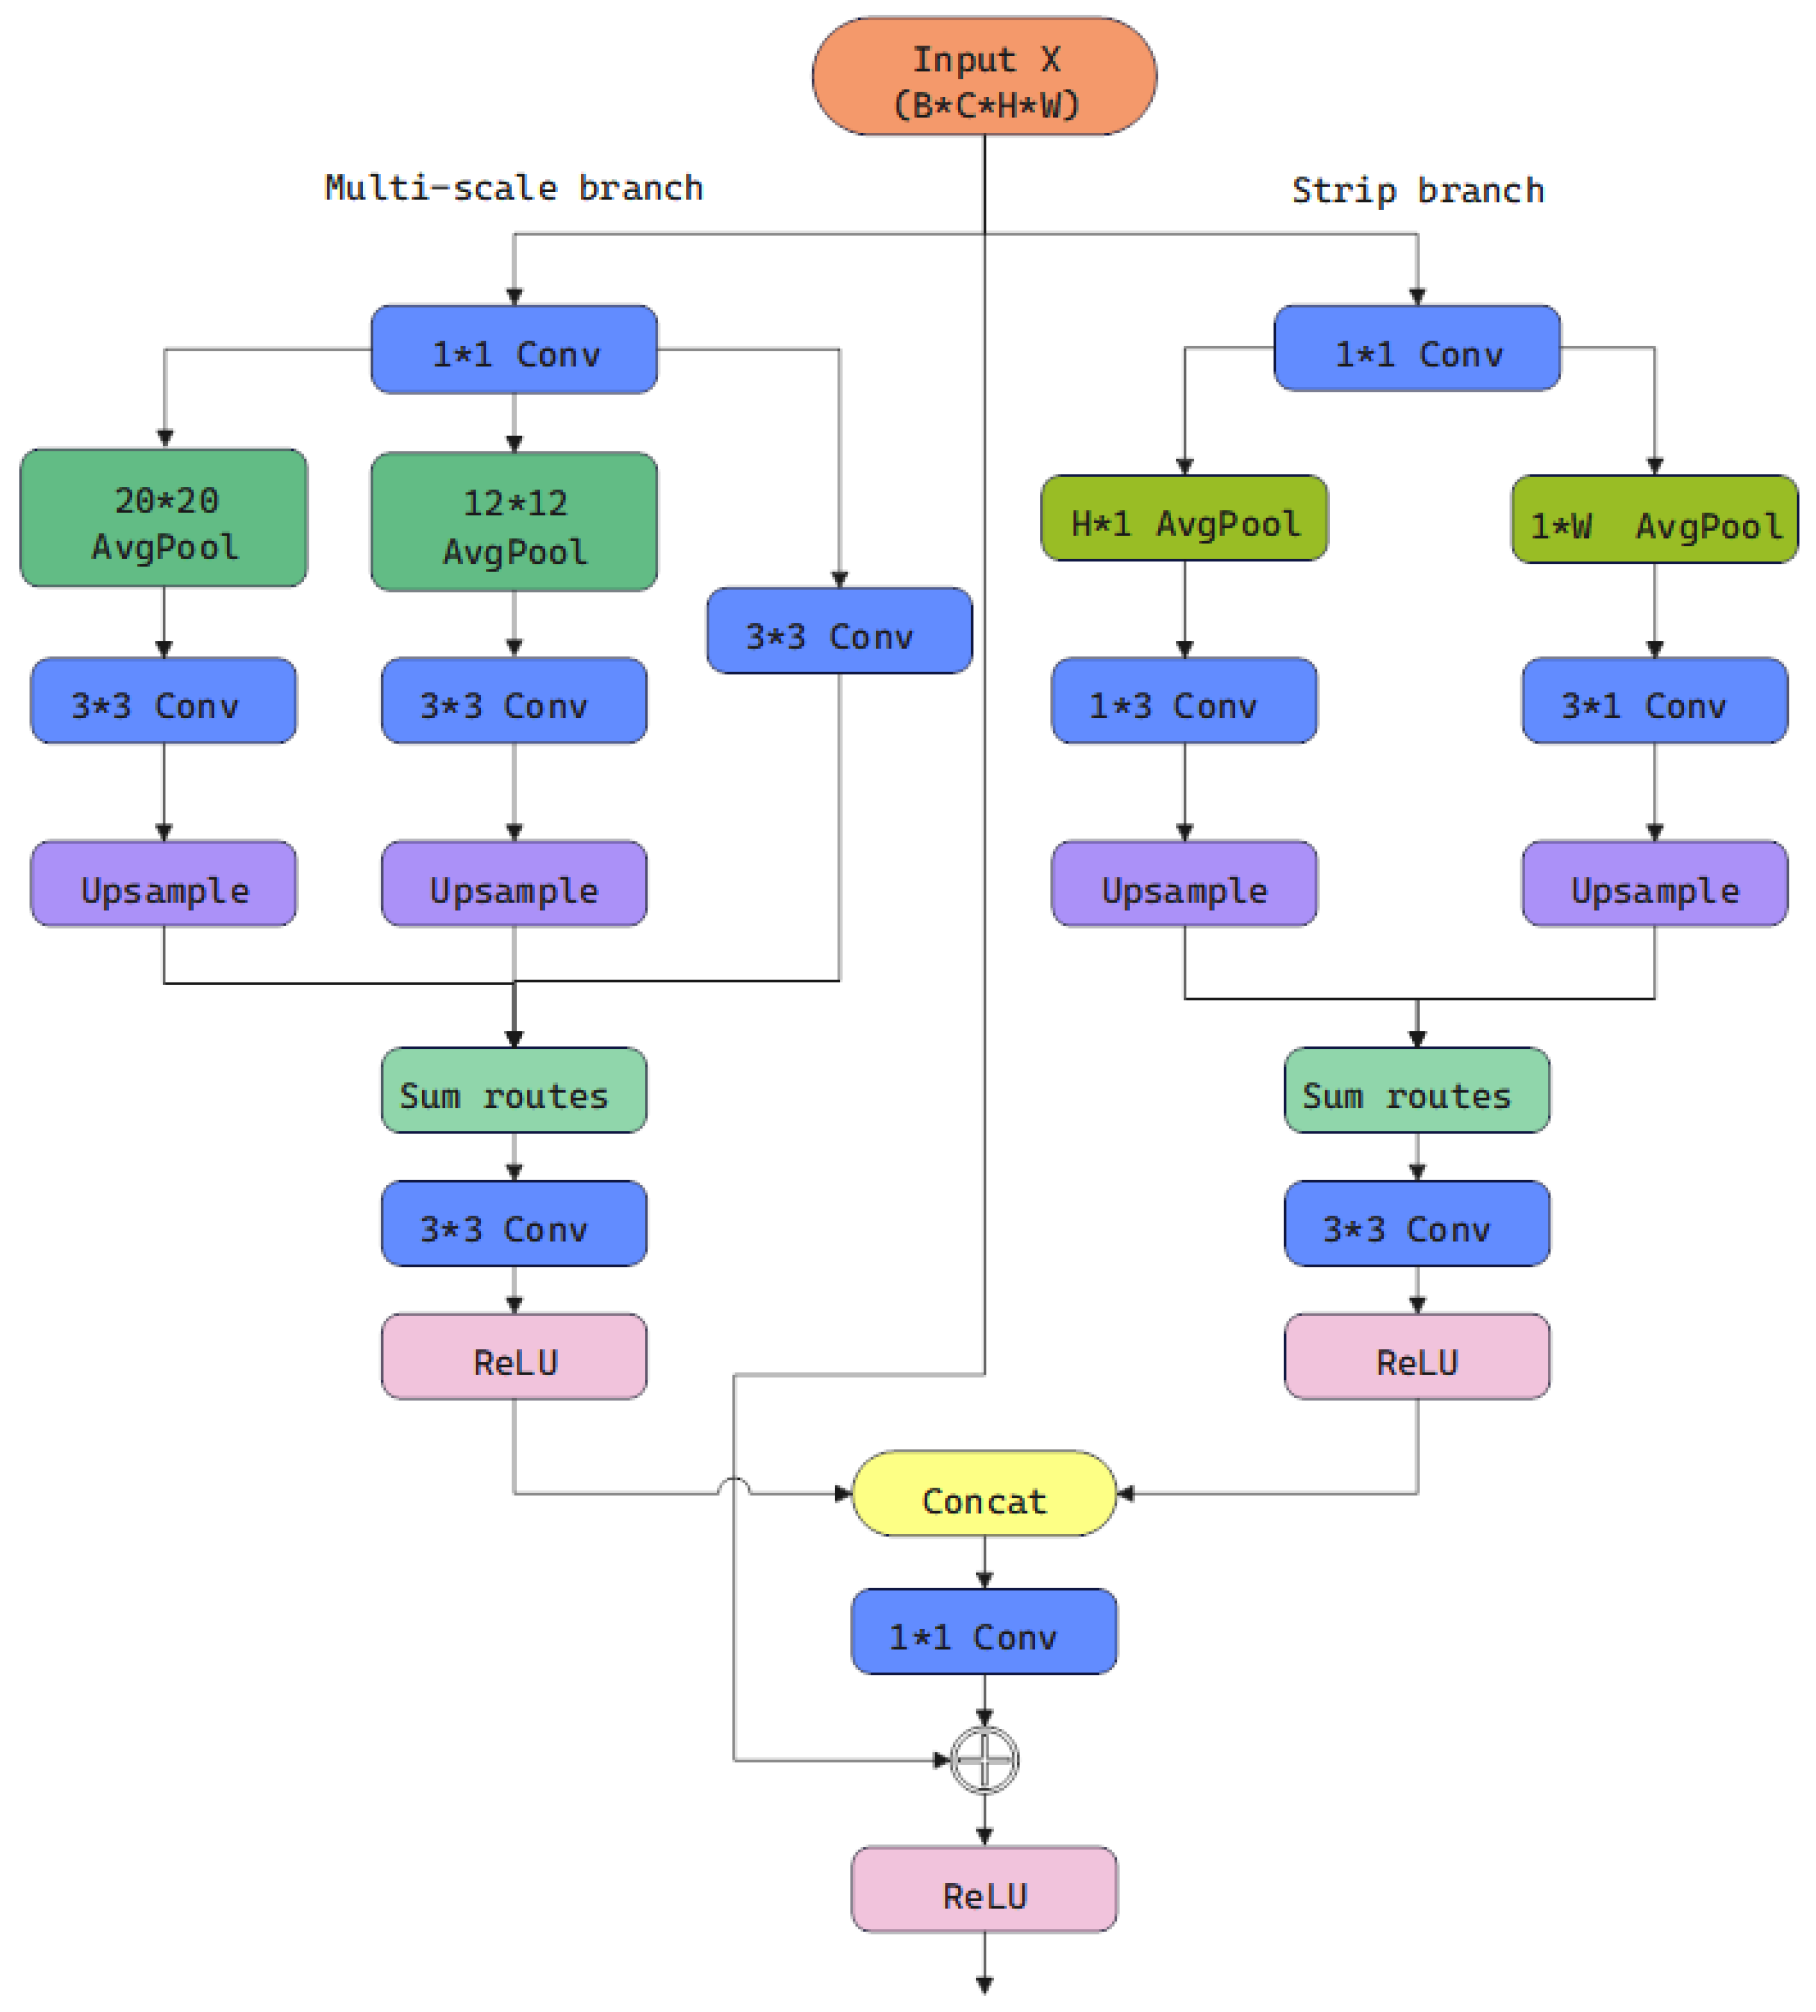
SP contains two parallel paths: the first is a multi-scale contextual path that performs adaptive average pooling of features to fixed small scales of 20 × 20 and 12 × 12, followed by bilinear upscaling to the original resolution after 3 × 3 convolutions. The second is the axial context path, performing SP along horizontal (1 × W) and vertical (H × 1) directions, followed by reshaping via 1 × 3 or 3 × 1 convolutions and upsampling. The two responses are concatenated with local convolutional features in the channel dimension and then linearly fused via 1 × 1 convolution. This output undergoes additive residual addition with the input and passes through a ReLU activation to produce the final output (Figure 9).
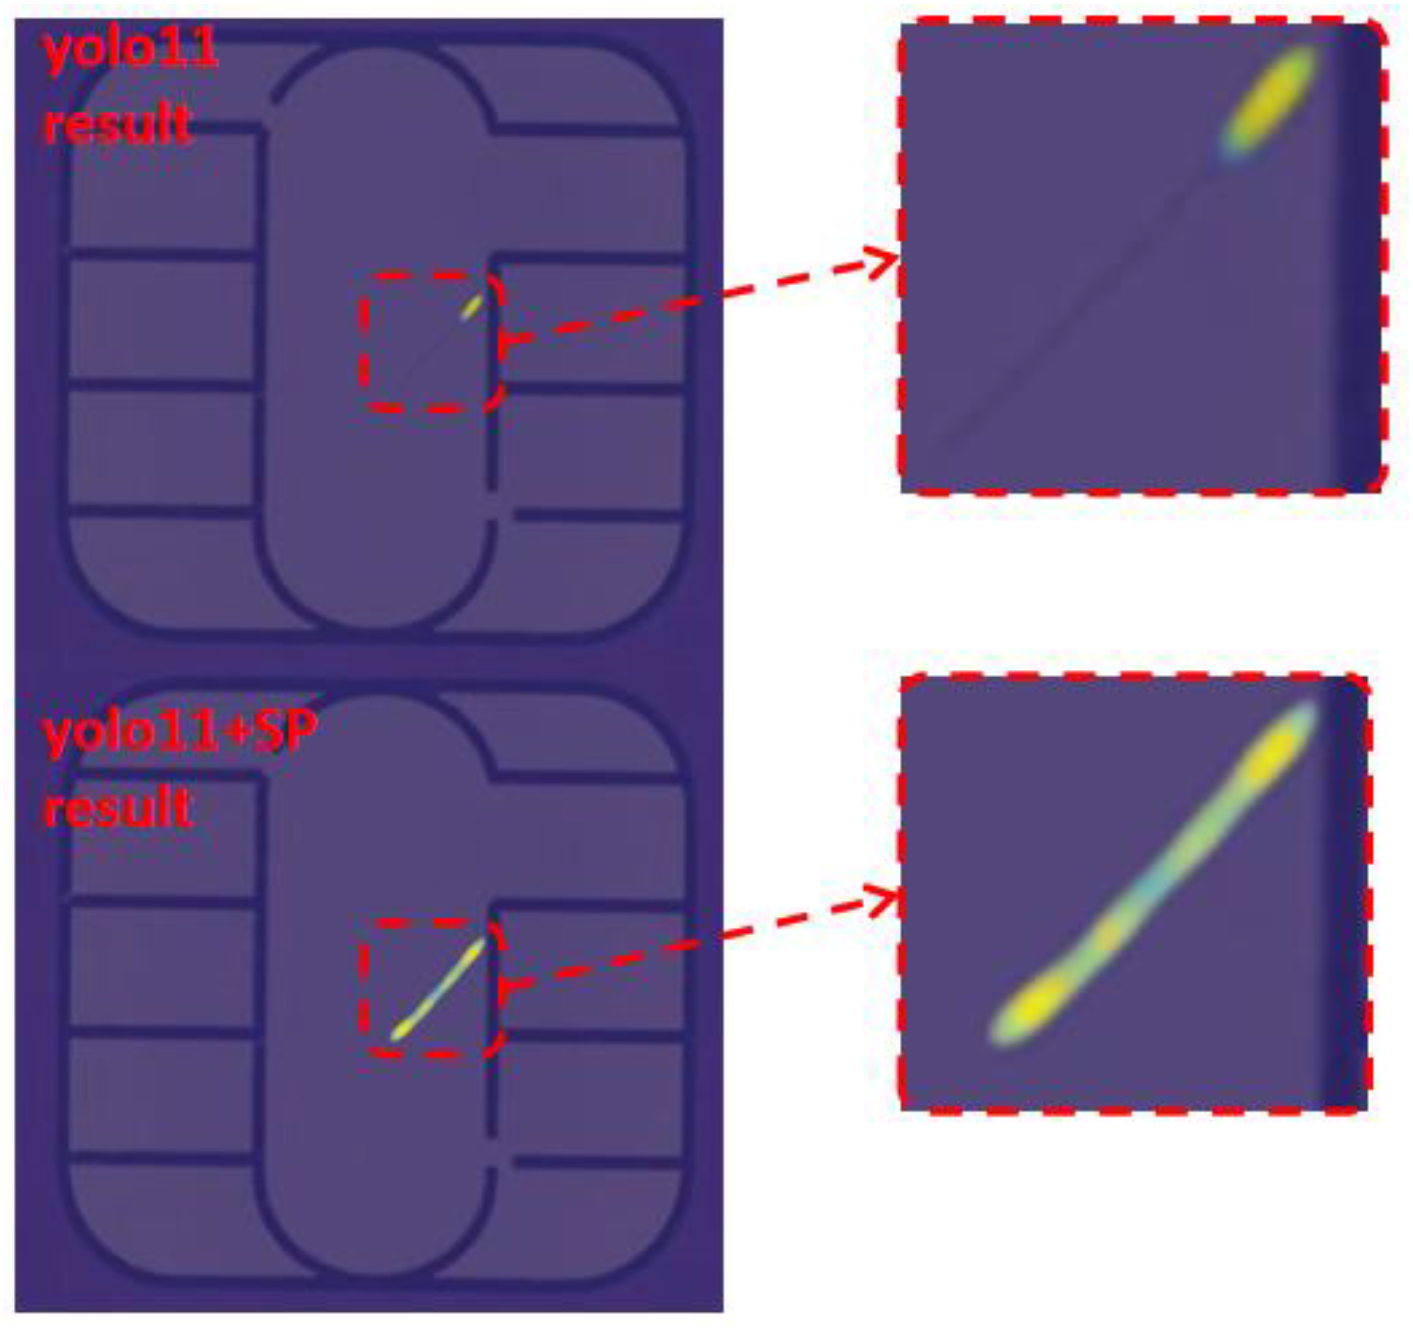
This design explicitly injects directional long-range dependencies and multi-scale context into the bottleneck without compromising local resolution. It enables elongated scratches and cracks to be connected across complex backgrounds. Tests demonstrate more continuous boundaries and more stable localization in the resulting representations (Figure 10).

4.3. RCM

However, the SP mechanism is fundamentally based on context enhancement and residual fusion, without explicitly generating weights to gate or reweight features. Consequently, it may still struggle to accurately separate foreground from background when encountering complex backgrounds or targets with significant long-range shape variations. Particularly in backgrounds like SignPlates, which feature extremely complex textured characters and strong long-range interference, relying solely on SP can easily mistake the background texture for the foreground.
RCM introduces Rectangular Self-Calibrating Attention at the top semantic feature level. It extracts two axial global vectors through horizontal and vertical pooling, respectively, combines them to generate a rectangular context, and then performs shape self-calibration via large-kernel striped convolutions to make the attention distribution more focused on the foreground region. Subsequently, RCM performs pixel-wise multiplication between this explicitly generated attention gate and the local response, achieving feature recalibration. This enables RCM to capture long-range dependencies and explicitly suppress background noise, providing more stable boundaries and global references in complex environments, thereby addressing the limitations of SP.
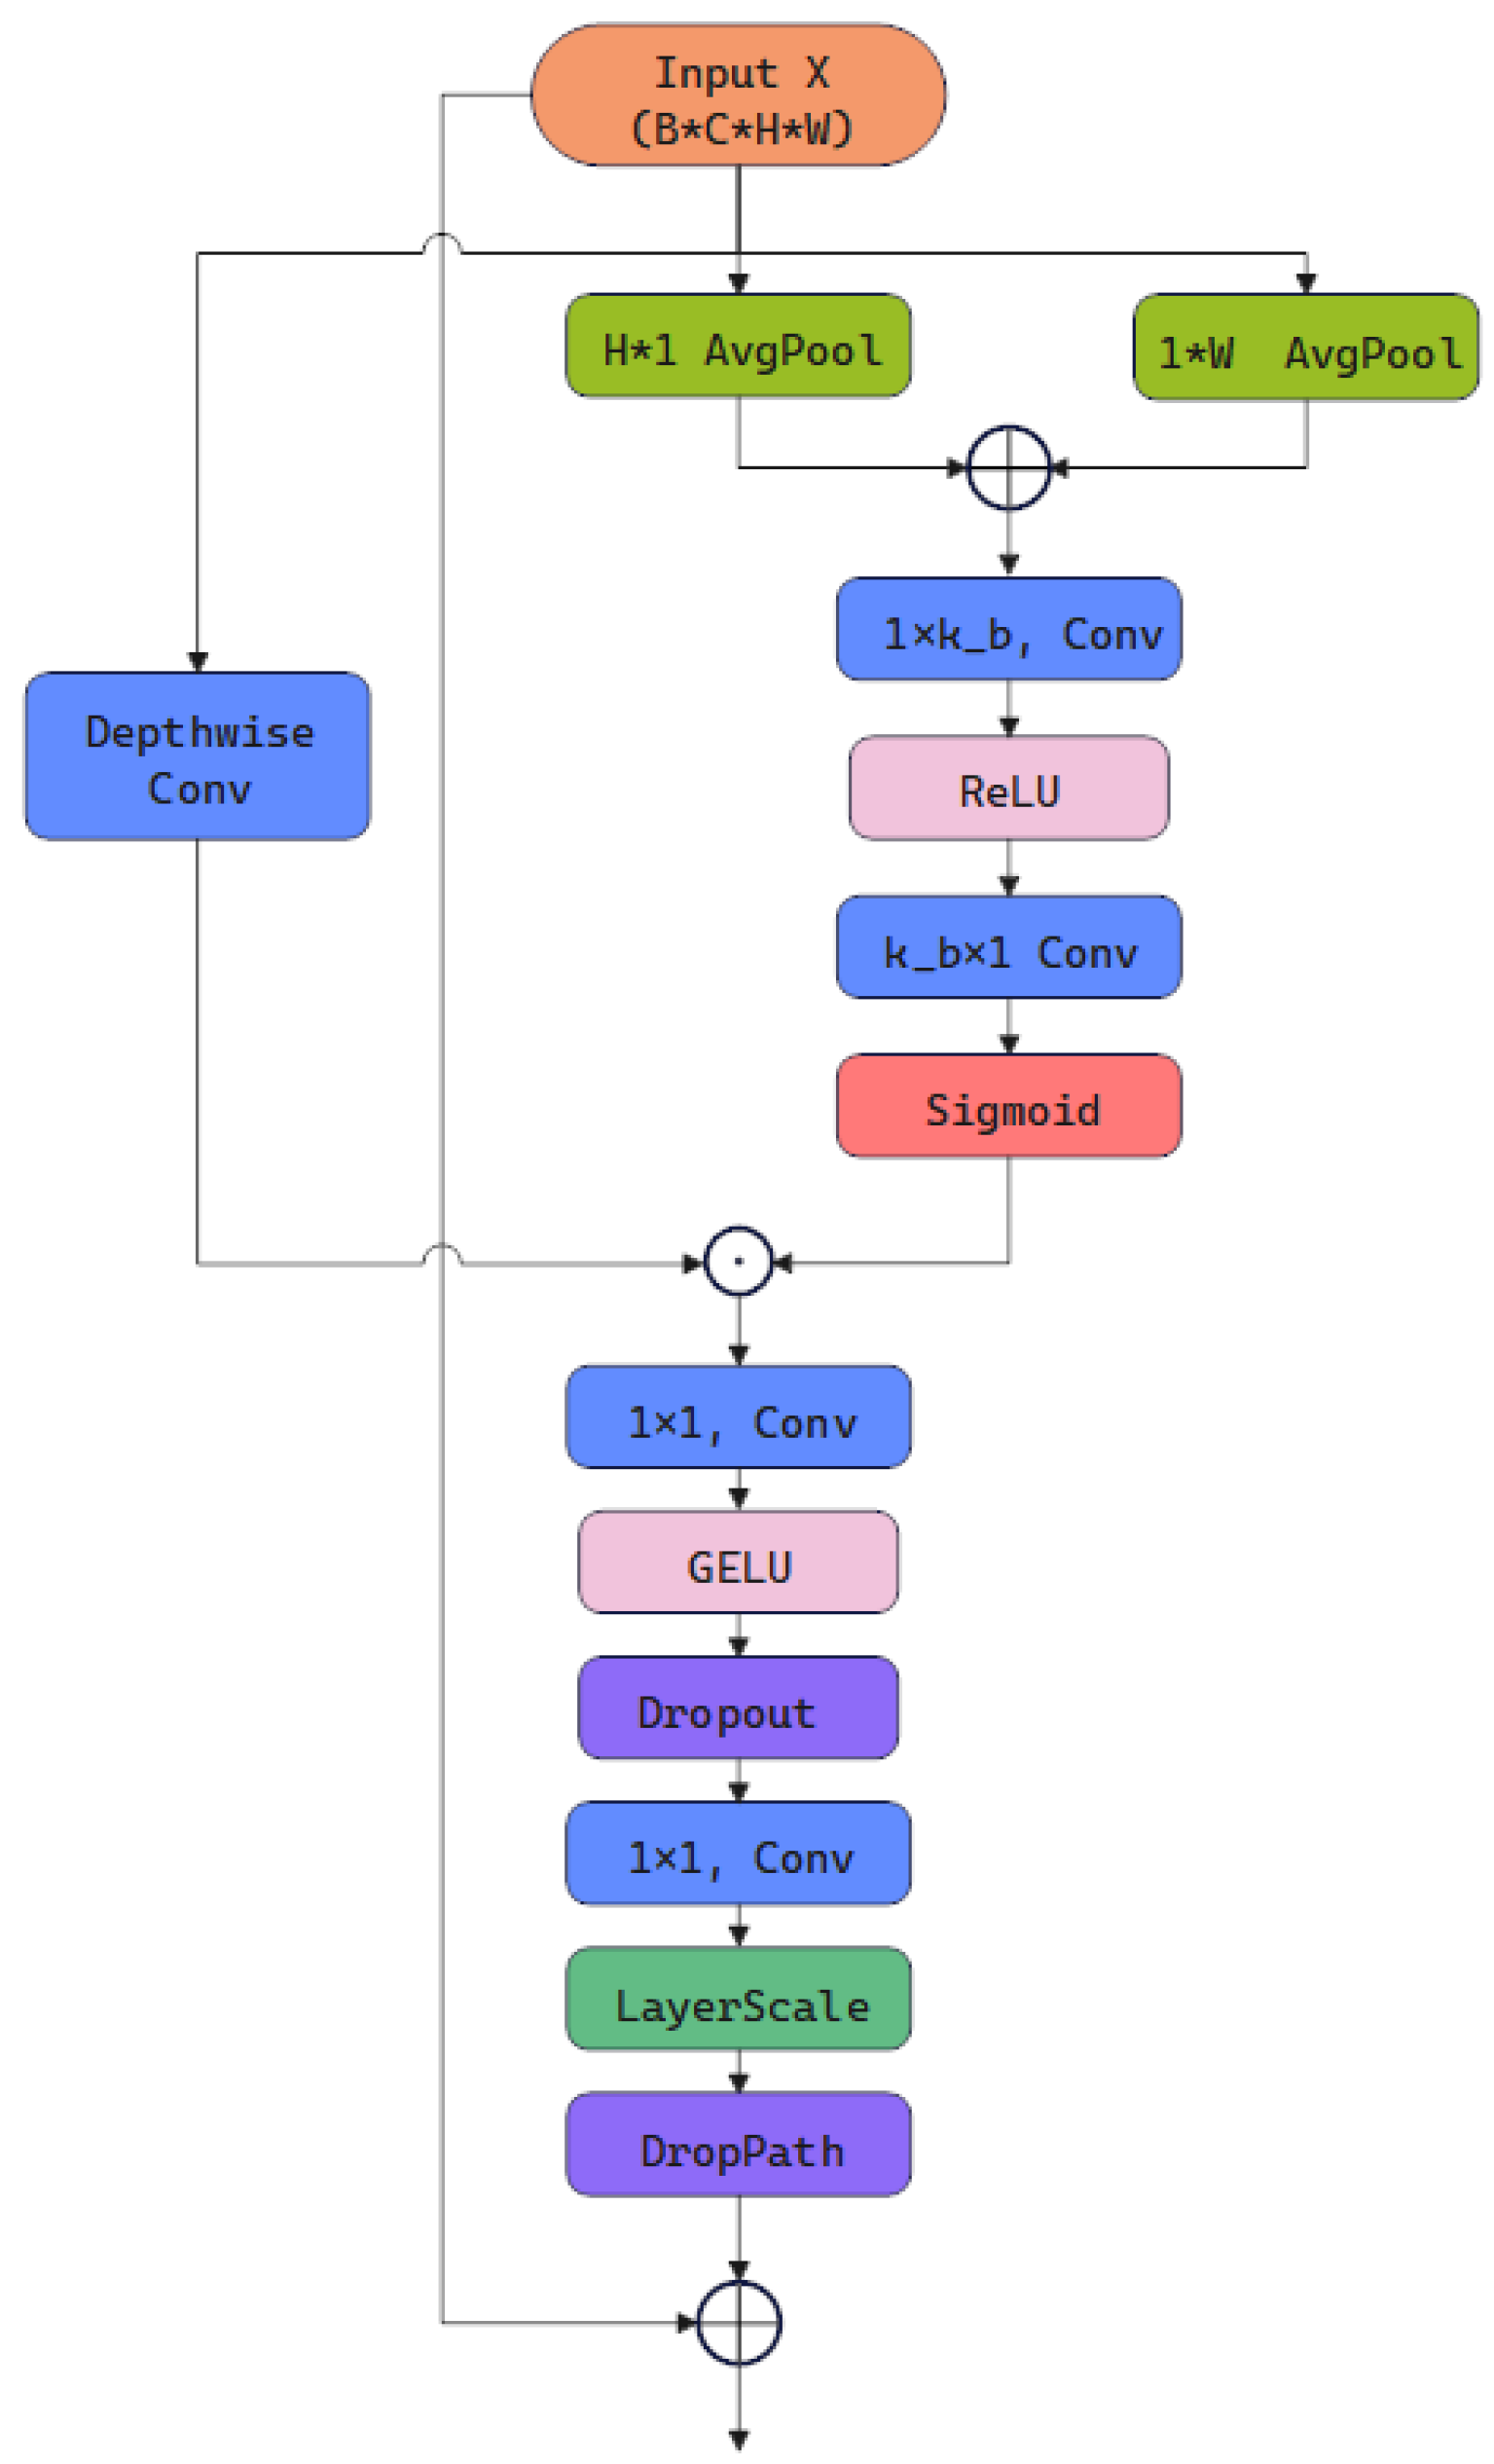
RCM primarily consists of three steps (Figure 11). First, input features undergo depthwise convolution to extract local responses, enhancing edge and detail representation. Simultaneously, adaptive average pooling is performed along both H × 1 and 1 × W axes, with the results summed. Subsequently, a rectangular gate map is generated through 1 × k_b convolution → ReLU → k_b × 1 convolution → Sigmoid. This map enables “shape self-calibration” for long-range structures, enhancing focus on target regions within complex backgrounds. Next, the gate and local responses are multiplied pixel-wise and fed into a channel MLP (1 × 1 Conv → GELU → Dropout → 1 × 1 Conv) to achieve cross-channel reorganization and information compression, balancing expressiveness and lightweight processing. Finally, LayerScale fine-tunes the residual branch magnitude, DropPath performs regularization, and the result is added to the input via a residual connection to produce the output. Overall, RCM extracts global shape information from high-level semantics, spatially recalibrates local responses via rectangular gating, and enhances channel interactions through MLP. This enables the network to focus on true foreground regions within complex backgrounds while maintaining boundary consistency.
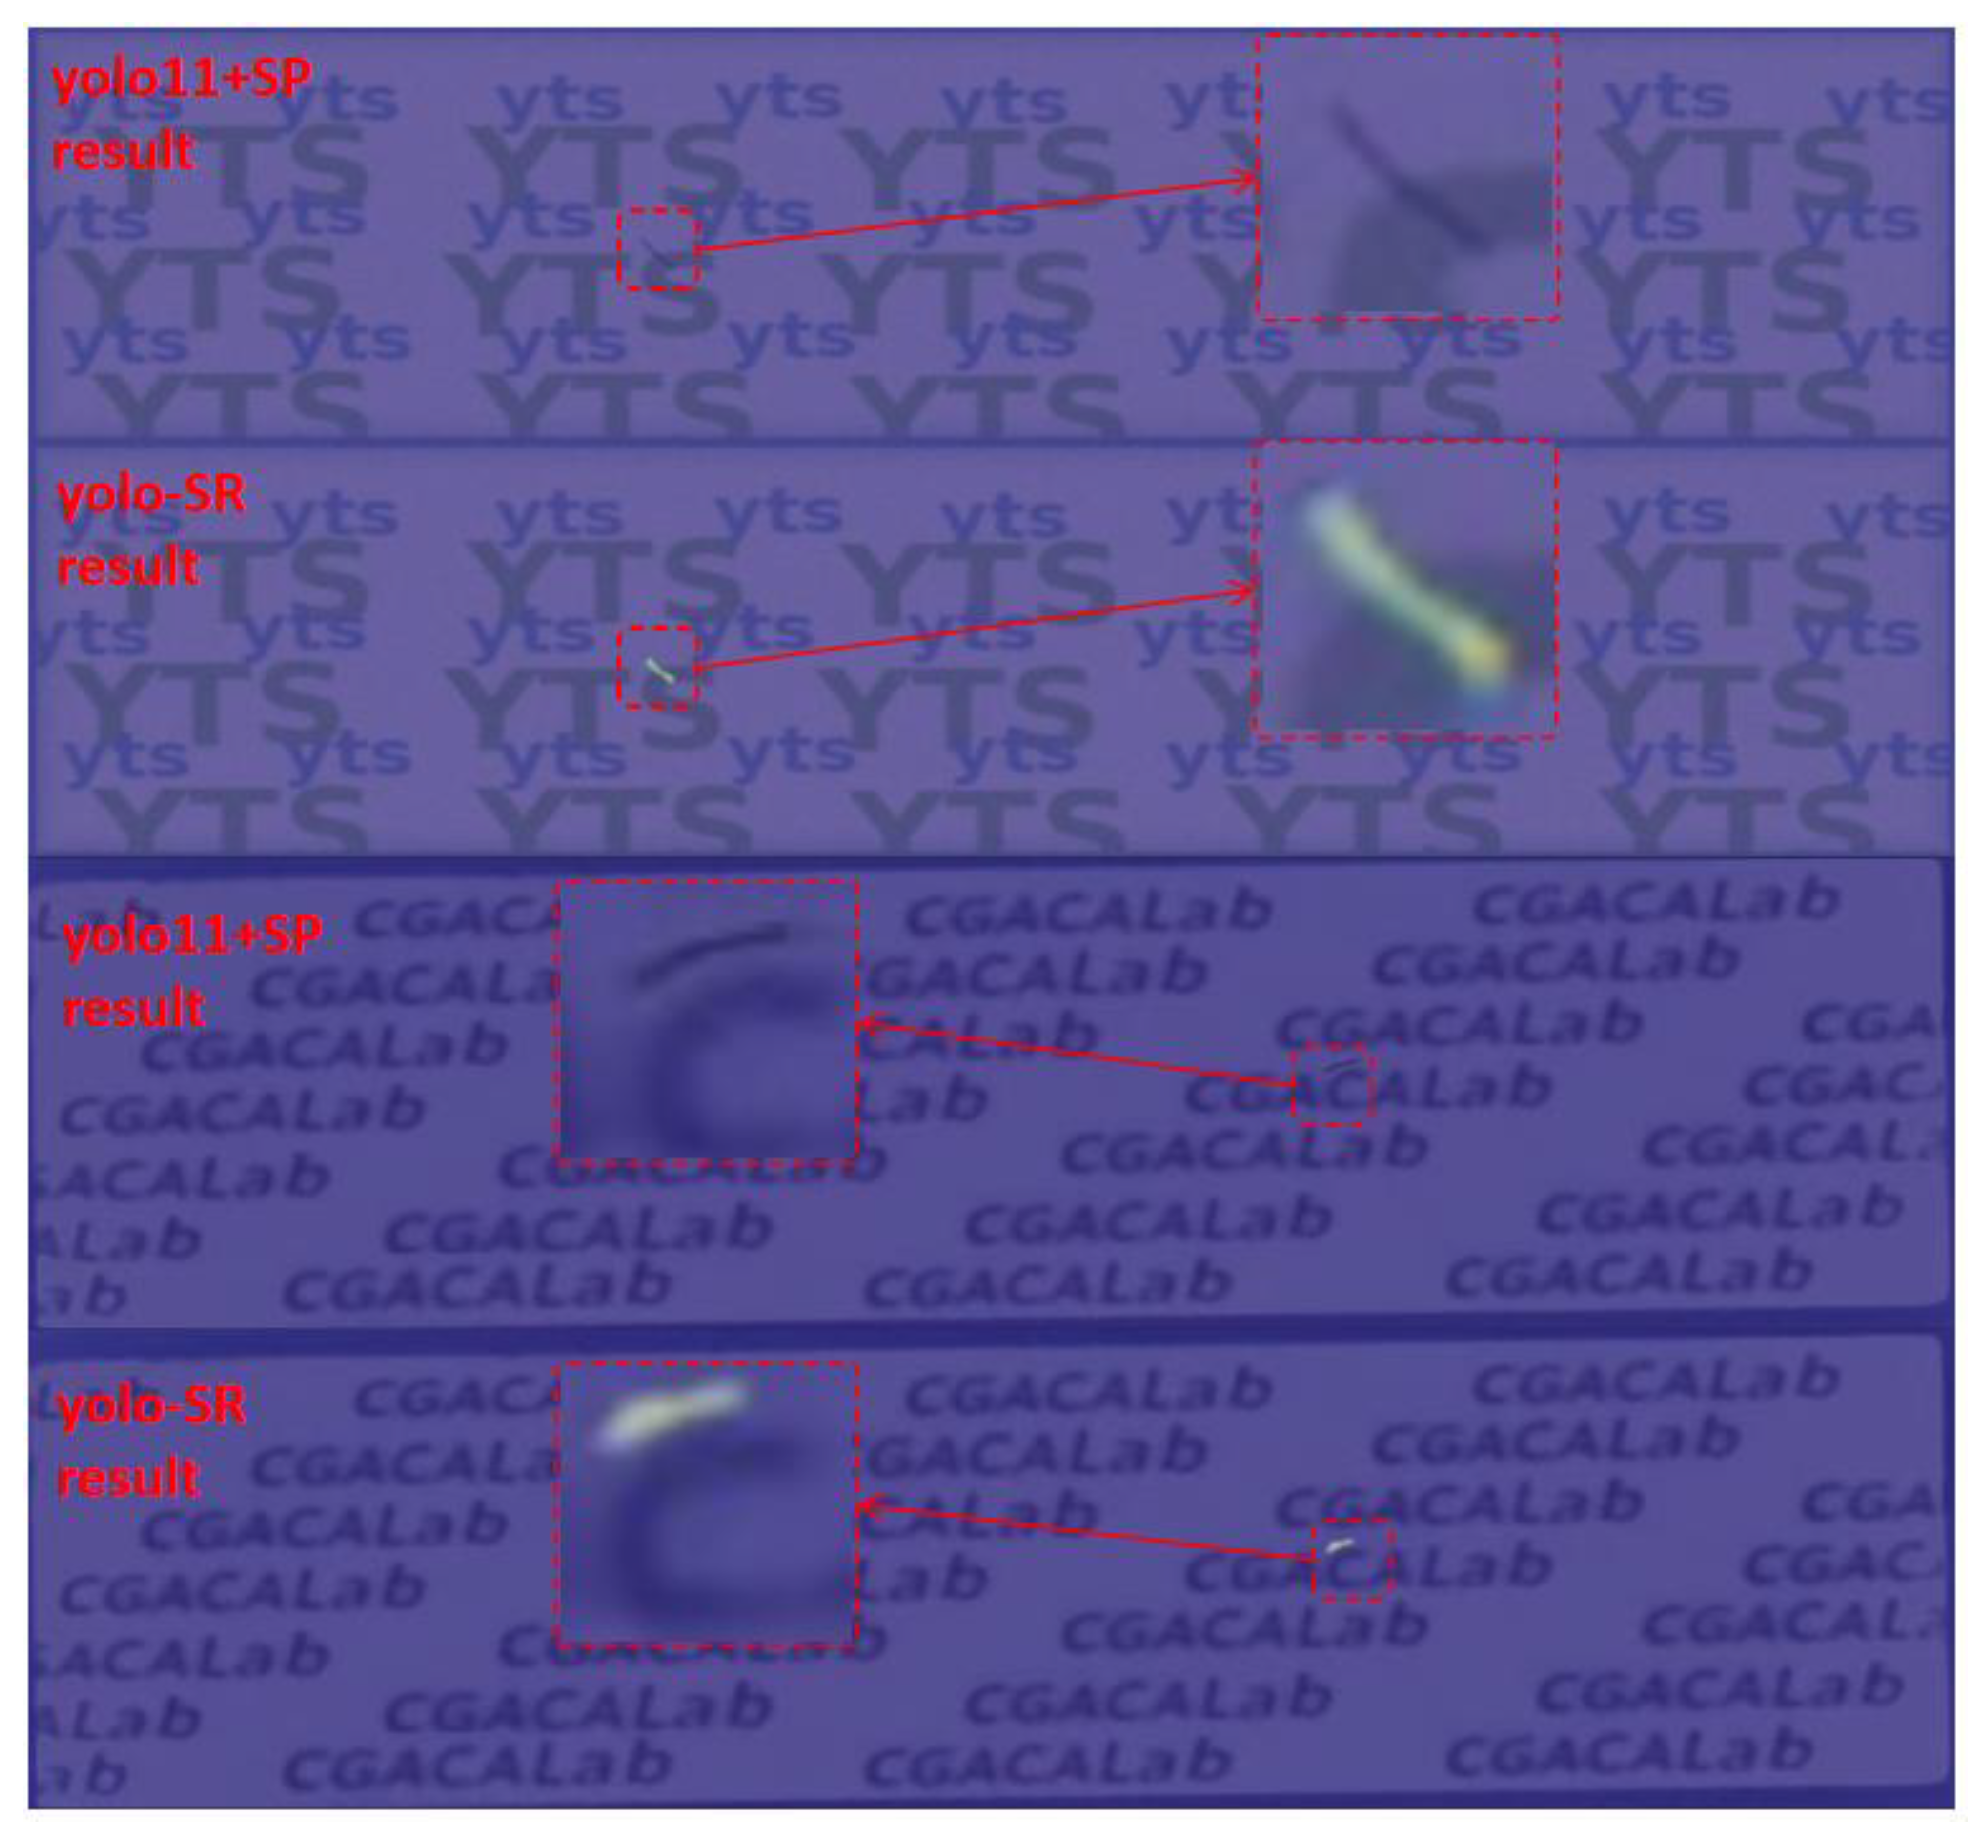
Although both RCM and SP utilize horizontal and vertical pooling to model directional information, their objectives and implementations are fundamentally different. SP injects directional priors at the local level through its “multi-scale + strip” branch, primarily targeting elongated, weakly textured defects; RCM performs global position and shape self-calibration at the top layer to suppress complex backgrounds and highlight foregrounds. As an independent block positioned between top-level semantic features and SPPF, RCM generates explicit gating at high semantic levels for shape self-calibration and global noise suppression, making it particularly suitable for SignPlate scenarios with strong background textures. Their synergy enables YOLO-SR to achieve more continuous responses to slender defects and more stable localization in complex backgrounds. (Figure 12).
From the perspective of feature operations, SP and RCM play clearly complementary roles. SP is embedded inside the C3K2_SP bottlenecks and injects directional long-range context along horizontal and vertical axes via multi-scale pooling and strip pooling, while keeping local resolution unchanged. This design primarily enhances the continuity and connectivity of slender scratches and traces, allowing weak, line-like defects to be linked across specular highlights and subtle texture transitions. In contrast, RCM operates on the top-level semantic feature map and constructs a rectangular self-calibrating attention gate based on dual-axis global pooling and large-kernel striped convolutions. By explicitly reweighting local responses according to global shape and foreground extent, RCM suppresses background clutter and stabilizes boundaries, particularly on highly textured SignPlate panels. Together, SP strengthens directional sensitivity to slender structures, whereas RCM aligns foreground shapes and suppresses spurious responses, forming a complementary pair that is further amplified by the instance-segmentation head. Together with Figure 10 and Figure 12, these visualizations illustrate that SP mainly extends slender responses, whereas RCM reshapes them into foreground-aligned rectangular patterns, making their roles complementary rather than overlapping

5. Experimental Results and Discussion

5.1. Dataset

We utilized two industrial product datasets: ICChip and SignPlate. The ICChip dataset contains four defect categories: damaged, foreign, scratch, and trace. The SignPlate dataset contains three defect categories: damaged, foreign, and scratch. In Table 1, “Original data” denotes the number of original defect samples per category. Subsequently, we enhanced the original data through horizontal flipping and brightness-contrast dithering. We then augmented the source datasets using a texture-adaptive procedural defect synthesis method. To ensure statistical consistency with background textures and natural edge transitions, defects were synthesized onto background images. This process ultimately unified the total number of defects in the original and augmented datasets to 1000. The total data was then split into training and validation sets at a 9:1 ratio. In addition, to assess cross-environment robustness, we collect extra real patches from different production batches and imaging conditions. We select 30 real samples for each defect class and background. They are strictly held out and used only for testing. Due to strict quality control and the high cost of scrapping defective smart cards, the number of available real defect samples per type in our production line is inherently limited to only several tens, even after collecting data from multiple batches. Under this practical constraint, using 30 non-overlapping real patches per defect class and background as the held-out test set corresponds to the maximum scale that can be reserved exclusively for evaluation, while keeping the remaining real defects for training and validation together with the synthesized samples.

5.2. Experiment Setting

The computer hardware and software environment used in this study is detailed in Table 2. All experiments were implemented in a Python 3.10.15 environment, with model development based on the PyTorch 2.5.1 framework (CUDA 12.1, cuDNN 90100). Experiments were conducted on a Windows 10 (10.0.26100) system with the following hardware configuration: one Intel® Core™ i9-14900KF processor, 64 GB RAM, and one NVIDIA GeForce RTX 4080 SUPER graphics card with 16 GB VRAM.
Table 3 lists the hyperparameters used in the experiments. This study conducts six comparative experiments: (1) Mask R-CNN; (2) Swin Transformer; (3) the baseline model YOLO11n; (4) YOLO11n +SP, incorporating only SP; (5) YOLO11n +RCM, incorporating only the RCM; and (6) YOLO-SR. In addition to the four YOLO11-based variants, we include two representative baselines: a two-stage detector (Mask R-CNN) and a transformer-based segmentation model (Swin Transformer). For Mask R-CNN, we adopt the standard implementation with a ResNet-50-FPN backbone pre-trained on COCO and re-initialize the detection head. For the Swin-based model, we follow the official UPerNet-Swin configuration and adapt the number of output classes to our defect categories. To ensure fairness, the training hyperparameters remain consistent across all six experiments: batch size is set to 40, training epochs to 300, input resolution to 640 × 640, and initial learning rate to 1 × 10⁻⁴. All other training configurations remain unchanged to guarantee reproducibility and impartiality in the comparisons.

5.3. Results and Analysis

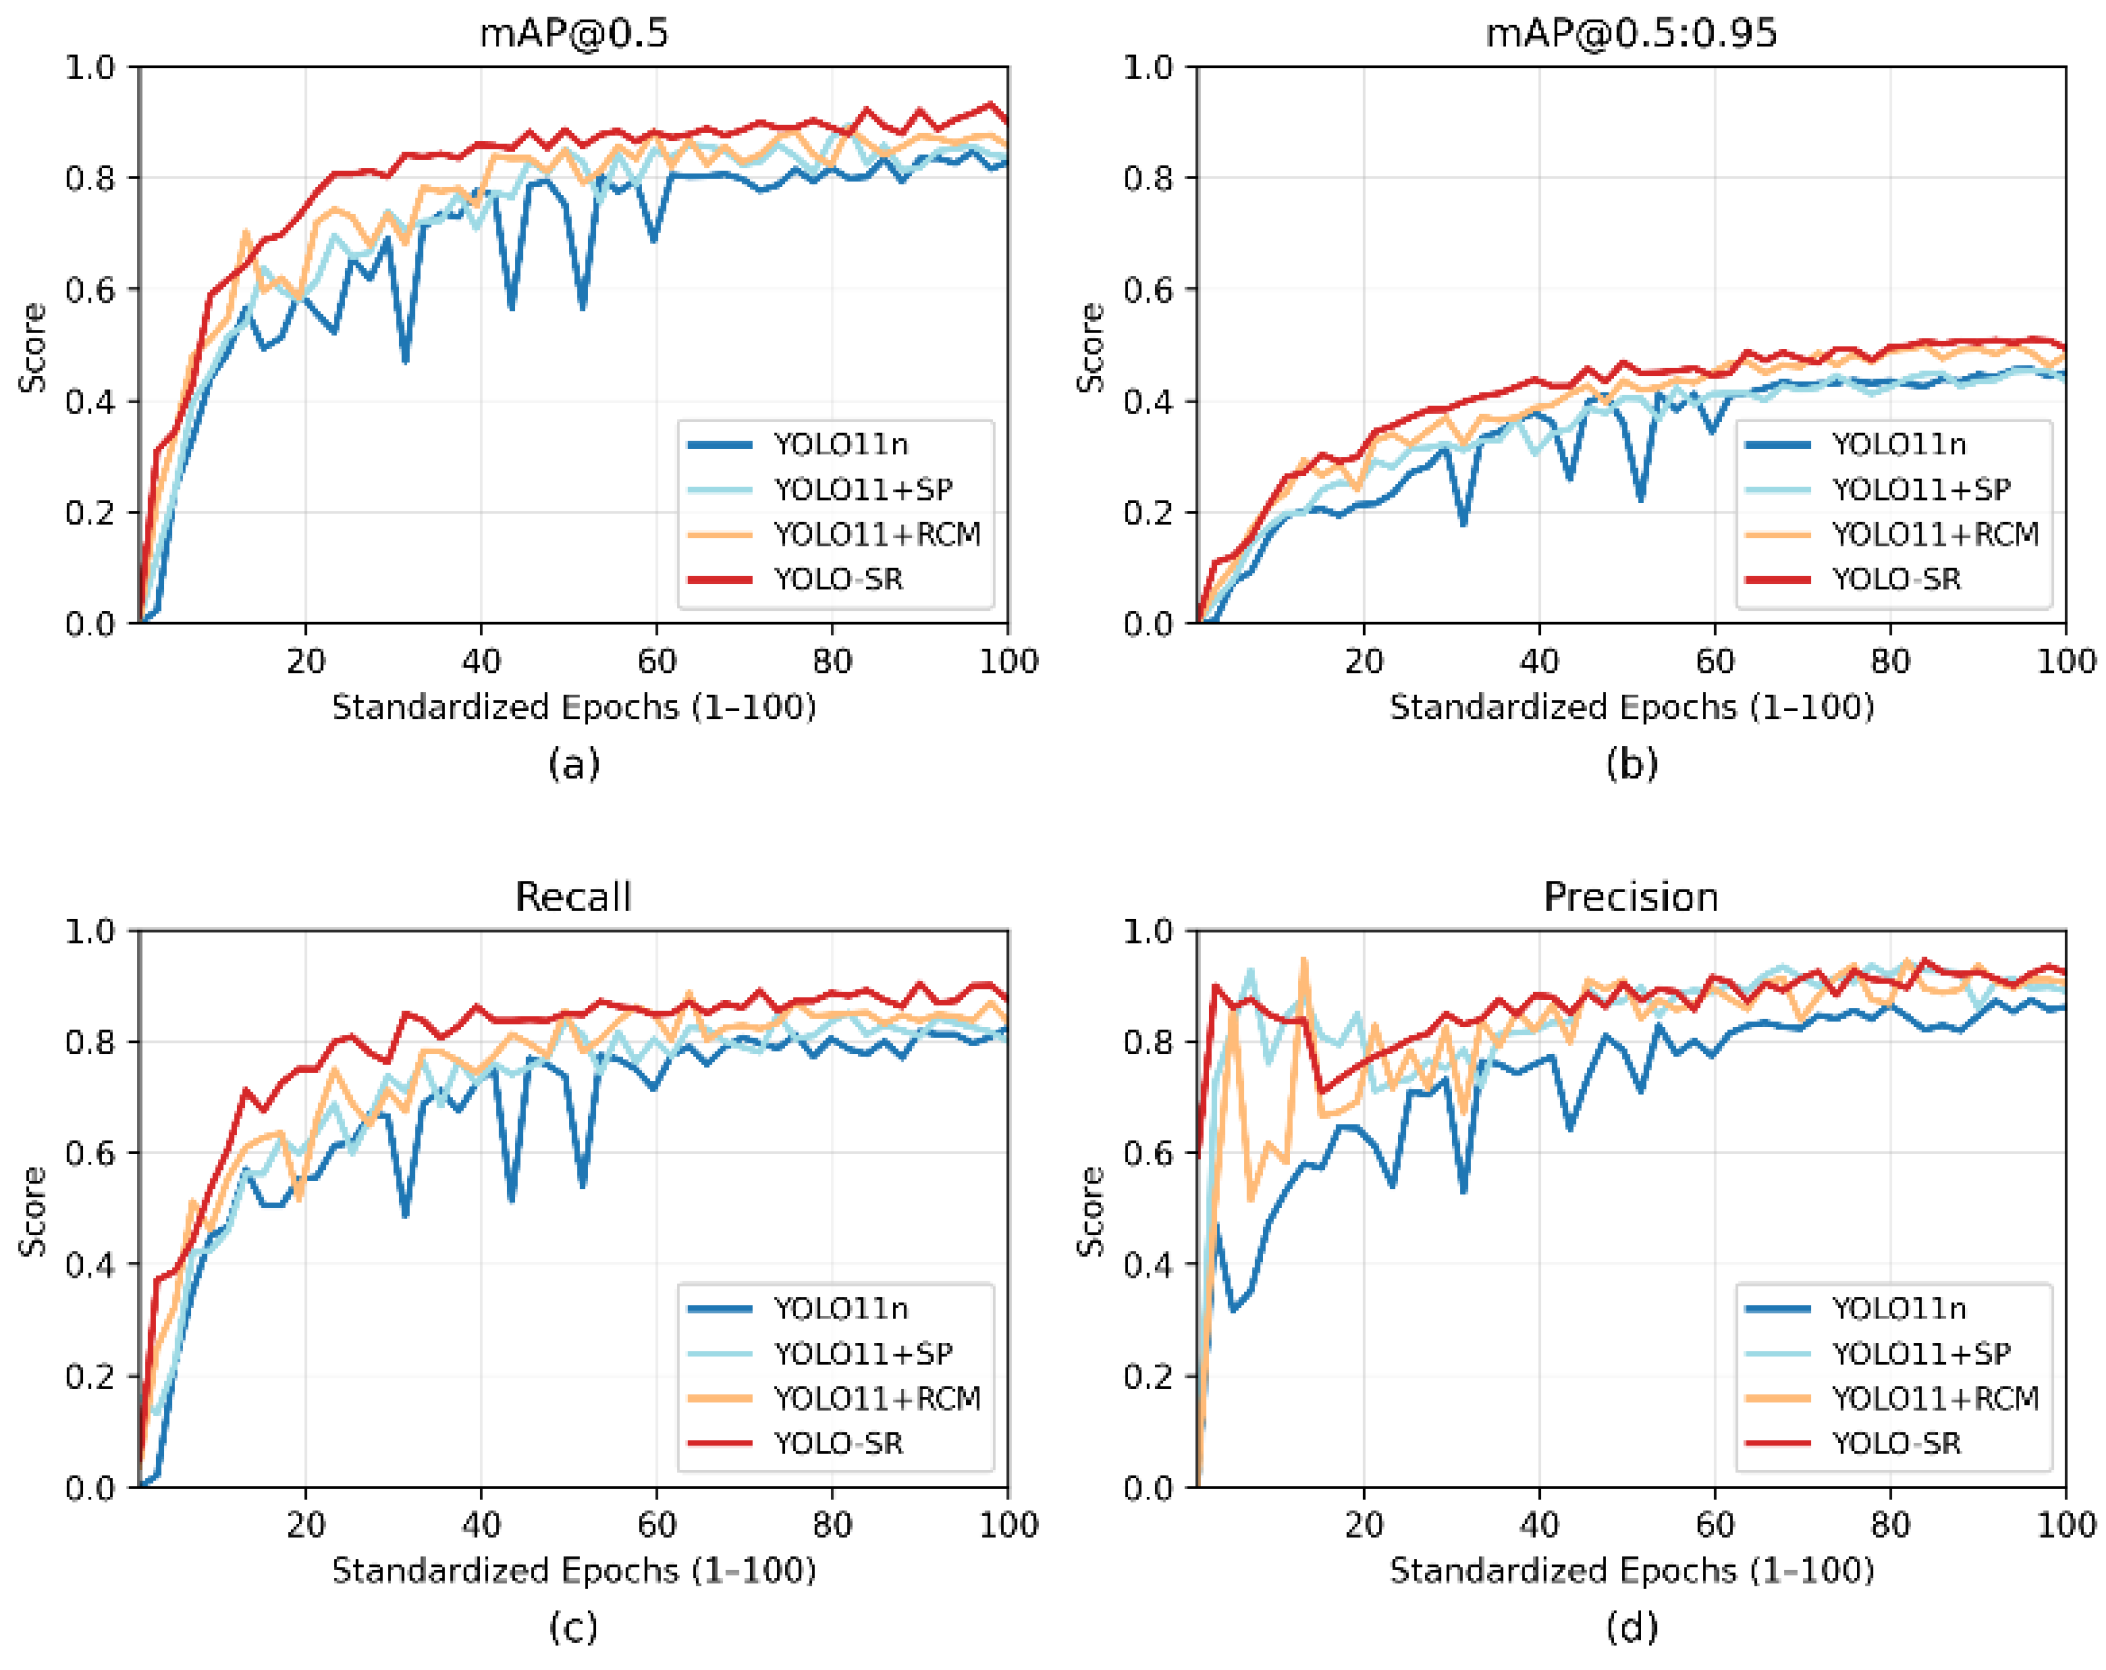
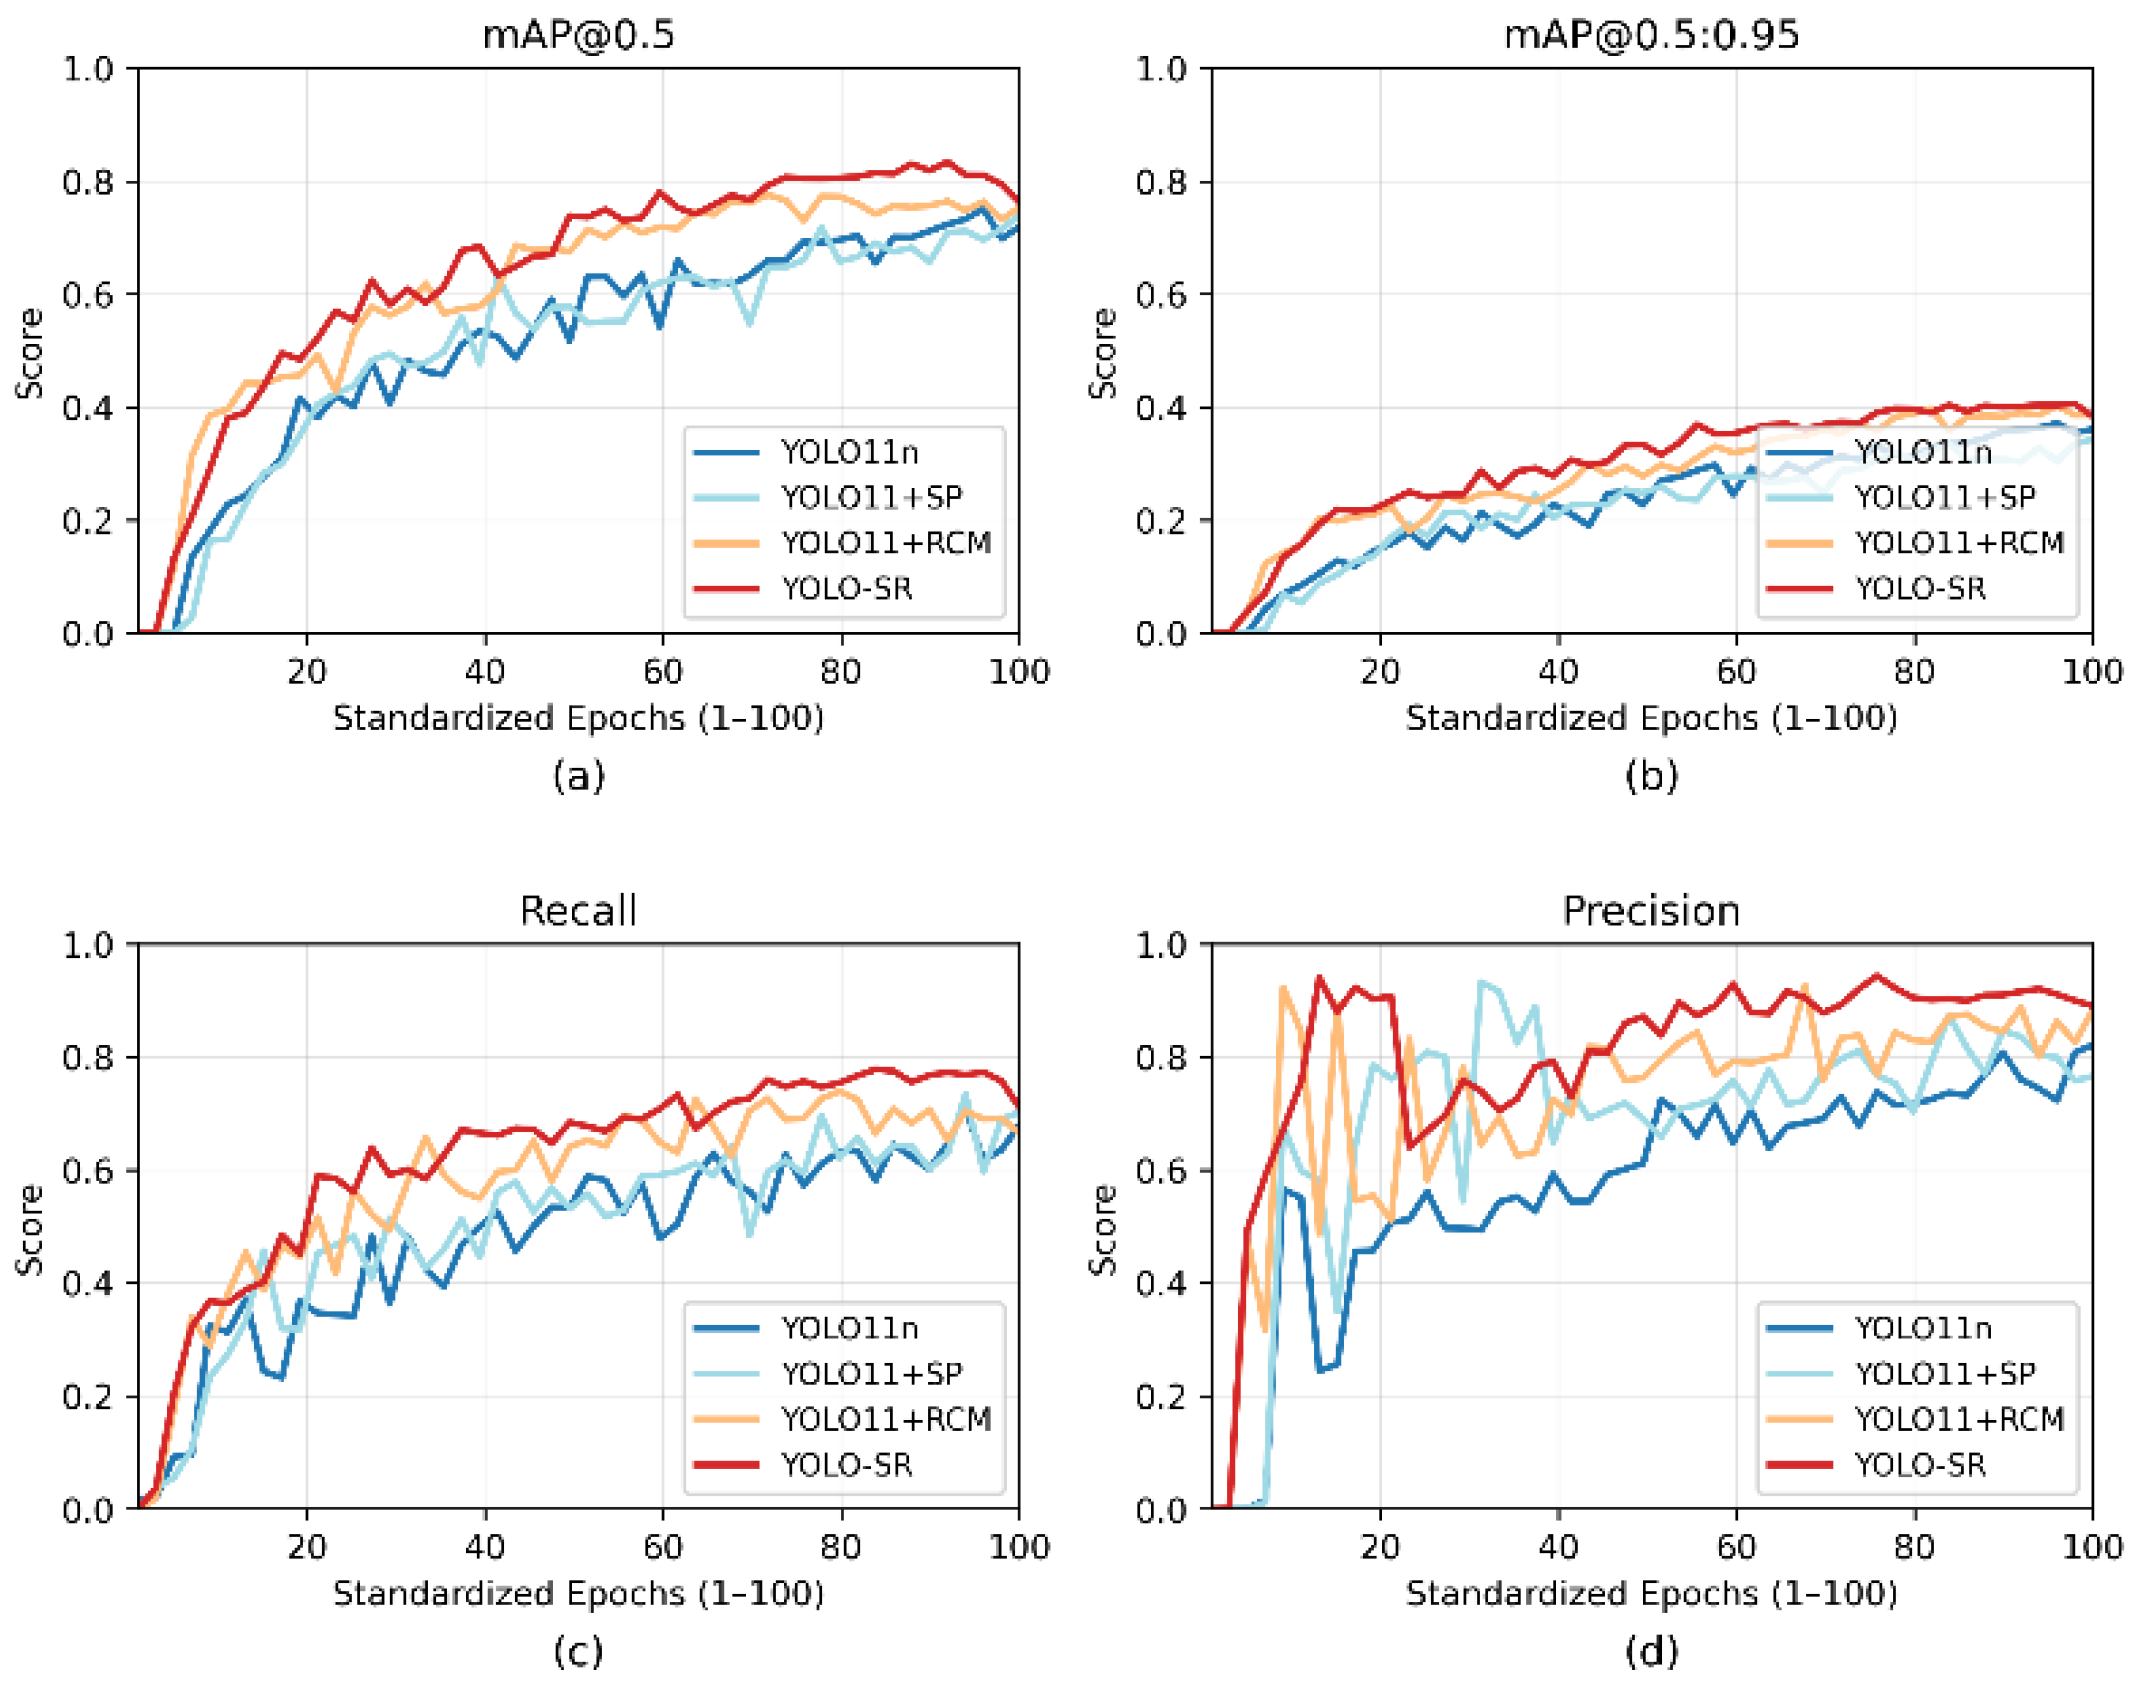
This study conducted comparative evaluations of six models—YOLO11n, YOLO11 + SP, YOLO11 + RCM, and YOLO-SR, Swin Transformer, Mask R-CNN—under identical training protocols. YOLO-SR achieved the best overall performance on both datasets (Table 4). Compared to the YOLO11 baseline under the same training protocol, YOLO-SR improved Recall on ICChip from 0.737 to 0.800 (+6.3%), Precision from 0.716 to 0.781 (+6.5%), mAP@0.5 from 0.701 to 0.787 (+8.6%), and mAP@0.5:0.95 from 0.322 to 0.335 (+1.3%). In contrast, Swin Transformer attains recall = 0.758, precision = 0.727, mAP@0.5 = 0.714, and mAP@0.5:0.95 = 0.328, while Mask R-CNN lags further behind (recall = 0.684, precision = 0.698, mAP@0.5 = 0.635, mAP@0.5:0.95 = 0.299). A similar trend is observed on the SignPlate dataset. YOLO-SR outperforming Swin Transformer and Mask R-CNN. On the SignPlate dataset, Recall increased from 0.643 to 0.719 (+7.6%), Precision from 0.802 to 0.867 (+6.5%), mAP@0.5 from 0.713 to 0.808 (+9.5%), and mAP@0.5:0.95 from 0.361 to 0.405 (+4.4%). For simplicity, metric curves from different model training processes are normalized to a 1–100 epoch scale. (Figure 13 and Figure 14) Across the four subplots—(a) mAP@0.5, (b) mAP@0.5:0.95, (c) Recall, and (d) Precision—for ICChip and SignPlate datasets, YOLO-SR surpasses other methods overall after approximately 20–30 normalized steps, exhibiting lower late-stage fluctuations and more stable convergence. YOLO11 + SP exhibits higher initial peaks but greater oscillations on the Precision and mAP@0.5 curves. YOLO11 + RCM consistently outperforms YOLO11 + SP on Recall and mAP@0.5:0.95 curves, demonstrating its contribution to high-IoU localization and boundary stability. The final rankings at the end of each curve align with the one-shot evaluation results in Table 4: YOLO-SR achieves the best overall performance among the four YOLO11-based variants, followed by YOLO11 + RCM. YOLO11 + SP demonstrates greater advantages at low-IoU metrics but slightly underperforms at high IoU. The combination of both modules yields complementary gains, simultaneously improving all four metrics of detection and localization. To avoid misunderstanding, the curves in the text reflect trends in the validation set during training progression, while Table 4 presents single-point results obtained on the test set using the optimal validation weights. From the perspective of the smart-card AOI pipeline, all defect categories in ICChip (damaged, foreign, scratch, trace) and SignPlate (damaged, foreign, scratch) are treated as safety-critical: once any defect is detected, regardless of its type, the corresponding card is rejected and sent for manual verification. Accordingly, the datasets in Table 1 are constructed to be class-balanced, and the evaluation in Table 4 focuses on macro-averaged recall, precision, and mAP, which directly reflect the overall capability of each model to capture micro-defects on the two workstations.
Quantitatively, Table 4 shows that YOLO-SR provides consistent gains in recall, precision, and mAP@0.5 over YOLO11n on both datasets. The improvements at mAP@0.5:0.95 are more modest (+1.3% on ICChip and +4.4% on SignPlate), which is smaller than the gains at mAP@0.5. Inspection of the IoU-sweep AP curves produced by the evaluation script (Figure 13b and Figure 14b) suggests that the gap between YOLO-SR and YOLO11n gradually shrinks toward stricter IoU thresholds (around 0.7–0.9). This behavior is not unexpected: extremely high IoU requires very accurate boundary alignment and is sensitive to annotation resolution, to label noise at thin boundaries, and to the limited number of real defect samples in our dataset. In other words, YOLO-SR mainly strengthens region-level localization and recall for tiny defects, while fine-grained boundary refinement at very high IoU remains challenging under the current data and annotation conditions. We therefore treat the relatively small gain at mAP@0.5:0.95 as a limitation and discuss possible boundary-aware extensions in conclusion.

5.4. Computational Complexity and Inference Latency

To better quantify the computational overhead of the proposed modules, Table 5 reports the parameter counts and single-image inference latency of the four YOLO11-based variants measured on the same RTX 4080 SUPER GPU (Table 2) with 640 × 640 input and batch size = 1. YOLO11n has 2.84 M parameters and runs at 6.34 ms per image (about 158 FPS). Enabling SP or RCM individually brings modest increases in model size and latency. YOLO-SR, which combines both SP and RCM, has 6.28 M parameters and an average latency of 10.84 ms per image (about 92 FPS). Although this is slower than the YOLO11n baseline, it remains on the order of 10 ms and satisfies the real-time requirements of our in-line card inspection setup. For reference, both the Swin Transformer and Mask R-CNN baselines are substantially larger in scale than our YOLO11-based variants. Therefore, Table 5 focuses on the four YOLO11-based variants when comparing model size and latency, while Swin Transformer and Mask R-CNN are only reported in terms of detection accuracy in Table 4. This indicates that, under the evaluated setting, YOLO-SR achieves improved defect detection accuracy with only a moderate increase in computational cost, and remains much more compact than the Swin Transformer and Mask R-CNN baselines.

5.5. Domain Discrepancy Between Synthetic and Real Defects

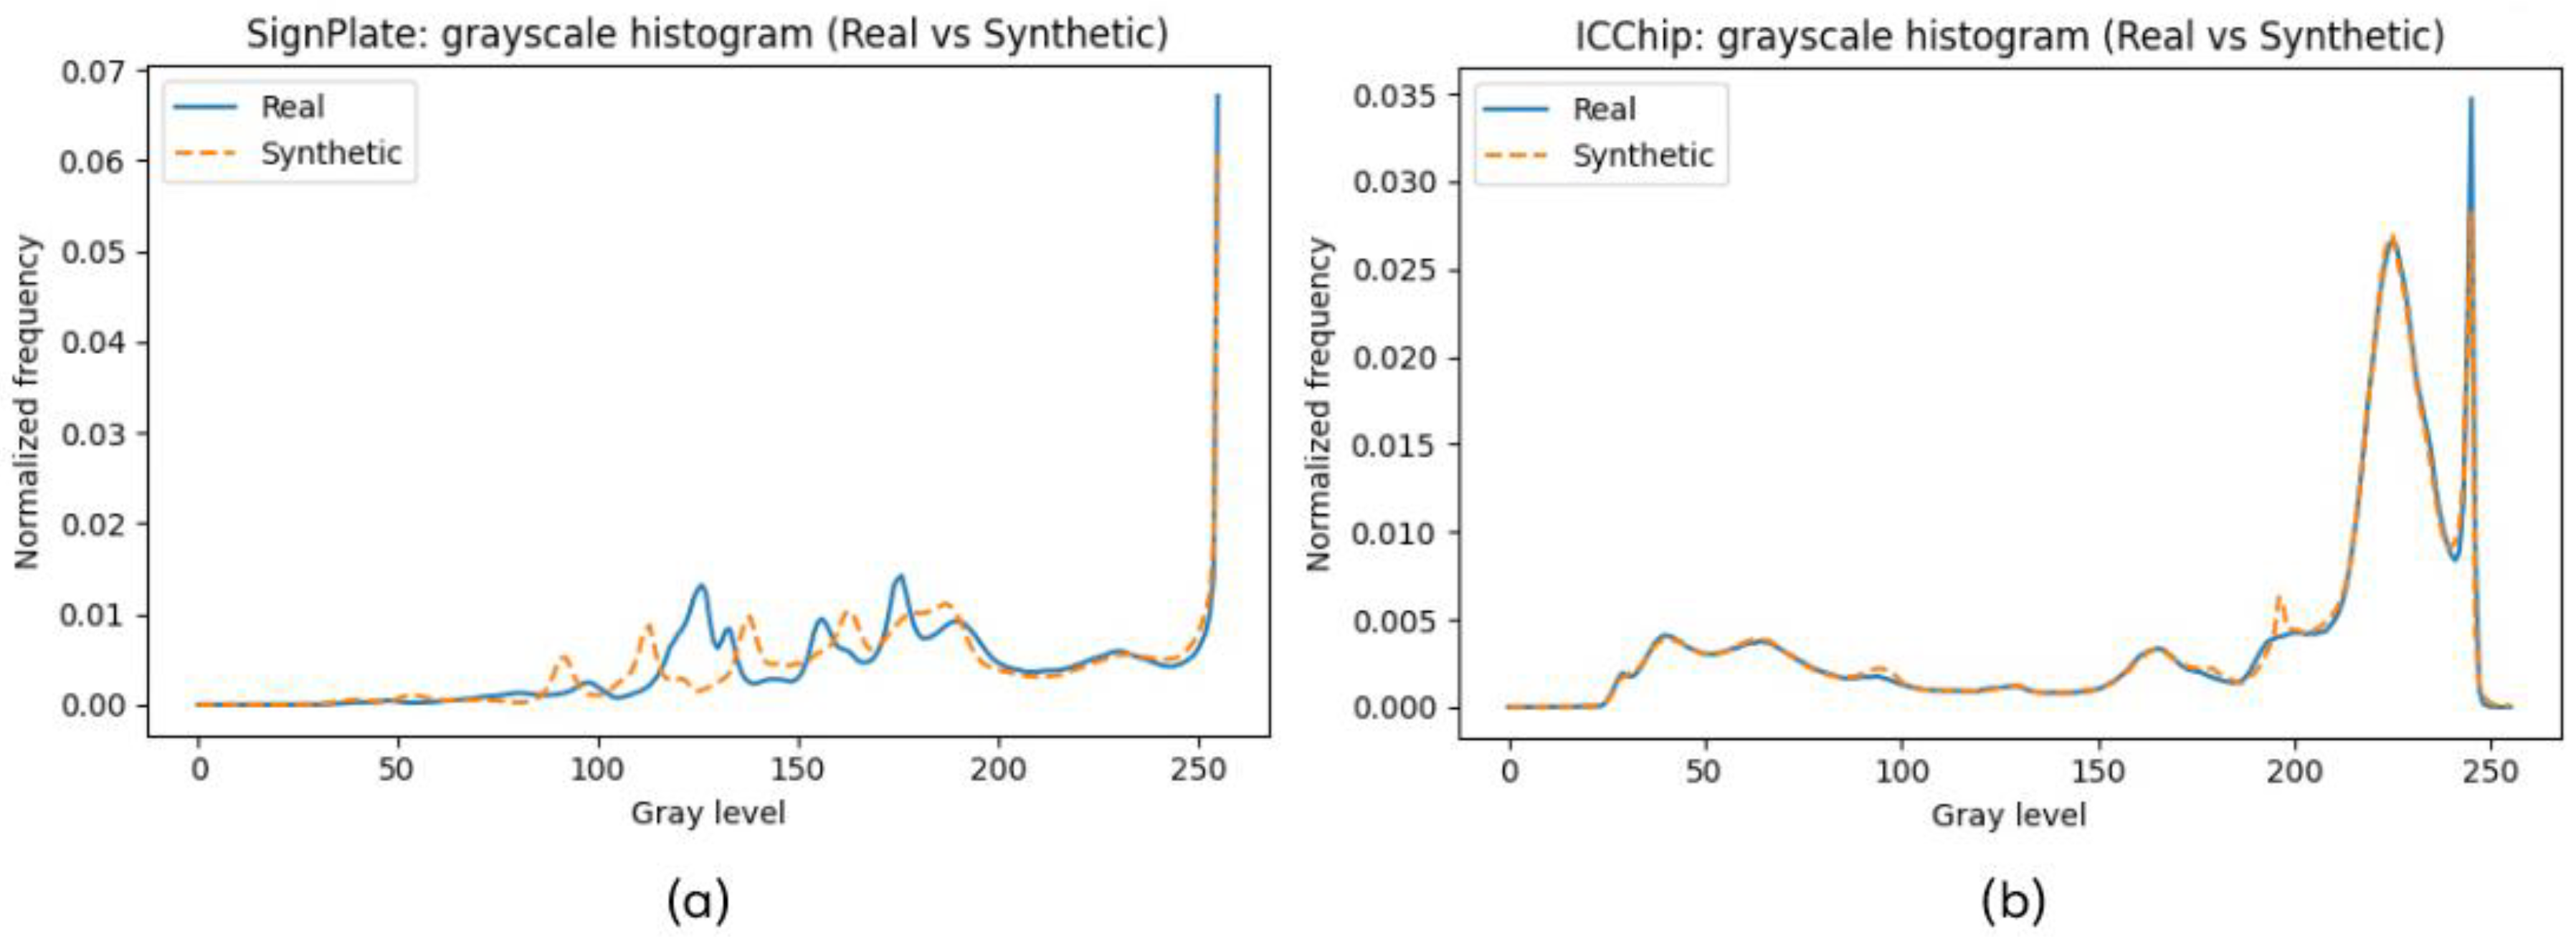
To obtain a preliminary quantitative view of the distribution consistency between synthetic and real data, we further compare the global grayscale intensity histograms of randomly sampled defect patches, as shown in Figure 15a,b. For the SignPlate dataset (Figure 15a), the histograms of real and synthetic patches share very similar overall shapes and contrast ranges, while the synthetic curve appears slightly smoother and shows minor fluctuations around several mid-gray peaks. This behavior is reasonable, because the SignPlate region involves diverse background textures and panel styles, and even cards from the same production batch can exhibit noticeable appearance variations. The observed differences therefore fall within an acceptable range of natural variability.
In contrast, for the ICChip dataset (Figure 15b), where the background structure is more regular and homogeneous, the two histograms almost overlap across the entire gray-level range, including the high-intensity region close to saturation. This indicates that the proposed texture-adaptive synthesis can closely match the luminance statistics of real defects, and that the synthesized samples are reasonably consistent with real data for subsequent training and evaluation.

5.6. Ablation on Module Placement

5.6.1. SP Placement

For the placement of SP, we focus on the more challenging SignPlate subset, whose strongly textured backgrounds and printed characters are more sensitive to directional context modeling. All models in this ablation follow the same training schedule and data augmentation as in Section 5.1, and use the same train/val/test split as summarized in Table 2. To isolate the effect of SP, RCM is disabled in all variants.
Table 6 summarizes six configurations. S0 is the YOLO11n baseline without SP. S1 activates SP only at shallow backbone stages up to P3, while all deeper backbone and neck blocks remain vanilla C3K2. S2 enables SP only at the mid–high backbone stages P4–P5, leaving shallower layers unchanged. S3 places SP solely in the top decoder branch in the neck (the P5 path in Figure 7), without modifying the backbone. S4, which corresponds to the YOLO11 + SP row in Table 4, activates SP at the mid–high backbone stages P4–P5 and the top decoder branch, matching the design described in Section 4.2. Finally, S5 activates SP at shallow backbone stages and the top decoder branch, but keeps P4–P5 as plain C3K2.
The results in Table 6 show that SP is not universally beneficial when placed arbitrarily. The shallow-only (S1) and shallow + head (S5) configurations actually degrade all four metrics compared with the baseline S0, indicating that injecting strip pooling into very early layers can oversmooth local textures and amplify noise from complex SignPlate backgrounds. In contrast, configurations that include SP at the mid–high backbone stages (S2 and S4) consistently improve both recall and mAP@0.5:0.95 over S0. The head-only configuration S3 mainly boosts precision and mAP@0.5 but yields smaller gains at high IoU. Among all variants, S4 (SP at P4–P5 and the top decoder branch) achieves the best overall balance between precision, recall and both mAP metrics, and is therefore adopted as the default SP placement in YOLO11 + SP and YOLO-SR. It is also worth noting that S1 and S5 already contain more SP-augmented blocks than S2 and S4, yet both configurations perform worse than the baseline S0 on all metrics. This suggests that simply inserting SP into additional shallow stages or propagating it to all backbone and neck blocks does not monotonically improve performance and may even degrade it under complex SignPlate backgrounds. For this reason, we deliberately restrict SP to the P4–P5 backbone stages and the top decoder branch in YOLO-SR instead of enabling strip pooling everywhere, which would increase latency without a clear accuracy benefit in our experiments.

5.6.2. RCM Placement

We next investigate the placement of RCM. Similarly to the SP ablation, we perform experiments on the SignPlate subset using the same training and evaluation protocol as in Section 5.1. To isolate the effect of RCM, SP is disabled in all variants. As summarized in Table 7, we compare four configurations: YOLO11n without RCM (R0), inserting RCM at an intermediate backbone stage after the P4 block (R1), inserting RCM at the top semantic backbone stage after the final P5 block and before SPPF (R2, our design), and inserting RCM into the top decoder branch in the neck (R3).
Table 7 shows that the effect of RCM strongly depends on its placement. The mid-backbone configuration R1 increases recall compared with the baseline R0 (0.683 vs. 0.643), but at the cost of lower precision and reduced mAP@0.5 and mAP@0.5:0.95. This suggests that when RCM is applied to less abstract P4 features, the rectangular gate may become unstable and sometimes overweight background regions. The decoder-level configuration R3 performs worse than R0 on all four metrics, indicating that constructing the gate after multi-scale fusion in the neck is not suitable for this task. In contrast, the top semantic backbone configuration R2 improves all four metrics over R0 and yields the highest recall and mAP@0.5:0.95 among all variants, confirming that exploiting fully semantic P5 features before SPPF is most effective for global shape self-calibration and background suppression. These trends justify our choice in Section 4.3 to place RCM at the top semantic backbone stage rather than at intermediate or head positions. Compared with the baseline R0, both R1 and R3 can be viewed as configurations that introduce additional RCM gating beyond the top backbone stage, yet neither of them achieves consistent gains across recall, precision, and both mAP metrics. This again indicates that proliferating RCM blocks at multiple levels is not necessarily beneficial under the current data and annotation conditions and may even destabilize the rectangular gating when applied to less abstract features. Consequently, we adopt a single top-level RCM in YOLO-SR as a minimal and empirically effective design rather than stacking multiple RCM blocks throughout the network.
Overall, the ablations in Table 6 and Table 7 indicate that the benefits of SP and RCM saturate when they are placed at carefully chosen semantic levels: adding more SP or RCM blocks at shallow or decoder stages does not lead to monotonic improvements and can even harm performance while increasing latency. Given the real-time requirement of our industrial scenario, we therefore focus on the minimal SP/RCM configuration used in YOLO-SR rather than exploring heavier variants with multiple stacked modules.

6. Conclusions

This work addresses three core challenges encountered in actual production lines: (1) confusion caused by small scales and low contrast; (2) contour discontinuities and positioning inconsistencies resulting from slender, discontinuous shapes; (3) data scarcity due to sample sparsity and class imbalance. It proposes solutions from both data and task–model perspectives. Experimental validation on the ICChip and SignPlate datasets confirms these approaches, as summarized in Table 4 and illustrated by the training curves in Figure 13 and Figure 14. On the data side, texture-adaptive defect synthesis builds multi-morphology small-defect sample libraries for ICChip and SignPlate areas, mitigating imbalance and suppressing overfitting despite limited overall sample size. On the task or model side, SP injects directional long-range context into C3K2, specifically enhancing visibility of elongated and weakly textured defects, while RCM operates at the top-level semantic stage, using rectangular gating to suppress background noise and calibrate shapes, thereby stabilizing boundaries. Combining both methods simultaneously enhances extended foreground detection while reducing texture and character interference, creating complementary gains. This method synergistically enhances detection rate, accuracy, and high-IoU localization quality through data construction coupled with directional priors and global self-calibration. Consistent gains are achieved across the two evaluated workstation datasets, indicating that, within the evaluated setup, the proposed approach can deliver stable small-defect detection with deployable overhead in practical production environments.
Overall, YOLO-SR is positioned as a domain-specific, deployment-oriented modification of YOLO11 rather than a fundamentally new detection architecture. Despite the performance gains, this study still has several limitations. First, although we additionally collected a small number of real test patches from different production batches to evaluate cross-environment robustness, the overall dataset is still predominantly synthetic and the number of real defects remains limited. The number of held-out real patches per defect type in our test set is also small (30 per class plus background), which constrains the statistical robustness of the reported metrics and should be regarded as a data-related limitation. Therefore, the reported performance gains should be interpreted as descriptive comparisons under the given test set, rather than as results of formal statistical hypothesis testing. The grayscale intensity histograms in Section 5.4 further show that the luminance distributions of real and synthesized defects are broadly aligned on both datasets: the curves almost overlap on ICChip and only minor deviations appear on SignPlate due to its inherently diverse background textures and panel styles. These results suggest that the proposed texture-adaptive synthesis is reasonably consistent with real data for the present experiments, while more systematic domain adaptation studies—such as synthetic pre-training followed by fine-tuning on different proportions of real defects—will be explored in future work. Finally, the proposed model shows only moderate improvements at high IoU thresholds, which is consistent with the relatively small margin observed at mAP@0.5:0.95 in Table 4. This indicates that there is still room for enhancing boundary precision and strict localization. As future work, we plan to further expand the collection of real defects across multiple production lines and camera/illumination setups and to conduct more systematic cross-line evaluations. We also intend to explore boundary-aware loss functions, multi-scale supervision, and lightweight contour refinement branches to improve high-IoU localization while maintaining the efficiency required in industrial deployments. Moreover, our ablations focus on internal variants and placements of SP and RCM under a fixed real-time budget and do not include replacement experiments with generic attention families such as CBAM, ECA, GAM, or Coordinate Attention. A more systematic study of how these modules compare to, or can be combined with, SP/RCM under comparable latency constraints is left for future work.

Author Contributions

Conceptualization, T.Y.; methodology, T.Y.; software, T.Y. and S.-H.K.; validation and formal analysis, F.M.F.H.; statistical analysis, T.Y. and F.M.F.H.; resources, T.Y. and F.M.F.H.; data curation, T.Y.; writing—review and editing, T.Y. and S.-H.K.; software upgrade and data generation, T.Y.; project administration, K.-H.Y.; funding acquisition, K.-H.Y. All authors have read and agreed to the published version of the manuscript.

Funding

This work was supported by the Innovative Human Resource Development for Local Intellectualization program through the Institute of Information & Communications Technology Planning & Evaluation (IITP) grant funded by the Korea government (MSIT) (IITP-2025-RS-2020-II201462).

Institutional Review Board Statement

Not applicable.

Informed Consent Statement

Not applicable.

Data Availability Statement

Access to the data is restricted due to proprietary constraints enforced by the data-holding enterprise. Therefore, it is not available for use upon request.

Conflicts of Interest

The authors declare no conflicts of interest.

References

  1. Mazzei, D.; Ramjattan, R. Machine Learning for Industry 4.0: A Systematic Review Using Deep Learning-Based Topic Modelling. Sensors 2022, 22, 8641. [Google Scholar] [CrossRef] [PubMed]
  2. Zhang, L.; Jia, X.; Chang, Q.; Liu, Y.; Zhang, Z.; Cao, Y.; Liu, J.; Yang, Y. The development of Machine Vision and its Applications in Different Industries: A review. Mech. Eng. Adv. 2024, 2, 1746. [Google Scholar] [CrossRef]
  3. de la Rosa, F.L.; Sánchez-Reolid, R.; Gómez-Sirvent, J.L.; Morales, R.; Fernández-Caballero, A. A Review on Machine and Deep Learning for Semiconductor Defect Classification in Scanning Electron Microscope Images. Appl. Sci. 2021, 11, 9508. [Google Scholar] [CrossRef]
  4. Zheng, X.; Zheng, S.; Kong, Y.; Chen, J. Recent advances in surface defect inspection of industrial products using deep learning techniques. Int. J. Adv. Manuf. Technol. 2021, 113, 35–58. [Google Scholar] [CrossRef]
  5. Bártová, B.; Bína, V.; Váchová, L. A PRISMA-driven Systematic Review of Data Mining Methods Used for Defects Detection and Classification in the Manufacturing Industry. Production 2022, 32, e20210097. [Google Scholar] [CrossRef]
  6. Prabhu, E.; Debby, G. An Efficient Optimization Approach for Steel Surface Flaw Classification using Machine Learning. Int. J. Res. Appl. Sci. Eng. Technol. 2025, 13, 1526–1538. [Google Scholar] [CrossRef]
  7. Waseem, F.; Menon, S.; Xu, H.; Mondal, D. VizInspect Pro—Automated Optical Inspection (AOI). arXiv 2022, arXiv:2205.13095. [Google Scholar]
  8. Wang, K.-J.; Fan-Jiang, H.; Lee, Y.-X. A multiple-stage defect detection model by convolutional neural network. Comput. Ind. Eng. 2022, 168, 108096. [Google Scholar] [CrossRef]
  9. Ma, Y.; Yin, J.; Huang, F.; Li, Q. Surface defect inspection of industrial products with object detection deep networks: A systematic review. Artif. Intell. Rev. 2024, 57, 333. [Google Scholar] [CrossRef]
  10. Bower, L.A. Automatic Identification Technology (AIT): The Development of Functional Capability and Card Application Matrices. Master’s Thesis, Naval Postgraduate School, Monterey, CA, USA, 1994. [Google Scholar]
  11. Access Control Council; Identity Council. PIV Card/Reader Challenges with Physical Access Control Systems: A Field Troubleshooting Guide. Available online: https://www.securetechalliance.org/piv-card-reader-challenges-with-physical-access-control-systems-a-field-troubleshooting-guide/ (accessed on 1 October 2025).
  12. TransFirst, TSYS. Operating Guide for Merchant Card Processing v6-0915. 2015. Available online: https://assets.tsys.com/Assets/TSYS/downloads/merchant/docs/TransFirst_Merchant_Card%20Processing_Operating_Guide_v6-0915.pdf (accessed on 1 October 2025).
  13. Liang, X.; Sun, J.; Wang, X.; Li, J.; Zhang, L.; Guo, J. Surface weak scratch detection for optical elements based on a multimodal imaging system and a deep encoder–decoder network. J. Opt. Soc. Am. A 2023, 40, 1237–1248. [Google Scholar] [CrossRef] [PubMed]
  14. Ye, B.; Xue, R.; Wu, Q. A hybrid attention multi-scale fusion network for real-time semantic segmentation. Sci. Rep. 2025, 15, 872. [Google Scholar] [CrossRef] [PubMed]
  15. Chen, X.; Cao, J.-W.; Wang, Y.-P. Defect detection in ID cards with accurately reconstructed reference image. In Proceedings of the 5th International Conference on Multimedia and Image Processing, Nanjing China, 10–12 January 2020; pp. 18–22. [Google Scholar]
  16. Lin, H.; Zhan, Y.; Liu, S.; Ke, X.; Chen, Y. A deep learning based bank card detection and recognition method in complex scenes. Appl. Intell. 2022, 52, 15259–15277. [Google Scholar] [CrossRef]
  17. Ultralytics. YOLO11 Documentation & Software Repository. 2024. Available online: https://docs.ultralytics.com/models/yolo11/ (accessed on 1 October 2025).
  18. Cai, X.; Ruan, Z.; Sun, H. Bank Card Number Identification Method Based on YOLOv3 and MobileNetv2. J. Comput.-Aided Des. Comput. Graph. 2022, 34, 142–151. [Google Scholar] [CrossRef]
  19. Sun, G.; You, F. Bank card number recognition system based on deep learning. In Proceedings of the EITCE 2020: 2020 4th International Conference on Electronic Information Technology and Computer Engineering, Online, 6–8 November 2020; pp. 745–749. [Google Scholar]
  20. Bochkovskiy, A.; Wang, C.-Y.; Liao, H.-Y.M. YOLOv4: Optimal Speed and Accuracy of Object Detection. arXiv 2020, arXiv:2004.10934. [Google Scholar] [CrossRef]
  21. Ghiasi, G.; Cui, Y.; Srinivas, A.; Qian, R.; Lin, T.-Y.; Cubuk, E.D.; Le, Q.V.; Zoph, B. Simple Copy-Paste Is a Strong Data Augmentation Method for Instance Segmentation. In Proceedings of the IEEE/CVF Conference on Computer Vision and Pattern Recognition (CVPR), Nashville, TN, USA, 20–25 June 2021; pp. 2918–2928. [Google Scholar]
  22. Cubuk, E.D.; Zoph, B.; Mane, D.; Vasudevan, V.; Le, Q.V. AutoAugment: Learning Augmentation Strategies from Dat. In Proceedings of the IEEE/CVF Conference on Computer Vision and Pattern Recognition (CVPR), Long Beach, CA, USA, 15–20 June 2019; pp. 113–123. [Google Scholar]
  23. Li, C.-L.; Sohn, K.; Yoon, J.; Pfister, T. CutPaste: Self-Supervised Learning for Anomaly Detection and Localization. In Proceedings of the IEEE/CVF Conference on Computer Vision and Pattern Recognition (CVPR), Nashville, TN, USA, 20–25 June 2021; pp. 9664–9674. [Google Scholar]
  24. Zhang, G.; Cui, K.; Hung, T.-Y.; Lu, S. Defect-GAN: High-Fidelity Defect Synthesis for Automated Defect Inspection. In Proceedings of the 2021 IEEE Winter Conference on Applications of Computer Vision (WACV), Virtual, 5–9 January 2021; pp. 2524–2534. [Google Scholar]
  25. Hou, Q.; Zhou, D.; Feng, J. Coordinate Attention for Efficient Mobile Network Design. In Proceedings of the 2021 IEEE/CVF Conference on Computer Vision and Pattern Recognition (CVPR), Nashville, TN, USA, 20–25 June 2021; pp. 13708–13717. [Google Scholar]
  26. Wang, B.; Wang, M.; Yang, J.; Luo, H. YOLOv5-CD: Strip steel surface defect detection method based on coordinate attention and a decoupled head. Meas. Sens. 2023, 30, 100909. [Google Scholar] [CrossRef]
  27. Hou, Q.; Zhang, L.; Cheng, M.-M.; Feng, J. Strip Pooling: Rethinking Spatial Pooling for Scene Parsing. In Proceedings of the 2020 IEEE/CVF Conference on Computer Vision and Pattern Recognition (CVPR), Seattle, WA, USA, 13–19 June 2020; pp. 4002–4011. [Google Scholar]
  28. Takikawa, T.; Acuna, D.; Jampani, V.; Fidler, S. Gated-scnn: Gated shape cnns for semantic segmentation. In Proceedings of the IEEE/CVF International Conference on Computer Vision (ICCV), Seoul, Republic of Korea, 27 October–2 November 2019; pp. 5229–5238. [Google Scholar]
  29. Qin, X.; Zhang, Z.; Huang, C.; Gao, C.; Dehghan, M.; Jagersand, M. BASNet: Boundary-Aware Salient Object Detection. In Proceedings of the IEEE/CVF Conference on Computer Vision and Pattern Recognition (CVPR), Long Beach, CA, USA, 15–20 June 2019; pp. 7479–7489. [Google Scholar]
  30. Feng, Y.; Fan, Z.; Yan, Y.; Jiang, Z.; Zhang, S. MFAFNet: Multi-Scale Feature Adaptive Fusion Network Based on DeepLab V3+ for Cloud and Cloud Shadow Segmentation. Remote. Sens. 2025, 17, 1229. [Google Scholar] [CrossRef]
  31. Ni, Z.; Chen, X.; Zhai, Y.; Tang, Y.; Wang, Y. Context-Guided Spatial Feature Reconstruction for Efficient Semantic Segmentation. In Computer Vision–ECCV 2024; Springer: Cham, Switzerland, 2024; pp. 239–255. [Google Scholar]
  32. Sun, B.; Cheng, X. Smoke Detection Transformer: An Improved Real-Time Detection Transformer Smoke Detection Model for Early Fire Warning. Fire 2024, 7, 488. [Google Scholar] [CrossRef]
  33. Liu, L.; Li, J. MCRS-YOLO: Multi-Aggregation Cross-Scale Feature Fusion Object Detector for Remote Sensing Images. Remote Sens. 2025, 17, 2204. [Google Scholar] [CrossRef]
  34. Zhang, Y.; Yu, X.; Ji, X. WMC-RTDETR: A Lightweight Tea Disease Detection Model. Front. Plant Sci. 2025, 16, 1574920. [Google Scholar] [CrossRef] [PubMed]
  35. Hu, F.; Abula, M.; Wang, D.; Li, X.; Yan, N.; Xie, Q.; Zhang, X. Investigation of an Efficient Multi-Class Cotton Leaf Disease Detection Algorithm That Leverages YOLOv11. Plants 2025, 25, 4432. [Google Scholar] [CrossRef] [PubMed]
Figure 1. Examples of typical micro-defects in production scenarios. The defect areas on the surfaces of ICChip (a) and SignPlate (b) are marked with red boxes.
Applsci 15 12980 g001
Figure 2. Augmentation process of SignPlate damaged type data, where the red square on the left marks the upper-left sampling region, the red cross indicates the 2 × 2 pixel block at the corner used to estimate the background color, and the red square on the right highlights the newly synthesized defect.
Applsci 15 12980 g002
Figure 3. Augmentation process of SignPlate foreign type data, where the red box marks the position of the synthesized defect on the SignPlate.
Applsci 15 12980 g003
Figure 4. Augmentation process of SignPlate scratch-type data, where the red label marks the position of the synthesized defect on the SignPlate.
Applsci 15 12980 g004
Figure 5. Augmentation process of ICChip damaged type data, where the red square on the left marks the sampled patch on the chip surface, the red cross denotes the 2 × 2 pixel block at the centroid used to estimate the background tone, and the red square on the right highlights the position of the synthesized damaged defect pasted back onto the ICChip.
Applsci 15 12980 g005
Figure 6. Augmentation process of ICChip trace type data, where the red square on the left marks the sampled patch on the chip surface, the red cross denotes the 2 × 2 pixel block at the centroid used to estimate the background tone, and the red square on the right highlights the position of the synthesized trace defect pasted back onto the ICChip.
Applsci 15 12980 g006
Figure 7. Overall Framework of YOLO-SR. Using YOLO11 as the backbone, C3K2_SP (green parts) is embedded layer-by-layer into the backbone and neck while preserving the three-scale decoder and segmentation head. RCM (red part) is integrated at the top-level semantic stage to synergize with SP, enhancing the modeling of slender and weakly textured objects. The blue arrows and “C3K2” labels indicate the positions of the original C3K2 blocks in YOLO11 that are replaced by C3K2_SP.
Applsci 15 12980 g007
Figure 8. Composition of C3K2_SP (a). In the standard C3K2 block, C3K is replaced one-to-one by C3K_SP (b); C3K_SP stacks two Bottleneck_SP (c) units. Each Bottleneck_SP inserts SP after the main-branch Conv while preserving the residual topology.
Applsci 15 12980 g008
Figure 9. Two parallel branches, “multi-scale” and “strip”, are upsampled back to the original resolution and concatenated with local features. A 1 × 1 fusion and residual output inject lightweight, directional context.
Applsci 15 12980 g009
Figure 10. YOLO11 (top) exhibits a short and discontinuous response to elongated scratches; after incorporating SP (bottom), the contextual information along the stripe direction is extended, resulting in a more continuous response, greater coverage, and more stable localization.
Applsci 15 12980 g010
Figure 11. Partial flowchart of RCM. First, Depthwise Conv yields local responses; parallel H × 1/1 × W adaptive pooling generates rectangular gates via 1 × k_b → ReLU → k_b × 1 → Sigmoid, performing pixel-wise weighting on local responses. Subsequently, 1 × 1 Conv → GELU → Dropout → 1 × 1 Conv fusion occurs. Finally, LayerScale + DropPath is applied before adding the residual input to obtain the output.
Applsci 15 12980 g011
Figure 12. In a SignPlate scene with extremely complex textures and text, the enlarged area within the red dashed box shows that YOLO11 + SP outperforms YOLO-SR (SP + RCM) by consistently detecting thin, weak defects while maintaining continuous response. It also demonstrates superior suppression of background and character interference, resulting in fewer false detections and more stable localization.
Applsci 15 12980 g012
Figure 13. Comparison line chart of YOLOv11n, YOLO11 + SP, YOLO11 + RCM, and YOLO-SR models; subplots (a) mAP@0.5. (b) mAP@0.5:0.95. (c) Recall. (d) Precision. The training curve plotted by epoch on the ICChip dataset is shown below.
Applsci 15 12980 g013
Figure 14. Comparison line chart of YOLO11n, YOLO11 + SP, YOLO11 + RCM, and YOLO-SR models; subplots (a) mAP@0.5. (b) mAP@0.5:0.95. (c) Recall. (d) Precision. The training curve plotted by epoch on the SignPlate dataset is shown below.
Applsci 15 12980 g014
Figure 15. Grayscale intensity histograms of real and synthetic defect patches on SignPlate (a) and ICChip (b).
Applsci 15 12980 g015
Table 1. Experiment dataset.
DatasetClassOriginal DataAugmented DataTotal
(Train + Val)
Train/Val (9:1)Test Data
ICChipdamaged329681000900/10030
foreign289721000900/10030
scratch369641000900/10030
Trace329681000900/10030
background1108901000900/10030
SignPlatedamaged249761000900/10030
foreign269741000900/10030
scratch309701000900/10030
background909101000900/10030
Table 2. Hardware environment and software versions used.
CategoryEnvironment
HardwareIntel(R) Core(TM) i9-14900KF × 1
RAM 64 GB
GeForce RTX 4080 SUPER 16 GB × 1
SoftwareWindows 10 (10.0.26100)
Python 3.10.15
Cuda 12.1
Pytorch 2.5.1
Table 3. Model and Training Configuration.
ModelsBatch SizeEpochInput Image
Pixels
Learning Rate
Mask R-CNN40300640 × 6400.0001
Swin Transformer40300640 × 6400.0001
YOLO11n40300640 × 6400.0001
YOLO11 + SP40300640 × 6400.0001
YOLO11 + RCM40300640 × 6400.0001
YOLO-SR40300640 × 6400.0001
Table 4. Experimental Results on ICChip and SignPlate datasets.
+MethodRecallPrecisionMap@0.5Map@0.5:0.95
ICChipMask R-CNN0.6840.6980.6350.299
Swin Transformer0.7580.7270.7140.328
YOLO11n0.7370.7160.7010.322
YOLO11 + SP0.7190.7560.7190.314
YOLO11 + RCM0.7480.7210.6910.324
YOLO-SR0.8000.7810.7870.335
SignPlateMask R-CNN0.5410.7290.6230.347
Swin Transformer0.6890.8560.7630.372
YOLO11n0.6430.8020.7130.361
YOLO11 + SP0.6450.8430.7660.370
YOLO11 + RCM0.7010.8110.7320.386
YOLO-SR0.7190.8670.8080.405
Table 5. Model size and single-image inference latency.
MethodParams (M)Latency (ms/Image)FPS
YOLO11n2.846.34157
YOLO11 + SP3.0810.3197.0
YOLO11 + RCM3.586.75148.1
YOLO-SR6.2810.8492.2
Table 6. Ablation on SP placement on the SignPlate dataset.
RecallPrecisionMap@0.5Map@0.5:0.95
S0YOLO11n (baseline)0.6430.8020.7130.361
S1SP-shallow (backbone)0.6250.7890.6940.338
S2SP-deep (backbone)0.6480.8310.7550.364
S3SP-head0.6320.8270.7630.352
S4SP-deep + head (ours)0.6450.8430.7660.370
S5SP-shallow + head0.6050.7720.6850.333
Table 7. Ablation on RCM placement on the SignPlate dataset.
RecallPrecisionMap@0.5Map@0.5:0.95
R0YOLO11n (baseline)0.6430.8020.7130.361
R1RCM-mid0.6830.7490.6810.317
R2RCM-top (ours)0.7010.8110.7320.386
R3RCM-head 0.6070.7150.6540.302
Disclaimer/Publisher’s Note: The statements, opinions and data contained in all publications are solely those of the individual author(s) and contributor(s) and not of MDPI and/or the editor(s). MDPI and/or the editor(s) disclaim responsibility for any injury to people or property resulting from any ideas, methods, instructions or products referred to in the content.