Systematic Review

Effectiveness of Orthodontic Methods for Leveling the Curve of Spee: A Systematic Review with Meta-Analysis

by
Inês Francisco
1,2,3,4,5,6,7,
Ana Lúcia Pinto
1,
Catarina Nunes
1,2,3,4,5,6,7,
Madalena Prata Ribeiro
2,
Francisco Caramelo
3,4,5,7,8,
Carlos Miguel Marto
1,2,3,4,5,6,7,9,10,
Anabela Baptista Paula
1,2,3,4,5,6,7,9,*,
Raquel Travassos
1,2,3,4,5,6,7 and
Francisco Vale
1,2,3,4,5,6,7
1
Faculty of Medicine, University of Coimbra, 3004-504 Coimbra, Portugal
2
Institute of Orthodontics, Faculty of Medicine, University of Coimbra, 3000-075 Coimbra, Portugal
3
Coimbra Institute for Clinical and Biomedical Research (iCBR), Area of Environment Genetics and Oncobiology (CIMAGO), Faculty of Medicine, University of Coimbra, 3000-075 Coimbra, Portugal
4
Laboratory for Evidence-Based Sciences and Precision Dentistry, University of Coimbra, 3000-075 Coimbra, Portugal
5
Clinical Academic Center of Coimbra (CACC), Hospitais da Universidade de Coimbra, 3004-561 Coimbra, Portugal
6
Centre for Mechanical Engineering, Materials and Processes (CEMMPRE), Advanced Production and Intelligent Systems (ARISE), Department of Mechanical Engineering, University of Coimbra, 3004-504 Coimbra, Portugal
7
Centre for Innovative Biomedicine and Biotechnology (CIBB), University of Coimbra, 3004-504 Coimbra, Portugal
8
Laboratory of Biostatistics and Medical Informatics (LBIM), Faculty of Medicine, University of Coimbra, 3004-531 Coimbra, Portugal
9
Institute of Integrated Clinical Practice, Faculty of Medicine, University of Coimbra, 3004-531 Coimbra, Portugal
10
Institute of Experimental Pathology, Faculty of Medicine, University of Coimbra, 3004-531 Coimbra, Portugal
*
Author to whom correspondence should be addressed.
Appl. Sci. 2025, 15(22), 12217; https://doi.org/10.3390/app152212217
Submission received: 10 October 2025 / Revised: 11 November 2025 / Accepted: 12 November 2025 / Published: 18 November 2025
(This article belongs to the Special Issue Advanced Dental Materials and Its Applications)

Abstract

Background: The development of the curve of Spee (CoS) is influenced by skeletal morphology, orofacial growth, tooth eruption timing, mandibular relationships, overbite, and neuromuscular development. This systematic review aims to determine the most effective orthodontic methods in correcting the curve of Spee. Methods: The systematic review protocol was registered on the PROSPERO platform and conducted according to the Cochrane and PRISMA guidelines. For its development, a standardized search was performed across different databases (MEDLINE, Cochrane Library, Embase and Web of Science) and grey literature. The risk of bias was assessed using Faggion, Jr.’s guidelines for in vitro and in silico studies of dental materials, and the Rob-2 and ROBINS-1 tools for clinical studies. Results: The initial search found 748 studies, with 44 selected after full-text review. Of these, 22 were included in the quantitative analysis, assessing the effectiveness of braces (with or without extractions) and invisible aligners. Key methods for correcting the curve of Spee include various orthodontic archwires (nickel–titanium (NiTi), stainless steel, beta-titanium), continuous and segmented techniques, reverse curve archwires, aligners, and treatment modalities including extraction protocols. Most in vitro studies and randomized studies had a high risk of bias, and non-randomized studies showed moderate to high bias risk. Conclusions: The results suggest that conventional techniques, particularly non-extraction approaches, may be more effective than aligners in correcting the curve of Spee, although the available evidence remains limited.

1. Introduction

The search for aesthetic has become one of the main goals of orthodontic treatment, along with preserving the health of periodontal tissues, maintaining treatment stability and achieving a healthy occlusion. The occlusal curvature in the sagittal plane was labeled Spee’s curve in 1890 by the German anatomist Gran Von Spee [1,2,3,4,5]. Currently, in orthodontics, the CoS is determined by the arc of a curved plane tangent to the incisal edges of the central incisors and the vertices of the buccal cusps of the mandibular teeth, seen in a sagittal plane [2,3,5,6].
There is limited knowledge in the literature regarding the factors behind the development of this curve, and several factors have been speculated to influence the morphological arrangement of the teeth in the sagittal plane [3,7]. Some authors suggest tooth eruption, the growth of orofacial structures and the development of the neuromuscular system [2,3,8]. CoS is also influenced by craniofacial morphology, but to a lesser degree [2,3,6]. In addition to these factors, overjet, the height of the molar cusps, the quality and quantity of posterior occlusal contacts and the inclination of the temporomandibular joint have also been thought to be potential factors with influence over the CoS [7,9]. Comparing the different Angle classifications in terms of CoS depth, the curve depth was greater in the Class II division 1 malocclusion group, followed by Class II division 2, Class I and Class III malocclusions [6]. Whilst comparing the depth of the CoS with the divergence of the facial profile, Halimi et al. reported that there was no statistically significant difference between hypodivergent, normodivergent and hyperdivergent patients [7]. On the other hand, studies by Trouten et al. and Orthlieb have shown a deeper curve in hypodivergent patients [10,11]. It should be noted that pronounced CoS has often been observed in dental malocclusions with deep overbites [2,6].
The presence of a flat CoS is crucial for the efficiency of the masticatory system, since it has been suggested that the CoS has a biomechanical function in food processing and subsequently increases the efficiency of occlusal forces and the crushing/shearing ratio between the posterior teeth [2]. In addition, an increase in the depth of the CoS can cause occlusal interference, which can lead to pain, discomfort and damage to the tooth structure [4]. This can lead to the development of malocclusions, which impair phonation, chewing and oral hygiene, increasing the risk of periodontal disease and caries lesions. In addition to these risks, disorders of the temporomandibular joint can also arise due to excessive stress exerted on it [4]. Correcting CoS is therefore imperative to ensure balanced occlusal function [2,4]. Various orthodontic methods have been used to correct this curvature, from fixed to removable appliances, with or without orthognathic surgery [12,13]. The dental movements used for leveling may include intrusion of the anterior teeth, extrusion of the posterior teeth, proclination of the lower incisors or a combination of these movements [2,6,9,12,14,15,16]. The choice of treatment method depends on several factors, including the vertical dimension and incisal exposure at rest and when smiling [9,17].
The current scientific literature reflects an ongoing debate regarding the most effective method for leveling the CoS, with various orthodontic techniques described but no clear consensus on their comparative efficacy [2,4,6,9,18,19]. While the general aim of treatment is to achieve a level occlusal plane, the available evidence remains fragmented and, in many cases, inconclusive, particularly concerning treatment protocols, outcome measures, and long-term outcomes. Given the diversity of therapeutic approaches and the variability in reported results, it becomes essential to determine the most effective treatment. Accordingly, this study aims to qualitatively synthesize the existing evidence on orthodontic methods used to correct the Curve of Spee through a systematic review, and to quantitatively compare their effectiveness through a meta-analysis, when data homogeneity allows. This approach enhances the overall strength of the evidence and contributes to identifying the most effective strategies for clinical practice. In doing so, the present review addresses a relevant gap in the literature and aims to support evidence-based orthodontic decision-making.

2. Materials and Methods

2.1. Protocol Registration

This review was carried out in accordance with the guidelines Cochrane and the Preferred Reporting Items for Systematic Reviews and Meta-Analysis (PRISMA) guidelines. The protocol was registered into the International Prospective Register of Systematic Reviews (PROSPERO) under the number CRD42024512212.

2.2. PICO Question

The PICO question (Population, Intervention, Comparison and Outcome) aims to answer the clinical question: ‘Which orthodontic methods are effective for correcting Spee’s curve?’ Specifically:
  • Population (P): Patients undergoing orthodontic treatment presenting with an accentuated curve of Spee, as well as in vitro models simulating this condition.
  • Intervention (I): Orthodontic techniques or mechanics aimed at leveling or correcting the curve of Spee.
  • Comparison (C): Alternative orthodontic approaches or conventional treatment methods used to achieve curve correction.
  • Outcome (O): Improvement or leveling of the curve of Spee, assessed through quantitative measures such as changes in curve depth or occlusal plane leveling.

2.3. Search Strategy

A standardized search was carried out in various databases by two reviewers independently (A.P. and I.F.), namely MEDLINE (through PubMed), Web of Science (all databases), Cochrane Library and EMBASE until 27 January 2025. In addition to these databases, a grey literature search was also carried out on the websites: HSRProj, OpenGrey Europe (https://opengrey.eu (accessed on 27 January 2025)) and ProQuest (https://www.proquest.com (accessed on 27 January 2025)). When appropriate, a combination of Medical Subject Headings (MesH) terms and keywords was used. The search formulas used in each database are presented in Table A1. No filters were used during the searches.

2.4. Eligibility Criteria

The defined inclusion criteria included randomized clinical trials and non-randomized controlled trials, retrospective and prospective cohort and case–control studies, cross-sectional studies, including in silico studies, and in vivo clinical studies involving patients undergoing orthodontic treatment to correct the CoS. Literature reviews, systematic reviews, case series studies, editorials, conference abstracts, book chapters, guidelines, protocols and opinion pieces were excluded. Studies that included patients diagnosed with systemic diseases and/or syndromes were also excluded.

2.5. Selection of Studies

Initially, two reviewers (A.P. and I.F.) independently analyzed the articles by title and abstract, based on the previously defined inclusion and exclusion criteria. The articles that met the inclusion criteria were subjected to a full reading of the text by two independent reviewers. In cases of doubt at any of the selection stages, a third reviewer was consulted (F.V.). The software used for reference management was Rayyan (available at https://www.rayyan.ai; accessed on 15 March 2025).

2.6. Data Collection and Synthesis

The included studies were thoroughly analyzed and the following information was extracted by two independent reviewers (A.P. and I.F.): author and year of publication, study design (in vitro, in vivo, ex vivo or clinical), sample size, sample distribution by gender (where applicable), average patient age, orthodontic appliance, follow-up time, main results, primary outcomes, secondary outcomes and conclusions. In the event of disagreement on the information to be included, a third reviewer was consulted (F.V.). The results from the selected studies were presented in a combination of narrative and tabular formats, in accordance with the PICO question.

2.7. Analyzing the Risk of Bias

The methodological quality of the in vitro studies was assessed using the guidelines by Faggion, Jr. [20], The Cochrane Risk of Bias tools were used to carry out the qualitative assessment of the clinical studies (RoB-2 and ROBINS-I tools) [21,22]. The overall individual risk of bias of the studies was categorized into three categories: low -all domains assessed with low risk of bias; moderate–low or moderate risk of bias for all domains; high -at least one domain presents a serious risk of assessment bias. The articles were assessed by two independent reviewers (A.P. and I.F.) and, in the event of disagreement, a third reviewer (F.V.) was consulted.

2.8. Quantitative Data Analysis

The quantitative analysis of the data of clinical studies was carried out through meta-analysis using a random-effects model (DerSimonian–Laird method) in the Metafor software in R v4.1.2 [23]. The depth of the Curve of Spee was measured as the perpendicular distance from a reference plane—connecting the incisal edges of the central incisors and the distal cusp tips of the most posterior teeth—to the deepest cusp tip, averaged between the right and left sides. Differences in measurement protocols between studies were minimized by analyzing the within-study change from pre-to post-treatment.
Heterogeneity between the included studies was assessed using the I2 index with 95% confidence intervals and Cochran’s Q test. The I2 index indicates the proportion of the total variation between studies that is due to heterogeneity, while the Q test assesses whether the variability observed between studies is greater than that expected by chance. Absolute heterogeneity was quantified using τ2 with corresponding confidence intervals. The paired measures of each study were analyzed using the mean of within-subject differences (pre-post changes), calculated from paired measurements within each patient. Where correlation coefficients between pre-and post-treatment measurements were not reported in the original studies, we estimated them using established methods for before-after comparisons. For studies lacking reported correlations, it is noted that although sensitivity analyses across a range of assumed correlations can sometimes be informative, the limited number of studies in several comparisons makes such analyses unlikely to materially affect the results. Subgroup analyses and sensitivity analyses were not performed due to the limited number of studies available for several comparisons (one of the meta-analyses included only 2 studies). The certainty of evidence was assessed using the GRADE methodology. To visualize the results, forest plots were generated illustrating the magnitude and direction of the effects for three types of treatment: conventional appliances, conventional appliances with extractions and invisible aligners.

3. Results

3.1. Study Selection

The initial search, carried out in the aforementioned databases, brought together 748 studies. After removing duplicates, 342 studies were selected for reading the title and abstract. Afterwards, all studies that did not fulfil the previously defined eligibility criteria were excluded, resulting in 66 studies for full reading. As 22 articles did not fulfil the inclusion criteria (Table A2), 44 were included in the qualitative analysis. The identification, screening and eligibility process are described in the PRISMA diagram (Figure 1).
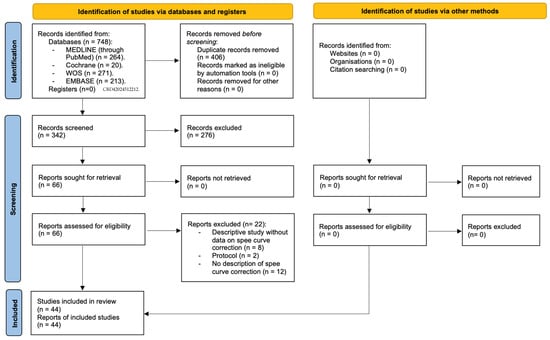
3.2. Characteristics of the Studies Included

This systematic review included 6 in silico studies and 38 clinical trials. The characteristics and results of the in silico studies and clinical trials are shown in Table 1 and Table 2, respectively. Table 3 summarizes the findings of clinical studies in general.
The sample size in the clinical studies ranged from 10 to 168 subjects, with studies with approximately 30 to 40 subjects being the most common. The average age ranged from 11.6 to 40.7 years, predominantly adolescents. Most studies have a higher number of female subjects [9,26,31,32,33,34,37,43,45,46,47,49,50,51,52,53,54,55,56,58,59,60,62,65]. Some studies do not report average age or gender [36,42,64].
Follow-up in the clinical trials ranged from 1 year to 11 years. However, 25 studies did not report the follow-up period [9,14,24,26,27,29,31,35,36,37,38,39,40,43,44,47,48,51,53,54,55,56,58,59,61,63,65].
The main methods used to correct the CoS are conventional fixed appliances, dental extractions with fixed appliances and invisible aligners. The most used method is the orthodontic arch, varying in terms of material and section. The continuous arch technique is also the most widely used and has proved to be effective in CoS leveling [9,14,30,32,33,34,39,41,45,54,55,56,57,58,59,60,61,63,65]. This leveling occurs mainly by extrusion of the premolars and molars and by proclination and intrusion of the incisors.
With regard to the type of archwires used, the majority of studies report the use of nickel–titanium (NiTi), stainless steel and Beta-Titanium (TMA) orthodontic archwires using the continuous archwire technique and the segmented archwire technique, with/without the incorporation of reverse curve archwires [9,14,24,25,27,32,33,35,38,41,44,45,54,55,56,57,58,59,60,61,63,65].
When differentiating between fixed appliance systems, most studies employing continuous arch mechanics reported a greater degree of CoS reduction compared to segmented arch approaches, mainly through extrusion of posterior teeth and proclination of the lower incisors. Studies using segmented mechanics generally aimed for more controlled intrusion of anterior teeth and less unwanted proclination, but few directly compared the two techniques, resulting in limited comparative evidence. Regarding treatment with and without extractions, the available studies did not demonstrate consistent differences in the magnitude of CoS leveling. While extraction protocols theoretically allow for greater incisor retraction and vertical control, the included studies did not systematically evaluate these effects, and heterogeneity was substantial.
In the studies in which the correction method is invisible aligners, it is reported that the leveling prediction by the aligner software is not very accurate [43,49,51], and is even less accurate in adults [49]. When analyzing treatment with clear aligners, most studies reported that CoS leveling occurred predominantly through incisor intrusion, given that posterior tooth extrusion demonstrated lower accuracy and predictability. Consequently, the use of auxiliary mechanics is often recommended to optimize vertical control and treatment efficacy.
A comparison between the effectiveness of the continuous arch technique and aligners was carried out in only one study [9]. In this study, there were no statistically significant differences in the leveling of the CoS, with leveling occurring mostly through the intrusion of the lower incisors with the aligners and through the extrusion of the posterior teeth and proclination of the lower incisors using the continuous arch technique alone.

3.3. Summary of Quantitative Evidence

The aim of the present meta-analysis was to evaluate the effectiveness of different orthodontic treatment methods in correcting the CoS. The graphs comparing conventional appliances, conventional appliances with extractions and invisible aligners are shown in Figure 2, Figure 3 and Figure 4, respectively. The results show that all the orthodontic methods analyzed are effective in correcting CoS, with variations in the magnitude and consistency of the effects observed.
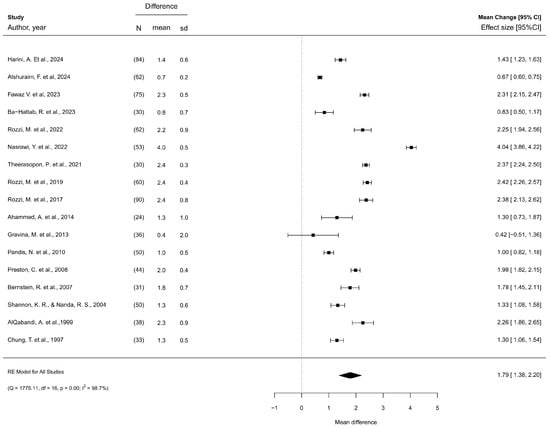
Regarding studies comparing conventional appliances (Figure 2), the effect size is 1.79 with a 95% confidence interval ranging from 1.38 to 2.20, which indicates a significant positive difference. No evidence of publication bias was found. Heterogeneity was high, with τ2 = 0.729 [0.394–1.745] and I2 = 98.7% [97.7–99.5].
Regarding studies comparing conventional appliances in conjunction with dental extractions (Figure 3), the effect size is 1.27 with a 95% confidence interval ranging from 0.26 to 2.29, which suggests a significant positive difference in the overall effect. It should be noted that the lower confidence interval is close to zero, which indicates a lower certainty in the combined estimate. Heterogeneity was also high (τ2 = 0.784 [0.204–30.953]; I2 = 98.3% [93.9–99.9]).
Regarding invisible aligners (Figure 4), the graph shows high variability among the included studies, and although there is a trend towards a positive difference, the overall results are not conclusive due to the wide confidence interval. Heterogeneity was substantial (τ2 = 2.199 [0.414–100.0]; I2 = 98.7% [93.2–99.9]).
According to the GRADE framework, the overall certainty of the evidence for this outcome was rated as very low (Table 4). The certainty of evidence for all three treatment modalities was assessed as very low. This was primarily due to very serious concerns about statistical inconsistency (I2 > 98% for all comparisons), serious to very serious risk of bias in the included studies, and serious to very serious imprecision due to small sample sizes. These findings indicate very limited confidence in the effect estimates, and further high-quality research is needed to establish the effects of these orthodontic interventions.

3.4. Risk of Bias Analysis

The analysis of the risk of bias is explained in Table A3, Table A4 and Table A5.
Regarding in silico studies and in vitro, most studies presented a high risk of bias. This is mainly due to the absence of sample size determination, randomization and blinding in treatment allocation; blinding in outcome measurement; the description of statistical methods and failures in the provision of their protocols. Additionally, two studies did not detail the interventions in each group [26,29].
Concerning randomized controlled trials, all studies presented a high risk of bias. Studies classified as having a high risk of bias did not mention the randomization method. The domains with the highest risk of bias are effect of assignment to intervention and missing outcome data.
Regarding non-randomized clinical studies, thirteen studies presented a high risk of bias due to a lack of definition of the intervention classification [30,31,34,36,39,42,46,48,50,51,52,62,64], one for confounding factors [63], one for selection of participants [45] and two for deviations from intended interventions [43,51]. The remaining studies presented a moderate risk of bias, mainly due to participant selection [9,35,37,40,41,47,49,53,55,56,58,59,60].

4. Discussion

Correction of CoS is essential to achieve ideal occlusion and improve masticatory function. In the current literature, there is still debate about which orthodontic method is most effective for CoS leveling. Therefore, the objective of this systematic review was to summarize the existing orthodontic methods for CoS correction. Orthodontic treatments commonly use NiTi, stainless steel, and TMA archwires with various techniques, but there is no consensus on the best biomechanical approach for stable, long-term leveling [56]. The results of the present study have resulted in the verification of three of the evaluated orthodontic methods in the meta-analysis as effective in correcting CoS. Nonetheless, these findings should be interpreted with caution due to the overall low quality of the available evidence. The methodological quality of the included studies was limited, with randomized controlled trials presenting high risk of bias and non-randomized studies showing moderate to high risk. The most frequent methodological shortcomings included lack of randomization, inadequate blinding procedures, in-sufficient description of statistical methods, and poor reporting of intervention protocols. These limitations may have affected the internal validity and reliability of the findings. Moreover, in silico studies frequently failed to define sample size, apply proper randomization or blinding, or describe the interventions clearly, further reducing the strength of their conclusions. Such methodological weaknesses compromise the generalizability of the results and preclude strong clinical recommendations. Therefore, the conclusions presented should be viewed as indicative rather than definitive, reinforcing the urgent need for high-quality and well-designed randomized clinical trials. In addition to clinical outcomes, it is important to consider the cost-effectiveness and patient-centered aspects of the evaluated techniques, as these factors play an increasingly significant role in contemporary orthodontic decision-making and the overall quality of care.
Regarding the continuous or segmented arch technique, the present study revealed an effect size of 1.79. A study by Preston et al., which compared the two techniques, observed that both produced statistically significant reductions in CoS [57]. However, in the post-retention stage, with a follow-up of approximately four years, a statistically significant but clinically insignificant relapse was observed [57]. The continuous arch technique is the most described, varying in the studies in terms of material and arch section and frequently incorporating the reverse curve arch form. Leveling with this technique is mostly achieved by extrusion of the premolars and molars and by proclination and intrusion of the incisors [9,33,54,55,56,58,59,60]. This technique demonstrates effective leveling of CoS, however, with some degree of relapse observed in the post-retention period [9,33,41,54,55,56,57,58,59,60]. In studies in which the correction method was invisible aligners, it is reported that the leveling prediction by Clincheck is not very accurate, and in the study by Kravitz et al., it was demonstrated that the accuracy is lower in adults compared to adolescents [49]. The extrusion movement of the posterior teeth is less accurate than the intrusion movement of the incisors [49]. According to Goh et al., to achieve the desired treatment objectives, an overcorrection of the CoS leveling should be prescribed in the treatment plan in ClinCheck and the addition of auxiliary methods such as attachments [43]. The recent systematic review by Boccuzzi et al. further supports these findings, indicating that ClinCheck tends to overestimate the clinical correction of deep bite due to the lack of standardized staging and biomechanical protocols, thus requiring planned overcorrections. Moreover, the application of posterior occlusal bite blocks and traditional attachments appears to have minimal influence on the success of open bite closure [66].
In a study by Rozzi et al., which compared the continuous arch technique with aligners, there were no statistically significant differences in the CoS leveling, which was effective in both groups [9]. This leveling occurred mainly due to the intrusion and proclination of the lower incisors [9]. In this sense, if one of the treatment objectives is the extrusion of the posterior teeth, the continuous arch technique is more advantageous than invisible aligners. Proclination of the lower incisors can be an undesirable effect of orthodontic treatment, since it can put the supporting tissues at risk, compromising aesthetics and stability [14]. A study by AlQabandi et al. compared the effects on the axial inclination of the lower incisors between rectangular and round arches and found no differences between the two arches [14]. Additionally, the study by Theerasopo et al. reported that the phased implementation of alignment followed by leveling is more advantageous in controlling incisor inclination [65].
The decision of the orthodontic method to be applied depends on the defined orthodontic objectives, since the CoS can be affected by several variables, namely, stage of dental eruption, timing of dental eruption, dental occlusion, craniofacial characteristics such as facial pattern, neuromuscular factors and parafunctional habits such as bruxism that can promote tooth wear [67]. Rozzi et al. reported that, in patients with low maxillary-mandibular angle, leveling occurred by vestibularization and intrusion of the lower incisors, while in patients with high maxillary-mandibular angle, leveling occurred through extrusion and verticalization of the posterior teeth [59,60]. A recent study by Alshuraim et al. found that there is no statistically significant difference between 2nd molar bonding and the amount of CoS reduction [31].
Several factors for the long-term stability of CoS correction have been highlighted in the literature, namely: amount of growth, patient age during treatment, muscle strength, neuromuscular adaptation and initial malocclusion [68]. Busenhart and collaborators concluded that the greater the amount of CoS correction, the greater the post-treatment relapse [34]. On the other hand, Lie reported that there is greater stability of the CoS after relatively large changes in the treatment of deep curves [50]. Furthermore, in the study by Preston et al., it was found that there is greater relapse when the treatment does not correct the CoS to a completely leveled curve [57]. Razdolsky et al. demonstrated that relative vertical movements can continue up to 21 months after the end of orthodontic treatment [69]. Therefore, it is crucial to maintain the CoS after the end of treatment with appropriate retention methods. The recurrence of CoS in orthodontic treatment with or without dental extractions remains a controversial topic in the scientific literature. The study by Shannon and Nanda reported no significant differences between the recurrence of CoS in the groups with or without extractions. The authors also reported that the use of fixed retainers instead of removable retainers is associated with a lower degree of recurrence [62]. However, in a study by Busenhart et al., it was established that premolar extractions may be associated with a lower degree of recurrence [34]. Among the 22 studies included in the quantitative synthesis, 11 did not report any follow-up, including all investigations assessing aligners, while follow-up in the remaining studies ranged from 1 month to 11 years. This variability may considerably affect the interpretation of treatment efficacy, as short-term post-treatment assessments may not accurately capture the long-term stability of curve of Spee correction. In particular, the lack of follow-up data for aligner studies precludes definitive conclusions regarding their durability and the potential for relapse in comparison with conventional orthodontic techniques. These observations highlight the necessity for future studies with standardized and adequately long follow-up periods to provide more robust evidence on the sustained effectiveness of different orthodontic interventions.
This systematic review has some limitations that may alter the interpretation of the results, including: (1) a few of the included studies had a small sample size and were not described in detail; (2) some included studies had a high risk of bias; (3) heterogeneity of the studies in terms of the CoS measuring method, both in the definition of the occlusal plane and in the selection of the teeth to be measured; (4) lack of information regarding clinical follow-up in some studies; (5) lack of detailed description of the orthodontic method used; (6) the included studies did not stratify samples by facial divergence, despite evidence that divergence may influence the depth of the Curve of Spee. According to the risk of bias analysis, some of the parameters analyzed with the highest risk of bias were flaws in the classification of the intervention, the randomization process, the blinding process and the definition of the statistical methods. The increased risk of bias affects the internal validity of the studies, making the results less reliable and applicable. Furthermore, it may over or underestimate the observed effects, leading to incorrect clinical or scientific decisions. These factors should be considered when interpreting the results of the present review. It is essential to carry out more clinical, controlled and randomized studies that report all the parameters described in this systematic review and that evaluate the effectiveness of the various orthodontic methods with similar protocols, so that an effective comparison can be made between them.
Future research should prioritize adequately powered randomized controlled trials with harmonized outcome definitions and standardized methods for measuring the Curve of Spee. Studies should include sufficient follow-up periods to assess stability and relapse and adopt comparable retention protocols to allow meaningful head-to-head comparisons between aligners and conventional fixed appliances. Such investigations would provide higher-quality evidence to guide clinical decision-making and enable more reliable evaluation of the relative effectiveness and long-term outcomes of different orthodontic interventions.

5. Conclusions

Despite the heterogeneity of the included studies, the available evidence indicates that CoS correction can be achieved using different methods, such as conventional appliances, conventional appliances combined with extractions and aligners. Although some findings suggest that conventional techniques appeared more effective than aligners, this observation is primarily based on limited direct comparative data and studies with moderate to high risk of bias, which reduces the certainty of these conclusions. Therefore, such conclusions should be interpreted with caution. The choice of method to use should be individualized, considering the patient’s diagnosis and treatment objectives.

Author Contributions

Conceptualization: I.F. and F.V.; Data curation: M.P.R., F.C. and A.B.P.; Formal analysis: F.C. and C.M.M.; Investigation: A.L.P., R.T. and C.N.; Methodology: C.M.M. and I.F.; Project administration: A.B.P. and F.V.; Software: F.C. and C.N.; Supervision: I.F. and F.V.; Validation: R.T. and C.N.; Visualization: I.F. Writing—original draft: A.L.P., F.C., R.T. and C.N.; Writing—review and editing: I.F., M.P.R., A.B.P. and F.V. All authors have read and agreed to the published version of the manuscript.

Funding

This research received no financial support or funding from any institution, organization, or agency.

Institutional Review Board Statement

Not applicable.

Informed Consent Statement

Not applicable.

Data Availability Statement

The data presented in this study are available on request from the corresponding author.

Conflicts of Interest

The authors declare no conflicts of interest.

Appendix A

Table A1. Search strategy.
DatabaseSearch Strategy
PubMed via MedLine(“Curve of Spee” OR “Spee, Curve” OR “Spee Curve” OR “Spee’s curve” OR “Spee’s curvature” OR “curvature of occluding surface of the teeth” OR “curvature of the occlusal alignment of teeth”) AND (Orthodontics[Mesh] OR Orthodont* OR “Dental Occlusion”[Mesh] OR “Dental Occlusion*” OR “Occlusion, Dental” OR “Occlusions, Dental” OR “normal occlusion” OR “teeth occlusion” OR “tooth occlusion” OR “Occlusal Plane *” OR “Plane, Occlusal” OR “Planes, Occlusal” OR “Occlusal Guidance*” OR “Guidance, Occlusal”)
Web of Science All Databases(“Curve of Spee” OR “Spee, Curve” OR “Spee Curve” OR “Spee’s curve” OR “Spee’s curvature” OR “curvature of occluding surface of the teeth” OR “curvature of the occlusal alignment of teeth”) AND (Orthodont * OR “Dental Occlusion *” OR “Occlusion, Dental” OR “Occlusions, Dental” OR “normal occlusion” OR “teeth occlusion” OR “tooth occlusion” OR “Occlusal Plane *” OR “Plane, Occlusal” OR “Planes, Occlusal” OR “Occlusal Guidance *” OR “Guidance, Occlusal”)
Embase(‘curve of spee’ OR ‘spee, curve’ OR ‘spee curve’ OR ‘spee’s curve’ OR ‘spee’s curvature’ OR ‘curvature of occluding surface of the teeth’ OR ‘curvature of the occlusal alignment of teeth’) AND (‘orthodontics’/exp OR orthodont* OR ‘tooth occlusion’/exp OR ‘normal occlusion’ OR ‘teeth occlusion’ OR ‘tooth occlusion’ OR ‘dental occlusion*’ OR ‘occlusion, dental’ OR ‘occlusions, dental’ OR ‘occlusal plane’/exp OR ‘occlusal plane*’ OR ‘plane, occlusal’ OR ‘planes, occlusal’ OR ‘occlusal guidance’ OR ‘guidance, occlusal’) AND ([article]/lim OR [article in press]/lim OR [data papers]/lim OR [letter]/lim)
Cochrane#1 “curve of spee”
#2 “spee, curve”
#3 “spee curve”
#4 “spee’s curve”
#5 “spee’s curvature”
#6 “curvature of occluding surface of the teeth”
#7 “curvatura of the occlusal alignment of teeth”
#8 MeSH descriptor: [Orthodontics] explode all trees
#9 orthodont *
#10 MeSH descriptor: [Dental Occlusion] explode all trees
#11 (dental NEXT occlusion *)
#12 (occlusion * NEXT dental)
#13 “normal occlusion”
#14 “teeth occlusion”
#15 “tooth occlusion”
#16 (occlusal NEXT plane *)
#17 (plane * NEXT occlusal)
#18 (occlusal NEXT guidance *)
#19 “guidance, occlusal”
#20 (#1 OR #2 OR #3 OR #4 OR #5 OR #6 OR #7) AND (#8 OR #9 OR #10 OR #11 OR #12 OR #13 OR #14 OR #15 OR #16 OR #17 OR #18 OR #19)
Table A2. List of excluded studies.
Excluded StudyReason for Exclusion
Amm, E. et al., 2022 [70]No description of spee curve correction. The study compares the verticalization of molars in leveled or unlevelled COS, with different methods
Arnett, G. et al., 2022 [71]Protocol description
Arnett, G. et al., 2022 [72]No description of spee curve correction.
Baldridge, D., 1969 [73]No description of spee curve correction.
Chattopadhyay, J. et al., 2023 [74]Descriptive study without data on spee curve correction
Chu, Y. et al., 2009 [75]Protocol description
Danguy, M. & Danguy-Derot, C., 2003 [76]Descriptive study without data on spee curve correction
De Praeter, J. et al., 2002 [5]No description of spee curve correction method.
Fauconnier, H. & Oosterbosch, J., 1949 [77]No description of spee curve correction.
Ferguson, J W., 1990 [78]Descriptive study without data on spee curve correction
Garcia, R., 1985 [79]No description of spee curve correction.
Goel, P. et al., 2014 [80]No description of spee curve correction.
Häll, B. et al., 2008 [81]No description of spee curve correction method.
Hoppenreijs, T. et al., 1998 [82]Descriptive study without data on spee curve correction
Martins, R.P., 2017 [83]Descriptive study without data on spee curve correction
Mischler, W.A. & Delivanis, H.P., 1984 [84]No description of spee curve correction method.
Ohannessian, P., 1979 [85]No description of spee curve correction method.
Spengeman, W., 1968 [86]Descriptive study without data on spee curve correction
Tremont, T.J. & Posnick, J.C., 2020 [87]Descriptive study without data on spee curve correction
Wiechmann, D., 1999 [88]Descriptive study without data on spee curve correction
Zemann, W. et al., 2012 [89]No description of spee curve correction.
Zhang, L. et al., 2022 [90]No description of spee curve correction.
Table A3. Assessing the risk of bias in in silico.
Structured SummaryScientific Background and Explanation of RationaleSpecific Objectives and/or HypothesesThe Intervention for Each GroupDefinition of OutcomeSample SizeSEQUENCE GenerationAllocation Concealment MechanismImplementationBlindingStatistical MethodOutcomes and EstimationLimitationsFundingProtocol
de Brito, G. et al., 2019 [24]YYYYYNNNNNNNYNN
Clifford, P.et al., 1999 [25]YYYYYNNNNNNNYNN
Fawaz, P. et al., 2021 [26]YYYNYYNNNNYYYNN
Theerasopon, P. et al., 2019 [27]YYYYYNNNNNNNYYN
Yeung, S. et al.,
2024 [28]
YYYYYYNNNNYYYNN
Zhu, L. et al., 2024 [29]YYYNNNNNNNNNYYN
Y—Yes; N—No.
Table A4. Assessing the risk of bias in randomized controlled clinical trials.
Randomization ProcessEffect of Assignment to InterventionMissing Outcome DataRisk of Bias in Measurement of the OutcomeRisk of Bias in Selection of the Reported ResultOverall
AlQabandi, A. et al.,1999 [14] HHHLLHigh
Ba-Hattab, R. et al., 2023 [32]LHHLHHigh
Bernstein, R. et al., 2007 [33]HHHLHHigh
Dritsas, K. et al., 2022 [38]LHHLHHigh
Gravina, M. et al., 2013 [44]HHHLHHigh
Nasrawi, Y. et al., 2022 [54]LHHLHHigh
Preston, C. et al., 2008 [57]HHHLHHigh
Shakhtour, F., 2024 [61]HHSCSCLHigh
Theerasopon, P. et al., 2021 [65]LHHLHHigh
L–Low, H—High; SC—Some concerns.
Table A5. Assessing the risk of bias in non-randomized clinical studies.
Confounding FactorsSelection of ParticipantsClassification of InterventionsDeviations from Intended InterventionsMissing DataMeasurement of the OutcomeSelection of the Reported ResultOverall
Ahammed, A. et al., 2014 [30]LMSLLLLS
Alshuraim, F. et al., 2024 [31] LMSLLLLS
Busenhart, D. M. et al., 2024 [34] LMSLLLLS
Chiqueto, K. et al., 2008 [35] LMLLLLLM
Chung, T. et al., 1997 [36] LMSLLLLS
Ciavarella, D. et al., 2024 [37] LMLLLLLM
Fawaz, V. et al., 2023 [39]LMSLLLLS
Feldman, E. et al., 2015 [40] LMLLLLLM
Freitas, K. et al., 2006 [41]LMLLLLLM
Givins, E.D., 1970 [42]LSSLLLLS
Goh, S. et al., 2022 [43] LMLSSLLS
Harini, A. et al., 2024 [45]LSLLLMLS
Hellsing, E., 1990 [46]LMSLLLLS
Jeong, H. et al., 2020 [47]LMLLLLLM
Koyama, T., 1979 [48]LMSLLLLS
Kravitz, N. et al., 2023 [49]LMLLLLLM
Lie, F. et al., 2006 [50]LMSLLLLS
Lim, Z. et al., 2023 [51]LMSSSLLS
Lupatini, P. et al., 2015 [52] LMSLLLLS
Martins, D. et al., 2012 [53]LMLLLLLM
Nawaz, A. et al., 2018 [55] LMLLLLLM
Pandis, N. et al., 2010 [56]LMLLLLLM
Rizvi, B. et al., 2013 [58]LMLLLLLM
Rozzi, M. et al., 2017 [59]LMLLLLLM
Rozzi, M. et al., 2019 [60]LMLLLLLM
Rozzi, M. et al., 2022 [9]LMLLLLLM
Shannon, K.R., Nanda R. S., 2004 [62]LMSLLLLS
Sinha, A. et al. 2024 [63]SMLLLMLS
Sondhi, A. et al., 1980 [64]LMSLLLLS
L—Low risk of bias, M—Moderate risk of bias, S—Serious risk of bias.

References

  1. Proffit, W.; Fields, H.; Sarver, D. Contemporary Orthodontics, 4th ed.; Mosby: St. Louis, MO, USA, 2007. [Google Scholar]
  2. Kumar, K.P.S.; Tamizharasi, S. Significance of curve of Spee: An orthodontic review. J. Pharm. Bioallied Sci. 2012, 4, S323–S328. [Google Scholar] [CrossRef]
  3. Marshall, S.D.; Caspersen, M.; Hardinger, R.R.; Franciscus, R.G.; Aquilino, S.A.; Southard, T.E. Development of the curve of Spee. Am. J. Orthod. Dentofac. Orthop. 2008, 134, 344–352. [Google Scholar] [CrossRef]
  4. Alkhalaf, Z.A.; Sghaireen, M.G.; Issrani, R.; Ganji, K.K.; Alruwaili, N.N.; Alsaleh, R.M.; Alruwaili, M.R.S.; Alabdali, M.F.; Alsirhani, M.A.R.; Alam, M.K. The Effect of Accentuation of Curve of Spee on Masticatory Efficiency-A Systematic Review and Meta-Analysis. Children 2023, 10, 511. [Google Scholar] [CrossRef]
  5. De Praeter, J.; Dermaut, L.; Martens, G.; Kuijpers-Jagtman, A.M. Long-term stability of the leveling of the curve of Spee. Am. J. Orthod. Dentofac. Orthop. 2002, 121, 266–272. [Google Scholar] [CrossRef] [PubMed]
  6. Veli, I.; Ozturk, M.A.; Uysal, T. Curve of Spee and its relationship to vertical eruption of teeth among different malocclusion groups. Am. J. Orthod. Dentofac. Orthop. 2015, 147, 305–312. [Google Scholar] [CrossRef] [PubMed]
  7. Halimi, A.; Benyahia, H.; Azeroual, M.F.; Bahije, L.; Zaoui, F. Relationship between the curve of Spee and craniofacial variables: A regression analysis. Int. Orthod. 2018, 16, 361–373. [Google Scholar] [CrossRef] [PubMed]
  8. Osborn, J.W. Orientation of the masseter muscle and the curve of Spee in relation to crushing forces on the molar teeth of primates. Am. J. Phys. Anthr. 1993, 92, 99–106. [Google Scholar] [CrossRef]
  9. Rozzi, M.; Tiberti, G.; Mucedero, M.; Cozza, P. Leveling the curve of Spee: Comparison between continuous archwire treatment and Invisalign system: A retrospective study. Am. J. Orthod. Dentofac. Orthop. 2022, 162, 645–655. [Google Scholar] [CrossRef]
  10. Trouten, J.C.; Enlow, D.H.; Rabine, M.; Phelps, A.E.; Swedlow, D. Morphologic factors in open bite and deep bite. Angle Orthod. 1983, 53, 192–211. [Google Scholar] [CrossRef]
  11. Orthlieb, J.D. The curve of Spee: Understanding the sagittal organization of mandibular teeth. Cranio 1997, 15, 333–340. [Google Scholar] [CrossRef]
  12. Al-Zoubi, E.M.; Al-Nimri, K.S. A comparative study between the effect of reverse curve of Spee archwires and anterior bite turbos in the treatment of deep overbite cases. Angle Orthod. 2022, 92, 36–44. [Google Scholar] [CrossRef]
  13. Huang, G.J.; Bates, S.B.; Ehlert, A.A.; Whiting, D.P.; Chen, S.S.H.; Bollen, A.M. Stability of deep-bite correction: A systematic review. J. World Fed. Orthod. 2012, 1, e89–e96. [Google Scholar] [CrossRef]
  14. AlQabandi, A.K.; Sadowsky, C.; BeGole, E.A. A comparison of the effects of rectangular and round arch wires in leveling the curve of Spee. Am. J. Orthod. Dentofac. Orthop. 1999, 116, 522–529. [Google Scholar] [CrossRef] [PubMed]
  15. Ricketts, R.M. Bioprogressive therapy as an answer to orthodontic needs. Part I. Am J Orthod. 1976, 70, 241–268. [Google Scholar] [CrossRef]
  16. Braun, S.; Hnat, W.P.; Johnson, B.E. The curve of Spee revisited. Am. J. Orthod. Dentofac. Orthop. 1996, 110, 206–210. [Google Scholar] [CrossRef] [PubMed]
  17. Nanda, R. The differential diagnosis and treatment of excessive overbite. Dent. Clin. N. Am. 1981, 25, 69–84. [Google Scholar] [CrossRef] [PubMed]
  18. Schudy, F.F. The association of anatomical entities as applied to clinical orthodontics. Angle Orthod. 1966, 36, 190–203. [Google Scholar] [CrossRef]
  19. Andrews, L.F. The six keys to normal occlusion. Am. J. Orthod. 1972, 62, 296–309. [Google Scholar] [CrossRef]
  20. Faggion, C.M. Guidelines for reporting pre-clinical in vitro studies on dental materials. J. Evid. Based Dent. Pract. 2012, 12, 182–189. [Google Scholar] [CrossRef]
  21. Sterne, J.A.C.; Savović, J.; Page, M.J.; Elbers, R.G.; Blencowe, N.S.; Boutron, I.; Cates, C.J.; Cheng, H.Y.; Corbett, M.S.; Eldridge, S.M.; et al. RoB 2: A revised tool for assessing risk of bias in randomised trials. BMJ 2019, 366, l4898. [Google Scholar] [CrossRef]
  22. Sterne, J.A.C.; Hernán, M.A.; Reeves, B.C.; Savović, J.; Berkman, N.D.; Viswanathan, M.; Henry, D.; Altman, D.G.; Ansari, M.T.; Boutron, I.; et al. ROBINS-I: A tool for assessing risk of bias in non-randomised studies of interventions. BMJ 2016, 355, i4919. [Google Scholar] [CrossRef]
  23. Viechtbauer, W. Conducting Meta-Analyses in R with the metafor Package. J. Stat. Softw. 2010, 36, 1–48. [Google Scholar] [CrossRef]
  24. de Brito, G.M.; de Araújo Brito, H.H.; Marra, G.G.M.; Freitas, L.R.P.; Hargreaves, B.O.; Magalhães, P.A.A.; Oliveira, D.D. Pure Mandibular Incisor Intrusion: A Finite Element Study to Evaluate the Segmented Arch Technique. Materials 2019, 12, 2784. [Google Scholar] [CrossRef]
  25. Clifford, P.M.; Orr, J.F.; Burden, D.J. The effects of increasing the reverse curve of Spee in a lower archwire examined using a dynamic photo-elastic gelatine model. Eur. J. Orthod. 1999, 21, 213–222. [Google Scholar] [CrossRef]
  26. Fawaz, P.; Amm, E.; Khoury, E. The curve of Spee and its levelling in different vertical skeletal patterns: A 3D set-up study. Int. Orthod. 2021, 19, 659–668. [Google Scholar] [CrossRef] [PubMed]
  27. Theerasopon, P.; Kosuwon, W.; Charoemratrote, C. Stress assessment of mandibular incisor intrusion during initial leveling in continuous arch system with different archwire shapes of superelastic nickel-titanium: A three-dimensional finite element study. Int. J. Health Allied Sci. 2019, 8, 92. [Google Scholar] [CrossRef]
  28. Yeung, S.; Owen, B.; Heo, G.; Carey, J.P.; Major, P.W.; Romanyk, D.L. In vitro measurement of the initial forces and moments generated for a curve of Spee malocclusion with labial and lingual archwire forms. Angle Orthod. 2025, 95, 35–42. [Google Scholar] [CrossRef] [PubMed]
  29. Zhu, L.; Liu, L.; Wang, W.; Deng, W.W. Effects of different patterns of movement for correcting a deep curve of Spee with clear aligners on the anterior teeth: A finite element analysis. BMC Oral Health 2024, 24, 217. [Google Scholar] [CrossRef] [PubMed]
  30. Ahammed, A.R.Y.; Ganiger, C.C.; Shetty, V.; Sunny, S.; Shetty, S.; Pawar, R.; Suresh, K.V. Post-retention Development of Curve of Spee in Pre-adjusted Edgewise Appliance Cases, Its Correlation to Dentoskeletal Parameters: An In vitro Study. J. Int. Oral Health 2014, 6, 31–35. [Google Scholar]
  31. Alshuraim, F.; Burns, C.; Morgan, D.; Jabr, L.; Rossouw, P.E.; Michelogiannakis, D. The second molar dilemma in orthodontics: To bond or not to bond? Angle Orthod. 2024, 94, 320–327. [Google Scholar] [CrossRef]
  32. Ba-Hattab, R.; Abu Alhaija, E.S.; Nasrawi, Y.H.; Taha, N.; Daher, H.; Daher, S. Leveling the curve of Spee using different sized archwires: A randomized clinical trial of blood flow changes. Clin. Oral Investig. 2023, 27, 2943–2955. [Google Scholar] [CrossRef]
  33. Bernstein, R.L.; Preston, C.B.; Lampasso, J. Leveling the curve of Spee with a continuous archwire technique: A long term cephalometric study. Am. J. Orthod. Dentofac. Orthop. 2007, 131, 363–371. [Google Scholar] [CrossRef]
  34. Busenhart, D.M.; Schätzle, M.; Eliades, T.; Papageorgiou, S.N. Long-term stability of curve of Spee depth among orthodontically treated patients: A retrospective longitudinal study. Orthod. Craniofacial Res. 2024, 27, 572–581. [Google Scholar] [CrossRef]
  35. Chiqueto, K.; Martins, D.R.; Janson, G. Effects of accentuated and reversed curve of Spee on apical root resorption. Am. J. Orthod. Dentofac. Orthop. 2008, 133, 261–268, quiz 328.e2. [Google Scholar] [CrossRef] [PubMed]
  36. Chung, T.S.; Sadowsky, P.L.; Wallace, D.D.; McCutcheon, M.J. A three-dimensional analysis of mandibular arch changes following curve of Spee leveling in nonextraction orthodontic treatment. Int. J. Adult Orthod. Orthognath. Surg. 1997, 12, 109–121. [Google Scholar]
  37. Ciavarella, D.; Fanelli, C.; Suriano, C.; Campobasso, A.; Lorusso, M.; Ferrara, D.; Maci, M.; Esposito, R.; Tepedino, M. Curve of Spee modification in different vertical skeletal patterns after clear aligner therapy: A 3D set-up retrospective study. Prog. Orthod. 2024, 25, 5. [Google Scholar] [CrossRef] [PubMed]
  38. Dritsas, K.; Alharbi, M.; Kouvelis, G.; Kloukos, D.; Gkantidis, N. Effect of the timing of second molar bonding on the duration of the mandibular arch levelling: A randomized clinical trial. Eur. J. Orthod. 2022, 44, 203–209. [Google Scholar] [CrossRef]
  39. Fawaz, V.; Purushothaman, B.; Siyo, R.K.N.; Naseem, K.T.; Ashok, A.; Bavitha, T.K. Investigation of the change in the degree of Frankfort mandibular plane angle after levelling the curve of spee in different malocclusion groups. J. Orthod. Sci. 2023, 12, 65. [Google Scholar] [CrossRef]
  40. Feldman, E.; Kennedy, D.B.; Aleksejuniene, J.; Hannam, A.G.; Yen, E.H. Mandibular changes secondary to serial extractions compared with late premolar extractions and controls. Am. J. Orthod. Dentofac. Orthop. 2015, 148, 633–640. [Google Scholar] [CrossRef] [PubMed]
  41. Freitas, K.M.S.; Crepaldi, A.; Freitas, M.R.; Fonseca, R.C.; Crepaldi, M.V. Estudo da recidiva da sobremordida relacionada com a curva de Spee, em pacientes Classe II, divisão 1, na fase pós-contenção. Rev. Dent. Press Ortod. Ortop. Facial 2006, 11, 138–150. [Google Scholar] [CrossRef]
  42. Givins, E.D. A cephalometric analysis of the degree of change in the curve of Spee of non-extraction orthodontic cases before and after treatment. Bull. Pac. Coast Soc. Orthod. 1970, 45, 36–37. [Google Scholar]
  43. Goh, S.; Dreyer, C.; Weir, T. The predictability of the mandibular curve of Spee leveling with the Invisalign appliance. Am. J. Orthod. Dentofac. Orthop. 2022, 162, 193–200. [Google Scholar] [CrossRef]
  44. Gravina, M.A.; Brunharo, I.H.V.P.; Fraga, M.R.; Artese, F.; da Silva Campos, J.; Vitral, R.W.F.; Quintão, C.C.A. Clinical evaluation of dental alignment and leveling with three different types of orthodontic wires. Dent. Press J. Orthod. 2013, 18, 31–37. [Google Scholar] [CrossRef]
  45. Harini, A.; Kadiveti, A.; Vivek Reddy, G.; Alahari, S.S.K.; Singaraju, G.S.; Mandava, P. Predictors of Curve of Spee Leveling in Class II Division 1 Malocclusion Treated with Reverse Curve of Spee Archwires: An Observational Study. Cureus 2024, 16, e67163. [Google Scholar] [CrossRef]
  46. Hellsing, E. Increased overbite and craniomandibular disorders—A clinical approach. Am. J. Orthod. Dentofac. Orthop. 1990, 98, 516–522. [Google Scholar] [CrossRef] [PubMed]
  47. Jeong, H.J.; Kim, S.-H.; Choi, B.-J.; Han, S.-H.; Ahn, H.-W. The Envelope of Segmental Movement and Airway Changes After Mandibular Anterior Subapical Osteotomy in Skeletal Class II Protrusion Patients. J. Craniofacial Surg. 2020, 31, 668–672. [Google Scholar] [CrossRef] [PubMed]
  48. Koyama, T. A comparative analysis of the curve of Spee (lateral aspect) before and after orthodontic treatment—With particular reference to overbite patients. J. Nihon Univ. Sch. Dent. 1979, 21, 25–34. [Google Scholar] [CrossRef] [PubMed]
  49. Kravitz, N.D.; Hansa, I.; Vaid, N.R.; Moshiri, M.; Adel, S.M. Does age influence deep overbite correction with Invisalign? A prospective study evaluating mandibular incisor intrusion in adolescents vs. adults. Angle Orthod. 2024, 94, 145–150. [Google Scholar] [CrossRef]
  50. Lie, F.; Kuitert, R.; Zentner, A. Post-treatment development of the curve of Spee. Eur. J. Orthod. 2006, 28, 262–268. [Google Scholar] [CrossRef]
  51. Lim, Z.W.; Meade, M.J.; Weir, T. The predictability of maxillary curve of Spee leveling with the Invisalign appliance. Angle Orthod. 2023, 93, 638–643. [Google Scholar] [CrossRef]
  52. Lupatini, P.; Vitral, R.; Campos, M.; Gravina, M.; Fraga, M.; Mota Júnior, S. Assessment of Long-Term Stability of Leveling of the Curve of Spee after Orthodontic Treatment in Mesocephalic Patients—A Pilot Study. Pesqui. Bras. Odontopediatria Clínica Integr. 2015, 15, 263–270. [Google Scholar] [CrossRef]
  53. Martins, D.R.; Tibola, D.; Janson, G.; Maria, F.R.T. Effects of intrusion combined with anterior retraction on apical root resorption. Eur. J. Orthod. 2012, 34, 170–175. [Google Scholar] [CrossRef]
  54. Nasrawi, Y.H.; Alhaija, E.S.A.; Al Maaitah, E.F. Efficacy of lower arch leveling, lower incisors’ root resorption, and pain associated with the correction of curve of Spee using different orthodontic archwires: A randomized clinical trial. Clin. Oral Investig. 2022, 26, 7107–7120. [Google Scholar] [CrossRef]
  55. Nawaz, A.; Munir, D.; Burhan Ud Din, M. An Expressive Research to Assess the Skeletal Variations after Arc of Spee Flattening with Non-Stop Archwire in Terms of Mean Change and Change Percentage. INDO Am. J. Pharm. Sci. 2018, 11, 12491–12497. [Google Scholar]
  56. Pandis, N.; Polychronopoulou, A.; Sifakakis, I.; Makou, M.; Eliades, T. Effects of levelling of the curve of Spee on the proclination of mandibular incisors and expansion of dental arches: A prospective clinical trial. Australas. Orthod. J. 2010, 26, 61–65. [Google Scholar] [CrossRef]
  57. Preston, C.B.; Maggard, M.B.; Lampasso, J.; Chalabi, O. Long-term effectiveness of the continuous and the sectional archwire techniques in leveling the curve of Spee. Am. J. Orthod. Dentofac. Orthop. 2008, 133, 550–555. [Google Scholar] [CrossRef]
  58. Rizvi, B.; Shah Faisal, S.; Siddique, H. Changes in Skeletal and Dental Structures after Leveling the Curve of Spee with Continuous Archwire. Ann. Abbassi Shaheed Hosp. Karachi Med. Dent. Coll. 2013, 18, 63–67. [Google Scholar]
  59. Rozzi, M.; Mucedero, M.; Pezzuto, C.; Cozza, P. Leveling the curve of Spee with continuous archwire appliances in different vertical skeletal patterns: A retrospective study. Am. J. Orthod. Dentofac. Orthop. 2017, 151, 758–766. [Google Scholar] [CrossRef]
  60. Rozzi, M.; Mucedero, M.; Pezzuto, C.; Lione, R.; Cozza, P. Long-term stability of curve of Spee levelled with continuous archwires in subjects with different vertical patterns: A retrospective study. Eur. J. Orthod. 2019, 41, 286–293. [Google Scholar] [CrossRef]
  61. Shakhtour, F.; Al-Nimri, K. Comparison between effects of reverse curve of Spee nickel titanium archwire and stainless steel archwires with and without torque on the lower incisors in deep overbite treatment: A randomized control study. Angle Orthod. 2025, 95, 27–34. [Google Scholar] [CrossRef] [PubMed]
  62. Shannon, K.R.; Nanda, R.S. Changes in the curve of Spee with treatment and at 2 years posttreatment. Am. J. Orthod. Dentofac. Orthop. 2004, 125, 589–596. [Google Scholar] [CrossRef]
  63. Sinha, A.; Jain, S.; Kunjappan, S.M.; Jai, V.A.; Kamble, R.; Jadhav, A.V. Assessing Cephalometric Changes in Deep Bite Correction: An Analysis of Class II Division 1 Orthodontic Patients Treated with the Reverse Curve of Spee Archwire. J. Pharm. Bioallied Sci. 2024, 16 (Suppl. 4), S3245–S3247. [Google Scholar] [CrossRef]
  64. Sondhi, A.; Cleall, J.F.; BeGole, E.A. Dimensional changes in the dental arches of orthodontically treated cases. Am. J. Orthod. 1980, 77, 60–74. [Google Scholar] [CrossRef]
  65. Theerasopon, P.; Lindauer, S.J.; Charoemratrote, C. Separation of aligning and leveling stages to control mandibular incisor inclination: A randomized clinical trial. Dent. Press J. Orthod. 2021, 26, e2119378. [Google Scholar] [CrossRef] [PubMed]
  66. Boccuzzi, M.; Cosola, S.; Butera, A.; Genovesi, A.; Laborante, T.; Castaldo, A.; Zizza, A.; Oldoini, G.; Nota, A.; Tecco, S. Predictability of ClinCheck in Overbite Correction with Aligners: A Systematic Review. Appl. Sci. 2025, 15, 7268. [Google Scholar] [CrossRef]
  67. Dhiman, S. Curve of Spee—From orthodontic perspective. Indian J. Dent. 2015, 6, 199–202. [Google Scholar] [CrossRef]
  68. Berg, R. Stability of deep overbite correction. Eur. J. Orthod. 1983, 5, 75–83. [Google Scholar] [CrossRef] [PubMed]
  69. Razdolsky, Y.; Sadowsky, C.; BeGole, E.A. Occlusal contacts following orthodontic treatment: A follow-up study. Angle Orthod. 1989, 59, 181–186. [Google Scholar] [CrossRef]
  70. Amm, E.; Amm, C.E.; Vaden, J. Effect of Class II elastics on different mandibular arch preparation stabilized with aligners and stainless-steel wires: A FEM study. Orthod. Craniofacial Res. 2022, 25, 520–529. [Google Scholar] [CrossRef]
  71. Arnett, G.W.; D’Agostino, A.; Grendene, E.; McLaughlin, R.P.; Trevisiol, L. Combined orthodontic and surgical open bite correction: Principles for success. Part 2. Angle Orthod. 2022, 92, 431–445. [Google Scholar] [CrossRef]
  72. Arnett, G.W.; Trevisiol, L.; Grendene, E.; McLaughlin, R.P.; D’Agostino, A. Combined orthodontic and surgical open bite correction. Angle Orthod. 2022, 92, 161–172. [Google Scholar] [CrossRef] [PubMed]
  73. Baldridge, D.W. Leveling the curve of Spee: Its effect on mandibular arch length. JPO J. Pract. Orthod. 1969, 3, 26–41. [Google Scholar]
  74. Chattopadhyay, J.; Fatima, A.; Naukarkar, P.; Sarate, S.; Kumar, M.; Patel, M. A Comparative Study Of Different Intrusion Methods And Their Effect On Maxillary Incisors. J. Pharm. Negat. Results 2023, 14, 809–814. [Google Scholar] [CrossRef]
  75. Chu, Y.M.; Bergeron, L.; Chen, Y.R. Bimaxillary protrusion: An overview of the surgical-orthodontic treatment. Semin. Plast. Surg. 2009, 23, 32–39. [Google Scholar] [CrossRef]
  76. Danguy, M.; Danguy-Derot, C. Treatment of overbite and leveling. L’Orthodontie Française 2003, 74, 511–517. [Google Scholar] [CrossRef]
  77. Fauconnier, H.; Oosterbosch, J. The inverted Spee curve. Arch. Stomatol. 1949, 4, 167–171. [Google Scholar] [PubMed]
  78. Ferguson, J.W. Lower incisor torque: The effects of rectangular archwires with a reverse curve of Spee. Br. J. Orthod. 1990, 17, 311–315. [Google Scholar] [CrossRef]
  79. Garcia, R. Leveling the curve of Spee: A new prediction formula. J. Charles H. Tweed Int. Found 1985, 13, 65–72. [Google Scholar]
  80. Goel, P.; Tandon, R.; Agrawal, K.K. A comparative study of different intrusion methods and their effect on maxillary incisors. J. Oral Biol. Craniofacial Res. 2014, 4, 186–191. [Google Scholar] [CrossRef] [PubMed]
  81. Häll, B.; Jämsä, T.; Soukka, T.; Peltomäki, T. Duration of surgical-orthodontic treatment. Acta Odontol. Scand. 2008, 66, 274–277. [Google Scholar] [CrossRef]
  82. Hoppenreijs, T.J.; Voorsmit, R.A.; Freihofer, H.P. Open bite deformity in amelogenesis imperfecta. Part 1: An analysis of contributory factors and implications for treatment. J. Cranio Maxillofac. Surg. 1998, 26, 260–266. [Google Scholar] [CrossRef] [PubMed]
  83. Martins, P.M. Early vertical correction of the deep curve of Spee. Dent. Press J. Orthod. 2017, 22, 118–125. [Google Scholar] [CrossRef]
  84. Mischler, W.A.; Delivanis, H.P. Comparison study between three tooth positioners. Am. J. Orthod. 1984, 85, 154–158. [Google Scholar] [CrossRef]
  85. Ohannessian, P. Une approche mathématique de la correction et du nivellement de la courbe de Spee. L’Orthodontie Française 1979, 50, 710–711. [Google Scholar]
  86. Spengeman, W.G. The curve of Spee leveling appliance (Cosla). Am. J. Orthod. 1968, 54, 202–216. [Google Scholar] [CrossRef]
  87. Tremont, T.J.; Posnick, J.C. Selected Orthodontic Principles for Management of Cranio-Maxillofacial Deformities. Oral Maxillofac. Surg. Clin. N. Am. 2020, 32, 321–338. [Google Scholar] [CrossRef]
  88. Wiechmann, D. Lingual orthodontics (part 2): Archwire fabrication. J. Orofac. Orthop. 1999, 60, 416–426. [Google Scholar] [CrossRef] [PubMed]
  89. Zemann, W.; Metzler, P.; Jacobsen, C.; Obwegeser, J.A. Segmental distraction osteogenesis of the anterior alveolar process using tooth-borne devices: Is it skeletal movement or mainly dental tipping? J. Oral Maxillofac. Surg. 2012, 70, 1292–1299. [Google Scholar] [CrossRef]
  90. Zhang, L.; Lin, S.; Chen, J.; Huang, L.; Huang, Z.; Li, H. Risk factors for midcourse correction during treatment of first series of aligners with Invisalign. Am. J. Orthod. Dentofac. Orthop. 2022, 162, e96–e102. [Google Scholar] [CrossRef] [PubMed]
Figure 1. PRISMA diagram.
Applsci 15 12217 g001
Figure 2. Effectiveness of conventional appliances [9,14,30,31,32,33,36,39,44,45,54,56,57,59,60,62,65].
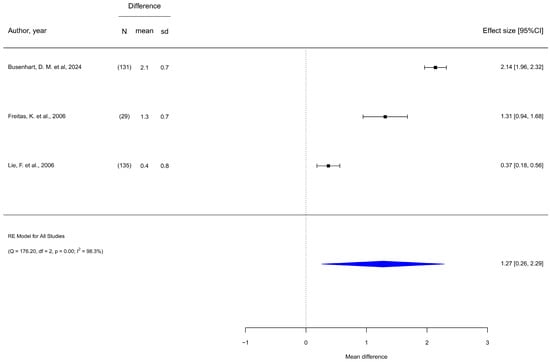
Applsci 15 12217 g002
Figure 3. Effectiveness of conventional appliances in conjunction with dental extractions [34,41,50].
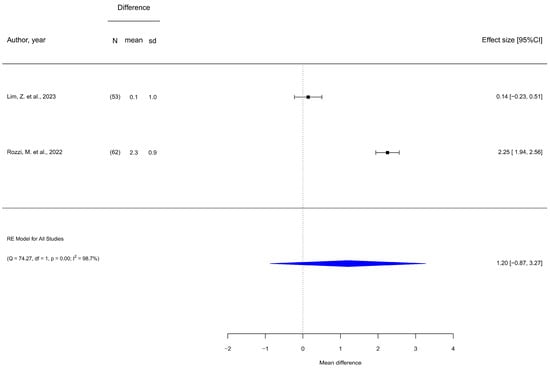
Applsci 15 12217 g003
Figure 4. Effectiveness of invisible aligners [9,51].
Applsci 15 12217 g004
Table 1. Summary of extrapolated data from included in vitro and in silico studies.
Author/YearStudy DesignSample SizeCorrection MethodologyFollow-UpMain ResultsPrimary OutcomesSecondary OutcomesConclusion
de Brito, G. et al., 2019 [24]In silicon = 4
FEM1-larger cantilever, more anterior PAF
FEM2-PAF in the middle of the canine crown (MD)
FEM3—2 mm smaller cantilever than in FEM2
FEM4-smallest cantilever
Segmented arch technique: AI archwire (0.021 × 0.025) an AI IBA (0.0215 × 0.0275) TMA tip-back springs (0.017 × 0.025)Does not referPure intrusion of the lower incisors: when the PAF in the IBA was 2 mm distal to the center of the canine crown.Changes in the position of the lower incisors:
-Forces applied mesial to the center of the canine crown resulted in proclination.
-Forces applied more than 2 mm distal to the center of the canine resulted in retroclination of the lower incisors.
Stress distribution in the incisors: FEM 1 and FEM 2: Stress concentrated on the vestibular surfaces and apices of the incisor roots (vestibular intrusion and tipping); FEM 3: Uniformly distributed stress (pure intrusion); FEM 4: Stress concentrated on the apices and lingual surfaces of the incisors (lingual intrusion and tipping).

Effects on the posterior anchorage segment:
-Primarily in the 1st M.
-Greater stress in FEM 1, decreasing progressively with the decrease of the cantilever.
The PAF in the IBA not only influences the direction of movement of the lower incisors (intrusion, proclination or retroclination), but also affects the distribution of reaction forces in the posterior segments of the anchorage unit.
Clifford, P. et al., 1999 [25]In silicoXAI Reverse Curve Arc 0.018 × 0.0259 amRSC of 1 mm increased arch length by 1.6 mm but increasing RSC to 5 mm did not increase arch length.

Stress distribution increased near the roots of incisors and molars as RSC was increased
-Downward vertical movement: in the crowns of the incisors, canines and 2nd M.
-Upward vertical movement: In the crowns of the 1st and 2nd PMs and 1st M.

-Distal rotational movements: 1st and 2nd M, with the 2nd M demonstrating more movement than the 1st. An increase was observed with the increase in the depth of the RSC arch.
-RSC (1 to 5 mm): No increase in arch length; slight reductions in intercanine distance (<1 mm).
-AI (0.018 × 0.025 in.) and RSC (1 and 2 mm) flat archwire: Minimal reduction in intermolar distance (0–0.6 mm).
-RSC (3 to 5 mm): Small increases in intermolar distance.
-Flat arch: Small stress in the apical 2/3 of the incisors, slight tension pattern in the apices of the 2nd lower M.
-RSC 1 mm: More intense stress at the apical of the incisors and canines, tension pattern at the distal root of the 2nd lower M, less tension pattern at the 1st M.
-RSC 5 mm: Greater tensions in the roots of the incisors, canines and M.
Continuous AI arcing resulted in a slight increase in arc length.
RSC 5 mm had minimal impact on arch width.
Increasing the depth of RSC increased the stress patterns around the roots of incisors and molars.
Fawaz, P. et al., 2021 [26]Comparative cross-sectional in silicoHypodivergent Group: n = 90

Normodivergent Group: n = 30

Hyperdivergent Group: n = 30
Extrusion of PMs and verticalization of posterior teeth by virtual simulation.

17.27 ± 5.112 a.
36 ♂ and 54 ♀.

Hypodivergent Group: 16.830 ± 3.840 a, 14 ♂ and 16 ♀.
Normodivergent Group: 15.690 ± 4.680 a, 9 ♂ and 21 ♀.
Hyperdivergent Group: 19.290 ± 6.030 a, 13 ♂ and 17 ♀
Does not referThere is no correlation between the space required to level the CoS and the different vertical skeletal patterns as well as the different parameters evaluated.PM Extrusion

Verticalization of posterior teeth
Moderate correlation: Between the verticalization angle of the 1st and 2nd M.
Space required to level the CoS: It did not show any correlation with the deepest point of the CoS nor with the verticalization angle of the molars.
The lower arch leveling was performed by extrusion of the PMs and verticalization of the posterior teeth, confirming that well-planned orthodontic mechanics can minimize the side effects (inclination of the lower incisors) encountered during treatment.
Theerasopon, P. et al., 2019 [27]In silico195,792 tetrahedral elements and 356,810 nodesSuperelastic round (0.016), square (0.016 × 0.016) or rectangular (0.016 × 0.022) NiTi orthodontic archwiresDoes not referThe intrusive force exerted by the orthodontic archwires within the PDL space caused stress in both the buccal and lingual cervical root thirds, being more significant in the buccal cervical root third. Round archwires caused greater stress and buccal displacement.Displacement in the vestibular direction

Movement in the vertical dimension

Y-axis displacement
Stress on the buccal radicular cervical 1/3The type of orthodontic wire used influences not only the stress distribution in the vestibular cervical root third during intrusion of the lower incisors, but also the vestibular inclination of the teeth.
Yeung, S.,
2025 [28]
In silicon = 61 (orthodontic simulator with 3 archwire)0.016 inch × 0.022 inch stainless-steel: labial straight, lingual straight, and lingual mush-room Does not referThe lowest force magnitudes were measured for labial straight archwires at each tooth position. The lateral incisor experienced the largest gingival forces with all archwire forms. The first premolar and first molar experienced labiolingual crown tipping moments in opposite directions between labial and the two lingual archwire forms.
  • Occlusal forces on canines, 1st and 2nd PM; gingival on lateral incisor, 1st and 2nd M.
  • Labial on lateral incisor and 1st M; lingual on central incisor, canine, 1st PM and 2nd M.
  • Lateral incisor received the highest forces.
  • Labial straight archwire had the lowest force magnitudes.
  • Crown Tipping:
  • Lingual archwires: lingual tipping (central incisor, canine, 1st and 2nd M); labial tipping (lateral incisor, 1st and 2nd PM).
  • Labial straight archwire: opposite Mx directions on 1st PM and 1st M, with the highest Mx forces.
  • Largest standard deviations in lingual archwires on the 1st PM.
Regardless of archwire form, the lateral incisor received large gingival forces and lingual root torque, which has increased concerns of root resorption.Labial straight archwire exerted the lowest force magnitudes overall. For lingual archwire forms, the labiolingual inclination of the first premolar could be highly variable during leveling. Regardless, tipping tended toward the buccal direction with lingual archwires and buccal direction with labial.
Zhu, L. et al., 2024 [29]In silico study5 models.
A: Distalization of the 2nd M (0.25 mm);
B: Distalization of the 2nd M (0.25 mm), extrusion of the 1st M (0.15 mm);
C: Distalization of the 2nd M (0.25 mm), extrusion of the 1st and 2nd PMs (0.15 mm);
D: Distalization of the 2nd M (0.25 mm), extrusion of the 1st M and PMs (0.15 mm);
E: Distalization of the 2nd M (0.25 mm), extrusion of the 1st M and PMs (0.15 mm), expansion of the 1st M and PMs (0.15 mm)
Invisible alignersDoes not referAll anterior teeth showed labial tipping, with the lower central incisor of configuration E being the most tipped. Configuration E resulted in less distal movement of the lower molars compared with configuration A, which showed the greatest distal displacement. The root apices of all teeth moved mesial, resulting in an uncontrolled distal lingual tipping movement. Configuration E exerted greater pressure on the PDL of the central and lateral incisors.-Vestibular inclination of the anterior teeth

-Maximum lip displacement;

-Distalization and distal displacement of lower molars.
Pressure on the PDL of the central and lateral incisors;

Variation in stress distribution across incisors;

Absence of significant differences in canines between the studied configurations.
Invisible aligners facilitated mandibular molar distalization in all evaluated patterns. Simultaneous PM extrusion and 2nd M distalization had little impact on 2nd M distalization. During simultaneous expansion and extrusion, emphasis was placed on preserving the buccal alveolar bone of the anterior teeth to avoid gingival recession, dehiscence, and fenestration. It is recommended to adapt clinical protocols according to the periodontal status of the mandibular anterior teeth to minimize complications.
♂: men; ♀: women; y: years; CoS: curve of Spee; SS: stainless steel; RSC-Reverse curve of Spee; FEM: finite element model; h: hours; IBA: intrusion base arch; PDL: periodontal ligament; M: molar; MD: mesiodistal; Mx: maxillary; NiTi: nickel–titanium; PAF: point of application of force; PM: premolar; PMs: premolars; TMA: beta-titanium.
Table 2. Summary of extrapolated data from included clinical trials.
Author/YearStudy DesignSample SizeAverage Age And SexCorrection MethodologyFollow-UpMain resultsPrimary OutcomesSecondary OutcomesConclusion
Ahammed, A. et al., 2014 [30]Cohort Retrospectiven = 2414.5 yearsPre-adjusted edgewise device

T1: Pre-treatment

T2: Post-treatment

T3: Post-retention
2.6 years-T2-T1: Significant difference in CoS, OJ and OB.
-T3-T1: Significant difference in CoS and OB.
-T3-T2 there is no significant difference in CoS
T2-T1: CoS—1.31 (p < 0.01 s)

T3-T1: CoS—1.44 (p < 0.01 s)

T2-T1: Incisor lower than NB 0.08 (p > 0.05 ns)

T3-T1: Incisor lower than NB−0.17 (p > 0.05 ns)
T2-T1: lower incisor to NB without statistically significant difference.
Significant difference in OJ and OB.

T3-T1: Significant difference in OB. Lower incisor in NB and OJ without statistically significant difference.
Leveling CoS is a stable treatment goal
AlQabandi, A. et al.,1999 [14]RCTn = 28

Group 1—round arches (n = 12)

Group 2—rectangular arches (n = 16)
Group I: 15.12 ± 4.83 years, 6 ♀ and 6 ♂

Group II: 12.16 ± 3.57 a, 8 ♀ and 8 ♂
Round arches or rectangular arches (0.016 × 0.022) in NiTi, progressing to stainless steel arches 0.016 × 0.022Does not referIn both groups, there was a significant reduction in CoS depth, increase in arch depth relative to molars, reduction in crowding and proclination of the lower incisors. There was no statistically significant difference between the change in CoS depth between the 2 groups. In group I, CoS was leveled on average by 6.3 m. In group II, CoS was leveled on average by 6.1 m.Lower incisor inclination:
-The mean inclination of the lower incisor was 6.75° ± 4.85° in group I and 6.10° ± 3.95° in group II. No significant difference in inclination was observed between the two groups.
CoS Reduction:
There was a significant reduction in CoS in both groups analyzed.
  • Increase in arch depth relative to molars in both groups
  • Reduction in dental crowding
  • Proclination of the lower incisors
  • Statistically significant correlations:
-Between the change in the axial inclination of the lower incisor and the relief of crowding.
-Axial inclination of the lower incisor and the depth of the mandibular arch.
-Mandibular arch depth was inversely correlated with the change in intercanine width.
The technique using NiTi archwire followed by stainless steel wire with mild RSC did not prevent proclination of the lower incisors after leveling the CoS with continuous archwire. There was a significant reduction in CoS depth in both groups, but this reduction did not correlate with proclination of the lower incisors. This was significantly associated with a reduction in intercanine width and dental crowding.
Alshuraim, F. et al., 2024 [31]Cohort
Retrospective
n = 62

Group 2° M cemented: n = 30.

Group 2° M cementless: n = 32
Cemented group: 16.07 ± 1.80 years, 11 ♂ and 19 ♀. Uncemented group: 15.69 ± 1.86 years, 14 ♂ and 18 ♀.Fixed orthodontic treatment without extractions (conventional arches, bite tubes and intermaxillary elastics) with or without cementation of the 2nd molarsDoes not referThe mean overall CR-Eval score was significantly higher in the group without cemented 2nd M (25.25 ± 3.98 vs. 17.70 ± 2.97).
There was a significant reduction in CoS between T1 and T2 (Cemented group: from 2.49 ± 0.26 mm to 1.72 ± 0.15 mm; Uncemented group: from 2.54 ± 0.26 mm to 1.96 ± 0.15 mm). There were no significant differences in CoS, OB, IMPA, or treatment duration between the groups.
CoS Reduction-Interincisal angle (IMPA);
-Number of emergency consultations: higher in the group with cemented 2nd M (3.3 ± 0.6 vs. 1.9 ± 0.4).

-Assessment of the quality of orthodontic treatment (CR-Eval) between the two groups evaluated.
Bonding of 2ndM improves the outcome of non-extraction fixed orthodontics, as demonstrated by the CR-Eval evaluation, without increasing the duration of treatment, regardless of whether there are more emergency consultations
Ba-Hattab, R. et al., 2023 [32]RCTn = 30

Group 1-stainless steel 0.017 × 0.025 (n = 10);

Group 2—stainless steel 0.019 × 0.025 (n = 10);

Group 3-TMA 0.021 × 0.025 (n = 10)
Group 1: 21.6 years; Group 2: 23.5 years; Group 3: 20.20 years. 20 ♀ and 10 ♂Reverse curve arch: stainless steel 0.017 × 0.025; stainless steel 019 × 0.025; TMA 0.021 × 0.0251 mSignificant CoS reduction in all groups.
The CoS depth before intervention averaged 5.30 ± 0.46 mm, 5.60 ± 0.92 mm, and 5.40 ± 0.49 mm in groups 1, 2, and 3, respectively. After 1 month, the CoS averaged 4.40 ± 0.49 mm, 4.70 ± 0.91 mm, and 4.70 ± 0.46 mm in groups 1, 2, and 3, respectively (p > 0.05).
Significant differences in BF changes between intrusion and extrusion forces using different archwire sizes and materials
CoS ReductionNo significant differences were found between the variations in BF in response to the application of intrusive and extrusive forces using different types of orthodontic archwires.

In the groups where the first premolars (PMs) were extruded, there was a greater reduction in bite force compared to the intruded incisors in the first 20 min after archwire insertion. After one week, blood flow continued to increase in the extruded PMs and intruded incisors in certain groups.
During CoS leveling, a temporary reduction in blood flow occurred after 20 min, followed by a gradual recovery that returned to baseline levels after one week. A faster return of BF to baseline values was observed in the stainless steel arch groups after PM extrusion. The bite force initially after force application was influenced by tooth type and change in CoS depth, indicating the complexity of the biological response during orthodontic treatment.
Bernstein, R. et al., 2007 [33]RCTn = 31T1 (before treatment): 12 to 6 m;

T2 (post-treatment) 14 to 11 m;

T3 (post-containment) 26 to 4 m.

22 ♀ and 9 ♂
Continuous arc technique11 to 5 mCoS completely leveled in 21 patients after treatment.

10 of the 31 patients remained level 5 to 25 years after orthodontic treatment.
  • Reduction in the depth of the CoS (semilunar canal);
  • Changes in the perpendicular height of the 1st M, more infra-erupted PM and more extruded incisor.
  • Changes observed between T2 and T3.
  • Dental movements during treatment.
  • Advancement of the position of the incisors in relation to the A-Po line.
  • Decrease in the ANB angle.
  • Decrease in the SN-OP angle.
  • Clockwise rotation.
  • Increased OP-MP angle.
-Leveling of the CoS mainly by extrusion of the PMs.
-The continuous arch technique is effective for leveling the CoS in patients with Class II Division 1 deep bite malocclusion treated without extractions, especially when the initial CoS is 2 to 4 mm.
-Leveling of the CoS with the continuous arch technique occurs through the extrusion of the premolars and, to a lesser extent, intrusion of the incisors.
-Small but statistically significant recurrence after treatment.
Busenhart, D.M. et al., 2024 [34]Cohort
Retrospective
n = 157

Fixed appliance group (n = 131).

Fixed appliance + tooth extractions group (n = 26).
11.6 ± 2 years

89 ♀ and 68 ♂
Edgewise fixed appliances with 0.018 slot.
26 patients were treated with lower PM extractions, 5 of whom had the 1st PM extracted and 21 had the 2nd PM extracted.
Average 7.1 years (minimum 3 years)Reduction of CoS in the group without extractions:—Significant reduction in CoS depth in the 1st PM from 1.87 mm (T1) to 0.22 mm (T2), with slight recurrence to 0.12 mm (T3).
-Reduction in the 2nd PM from 2.01 mm (T1) to 0.76 mm (T2).
Relapse and Long-Term changes:
-Minimal recurrence in PMs and in the 1st M in the group without extractions.
Stability and relapse:
-The stability of the PMs was similar.
-Less recurrence in the 1st M in the group with extractions.
-The average recurrence rate of CoS depth was 4.6%.
Reduction of CoS in PMs and 1st MInfluence of demographic variables:
-Sex: Did not show differences.
-Age of patient at start of treatment:
Statistically significant at T1, associated with the depth of the CoS in the 1st and 2nd PMs.

Duration of treatment (T1–T2) and follow-up (T2–T3): They did not show statistically significant effects on the depth of the CoS.
Post-treatment relapse:
-The amount of recurrence (T2–T3) was significantly associated with the amount of CoS depth correction during treatment (T1–T2).
-Each additional mm of CoS correction during treatment was associated with 0.11 mm more recurrence in the first PMs and 0.17 mm more in the 2nd PM.
Effective leveling of curves of Spee: It has been demonstrated that pronounced CoS can be satisfactorily leveled by orthodontic treatment.

Long-term stability: The results indicate that CoS leveling presents satisfactory stability over time after orthodontic treatment.

Impact of PM extractions: There was an observed association between performing PM extractions and lower post-treatment CoS recurrence.
Chiqueto, K. et al., 2008 [35]Cohort
Retrospective
n = 60

Group 1-overbite, intrusive methods (n = 30).

Group 2-normal bite, without intrusion (n = 30).
G1: 12.8 ± 1.23 years, 18 ♂ and 12 ♀.

G2: 12.87 ± 1.43 years, 16 ♂ and 14 ♀.
Continuous round and rectangular stainless steel arches with reverse and sharp curvesDoes not referG1: greater root resorption, greater changes in OB and OJ, vestibular inclination of the lower incisor and horizontal displacement of the upper incisor. The upper incisors showed greater resorption than the lower incisors.G1: vestibular inclination of the lower incisor and horizontal displacement of the upper incisor.Correlation of root resorption

Effect of intrusion mechanics

Difference between upper and lower incisors
The accentuation and inversion mechanics of CoS resulted in greater root resorption compared with nonintrusive techniques.

Correlation of root resorption:
-There was a statistically significant correlation between root resorption and the amount of deep overbite correction.
-The amount of intrusion of the upper incisors correlated significantly with the observed root resorption.

Maxillary incisors showed statistically higher incidence of root resorption compared to mandibular incisors during orthodontic treatment.
Chung, T. et al., 1997 [36]Cohort Retrospectiven = 33Does not referTreatment without tooth extractions and IP reduction of enamel (6 with orthodontic-surgical treatment, surgery without leveling)Does not referLeveling correlated with expansion in all dimensions (weak correlations) except 3-D arch length. Only 11% of the leveling variability could be explained by changes in anteroposterior and transverse dimensions. Change in 3-D arch length was associated with both a change in arch depth and a change in CoS depth (approximately 62%).CoS Leveling:
Average CoS leveling was 1.3 ± 0.7 mm

Increased depth, length and width of the arch with orthodontic treatment
Changes in arc length

Changes in arch depth

Changes in arch width

Relationships between variables

Pattern of change with CoS as dependent variable

Specific correlations
Increase in 3D arch length because of orthodontic treatment.
No statistical evidence of correlation was found between CoS leveling and 3D or 2D increase in arch length.

A linear regression model based on 3D arch length revealed that the interaction between two specific variables (arch depth and CoS leveling) could explain 60% of the increase in 3D arch length.
Ciavarella, D. et al., 2024 [37]Cohort
Retrospective
n = 106.
Group 0-SN-MP < 30.5°, hypodivergent (n = 36)
Group 1—SN-MP > 35.5°, hyperdivergent (n = 34)
Group 2—30.5 ≤ SN-MP ≤ 35.5°, normodivergent (n = 36)
22.3 ± 3.4 years

47 ♂ and 59 ♀
Invisible aligners (treatment focused on preventing extrusion and intrusion of molars and incisors and preventing pro-inclination of incisors)Does not referIn group 2, the T1–T0 difference in the distance from the 1st M to the occlusal plane was 1 mm greater than that observed in group 1 (p < 0.05); in group 2, the T1–T0 difference in the distance from the 2nd PM to the occlusal plane was 1.23 mm greater than that observed in group 1 (p < 0.05), while in group 0, it was 1.08 mm greater than in group 1 (p < 0.05); in group 2, the T1–T0 difference in the distance from the 1st PM to the occlusal plane was 0.97 mm greater than that observed in group 1 (p < 0.05)Non-relevant modifications of CoS in the 3 groups (−0.01 mm);

Modification of CoS in different facial biotypes;

Changes in the 2nd molars
6 MB difference

5 MB difference

4 V difference

Statistical analysis between groups
The study demonstrated that aligner treatment did not result in clinically significant changes in CoS depth. Normodivergent patients showed greater intrusion of the 1st and 2nd MP, as well as the 1st M, compared to hyperdivergent patients. Finally, hypodivergent patients exhibited greater intrusion of the 2nd MP compared to hyperdivergent patients. These results suggest that aligner treatment may not be the most appropriate option for hypodivergent patients, potentially leading to a reduction in the initial vertical dimension.
Dritsas, K. et al., 2022 [38]RCTn = 32.
Group A—initial 0.014 NiTi archwire, tubes cemented to the 2nd lower molars at the time of placement of the 0.016 × 0.022 NiTi archwire (n = 16)
Group B—2nd molars cemented at the 1st appointment (n = 16)
12 to 18In both groups, arch sequence: 0.014 Sentalloy 80 gr (NiTi); 0.016 × 0.022 Neo Sentalloy 80 gr (NiTi); and, 0.017 × 0.025 stainless steelDoes not referGroup A tended to need more days to level the CoS than group B, but without a statistically significant difference.Number of days to level CoSInitial OJ and number of detached brackets:
Regarding the occlusal factors studied, only the initial OJ appeared to be moderately associated with the days required to level the mandibular arch.
The leveling of the CoS was not affected by the height of inclusion of the 2nd M in the device.
Fawaz, V. et al., 2023 [39]Cohort
Retrospective
n = 75.

GI—class I (n: 25)
GII-class II (n: 25)
GIII-class III (n: 25)
Age > 14 yearsFixed orthodontic treatmentDoes not referAfter CoS leveling, the FMP angle decreased in the Class I and II groups and increased in the Class III group. These results were statistically significant except in the Class I malocclusion group.Leveling of the CoS before and after orthodontic treatmentAverage FMP angle before and after treatment

Correlation between CoS and FMP angle:
A slight positive correlation was observed between CoS and FMP angle in the Class I and III malocclusion groups, and a negative correlation in the Class II malocclusion group.
It was observed that in the Class I and II groups, there was a significant decrease in the FMP angle, indicating an improvement in the dental relationship after orthodontic treatment. In contrast, in the Class III group, there was an increase in the FMP angle, suggesting a specific modification of the dental relationship in this type of malocclusion.
Feldman, E. et al., 2015 [40]Cohort
Retrospective
n = 90.

Group I—Class I controls (n = 30) SE Group (n = 30) LPE Group (n = 30)
45 ♂ and 45 ♀Serial extractions or late extractions of PMs. Orthodontic treatment later. T0: initial evaluation time.
T1: After natural displacement and before orthodontics, for patients in the control group and patients with serial extraction.
Pretreatment for patients with late PMS extraction.
T2: After comprehensive orthodontic treatment for serial extraction and delayed extraction groups of PMs.
Does not referFrom T0 to T1, incisors and canines in patients with SE tilted distally and became vertical. At T1, molars in the SE group tilted more. At T1, the LPE group showed significant differences in incisor and canine angulations compared to the other 2 groups. From T1 to T2, canines and molars in the SE group verticalized, with decreased incisor and canine angulation and increased molar angulation. From T0 to T1, in the SE group there was a significant decrease in the radius of the CoS sphere and the Monson sphere, and an increase in the radius of the Wilson curve sphere, while from T1 to T2, a significant increase in the radius of the Monson sphere and the Wilson curve and a non-significant decrease in the radius of the CoS sphere.Changes in the radii of the CoS sphere, Monson and Wilson curve.

Statistical differences between groups at T1.

Teeth inclination and angulation.

Changes in inclination and verticalization of teeth from T1–T2.
Significant increase in the radius of the Monson sphere from T1–T2.

Significant increase in the radius of the Wilson curve sphere from T0–T1 to T1–T2.

Statistically significant difference in the mean radii between the three groups at T1.

Significant difference between the SE group in relation to the Monson sphere and the Wilson curve compared to the other two groups at T1.
-The SE group showed changes in tooth inclination over time, with an initial increase followed by a decrease in the lingual inclination of the molars from T0 to T1, followed by verticalization during orthodontic treatment.
-The incisors and canines of the SE group tilted distally from T0 to T1, while the molars showed mesial inclination and greater prominence of the occlusal curves.
-After orthodontic treatment (T1–T2), there was minimal proclination of the incisors, significant proclination of the canines and significant verticalization of the molars in the SE group.
-The changes observed in the SE group were reflected by smaller Monson spheres and Wilson curves after the period of dental drift, compared with the control and LPE groups.
Freitas, K. et al., 2006 [41]Case–control
Retrospective
n = 58.

Group 1 (experimental) n = 29; Group 2 (control): n = 29
Group 1: Initial: 13 years; Final: 15 years and 4 m; retention: 20 years and 7 m;11 ♀ and 18 ♂.
Group 2: Two measurements: 12 years and 9 m and 15 years and 1 month; 11 ♀ and 18 ♂
NiTi and stainless steel archwires with reverse curve in the lower arch and accentuated in the upper arch and extraction of the four 1st PMs5 years-Statistically significant reduction in CoS after orthodontic treatment.
-Statistically significant increase in CoS from the post-treatment to post-retention phase.
-Positive correlation between overbite and CoS in the post-retention phase.
-Positive correlation between CoS in the post-retention phase and relapse of the initial overbite associated with greater correction achieved by the treatment and greater overbite in the post-retention phase.
CoS reduction

Difference between treatment and post-retention phases
CoS percentage correction

Changes in the position of the upper and lower incisors

Intrusive effect
Overbite Recurrence

OJ: Reduction and recurrence: Relative stability of OJ correction after treatment

Change in Inter-incisor Angle during treatment
Change in Inter-incisor Angle after retention

Relatively stable leveling of CoS during long-term orthodontic treatment
Orthodontic treatment was effective in initially reducing overbite and CoS. However, there was significant relapse of these corrections after the end of active treatment, especially evident in CoS. The positive correlation between overbite relapse and post-retention CoS suggests that changes in CoS may influence the stability of overbite correction over time. These findings highlight the importance of appropriate retention strategies to maintain long-term orthodontic results.
Givins, E.D., 1970 [42]Cohort
Retrospective
n = 33Does not referTreatment without tooth extractionsMinimum 2 yearsAfter orthodontic treatment, the shape of the CoS was leveled in relation to that presented at the beginning of treatment. The shape of the CoS and the angle of the mandibular occlusal plane tended to remain constant after orthodontic treatment.CoS Shape
Relapse of CoS correction: The points that presented the greatest consistency and the greatest amount of relapse along the CoS were the canines and the 1st mandibular PMs. Cases with low mandibular angle showed a greater relapse of CoS.
Mandibular occlusal plane angleOrthodontic treatment was effective in reducing and leveling the CoS in patients with different types of malocclusions, resulting in a change in the initial shape to a flatter configuration.
The stability of the CoS shape and the mandibular occlusal plane angle indicates a good response to orthodontic treatment.
Goh, S. et al., 2022 [43]Cohort
Retrospective
n = 4231.6 ± 9.8 a. 17 ♂ and 25 ♀Invisible aligners (8 patients with IP reduction)Does not referClinCheck predicted 0.55 mm more CoS correction than the actual outcome. The mean accuracy of CoS correction was 35%, and ClinCheck overestimated leveling in 85% of patients. First molars had the lowest accuracy and extrusion relative to the occlusal plane.Correction of overbite predicted by ClinCheck compared to actual outcome.

ClinCheck overestimation percentage in overbite correction.

Accuracy of change in angulation of lower central incisors relative to that predicted by ClinCheck.
XTo achieve the desired treatment goals, an overcorrection of the CoS leveling should be prescribed in the ClinCheck treatment plan and the extrusion of the lower 1st M should be the region of focus. The clinician should consider the use of adjunctive methods to improve leveling.
Gravina, M. et al., 2013 [44]RCTn = 36.

Group I—stainless steel arch 0.014 (n = 11)

Group II—Multifilament stainless steel 0.015 (n = 12)

Group III—Superelastic NiTi 0.014 (n = 13)
14 ± 2 a.
18 ♂ and 18 ♀
Lower 0.014 inch stainless steel archwire or Lower 0.015 inch Multifilament stainless steel archwire or Lower 0.014 inch Superelastic NiTi archwire

T1: Before treatment

T2: After treatment
Does not referStatistically significant intergroup differences only at T2, in relation to the dental irregularity index, with NiTi and multifilament stainless steel archwires having greater alignment capacity than conventional stainless steel archwires.Change in overbite (CoS) between periods T2 and T1 for the three groups.

Change in overbite (CoS) between periods T2 and T1 for each group individually.
T2-T1 irregularity index

Alignment capability of conventional stainless steel arch compared to other groups

Significant differences between groups in the irregularity index at T2-T1
Changes in the positions of the lower incisors were not different between the 3 groups evaluated, indicating a similarity in the behavior of the lower teeth in response to orthodontic treatment.
CoS leveling showed no significant differences between groups using only one type of archwire for a period of 8 weeks, suggesting similar efficacy.
There were statistically significant differences in the values of the irregularity index at T2, with the groups that used NiTi and multifilament stainless steel presenting greater tooth alignment compared to the other groups.
Harini, A.,
2024 [45]
Cohort
Retrospective
n = 8422.3 ± 1.2 years,
27 ♂ and 57 ♀
NiTi wires with a reverse curve of Spee
(non-extraction).
NiTi archwires in a standardized sequence of 0.014, 0.016, 0.018-inch, and 0.017 × 0.025-inch. Subsequently, 0.017 × 0.025-inch, 0.019 × 0.025-inch NiTi, and 0.019 × 0.025-inch RCS wires were used until a 0.019 × 0.025-inch SS wire could be inserted passively for retraction.
2 to 5.5 mThe CoS decreased by−1.43 ± 0.68 mm, which is statistically significant (<0.001). There is no significant difference in CoS reduction between the categorical variables. Despite statistically significant differences in the parameters between pre-and post-treatment, the linear correlation between most of the variables and CoS reduction ranged from very weak (<0.20) to weak (0.20–0.39).The CoS decreased by−1.43 ± 0.68 mm, which is statistically significant (<0.001).
A mean proclination of 2.48 degrees for lower incisors was noted, increasing the L1-MP angle from 103.25 ± 9.1 of pre-treatment values to 105.73 ± 6.83 after treatment. There is also a decrease in the L6-MP angle (-2.14 ± 5.64), suggesting distal inclination of the crowns of the first molar.
SN-OP (°), OP-MP (°), L6-MP (°), L6-MP (mm), PM-MP (mm), ICW (mm), and IWM (mm), exhibited statistical significance between pre- and post-treatment.
There is no significant difference in CoS reduction between the categorical variables. Despite statistically significant differences in the parameters between pre-and post-treatment, the linear correlation between most of the variables and CoS reduction ranged from very weak (<0.20) to weak (0.20–0.39).
The association of the WALA-M (mm), overjet, and overbite with the flattening of the CoS from pretreatment to post-treatment is positive, and the correlation is statistically significant. Other variables ANB, FMA, SN-OP, OP-MP, CG, L1-MP (mm), PM-MP (mm), ICW (mm), IMW (mm), and WALA-PM (mm) exhibited a positive correlation, but that is not statistically significant.
The vertical extrusion of lower premolars and molars combined with the intrusion of lower incisors contributed to the reduction of the CoS by reverse curve wires. The increase in transverse arch widths contributes to the correction of deep bites.
There is a change in the orientation of the occlusal plane with the flattening of the CoS.
Hellsing, E., 1990 [46]Case–control
Prospective
n = 11

Experimental—with TMJ disorders (n = 10)

Control—no TMJ disorders (n = 1)
34 years
3 ♂ and 8 ♀
Palatal arch with anterior bite plate. fixed appliances placed and, when necessary, PMs were extracted (n = 10). The maxillary lingual arch was not removed until the lower dental arch was stabilized with a 0.016 wire.2 yearsRelief from headaches and TMJ pain with the use of the device. Average reduction in OB of 3.4 mmAverage treatment time to achieve molar occlusion.

Leveling of the CoS after molar contact.

Clinically observed OB reduction after molar contact.
Proclination of the incisors.

Intrusion of the incisors.
Relief from headaches and TMJ pain after 1 week of using the lingual arch.

Improved jaw mobility due to the bite opening provided by the device.

Increased mandibular inclination.

Increased lower facial height (LAFH).
Lingual arches with bite plates are effective in relieving signs and symptoms of temporomandibular disorders. The average time for molars to have occlusal contact and decrease the OB was 3 m.
Jeong, H. et al., 2020 [47]Cohort
Retrospective
n = 33

Group I—flat CoS (n = 18). Group II—deep CoS (n = 15)
27.8 years.
3 ♂ and 30 ♀
Extraction of the 4 PMs and anterior mandibular subapical osteotomyDoes not referThe mean retraction of the lower incisors was 4.04 mm at the edge and 4.29 mm at the apex. The intrusion of the lower incisors was 3.33 mm at the edge and 3.42 mm at the apex. Correlation between anterior segment movements and airway-related parametersThe axis of the lower incisors did not change significantly.

Patients with a deep CoS demonstrated significantly greater intrusion of the incisors, while the axis of the incisors became more pro-inclined.
The lower pharyngeal airway became narrower, and the hyoid bone moved downward after surgery. The decrease in the lower pharyngeal airway space was correlated with apex retraction and proclination of the lower incisors. Point B moved posteriorly. Head posture was not significantly influenced by surgery.
Surgery should be performed with caution in patients with skeletal class II who are vulnerable to airway problems.
The anterior segment motion envelope was 6.5 to 7.2 mm of retraction and 5.6 to 5.8 mm of intrusion. Increased intrusion to level the CoS compromised anterior segment verticalization. To establish accurate surgical treatment goals, a balance must be made between the amount of intrusion and changes in the axis of the lower incisors.
Koyama, T., 1979 [48]Cohort
Retrospective
n = 20Start of treatment: 13 to 11 m, end of treatment: 17 to 5 m, end of retention: 19 to 11 mEdgewise device and extraction of the four PMsDoes not referIn op 1–6 after retention, a slight curve similar to that of the post-treatment cases was observed. In op 1–7 after retention, the curve became slightly deeper in the mandible. It was not possible to establish whether this deepening of the curve in the mandible was due to treatment relapse or occlusal movement after treatment.When CoS in subjects with normal occlusion was compared with orthodontic patients:
-After active treatment: smooth and slight curve, except in the lateral incisors, the CoS in the mandible tends to be flat.
-After retention: reverse curve or straight line.
The OB grades were 59.2% preoperative, 42.6% postoperative, and 41.4% post-retention.In orthodontic patients, the CoS is reversed or straight both after treatment and after retention.
Kravitz, N. et al., 2023 [49]Cohort
Prospective
n = 58Teenage group: 15.1 years, 9 ♂ and 20 ♀.

Adult group: 40.7 years, 7 ♂ and 22 ♀
Invisible aligners (with bite ramps on the upper incisors) with reverse curve implemented1 yearThe mean accuracy of intrusion of the lower incisors was 63.5% in adolescents and 45.3% in adults.
The intrusion accuracy of the lower central incisors was 52.1% and of the lateral incisors 56.5% (no statistical significance)
The amount of intrusion achieved was 1.7 mm in adolescents and 0.9 in adults (statistically significant difference).Weak negative correlation between age and accuracy, with advancing age the accuracy of intrusion decreases slightlyLower incisor intrusion with aligners is significantly more accurate in adolescents than in adults. No statistical difference in intrusion accuracy between lower central and lateral incisors with horizontal attachments placed on the lateral incisors. Orthodontists may consider reducing the degree of overcorrection for lower incisor intrusion in adolescents with deep bites who implementing the reverse curve of Spee mechanics.
Lie, F. et al., 2006 [50]Cohort
retrospective
n = 135

TLA Group (n = 100)
ULA Group (n = 35)
T1 (before treatment): 12.0 ± 1.5 years; T2 (end of treatment): 14.6 ± 1.5 years; T3 (after 3 years without retention): 26.6 ± 5.0 years.
50 ♂ and 85 ♀
The upper arch was treated in all subjects. The lower arch was treated in 100 subjects (TLA group) and 35 (ULA group) were untreated. In patients in whom both arches were treated, 47 had extraction of four PMs and 53 had treatment without extractions.3 years after retentionPost-treatment CoS depth often unstable. Post-treatment stability appeared to be more frequent in the TLA group than in the ULA group, but without statistical significance. The results suggest that an ideal curve depth of about 2.0 mm at T2 is associated with the least amount of post-treatment change. Changing from flat curves during treatment often leads to long-term CoS instability. In the TLA group, originally deep curves showed more stability than originally flat or normal curves. In the ULA group, originally normal curves showed more stability than originally flat or deep curves.In the TLA group, 52 patients remained stable in terms of curve depth, 29 relapsed and 19 underwent a spontaneous change to another curve type. In the ULA group, 21 patients remained stable, 5 relapsed and 9 underwent a spontaneous change. TLA group with−0.8 mm of curve depth between T1–T2 and an increase of 0.3 mm between T2–T3 (relapse of 37.5%). ULA group with +0.1 mm of curve depth between T1–T2 and −0.2 mm between T2–T3. TLA group decreased curve depth between T1–T2 associated with an increase between T2–T3 and distal displacement of the deepest point between T1–T2 related to a mesial relocation between T2–T3.The deepest point of the curve was displaced distally during T1–T2 and showed mesial relocation during T2–T3. Deep curve at T2 was associated with decreased curve depth between T2–T3. TLA group showed differences in CoS depth and deepest point over time without significant interaction with sex and lower dental extractions. TLA group showed positive correlation between curve depth and OB only at T1. Changes in OB correlated positively with changes in curve depth between T1–T2 (not between T2–T3). Curve depth at the end of treatment explained 26% of the total variation in curve depth between T2–T3. 47% of the post-treatment change in the deepest point can be explained by extraction treatment, more distal location of the deepest point and pro-inclination of the lower incisors at the end of treatment.Both the depth of the mandibular CoS and the location of its deepest point after orthodontic treatment are often unstable.
Greater stability can be expected after relatively large changes in leveling of deep curves during treatment compared to smaller changes.
The only predictor of post-treatment CoS depth change was the depth at the end of treatment; a CoS of approximately 2 mm at the end of treatment appears to be associated with favorable long-term stability.
Predictors for post-treatment change in deepest point location were extractions in the lower arch, deepest point location, and lower incisor proclination at end of treatment.
Lim, Z. et al., 2023 [51]Cohort
Retrospective
n = 5333 years.
16 ♂ and 37 ♀
Invisible alignersDoes not referSignificant difference between predicted and actual mean maxillary CoS leveling (46%), with a deficiency of 0.11 mm. Planned intrusion tended to be more accurate posteriorly, with an overexpression of 117% for the 1st molars. Planned extrusion was the least accurate, with the mild arch demonstrating expressions of −14% to −48% (teeth intruded despite a prescribed extrusive movement)No significant difference was found between predicted and actual movements of the molars and 2nd PMs in the planned intrusive movement. Within the planned intrusion subgroup, there was a significant mean deficit for the 1st PMs and canines. There were significant differences between all predicted and actual movements within the planned extrusion subgroup. The mean expression for the 1st molars and PMs demonstrated an intrusive movement despite the planned extrusion. The clear aligner did not accurately predict maxillary CoS leveling. Planned intrusive movements were overcorrected, and planned extrusive movements were under corrected or resulted in intrusion (effect was most apparent for the maxillary 1st M). Attempting to open the bite or level the maxillary CoS by extruding the maxillary molars with aligners may not produce the desired result. The use of attachments or prescribing overcorrection should be considered within ClinCheck when planning maxillary posterior extrusion.
Lupatini, P. et al., 2015 [52]Cohort
Retrospective
n = 10Initial (T0): 15.7 ± 8.04 years;
After (T1): 19.8 ± 7.71 years;
Retention (T2): 27.9 ± 7.96 years.
7 ♀ and 3 ♂
Treatment without extractions or orthognathic surgery8.4 ± 0.69 yearsThe mean CoS correction was 1.36 mm (73.11%) and the mean recurrence was 0.03 mm (2.2%). There was no significant difference between the T1–T2 values on the right or left side. On the other hand, there was a significant difference between the T0–T1 and T0-T2 values.The mean CoS depth at T0 was 1.86 mm, 0.50 mm at T1 and 0.53 mm at T2. The mean depth correction was 1.36 mm (73.11%) and the mean recurrence was 0.03 mm (2.2%). The results suggest that there was no significant recurrence of CoS, being a stable procedure after 8 years of treatment in mesocephalic patients who still use fixed mandibular retention.
The values found between T0 and T1 show that the CoS was leveled during orthodontic treatment.
Martins, D. et al., 2012 [53]Cohort
Retrospective
n = 56

Group I—increased OJ and OB (n = 28)

Group II—increased OJ, normal OB (n = 28)
Group I: 13.41 years, 16 ♂ and 12 ♀

Group II: 13.27 years, 16 ♂ and 12 ♀
Edgewise device and extraction of two or four PMs.

Group I: continuous arch with sharp curve or reverse curve

Group II: no intrusive mechanics
Does not referGroup I showed greater root resorption than group II. The initial severity of overbite and the amount of correction had significant positive correlations with root resorption.Group I showed greater changes in overbite treatment than Group II.Group I presented a higher degree of root resorption.
The combination of anterior retraction with intrusive mechanics causes more root resorption than anterior retraction of the maxillary incisors alone.
Patients with deep overbite treated with intrusion mechanics aimed at accentuating and reversing CoS, combined with anterior retraction, presented statistically greater root resorption of the upper incisors than patients with a normal overbite treated with anterior retraction without intrusion. There was a statistically significant positive correlation of root resorption with the initial severity of the overbite and with the amount of correction.
Nasrawi, Y. et al., 2022 [54]RCTn = 53
Group 1—stainless steel 0.017 × 0.025 reverse curve (n = 18)
Group 2-stainless steel 0.019 × 0.025 reverse curve (n = 17)
Group 3—TMA 0.021 × 0.025 reverse curve (n = 18)
Group 1: 12 ♀, 6 ♂

Group 2: 12 ♀, 5 ♂

Group 3: 15 ♀, 3 ♂
Stainless steel arc 0.017 × 0.025 reverse curve; stainless steel arc 0.019 × 0.025 reverse curve; TMA arc 0.021 × 0.025 reverse curve.
6 m
Does not referThe 3 arches were effective in leveling and safe for the roots of the lower anterior teeth. Statistically significant difference between reduction of groups 1 and 2 and groups 2 and 3.Significant monthly reduction in CoS in all groups. Group 2 with greater reduction compared to groups 1 and 3. CoS reduction of 3.82 mm, 4.47 mm, and 3.85 mm in groups 1, 2, and 3, respectively.
Arch length and width increased significantly in groups 2 and 3.
During CoS leveling, the external apical root resorption of the lower incisors ranged from 0.68 to 0.72 mm, from 0.63 to 0.82 mm, and from 0.53 to 0.88 mm in groups 1, 2, and 3, respectively (p > 0.05), being similar in groups 1 and 2 and greater in group 3. Higher pain scores were observed in group 2.The 3 arches were effective in leveling the CoS with minimal external apical root resorption. CoS was leveled by intrusion and proclination of the lower incisors and extrusion of the lower molars. Intrusion was more pronounced in group 3 and extrusion was more pronounced in group 1. Pain was greater in group 2 during the first 24 h, and after 48 h it was similar in all groups.
Nawaz, A. et al., 2018 [55]Cohort
Prospective
n = 3515.05 ± 2.65 years. 13 ♂ and 22 ♀0.019-inch continuous stainless steel archwire with opposing archwire in the lower arch.Does not referThe mean changes (T2-T1) for L4-MP were statistically significant.There was an average extrusion of 3.25 ± 3.44 mm of the 1st s PM
The mean reduction in overbite, 7 months after insertion of the continuous orthodontic archwire with opposing archwire (T2-T1), was 3.67 ± 2.94 mm.
The mean reduction in OJ, (T2-T1) was 4.75 ± 3.79 mm. The mean change (T2-T1) in IMPA was statistically significant. L1-APog increased significantly by 3.39 ± 2.98 mm. The PFO-MP angle showed a mean increase of 4.30 ± 6.4°, statistically significant.The continuous arch method effectively leveled the CoS. The CoS leveling was mainly due to the extrusion of the PMs, protrusion of the mandibular teeth and increase in IMPA, significantly increasing the functional occlusal plane in the mandibular plane and the height of the lower face.
Pandis, N. et al., 2010 [56]Cohort
Prospective
n = 5013.8 ± 1.3 years.
10 ♂ and 40 ♀
Straight archwire appliance. Sequence: 0.014 or 0.016 ideal form Sentalloy, followed by 0.020 ideal form Sentalloy, 0.020 stainless steel wire and 0.018 × 0.025 stainless steel wireDoes not referThe CoS showed an average decrease of 0.9 mm, with 50% of cases ranging between 0.4 mm and 1.4 mm. The only predictor of curve leveling was the angle of the lower incisors in relation to the mandibular planeThe CoS showed an average decrease of 0.9 mm, with 50% of cases ranging from 0.4 mm to 1.4 mm. A 4-degree proclination of the lower incisors resulted in a 1-mm leveling. Incisor inclinations increasedIncreased intercanine and intermolar widthsThe CoS is primarily leveled by proclination of the lower incisors. For every 1 mm of leveling, the incisors proclination 4 degrees, without increasing the arch width.
Preston, C. et al., 2008 [57]RCTn = 44

Alexander Group—continuous arch (n = 31)

Bench Group—segmented arch (n = 13)
Alexander Group: T1 (before treatment)—12 years and 6 m; T2 (2 m after treatment)—14 years and 11 m, T3 (after retention)—26 years and 4 m
Bench Group: T1-13 years and 6 m, T2-16 years and 2 m, T3-22 years and 5 m
Alexander Continuous Arch Technique or Bioprogressive Segmented Arch TechniqueAlexander Group: 11 years and 5 m

Bench Group: 4 years and 1 m
22 patients in the Alexander group were level at T2. 9 patients in the Bench group were level at T2. There was no significant correlation between CoS at T1 and recurrence. In both groups, patients who did not have a completely level curve at T2 relapsed more than those who did.Statistically significant reduction in CoS after treatment in both groups. Alexander group 71% completely leveled. Bench group 69% completely leveledAll occlusal characteristics had statistically significant differences between T1–T2 and T2–T3.

  • Intercanine width: Alexander group increased during treatment but reduced between T2–T3; Bench group increased during treatment and between T2–T3.
  • OB: reduction in both groups during treatment.
  • OJ: reduced during treatment, but in the Alexander group it increased in 27 patients and recurred in 6 patients after retention.
  • Lower incisor irregularity: decreased but increased significantly post-treatment.
  • Arch length: both groups increased during treatment and decreased post-retention
Both techniques produced significant reductions in CoS (T1 to T2). Statistically significant but clinically insignificant post-retention relapse of CoS (T2 to T3). For both techniques, a statistically significant difference in the incidence of CoS relapse was observed between patients who were completely leveled post-treatment and those who were not. No correlation was found between pre-treatment CoS and relapse in any of the other occlusal characteristics studied. This study indicates that in well-treated patients, the observed relapse in CoS is minimal and occurs over a long period of time.
Rizvi, B. et al., 2013 [58]Cohort
Prospective
n = 3114.03 ± 1.60 years.
10 ♂ and 21 ♀
Stainless steel continuous arc reverse curve 0.018Does not referSignificant reduction in OJ and OB. Significant increase in IMPA. Significant increase in L4-MP. Significant increase in L1-Apog.Mean PM extrusion of 2.24 ± 2.43 mm (Significant increase in L4-MP). Non-significant change in L6-MP. Proclination of lower incisors.Significant reduction in OB (53.5%) and OJ. Significant increase in IMPA. Significant increase in L1-Apog. Increase in LAFH (hourly rotation).The continuous arch technique leveled the CoS in this sample of patients with Class II division 1 deep bite treated without extractions. Leveling occurred mainly by extrusion of the PMs, protrusion of the lower incisors and increase in the IMPA angle to a slightly higher limit than normal. Highly significant decreases were observed in the OJ and OB.
Rozzi, M. et al., 2017 [59]Cohort
Retrospective
n = 90

Group 1—low maxillomandibular angle (n = 30)

Group 2—normal maxillomandibular angle (n = 30)

Group 3—high maxillomandibular angle (n = 30)
19 years and 4 m.
39 ♂ and 51 ♀
Continuous arc techniqueDoes not referSkeletal variables: there was no significant change in the 3 groups. Dento-alveolar variables: group 1 with proclination and intrusion of the lower incisors, group 3 with extrusion of the posterior teeth and uprighting of the 1st and 2nd molars.CoS modification was similar in the 3 groups. The mean CoS correction ranged from 2.69 mm for group 1 to 2.10 mm for group 3.Between groups 2 and 3, a significant reduction in the inter-incisor angle was observed in group 2.

Group 3-occlusal plane with increasing clockwise rotation.

In all groups, improvement in OB
In group 1, leveling occurred by proclination and intrusion of the lower incisors. In group 3, leveling occurred by extrusion and verticalization of the posterior teeth. There were no significant differences between groups in the leveling of the CoS.
Rozzi, M. et al., 2019 [60]Cohort
Retrospective
n = 60

Group 1—low maxillomandibular angle (n = 21)
Group 2—normal maxillomandibular angle (n = 20)
Group 3—high maxillomandibular angle (n = 19)
19.8 ± 1.4 years.
28 ♂ and 32 ♀
Continuous arch technique (combined with class II intermaxillary elastics and interproximal reduction of the incisors).

T1: Before treatment
T2: End of treatment
T3: 2 years after treatment
2 yearsIn group 1, the leveling of the CoS occurred by proclination and intrusion of the lower incisors, while in group 3 the CoS was leveled by extrusion and verticalization of the lower posterior teeth. Group 1 showed significant relapse of the inclination of the lower incisors. On the other hand, group 3 had greater stability in the leveling of the CoS obtained by the stable extrusion of the posterior teeth.Between T2-T1: No difference in CoS reduction. The mean CoS leveling ranged from −2.87 mm in group 1 to −2.08 mm in group 3.

Between T3-T2: greater CoS relapse in group 1 (CoS: +1.52 mm) compared with group 3 (CoS: +0.53 mm). Group 3 with increased axial angulation of the 1st and 2nd molars
Between T2-T1: Group 1 with decreased clockwise rotation of the occlusal plane, with no difference between groups in OB correction. Group 3 with less reduction in the inter-incisor angle compared to group 1.

Between T3-T2: Group 3 with greater stability of the inter-incisor angle. Greater relapse of the OB in group 1.
Leveling without statistically significant difference between groups, occurring by proclination and intrusion in group 1 and by extrusion of the posterior teeth in group 3. The long-term instability of the proclination of the incisors determined the relapse of the OB and CoS in group 1.
Rozzi, M. et al., 2022 [9]Cohort
Retrospective
n = 62

Group I—aligners (n = 30)

Group F—continuous arch (n = 32)
Group I: 24 years and 5 m (±19 m), 13 ♂ and 17;

Group F: 22 years and 4 m (±21 m), 12 ♂ and 20 ♀
Continuous arch technique or invisible alignersDoes not referLeveling of the CoS was obtained in both groups. Group F presented extrusion of the posterior teeth and proclination of the lower incisors. Group I presented intrusion of the lower incisors.Group F: statistically significant leveling (−2.3 mm). Group I: statistically significant leveling (−2.2 mm), intrusion and proclination of the lower incisors and retroclination of the upper incisors. More proclination in group F than in I.Group F: statistically significant clockwise rotation of the occlusal plane, significant decrease in OJ and OB, and decrease in the interincisor angle. Group I: counterclockwise rotation with minimal reduction in the Sella-MP angle, significant decrease in OJ and OB, with increase in the interincisor angle (no statistical significance).Both methods effectively level CoS, with no statistically significant differences in CoS values when comparing T1–T0 between the 2 groups.
Shakhtour, F.
2024 [61]
RCTn = 62
Group I—0.019 × 0.025 SS reverse CS with crown labial torque (n = 20)
Group II—0.019 × 0.025 SS Reverse CS without crown labial torque (n = 22)
Group III—rocking-chair NiTi 0.016 × 0.022 with reverse CS (n = 20)
Group I—20.5 years, 7 ♂ and 13 ♀

Group II—19.4 years, 10 ♂ and 12 ♀

Group III—18.2 years, 9 ♂ and 11 ♀
0.019 × 0.025-inch SS archwire with
reverse CS with crown labial torque or 0.01 × 0.025-inch SS Reverse CS with zero crown labial torque or rocking-chair NiTi 0.016 × 0.022-inch with reverse CS
Does not referThe lower incisor angular change was significantly smaller in Group II compared to Group I and Group III.
Lower incisor anterior movement was reduced in Group II compared to Group I and Group III. Group III showed significantly more downward movement of the lower Incisors. The three groups showed comparable amounts of true intrusion.
The angular change of lower incisors was significantly smaller in group II (0.3°) compared to Group I (4.8°) and Group III (6.0°, p < 0.001).
There was a significant difference in the anterior movement between Group II and Group I (p = 0.014) and Group III (p = 0.008).
There was no significant difference in lower incisor proclination and forward movement between Group I and Group III
The lower incisors in group III showed significantly more downward movement (1.945 mm) in comparison to group I (1.01 mm) and II (0.97 mm, p < 0.001). No significant differences were detected among the three groups in relation to the intrusion of point I (p = 0.536).0.016 × 0.022 NiTi and 0.019 × 0.025 SS with crown labial torque reverse CS archwires resulted in similar proclination and forward movement of the lower incisors.
Removal of anterior crown labial torque from the 0.019 × 0.025 SS reverse CS archwire prevents lower incisor proclination and forward movement.
0.016 × 0.022 reverse CS NiTi archwire exhibited the highest degree of downward movement of the lower incisor incisal edge.
No significant difference in true intrusion of the lower incisors was detected among the groups.
Shannon, K.R., & Nanda, R.S., 2004 [62]Cohort
Retrospective
n = 5014 years and 5 m.
24 ♂ and 26 ♀
Verticalization of molars, extrusion of PMs, intrusion or vestibularization of incisors.
20 patients with extractions and 30 without extractions
Average: 2 years and 8 m (from 2 years to 5 years and 8 m)On average, CoS leveled to maximum depth 0.57 ± 0.54 mm. No differences in CoS relapse (approximately 16%) between groups with/without extractions and between dental classes. Statistically significant correlation between CoS relapse and verticalization of the 2nd M.With treatment: extrusion of the 1st and 2nd molars, 1st and 2nd PMs, intrusion and proclination of the lower incisors. Post-retention: posterior teeth continued to erupt, and the 2nd molar angled mesially and incisors extruded.
  • With treatment: increased FOP-MP and decreased SN-OP; correlation between increased pre-treatment CoS and smaller mandibular plane angle; smaller angle between mandibular and occlusal plane; 1st and 2nd M inclined mesially; increased OB and OJ. Post-retention: increased FOP-MP and decreased SN-OP.
Relatively stable CoS leveling after treatment. CoS corrected in 63% of patients, but with 16% relapse. No significant differences in CoS relapse between groups with/without extractions. Correlation between CoS relapse and post-retention changes in OB and irregularity index. Patients with fixed retainers relapse less than those with removable retainers
Sinha A., et al.
2024 [63]
Cohort
Retrospective
n = 16818.5 years
84 ♀ and 84 ♂
Reverse curve of Spee archwireDoes not referSignificant reduction in OB
Altered inclinations of maxillary and mandibular incisors
Reduced ANB angle
Patient satisfaction
Maxillary incisor inclination: 2.8 mm (p 0.002)

Mandibular incisor inclination: −2.3 (p 0.008)
OB: −4.1 (p < 0.001)
ANB angle: −0.7 (p 0.015)
Patient satisfaction: remarkable improvement in the perceived treatment progress. Subgroup analysis based on age and sex reveals consistent changes in cephalometric parameters across different groups
Efficacy of reverse CoS archwires in the correction of deep bite malocclusion
Sondhi, A. et al., 1980 [64]Cohort
Retrospective
n = 53.

Sub-sample: n = 15
Does not referEdgewiseMinimum 2 yearsThe group that had molar eruption during the post-treatment period exhibited a stable correction of the overbite, unlike the other study group.Vertical changes in molar position during treatment did not show a definitive association with the stability of the corrected overbite.

The association between the stability of the overbite dimension and incisor intrusion or extrusion was not statistically significant.
Stable overbite correction in patients with molar eruption during the post-treatment period.
Overbite relapse in patients without molar eruption during the post-treatment period.
Correlation between changes in maxillary arch length and maxillary incisor inclination to the SN plane.
Correlation between changes in mandibular arch length and mandibular incisor inclination to the mandibular plane, with non-high correlation values.
Eruption of the 1st M during the post-treatment period is associated with greater stability in the overbite.
Overbite relapse does not show significant differences between cases in which the incisors are intruded during treatment and those in which they are not.
The correlation between changes in dental arch length and changes in incisor inclination is not high.
The depth of the CoS does not show a significant correlation with the inclination of the occlusal plane.
Theerasopon, P. et al., 2021 [65]RCTn = 30.

Group 1—simultaneous control, leveling and alignment (n = 15).

Group 2—experimental, initially aligned, later leveled (n = 15)
22.48 years.
11 ♂ and 19 ♀
Group 1—aligned with NiTi 0.014 and 0.016 and stainless steel 0.016 × 0.016 and 0.016 × 0.022;
Group 2-
aligned with NiTi 0.014” and 0.016, then leveled with stainless steel 0.016 × 0.016, with a passive CoS and TMA 0.016” × 0.022” with accentuated CoS, then stainless steel 0.016 × 0.022
Does not referGroup 1CoS Reduction

Incisor projection

Incisor intrusion

Group 2 showed significantly lower incisor projection with greater incisor intrusion. The CoS in Group 2 showed significantly greater reduction (−2.88 mm) than in Group 1 (−1.69 mm).
Gum recession

Dental crowding

Treatment time in group 2 was significantly longer than in group 1
The type of archwire used significantly influences the projection of the lower incisors and the leveling of the CoS.
Group 1, treated with round arches, presented a notable projection of the lower incisors, especially exacerbated when rectangular arches were used.
Group 2 showed minimal projection of the lower incisors, accompanied by a greater reduction in CoS.
These results highlight the importance of choosing the appropriate arch type to achieve the desired orthodontic goals, such as tooth alignment and CoS correction for a satisfactory aesthetic and functional result.
-Round arch: the lower incisors tipped labially and intruded, reduction of the CoS 1.19 mm.
-Rectangular arch: the lower incisors intruded and projected additionally.
Group 2
-Round arch: lower incisors tilted slightly buccally, without significant intrusion.
-Rectangular arch: incisors, for the most part, intruded, with a slight projection.
♂: men; ♀: women; 4 V: distance from the buccal cusp of the 1st lower premolar to the reference plane; 5 V: distance from the buccal cusp of the 2nd lower premolar to the reference plane; 6 MV: distance from the mesiobuccally cusp of the 1st lower molar to the reference plane a: years; ANB: angle formed between the line joining the site of greatest concavity of the anterior profile of the superior alveolar process to the most anterior point of the nasofrontal suture and the line joining the site of greatest concavity of the anterior profile of the inferior alveolar process to the most anterior point of the nasofrontal suture; A-Po: line joining the site of greatest concavity of the anterior profile of the superior alveolar process to the most superior point of the external auditory canal; ATM: temporomandibular joint; BF: blood flow; CR-Eval: American Board of Orthodontics Radiograph and Model Evaluation score; CoS: curve of Spee; FMP: mandibular-Frankfurt plane; FOP-MP: angle between the occlusal plane and the mandibular plane; h: hours; IMPA: angle between the mandibular plane and the axis of the lower incisor; IP: interproximal; L1-APog: L1-L1A; L4-MP: distance from the apex of the cusp of the 1st premolar to the mandibular plane; L6-MP: distance from the apex of the cusp of the 1st molar to the mandibular plane; LAFH: lower anterior face height; LPE: late premolar extraction; m: months; M: molar; MD: mesiodistal; Min: minutes; NB: line joining the site of greatest concavity of the anterior profile of the inferior alveolar process to the most anterior point of the nasofrontal suture; NiTi: nickel titanium; Op 1–6: Occlusal plane joining the center of the central incisor to the crest of the distobuccal cusp of the 1st molar; Op 1–7: Occlusal plane joining the center of the central incisor to the crest of the distobuccal cusp of the 2nd molar; OB: overbite; OJ: overjet; OP-MP: Occlusal plane—mandibular plane; PM: premolar; PMs: premolars; RCT—Randomized Controlled Trial; SE: serial extractions; Sela-MP: center of the bony cavity of the sella turcica in relation to the mandibular plane; SN-MP: line joining the center of the bony cavity of the sella turcica to the most anterior point of the nasofrontal suture in relation to the mandibular plane; SN-OP: line joining the center of the bony cavity of the sella turcica to the most anterior point of the nasofrontal suture in relation to the occlusal plane; TLA: treatment in the lower arch; TMA: beta titanium; ULA: untreated chin in the lower arch.
Table 3. Summary of findings.
ComparisonOutcome (mm)Control (mean, mm)Mean Difference (95% CI)Prediction Interval (mm)
Aligners vs. Conventional AppliancesPrimary tooth movement/alignment2.5 mm−0.8 mm (−2.5 to +0.9)−4.3 to +2.7
Conventional Appliances with Extractions vs. Without ExtractionsSpace closure/retraction3.0 mm+0.5 mm (−1.5 to +2.4)−3.8 to +4.9
OverallMean tooth displacement2.8 mmRange across interventions: −1.2 mm to +1.0 mm−4.6 to +3.7
Table 4. GRADE Evidence Profile.
OutcomeNo. Studies/SubjectsRisk of BiasInconsistencyIndirectnessImprecisionPublication BiasOverall Certainty
Conventional appliances17/852Very serious 1Very serious 2Not seriousSerious 3Not assessed 4⊕⊝⊝⊝ VERY LOW
Conventional appliances with extractions3/295Very serious 5Very serious 6Not seriousVery serious 7Not assessed 4⊕⊝⊝⊝ VERY LOW
Invisible aligners2/115Serious 8Very serious 9Not seriousVery serious 10Not assessed 4⊕⊝⊝⊝ VERY LOW
1 13 of 17 studies (76%) at high risk of bias; 2 Very high statistical heterogeneity (I2 = 98.7%); 3 Moderate sample size but wide confidence intervals likely; 4 Too few studies to assess publication bias reliably; 5 2 of 3 studies (67%) at high risk of bias; 6 Very high statistical heterogeneity (I2 = 98.3%); 7 Small sample size (295 participants) and very wide confidence intervals expected; 8 1 of 2 studies (50%) at high risk of bias; 9 Very high statistical heterogeneity (I2 = 98.7%); 10 Very small sample size (115 participants) and very wide confidence intervals expected.
Disclaimer/Publisher’s Note: The statements, opinions and data contained in all publications are solely those of the individual author(s) and contributor(s) and not of MDPI and/or the editor(s). MDPI and/or the editor(s) disclaim responsibility for any injury to people or property resulting from any ideas, methods, instructions or products referred to in the content.

