Article

Enhancing Biscuit Nutritional Value Through Apple and Sour Cherry Pomace Fortification

by
Maria Bianca Mandache
1,
Carmen Mihaela Topală
2,
Loredana Elena Vijan
2,* and
Sina Cosmulescu
3,*
1
Doctoral School of Plant and Animal Resources Engineering, Faculty of Horticulture, University of Craiova, A.I. Cuza Street, No. 13, 200585 Craiova, Romania
2
Faculty of Sciences, Physical Education and Computer Science, The National University of Science and Technology Politehnica Bucharest, Pitesti University Centre, 1 Targu din Vale Street, 110040 Pitesti, Romania
3
Department of Horticulture and Food Science, Faculty of Horticulture, University of Craiova, A.I. Cuza Street, No. 13, 200585 Craiova, Romania
*
Authors to whom correspondence should be addressed.
Appl. Sci. 2025, 15(21), 11823; https://doi.org/10.3390/app152111823
Submission received: 4 October 2025 / Revised: 31 October 2025 / Accepted: 4 November 2025 / Published: 6 November 2025

Abstract

This research investigates the use of apple and sour cherry pomace to fortify biscuits, aiming both to improve their nutritional profile and to support the sustainable reuse of fruit processing by-products. Apple and sour cherry pomace, known for their high content of bioactive compounds, were added to biscuit formulations at inclusion levels of 5%, 10%, and 15%. Enrichment notably boosted the concentration of health-promoting constituents. Biscuits containing 15% sour cherry pomace recorded the highest amounts of polyphenols (475.16 mg gallic acid equivalents/100 g), flavonoids (204.10 mg catechin equivalents/100 g), and anthocyanins (28.58 mg cyanidin-3-glucoside equivalents/100 g). In contrast, biscuits fortified with 15% apple pomace displayed stronger antiradical activity (30.80%) and higher sugar content (46.31 g glucose equivalents/100 g) than their sour cherry counterparts. FTIR spectroscopy confirmed the presence of characteristic vibrations associated with these bioactive compounds in both the pomace and the enriched biscuits. Overall, the results show that incorporating apple and sour cherry pomace is a practical way to create functional biscuits with enhanced nutritional qualities while promoting the sustainable use of fruit industry residues.

1. Introduction

The current trend towards sustainable development seeks to minimise food waste and utilise available resources more efficiently, thereby adding value to by-products. A key priority is ensuring consistent access to sufficient, safe and nutritious food that meets people’s needs and enables them to lead healthy and active lives. At the same time, responsible operational practices must be adopted to minimise environmental damage and ensure long-term economic viability and social well-being. Transitioning from the traditional ‘take, make, dispose’ model to a system that minimises waste, reuses resources, and regenerates natural systems creates a perpetual cycle in which by-products serve as inputs, nutrients are recycled, and waste is eliminated through efficient design [1,2]. The ultimate goal is to establish a sustainable food economy that benefits people, the environment and businesses alike. Taking a holistic approach that considers waste and emission reduction, energy efficiency, the use of renewable resources, the design of sustainable and recyclable products, and the promotion of the circular economy can reduce the environmental, economic, and social impacts of industrial activities [3,4]. Thus, the focus shifts from short-term gains to long-term value creation.
In recent years, the need to reduce the negative environmental impact of products throughout their life cycle has prompted the European Union to introduce a series of directives promoting sustainable practices [5,6]. The European Commission has also set itself the long-term objective of transitioning to a competitive economic model characterised by the optimal, sustainable use of resources [7]. Three strategies have been discussed to increase the sustainability of the food system in terms of resource use and environmental impact: a consumption strategy, a production strategy and a circular economy strategy. The consumption strategy aims to change consumer preferences so that products with a lower environmental impact are chosen. The production strategy aims to develop more environmentally friendly food technologies. The circular economy strategy combines aspects of the first two and aims to create a closed resource cycle while ensuring the efficient distribution of land and biomass resources throughout the food system [8,9].
Interest in fruit consumption has increased due to its role in maintaining a balanced diet. Fruit is valued for its complex nutritional profile and health-promoting properties [10,11]. There is also a positive correlation between daily fruit consumption and reduced mortality [12]. Depending on its perishability, fruit can be consumed fresh for a limited time or processed to extend its shelf life and create products such as juices, jams, jellies, dried fruit and purées. However, fruit processing generates considerable amounts of waste. Statistics show that fruit and vegetable waste (including skin, pulp, pomace and seeds) accounts for around 16% of total food waste and contributes around 6% to global greenhouse gas emissions [1]. This waste is valuable due to its potential to be transformed into high-value products through valorisation, thanks to the presence of bioactive compounds such as polyphenols, anthocyanins, dietary fibres, and antioxidants [13]. These compounds can be extracted and used to produce functional foods, nutraceuticals, food additives, biomaterials, and biofertilisers, thereby reducing the environmental impact of waste and contributing to a circular economy [14,15].
The fruit juice industry consumes about 50% of global fruit production [16], 30–40% of the global sour cherry harvest [17] and 25–30% of the apple harvest [18]. Apples are a key ingredient in the growing global juice market, with China, the United States and Europe (especially Poland) being the main producers and consumers of apple juice and concentrate [19]. Apple pomace is one of the most common types of agricultural waste produced worldwide, with around 4 million tonnes generated each year [20,21,22]. Around 75% of an apple’s weight is converted into juice, while the remaining 25% becomes pomace [23].
Integrating fruit pomace into food products such as bakery items, confectionery, dairy products and meat products has been shown to enhance their nutritional, pharmacological and phytochemical properties [22,24]. However, effective management strategies based on a thorough analysis of the pomace composition are needed to achieve the ‘zero waste’ goal [25,26]. Given the popularity of biscuits, enriching them with fruit pomace is an effective way to boost their nutritional value and promote health and sustainability. The high fibre content of pomace and its ability to retain moisture help biscuits to maintain a soft, chewy texture, reducing hardening during storage and thus extending their shelf life [27,28]. Although many studies have examined the use of fruit pomace as a functional food ingredient, none have compared the impact of different types of pomaces on the same product. This study aimed to improve the nutritional value of biscuits and increase the industrial sustainability of fruit by adding value to apple and sour cherry pomace. The effects of the two types of pomaces on biscuit composition were examined, and FTIR spectroscopy revealed that bioactive compounds had transferred from the pomace to the final product. Another benefit is reducing the ecological impact by reusing the pomace to develop functional foods that provide health benefits.

2. Materials and Methods

2.1. Raw Materials and Biscuit-Making Process

The apple and sour cherry pomace came from two juice producers in Romania. Each pomace was slowly dried at 60 °C before being ground in an electric grinder. They were then stored in glass jars with airtight lids in the refrigerator.
The biscuit-making process had four stages. The first stage, dough preparation, involved mixing the raw materials: 500 g of type 000 wheat flour, 168 g of eggs, 50 g of milk powder, 166 mL of sunflower oil, 213 g of sugar, 2 g of iodised sodium chloride, and 2 g of baking powder. The second stage was moulding, where the biscuits were given their desired shape. The third stage involved baking the biscuits at 180 °C. Finally, the biscuits were cooled and packaged to maintain the freshness and quality of the final product. To prepare the experimental biscuits, 5%, 10% or 15% (25 g, 50 g or 75 g, respectively) of the wheat flour in the control sample of biscuits was replaced with either sour cherry or apple pomace powder.

2.2. Determination of the Moisture Content and the Physical and Sensory Characteristics of Biscuits

The moisture content was determined by gravimetrically drying the samples at 110 °C using a KERN DBS 60-3 moisture analyser (KERN & SOHN GmbH, Balingen, Baden-Württemberg, Germany). The results were expressed as percentages.
The average diameter of the biscuits was calculated by measuring their smallest width and largest length and averaging the results. The height was determined by stacking six biscuits together and measuring the total height of the resulting column. After the initial measurement, the biscuits were rearranged, and the height was measured again. The median of these two values was then divided by the number of biscuits stacked. Finally, the diameter/height ratio was calculated by dividing the average diameter by the average height of the biscuits [29].
The sensory evaluation of the seven types of biscuit involved a hedonic test, in which 42 consumers participated. Prior to the evaluation, the participants were informed of the purpose of the study and gave their voluntary consent to participate. The evaluation was conducted in natural daylight at 20 °C and had received approval from the institutional ethics committee. The evaluation examined the outer aspect, consistency, colour intensity, odour, taste and overall acceptability of the biscuits. Each sensory attribute was rated on a scale from 1 to 9, where 1 means “I dislike it extremely”, 2 “I dislike it very much”, 3 “I dislike it moderately”, 4 “I dislike it a little”, 5 “I neither like it nor dislike it”, 6 “I like it a little”, 7 “I like it moderately”, 8 “I like it a lot”, and 9 “I like it extremely”.

2.3. Preparing the Necessary Extracts to Determine the Total Content of Sugars, Polyphenols, Flavonoids, Anthocyanins, and Anti-Radical Activity

To determine the total sugar content, 1 g of biscuit sample was mixed with 10 mL of distilled water. This mixture was vortexed for two minutes, followed by ultrasonication at 99 °C for a further 30 min.
Ethanolic extracts of 1 g of biscuit sample with 10 mL of absolute ethanol (Merck-Sigma-Aldrich, Darmstadt, Germany) were used to determine the other biochemical parameters. The mixtures underwent two consecutive cycles: two minutes of vortexing in a Vortex VX-200 mixer (Corning Life Sciences, Tewksbury, MA, USA) followed by 30 min of ultrasonication at 40 kHz in a Labbox Labware ULTR-2L0-001 ultrasonic bath (Migjorn, Spain) and then 30 min of centrifugation at 6000× g rpm in a Spectrafuge 6c centrifuge (Labnet International, Edison, NJ, USA).

2.4. Determination of Total Polyphenol Content

The total polyphenol content was determined using a PerkinElmer Lambda 25 UV-Vis spectrophotometer (Shelton, CT, USA) according to the method described by Mandache et al. [30]. 2 mL of the biscuit ethanolic extract were mixed with 0.5 mL of Folin-Ciocâlteu reagent. Then, 2 mL of a 10% sodium carbonate solution (Merck-Sigma-Aldrich, Darmstadt, Germany) were added to the mixture, followed by 5.5 mL of distilled water to bring the total volume to 10 mL in each tube. After resting in the dark for two hours, the absorbance of each sample was measured at 765 nm. The results were reported as mg gallic acid equivalents (GAE)/100 g of sample, using the gallic acid calibration curve.

2.5. Determination of Total Flavonoid Content

To determine the total flavonoid content spectrophotometrically according to the method described by Mandache et al. [30], the samples were prepared by mixing 2 mL of biscuit ethanolic extract with 0.5 mL of 5% sodium nitrite. Then, 0.5 mL of a 10% aluminium chloride solution, 2 mL of a 1 M sodium hydroxide solution (Merck-Sigma-Aldrich, Darmstadt, Germany) and 5 mL of distilled water were added to each tube, one after the other, to bring the total volume to 10 mL. The absorbance of each sample at 510 nm was then determined. Total flavonoid content was reported as mg catechin equivalents (CE)/100 g of sample using the catechin calibration curve.

2.6. Determination of Total Anthocyanin Content

To determine the total anthocyanin content using a spectrophotometer, according to the methodology described by Mandache et al. [30], the following were mixed: 1 mL of biscuit ethanolic extract, 1 mL of absolute ethanol solution acidified with 0.1% pure hydrochloric acid (HCl) and 8 mL of a pH 0.6 buffer solution (2% HCl solution). Alternatively, a pH 3.5 buffer solution can be used, made by dissolving 21.7 g of disodium phosphate and 14.6 g of citric acid in distilled water to make up 1 litre in total. The absorbance at 520 nm was then determined. The total anthocyanin content was reported as mg cyanidin 3-glucoside equivalents (C3GE)/100 g of sample, using the cyanidin 3-glucoside calibration curve.

2.7. Determination of Total Sugar Content

The total sugar content was determined using the spectrophotometric phenol–sulfuric acid method [30]. To do this, 0.2 mL of aqueous biscuit extract was homogenised with 0.8 mL of distilled water and 5 mL of concentrated sulphuric acid. After stirring, 1 mL of a 5% aqueous phenol solution (Merck-Sigma-Aldrich, Darmstadt, Germany) was quickly added and the mixture shaken vigorously to develop the colour. The absorbance of each sample was then determined at 490 nm. Total sugar content was reported as g of glucose equivalents (GluE)/100 g of sample using the glucose calibration curve.

2.8. Determination of Antiradical Activity

The antiradical activity of the ethanolic biscuit extract was evaluated using the DPPH (1,1-diphenyl-2-picrylhydrazyl) assay [30]. 3 mL of methanolic DPPH solution (11.6 mmol/L, Merck-Sigma-Aldrich) were mixed with 0.1 mL of each ethanolic biscuit extract. The mixtures were shaken and incubated in the dark at room temperature for 20 min. Absorbance values for the control sample (DPPH stock solution) and the plain and fortified biscuit samples were determined at 517 nm and the DPPH radical scavenging activity (RSA%) was calculated.

2.9. FTIR Analysis

Fourier transform infrared spectroscopy (FTIR) was used to identify the functional groups in apple and sour cherry pomace, as well as in plain and fortified biscuit samples, within the 400–4000 cm−1 range [31,32]. Analysis was performed using a Jasco 6300 FTIR spectrometer equipped with a Pike Technologies ATR (Attenuated Total Reflection) diamond crystal accessory. To ensure spectral reproducibility and analytical precision, three spectra were acquired for each sample. The average spectrum was obtained using version 2.0 of the Spectra Manager II software (JASCO, Hachiōji, Tokyo, Japan).

2.10. Statistical Analysis

All determinations were performed in triplicate. UV-Vis spectra were processed using UV WinLab version 2.85 (PerkinElmer, Inc., Shelton, CT, USA) and FTIR spectra were processed using Spectra Manager II version 2.0. To ensure availability and resilience of the spectral data, they were stored on computers connected to the spectrometers, but not to the internet. The colorimetric data were processed using Microsoft Excel 2010 and the results were expressed as the mean ± standard deviation (X ± SD). Statistical analysis was performed using IBM SPSS Statistics 26, which includes two-way ANOVA and Duncan multiple range tests (p < 0.05).

3. Results and Discussion

3.1. Characterisation of Apple and Sour Cherry Pomace

Apple and sour cherry pomace are valuable sources of bioactive compounds that are highly valued for their antioxidant capacity and potential health benefits. These characteristics make them promising ingredients for use in functional food products, as they can increase the nutritional value of the final product while reducing agri-food waste generated during fruit processing. The composition of these pomaces was presented in a previous study [33]. Apple pomace contained 1211.33 mg GAE/100 g of polyphenols, 528.00 mg CE/100 g of flavonoids, and 136.17 mg C3GE/100 g of anthocyanins, exhibiting 70.67% antiradical activity. In contrast, sour cherry pomace contained 1451.66 mg GAE/100 g of polyphenols, 784.33 mg CE/100 g of flavonoids, and 239.62 mg C3GE/100 g of anthocyanins, exhibiting 78.76% antiradical activity.
FTIR spectroscopy was used to analyse the biochemical compounds in apple and sour cherry pomace and identify functional groups and characteristic chemical bonds. Measurements conducted in the 400–4000 cm−1 range provided detailed information on the chemical composition of the two pomace in detail (Table 1 and Figure 1).
The spectra reveal three characteristic regions at 3600–2500 cm−1, 2000–1300 cm−1, and 1300–700 cm−1 (Figure 1). The bands within the 3400–3000 cm−1 range are typically associated with various hydroxyl (OH) stretching vibrations, which are characteristic of alcohols, phenols, and carboxylic acids found in pectin, cellulose, hemicellulose, lignin, and adsorbed moisture. These OH stretching vibrations are highly sensitive to hydrogen bonding, thus depending on the bond strength. The 3000–2900 cm−1 region corresponds to the symmetric and asymmetric stretching vibrations of the C-H groups in CH2 and CH3, as well as the stretching vibration of N-H in both alkyl and aromatic groups [30,34,35]. In the subsequent region, between 1640 and 1720 cm−1, absorption bands related to carboxyl and ester groups are identified [30,32,36]. The presence of amide I (vibrations of C=O and C-N groups) and amide II (primarily N-H bending) within 1700–1500 cm−1 and 1500–1300 cm−1, respectively, confirms the presence of proteins. Peaks observed between 1750 and 1600 cm−1 are associated with the stretching of the amide functional group (-C=O) within lignin ring structures [37]. Variations in the 1400–1100 cm−1 region are due to the bending vibrations of OCH, CCH, and COH groups in carbohydrates [38,39]. The peaks within 1500–1400 cm−1 relate to aromatic C-C stretching, while those around 1385–1375 cm−1 are attributed to alkane C-H stretching vibrations. Peaks indicative of phenolic compounds appear between 1600 and 900 cm−1, with the band near 1640 cm−1 primarily assigned to vibrational modes of C-C bonds in phenolic compounds [40]. In the third region, between 1150 and 700 cm−1, signals from C-O-H, C-O, and C-O-C glycosidic bonds are observed [31,41]. The spectral region below 900 cm−1 constitutes the “fingerprint” zone, reflecting conformational changes in the material’s structure. An increase in peak intensity within the 1600–1000 cm−1 range indicates enhanced carbon bonding [37], while the peak corresponding to aromatic rings (-C-H) appears between 900 and 700 cm−1. As can be seen from the normalised spectra of the two pomaces, the carbohydrate- and lipid-specific bands are more intense in apple pomace, while the protein-specific bands are more intense in sour cherry pomace.

3.2. Characterisation of Biscuits Fortified with Pomace

According to the values in Table 2, the moisture content of biscuits supplemented with different percentages of apple and sour cherry pomace (5%, 10% and 15%) increased in relation to the type and quantity of pomace added. The control sample had a moisture content of 6.83%, whereas biscuits with the maximum addition of apple and sour cherry pomace (15%) had moisture content values of 8.65% and 7.27%, respectively. Similar increases were identified in a study by Usman et al. (2020) [42], in which the moisture content varied from 2.22% to 2.69% following the addition of 5–15% apple pomace. Naseem et al. (2024) [43] observed a similar trend in moisture content depending on the apple pomace concentration, with values ranging from 1.4% (control sample) to 2.8% (sample containing 15% pomace). The moisture content identified in all formulations indicates a long shelf life, since microbial growth is inhibited at levels below 13% [44].
The gluten and starch network was weakened due to the higher percentage of wheat flour substitution with pomace, resulting in a progressive decrease in diameter and height. Compared to the control sample, which had an average height of 10.65 mm and a diameter of 55.77 mm, the height and diameter of the fortified biscuits varied depending on the type and concentration of pomace used. The maximum and minimum heights of biscuits containing 5–15% apple and sour cherry pomace were 10.07–8.73 mm and 9.90–7.57 mm, respectively. The diameters were found to be 54.50–52.03 mm for biscuits containing apple pomace and 53.33–50.80 mm for biscuits containing sour cherry pomace. These results are consistent with those reported by Usman et al. (2020) [42], who found that biscuit diameter and height decreased as the amount of apple pomace increased. They observed a decrease in diameter from 45.13 mm (control sample) to 44.85 mm (sample containing 15% pomace) and in height from 1.47 mm (control sample) to 1.29 mm (sample containing 15% pomace). De Toledo et al. (2017) [45] also observed a decrease in biscuit diameter of between 21.74% and 17.95% when apple pomace was added to the recipe at a level of 5–15%. The height of biscuits is influenced by raising agents (such as baking powder), the steam generated during baking and the thermal denaturation of the gluten network [46]. Therefore, adding any ingredient will disrupt the structure of the biscuits, reducing their height [29]. Using cellulose-rich ingredients instead of wheat flour reduces the gluten content of the dough, resulting in a finished product with a smaller volume [47]. The diameter/height ratio is an important parameter for evaluating biscuit quality, with high values indicating the degree of biscuit deformation. In the present study, this ratio was higher in all formulations containing pomace than in the control sample (5.24). The highest values were found in biscuits with the maximum addition of sour cherry pomace (15%) (6.71), followed by those with apple pomace (5.96). Similar results were observed in studies by Usman et al. (2020) [42] and Naseem et al. (2024) [43], indicating an increase in the diameter/height ratio from 30.70 (control sample) to 34.77 (sample containing 15% pomace) and from 9.50 (control sample) to 10.00 (sample containing 15% pomace), respectively.
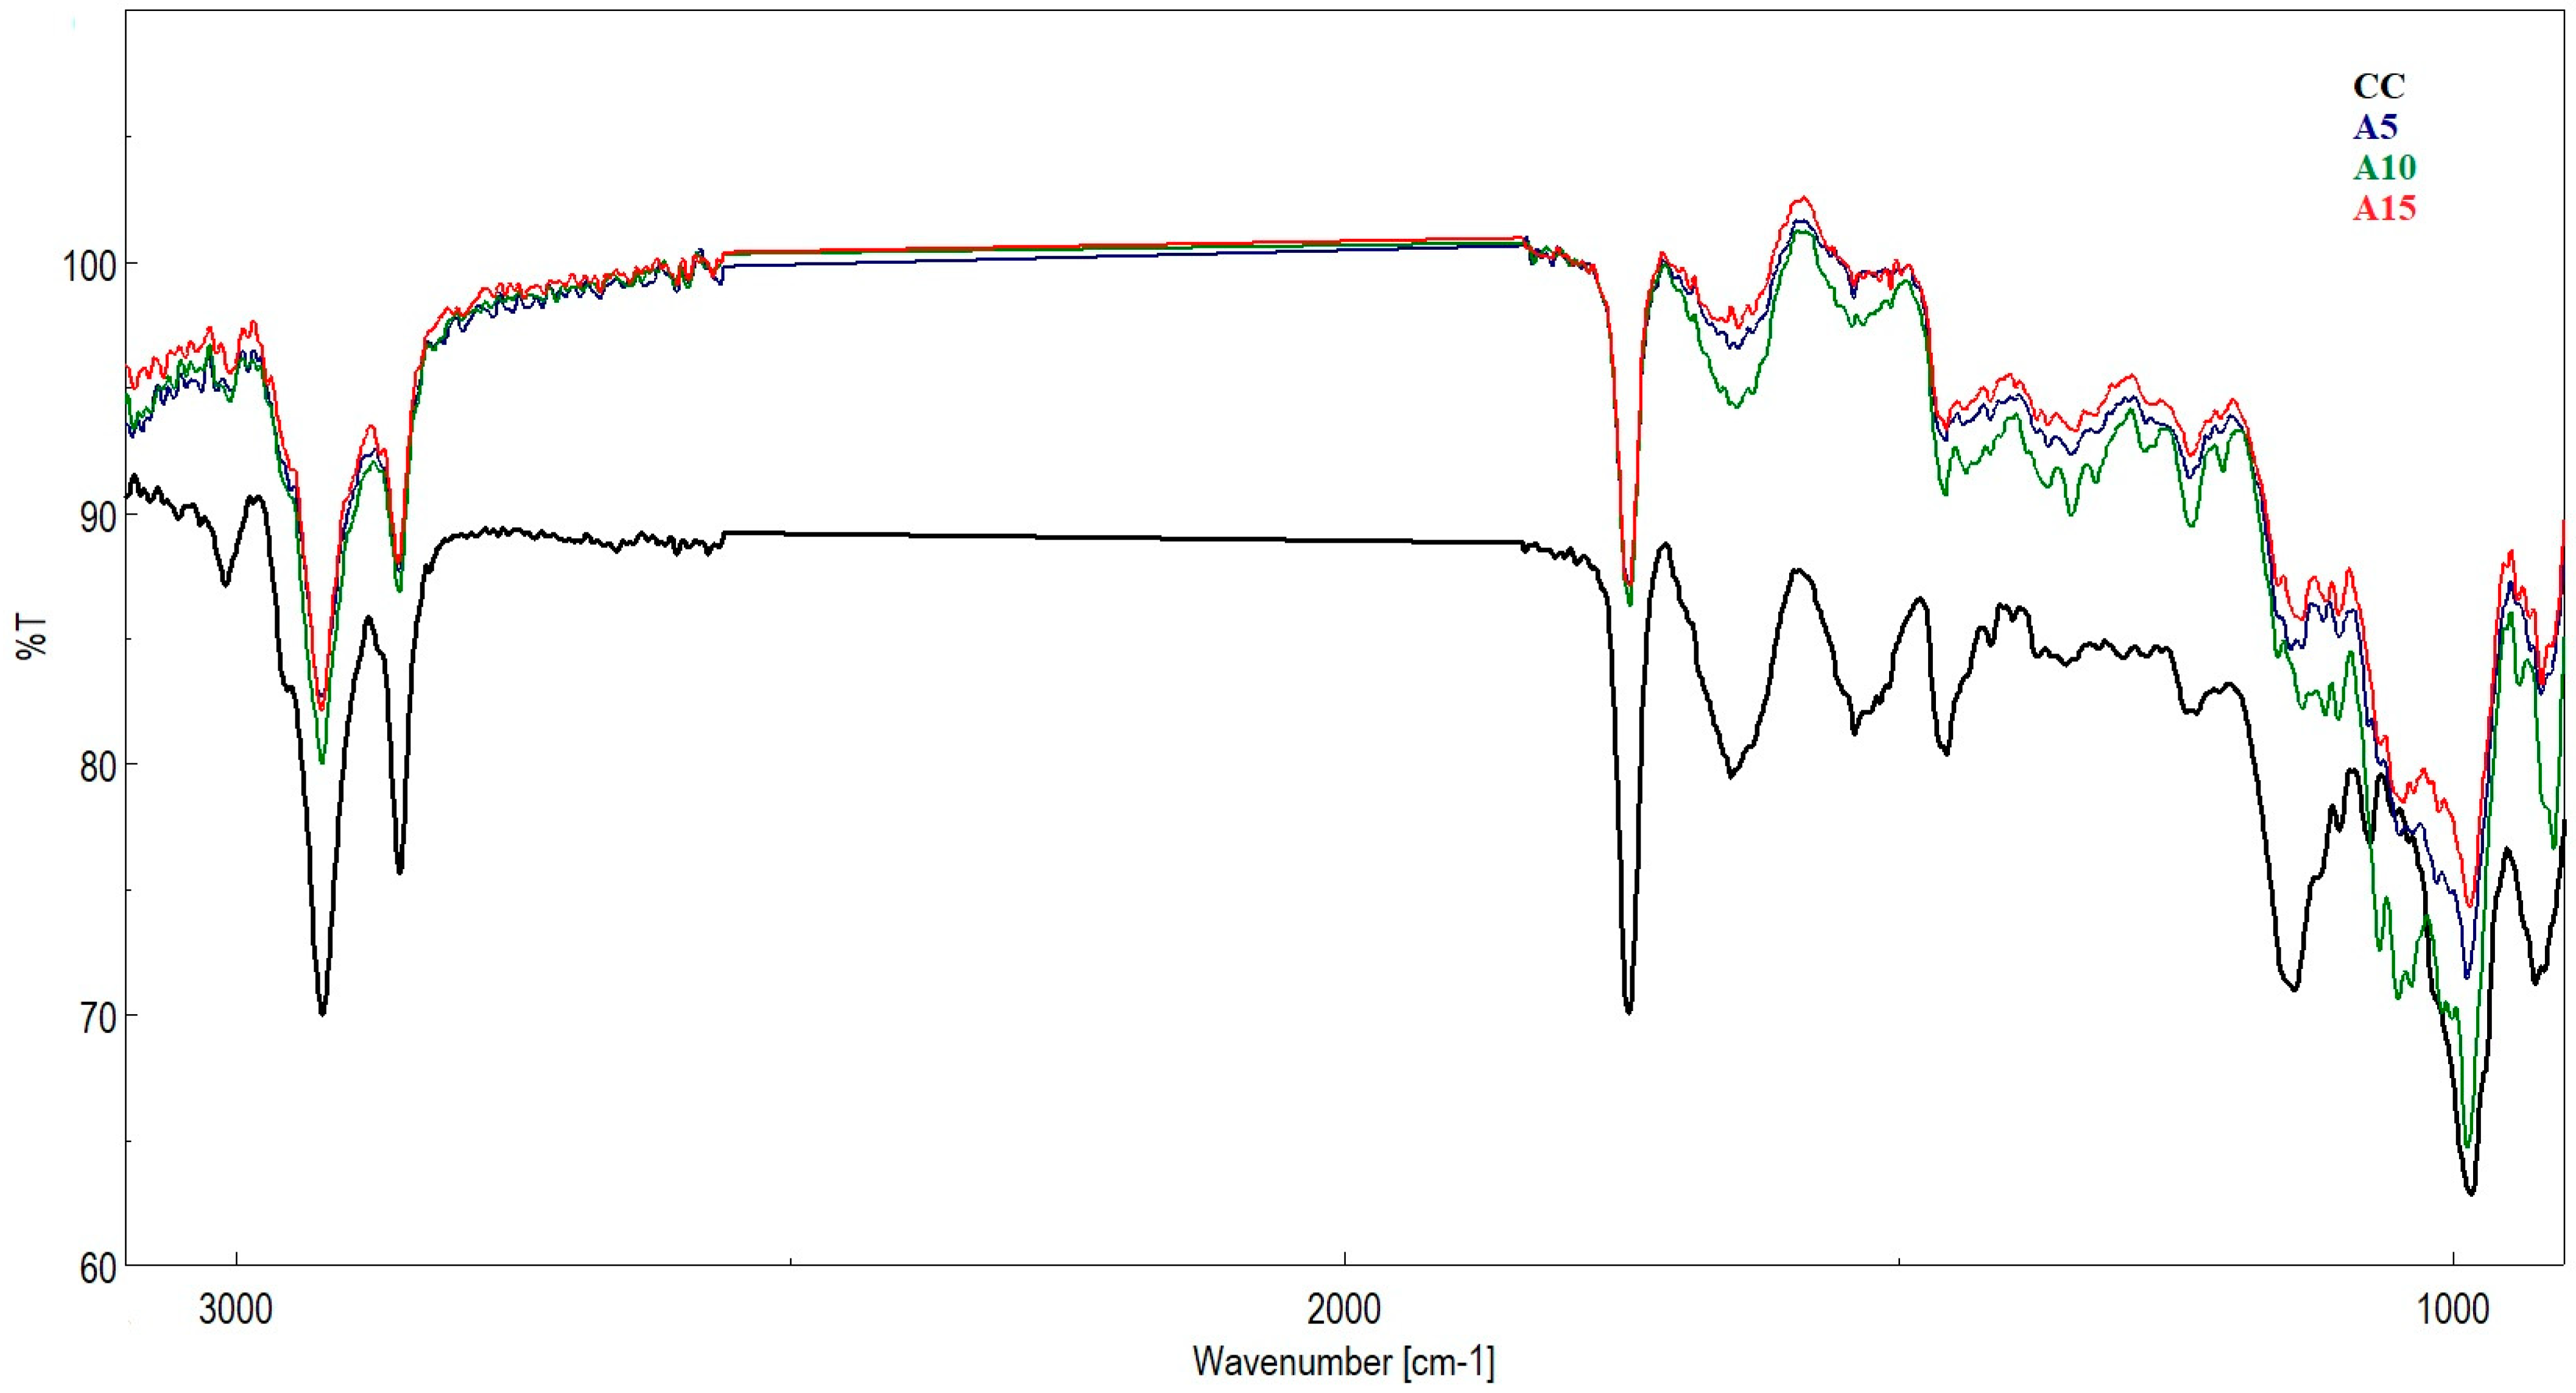
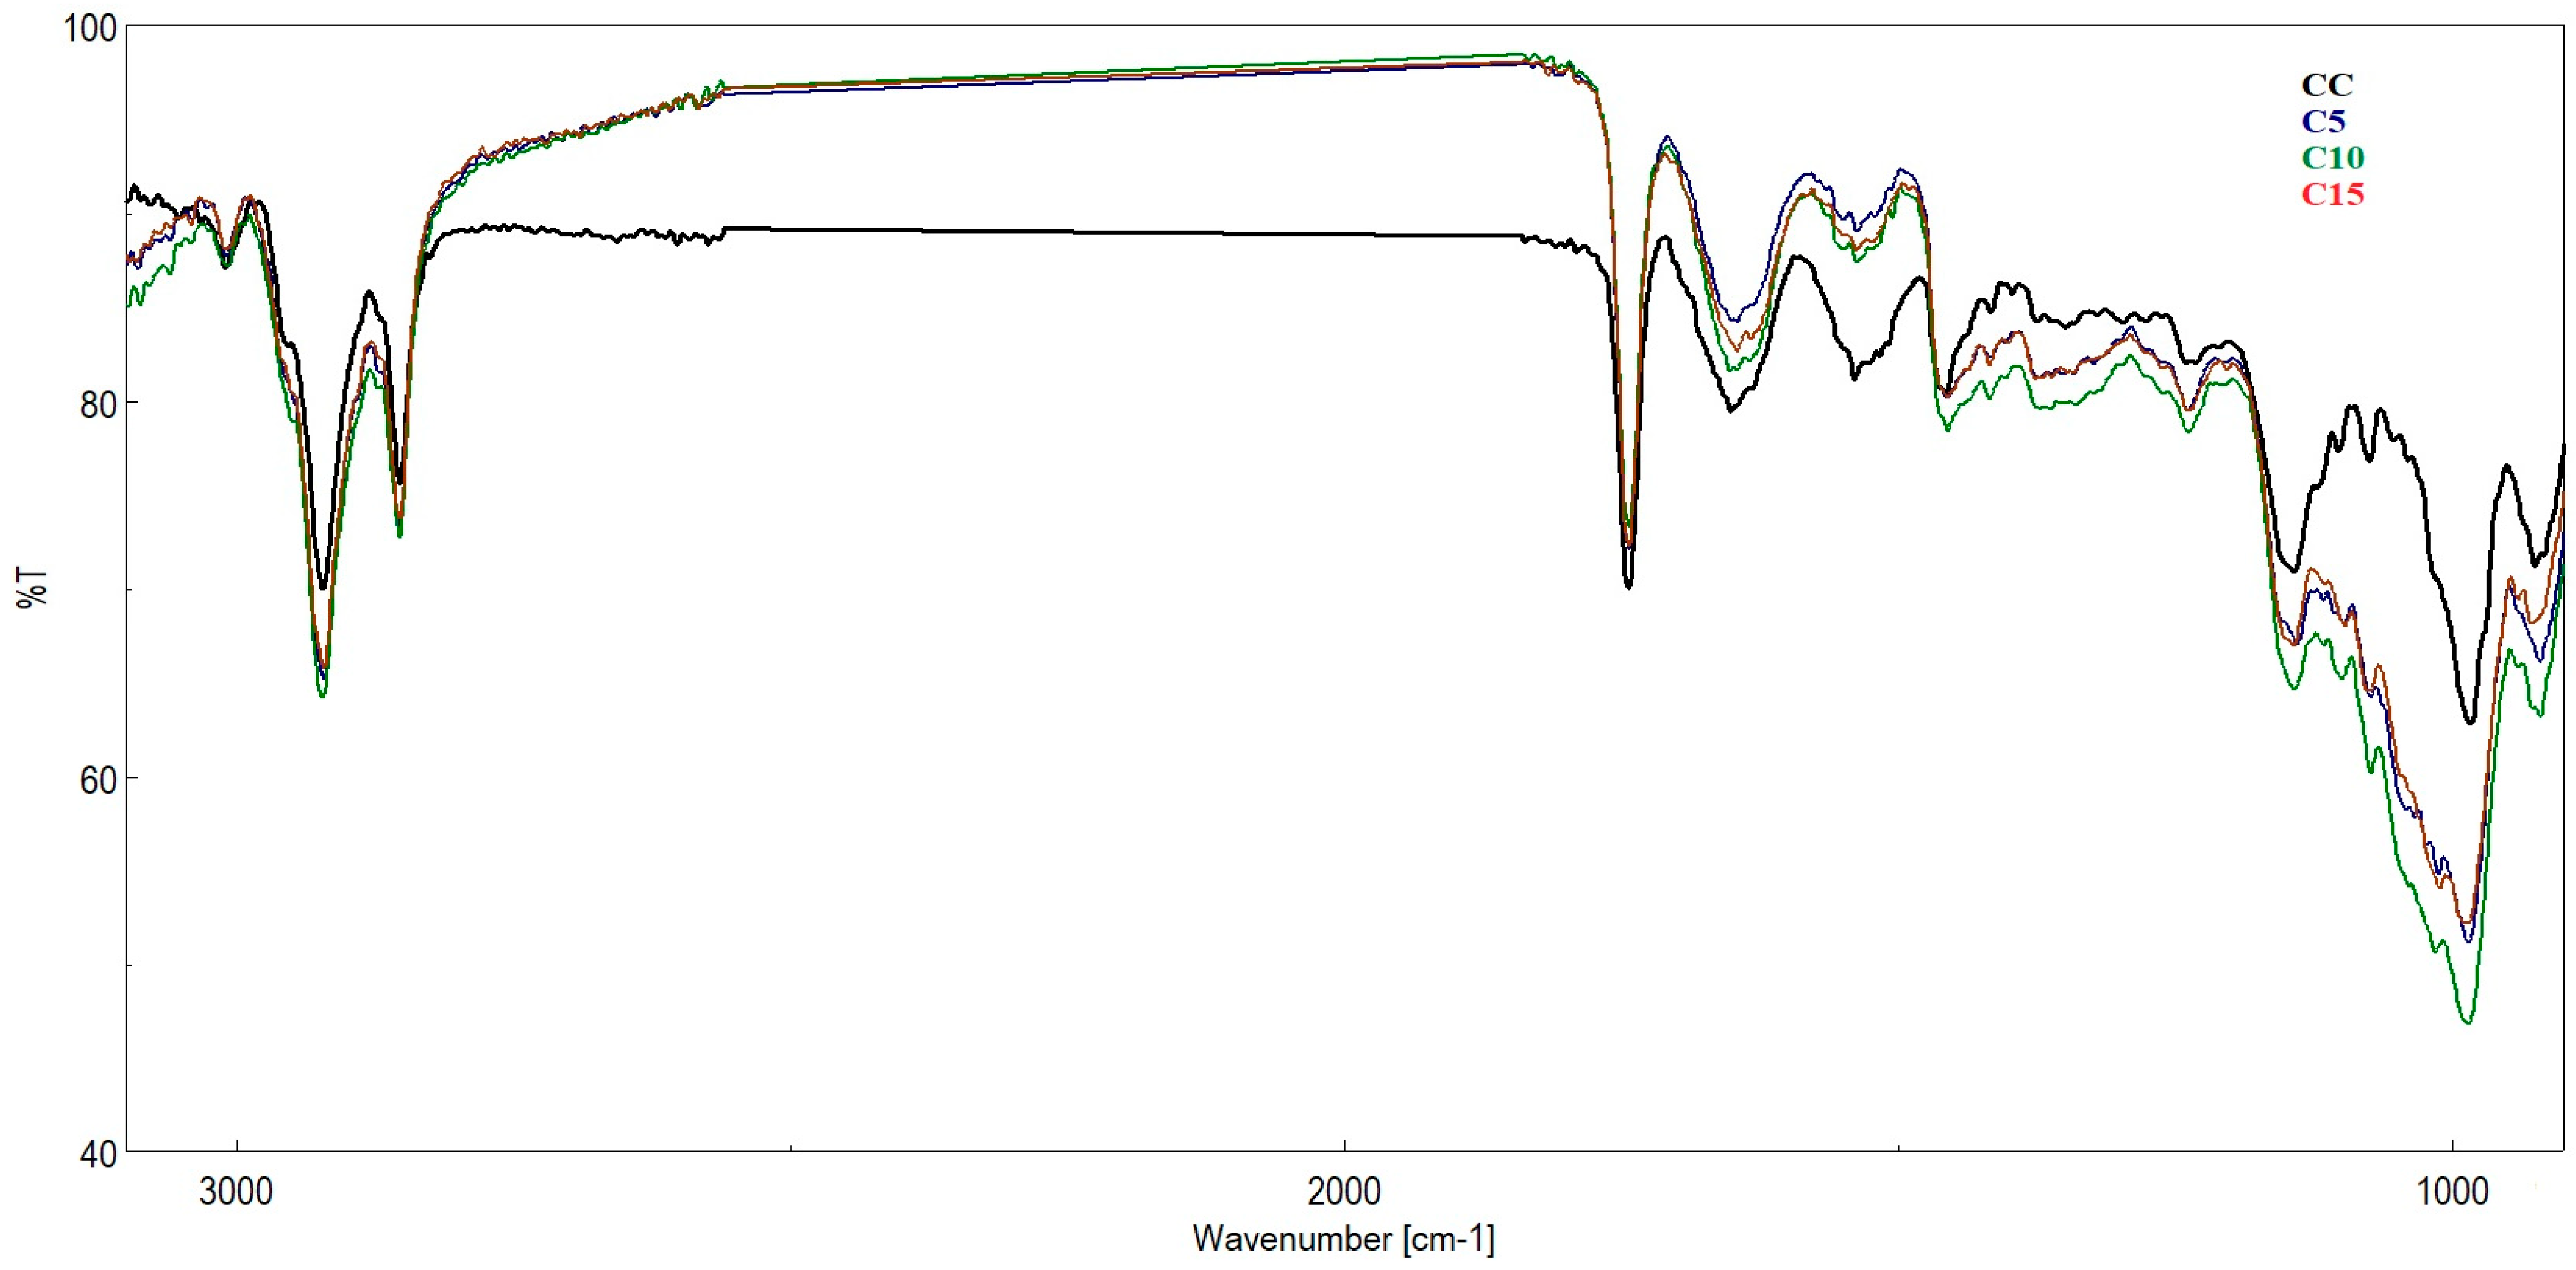
Figure 2 and Figure 3 shows the FTIR spectra of experimental biscuits that were enriched with apple and sour cherry pomace. Despite minor differences in intensity, the biscuit samples exhibited similar spectral bands, as illustrated in Table 3. The most intense peaks were observed in the spectra of the biscuits enriched with 10% apple or sour cherry pomace. Prominent bands were detected at 3000 and 2800 cm−1 across all samples, which correspond to the stretching vibrations of the O–H, N–H, and C–H bonds. The bands observed between 1744 and 1646 cm−1 were associated with the C–O stretching vibration of an α,β-unsaturated compound. Additionally, a band in the vicinity of 1349–2399 cm−1 was linked to C–O stretching as well as C–H and N–H deformation in apple pomace. This was particularly noted in the apple-enriched biscuit samples at 1340–1345 cm−1 and in the sour cherry-enriched biscuit samples at 1362–1374 cm−1 but was absent in the control sample. The FTIR analysis indicated the presence of various bioactive compounds in the formulated biscuits.
The bands detected at 1147–1000 cm−1 correspond to C–O and aliphatic C–N stretching vibrations. Their intensity was greater in biscuits enriched with fruit pomace than in the control (CC), consistent with earlier reports [35,48,49]. These spectral features are indicative of phenolic compounds, β-glycosides, and glucosides [49]. Compared to the control sample, it is evident that the biochemical footprint of carbohydrates is much more prominent in all fortified biscuit samples.
As can be seen in Table 4, the results demonstrate the impact of incorporating different quantities of apple and sour cherry pomace into biscuits on their total polyphenol, flavonoid and sugar content, and their antiradical activity. Increasing the percentage of wheat flour substitution (from 5% to 15%) and the type of pomace used resulted in a progressive and significant increase in these values (p < 0.05). Compared to the control sample (390.21 mg GAE/100 g), adding 5% pomace increased the total polyphenol content to 439.52 mg GAE/100 g for apple pomace biscuits and 445.34 mg GAE/100 g for sour cherry pomace biscuits, representing an increase of 12.63–14.12%. As expected, the highest values for total polyphenol content were identified at the maximum substitution level of 15%: 453.25 mg GAE/100 g for biscuits with added apple pomace and 475.16 mg GAE/100 g for biscuits with added sour cherry pomace. These values represent increases of 16.16% and 21.77%, respectively, compared to the control sample. Additionally, biscuits with sour cherry pomace exhibited significantly higher polyphenol content. Mir et al. [50] observed a similar tendency towards increased polyphenol content in rice biscuits containing apple pomace, ranging from 61 mg GAE/100 g (0%) to 82 mg GAE/100 g (9%). The values identified in this study are higher than those reported by Andrejko et al. [51] and Naseem et al. [43], who found total polyphenol contents in apple pomace biscuits of 66–71 mg GAE/100 g (5–10%) and 65–94 mg GAE/100 g (5–15%), respectively. This variability is attributed to the controlled dehydration process of the pomace at 60 °C and the optimisation of the extraction parameters for bioactive compounds in plain and enriched biscuits [30].
Regarding the flavonoid concentration (Table 4), the control sample had a lower content (120.13 mg CE/100 g) than the formulations supplemented with pomace. Increasing the pomace content from 5% to 15% resulted in increases of 164.17–180.23 mg CE/100 g for apple pomace biscuits and 178.80–204.10 mg CE/100 g for sour cherry pomace biscuits. Therefore, increasing the pomace content from 5% to 15% had a positive effect on the biscuits, gradually raising the total flavonoid content to 36.66–50.02% and 48.87–69.89%, respectively. This highlights the efficiency with which flavonoid compounds are transferred from pomace to the finished product matrix. The same trend was observed in research by Mir et al. [50], where the total flavonoid content of biscuits containing apple pomace ranged from 5549 mg CE/100 g (control sample) to 6316 mg CE/100 g (sample containing 9% pomace). The variability of these results can be associated both with the biochemical diversity of pomace and with the applied addition [52].
The total anthocyanin content (Table 4) was higher in biscuits containing sour cherry pomace than in those containing apple pomace. Replacing 5% of the flour with pomace increased the content to between 24.84 and 26.72 mg C3GE/100 g, compared to the control sample which had the lowest values, at 18.78 mg C3GE/100 g. The most significant increases were observed when 15% of the flour was replaced with pomace. Contents fluctuated between 26.58 and 28.58 mg C3GE/100 g, representing a percentage increase of 41.53–52.18%. The high anthocyanin content detected in biscuits fortified with apple and cherry pomace, as opposed to the control sample, is directly attributable to the presence of these compounds in the pomace.
Progressive integration of pomace into the biscuit composition increased the total sugar content. The highest concentrations were observed when 15% pomace was added (44.63 and 46.31 g GluE/100 g), and the lowest when 5% was added (43.57 and 44.50 g GluE/100 g). Compared to the control sample (39.16 g GluE/100 g), biscuits containing apple pomace had the highest total sugar content, increasing by 13.63–18.25%. Biscuits with sour cherry pomace followed, showing an increase of 11.26–13.96%.
The control sample exhibited the lowest level of antiradical activity at 18.77%. Significant increases in antiradical activity were observed when different types and concentrations of pomace were added. Adding 5% pomace resulted in inhibition levels ranging from 20.20% for apple pomace biscuits to 22.79% for sour cherry pomace biscuits. As the concentration of pomace increased, antiradical activity reached maximum values of 30.80% in biscuits containing 15% apple pomace and 26.57% in biscuits containing 15% sour cherry pomace. Similar results were observed in biscuits fortified with peach pomace, with the highest antiradical activity (27.21%) recorded in samples containing 15% pomace [30]. Due to its ability to increase the content of bioactive compounds and the antioxidant capacity of finished products, pomace has considerable potential as an ingredient in functional foods.
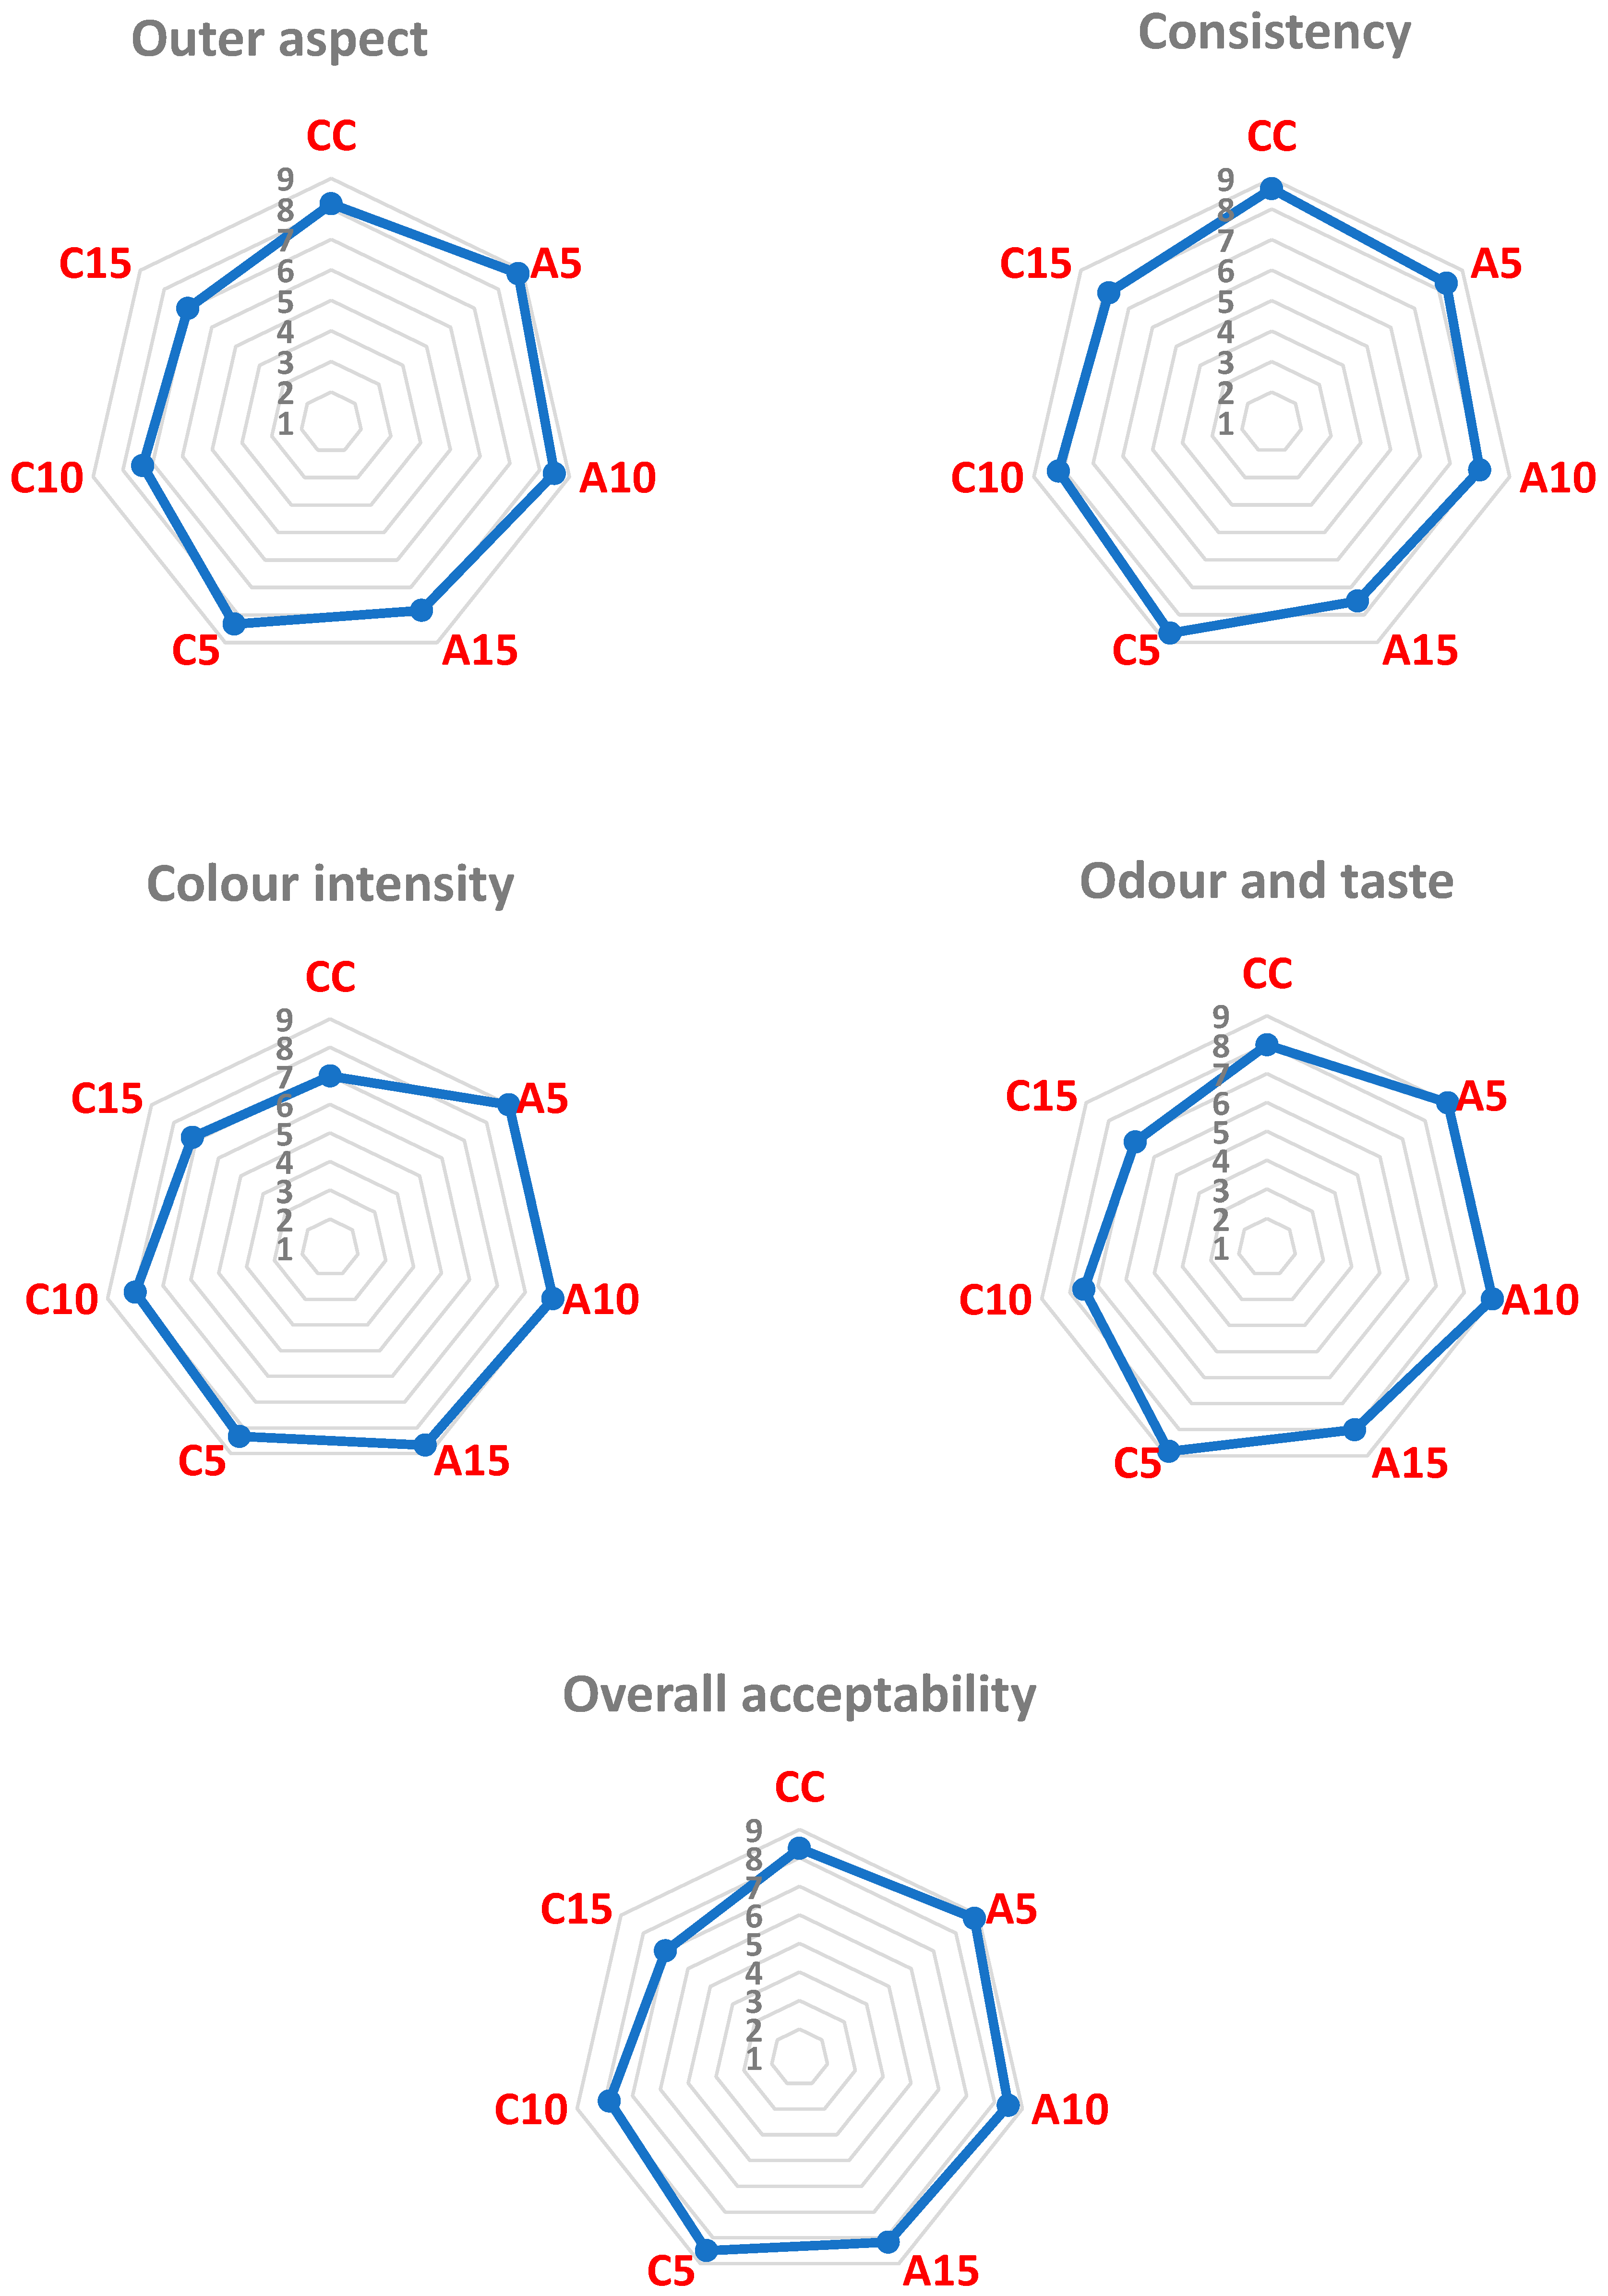
Sensory analysis revealed that the fruit pomace had a significant impact on the final formulations, with scores varying depending on the monitored sensory parameters (Figure 4). Overall, the formulated biscuits had a specific format, characterised by a uniform, semi-glossy, ruddy surface. In terms of their internal appearance, they were evenly baked, with consistent layers and fine porosity and no voids. In terms of outer aspect, biscuits containing 5% or 10% apple pomace (8.83–8.50) or 5% sour cherry pomace (8.33) were rated higher than the control sample (8.17). The lowest values were recorded in formulations containing 15% sour cherry pomace (7—moderately pleasant). Lower scores were recorded in terms of consistency, except for the biscuits with the addition of 5% sour cherry pomace, which obtained scores like the control sample. By contrast, an increase in scores was observed for colour intensity, as well as for odour and taste, when compared with the control sample. Colour intensity was particularly well-received in biscuits containing 5% or 10% apple pomace, which received the highest ratings (9). This contrasted with those that contained 15% sour cherry pomace, which received the lowest score (7.17). The taste and odour of the samples containing 5–10% apple pomace were favourably evaluated (9 points), but the scores decreased considerably for those containing 15% sour cherry pomace (7 points). Following an evaluation of general acceptability, the highest scores were obtained by formulations supplemented with 5–10% apple pomace (8.83–8.50) and 5% sour cherry pomace (8.50), while the lowest score was obtained by those with 15% sour cherry pomace (7.00).
The ratings given to each biscuit assortment show that pomace significantly influenced the monitored parameters both positively and negatively. Using pomace concentrations of 5% and 10% produced promising results, improving sensory characteristics such as colour, odour, and taste compared to the control sample. At a flour substitution level of 15%, the perception of the formulated products was slightly affected. A minimum acceptance level of 7 (moderately pleasant) was achieved, indicating a favourable reaction from participating consumers. Our results are consistent with those reported by Kohajdová et al. (2014) [53], who found that adding 5% apple pomace powder did not significantly alter the odour or taste of biscuits compared to the control sample. Furthermore, several authors [47,53,54,55] stated that the integration of pomace into the composition of biscuits can improve their aroma and taste, allowing both a reduction in the level of added sugar and the use of flavouring ingredients. Thus, it can be concluded that the acceptability of wheat products enriched with dried fruits directly depends directly on the quantity added. Consequently, optimisation and strict control of the proportion of added pomace are required. For example, adding more than 20% pomace was found to produce heterogeneous, crumbly dough [56].

4. Conclusions

The results of this research highlight the potential of using apple and sour cherry pomace as a source of biochemical compounds. Integrating it into the biscuit manufacturing recipe at variable proportions (5%, 10% and 15%) resulted in a progressive increase in total sugar, polyphenol, flavonoid and anthocyanin content as the percentage of flour replaced by apple or sour cherry powder increased. The type of pomace used had a significant impact on the nutritional profile: sour cherry pomace biscuits had a higher polyphenol, flavonoid and anthocyanin content. Apple pomace biscuits had a higher sugar content and more pronounced anti-radical activity. Therefore, using both types of pomace in biscuit recipes is consistent with the principles of the circular economy, as it promotes the sustainable recovery of residues from fruit processing and reduces food waste in the fruit juice industry.
By FTIR spectroscopy, the bioactive compounds present in apple and sour cherry pomace were also identified in the biscuit samples (vibration range 1105–1000 cm−1, 1340–1376 cm−1 and at around 1418 cm−1).

Author Contributions

Conceptualization, M.B.M. and S.C.; methodology, C.M.T. and L.E.V.; software, M.B.M., C.M.T. and L.E.V.; validation, M.B.M., L.E.V. and S.C.; investigation, M.B.M. and L.E.V.; writing—original draft preparation, M.B.M., C.M.T. and L.E.V.; writing—review and editing, M.B.M. and S.C.; supervision, S.C. All authors have read and agreed to the published version of the manuscript.

Funding

This research received no external funding.

Institutional Review Board Statement

Not applicable.

Informed Consent Statement

Not applicable.

Data Availability Statement

The original contributions presented in this study are included in the article. Further inquiries can be directed to the corresponding authors.

Conflicts of Interest

The authors declare no conflicts of interest.

References

  1. Cassani, L.; Gomez-Zavaglia, A. Sustainable food systems in fruits and vegetables food supply chains. Front. Nutr. 2022, 9, 829061. [Google Scholar] [CrossRef]
  2. Maina, S.; Kachrimanidou, V.; Koutinas, A. A roadmap towards a circular and sustainable bioeconomy through waste valorization. Curr. Opin. Green Sustain. Chem. 2017, 8, 18–23. [Google Scholar] [CrossRef]
  3. Despeisse, M.; Ball, P.D.; Evans, S. Strategies and ecosystem view for industrial sustainability. In Re-Engineering Manufacturing for Sustainability; Nee, A., Song, B., Ong, S.K., Eds.; Springer: Singapore, 2013. [Google Scholar] [CrossRef]
  4. Esturo, A.; Lizundia, E.; Sáez de Cámara, E. Fruit juice industry’s transition towards sustainability from the viewpoint of the producers. Sustainability 2023, 15, 3066. [Google Scholar] [CrossRef]
  5. Scarlat, N.; Dallemand, J.-F.; Monforti-Ferrario, F.; Nita, V. The role of biomass and bioenergy in a future bioeconomy: Policies and facts. Environ. Dev. 2015, 15, 3–34. [Google Scholar] [CrossRef]
  6. Castangia, I.; Aroffu, M.; Fulgheri, F.; Abi Rached, R.; Corrias, F.; Sarais, G.; Bacchetta, G.; Argiolas, F.; Pinna, M.B.; Murru, M.; et al. From Field to Waste Valorization: A preliminary study exploring the impact of the wine supply chain on the phenolic profile of three sardinian pomace extracts. Foods 2024, 13, 1414. [Google Scholar] [CrossRef]
  7. Cifuentes-Faura, J. European Union policies and their role in combating climate change over the years. Air Qual. Atmos. Health 2022, 15, 1333–1340. [Google Scholar] [CrossRef] [PubMed]
  8. Sha, S.P.; Modak, D.; Sarkar, S.; Roy, S.K.; Sah, S.P.; Ghatani, K.; Bhattacharjee, S. Fruit Waste: A current perspective for the sustainable production of pharmacological, nutraceutical, and bioactive resources. Front. Microbiol. 2023, 14, 1260071. [Google Scholar] [CrossRef]
  9. Tonelli, F.; Evans, S.; Taticchi, P. Industrial sustainability: Challenges, perspectives, actions. Int. J. Bus. Innov. Res. 2013, 7, 143–163. [Google Scholar] [CrossRef]
  10. Idowu, A.T.; Igiehon, O.O.; Adekoya, A.E.; Idowu, S. Dates palm fruits: A review of their nutritional components, bioactivities and functional food applications. AIMS Agric. Food 2020, 5, 734–755. [Google Scholar] [CrossRef]
  11. Bernstein, M.; Muniz, N. Position of the Academy of Nutrition and Dietetics: Food and nutrition for older adults: Promoting health and wellness. J. Acad. Nutr. Diet. 2012, 112, 1255–1277. [Google Scholar] [CrossRef] [PubMed]
  12. Dillard, C.J.; German, J.B. Phytochemicals: Nutraceuticals and human health. J. Sci. Food Agric. 2000, 80, 1744–1756. [Google Scholar] [CrossRef]
  13. Iqbal, A.; Schulz, P.; Rizvi, S.S.H. Valorization of bioactive compounds in fruit pomace from agro-fruit industries: Present Insights and future challenges. Food Biosci. 2021, 44, 101384. [Google Scholar] [CrossRef]
  14. Rațu, R.N.; Veleșcu, I.D.; Stoica, F.; Usturoi, A.; Arsenoaia, V.N.; Crivei, I.C.; Postolache, A.N.; Lipșa, F.D.; Filipov, F.; Florea, A.M.; et al. Application of agri-food by-products in the food industry. Agriculture 2023, 13, 1559. [Google Scholar] [CrossRef]
  15. Venkidasamy, B.; Samynathan, R.; Ramasamy, P.; Kumar, M.S.; Thiruvengadam, M.; Khayrullin, M.; Shariati, M.A.; Nile, A.S.; Nile, S.H. Unveiling novel applications of fruit pomace for sustainable production of value-added products and health benefits: A review. Food Biosci. 2024, 61, 104533. [Google Scholar] [CrossRef]
  16. Pedro, A.C.; Maciel, G.M.; Lima, N.P.; Lima, N.F.; Ribeiro, I.S.; Pinheiro, D.F.; Haminiuk, C.W.I. Valorization of bioactive compounds from juice industry waste: Applications, challenges, and future prospects. Trends Food Sci. Technol. 2024, 152, 104693. [Google Scholar] [CrossRef]
  17. Argun, M.E.; Ateş, H.; Argun, M.Ş.; Cakmakcı, Ö. Management of sour cherry processing industry waste water by super critical fluid method: Sequential recovery and treatment. Process Saf. Environ. Protect. 2025, 199, 107318. [Google Scholar] [CrossRef]
  18. Vidović, S.; Horecki, A.T.; Vladić, J.; Šumić, Z.; Gavarić, A.; Vakula, A. Apple. In Valorization of Fruit Processing by-Products; Galanakis, C.M., Ed.; Academic Press: Cambridge, MA, USA; Elsevier: Amsterdam, The Netherlands, 2020; pp. 17–42. [Google Scholar] [CrossRef]
  19. Kraciński, P.; Stolarczyk, P.; Czerwińska, W.; Nosecka, B. Fruit consumption habits and apple preferences of university students in Poland. Foods 2025, 14, 2073. [Google Scholar] [CrossRef] [PubMed]
  20. Gołębiewska, E.; Kalinowska, M.; Yildiz, G. Sustainable use of apple pomace (AP) in different industrial sectors. Materials 2022, 15, 1788. [Google Scholar] [CrossRef] [PubMed]
  21. Moreno-González, M.; Ottens, M. A structured approach to recover valuable compounds from agri-food side streams. Food Bioprocess Technol. 2021, 14, 1387–1406. [Google Scholar] [CrossRef]
  22. Kauser, S.; Murtaza, M.A.; Hussain, A.; Imran, M.; Kabir, K.; Najam, A.; An, Q.U.; Akram, S.; Fatima, H.; Batool, S.A.; et al. Apple pomace, a bioresource of functional and nutritional components with potential of utilization in different food formulations: A review. Food Chem. Adv. 2024, 4, 100598. [Google Scholar] [CrossRef]
  23. Fidelis, M.; de Moura, C.; Kabbas Junior, T.; Pap, N.; Mattila, P.; Mäkinen, S.; Putnik, P.; Bursać Kovačević, D.; Tian, Y.; Yang, B.; et al. Fruit seeds as sources of bioactive compounds: Sustainable production of high value-added ingredients from by-products within circular economy. Molecules 2019, 24, 3854. [Google Scholar] [CrossRef]
  24. Piasecka, I.; Górska, A. Possible uses of fruit pomaces in food technology as a fortifying additive—A review. Zesz. Probl. Postęp. Nauk. Rol. 2020, 600, 43–54. [Google Scholar] [CrossRef]
  25. Friant, M.C.; Vermeulen, W.J.V.; Salomone, R. Analysing European Union circular economy policies: Words versus actions. Sustain. Prod. Consum. 2021, 27, 337–353. [Google Scholar] [CrossRef]
  26. Kassim, F.O.; Thomas, C.L.P.; Afolabi, O.O.D. Integrated conversion technologies for sustainable agri-food waste valorization: A critical review. Biomass Bioenergy 2022, 156, 106314. [Google Scholar] [CrossRef]
  27. Ghadam, M.S.; Asl, M.R.S.; Sharifi, A.; Nia, A.P.; Armin, M. Effect of apple pomace powder addition on the physicochemical properties of oily cakes and ranking samples by Delphi Fuzzy Approach. J. Food Qual. 2023, 2023, 8111233. [Google Scholar] [CrossRef]
  28. Lau, K.Q.; Sabran, M.R.; Shafie, S.R. Utilization of vegetable and fruit by-products as functional ingredient and food. Front. Nutr. 2021, 8, 661693. [Google Scholar] [CrossRef]
  29. Filipović, V.; Lončar, B.; Filipović, J.; Nićetin, M.; Knežević, V.; Šeregelj, V.; Košutić, M.; Bodroža Solarov, M. Addition of Combinedly Dehydrated Peach to the Cookies—Technological Quality Testing and Optimization. Foods 2022, 11, 1258. [Google Scholar] [CrossRef] [PubMed]
  30. Mandache, M.; Topală, C.M.; Vijan, L.E.; Cosmulescu, S. The characterization of peach pomace and the influence of its incorporation on the chemical composition of biscuits. Appl. Sci. 2025, 15, 6983. [Google Scholar] [CrossRef]
  31. Topală, C.M.; Ducu, C. Spectroscopic study of sea buckthorn extracts. Curr. Trends Nat. Sci. 2014, 3, 48–53. [Google Scholar]
  32. Topală, C.M.; Rusea, I. Analysis of leaves using FTIR spectroscopy and principal component analysis. Discrimination of different plant samples. Curr. Trends Nat. Sci. 2018, 7, 286–291. [Google Scholar]
  33. Mandache, M.B.; Vijan, L.E.; Cosmulescu, S. The influence of extraction time on concentration of bioactive compounds in apple and sour cherry pomace: A need for optimization. AgroLife Sci. J. 2025, 14, 98–107. [Google Scholar]
  34. Topală, C.M.; Vîjan, L.E.; Giura, S.; Botu, M. Attenuated total reflection Fourier transform infrared (ATR-FTIR): A method for the biochemical study of walnut leaves. Curr. Trends Nat. Sci. 2020, 9, 266–272. [Google Scholar] [CrossRef]
  35. Stamin, F.D.; Vijan, L.E.; Topală, C.M.; Cosmulescu, S.N. The influence of genotype, environmental factors, and location on the nutraceutical profile of Rosa canina L. fruits. Agronomy 2024, 14, 2847. [Google Scholar] [CrossRef]
  36. Pancerz, M.; Ptaszek, A.; Sofińska, K.; Barbasz, J.; Szlachcic, P.; Kucharek, M.; Łukasiewicz, M. Colligative and hydrodynamic properties of aqueous solutions of pectin from cornelian cherry and commercial apple pectin. Food Hydrocoll. 2019, 89, 406–415. [Google Scholar] [CrossRef]
  37. Gomravi, Y.; Karimi, A.; Azimi, H. Adsorption of heavy metal ions via apple waste low-cost adsorbent: Characterization and performance. Korean J. Chem. Eng. 2021, 38, 1843–1858. [Google Scholar] [CrossRef]
  38. Athmaselvi, K.A.; Kumar, C.; Balasubramanian, M.; Roy, I. Thermal, structural, and physical properties of freeze dried tropical fruit powder. J. Food Process. 2014, 2014, 524705. [Google Scholar] [CrossRef]
  39. Kumar, P.S.; Keran, D.A.; Pushpavalli, S.; Shiva, K.N.; Uma, S. Effect of cellulose and gum derivatives on physicochemical, microstructural and prebiotic properties of foam-mat driedred banana powder. Int. J. Biol. Macromol. 2022, 218, 44–56. [Google Scholar] [CrossRef]
  40. Sarabandi, K.; Jafari, S.M.; Mahoonak, A.S.; Mohammadi, A. Application of gum Arabic and maltodextrin for encapsulation of eggplant peel extract as a natural antioxidant and color source. Int. J. Biol. Macromol. 2019, 140, 59–68. [Google Scholar] [CrossRef]
  41. Stamin, F.D.; Topală, C.M.; Mazilu, I.C.; Badea, G.I.; Vijan, L.E.; Cosmulescu, S. Optimization of phenolic compounds extraction from Crataegi fructus. Appl. Sci. 2025, 15, 9525. [Google Scholar] [CrossRef]
  42. Usman, M.; Ahmed, S.; Mehmood, A.; Bilal, M.; Patil, P.J.; Akram, K.; Farooq, U. Effect of apple pomace on nutrition, rheology of dough and cookies quality. J. Food Sci. Technol. 2020, 57, 3244–3251. [Google Scholar] [CrossRef]
  43. Naseem, Z.; Bhat, N.A.; Mir, S.A. Valorisation of apple pomace for the development of high-fibre and polyphenol-rich wheat flour cookies. Sci. Rep. 2024, 14, 25912. [Google Scholar] [CrossRef]
  44. Bustos, M.C.; Perez, G.T.; Leon, A.E. Structure and quality of pasta enriched with functional ingredients. RSC Adv. 2015, 5, 30780–30792. [Google Scholar] [CrossRef]
  45. De Toledo, N.M.V.; Nunes, L.P.; Da Silva, P.P.M.; Spoto, M.H.F.; Canniatti-Brazaca, S.G. Influence of pineapple, apple and melon by-products on cookies: Physicochemical and sensory aspects. Int. J. Food Sci. Technol. 2017, 52, 1185–1192. [Google Scholar] [CrossRef]
  46. Mamat, H.; Hardan, M.O.A.; Hill, S.E. Physicochemical properties of commercial semi-sweet biscuit. Food Chem. 2010, 121, 1029–1038. [Google Scholar] [CrossRef]
  47. Salehi, F.; Aghajanzadeh, S. Effect of dried fruits and vegetables powder on cakes quality: A review. Trends Food Sci. Tech. 2020, 95, 162–172. [Google Scholar] [CrossRef]
  48. Zarroug, Y.; Sriti, J.; Sfayhi, D.; Slimi, B.; Allouch, W.; Zayani, K.; Hammami, K.; Sowalhia, M.; Kharrat, M. Effect of addition of Tunisian Zizyphus lotus L. fruits on nutritional and sensory qualities of cookies. Ital. J. Food Sci. 2021, 33, 84–97. [Google Scholar] [CrossRef]
  49. Tyagi, P.; Chauhan, A.K.; Aparna. Optimization and characterization of functional cookies with addition of Tinospora cordifolia as a source of bioactive phenolic antioxidants. LWT—Food Sci. Technol. 2020, 130, 109639. [Google Scholar] [CrossRef]
  50. Mir, S.A.; Bosco, S.J.D.; Shah, M.A.; Santhalakshmy, S.; Mir, M.M. Effect of apple pomace on quality characteristics of brown rice based cracker. J. Saudi Soc. Agric. Sci. 2017, 16, 25–32. [Google Scholar] [CrossRef]
  51. Andrejko, D.; Blicharz-Kania, A.; Krajewska, M.; Sagan, A.; Pastusiak, M.; Ociesa, M. The influence of the use of carrot and apple pomace on changes in the physical characteristics and nutritional quality of oat cookies. Processes 2024, 12, 2063. [Google Scholar] [CrossRef]
  52. Skinner, R.C.; Gigliotti, J.C.; Ku, K.M.; Tou, J.C. A comprehensive analysis of the composition, health benefits, and safety of apple pomace. Nutr. Rev. 2018, 76, 893–909. [Google Scholar] [CrossRef] [PubMed]
  53. Kohajdová, Z.; Karovičová, J.; Magala, M.; Kuchtová, V. Effect of apple pomace powder addition on farinographic properties of wheat dough and biscuits quality. Chem. Pap. 2014, 68, 1059–1065. [Google Scholar] [CrossRef]
  54. Dhingra, D.; Michael, M.; Rajput, H.; Patil, R.T. Dietary fibre in foods: A review. J. Food Sci. Technol. 2012, 49, 255–266. [Google Scholar] [CrossRef]
  55. Uchoa, A.M.A.; Correia da Costa, J.M.; Maia, G.A.; Meira, T.R.; Sousa, P.H.M.; Montenegro Brasil, I. Formulation and physicochemical and sensorial evaluation of biscuit-type cookies supplemented with fruit powders. Plant Foods Hum. Nutr. 2009, 64, 153–159. [Google Scholar] [CrossRef] [PubMed]
  56. Das Chagas, E.G.L.; Vanin, F.M.; Dos Santos Garcia, V.A.; Yoshida, C.M.P.; De Carvalho, R.A. Enrichment of antioxidants compounds in cookies produced with camu-camu (Myrciaria dubia) coproducts powders. LWT 2021, 137, 110472. [Google Scholar] [CrossRef]
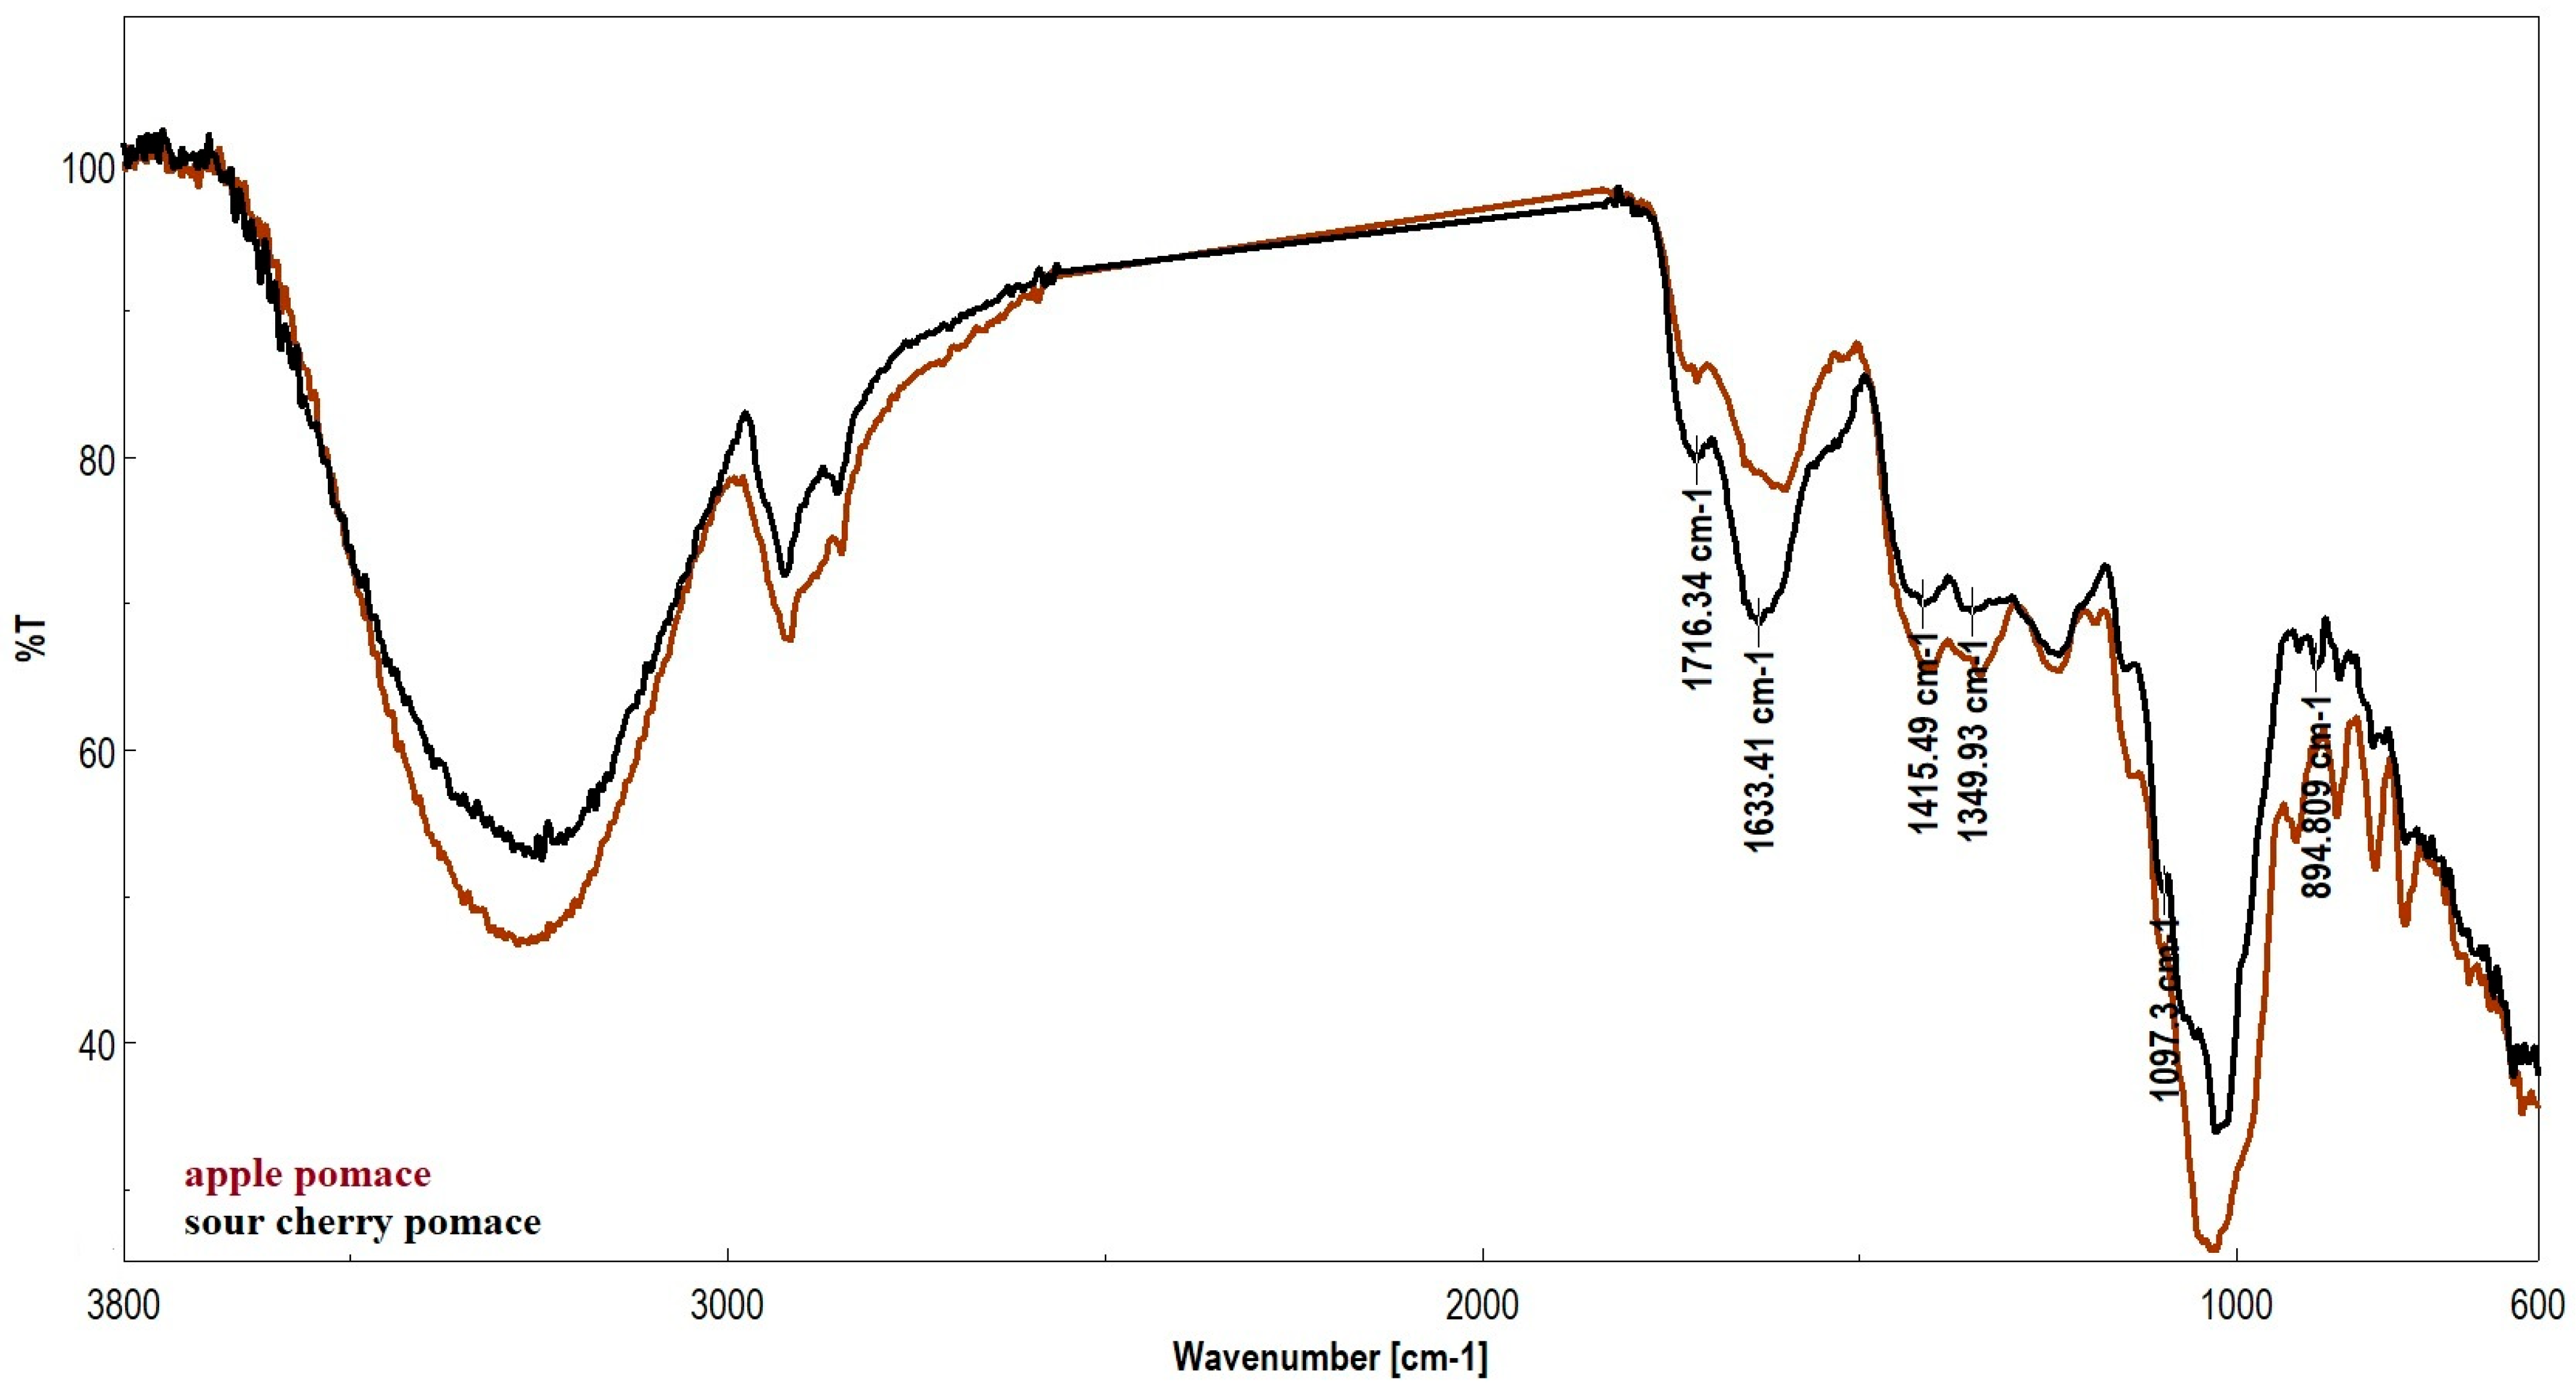
Figure 1. ATR-FTIR spectra of apple and sour cherry pomace.
Applsci 15 11823 g001
Figure 2. FTIR spectra of biscuit samples. ‘CC’ refers to the control biscuits, while ‘A5’, ‘A10’ and ‘A15’ refer to biscuit samples containing 5%, 10% and 15% apple pomace, respectively.
Applsci 15 11823 g002
Figure 3. FTIR spectra of biscuit samples. ‘CC’ refers to the control biscuits, while ‘C5’, ‘C10’ and ‘C15’ refer to biscuit samples containing 5%, 10% and 15% sour cherry pomace, respectively.
Applsci 15 11823 g003
Figure 4. Sensory analysis of biscuits supplemented with apple and sour cherry pomace, as assessed by a hedonic test. ‘CC’ refers to the control biscuits. ‘A5’, ‘A10’ and ‘A15’ refer to biscuit samples containing 5%, 10% and 15% apple pomace, respectively. ‘C5’, ‘C10’ and ‘C15’ refer to biscuit samples containing 5%, 10% and 15% sour cherry pomace, respectively.
Applsci 15 11823 g004
Table 1. Correlation between FTIR bands and functional compounds in apple and sour cherry pomace.
Samples Wavenumber (cm−1)Attributions
AppleSour CherryFunctional GroupingVibration TypeCorresponding Compounds
32783256–OH (Hydroxyl)Stretching Water, alcohols, polyphenols, cellulose, pectins
2916
2848
2924
2855
C–H (aliphatic)Stretching (symmetrical/asymmetrical)Lignin waxes, lipids, aliphatic chains
17151716
1633
C=O (carbonyl)StretchingCarboxylic acids,
esters (pectin), aldehydes
15991554C=C (aromatic)StretchingLignin, polyphenols
1411
1399
1415
1349
C–H and C=C (aromatic)Deformation and stretchingLignin, phenolic compounds
1236
1105
1026
1235
1097
1026
C–O, C–O–C,
C-O-C glycosidic bond
StretchingCellulose, hemicellulose, pectins, sugars
921
885
815
777
916
894
862
777
C–H (aromatic out-of-plane)Deformation from the planeLignin, phenolic structures
Table 2. Moisture content, height, diameter and diameter/height ratio of wheat biscuits containing different proportions of apple and sour cherry pomace.
SamplePomace WeightMoisture Content (%)Height
(mm)
Diameter
(mm)
Diameter/Height Ratio
Control sample0%6.83 ± 0.75 a10.65 ± 0.27 a55.77 ± 0.45 a5.24
Biscuits
with added
apple pomace
5%8.07 ± 0.89 a10.07 ± 0.21 ab54.50 ± 0.60 b5.41
10%8.33 ± 0.72 a9.33 ± 0.42 bc52.67 ± 0.38 cd5.65
15%8.65 ± 0.95 a8.73 ± 0.21 c52.03 ± 0.47 de5.96
Biscuits
with added
sour cherry pomace
5%7.12 ± 0.78 a9.90 ± 0.44 ab53.33 ± 0.75 bc5.39
10%7.20 ± 0.79 a8.43 ± 0.55 cd51.97 ± 0.21 de6.16
15%7.27 ± 0.80 a7.57 ± 0.31 d50.80 ± 0.36 f6.71
F-value 1.1112.8517.83
Values are expressed as mean ± standard deviation. Different letters indicate statistically significant differences between genotypes (Duncan multiple range test, p < 0.05).
Table 3. Infrared bands of biscuits with different percentages of apple and sour cherry pomace.
Samples Wavenumber (cm−1)Attribution
Control Sample [30]Biscuits with Added
Apple Pomace
Biscuits with Added Sour Cherry Pomace
5%10%15%5%10%15%
3009301830053006300930083010N–H stretching and the =C–H groups are associated with bands characteristic of olefins or unsaturated fatty acids
2922292229222922292129222920Asymmetric stretching vibration of CH2   L
2853285328532854285328532853Symmetric stretching vibration of CH2   L
1743174317421743174317431743C=O stretching (lipids)   L
1651164416451644164516521645Amide I (C = O stretching)   P
1539154015411507153715381538Amide II (N-H bending, C-N stretching)   P
14561458
1418
1458
1439
1457
1415
1455
1415
1455
1418
1454
1418
CH3 bending vibration (lipids and proteins)   L, P
Stretching C-N, deformation N-H, deformation C-H
134513451340137413621376Stretching C-O, in-plane C-O stretching vibration combined with the ring stretch of phenyl   C
1231123812361237123912391239Amide III (C-N stretching, N-H bending)   P
1143114712081136114011421143C-O stretching vibration
Oligosaccharide C-O bond   C
10751103
1048
1104
1066
1050
1103
1046
1098
1010
1100
1015
1097Carbohydrates
ν(CO), ν(CC), ring (polysaccharides, pectin)   C
983987987985987986989Stretching OCH3
L = lipids; P = proteins; C = carbohydrates.
Table 4. Total content of polyphenols, flavonoids, anthocyanins, sugars and antiradical activity in wheat biscuits with different proportions of apple and sour cherry pomace.
SamplePomace WeightPolyphenols
(mg GAE/100 g)
Flavonoids
(mg CE/100 g)
Anthocyanins (mg C3GE/100 g)Sugars
(g GluE/100 g)
RSA
(%)
Control sample0%390.21 ± 0.39 e120.13 ± 0.46 g18.78 ± 0.30 f39.16 ± 0.36 e18.77 ± 0.63 f
Biscuits
with added
apple pomace
5%439.52 ± 0.73 d164.17 ± 0.30 f24.84 ± 0.25 e44.50 ± 0.66 c20.20 ± 0.74 e.
10%441.19 ± 0.39 d170.33 ± 0.42 e25.45 ± 0.10 d45.37 ± 0.02 b25.60 ± 0.28 c
15%453.25 ± 2.17 b180.23 ± 0.66 c26.58 ± 0.25 c46.31 ± 0.91 a30.80 ± 0.53 a
Biscuits
with added
sour cherry pomace
5%445.34 ± 1.46 c178.80 ± 0.46 d26.72 ± 0.28 c43.57 ± 0.17 d22.79 ± 0.50 d
10%450.69 ± 2.79 b187.09 ± 0.42 b27.88 ± 0.23 b43.99 ± 0.33 cd23.33 ± 0.78 d
15%475.16 ± 1.11 a204.10 ± 0.66 a28.58 ± 0.34 a44.63 ± 0.11 c26.57 ± 0.64 b
F-value 1619.928935.36470.1375.60143.64
Values are expressed as mean ± standard deviation. Different letters indicate statistically significant differences between genotypes (Duncan multiple range test, p < 0.05).
Disclaimer/Publisher’s Note: The statements, opinions and data contained in all publications are solely those of the individual author(s) and contributor(s) and not of MDPI and/or the editor(s). MDPI and/or the editor(s) disclaim responsibility for any injury to people or property resulting from any ideas, methods, instructions or products referred to in the content.