Article

Predicting Surface Subsidence in Northern Huainan Based on a Hybrid LSTM–Transformer Model

1
School of Geomatics, Anhui University of Science and Technology, Huainan 232001, China
2
Key Laboratory of Aviation-Aerospace-Ground Cooperative Monitoring and Early Warning of Coal Mining-Induced Disasters of Anhui Higher Education Institutes, Huainan 232001, China
*
Author to whom correspondence should be addressed.
Appl. Sci. 2025, 15(21), 11780; https://doi.org/10.3390/app152111780
Submission received: 15 September 2025 / Revised: 19 October 2025 / Accepted: 3 November 2025 / Published: 5 November 2025

Abstract

As one of the world’s primary energy sources, coal has driven economic development but has also led to severe surface subsidence. Currently, many regions around the world face significant ground deformation risks due to ongoing or legacy mining activities. Accurate monitoring and trend prediction are critical for enhancing subsidence early-warning capabilities and urban resilience. The northern region of Huainan City exhibits a spatial pattern characterized by the coexistence of mining areas, urban areas, and decommissioned mining sites, among which the mining areas show more pronounced surface deformation due to prolonged mining activities. To fully understand the subsidence evolution characteristics and differences across various regions, an LSTM–Transformer prediction model was constructed based on SBAS-InSAR monitoring technology to predict the surface subsidence processes in the three types of areas separately. The results indicated that the subsidence rate and cumulative subsidence in the mining areas were significantly greater than those in the urban and decommissioned areas, demonstrating more intense deformation activity. The average subsidence rates for the mining areas, urban areas, and decommissioned mining sites were −57.42 mm/yr, −5.37 mm/yr, and −3.21 mm/yr, respectively. The model’s prediction results demonstrated good accuracy across different regions, with the root mean square errors (RMSEs) for the mining areas, urban areas, and decommissioned mining sites being 2.16 mm, 1.03 mm, and 0.22 mm, respectively. The study shows that the constructed LSTM–Transformer hybrid model not only possesses strong capability in fitting subsidence trends but will also provide a scientific basis for future monitoring and early warning of surface subsidence hazards.

1. Introduction

Huainan is a typical resource-based city in China, with abundant coal reserves. In the northern part of Huainan City, mining areas are densely distributed, and the urban population is highly concentrated. Due to coal mining activities, the mining areas and urban areas exhibit distinct subsidence characteristics. The mining areas exhibit an average annual subsidence rate exceeding −50 mm/yr, with some regions reaching as high as −148.40 mm/yr [1]. In contrast, surface deformation in the urban areas is relatively stable, with an average annual subsidence rate around −23 mm/yr [2]. The mining areas have a significant impact on the surrounding regions. Therefore, developing predictive models for surface deformation in mining and urban areas holds significant scientific importance for surface subsidence early warning.
Traditional surface deformation monitoring methods generally suffered from limitations such as point-based measurements, insufficient spatial resolution, and high resource consumption. However, Interferometric Synthetic Aperture Radar (InSAR) technology effectively addressed these issues. In 1969, the team led by Rogers [3] pioneered the development of InSAR technology. With its advantages of centimeter-level accuracy, cost-effectiveness, wide-area coverage, and high spatial resolution, this innovative technique has been successfully applied in the field of geological hazard monitoring, including early detection of potential landslides [4], inversion of seismic deformation fields [5], and urban surface subsidence monitoring [6]. It is worth noting that Differential InSAR(D-InSAR), which was developed based on InSAR, has enhanced deformation monitoring capabilities. However, its practical effectiveness is constrained by spatiotemporal baseline decorrelation effects, which often lead to phase unwrapping difficulties and a decline in data quality. In 2002, the team led by Berardino [7] first proposed the Small Baseline Subset Interferometric Synthetic Aperture Radar (SBAS-InSAR) technique. By optimizing the spatiotemporal baseline configuration and adopting a multi-master image combination strategy, SBAS-InSAR effectively overcame the phase decorrelation issues caused by long baselines in D-InSAR [8]. However, it was limited to the inversion of historical deformation and lacked predictive capability. Most existing studies employed single machine learning models [9] to process large-scale subsidence data, overlooking the differences in subsidence-driving mechanisms of mining areas affected by the dynamics of goaf areas and urban built-up areas affected by building loads, resulting in insufficient generalization of the models. At the prediction method level, most researchers commonly employed Long Short-Term Memory (LSTM) neural networks [10] to process time-series deformation data; however, the single network structure struggled to capture long-range dependencies in sudden subsidence events.
In recent years, SBAS-InSAR [11,12,13,14,15,16,17,18,19,20,21] technology has been widely applied to monitor surface deformation in both mining areas and urban regions. However, most existing studies have primarily focused on the identification and analysis of historical deformation, while research on the prediction of future subsidence remains relatively limited. Furthermore, traditional approaches often fail to account for the differing driving mechanisms between mining and urban environments, and single-network models have difficulty capturing sudden deformation variations. In addition, many existing prediction methods rely on conventional statistical or machine learning models, which are insufficient to accurately characterize the nonlinear and temporal dependency features inherent in deformation time series. Therefore, LSTM–Transformer hybrid prediction model was designed, which utilized LSTM [22,23] to extract local temporal features and combined the Transformer’s self-attention mechanism [24,25] to capture long-term spatiotemporal dependencies in subsidence events. The two types of features were dynamically fused through gating units. Finally, a unified surface subsidence prediction model was constructed to simultaneously model three types of regions. This approach effectively overcomes the limitations of traditional statistical, physical [26,27], and machine learning models in terms of prediction accuracy and their ability to handle complex geological conditions.

2. Overview of the Study Area and Research Data

2.1. Overview of the Study Area

The northern part of Huainan City is located in the central–northern region of Anhui Province, upstream of the Huai River, with coordinates ranging from 32°30′08″ N to 33°00′26″ N, and from 116°21′05″ E to 117°12′30″ E. Situated in East China, this area is a major energy base with abundant natural resources. The topography of the northern region is predominantly characterized by plains and hills, with the Tianjiaan District being notably urbanized. However, extensive and ongoing mineral extraction activities have led to the formation of numerous mining subsidence zones, disrupting the structure of underground aquifers and exacerbating surface subsidence. Furthermore, the surface subsidence in urbanized areas has become more pronounced due to various anthropogenic factors, including building load effects, disturbances from underground construction, and the over-extraction of shallow groundwater. For subsequent experimental analysis, the study area was divided into three types of regions-mining areas, urban areas, and abandoned mining areas-based on administrative boundaries and mining rights. The research area is depicted in Figure 1.

2.2. Research Data

The data used in this study comprise 90 Sentinel-1A images collected between January 2022 and December 2024, along with the ASTER GDEM Digital Elevation Model (DEM) at a 30 m resolution, which was used to mitigate the terrain-induced phase effect. Detailed parameter information is provided in Table 1.

3. Methodology

3.1. SBAS-InSAR Processing

The SBAS-InSAR technique selects interferometric pairs whose temporal and spatial baselines satisfy certain thresholds and processes them using multi-temporal spatial analysis to maximize the coherence of the interferometric phase, making it suitable for large-scale time-series deformation analysis. Here, the temporal baseline refers to the time interval between two image acquisitions, while the spatial baseline represents the vertical distance between satellite orbits at different acquisition times. To reduce decorrelation effects and improve interferogram coherence, interferometric pairs are screened based on the small-baseline criterion. In this study, 90 Sentinel-1 images were used. After performing image co-registration, differential interferometry, and other preprocessing steps, temporal and spatial baseline connection maps were generated. Combined with the ASTERGDEM Digital Elevation Model, the resulting time series were analyzed to invert nonlinear surface deformation, ultimately producing deformation time series, cumulative deformation maps, and annual mean deformation rate maps.

3.2. Model Architecture Choice

Temporal CNN is a type of neural network designed for processing time-series data and is highly efficient in terms of computation. Essentially, it is a temporal extension of CNN, employing one-dimensional convolutions to replace the stepwise modeling of traditional RNNs. The convolutional layers extract local temporal patterns, which allows Temporal CNN to perform well in short-term prediction. However, for long-term time-series data such as surface subsidence, its modeling performance is limited. Moreover, Temporal CNN lacks a global attention mechanism, making it prone to overlooking abrupt temporal changes. In addition, subsidence patterns in mining areas are often nonlinear and unstable, and Temporal CNN shows inadequate fitting capability for such complex data.
Gradient Boosting is a method that models nonlinear relationships by sequentially fitting multiple decision trees to the residuals. Although it offers fast training speed, it lacks the ability to model temporal dependencies and is therefore unable to capture long-term subsidence evolution. Moreover, the model relies on static feature splits, which prevents it from dynamically adjusting weights over time.
In this study, a hybrid LSTM–Transformer model was employed. The LSTM component captures long-term dependencies in the time series, effectively mitigating the vanishing gradient problem, while the Transformer module introduces a self-attention mechanism that can dynamically identify critical stages in the time series, such as abrupt deformation caused by mining activities or seasonal variations. This hybrid architecture not only preserves the continuity of temporal information but also enhances the model’s ability to perceive global temporal correlations.

3.3. LSTM Long Short-Term Memory Network

LSTM is a specialized type of Recurrent Neural Network (RNN). The core components of LSTM are three gates (forget gate, input gate, and output gate) and a cell state. The cell state flows through the entire time series and is responsible for transmitting long-term memory with only a small number of linear operations, making it less susceptible to gradient vanishing.
The forget gate decides which information to discard from the cell state, outputting values between 0 and 1 via a sigmoid function (0 indicating complete forgetting and 1 indicating complete retention).
f t = σ ( W f [ h t 1 , x t ] + b f )
In the formula, f t represents the output of the forget gate; σ represents the s i g m o i d activation function, which outputs values between 0 and 1; W f represents the weight matrix of the forget gate; h t 1 , x t represents the concatenated matrix of the previous hidden state and the current input; and b f represents the bias term of the forget gate.
The input gate controls the new information to be added to the cell state, with the sigmoid layer determining which parts will be updated, and the Tanh layer generating the candidate value C ~ t .
i t = σ ( W i [ h t 1 , x t ] + b i )
In the formula, i t represents the output of the input gate, which determines the new information to be added to the cell state; W i represents the weight matrix of the input gate; h t 1 , x t represents the concatenated matrix of the previous hidden state and the current input; and b i represents the bias term of the input gate.
C ˜ t = t a n h ( W c [ h t 1 , x t ] + b c )
In the formula, C ~ t is the candidate value, generated through the t a n h activation function, with values ranging from −1 to 1; W C represents the weight matrix of the candidate value; h t 1 , x t represents the concatenated matrix of the previous hidden state and the current input; and b C represents the bias term of the input gate.
The cell state is updated by combining the results of the forget gate and the input gate.
C t = f t C t 1 + i t C ˜ t
In the formula, C t represents the cell state at the current time step, represents element-wise multiplication, and C t 1 represents the cell state at the previous time step.
The output gate determines the output at the current time step, based on the updated cell state and the filtering by the output gate.
o t = σ ( W o [ h t 1 , x t ] + b o )
In the formula, o t represents the output of the output gate, which determines the output at the current time step; W o represents the weight matrix of the output gate; h t 1 , x t represents the concatenated matrix of the previous hidden state and the current input; and b o is the bias term of the output gate.
h t = o t t a n h ( C t )
In the formula, h t represents the hidden state at the current time step, while t a n h ( C t ) represents the cell state generated by the t a n h activation function.

3.4. LSTM–Transformer Model

In the constructed model, sinusoidal position encoding is used to inject absolute position information, enabling the model to capture information from each position in the sequence. This helps the model better capture information from each position in the sequence, thereby improving its performance in processing sequential data.
P E ( p o s , 2 i ) = sin p o s 10,000 2 i d
P E ( p o s , 2 i + 1 ) = cos p o s 10,000 2 i d
In the formula, pos represents the position index, i represents the dimension index, and d represents the embedding dimension.
The encoder consists of N identical layers stacked together, each containing multi-head self-attention mechanisms and residual connections. In the multi-head self-attention module, the input is divided into h parallel attention heads (where h = 4 in this experiment), and each head independently computes scaled dot-product attention:
Attention ( Q , K , V ) = softmax Q K T d k V
In the formula, Q , K , V R T × d k represent the Query, Key, and Value matrices, respectively; d k represents the dimensions of the key and value; Q K T d k is used to compute the similarity between the query and the key; and the division by d k helps prevent the dot product from becoming too large, which could cause the gradient vanishing in the softmax function.
The outputs from all attention heads are concatenated and undergo a linear transformation to produce the final attention output:
MultiHead ( Q , K , V ) = C o n c a t ( h e a d 1 , , h e a d h ) W O
In the formula, h e a d i represents the output of the i attention head, W O represents the output weight matrix, and C o n c a t can concatenate the outputs of all heads together.
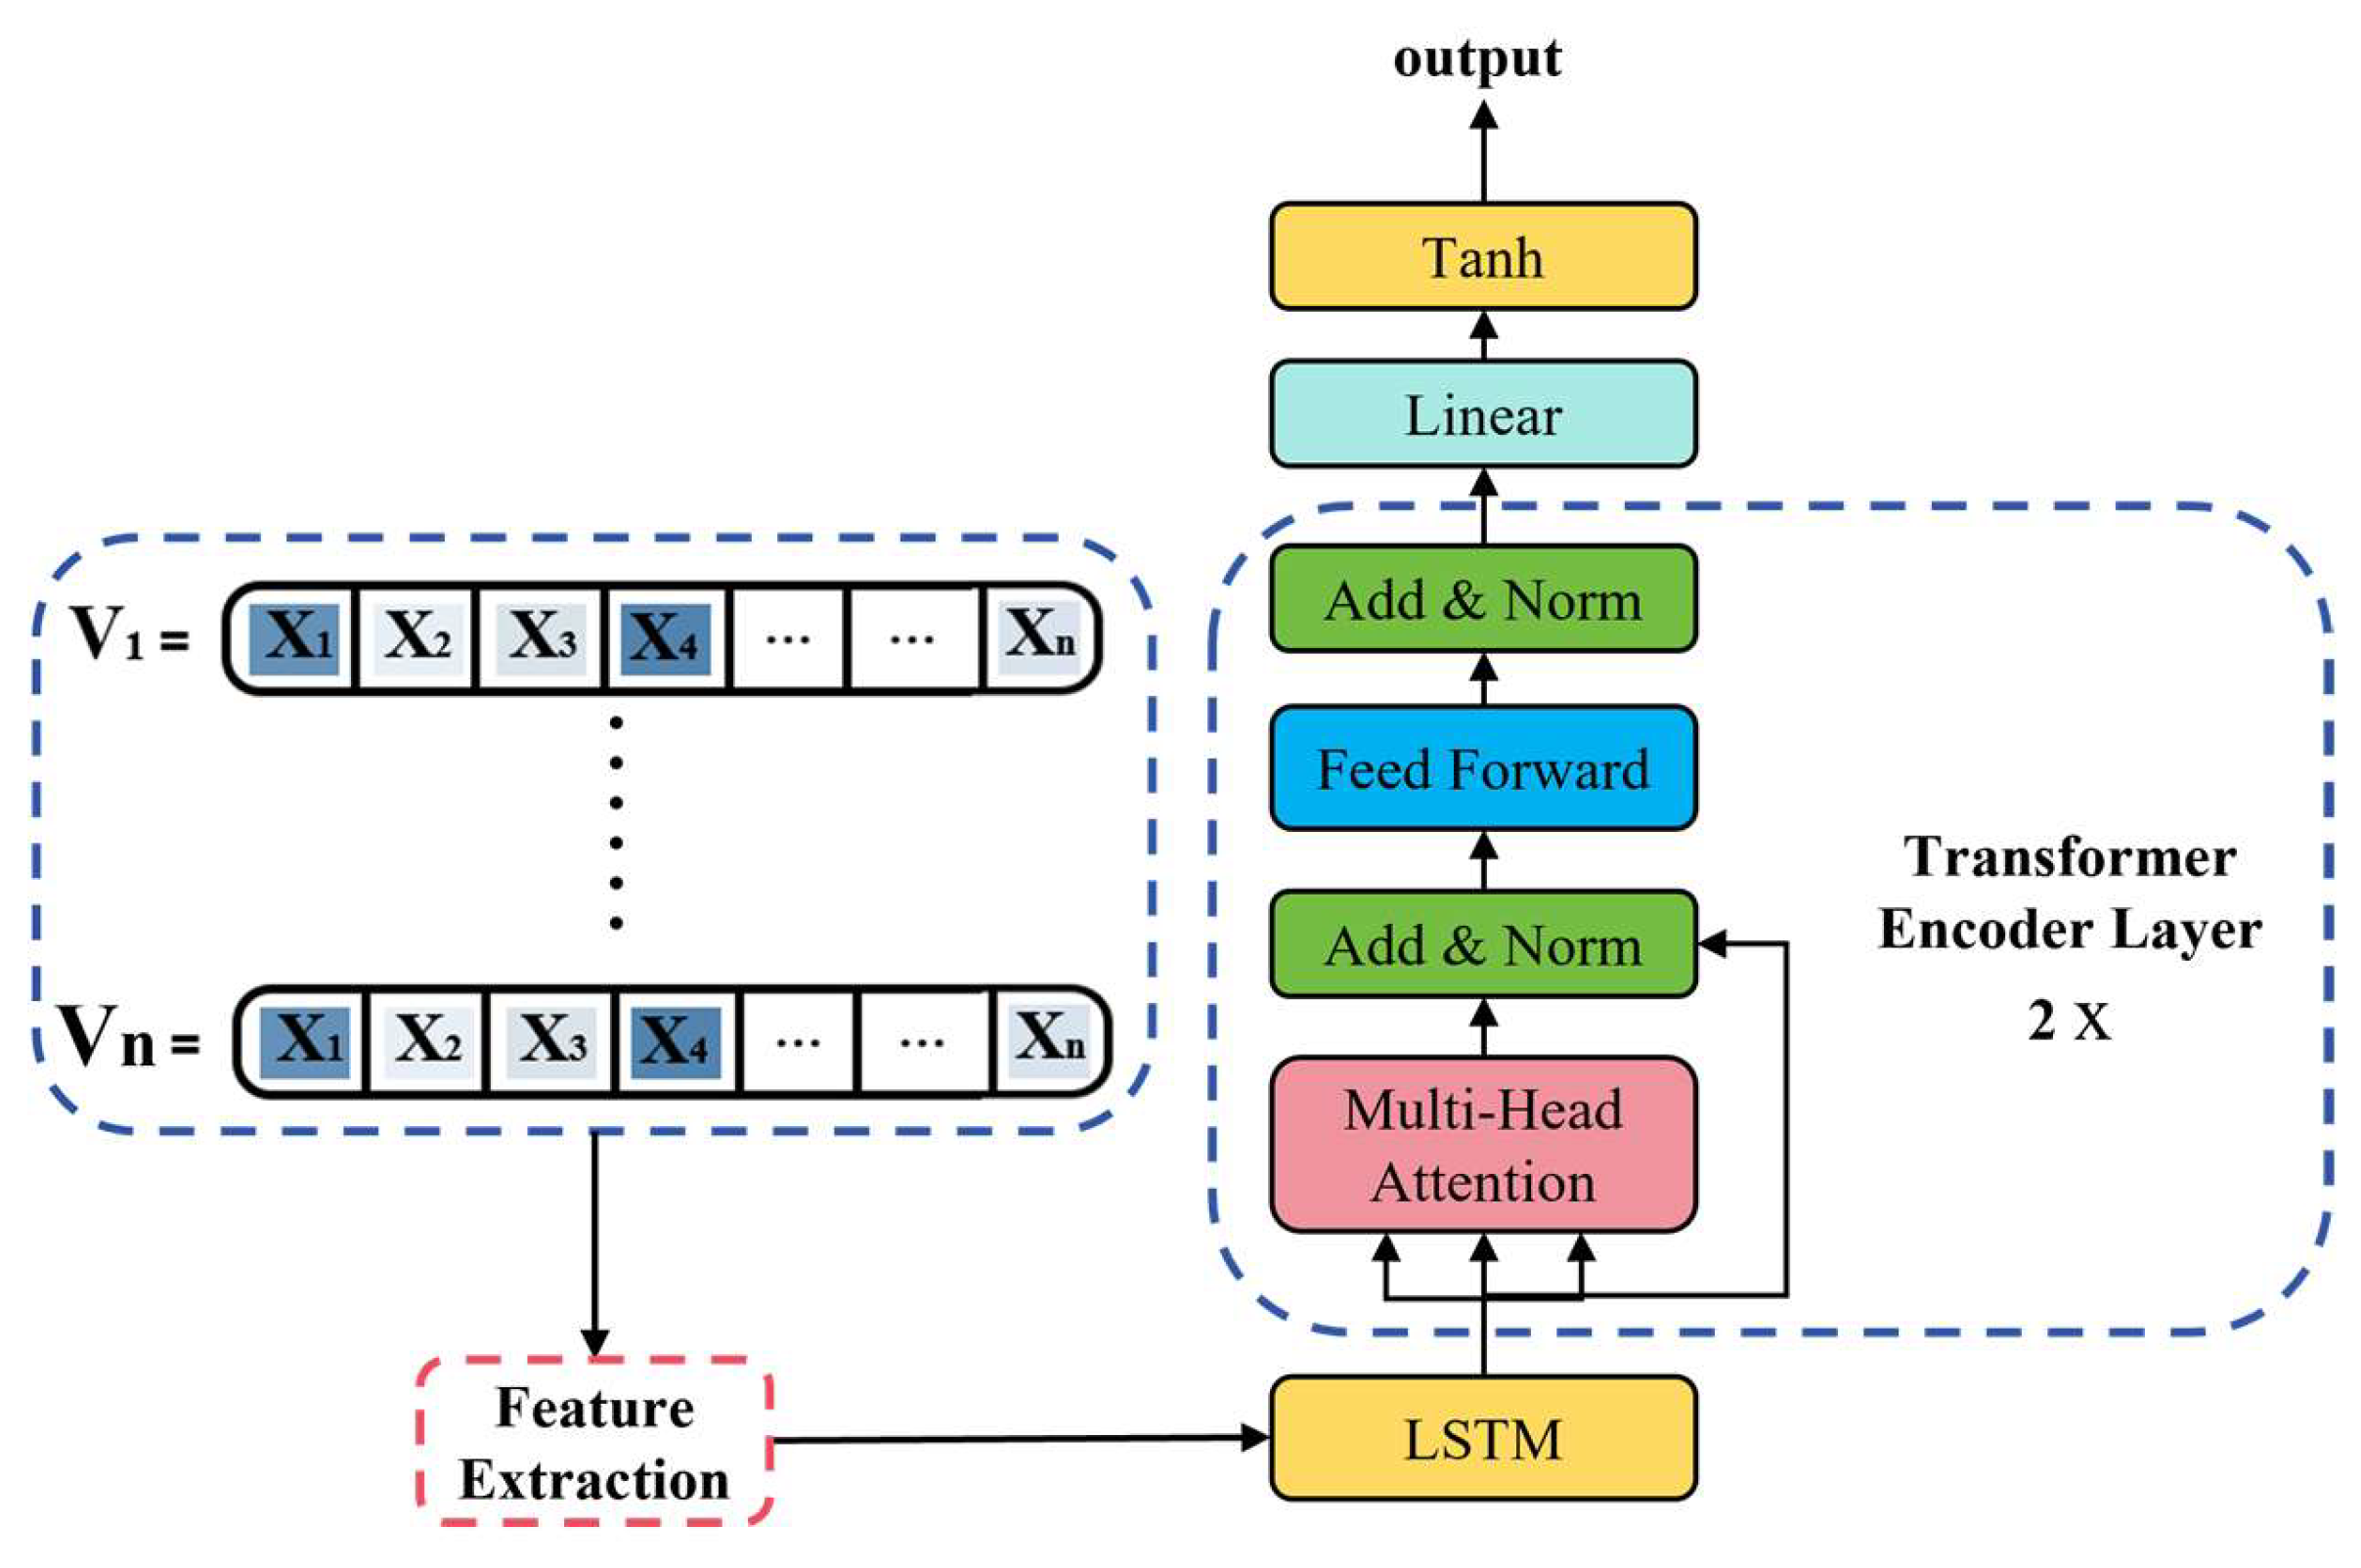
The model structure is shown in Figure 2. The matrices V1-Vn, containing time-series subsidence values, are processedthrough the LSTM branch for feature extraction. The extracted features are thenfurther refined by the Transformer’s multi-head attention mechanism to captureglobal dependencies, ultimately generating the final predictions.

3.5. Module Ablation Test

In constructing an ablation test for the LSTM–Transformer model, we focus on analyzing the impact of different components on model performance. The ablation test systematically evaluates the contribution of key components by removing or replacing them step-by-step. First, we removed the Transformer module and compared the results with the baseline model. Second, we ablated the LSTM component to evaluate its substantive contribution to capturing long-term cumulative trends. It is crucial that all other hyperparameters and thetraining process remain consistent during the tests to ensure fairness and that any variations in the results are a true reflection of the specific components’ influence.

3.6. Prediction Accuracy Evaluation Metrics

This paper evaluates the prediction performance and accuracy of the model using two common error metrics: Mean Absolute Error (MAE) and Root Mean Square Error (RMSE).
S M A E = 1 m i = 1 m | Y i y i |
S R M S E = 1 m i = 1 m ( Y i y i ) 2
In the formula, m represents the total number of samples, Y i is the actual value of the i point, y i is the predicted value of the i point. The smaller the values of S M A E and S R M S E , the better the model’s prediction accuracy.

4. Results

4.1. Subsidence Rate Analysis

Figure 3 illustrates the subsidence rate in the study area from 2022 to 2024. The annual average deformation rate in the study area mainly ranges from −5 to 10 mm/yr, while the mining areas show significant deformation. The southeastern part of the study area, which is the urban area, experiences a deformation rate stable between −5 and 10 mm/yr, influenced by factors such as municipal construction, groundwater extraction, and natural settlement. In contrast, the mining areas exhibit larger deformation rates, and some regions show decorrelation. The maximum deformation rate in the northern part of the study area reaches −85.70 mm/yr. The yellow boundary line indicates the decommissioned mining sites. During the mining period, underground voids caused surface subsidence and settlement. After mining ceased, these areas gradually stabilized, with subsidence slowing down, and the subsidence rate decreased each year, eventually stabilizing at around −2 mm/yr. From the figure, it is clear that location with deformation rates less than −30 mm/yr largely coincide with the mining areas. In the southern mining area, no significant settlement has been observed in recent years due to the cessation of mining, and the surface deformation has remained relatively stable, as shown in Figure 3.

4.2. Accuracy Validation

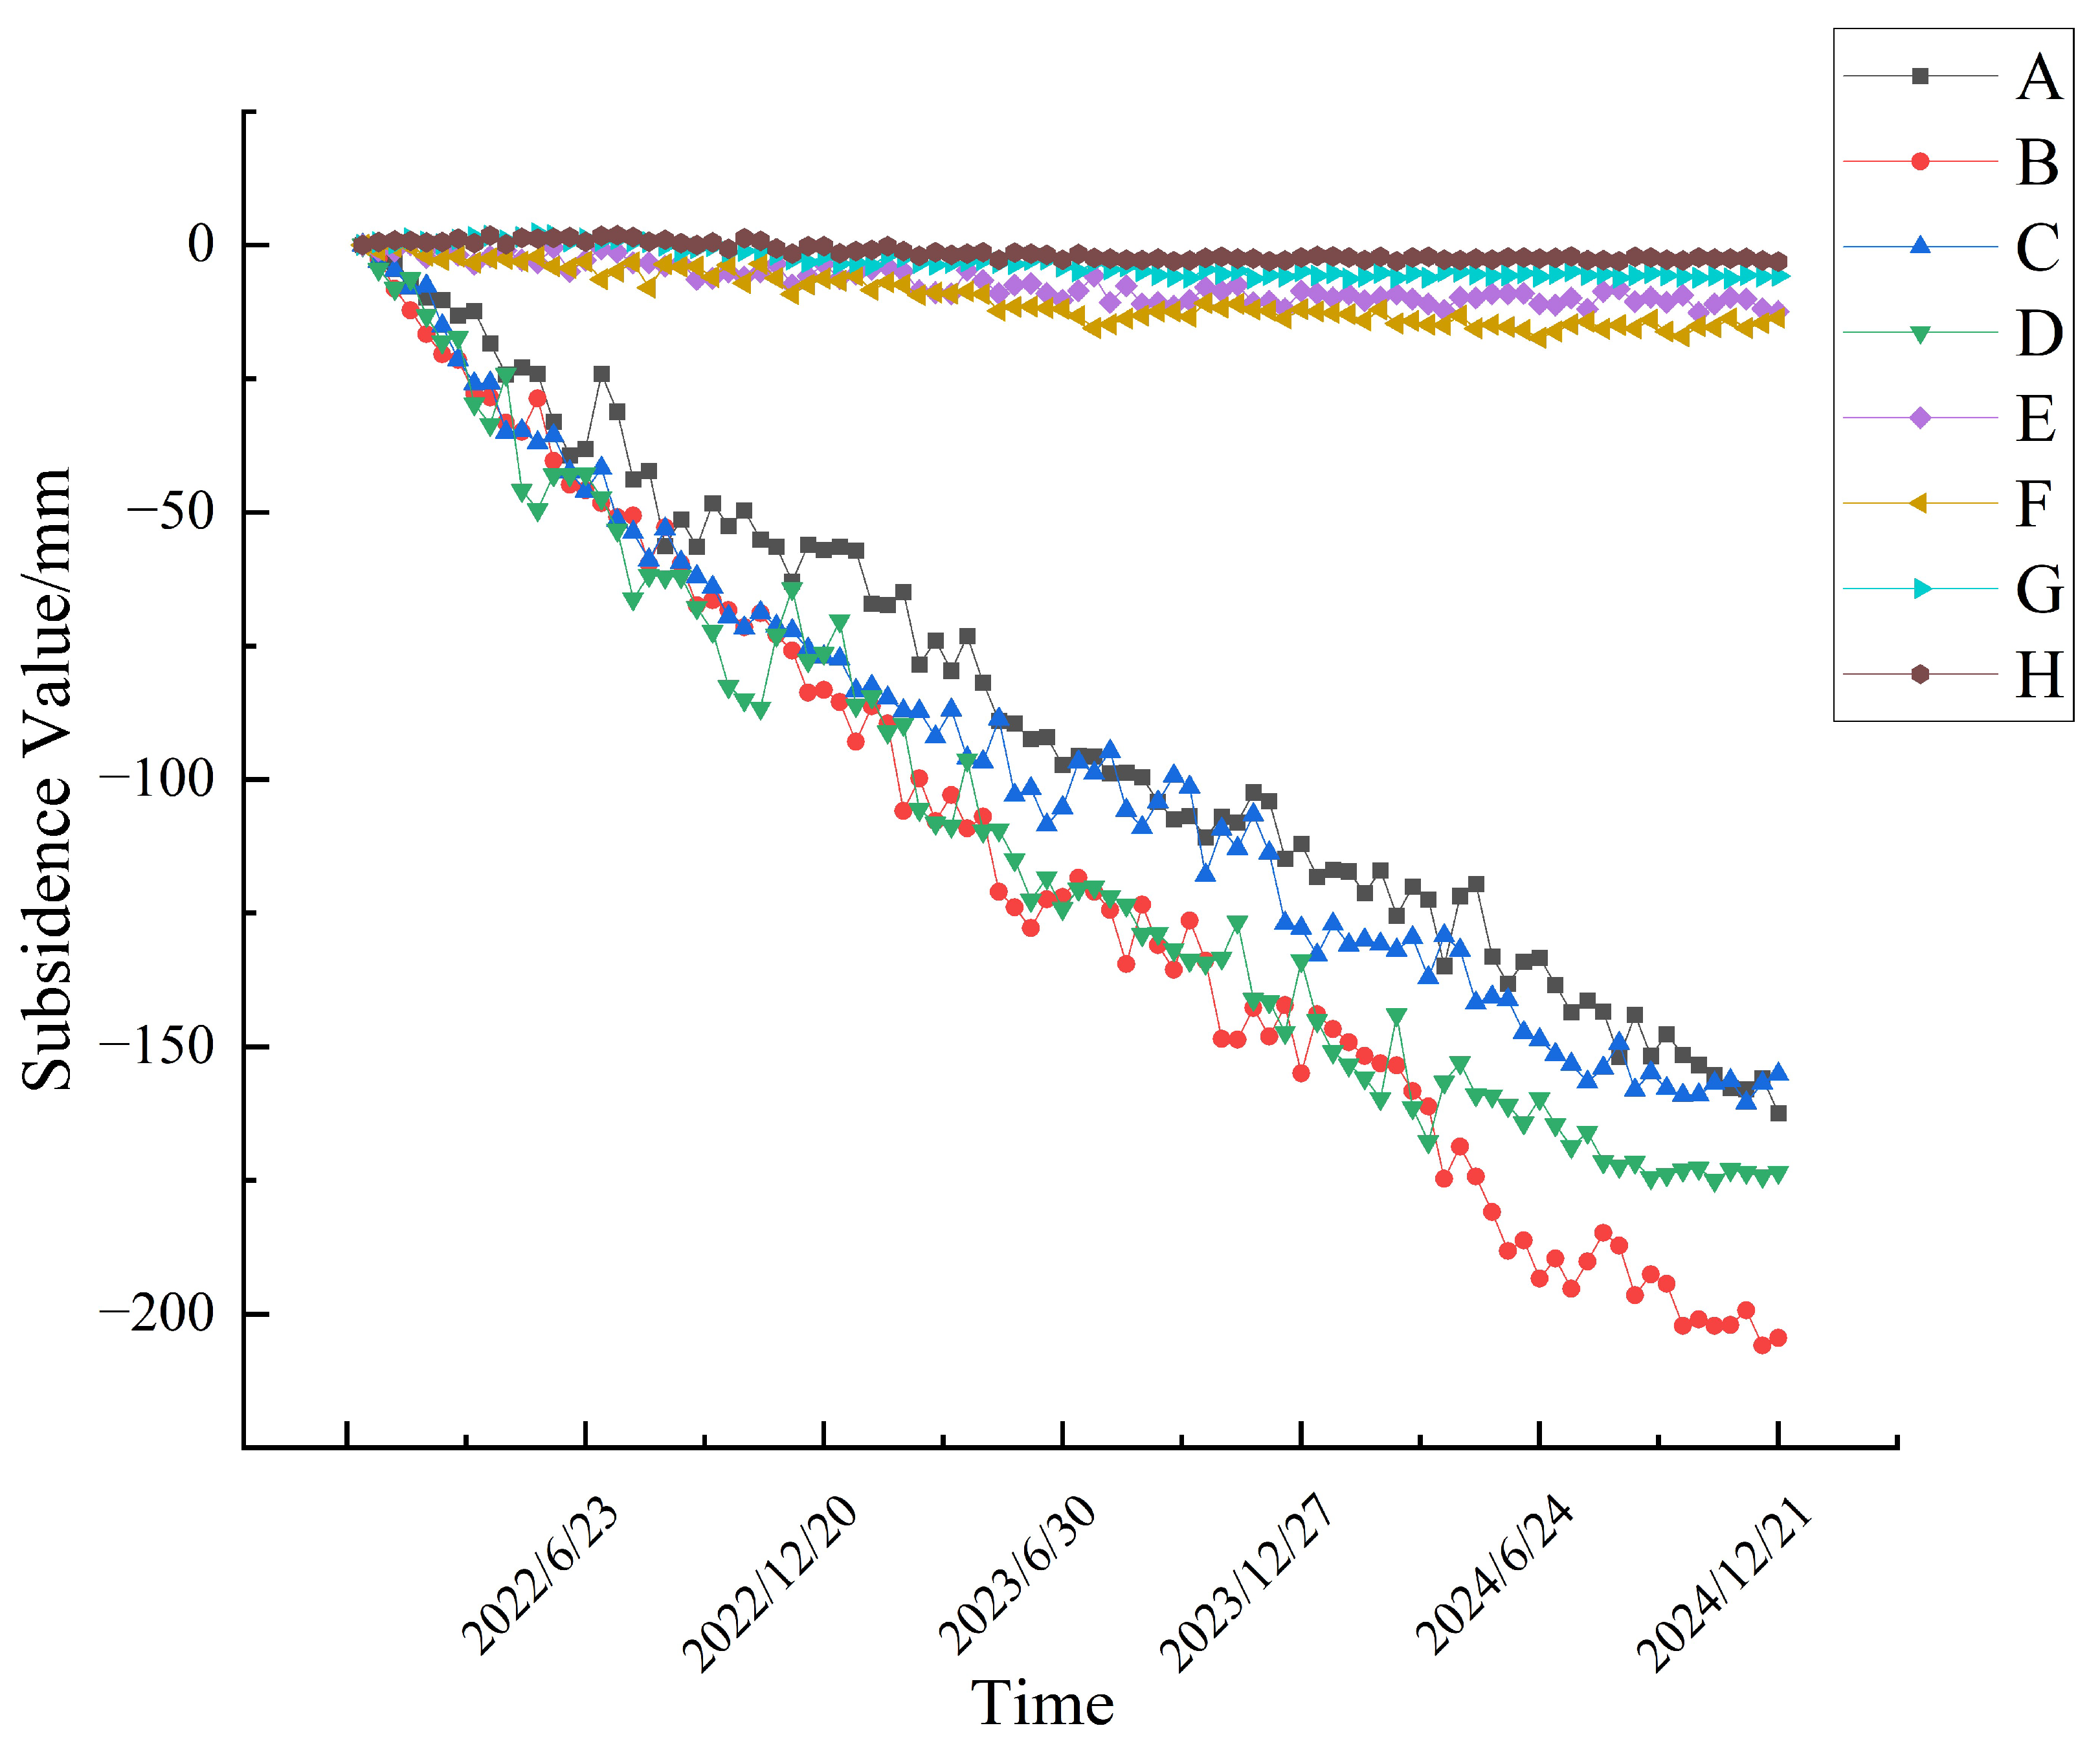
Based on the settlement values obtained from SBAS-InSAR technology, this study established eight research points (A–H), as shown in Figure 3, to analyze the time Variation In Cumulative deformation at these points. The data reveals that settlement has consistently increased at these 8 points, though the rate of increase varies. Among them, the settlement at points A–D, located in the mining area, is more significant, with point B showing the largest cumulative settlement, exceeding −200 mm. Points E and F, located in the urban area, show relatively stable settlement, with a range within −20 mm. Points G and H, located in the decommissioned mining sites, show stable settlement, both within −5 mm. The settlement characteristics of these 8 points reflect the settlement patterns in the mining area, urban area, and decommissioned mining sites. Therefore, these 8 research points will be used for subsequent experiments. The variation in settlement values over time for these 8 points is shown in Figure 4.
To ensure consistency in the temporal steps during model training, the original Sentinel-1 deformation time series was interpolated. The raw dataset consisted of 90 SAR images acquired at irregular time intervals. To obtain an evenly spaced temporal sequence and enhance the model’s ability to resolve the temporal evolution of deformation, linear interpolation was applied, resulting in 360 uniformly distributed time steps. No additional temporal smoothing was performed during interpolation to avoid introducing artificial autocorrelation or weakening the true fluctuation characteristics of ground subsidence. To verify the performance and accuracy of the model constructed in this study for actual predictions, the interpolated time-series subsidence values from eight study points were used as input data, with a feature dimension of 1 (time dimension). The dataset was divided into training, validation, and test sets according to an 8:1:1 ratio. Considering the characteristics of the time-series data and the prediction task, the input window was set to 32 and the output length to 7. After multiple adjustments, a learning rate of 0.001 was found to provide the best convergence speed and accuracy. The Adam optimizer was used to accelerate convergence. After testing different batch sizes, 16 was selected as the optimal batch size, balancing training speed and resource utilization. To prevent overfitting, a dropout rate of 0.1 was applied, which was experimentally found to provide the best training stability. The Tanh activation function was chosen to avoid the vanishing gradient problem. Mean Squared Error (MSE) was used as the loss function to evaluate model performance, and the number of training iterations was set to 200. Detailed model parameters are provided in Table 2. Root Mean Square Error (RMSE)and Mean Absolute Error (MAE) were used as evaluation metrics to assess prediction performance. In addition, an ablation study was conducted to further validate the contributions of different model components.
Based on the results of the ablation study, from a quantitative perspective, as shown in Table 3, the LSTM–Transformer model achieved the highest prediction accuracy compared to the individual LSTM and Transformer models. This superior performance was consistent across mining areas, urban areas, and abandoned mining areas. Notably, at point H, the model achieved the lowest prediction errors, with a root mean square error (RMSE) of 0.22 mm and a mean absolute error (MAE) of 0.17 mm. Therefore, the LSTM–Transformer model demonstrates significant advantages in predicting surface subsidence across mining, urban, and abandoned mining regions.

4.3. Prediction Results and Analysis

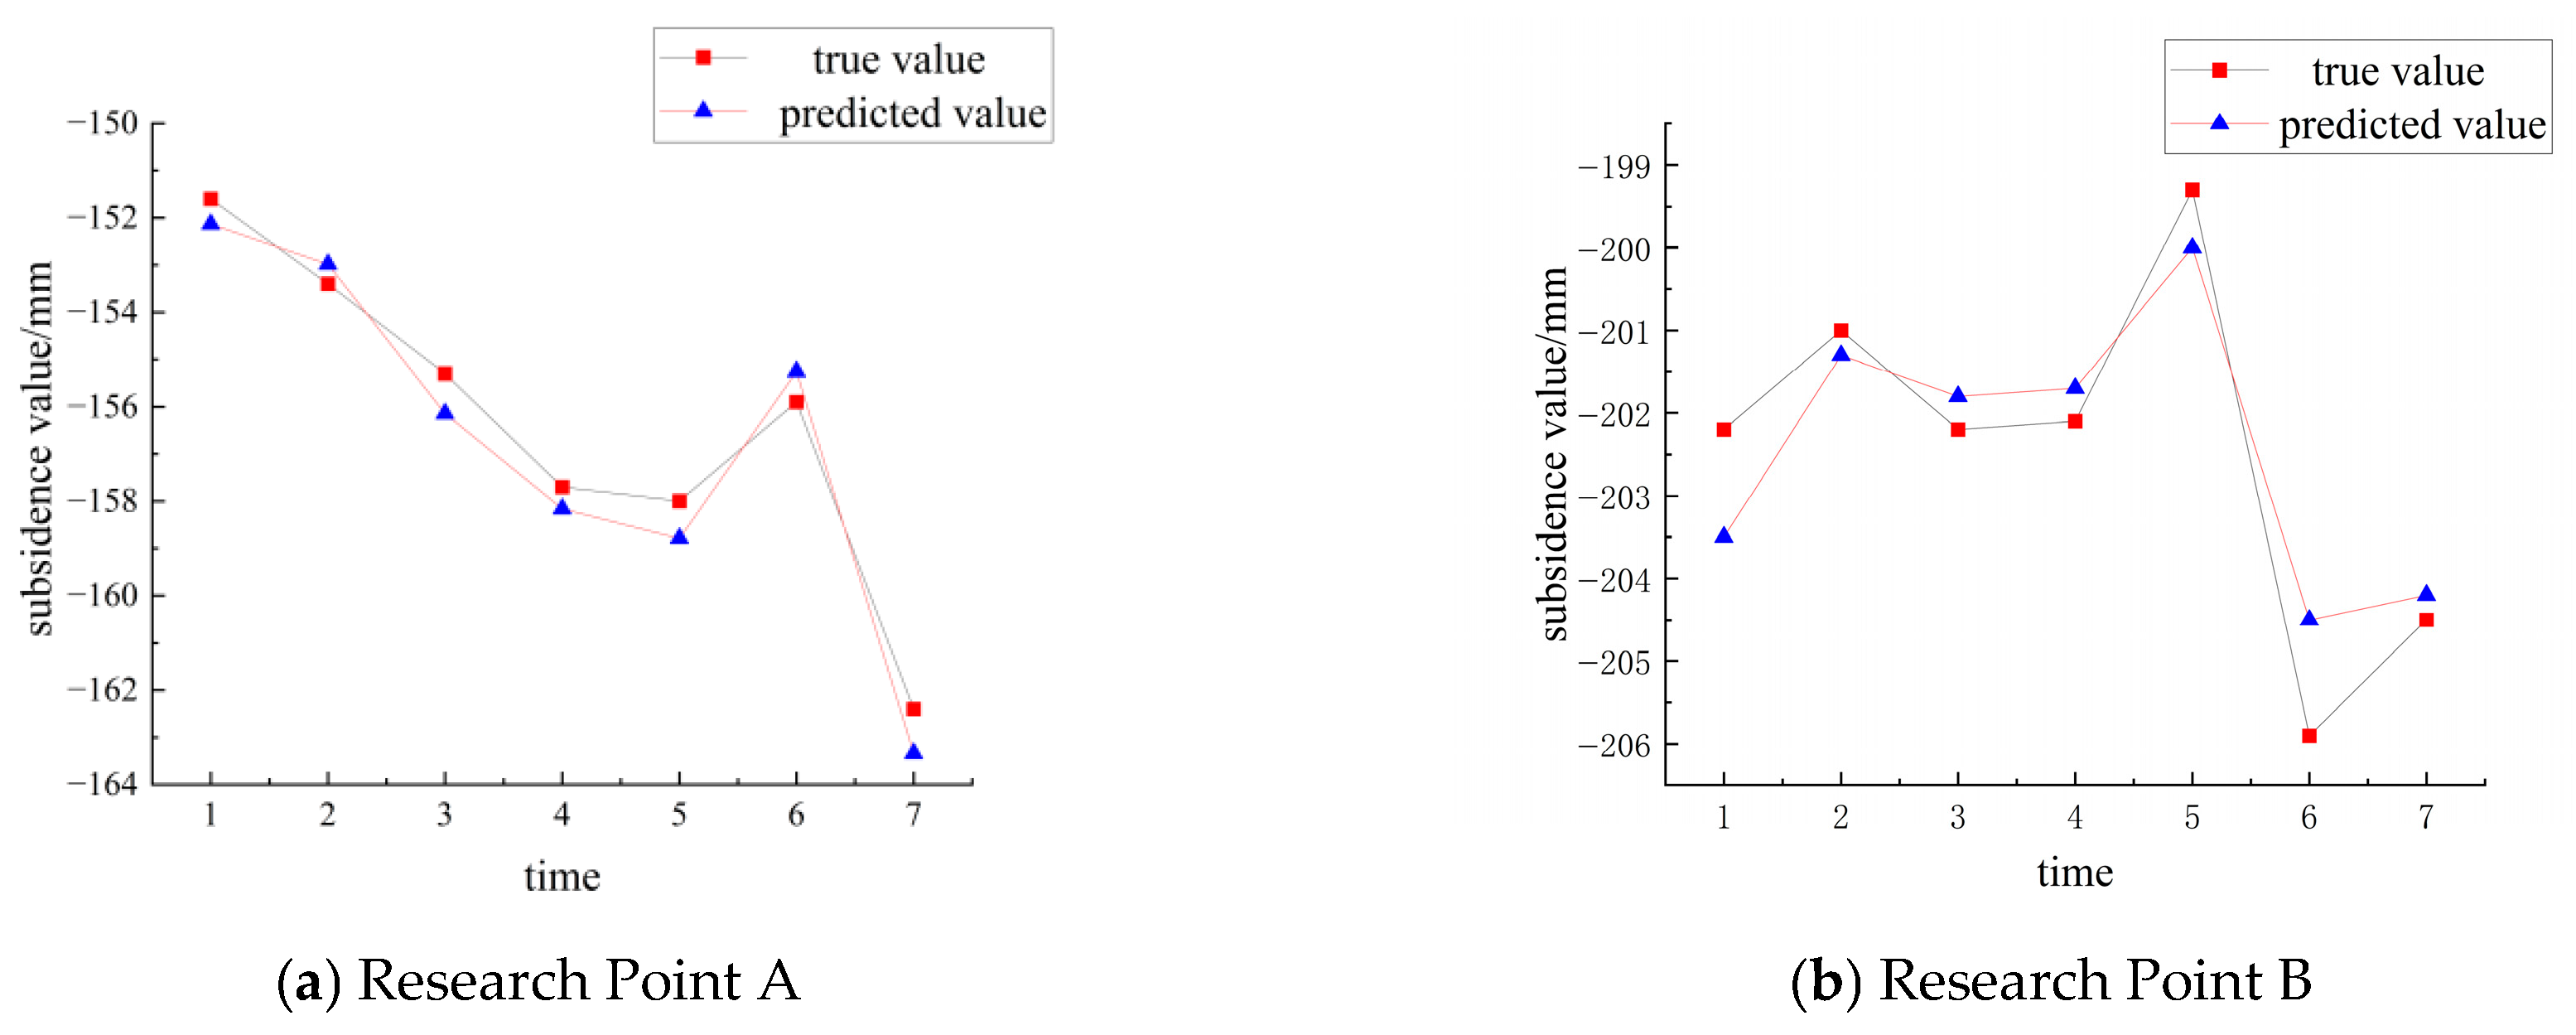
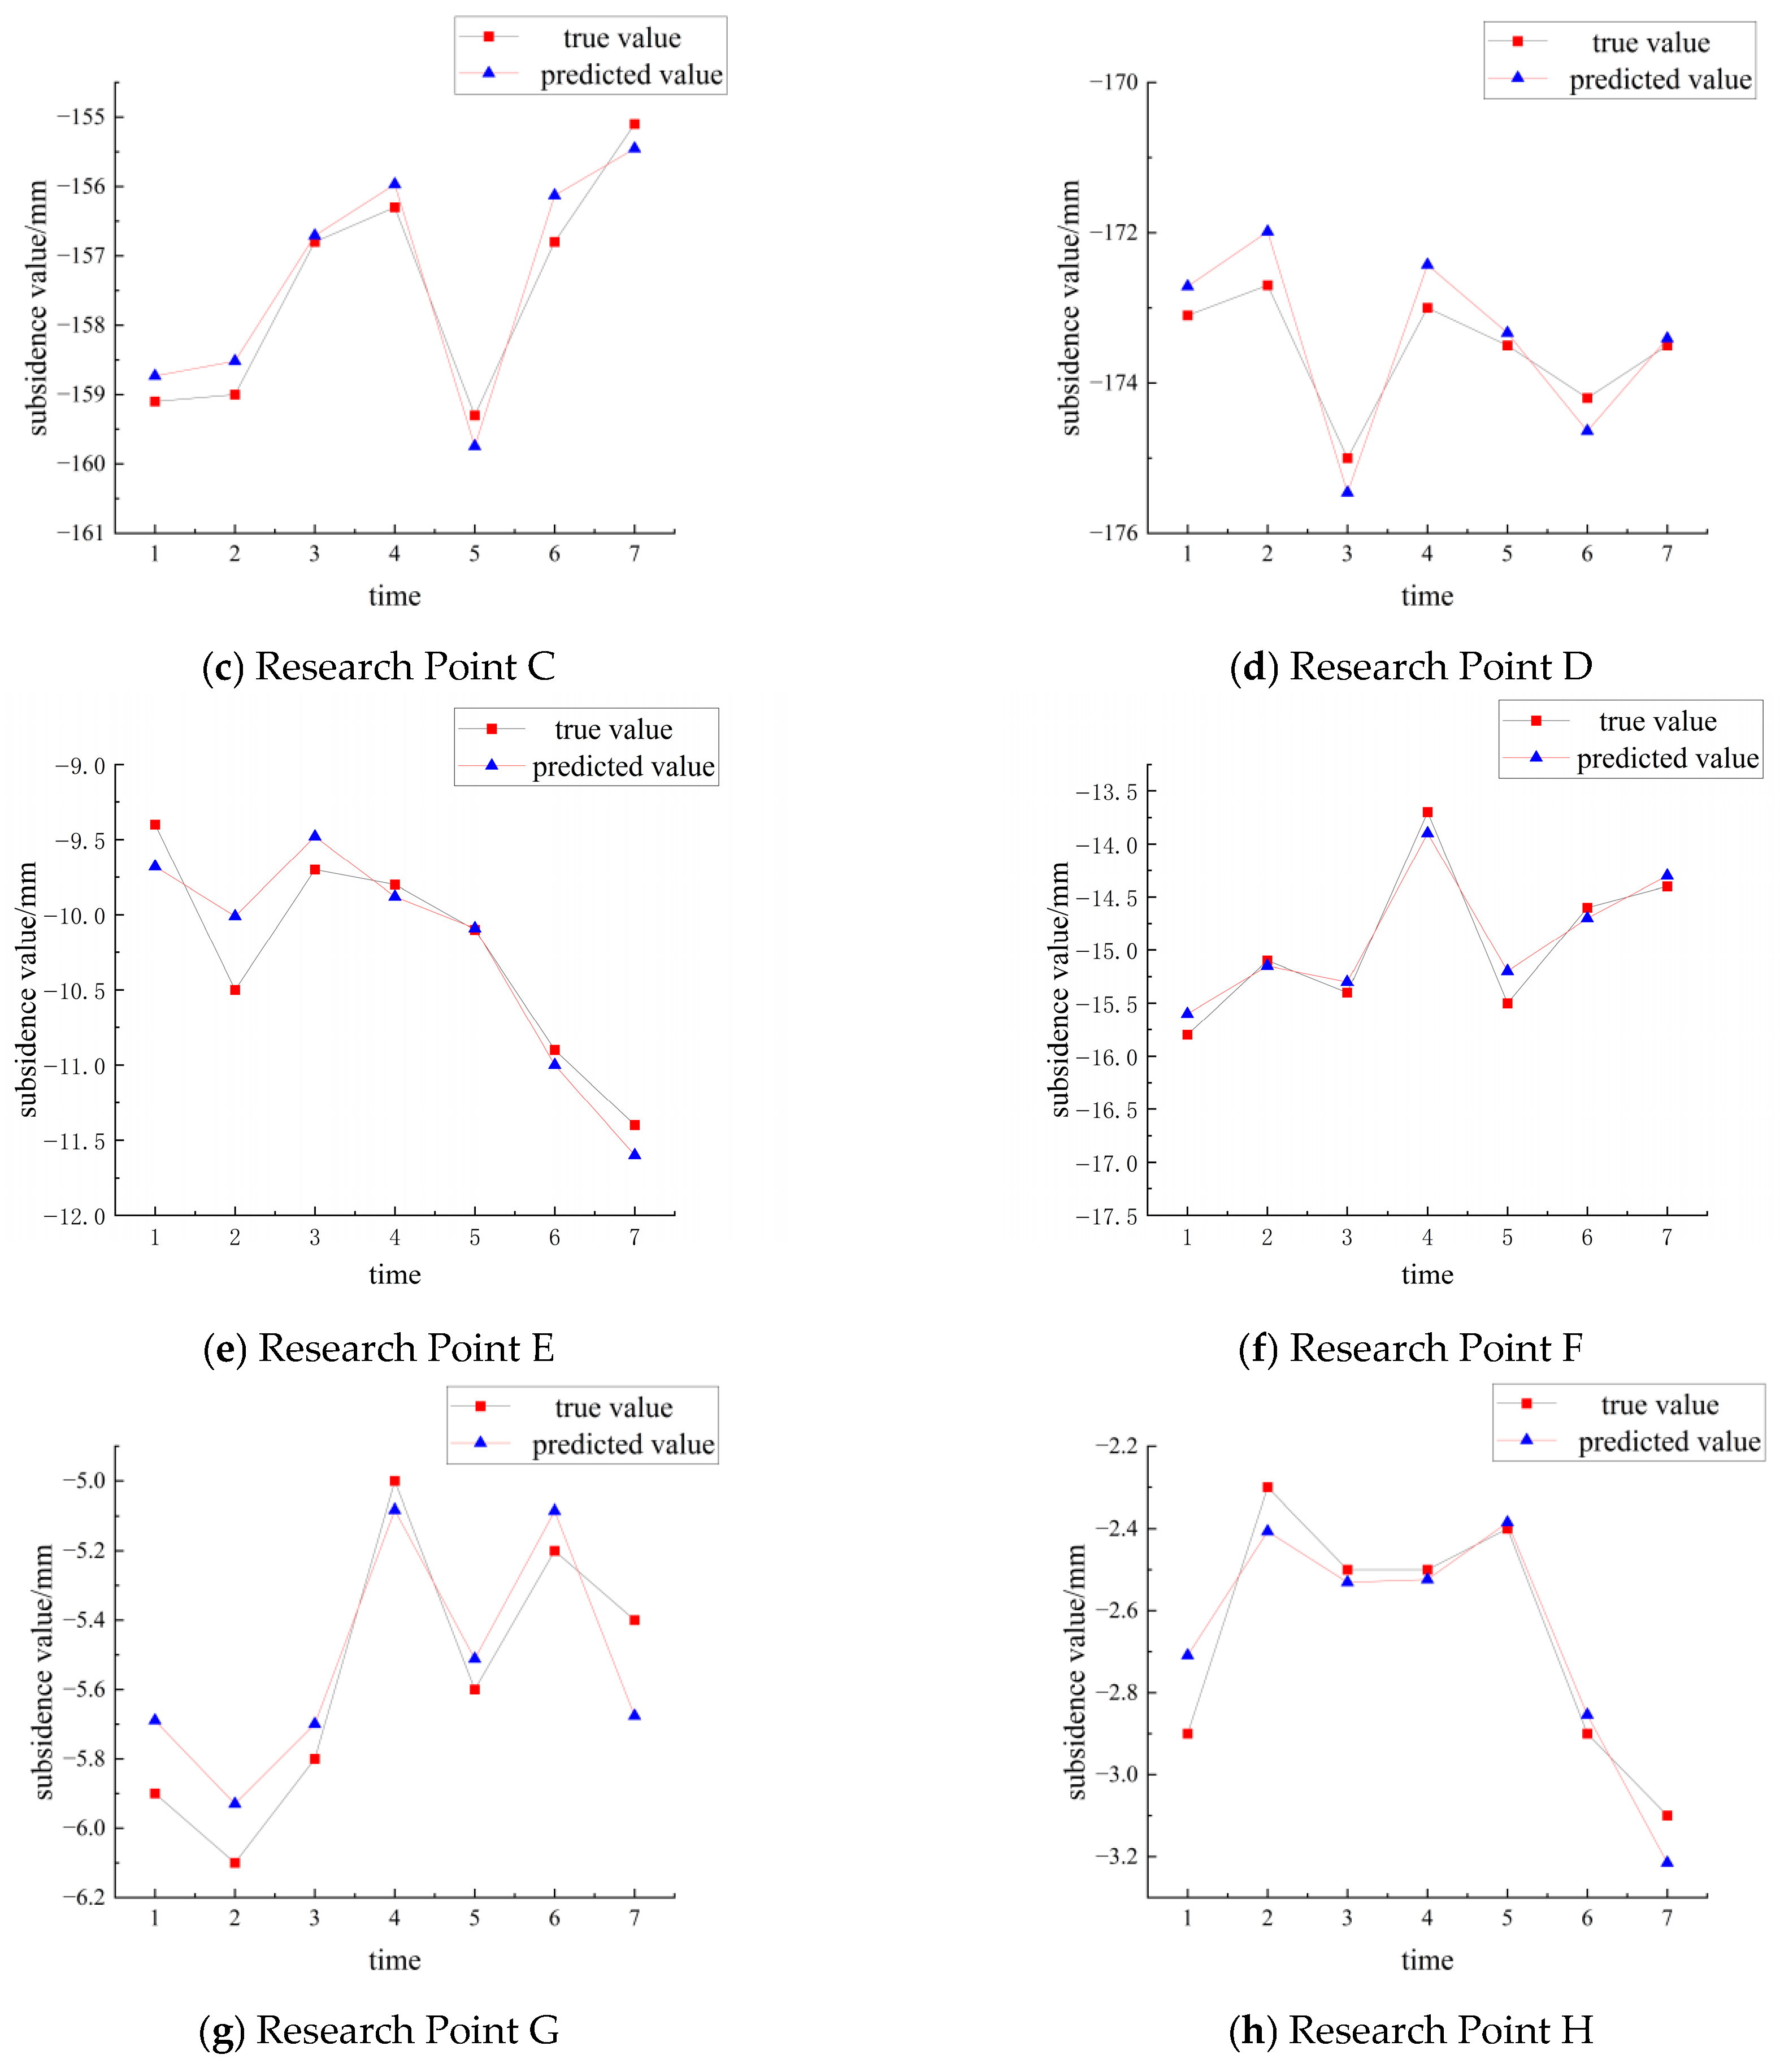
After validating the accuracy and reliability of the proposed model, it was further applied to predict future surface subsidence at the eight established study points. The LSTM–Transformer model’s predicted subsidence values for the next seven times steps were compared with the corresponding measurements obtained from the SBAS-InSAR technique to evaluate the model’s predictive performance. The prediction results are presented in Figure 5.
As shown in the figure above, for the research points in the mining area, urban area, and decommissioned mining sites, the predictions from the LSTM–Transformer model closely follow the trends of the actual values, thereby validating the effectiveness of the model proposed in this paper.

5. Conclusions and Discussion

In this study, SBAS-InSAR technology was used to obtain surface deformation rates and cumulative settlement time series for the northern part of Huainan City. The results revealed that the mining area experiences more severe surface settlement compared to the urban and decommissioned mining sites, with a maximum deformation rate of −85.70 mm/yr and the maximum cumulative settlement reaching −243.81 mm. In the urban area, the maximum deformation rate was −31.47 mm/yr, and the largest cumulative settlement amounted to −29.72 mm. For the decommissioned mining sites, the maximum deformation rate was −5.76 mm/yr, with a maximum cumulative settlement of −6.21 mm. The model can provide a quantitative basis for identifying high-risk areas of surface instability, with in mining areas, the predicted results can be used to optimize excavation sequences and adjust mining plans to mitigate surface damage. In urban areas, the predictions can support infrastructure maintenance planning and risk zoning. In abandoned mining areas, the results can provide scientific guidance for ecological restoration strategies. Based on the monitoring results from SBAS-InSAR, the LSTM–Transformer model was constructed to predict settlement in the mining area, urban area, and decommissioned mining sites, leading to the following conclusions:
  • By utilizing time-series settlement data obtained through SBAS-InSAR technology, effective classification and management of the mining area, urban area, and decommissioned mining sites were achieved, providing a solid data foundation for differentiated modeling. The LSTM–Transformer model demonstrated high accuracy in predicting settlement across all three areas, with the RMSE consistently maintained between 1 and 2 mm. These results underscore the feasibility and practical application of this method in the fine monitoring and prediction of surface settlement.
  • A comparison of the LSTM–Transformer model’s predictions with the actual data demonstrates a high degree of consistency, highlighting the model’s strong predictive performance and reliability. The integration of SBAS-InSAR technology with the LSTM–Transformer model not only enhances the accuracy of surface settlement monitoring and prediction but also provides a solid scientific foundation and technical support for early warning and mitigation of settlement-related disasters.
However, this study also has some limitations. The temporal interpolation of the Sentinel-1 dataset, while ensuring uniform time steps, may introduce uncertainty in long-term deformation trends. In addition, external driving factors such as rainfall, groundwater extraction, or mining depth were not incorporated into the current model. Future work will focus on developing multi-source data fusion approaches and interpretable prediction frameworks to enhance model generalization and reliability.

Author Contributions

Conceptualization, H.T. and J.X.; methodology, H.T. and J.X.; software, J.X. and R.L.; validation, J.X., R.L. and J.D.; formal analysis, H.T. and M.Z.; investigation, J.X., R.L. and J.D.; resources, H.T. and M.Z.; data curation, J.X. and R.L.; writing—original draft preparation, J.X. and H.T.; writing—review and editing, J.X. and H.T.; visualization, J.X. and R.L.; supervision, M.Z. and J.D.; project administration, H.T.; funding acquisition, H.T. All authors have read and agreed to the published version of the manuscript.

Funding

This research was funded by Natural Science Research Project of Anhui Educational Committee, grant number 2023AH051190; the Anhui Provincial Key Laboratory Open Fund, grant number KLAHEI202307; and the Scientific Research Foundation for High-level Talents of Anhui University of Science and Technology, grant number 2022yjrc26. The APC was funded by the same source.

Institutional Review Board Statement

Not applicable.

Informed Consent Statement

Not applicable.

Data Availability Statement

The experimental data used in this study can be downloaded from https://search.earthdata.nasa.gov/search (accessed on 5 May 2025).

Conflicts of Interest

The authors declare no conflict of interest.

References

  1. Zhang, Y.X.; Yuan, X.P.; Gan, S.; Peng, X.; Wang, S. Application of time series lnSAR technology in surface subsidence monitoring and spatio-temporal evolution analysis in mining area. Bull. Surv. Mapp. 2025, 3, 15–20. [Google Scholar] [CrossRef]
  2. Yuan, Y.X.; Pan, J.P.; Zhao, R.Q.; Cai, Z.Y.; Li, P.X. Monitoring Urban Surface Subsidence in the Main Urban Area of Chongqing Using Time-Series InSAR Technology. J. Geomat. 2024, 49, 93–98. [Google Scholar] [CrossRef]
  3. Rogers, A.E.E.; Ingalls, R.P. Venus: Mapping the surface reflectivity by radar interferometry. Science 1969, 165, 797–799. [Google Scholar] [CrossRef]
  4. Yu, H.H.; Cai, G.L.; Gan, Q.; Shen, D. Early identification of the jiangdingya landslide of zhouqu based on SBAS-InSAR technology. Earthq. Res. China 2020, 34, 510–522. [Google Scholar] [CrossRef]
  5. Aymar, P.; Luis, M. Seismic risk regularization for urban changes due to earthquakes: A case of study of the 2023 turkey earthquake sequence. Remote Sens. 2023, 15, 2754. [Google Scholar] [CrossRef]
  6. Zhang, S.Y.; Li, T.; Xia, Y. Study on Urban Area Subsidence Monitoring Based on InSAR Technique. Geomat. Inf. Sci. Wuhan Univ. 2008, 33, 850–853. [Google Scholar]
  7. Berardino, P.; Fornaro, G.; Lanari, R.; Sansosti, E. A new algorithm for surface deformation monitoring based on small baseline differential SAR interferograms. IEEE Trans. Geosci. Remote Sens. 2002, 40, 2375–2383. [Google Scholar] [CrossRef]
  8. Karami, J.; Babaee, F.; Mahmoudnia, P.; Kia, M.S. Integrated spatiotemporal data mining and DInSAR for improved understanding of subsidence related to groundwater depletion impacts. J. Geogr. Sci. 2025, 35, 598–618. [Google Scholar] [CrossRef]
  9. Xu, Y.M.; Wu, Z.; Zhang, H.W.; Liu, J.; Jing, Z.H. Land subsidence monitoring and building risk assessment using InSAR and machine learning in a loess plateau city—A case study of Lanzhou, China. Remote Sens. 2023, 15, 2851. Available online: https://www.mdpi.com/2072-4292/15/11/2851 (accessed on 5 May 2025). [CrossRef]
  10. Ma, F.; Sui, L.C.; Lian, W. Prediction of mine subsidence based on insar technology and the LSTM algorithm: A case study of the Shigouyi coalfield, Ningxia (China). Remote Sens. 2023, 15, 2755. Available online: https://www.mdpi.com/2072-4292/15/11/2755 (accessed on 5 May 2025). [CrossRef]
  11. Chen, Y.; Yu, S.W.; Tao, Q.X.; Liu, G.L.; Wang, L.Y.; Wang, F.Y. Accuracy verification and correction of D-InSAR andSBAS-InSAR in monitoring mining surface subsidence. Remote Sens. 2021, 13, 4365. Available online: https://www.mdpi.com/2072-4292/13/21/4365 (accessed on 5 May 2025). [CrossRef]
  12. He, Y.F.; Zhang, G.G.; Kaufmann, H.; Xu, G.C. Automatic interferogram selection for sbas-insar based on deep convolutional neural networks. Remote Sens. 2021, 13, 4468. Available online: https://www.mdpi.com/2072-4292/13/21/4468 (accessed on 5 May 2025). [CrossRef]
  13. Li, D.; Deng, K.Z.; Gao, X.X.; Niu, H.P. Monitoring and analysis of surface subsidence in Mining areas based on SBAS-InSAR. Geomat. Inf. Sci. Wuhan Univ. 2018, 43, 1531–1537. [Google Scholar] [CrossRef]
  14. Wang, P.; Zhang, C.; Tian, X.J.; Zhao, Y. Monitoring and analysis of ground subsidence in Weishan County based on SBAS-InSAR technology. Coal Sci. Technol. Mag. 2024, 45, 49–54. [Google Scholar] [CrossRef]
  15. Wang, B.J.; Shi, M.Y. Monitoring and analysis of land subsidence in Wuhan based on SBAS-InSAR technology. Sci. Technol. Innov. 2022, 33, 42–45. [Google Scholar]
  16. Ding, W.; Chen, Z.P.; Xu, B.; Feng, Z.X. Long time-series of surface deformation monitoring and cause analysis in Balyun district, Guangzhou base on SBAS-InSAR technology. Bull. Surv. Mapp. 2023, 4, 167–171. [Google Scholar] [CrossRef]
  17. Yi, H.J.; Zhu, J.J.; Li, Z.W.; Ding, X.L.; Wang, C.C. A study on deformation monitoring in Mining areas based on SBAS. J. Geod. Geoinf. Sci. 2011, 40, 52–58. [Google Scholar]
  18. Wang, R.; Feng, Y.J.; Tong, X.H.; Li, P.S.; Wang, J.F.; Tang, P.L.; Tang, X.Y.; Xi, M.G.; Zhou, Y. Large-scale surface deformation monitoring using sbas-insar and intelligent prediction in typical cities of yangtze river delta. Remote Sens. 2023, 15, 4942. [Google Scholar] [CrossRef]
  19. Chen, D.L.; Lu, Y.Y.; Li, M.C.; Zhou, Z. Land subsidence characteristics of cpec as revealed by SBAS-InSAR—A case of gwadar port pakistan. Fresenius Environ. Bull. 2022, 31, 1550–1560. [Google Scholar]
  20. Harintaka, H.; Suhadha, A.G.; Syetiawan, A.; Ardha, M.; Rarasati, A. Current land subsidence in jakarta: A multi-track SBAS-InSAR analysis during 2017–2022 using C-band SAR data. Geocarto Int. 2024, 39, 2364726. [Google Scholar] [CrossRef]
  21. Hussain, S.; Pan, B.; Afzal, Z.; Sajjad, M.M.; Kakar, N.; Ahmed, N.; Hussain, W.; Ali, M. SBAS-InSAR analysis of tectonic derived ground deformation and subsidence susceptibility mapping via machine learning in quetta city, pakistan. Int. J. Digit. Earth 2025, 18, 2441926. [Google Scholar] [CrossRef]
  22. Shi, Y.; Zhe, X.Y.; Zhang, Y.X.; Wang, K.; Zhang, K.; Wu, R. Monitoring and predicting mining subsidence in mining areas through SBAS-InSAR and CNN-LSTM. J. Saf. Environ. 2024, 24, 3429–3438. [Google Scholar]
  23. Majeed, M.A.; Shafri, H.Z.M.S.; Zulkafli, Z.; Wayayok, A. A deep learning approach for dengue fever prediction in malaysia using lstm with spatial attention. Int. J. Environ. Res. Public Health 2023, 20, 4130. [Google Scholar] [CrossRef] [PubMed]
  24. Liu, H.J.; Lei, D.X.; Yuan, J.; Le, H.J.; Shan, W.F.; Li, L.C.; Wang, H.R.; Li, Z.; Yuan, G.M. Lonospheric TEC prediction based on Attention-LSTM. Chin. J. Geophys. 2024, 67, 439–451. [Google Scholar]
  25. Sang, S.; Li, L. A novel variant of lstm stock prediction method incorporating attention mechanism. Mathematics 2024, 12, 945. [Google Scholar] [CrossRef]
  26. Ayad, A.; Amrani, M.; Bakkali, S. Quantification of the disturbances of phosphate series using the box-counting method on geoelectrical images (sidi chennane, morocco). Int. J. Geophys. 2019, 3, 1–12. [Google Scholar] [CrossRef]
  27. Ayad, A.; Tagma, T. Lithostratigraphic and seismic investigation of the weathered zone in the exploration of deep petroleum structures (Boujdour area, Morocco). Egypt. J. Pet. 2024, 33, 493–503. [Google Scholar] [CrossRef]
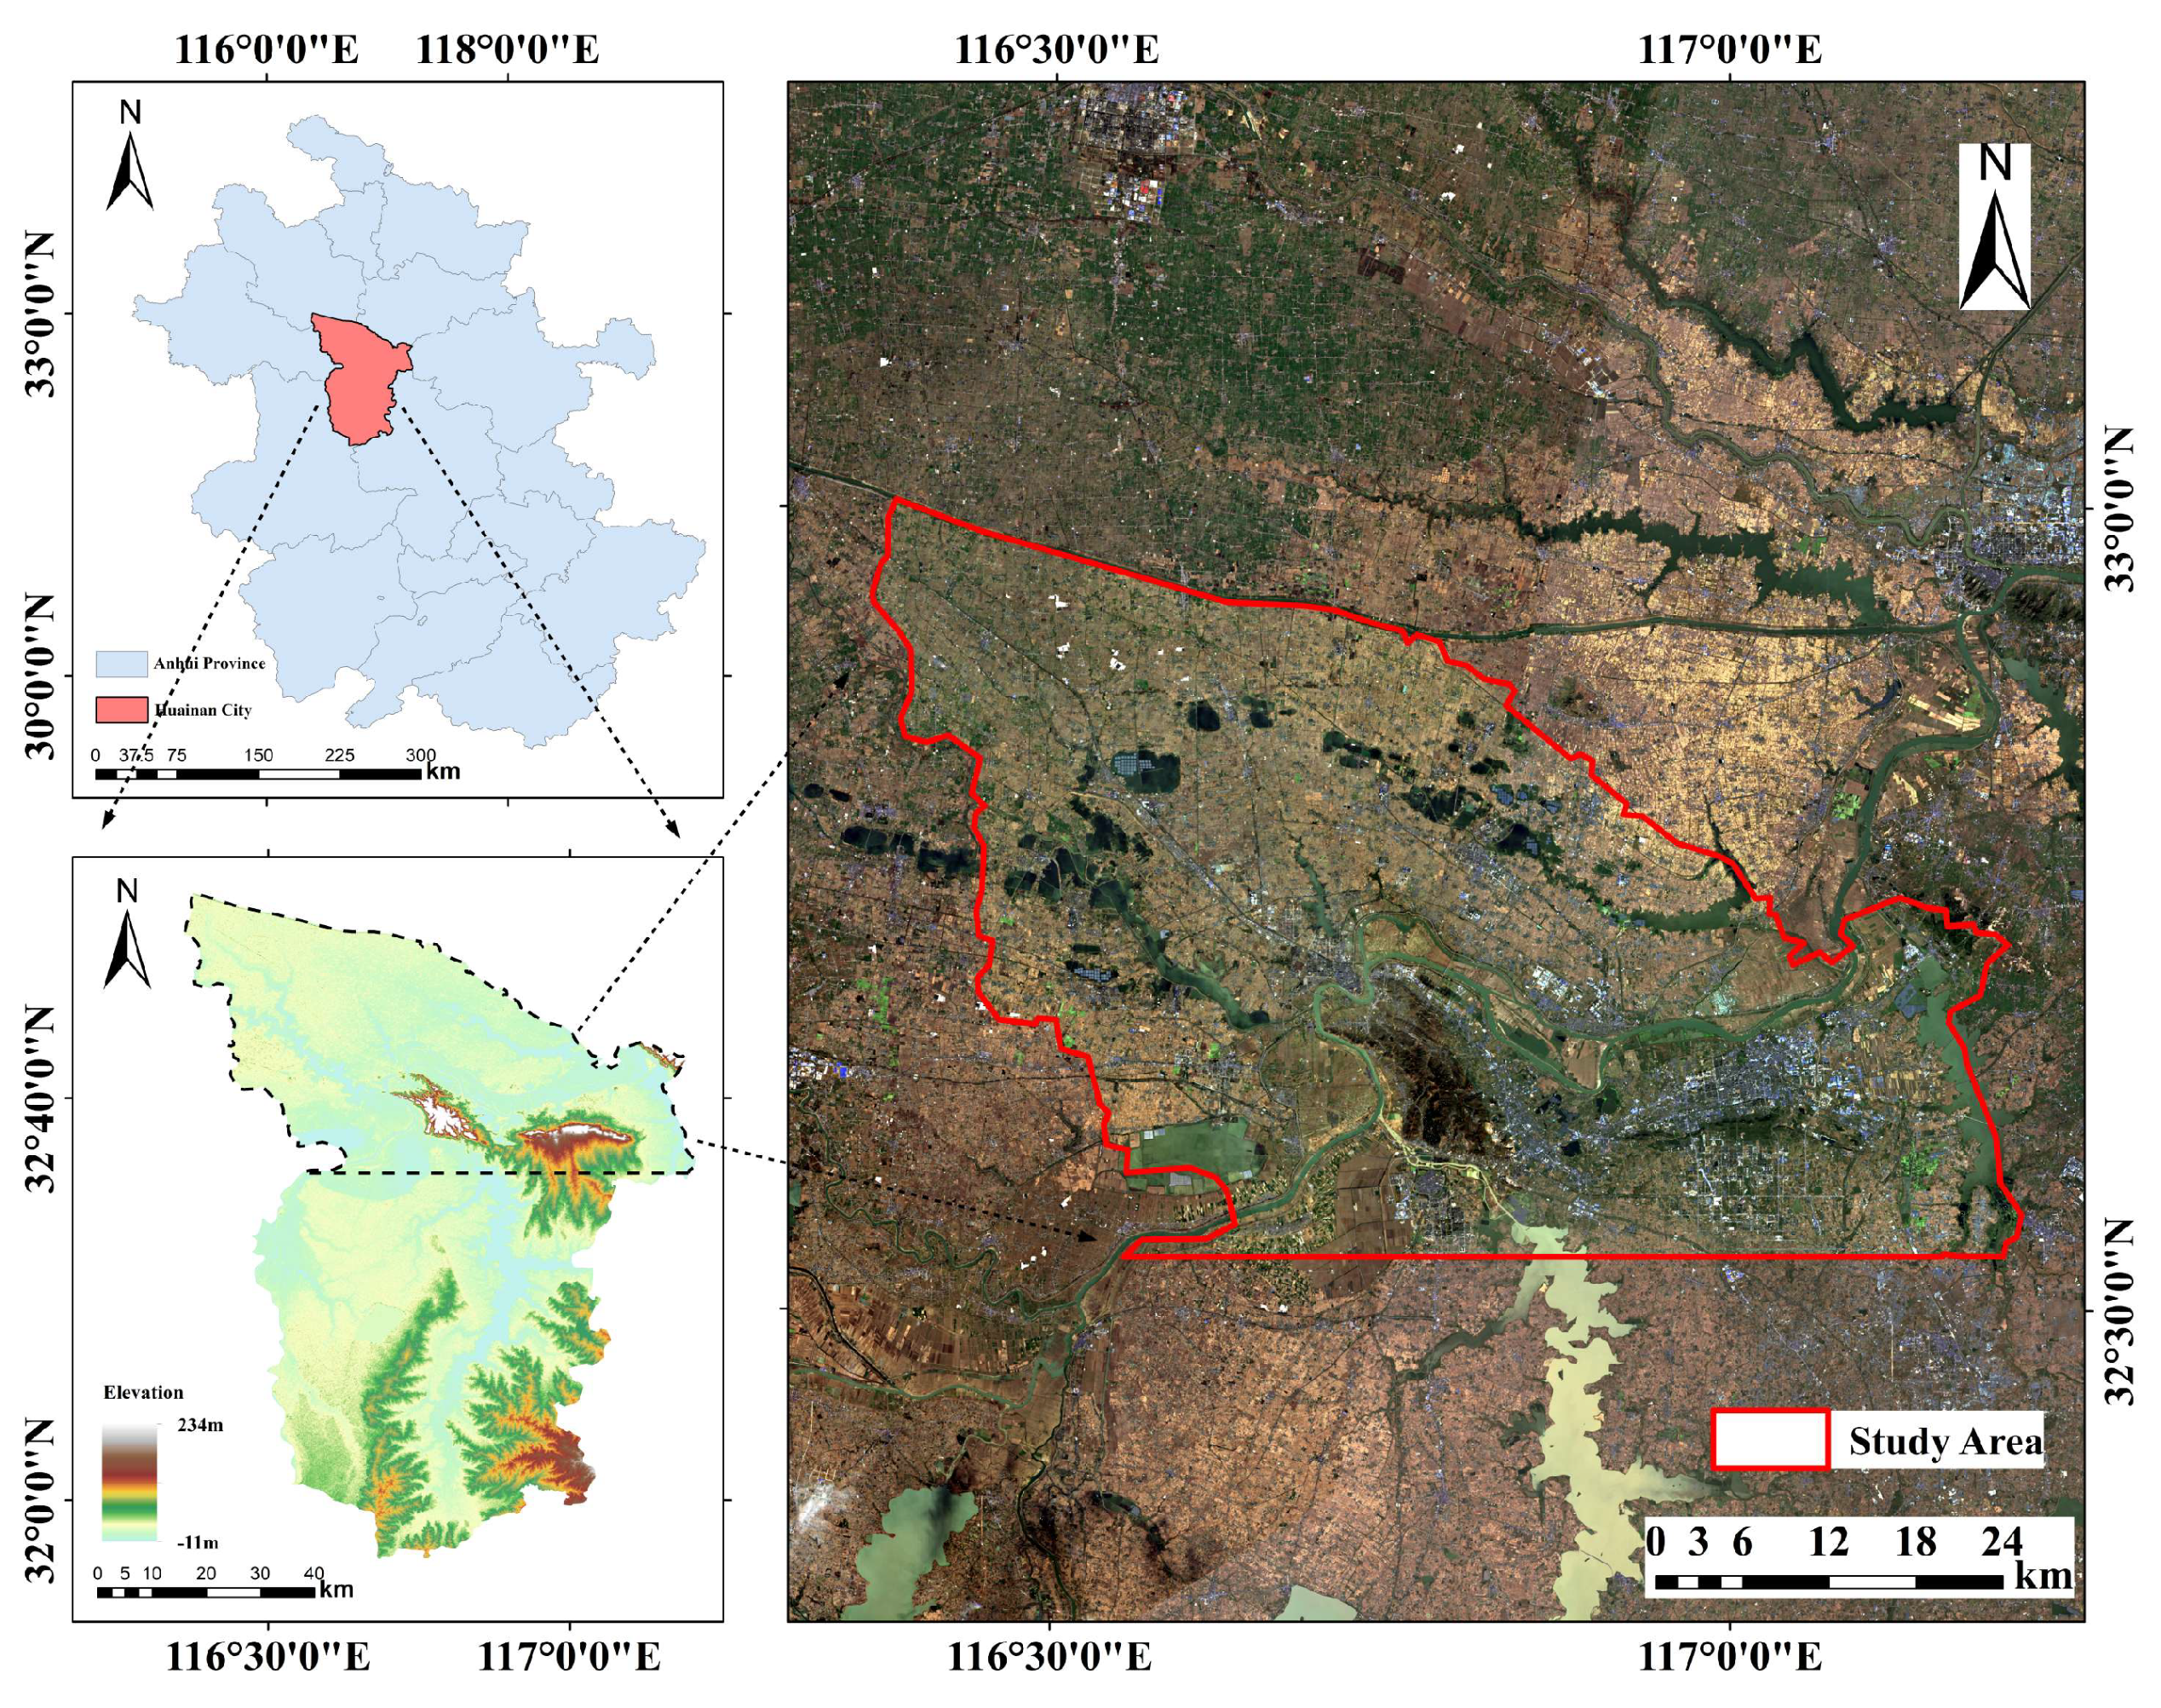
Figure 1. An Overview of the Northern Research Area of Huainan City.
Applsci 15 11780 g001
Figure 2. A schematic diagram of the structure of the LSTM–Transformer prediction model.
Applsci 15 11780 g002
Figure 3. A subsidence rate map of the northern part of Huainan City.
Applsci 15 11780 g003
Figure 4. The variation graph of sedimentation values at 8 research points over time.
Applsci 15 11780 g004
Figure 5. A comparison chart between the predicted results and the true values.
Applsci 15 11780 g005aApplsci 15 11780 g005b
Table 1. Parameter information of Sentinel-1A images.
Sensor Orbit Direction Revisit Period Polarization Mode Operating Mode Number of Images/Scenes
Sentinel-1A Ascending 12d VV IW 90
Table 2. The parameters of the LSTM–Transformer model.
ParametersSettings
Number of LSTM Layers64
Number of Transformer Layers64
Number of Transformer Encoder Layers2
Number of Attention Heads4
Input Windows32
Output Length7
Learning Rate0.001
OptimizerAdam
Batch Size16
Dropout Rate0.1
Activation FunctionTanh
Loss FunctionMSE
Epochs200
Table 3. Prediction accuracy of feature points (among them, A–D represent research points in the mining area, E, F in the urban area, and G, H in the decommissioned mining area).
Research PointSubsidence Rate
mm/yr
LSTMTransformerLSTM–Transformer
RMSE/mmMAE/mmRMSE/mmMAE/mmRMSE/mmMAE/mm
A−52.522.392.022.251.982.201.71
B−68.143.733.353.593.363.523.08
C−51.282.942.482.872.372.842.34
D−58.382.612.102.592.012.161.67
E−3.601.431.211.251.081.030.81
F−5.381.741.151.531.411.391.12
G−2.621.131.240.880.790.310.26
H−1.250.870.790.740.630.220.17
Disclaimer/Publisher’s Note: The statements, opinions and data contained in all publications are solely those of the individual author(s) and contributor(s) and not of MDPI and/or the editor(s). MDPI and/or the editor(s) disclaim responsibility for any injury to people or property resulting from any ideas, methods, instructions or products referred to in the content.