Abstract
Global road safety reports identify human factors as the leading causes of traffic accidents, particularly behaviors such as speeding, drunk driving, and driver distraction, emphasizing the need for autonomous driving technologies to enhance transport safety. This research aims to provide a practical model for the development of autonomous driving systems as part of an autonomous transportation system for inter-building passenger mobility, intended to enable safe and efficient short-distance transport between buildings in semi-open environments such as university campuses. This work presents a fully integrated autonomous platform combining LiDAR, cameras, and IMU sensors for mapping, perception, localization, and control within a drive-by-wire framework, achieving superior coordination in driving, braking, and obstacle avoidance and validated under real campus conditions. The electric golf cart prototype achieved centimeter-level mapping accuracy (0.32 m), precise localization (0.08 m), and 2D object detection with an mAP value exceeding 70%, demonstrating accurate perception and positioning under real-world conditions. These results confirm its reliable performance and suitability for practical autonomous operation. Field tests showed that the vehicle maintained appropriate speeds and path curvature while performing effective obstacle avoidance. The findings highlight the system’s potential to improve safety and reliability in short-distance autonomous mobility while supporting scalable smart mobility development.
1. Introduction
Electric golf carts are widely utilized for transportation in large or limited areas such as hospitals and university campuses due to their energy efficiency and compact design. These vehicles are particularly useful in carrying passengers and luggage, offering a practical alternative to conventional cars. Additionally, since they are electrically powered, they produce zero carbon emissions, making them an environmentally friendly choice for public spaces.
Effective transportation management is crucial in ensuring both efficiency and passenger safety. Studies indicate that human factors, such as driver fatigue and reduced attentiveness, are the primary causes of scheduling errors and accidents. This problem is intensified when drivers work irregular shifts, such as alternating between day and night, which elevates their workloads and safety risks. Moreover, controlling the vehicle speed and steering according to the road conditions is vital for passenger comfort and system reliability. Distracted driving has been shown to increase crash risks and impair driver performance [1]. To reduce the impacts of human error, the cited report highlights interventions such as automated speed enforcement and vehicle safety technologies, including electronic stability control and advanced braking systems, which can support drivers and mitigate the consequences of unsafe behavior. Furthermore, recent studies on trust assessment in autonomous golf carts emphasize the importance of user confidence and interaction in the deployment of such systems [2].
Regarding the above challenges, autonomous electric golf carts present a viable solution. In this research, we used the Club Car Precedent four-seat electric golf cart (as shown in Figure 1) as the base platform for the development of an autonomous system. Through the integration of an optimized transportation system, the vehicle can enhance both time management and safety while minimizing human-related risks. Autonomous vehicle systems are designed to sense, interpret, and act with minimal or no human intervention. According to the SAE J3016 standard, their levels of automation range from fully manual (level 0) to fully autonomous (level 5) [3]. As these systems evolve, they are typically structured around three main modules: perception, planning, and control [4]. A notable example of full autonomy is represented by the successful 103 km journey of the Mercedes-Benz S-Class S 500 INTELLIGENT DRIVE along the historic Bertha Benz Memorial Route in Germany [5]. Moreover, several recent developments demonstrate the implementation of autonomous navigation and control systems in electric golf carts, such as the intelligent driving assistance system proposed by Liu et al. [6], the self-driving CART platform using LiDAR and stereo vision presented by AlSamhouri et al. [7], and the deep learning-based navigation approach described by Panomruttanarug et al. [8].
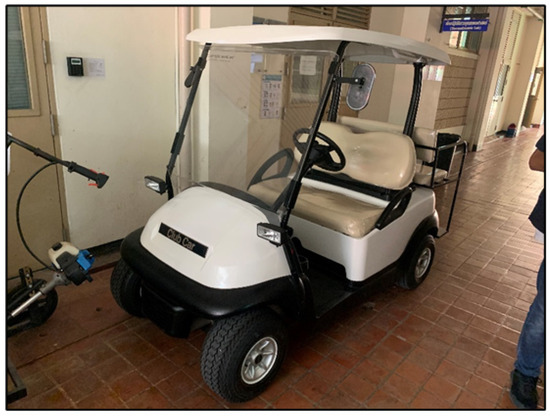
Figure 1.
Club Car Precedent electric golf cart.
Sensor technology plays a fundamental role in the perception systems of autonomous vehicles. According to Hirz et al. [9], sensor selection must align with the functional requirements defined according to the levels of automated driving, with current and emerging technologies evaluated for their suitability for object detection and classification. Cameras and LiDAR are widely used; cameras assist with object recognition, while LiDAR offers precise depth and spatial measurements that are independent of lighting. Chen et al. [10] proposed a multi-view 3D detection framework that fuses LiDAR point clouds and RGB images to enhance the accuracy of 3D object detection. Similarly, many autonomous systems adopt sensor fusion strategies to improve perception reliability. Recent studies highlight the effectiveness of multi-sensor fusion and segmentation using deep reinforcement learning and DQN-based frameworks [11], as well as enhanced obstacle avoidance through adaptive fusion algorithms combining LiDAR, radar, and cameras [12]. For cooperative environments, LiDAR–depth camera fusion has also been applied to improve safety in human–robot interaction systems [13]. The emergence of neural rendering and robust 3D object detection techniques, such as SplatAD [14], robustness-aware models [15], and advanced voxel-based approaches [16], has led to further enhancements in environmental understanding. For autonomous golf carts, LiDAR remains the preferred sensing modality due to its robustness under variable lighting conditions [17].
In addition to real-time sensing, high-definition (HD) maps are essential for localization, route planning, and situational awareness in autonomous systems. Poggenhans et al. [18] introduced Lanelet2, an open-source HD map framework designed for a wide range of applications in highly automated driving, including but not limited to localization and motion planning. To achieve accurate localization, various map representations, such as Gaussian mixture models and 3D point cloud maps, are aligned with real-time sensor data using registration algorithms such as Iterative Closest Point (ICP) or Normal Distributions Transform (NDT). Wolcott and Eustice [19] demonstrated robust LiDAR-based localization using multi-resolution Gaussian mixture maps. Liu et al. [20] employed the NDT within a SLAM framework to reconstruct high-precision point cloud maps. More recent advancements, including LiDAR–IMU fusion with uncertainty estimation [21], long-term odometry and mapping systems [22], and integrated GNSS/IMU/LiDAR mapping [23], have demonstrated centimeter-level precision. A comprehensive review by Fan et al. [24] further categorized multi-sensor fusion SLAM systems into LiDAR–IMU, visual–IMU, LiDAR–visual, and LiDAR–IMU–visual combinations and emphasized the advantages of hybrid localization methods for autonomous platforms.
Object detection is critical for autonomous vehicles to navigate safely in dynamic environments. You Only Look Once (YOLO) is a widely used real-time algorithm for 2D object detection that processes images using a single neural network for fast and efficient identification [25]. For 3D perception, models such as MV3D integrate RGB images with LiDAR point clouds to generate accurate 3D bounding boxes, enhancing the spatial understanding of surrounding objects [10]. Recent research has extended this capability with YOLOv11 for high-precision vehicle detection [26] and object recognition in complex environments [27].
In this study, all key modules, including perception, localization, planning, and control, were integrated into the Club Car Precedent electric golf cart platform. A LiDAR sensor and camera were installed, along with onboard CPU and GPU units for real-time processing. Localization was achieved using HD maps based on point cloud data, with alignment performed through the Normal Distributions Transform (NDT) algorithm. Both 2D and 3D object detection techniques were incorporated into the system to identify static and dynamic obstacles. The final autonomous system possessed self-driving capabilities, including automated acceleration, braking, steering, and collision avoidance, being suitable for low-speed environments such as campuses and public facilities. This paper evaluates the performance of such an autonomous golf cart system under controlled campus environments to validate its operational accuracy and reliability.
2. Electric Golf Cart and Sensor Testing
The steer-by-wire mechanism integrates an electrical motor and encoder, employing electrical signals to regulate the cart’s turning angle. The throttle-by-wire system is designed to control the electrical voltage to the motor, with both systems governed by closed-loop control and utilizing an Arduino UNO R3 for PID control. Meanwhile, the brake-by-wire system manages the fluid pressure in the motor brake system. The throttle, brake, and steering wheel setup used in this research is illustrated in Figure 2. These systems, designed for the study of PID control [28], collectively enhance the electric golf cart’s driving control.
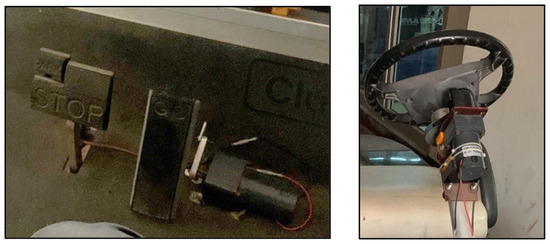
Figure 2.
Brake, throttle, and steering wheel.
The electric golf cart is equipped with a Logitech C920 webcam and a Velodyne Puck VLP-16 LiDAR (as shown in Figure 3). To ensure efficient real-time processing in handling both the camera and LiDAR data, the Mini-ITX PC with an Intel CORE I7-11700K and Nvidia Geforce RTX3080Ti serve as the central processor unit and graphic processor unit, respectively, and are installed at the rear of the cart, as shown in Figure 4. The LiDAR operates on a 12 Vdc supply from the battery, while the cart’s battery provides 48 Vdc to the processor unit. The webcam is connected to the central processor unit via USB.
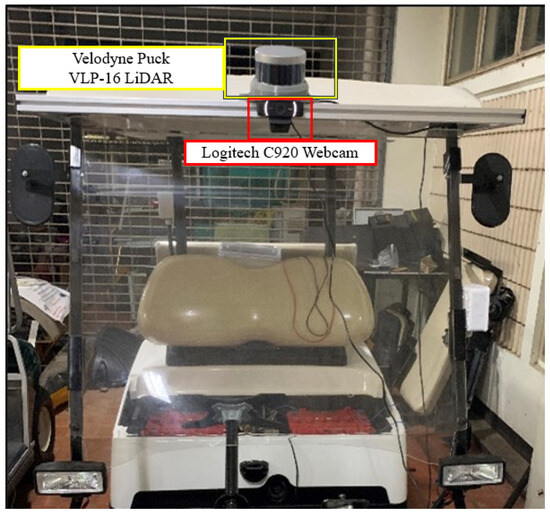
Figure 3.
Camera and LiDAR installation at the front of the cart.
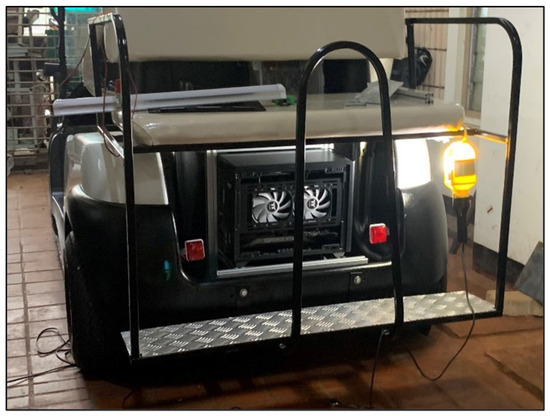
Figure 4.
CPU and GPU installation at the rear of the cart.
The camera and LiDAR components necessitate dedicated software for the processing of the generated data. The camera transmits data in the form of a three-layer array, while the LiDAR provides point cloud scanning data. However, the utilization of a camera necessitates calibration to compensate for errors and distortions in the acquired images. This is achieved through intrinsic camera calibration, which involves capturing images of a checkerboard at various angles (demonstrated in Figure 5). The data from these images are then employed to calculate a transform matrix, allowing the precise adjustment and correction of the camera’s output.
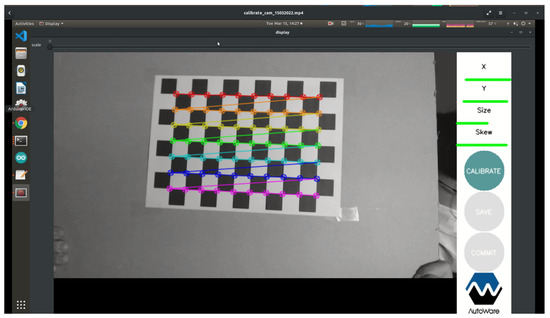
Figure 5.
Camera calibration with checkerboard.
3. High-Definition Map and Point Cloud Registration
3.1. High-Definition Map
High-definition (HD) maps were first introduced by Ziegler et al. [5] in 2010, during the development of the Mercedes-Benz S500 INTELLIGENT DRIVE. This vehicle successfully completed a 103 km fully autonomous journey on the Bertha Benz Memorial Route, using a 3D HD map for precise localization.
Poggenhans et al. [18] later developed Lanelet2, an open-source HD map framework structured into two main layers. The first is a point cloud map, constructed using LiDAR data through a process called point cloud registration. The second is a road lane layer, composed of connected lines and junctions that represent traffic lanes. This layer allows the localization of infrastructure features such as stop lines and traffic signal poles, making it highly suitable for autonomous navigation in structured environments.
3.2. Point Cloud Registration
Point cloud registration is a crucial step in building 3D maps and can be achieved using two main algorithms: Iterative Closest Point (ICP) and Normal Distributions Transform (NDT). Su Pang et al. [29] compared these two algorithms in a real-world setting at Michigan State University using a Velodyne Puck LiDAR and a NovAtel ProPak7 GNSS inertial navigation system. They generated a 3D point cloud map of a 350 m area in real time. Both methods produced usable maps, but the NDT outperformed ICP by offering faster processing and lower error rates; this led to our decision to adopt NDT in this research.
NDT is an algorithm that registers current LiDAR scans to a reference map by estimating the probability distribution of the points in each cell of the reference frame, rather than relying on direct point-to-point matching [30]. This probabilistic approach enhances its robustness and reduces the computational burden, making NDT highly efficient and suitable for platforms with limited processing power.
In this research, the generation of a high-definition map was conducted in two stages. First, the robot operating system (ROS) was used to derive input from LiDAR scans, which were processed using the NDT algorithm. The golf cart was manually driven at a controlled speed of 10 km per hour throughout the service area to collect point cloud data. As a result, a 3D point cloud map was created, covering both indoor and outdoor environments. This process was repeated to produce three maps used to validate the system’s dimensional accuracy.
In the second stage, the point cloud data served as the basis for the definition of the route geometry and attitude within the path planning module. The final HD map was implemented using the Lanelet2 library, combining traffic paths with the point cloud map to support both localization and environment recognition for autonomous navigation.
4. Autonomous Driving System
Claudine et al. [31] stated that the architecture of the autonomous system in a self-driving car is typically divided into two main components: the perception system and the decision-making system. In this section, the development of the autonomous system is described in the context of this structure, relying on the robot operating system (ROS) and utilizing prepared data obtained from sensors combined with high-definition map data. The acquired data are subsequently processed to facilitate the effective control and handling of the golf cart.
4.1. Localization
The use of the Normal Distributions Transform (NDT) algorithm for autonomous vehicle localization has been explored in several studies. Naoki et al. [32] generated a 3D point cloud map of the Gwangju Institute of Science and Technology using a VLP-32 LiDAR and demonstrated that NDT enables real-time localization. Likewise, Liu et al. [33] proposed using NDT as an alternative to GPS in environments where satellite signals are obstructed by buildings. They showed that the mean square error in NDT localization was comparable to that of GPS, supporting its effectiveness in GPS-denied environments.
Building upon this foundation, our research employs NDT localization within a controlled service area using a point cloud map generated from LiDAR data. The localization process begins with configuring commands in the robot operating system (ROS) to acquire both the pre-built HD map and real-time LiDAR scan data. These datasets are processed using the NDT algorithm, as demonstrated in the indoor testing illustration shown in Figure 6.
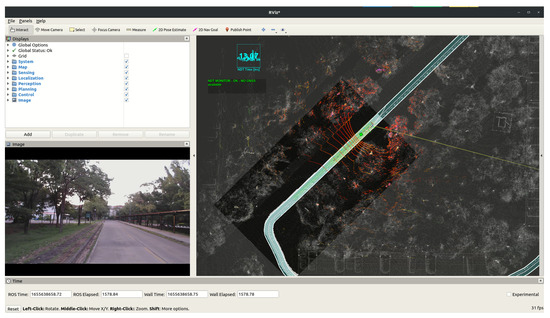
Figure 6.
NDT localization testing inside the building.
During localization, the system first initializes its position by assigning an origin point, typically (0, 0, 0), within the map’s coordinate frame. To evaluate the localization performance, twelve reference points were selected along the golf cart’s path. Coordinates for these points were extracted from the point cloud map and compared to manually measured data using CloudCompare. At each reference point, the localization origin was set as the midpoint between the rear tires of the cart. These physical locations were marked on the testing ground using tape, as illustrated in Figure 7. The calibration positions are presented in Figure 8.
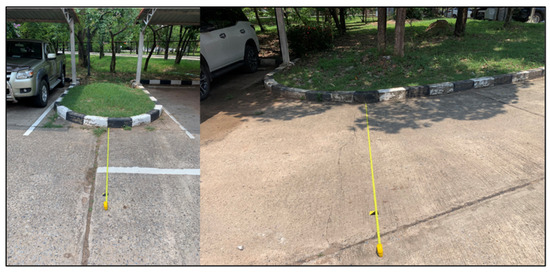
Figure 7.
Measurement with tape for reference.
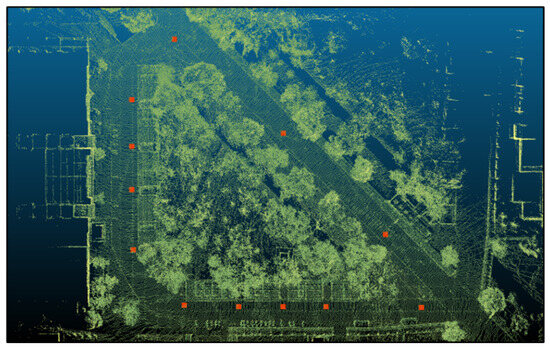
Figure 8.
Localization calibration positions.
4.2. Two-Dimensional Object Detection
The training data were collected using the golf cart, aiming to capture images containing humans, cars, and motorbikes. YOLOv11 was selected as the model in this work because it is the latest version in the YOLO series, featuring architectural improvements such as C3K2 blocks, Spatial Pyramid Pooling Fast (SPFF), and C2PSA attention mechanisms. These enhancements improve the detection performance for small and partially occluded objects, allowing the earlier and more reliable recognition of pedestrians, vehicles, and motorcycles, which may appear smaller or partly hidden in the scene. Such capabilities are particularly valuable for autonomous driving systems, where rapid detection in complex outdoor environments supports safe navigation and collision avoidance. After model selection, the dataset was annotated using Supervise.ly and divided into training and testing subsets, representing 80% and 20% of the total images, respectively. The model was trained and tested using data captured under daytime conditions, aligning with the golf cart’s intended inter-building operation during daylight hours.
To quantify the object detection performance in the test set, the mean average precision (mAP) is calculated, serving as a metric to assess the overall effectiveness of the YOLOv11 model. The results are compared with those of the YOLOv11 COCO model to verify the environment encountered by the golf cart. The model’s weights are further tested under varying times of day to assess its positioning accuracy and precision in determining the size of the detected object. Figure 9 demonstrates how the person and cart classes are labeled, and Figure 10 demonstrates the car and motorcycle classes’ labeling.
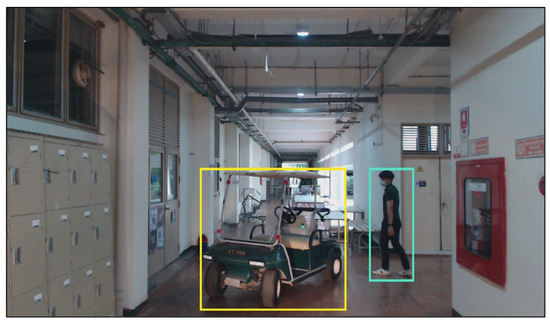
Figure 9.
Example of labeled image illustrating 2D object detection results. Yellow bounding box indicate golf cart class, while blue bounding box represent person class.
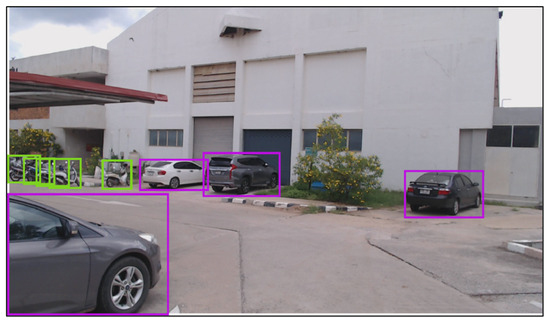
Figure 10.
Example of labeled image illustrating 2D object detection results. Purple bounding boxes indicate car class, while Green bounding boxes represent motorcycle class.
4.3. Point Cloud Clustering
Euclidean clustering is employed to segment point cloud data into distinct groups representing individual objects in the environment. Anjani et al. [34] demonstrated the effectiveness of this method for real-time object identification around autonomous vehicles. In their approach, point cloud data obtained from LiDAR were first filtered using a voxel grid filter and then divided into smaller sections through slicing. The ground plane was removed using the RANSAC algorithm, which enabled the identification and exclusion of points lying on the same plane. The remaining non-ground points were then processed using Euclidean clustering, grouping nearby points and identifying them as individual objects.
In this study, the Euclidean clustering method is implemented by scripting commands to extract LiDAR data and initiate the clustering process. The primary objective is to support three-dimensional object detection. After clustering, the results are evaluated in terms of the object positioning accuracy and the precision of object size estimation. The results of the point cloud clustering process are illustrated in Figure 11.
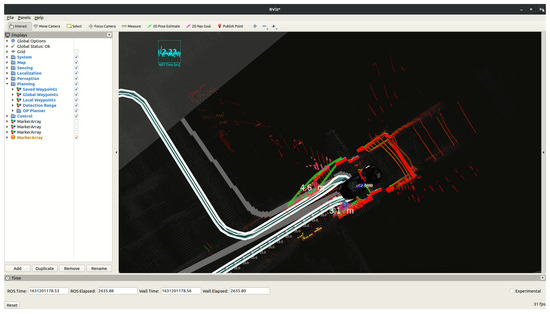
Figure 11.
Testing point cloud clustering at the front of the cart.
4.4. Three-Dimensional Object Detection
In this work, 3D object detection in the autonomous driving system involves the utilization of the robot operating system to process the clustered point cloud data obtained from the surroundings of the golf cart. These clustered data reflect both objects and the ambient environment and are derived through bounding box data generated by the YOLOv11 object detection model. The approach employs the middle point of the clustered point cloud associated with each object, which is then compared with the middle pixel of the object within the detected image. Furthermore, a comparative analysis is conducted by leveraging extrinsic camera–LiDAR calibration techniques.
This process involves the creation of 3D bounding boxes encapsulating each group of point cloud data. These bounding boxes serve a dual purpose: elucidating the dimensions of the detected object and contributing to the localization of this object within a grid map. The 3D object detection process is demonstrated in Figure 12.
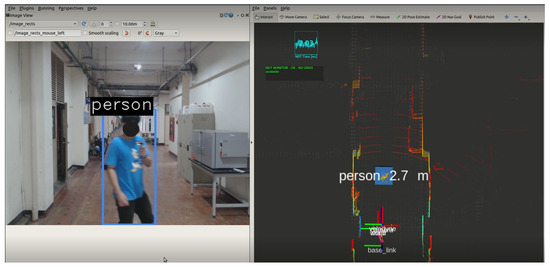
Figure 12.
Detection and localization of person class used in 3D object detection.
4.5. Grid Map Generation
Autonomous driving operations are managed through decision-making based on a 2D map or a grid map. Here, the grid map is generated using the high-definition map, point cloud data, traffic path information, cart localization data, 3D object detection results, and point cloud scanning data from the cart. The processing of these data is executed with a precision of 0.05 cm.
In grid map generation, each point is assigned a value or either 1 to indicate the position of an object or 0 to indicate a feasible path for the cart. Precision in positioning is achieved through data integration from point cloud scanning and point cloud map sources. Additionally, the height of each object is considered in this process, and restrictions are imposed to ensure that the cart is not permitted to traverse areas identified as occupied in both the point cloud scanning and point cloud map data.
4.5.1. Path Planning
Sedighi et al. (2019) [35] proposed the use of the A* algorithm for autonomous vehicle path planning in parking lot scenarios. Their simulations, conducted over 1000 runs under various conditions, showed that the A* algorithm enabled the efficient identification of the shortest path and the successful avoidance of collisions with both static and dynamic obstacles. Considering a different domain, Liu et al. (2019) [20] addressed the limitations of the traditional A* algorithm in maritime navigation, where additional factors such as obstacle risks, traffic separation rules, vessel maneuverability, and water currents must be considered. They proposed an improved A* algorithm that integrates these risk models to balance the path length with navigation safety, demonstrating its effectiveness through simulations and real-world scenarios.
Building on these insights, our path planning system applies the A* algorithm using data extracted from the grid map, enabling the identification of feasible paths for the golf cart, in combination with information from the high-definition map. The data are processed to generate a collision-free path, using A* to evaluate multiple route options and selecting the one with the lowest cost. This approach ensures that the golf cart navigates safely around obstacles while adhering to defined traffic lanes.
4.5.2. Path Tracking Control
Path tracking control involves two widely used approaches: pure pursuit control and model predictive control (MPC). Rokonuzzaman et al. (2021) [4] compared both methods and found that pure pursuit is more suitable for low-speed autonomous vehicles due to its simplicity, lower computational demands, and reliable tracking performance when the vehicle starts on-path. It operates by generating a curved path toward a target point at a specified look-ahead distance using the vehicle’s kinematic model. In contrast, MPC evaluates the system’s future states based on a dynamic model and updates the control commands in real time, offering higher accuracy and adaptability but at the cost of greater computational resource consumption.
In this study, pure pursuit (as shown in Figure 13) is implemented, leveraging path data derived either from the path planning module or from center-lane tracking. The algorithm processes these data to control the vehicle’s steering based on the golf cart’s kinematic model. The main output is the steering angle command, a critical element of low-level control. The proper tuning of the look-ahead distance is essential to optimize system performance, enabling the vehicle to anticipate and respond to path changes effectively while maintaining stability and smooth navigation.
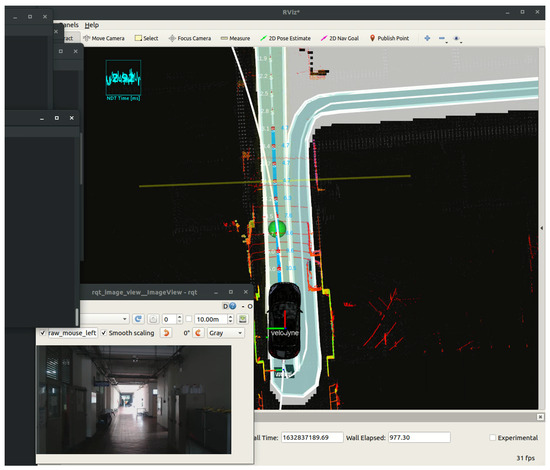
Figure 13.
Testing of pure pursuit control.
4.5.3. Curve Speed Control
The forces acting along the lateral and longitudinal axes play a critical role in determining vehicle stability and passenger comfort during autonomous operation. According to Gill et al. [36], an understanding of these directional forces is essential in designing effective control mechanisms, particularly in systems involving four-wheel drive dynamics. Building on this, Il Bae (2019) [37] found that, for optimal control and ride comfort, the acceleration values should remain within the range of to along both axes. Moreover, their study highlighted that human sensitivity to vibrations is highest within the frequency range of 4 to 16.5 Hz in both the lateral and longitudinal directions. Maintaining the control inputs within these thresholds ensures smoother navigation and reduces discomfort caused by excessive motion or vibrations.
In alignment with the above, the current research incorporates the Xsense MTi-30 inertial sensor (Xsens Technologies B.V., Enschede, The Netherlands), installed at the point nearest to the center of gravity on the golf cart (illustrated in Figure 14). Experimental trials were conducted on a designated testing route, wherein the autonomous driving cart maintained a constant speed. Acceleration measurements in the lateral and longitudinal axes were recorded as the vehicle entered curves within the testing area. The tests were divided into five phases, varying the speed between 5 and 10 km per hour. The tests were intended to ascertain the most suitable speed for entering curves in the testing area, subsequently informing the optimization of the autonomous driving system.
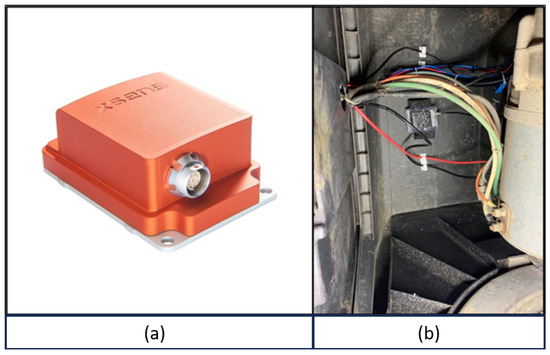
Figure 14.
(a) Xsense MTi-30 inertia sensor (from datasheet [38]); (b) inertia sensor installed on golf cart.
5. Results and Discussion
5.1. Generation of High-Definition Map
A point cloud map was transformed into 3D maps using Normal Distributions Transform (NDT) mapping, resulting in three separate maps. To evaluate the system, the golf cart was driven for three laps along a designated lane. Calibration was performed by comparing the sizes of the point cloud maps with the actual physical area. Eight reference points on the point cloud maps were measured using the CloudCompare software and compared to real-world measurements.
Figure 15 shows the top view of the high-definition map generated from the point cloud data, while Figure 16 illustrates the locations where measurements were taken for comparison. The localization errors calculated from this comparison are summarized in Table 1, with distance errors of 1.15%, 1.17%, and 1.28% for maps 1, 2, and 3, respectively. Localization accuracy tests yielded mean absolute error (MAE) values of 0.082 m, 0.078 m, and 0.075 m for tests 1, 2, and 3, respectively.
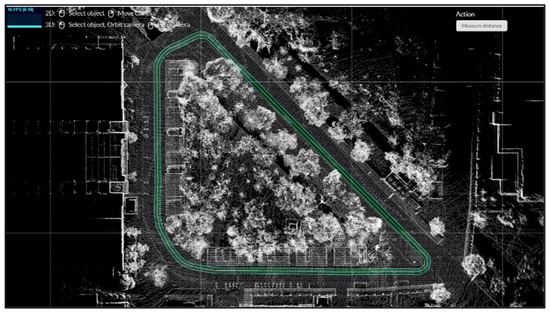
Figure 15.
The top-view high-definition map of the test building.
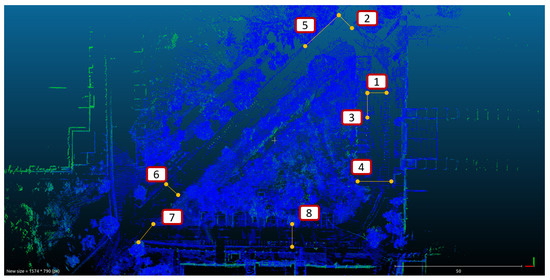
Figure 16.
Measurement locations on the high-definition map used to compare point cloud data with real-world reference points.

Table 1.
Distance and error comparison between maps and ground truth.
The largest error in map 1 was the lowest compared with the other maps, with the errors remaining at the centimeter level. The maximum error value observed was only 0.32 m, corresponding to 2.57%. Therefore, map 1 was selected as the high-definition map for this research.
The centimeter-level mapping errors demonstrate that the NDT-based mapping system provides sufficient accuracy for low-speed autonomous navigation, where deviations below ±0.5 m are generally acceptable for safe path tracking. The slightly higher variation among maps is likely caused by LiDAR alignment offsets, surface reflectivity differences, and environmental lighting during data collection. Compared with previous research on low-speed autonomous platforms, the obtained 0.32 m maximum error indicates a reliable mapping precision within the operational threshold, confirming the system’s readiness for subsequent localization and testing in autonomous driving systems.
5.2. Localization System
The localization system was evaluated using an autonomous golf cart operating on the roadway in front of the test building, which featured sufficiently wide paths. The cart’s estimated positions, derived by applying the Normal Distributions Transform (NDT) to the point cloud data, were compared against the actual positions measured at 12 designated test points. The positional errors along the x- and y-axes are presented in the bar charts shown in Figure 17 and Figure 18, respectively.
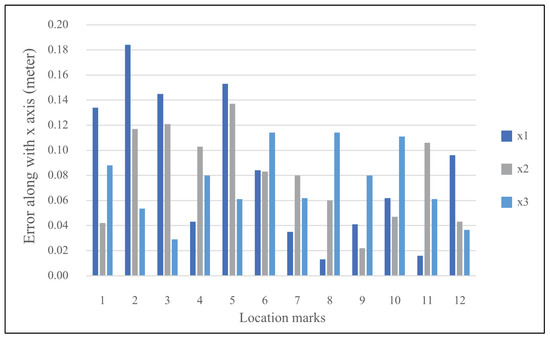
Figure 17.
Positional errors along the x-axis at 12 test points across three localization tests using NDT-based point cloud data.
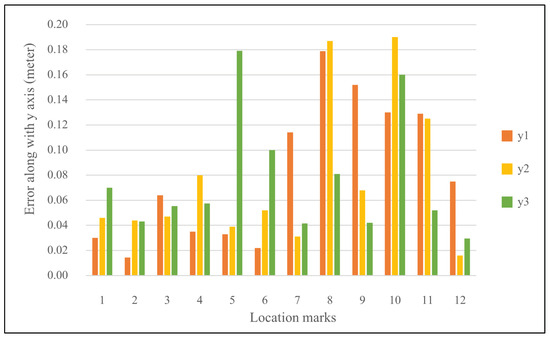
Figure 18.
Positional errors along the y-axis at 12 test points across three localization tests using NDT-based point cloud data.
The average localization errors were 0.082 m, 0.078 m, and 0.075 m for tests 1, 2, and 3, respectively, demonstrating a consistent accuracy across trials. The distribution of the x-axis errors varied slightly among the test points, mainly influenced by small differences in the cart’s manual initialization and the iterative alignment characteristic of the NDT algorithm. Because the vehicle’s starting pose was manually adjusted before each run, even minor offsets in orientation or position could affect the scan matching. Likewise, the probabilistic surface-fitting process in the NDT can result in convergence to slightly different local minima depending on the point density, resulting in small positional shifts. The highest x-axis error of 0.184 m occurred at point 2 in test 1, while the overall average x-axis error remained at 0.079 m, confirming the stable centimeter-level precision across tests.
Similarly, the y-axis error distribution was uneven but exhibited comparable average errors across all tests. The maximum y-axis error of 0.190 m occurred at point 10 in test 2, with an overall average error value of 0.078 m. These findings indicate that the localization system maintained a stable and comparable performance in both the x and y directions.
The localization accuracy results show that the NDT-based approach provided stable and precise position estimation across all three tests. The x- and y-axis errors remained below 0.2 m, with averages of 0.079 m and 0.078 m, respectively, indicating a high level of consistency in both directions. These results confirm that the system could accurately align the LiDAR-derived point clouds with the high-definition map, ensuring reliable position updates during operation. The small variations observed among the test points mainly resulted from LiDAR alignment offsets, NDT computation delays, and manual initialization during testing.
5.3. Results of Two-Dimensional Object Detection
The data consisted of 1726 images, containing 1064 human targets, 2312 car targets, 874 motorcycle targets, and 586 golf cart targets. The dataset was split according to a 9:1 ratio, with 1554 images for training and 172 images for testing. Using a batch size of 64 and running 100,100 iterations, the loss at the final iteration was 0.3176.
The evaluation metrics are presented in Table 2. The mean average precision (mAP) at a 0.5 intersection over union (IoU) for each class exceeded 70%. This level of performance surpasses that of the YOLOv11 model trained on the COCO dataset (mAP of 55.3%), mainly because the model used in this study was pretrained for autonomous golf cart operation, using a dataset captured in the target environment that contained fewer object classes and more consistent contextual features. This environment-specific dataset allowed the detector to better focus on relevant visual patterns, resulting in a higher detection accuracy within the golf cart’s operational area. Examples of detections are illustrated in Figure 19 and Figure 20.

Table 2.
mAP (%) at 0.5 IoU for each class.
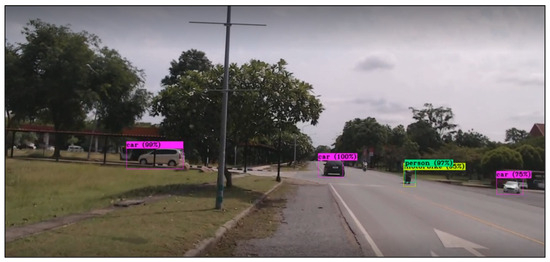
Figure 19.
Example of 2D object detection showing person, motorbike, and car accurately identified in the test image.
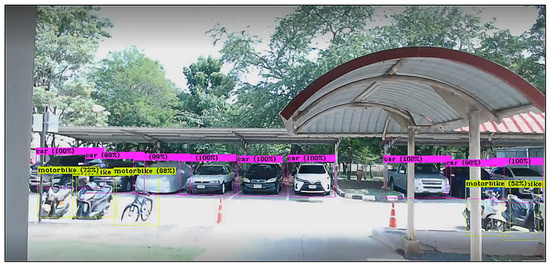
Figure 20.
A 2D object detection example, showing a motorcycle and car identified in the test image.
The results confirm that the pretrained YOLOv11 provides a sufficient accuracy for real-time perception in low-speed autonomous driving. The simplified class set and consistent scene context improved the detection reliability compared with generic models trained on large, diverse datasets. Minor accuracy reductions were observed under intense sunlight or partial occlusion, indicating that the performance could be further improved by incorporating additional lighting conditions in future datasets.
5.4. Results of Three-Dimensional Object Detection
The 2D object detection model described in the previous subsection was integrated with point cloud segmentation data to enable 3D object detection and localization. This evaluation focused specifically on the 3D detection and localization of the human class, with the results summarized in Table 3.

Table 3.
Detection distance at different measurement distances.
Testing revealed that the effective operational range of the 3D detection system was limited to 2–9 m. Objects located too closely or beyond this range could not be accurately localized in 3D. At close distances, large objects produced dense point cloud data that could not be reliably mapped to the corresponding 2D pixel coordinates. As a result, when the 2D detection centroid pointed to uncalibrated point cloud data, 3D localization failed, even though 2D detection and point cloud clustering remained possible. At distances beyond 9 m, while 2D detection continued to take place, the point cloud data became too sparse for consistent grouping due to the increasing spacing between LiDAR points at greater ranges, resulting from the angular scanning characteristic of the sensor.
The 2–9 m effective range corresponds to the practical detection zone of the LiDAR sensor, which supports collision avoidance in combination with the YOLOv11 model. Since YOLOv11 can detect small objects and pedestrians in 2D images, the system uses this visual information to anticipate potential obstacles before they enter the critical LiDAR range. Within the 2–9 m distance range, the LiDAR provides a sufficient point cloud density for accurate 3D localization and distance estimation, enabling timely braking or avoidance. This range is therefore suitable for low-speed golf cart operation at 5–10 km/h, where it aligns with the vehicle’s braking distance and safety margins. Future work could integrate the 2D detection output for predictive collision forecasting, allowing the system to initiate early responses before an object enters the LiDAR detection range.
5.5. Results of Curve Speed Control
The curve navigation performance of the autonomous golf cart was evaluated at constant speeds ranging from 5 to 10 km/h. The actual trajectory was compared with the planned path, as shown in Figure 21 and Figure 22. The results indicate that higher speeds reduced the vehicle’s ability to follow the curved path due to the limited response time of the low-level steer-by-wire system. At 5 km/h, the cart accurately followed the intended path, but the deviations increased with greater speeds.
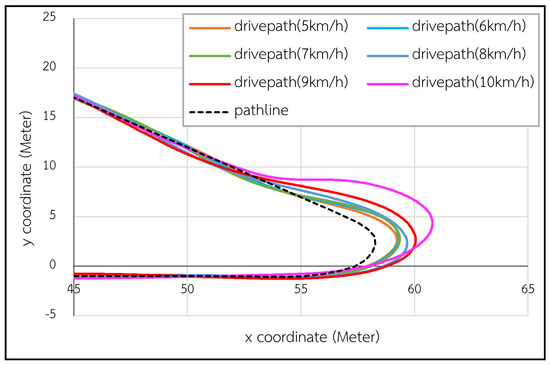
Figure 21.
Curve speed control at curve 1.
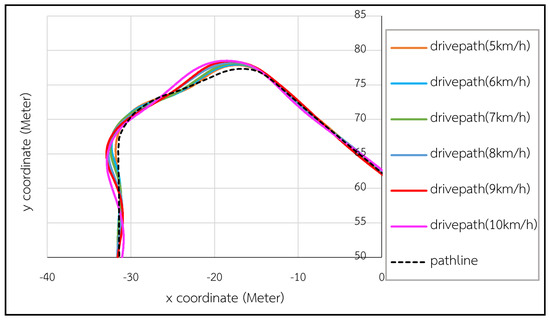
Figure 22.
Curve speed control at curves 2 and 3.
The steering lag was mainly caused by actuator response delays and control loop latency. The steering motor has a finite rise time, and the control signal passes through multiple stages of feedback and communication, including PID processing and CAN bus transfer, resulting in a total delay of about 150–200 ms. At higher speeds, this delay leads to greater lateral deviations before correction, while minor backlash in the steering linkage adds a slight delay in the angular response when encountering sharp curves.
Ride comfort was evaluated based on lateral acceleration, interpreted through the ISO 2631-1 whole-body vibration framework [39]. According to this standard, the boundary between reduced and unacceptable comfort corresponds to weighted RMS accelerations of approximately 0.58–0.9 m/s2 for lateral motion. Therefore, a threshold of ±0.9 m/s2 was adopted as the upper comfort limit for low-speed curve driving. At 5 km/h, the lateral acceleration remained well below this limit across all curves, while 6 km/h produced a few peaks near the threshold at curves 2 and 3. Considering both trajectory accuracy and ride comfort, 5 km/h was identified as the optimal speed for autonomous curve navigation.
The results confirm that the steer-by-wire system exhibits a stable performance and ride comfort at 5 km/h, consistent with the golf cart’s normal inter-building operation scenario. The observed 150–200 ms response delay indicates a control limitation that could be mitigated by using faster actuators or predictive steering algorithms for higher-speed applications. This response time is critical to the overall autonomous driving system, as accurate steering control directly affects the path tracking precision and the vehicle’s ability to execute collision avoidance maneuvers. A stable steering performance at the tested speed range therefore ensures safe and reliable operation within the intended use of the autonomous golf cart.
5.6. Autonomous Driving
The evaluation of the overall autonomous driving system was divided into three parts: the self-driving test, the self-braking test, and the collision avoidance test. These tests collectively assessed the vehicle’s navigation accuracy, braking performance, and obstacle avoidance capabilities under autonomous operation.
5.6.1. Self-Driving System Test
The self-driving test evaluated the system’s ability to autonomously navigate from a starting point to a designated destination using a high-definition map. The golf cart was driven along a predefined route at 5 km/h on curves and 10 km/h on straight segments, as shown in Figure 23. Steering control was managed using the pure pursuit algorithm with a look-ahead distance of 2.25 m, allowing the vehicle to follow the planned trajectory while adjusting for curvature.
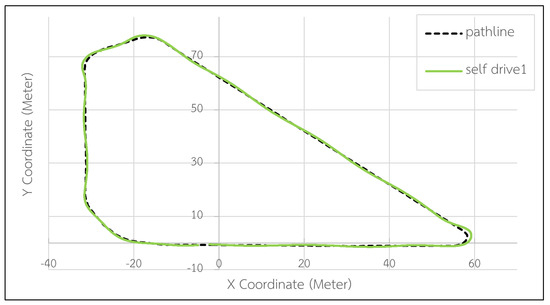
Figure 23.
Self-driving test attempt 1.
The system successfully completed the route, and, when deviations occurred, corrective steering realigned the vehicle to the intended path. On straight segments, an average deviation of about 0.4 m was observed, primarily due to steering response delays and slight wheel misalignment. Additional test results showing consistent path following behavior are presented in Appendix A (Figure A4 and Figure A5), confirming stable operation and a repeatable performance across runs.
The results demonstrate that the self-driving system maintains accurate path tracking within the centimeter-level localization precision achieved earlier. The small deviation observed corresponds to the combined influence of steering delays and localization offsets, both remaining within the ±0.5 m tolerance typical for low-speed autonomous navigation. This control accuracy ensures safe and reliable movement along inter-building routes and provides a strong foundation for coordination with higher-level modules such as those for autonomous driving control and collision avoidance.
5.6.2. Self-Braking System Test
The self-braking test evaluated the system’s ability to detect obstacles and perform automatic braking during autonomous driving. A stationary obstacle was introduced into the golf cart’s path while operating at 10 km/h, as shown in Figure 24. The obstacle was detected within the LiDAR’s effective range, triggering the braking sequence through the drive-by-wire controller. The vehicle decelerated smoothly and came to a complete stop at an average distance of 5.63 m from the obstacle. Additional trials showing consistent behavior are presented in Figure 25 and Figure 26.
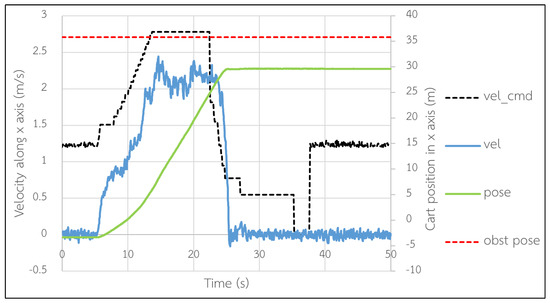
Figure 24.
Self-braking test attempt 1.
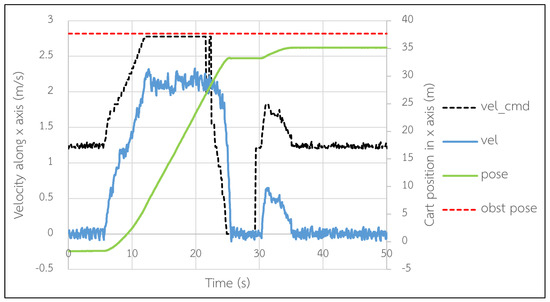
Figure 25.
Self-braking test attempt 2.
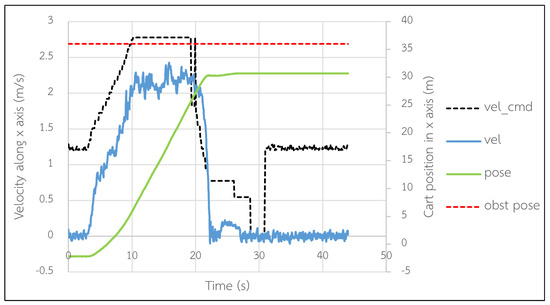
Figure 26.
Self-braking test attempt 3.
The 0.63 m difference from the 5.0 m target distance remains acceptable for low-speed operation. This variation results from small localization offsets and the discrete control behavior of the brake-by-wire actuator near zero velocity. The recorded braking sequence shows a total response time of approximately 1.8 s, giving an average deceleration value of 1.55 m/s2, which satisfies the comfort and safety limits for passenger transport. Overall, the braking module demonstrates consistent stopping capabilities within the LiDAR’s 2–9 m detection range, ensuring a sufficient margin to account for control and sensing delays.
5.6.3. Collision Avoidance System Test
The collision avoidance test evaluated the system’s ability to detect and avoid obstacles within a designated lane using the 3D object detection and A* path planning modules. A human subject acted as a stationary obstacle, placed near or directly within the golf cart’s planned path, as shown in Figure 27. Once the obstacle was detected within the LiDAR’s 2–9 m range, the system generated an alternative local path that preserved the lane boundaries while maintaining safe clearance from the obstacle.
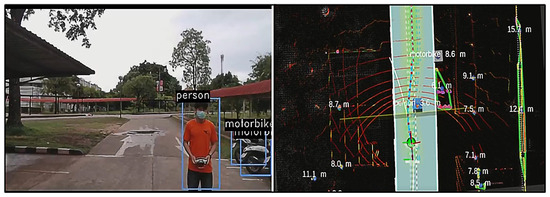
Figure 27.
Collision avoidance system test.
In the first test (Figure 28), the obstacle was positioned at approximately x = 21 m and y = –2.2 m relative to the high-definition map. The golf cart deviated by about 1 m toward the –y direction to pass safely on the side with greater clearance. In the second test (Figure 29), a moving obstacle crossed the lane from –y to +y, prompting two avoidance maneuvers. The planner first chose a near-center path and then recalculated with a wider deviation as the obstacle advanced, before returning smoothly to the original route. The third test (Figure 30) produced a mirrored response, where the vehicle avoided a central obstacle by deviating toward the +y side.
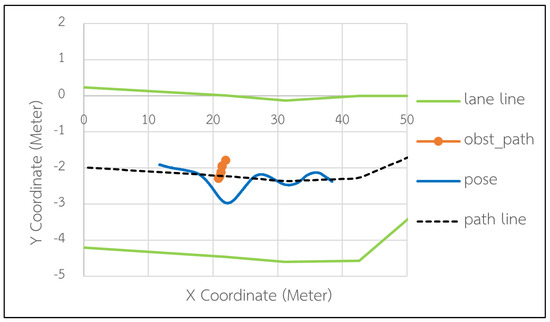
Figure 28.
Collision avoidance test attempt 1.
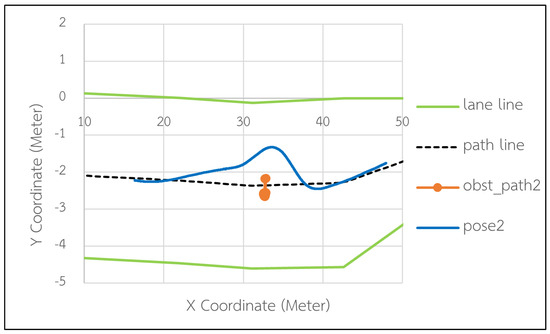
Figure 29.
Collision avoidance test attempt 2.
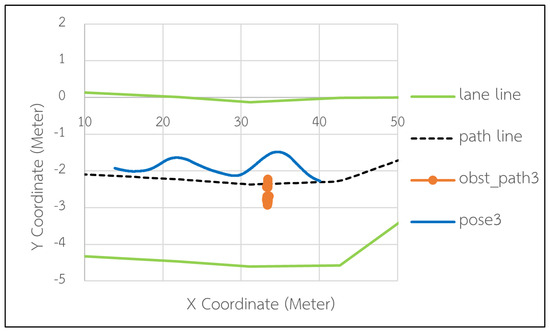
Figure 30.
Collision avoidance test attempt 3.
Across all trials, the A* planner consistently selected the optimal avoidance direction and maintained smooth trajectories within the lane boundaries. The vehicle preserved sufficient clearance during each maneuver without compromising path stability or passenger comfort. The coordination of 3D perception, planning, and steering control enabled real-time obstacle avoidance without abrupt motion or a loss of localization accuracy. These results confirm that the system can safely navigate around stationary and moving obstacles in confined lanes, demonstrating its readiness for mixed pedestrian environments typical of inter-building transport.
The results obtained for all modules confirm that the autonomous golf cart system achieves reliable and coordinated operation under its defined conditions. The high-definition map provided centimeter-level spatial accuracy, while localization showed mean errors below 0.08 m, ensuring precise vehicle positioning. The perception system demonstrated the effective detection of pedestrians and vehicles through YOLOv11 and 3D LiDAR integration, with an operational range of 2–9 m, suitable for low-speed environments. Self-driving tests showed an average deviation of 0.4 m, remaining within the ±0.5 m tolerance for safe autonomous driving. The self-braking module consistently stopped the vehicle at 5.63 m from detected obstacles, maintaining a safety margin against the 5.0 m target, and the collision avoidance system successfully performed smooth avoidance maneuvers without lane departure. Collectively, these results demonstrate that the system can perform autonomous navigation, braking, and obstacle avoidance smoothly and safely within inter-building routes. The overall performance indicates the system’s readiness for real-world deployment in controlled campus or facility environments, with future work planned to focus on improving its robustness under variable lighting and surface conditions.
6. Conclusions
This paper describes the development of an autonomous driving system designed for electric golf carts operating in inter-building environments. The system integrates data from both camera and LiDAR sensors to perform localization, object detection, path planning, path tracking, and collision avoidance. The primary goal was to establish a reliable and safe autonomous transportation solution for semi-open environments.
A high-definition map, incorporating point cloud data and path information from the testing area, was evaluated to determine the mapping accuracy. The best map test showed a maximum positioning error of 0.32 m (2.57%), demonstrating centimeter-level accuracy and suitability for autonomous golf cart navigation.
The localization system, based on the Normal Distributions Transform (NDT) and LiDAR scanning data, achieved average positional errors of 0.079 m and 0.078 m along the x- and y-axes, respectively. This level of accuracy is adequate for maintaining stable autonomous operation.
The 2D object detection system achieved a mean average precision (mAP) exceeding 70% at an intersection over union (IoU) threshold of 0.5 across all object classes. The 3D object detection and localization system performs effectively within a range of 2 to 9 m. For objects beyond 9 m, the system continues to function by relying on accumulated point cloud data to ensure environmental awareness.
The complete autonomous driving system enables self-driving speeds between 5 and 10 km/h, with 5 km/h identified as optimal for curve navigation based on trajectory accuracy and ride comfort. Using the pure pursuit steering method, the vehicle follows the predefined path with an average lateral deviation of 0.4 m. The self-braking mechanism allows the golf cart to decelerate and stop safely, with an average braking distance of 4.3 m and a final distance of 5.63 m from the detected obstacle. Furthermore, the collision avoidance system effectively adjusts the vehicle’s path to navigate around both stationary and moving obstacles within the defined lane, ensuring safe and reliable autonomous operation.
Author Contributions
Conceptualization, S.T., W.A. and A.A.; methodology, S.T., W.A. and A.A.; software, S.T. and W.A.; validation, S.T., A.P. and A.A.; formal analysis, A.P.; investigation, W.A.; resources, S.T.; data curation, P.K.; writing—original draft preparation, N.P.; writing—review and editing, N.P. and A.A.; supervision, S.T., W.A. and A.A.; project administration, A.A.; funding acquisition, A.A. All authors have read and agreed to the published version of the manuscript.
Funding
This work was supported by Suranaree University of Technology (SUT): Full-time66/15/2568.
Informed Consent Statement
Not applicable.
Data Availability Statement
The data supporting the results of this study are available in the article. Requests for further materials should be directed to the corresponding author.
Conflicts of Interest
The authors declare no conflicts of interest.
Appendix A. Additional Figures
Appendix A.1. High-Definition Map
Figure A1 and Figure A2 show the scanned point cloud data that were generated for the high-definition map inside and outside the building, respectively.
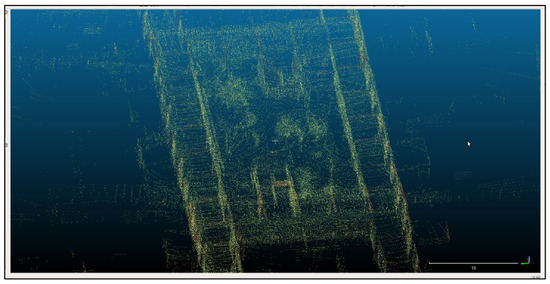
Figure A1.
Point cloud map for the inside of the building.
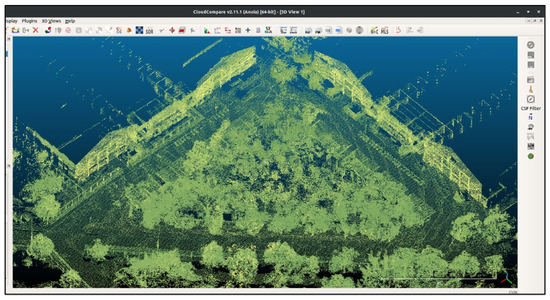
Figure A2.
Point cloud map for the outside of the building.
Figure A3 shows the process of creating the vector map using the Lanelet2 library, combining the traffic path with the point cloud map to support both localization and environment recognition for autonomous driving systems.
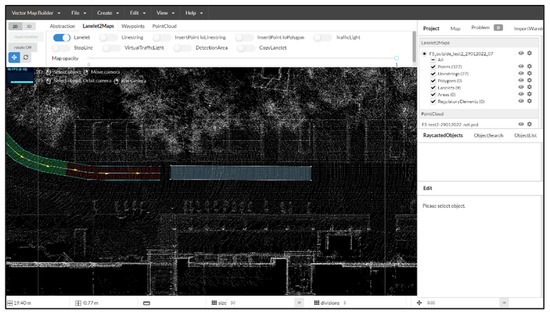
Figure A3.
Creating the vector map using Lanelet2.
Appendix A.2. Results of Self-Driving System Test
Figure A4 and Figure A5 demonstrate that the golf cart exhibited similar path following behavior as in the first attempt, shown in Figure 29.
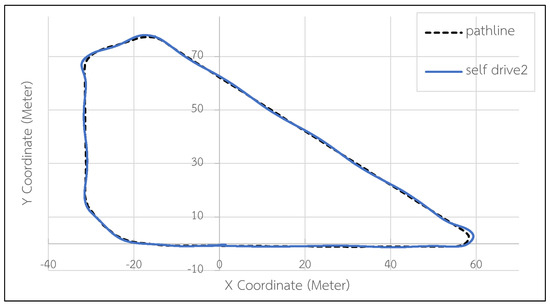
Figure A4.
Self-driving test attempt 2.
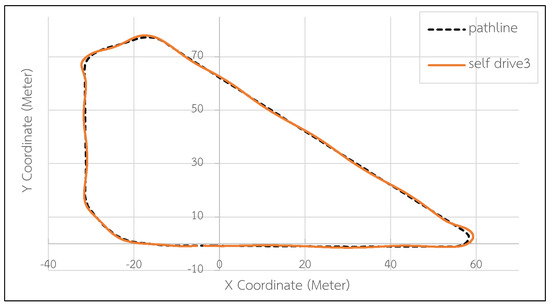
Figure A5.
Self-driving test attempt 3.
References
- World Health Organization. Global Status Report on Road Safety 2023; WHO: Geneva, Switzerland, 2023; Available online: https://www.who.int/publications/i/item/9789241565684 (accessed on 14 October 2025).
- Tenhundfeld, N.L.; Forsyth, J.; Sprague, N.R.; El-Tawab, S.; Cotter, J.E.; Vangsness, L. In the Rough: Evaluation of Convergence Across Trust Assessment Techniques Using an Autonomous Golf Cart. J. Cogn. Eng. Decis. Mak. 2024, 18, 3–21. [Google Scholar] [CrossRef]
- SAE Standard J3016; Taxonomy and Definitions for Terms Related to Driving Automation Systems for On-Road Motor Vehicles (J3016_202104). SAE International: Warrendale, PA, USA, 2021. Available online: https://www.sae.org/standards/content/j3016_202104/ (accessed on 2 October 2025).
- Rokonuzzaman, M.; Mohajer, N.; Nahavandi, S.; Mohamed, S. Review and Performance Evaluation of Path Tracking Controllers of Autonomous Vehicles. IET Intell. Transp. Syst. 2021, 15, 646–670. [Google Scholar] [CrossRef]
- Ziegler, J.; Bender, P.; Schreiber, M.; Lategahn, H.; Strauss, T.; Stiller, C.; Dang, T.; Franke, U.; Appenrodt, N.; Keller, C.G.; et al. Making Bertha Drive—An Autonomous Journey on a Historic Route. IEEE Intell. Transp. Syst. Mag. 2014, 6, 8–20. [Google Scholar] [CrossRef]
- Liu, H.-D.; Hung, Y.-H.; Lin, J.-T.; Huang, L.-C.; Shih, J.-W.; Li, C. Development of an Intelligent Transportation-Oriented Autonomous Driving Assistance System and Energy Efficiency Optimization Based on Electric Golf Cart Battery Packs. Energy 2025, 335, 138116. [Google Scholar] [CrossRef]
- AlSamhouri, L.I.; Alameri, S.; Eldosoky, M.; Alhammadi, F.; Mousa, N.; Al Jaberi, A.; Majid, S.; Al-Gindy, A. The Implementation of an Autonomous Navigation System on a Self-Driving CART. In Proceedings of the 3rd International Conference Sustainable Mobility Applications, Renewables and Technology (SMART), Sharjah, United Arab Emirates, 22–24 November 2024; pp. 1–10. [Google Scholar]
- Panomruttanarug, B.; Ponpimonangkul, J.; Muangthai, P.; Piyawanich, N. Deep Learning-Driven Navigation for Autonomous Golf Carts: Implementing YOLOP for Roadside Tracking. In Proceedings of the International Conference on Control, Automation and Systems (ICCAS), Jeju, Republic of Korea, 29 October–1 November 2024; pp. 1429–1433. [Google Scholar]
- Hirz, M.; Walzel, B. Sensor and Object Recognition Technologies for Self-Driving Cars. Comput.-Aided Des. Appl. 2018, 15, 501–508. [Google Scholar] [CrossRef]
- Chen, X.; Ma, H.; Wan, J.; Li, B.; Xia, T. Multi-View 3D Object Detection Network for Autonomous Driving. In Proceedings of the IEEE Conference on Computer Vision and Pattern Recognition (CVPR), Honolulu, HI, USA, 21–26 July 2017; pp. 1907–1915. [Google Scholar]
- Vinoth, K.; Sasikumar, P. Multi-Sensor Fusion and Segmentation for Autonomous Vehicle Multi-Object Tracking Using Deep Q Networks. Sci. Rep. 2024, 14, 31130. [Google Scholar] [CrossRef]
- Li, W.; Wan, X.; Ma, Z.; Hu, Y. Multi-Sensor Fusion Perception of Vehicle Environment and Its Application in Obstacle Avoidance of Autonomous Vehicle. Int. J. ITS Res. 2025, 23, 450–463. [Google Scholar] [CrossRef]
- Wang, Z.; Li, P.; Zhang, Q.; Zhu, L.; Tian, W. A LiDAR–Depth Camera Information Fusion Method for Human–Robot Collaboration Environment. Inf. Fusion 2025, 114, 102717. [Google Scholar] [CrossRef]
- Hess, G.; Lindström, C.; Fatemi, M.; Petersson, C.; Svensson, L. SplatAD: Real-Time LiDAR and Camera Rendering with 3D Gaussian Splatting for Autonomous Driving. In Proceedings of the IEEE/CVF Conference on Computer Vision and Pattern Recognition (CVPR), Nashville, TN, USA, 11–15 June 2025; pp. 11982–11992. [Google Scholar]
- Song, Z.; Liu, L.; Jia, F.; Luo, Y.; Jia, C.; Zhang, G.; Yang, L.; Wang, L. Robustness-Aware 3D Object Detection in Autonomous Driving: A Review and Outlook. IEEE Trans. Intell. Transp. Syst. 2024, 25, 15407–15436. [Google Scholar] [CrossRef]
- Wang, H.; Tang, Y.; Hu, J.; Liu, H.; Wang, W.; Wei, C.; Hu, C.; Wang, W. Robust and High-Precision Point Cloud Registration Method Based on 3D-NDT Algorithm for Vehicle Localization. IEEE Trans. Veh. Technol. 2025, 74, 13865–13877. [Google Scholar] [CrossRef]
- Pendleton, S.; Uthaicharoenpong, T.; Chong, Z.J.; Fu, G.M.J.; Qin, B.; Liu, W. Autonomous Golf Cars for Public Trial of Mobility-on-Demand Service. In Proceedings of the IEEE/RSJ International Conference on Intelligent Robots and Systems (IROS), Hamburg, Germany, 28 September–2 October 2015; pp. 1164–1171. [Google Scholar]
- Poggenhans, F.; Pauls, J.H.; Janosovits, J.; Orf, S.; Naumann, M.; Kuhnt, F.; Mayr, M. Lanelet2: A High-Definition Map Framework for the Future of Automated Driving. In Proceedings of the International Conference on Intelligent Transportation Systems (ITSC), Maui, HI, USA, 4–7 November 2018; pp. 1672–1679. [Google Scholar]
- Wolcott, R.W.; Eustice, R.M. Robust LIDAR Localization Using Multiresolution Gaussian Mixture Maps for Autonomous Driving. Int. J. Robot. Res. 2017, 36, 292–319. [Google Scholar] [CrossRef]
- Liu, C.; Mao, Q.; Chu, X.; Xie, S. An Improved A-Star Algorithm Considering Water Current, Traffic Separation and Berthing for Vessel Path Planning. Appl. Sci. 2019, 9, 1057. [Google Scholar] [CrossRef]
- Li, Q.; Zhuang, Y.; Huai, J.; Wang, X.; Wang, B.; Cao, Y. A Robust Data–Model Dual-Driven Fusion with Uncertainty Estimation for LiDAR–IMU Localization System. ISPRS J. Photogramm. Remote Sens. 2024, 210, 128–140. [Google Scholar] [CrossRef]
- Zou, Z.; Yuan, C.; Xu, W.; Li, H.; Zhou, S.; Xue, K.; Zhang, F. LTA-OM: Long-Term Association LiDAR–IMU Odometry and Mapping. J. Field Robot. 2024, 41, 2455–2474. [Google Scholar] [CrossRef]
- Ilci, V.; Toth, C. High Definition 3D Map Creation Using GNSS/IMU/LiDAR Sensor Integration to Support Autonomous Vehicle Navigation. Sensors 2020, 20, 899. [Google Scholar] [CrossRef]
- Fan, Z.; Zhang, L.; Wang, X.; Shen, Y.; Deng, F. LiDAR, IMU, and Camera Fusion for Simultaneous Localization and Mapping: A Systematic Review. Artif. Intell. Rev. 2025, 58, 174. [Google Scholar] [CrossRef]
- Redmon, J.; Divvala, S.; Girshick, R.; Farhadi, A. You Only Look Once: Unified, Real-Time Object Detection. In Proceedings of the IEEE Conference on Computer Vision and Pattern Recognition (CVPR), Las Vegas, NV, USA, 26 June–1 July 2016; pp. 779–788. [Google Scholar]
- Al Rabbani, M.A. Yolov11 for Vehicle Detection: Advancements, Performance, and Applications in Intelligent Transportation Systems. arXiv 2024, arXiv:2410.22898. [Google Scholar] [CrossRef]
- He, L.; Zhou, Y.; Liu, L.; Cao, W.; Ma, J.H. Research on Object Detection and Recognition in Remote Sensing Images Based on YOLOv11. Sci. Rep. 2025, 15, 14032. [Google Scholar] [CrossRef] [PubMed]
- Pethnok, P.; Lonklang, A.; Tantrairatn, S. Implementation of Steering-by-Wire Control System for Electric Golf Cart. In Proceedings of the 5th International Conference on Control, Automation and Robotics, Beijing, China, 19–22 April 2019; Volume 69, p. 026113. [Google Scholar]
- Pang, S.; Kent, D.; Cai, X.; Al-Qassab, H.; Morris, D.; Radha, H. 3D Scan Registration Based Localization for Autonomous Vehicles—A Comparison of NDT and ICP Under Realistic Conditions. In Proceedings of the IEEE 88th Vehicular Technology Conference (VTC-Fall), Chicago, IL, USA, 27–30 August 2018; pp. 1–5. [Google Scholar]
- Magnusson, M. The Three-Dimensional Normal-Distributions Transform: An Efficient Representation for Registration, Surface Analysis, and Loop Detection. Ph.D. Thesis, Örebro University, Örebro, Sweden, 2009. [Google Scholar]
- Badue, C.; Guidolini, R.; Carneiro, R.V.; Azevedo, P.; Cardoso, V.B.; Forechi, A.; Jesus, L.; Berriel, R.; Paixão, T.M.; Mutz, F.; et al. Self-Driving Cars: A Survey. Expert Syst. Appl. 2021, 165, 113816. [Google Scholar] [CrossRef]
- Akai, N.; Morales, L.Y.; Takeuchi, E.; Yoshihara, Y.; Ninomiya, Y. Robust Localization Using 3D NDT Scan Matching with Experimentally Determined Uncertainty and Road Marker Matching. In Proceedings of the IEEE Intelligent Vehicles Symposium (IV), Redondo Beach, CA, USA, 11–14 June 2017; pp. 1356–1363. [Google Scholar]
- Liu, S.; Luo, J.; Hu, J.; Luo, H.; Liang, Y. Research on NDT-Based Positioning for Autonomous Driving. E3S Web Conf. 2021, 257, 02055. [Google Scholar] [CrossRef]
- Josyula, A.; Anand, B.; Rajalakshmi, P. Fast Object Segmentation Pipeline for Point Clouds Using Robot Operating System. In Proceedings of the IEEE 5th World Forum Internet Things (WF-IoT), Limerick, Ireland, 15–18 April 2019; pp. 915–919. [Google Scholar]
- Sedighi, S.; Nguyen, D.-V.; Kuhnert, K.-D. Guided Hybrid A-Star Path Planning Algorithm for Valet Parking Applications. In Proceedings of the 5th International Conference on Control, Automation and Robotics (ICCAR), Beijing, China, 19–22 April 2019; pp. 302–307. [Google Scholar]
- Gill, B.A.S.; Sehdev, M.; Singh, H. Four-Wheel Drive System: Architecture, Basic Vehicle Dynamics and Traction. Int. J. Curr. Eng. Technol. 2018, 8. [Google Scholar] [CrossRef][Green Version]
- Bae, I.; Moon, J.; Seo, J. Toward a Comfortable Driving Experience for a Self-Driving Shuttle Bus. Electronics 2019, 8, 943. [Google Scholar] [CrossRef]
- Xsens Technologies. MTi 10-Series Datasheet, 2nd ed.; Xsens Technologies: Enschede, The Netherlands, 2020; p. 3. [Google Scholar]
- ISO 2631-1:1997; Mechanical Vibration and Shock—Evaluation of Human Exposure to Whole-Body Vibration—Part 1: General Requirements. ISO: Geneva, Switzerland, 1997.
Disclaimer/Publisher’s Note: The statements, opinions and data contained in all publications are solely those of the individual author(s) and contributor(s) and not of MDPI and/or the editor(s). MDPI and/or the editor(s) disclaim responsibility for any injury to people or property resulting from any ideas, methods, instructions or products referred to in the content. |
© 2025 by the authors. Licensee MDPI, Basel, Switzerland. This article is an open access article distributed under the terms and conditions of the Creative Commons Attribution (CC BY) license (https://creativecommons.org/licenses/by/4.0/).