Abstract
The rapid adoption of electric vehicles (EVs) has made the strategic deployment of charging infrastructure a critical task for sustainable mobility. This study formulates the siting of EV charging stations as a p-median problem and applies two metaheuristic approaches—genetic algorithm (GA) and ant colony optimization (ACO)—to solve it. The cost function, defined as the combination of transportation and installation costs, was analyzed in various scenarios. The results show that ACO consistently outperforms GA, offering lower total costs and shorter solution times. Crucially, the work uses optimization results published in the literature to expand the comparison beyond GA, using GA as a typical baseline. The suggested framework is adaptable and can be used to solve different spatial planning and facility location issues. This paper offers a data-driven, scientifically based approach for EV charging infrastructure development by combining cost effectiveness and service accessibility. In addition to providing decision-makers with useful tactics for creating dependable and sustainable charging networks, it helps handle the temporal and geographical coordination issues in EV charging.
1. Introduction
The increase in the usage of electric vehicles is strategically significant for urban transportation planning, spatial resource allocation, and energy infrastructure. Because of this, choosing the best site for charging stations is essential for sustainable urban growth. The literature looks at the infrastructure needs for charging electric cars (EVs) as they become more common. For the creation of effective and sustainable charging infrastructure, important elements such as station locations, network load modeling, and scheduling strategies are examined, and optimization techniques are suggested [1]. In this context, they developed a two-stage model considering distributed energy resources and electric vehicle penetration. This model determines the location and capacity of charging stations and aims to incorporate grid operating costs, user behavior, and uncertainties related to renewable energy [2]. Electric vehicles have been increasingly popular in recent years due to the negative effects of fossil fuel usage on performance and the expense of lowering CO2 emissions. However, these developments are severely hampered by the dearth of charging facilities required for the effective use of electric products, unequal access to charging stations, and high installation prices [3,4]. Limited driving range, and particularly range anxiety, directly impacts consumers’ preferences for electric vehicles. A well-planned charging network has been suggested as a solution to this problem [3]. Various optimization methods have been proposed in the literature for the optimal location and capacity allocation of charging stations. These studies have considered various factors such as time and space-based demand modeling, distribution network impact, carbon emissions, social equity, user behavior, and infrastructure costs [5,6,7,8]. Some studies have attempted to achieve a uniform distribution of fast charging stations on major road networks using models supported by geographic information systems (GIS) [3]. Others have attempted to find solutions in large-scale systems using metaheuristic methods such as genetic algorithm (GA), ant colony optimization (ACO), particle swarm optimization (PSO), and, more recently, heuristic algorithms supported by deep learning [5,7,9,10]. Two-stage planning models aim to optimize both user behavior and grid operating conditions with frameworks that consider renewable energy integration (DER) and uncertainties [4,7,11]. Attempts have been made to develop models that evaluate social, environmental, and economic impacts using multi-criteria decision-making methods [6,12,13]. Some studies have tested the impact of planned settlements using a simulation infrastructure based on real road networks and open city-level data sources. The goal is to improve system performance by optimizing load density distribution [5,14,15]. This study aims to contribute to the location selection of electric vehicle charging stations by proposing a p-median multi-objective model that considers transportation and installation costs. The novelty of this study is the integration of transportation and installation costs into a p-median-based multi-objective model and a scenario-based comparison of GA and ACO. Thus, it provides a transferable framework for planning sustainable charging infrastructures for electric vehicles. GA and ACO algorithms are compared on a scenario basis, and the results are compared with other optimization approaches in the literature; GA is presented as a representative example. ACO is determined to be more efficient under budget-constrained planning conditions. The developed model aims to provide a general solution framework that can be adapted not only to electric vehicle infrastructure but also to other spatial decision-making problems. Furthermore, a data-driven planning approach can provide novel contributions to addressing gaps in the literature on the development of sustainable and viable electric vehicle infrastructure.
The key features of the metaheuristic algorithms proposed in our study can be summarized as follows. GA is an evolutionary search method inspired by natural selection and genetic principles, exploring the solution space through operators such as selection, crossover, and mutation. ACO is a method based on ant nests, stimulated by their foraging behavior. In it, artificial agents constantly generate solutions and directly search for the best locations through pheromones. Both methods are particularly suitable for solving complex spatial problems, such as nonlinear, multi-objective, and large-scale development systems. The remainder of the paper is organized as follows: Section 2 describes the materials and methods, including the mathematical formulation and development of the implemented algorithms. Section 3 presents and discusses the simulation results and the comparative performance analysis of GA and ACO. Section 4 concludes the paper with conclusions and main suggestions for future research.
2. Materials and Methods
The increasing prevalence of EV infrastructure necessitates the strategic location of charging stations. The optimal location should be determined by considering the distance between demand points and stations, as well as installation costs. This study mathematically formulates the EV charging station placement problem and utilizes ACO and GA optimization methods to solve it. GA represents an evolutionary algorithm inspired by the principles of natural selection. ACO reflects a swarm intelligence-based approach inspired by the foraging behavior of ants. Both algorithms are frequently used in facility location selection and electric vehicle charging station placement problems, and successful results have been achieved [16,17].
2.1. Problem Formulation
The aim of our study is to minimize access costs by locating EV charging stations in convenient locations. This minimizes the installation costs of the stations, thus reducing overall costs.
Equations (1) and (2) give the expression of decision variables to place electric vehicle charging stations in suitable locations [18].
fj ∈ {0, 1}, j ∈ {1,…,M}
2.1.1. Objective Function
Heuristic algorithms for optimal placement of electric vehicle charging stations use Equation (3) as the objective function.
In Equation (3), z represents the total cost (the value to be optimized). z1 and z2 represent the transportation cost based on the distance to the stations where the demand points are assigned and the installation cost of the selected stations, respectively. w1 is the coefficient of the distance cost. w2 is the coefficient of the cost of opening a station. In Equation (3), the cost function was tested under four different weight combinations to represent varying priorities between transportation and installation costs. The equal-weight case reflects a balanced scenario, while emphasizes budget constraints, and moderately prioritizes user accessibility. The extreme case assigns the highest importance to transportation costs, simulating planning conditions where minimizing user travel distances is critical. These weight settings are consistent with sensitivity analysis approaches commonly found in the literature [19,20,21], and they demonstrate the adaptability of the proposed model to different planning priorities.
The weighted cost of transportation is calculated by multiplying the distance from each demand point to the nearest open station by the demand at that point. The transportation cost is given in Equation (4).
In Equation (4), N represents the number of demand points, di represents the demand quantity for the ith demand point, and represents the distance to the nearest open station for the ith demand point. Equation (4) calculates the weighted transportation cost by multiplying the distance from each demand point to the nearest open station () with its associated demand quantity (). Here, reflects the estimated daily charging demand at point , derived from local traffic density, residential/commercial land-use, and EV ownership distribution. This formulation ensures that both demand magnitude and spatial accessibility are captured in the cost evaluation.
Equation (5) gives the station installation cost [18].
In Equation (5), M represents the number of all potential station points, fj ∈ {0,1} is the decision variable indicating whether the jth station is open (1) or closed (0), and cj represents the fixed installation cost of the jth station. Only the costs of open stations are calculated in this study. The total setup cost is created by multiplying the setup cost by the decision variable.
2.1.2. Constraints
The minimum station constraint equation is given in Equation (6). The number of open stations must be at least H.
fj ∈ {0, 1}
In Equation (7), the binary expression of the decision variables is given.
2.2. Mathematical Modeling of the P-Median Facility Location Selection Problem
The p-median facility location problem was first formulated by Revelle and Swain. The objective of this model is to minimize the total weighted distance from all demand points to the facilities to which they are assigned [22]. The objective function used in this problem aims to maximize service efficiency by minimizing the access distance between facilities and demand points.
In Equations (8)–(14), wi represents the demand at point i, n represents the total number of demand points, dij represents the shortest distance between point i and point j, and p represents the median number (number of facilities). In Equation (8), in the objective function, represents the demand quantity at demand point i, and represents the distance between demand point i and potential facility j. represents a binary decision variable that takes the value 1 if demand point i is assigned to facility j, and 0 otherwise. Equation (8) aims to minimize the weighted total distance of all demand points to assigned facilities. In this way, the model aims to reduce user access distances while increasing the overall cost-effectiveness of the system. The objective function of the p-median facility location selection problem is defined by Equation (8), and the main objective of the model is to minimize the total service cost between served facilities and demand points. The requirement that each demand point be assigned to only one facility is a fundamental constraint that ensures the integrity of the model and is expressed in Equation (9). Equation (9), the binary variable , represents the assignment of demand point to facility . This constraint aims to ensure that each demand point is served by a single facility. This prevents unassigned demand points and multiple assignments to different facilities. By implementing this constraint, the model reflects realistic facility planning conditions where each demand must be met uniquely and completely. The constraint that a demand point can only be assigned to open facilities is defined to ensure the applicability of the model, and this dependency is illustrated in Equation (10). In Equation (11), is a binary decision variable that takes the value 1 if facility is selected and 0 if it is not. represents the specified number of facilities to be opened. This constraint ensures that the model selects exactly facilities from all candidates. Thus, it represents a planning condition where the number of facilities is limited for budgetary or strategic reasons. Finally, the fact that the number of active facilities is limited by p represents a capacity constraint on the system and is mathematically modeled in Equation (11) [22,23,24,25,26].
2.3. Genetic Algorithm Modeling
In this study, GA, an evolutionary approach suitable for the electric vehicle charging station location selection problem, was used due to the complexity of the solution space and the multitude of possible solution combinations.
2.3.1. Individual (Solution) Representation
In Equation (15), everyone is defined as a binary vector f. If each element is 1, that station is active; if it is 0, that station is inactive.
2.3.2. Initial Population
The initial population is given in Equation (16). H random stations are tried to be created so that individuals are active.
2.3.3. Selection
In our study, we used the Roulette Wheel Method and the Tournament Selection Metod.
In Equation (17), zi represents the cost of the ith individual, while β represents the selective pressure parameter.
In the Tournament Selection method, m individuals are randomly selected, and the lowest cost individual is chosen as the parent.
2.3.4. Crossover
The expression for Simple Single Point Crossing is given in Equations (18) and (19). The expression cc in Equations (18) and (19) represents the crossover point (randomly selected).
The expression for double-point crossing is given in Equations (20) and (21). The expression for regular crossover is given in Equation (22). After the crossover process, Equation (16) is checked again.
2.3.5. Mutation
The equation for the mutation process is given in Equation (23). In Equation (23), some bits (station status) of everyone are randomly changed at a certain rate. However, after the mutation, Equation (16) check is repeated.
2.3.6. Elitism and the New Population
The expression for the Elitism equation is given in Equation (24). In our study, the lowest cost nPop individual is selected while preserving the best solutions.
(New Pop = Parents + Offspring + Mutants)
GA is applied as a population-based evolutionary search method that uses the standard steps of representation, selection, crossover, mutation, and elitism. Its implementation for EV charging-station placement follows conventional formulations in the literature; a schematic diagram and the pseudocode of the GA procedure are provided in Figure 1.
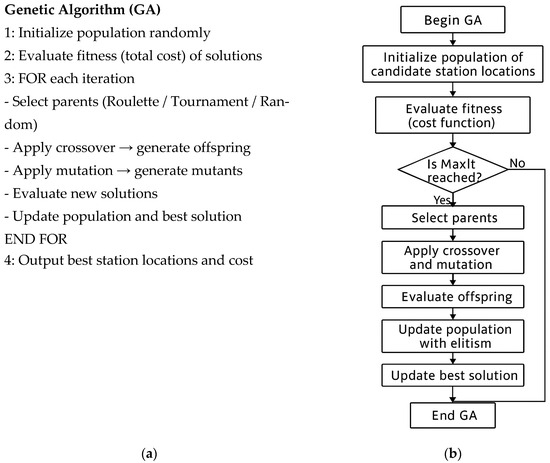
Figure 1.
Pseuducode (a) and flowchart (b) of solving GA.
2.4. Modeling Ant Colony Optimization
In this study, ant colony optimization (ACO), a heuristic method inspired by the behavior of ants in nature, was applied to improve the solution quality in charging station location selection and to reach the global optimum without getting stuck in the local minimum [27,28,29,30,31,32,33]. The aim is to find the optimum station locations (vector f) to minimize the total cost (z) defined in Equation (3).
2.4.1. Pheromone Matrix (τ)
The pheromone matrix equation is given in Equation (25). Initially, it is assigned equally for all stations.
Equation (26) gives the update expression at each iteration. In Equations (25) and (26), ρ represents the pheromone evaporation rate, zk represents the cost of the solution created by the kth ant, φ represents the pheromone contribution coefficient, and elite solutions: the best-found solutions represent the solutions that receive additional pheromone contribution [29].
2.4.2. Intuitive Knowledge (ƞ)
The heuristic information equation is given in Equation (27). It is used to give lower selection probability to high-cost stations and is then normalized.
2.4.3. Probability Calculation (P)
The probability (P) equation is given in Equation (28). The probability vector in Equation (28) determines which points the ants will prefer when selecting stations. Ants make their choice stochastically according to the probability distribution in Equation (28).
In Equation (28), α represents the pheromone effect and β represents the heuristic information effect. A curve showing the change in total cost is created using the best cost values obtained through iterations.
(ACO) is employed as a swarm intelligence-based metaheuristic inspired by the foraging behavior of ants, where pheromone trails guide the probabilistic construction of solutions. The main steps and pseudocode include pheromone initialization, solution construction, pheromone updating, and stochastic selection, as illustrated in Figure 2.
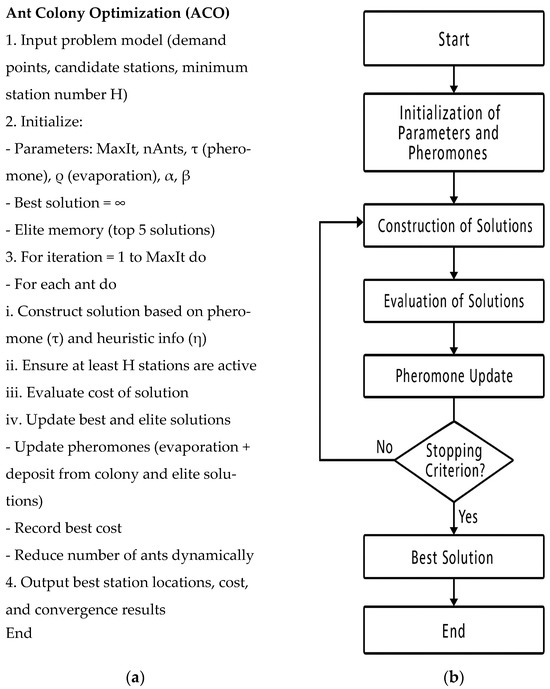
Figure 2.
Pseuducode (a) and flowchart (b) of solving ACO.
3. Results & Discussion
This study was conducted in Dadaşkent, Aziziye District, Erzurum Province, using two scenarios with 1035 and 1535 demand points, respectively. The different search densities provided a comparative assessment of the consistency and flexibility of the optimization models. The primary objective of the study is to develop a feasible roadmap for optimal planning of the location and capacity of electric vehicle charging infrastructure at the regional level. The total cost function is evaluated under different weighting combinations: (w1 = 0.9; w2 = 1.1), (w1 = 1; w2 = 1), (w1 = 1.1; w2 = 0.9), and (w1 = 1.2; w2 = 0.8). These scenarios reflect the trade-off between transportation and installation costs at different levels and allow comparison of algorithm performance under multiple conditions. For this purpose, genetic algorithm (GA) and ant colony optimization (ACO) methods were used, and their performances were compared. Both metaheuristic approaches proved effective in solving the inherently NP-hard p-median location problem. The comparison results demonstrate the methods’ success in minimizing total service costs and access distances, as well as their adaptability to different demand scenarios and weighting combinations.
3.1. GA and ACO Results for 1035 Demand Points and 40 Station Locations
In this scenario, 1035 demand points and 40 station locations were considered. Optimization was performed using GA and ACO algorithms, and both methods successfully solved the p-median problem. The results showed that station locations are critical in determining total costs and range.
While solving the problems, the population size for the GA was set as nPop = 100, the maximum iteration number as MaxIt = 100, the crossover percentage as pc = 0.8, and the number of offspring as nc = 2 × round (pc × nPop/2) according to this relationship. The mutation percentage was taken as pm = 0.3, and the number of mutated individuals was calculated using nm = round (pm × nPop). In addition, the mutation rate was set as μ = 0.05 [34,35].
The following parameters were used for ACO: maximum iteration number of 100, ant population of 100, pheromone evaporation rate of 0.05, pheromone weighting factor of 1, fitness weighting factor of 2, and initial pheromone concentration of 1. For ACO, parameters such as the number of ants, pheromone evaporation rate, and heuristic coefficients () were also adopted from the literature and fine-tuned through preliminary tests to achieve stable convergence [36,37]. The results of the optimization performed with these parameters are presented in Table 1 and Table 2.

Table 1.
GA-based station positioning results (1035 demand points).

Table 2.
ACO-based station positioning results (1035 demand points).
A combined analysis of Table 1 and Table 2 reveals significant differences in cost, solution time, and number of functions. From a cost perspective, the total cost of GA results increased steadily as the number of stations increased, reaching approximately 9.15 million units at 30 stations. In contrast, ACO achieved lower costs under the same conditions at 7.71 million units, yielding approximately 15–20% better results than GA, particularly with fewer stations.
Whereas ACOs took 10 to 17 s to solve, GAs took 20 to 26 s. This illustrates the increased time efficiency of ACO. ACO ran 5095 functions per trial, whereas GA ran 11,100 functions. This implies that ACO can accomplish comparable or superior outcomes with less computing work.
The findings demonstrate that ACO performs better than GA in terms of cost, solution time, and computing effort. This is in line with research findings and implies that ACO can offer more effective solutions, particularly in urban planning scenarios with limited funding. While GA inherently offers more flexible selection methods (roulette, tournament, random), it lags ACO in terms of solution quality and speed. Therefore, ACO can be considered a more rational choice for low-capacity station planning problems, both in terms of cost and time efficiency.
Comparative cost graphs for 30 station locations with GA and ACO solution methods are given in Figure 3.
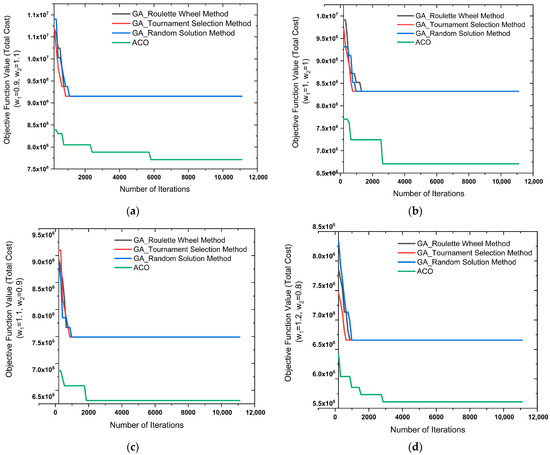
Figure 3.
(a–d) Comparative cost graphs obtained using GA and ACO solution methods for 30 station locations (1035 demand points).
Looking at the graphs in Figure 3, the ACO method achieves lower costs and faster convergence compared to the GA method for 1035 demand points across all weighting combinations. While the GA methods stabilized after a certain number of iterations, the ACO method provided more efficient solutions and gradually reduced costs.
Figure 3a–d show the cost convergence comparison graphs of the GA and ACO algorithms for 30 charging stations and 1035 demand points under four different weight combinations: (w1, w2) = (0.9; 1.1), (1.0; 1.0), (1.1; 0.9), and (1.2; 0.8). The results show a sharp decline in the initial iterations for GA (roulette, tournament, and random solution methods). However, the equilibrium is reached after approximately 2000 iterations. ACO consistently outperforms GA in all scenarios. It also achieves lower final cost values and demonstrates gradual improvements throughout the iteration process. Comparing the weighting configurations, it is found that (w1 = 1.2, w2 = 0.8) yields the most efficient results. In this scenario, ACO achieves a final cost of approximately 5.5 × 10⁶, which is significantly lower than the cost levels achieved in the other cases. More critically, significantly fewer function evaluations are required to reach convergence. Because the algorithms’ calculations are unpredictable, the shapes begin at different points. ACO finds better outcomes with just 5095 function evaluations, whereas GA needs about 11,100 function evaluations to identify the ideal answers. It is understood that ACO uses greater processing power to accomplish these goals in addition to offering reduced total expenses. This implies that ACO is especially well-suited for large-scale electric vehicle charging infrastructure development, where time and computational resources are crucial. The focus on transportation expenses (w1) and the slight decrease in setup costs (w2) is responsible for this efficiency, which results in more balanced solutions that reduce user trip distances and enhance accessibility. ACO’s distributed search mechanism enables adaptive exploration and exploitation of the solution space, requiring fewer convergence evaluations compared to GA’s evolutionary operators. The superiority of the ACO (w1 = 1.2, w2 = 0.8) configuration demonstrates strong performance in addressing large-scale facility location and transportation planning problems thanks to the adaptive and distributed search mechanisms of ant colony-based approaches [19,20,21]. These results suggest that incorporating higher weights for transportation costs not only minimizes user access distances but also leads to lower overall costs through improved computational efficiency. Thus, they provide evidence supporting more sustainable and practical electric vehicle charging infrastructure planning. Figure 4 shows a concentration and some imbalance in the central areas of the station distribution obtained with GA (random solution). However, Figure 5 shows that ACO distributes demand points more evenly and homogeneously across stations, particularly by minimizing access distances. While both methods solved the p-median problem, ACO provided a more even station distribution and more cost-effective solutions.
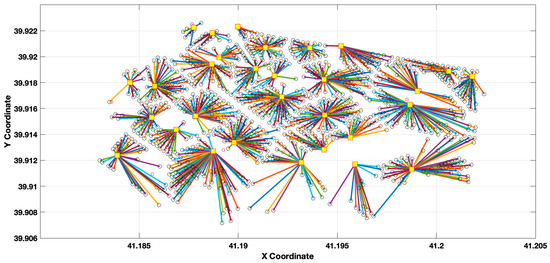
Figure 4.
30 station locations with random GA solution method (1035 demand points).
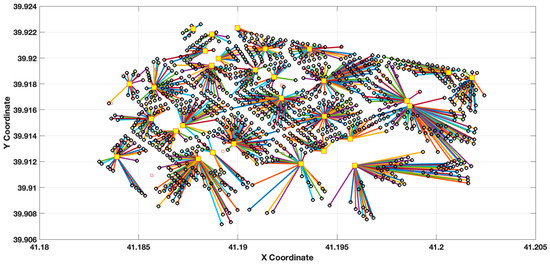
Figure 5.
30 station locations with ACO solution method (1035 demand points).
Figure 6a–d compare the performance of the GA under two different mutation rates ( and ) for 30 charging station locations and 1035 demand points. The results show that both parameter settings achieve convergence within the first 2000 iterations, but they differ in convergence speed and stability. A lower mutation rate () is consistent with commonly reported ranges in the literature and leads to faster convergence, while a higher mutation rate () enhances solution diversity and prevents premature convergence, resulting in more stable outcomes across multiple runs. These findings indicate that parameter settings can influence convergence behavior, although the overall cost levels remain comparable in both scenarios. In addition, the results obtained with are presented in Table 1, and the same values were also achieved with , though the solution time was longer in the case. Furthermore, when considering the effect of the weight coefficients, the combination yields the lowest total cost and significantly reduces user access distances. This result suggests that assigning a higher weight to transportation costs relative to installation costs ensures more effective service coverage for demand nodes and enhances the practical applicability of station placement strategies in urban planning.
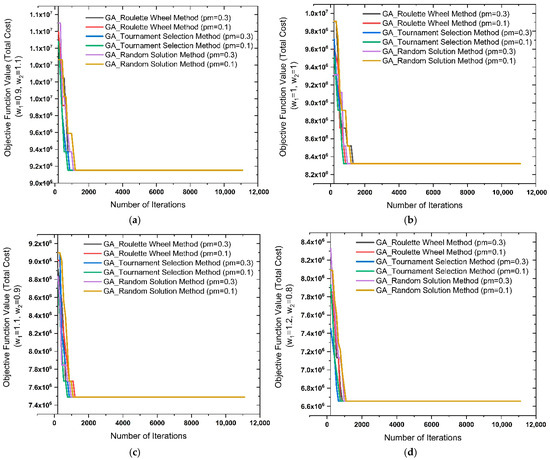
Figure 6.
(a–d) Comparison of GA with different mutation rates (pm = 0.1 vs. pm = 0.3) for the placement of 30 charging stations (1035 demand points).
3.2. GA and ACO Results for 1535 Demand Points and 40 Station Locations
In this scenario, 1535 demand points and 40 station locations were considered. Both methods, optimized with the GA and ACO algorithms, effectively solved the p-median problem and demonstrated the impact of station locations on costs and access distances as demand density increases. Optimization results are presented in Table 3 and Table 4.

Table 3.
GA-based station positioning results (1535 demand points).

Table 4.
ACO-based station positioning results (1535 demand points).
The outcomes of the GA and ACO algorithms for the 1535 demand point scenario are shown in Table 3 and Table 4, respectively. The findings indicate that while both algorithms’ costs rise as demand density rises, their performance varies significantly.
In terms of expenses, ACO was able to lower expenditure to 7.96 million units under the same circumstances, whereas GA reached a peak value of 9.15 million units for 30 stations. At fewer stations, a similar pattern was seen; for instance, in the five-station scenario, GA obtained a value of 528,435 units while ACO obtained a value of 406,488 units, resulting in about 23% cost reduction. This shows that even when demand rises, ACO can optimize costs more successfully.
ACO computations normally take 14 to 20 s to complete, whereas GA computations usually take 29 to 39 s. This suggests that ACO can provide solutions 40–50% more quickly than GA.
ACO obtained more effective solutions with just 5095 functions, whereas GA performed 11,100 functions per test. This distinction shows that ACO requires less computing power to get better outcomes.
Looking at the cost diagrams shown in Figure 7, the ACO method achieved lower costs than the GA method for all weighting combinations for 1535 demand points. While GA methods achieved rapid convergence in the first few iterations and remained fixed at a certain point, ACO achieved more efficient results by gradually reducing costs throughout the iterations. The results obtained with different weight combinations (w1, w2) illustrate the impact of the parameters on total costs. Increasing the value of w1 (more weighting of transportation costs) shortens travel distances and significantly reduces total costs. In particular, the scenario (w1 = 1.2, w2 = 0.8) stands out among the other scenarios, offering the most efficient solution with final costs of approximately 5.5 × 10⁶. ACO also outperforms GA in terms of computational performance. The shapes start from different starting points due to the random calculations of the algorithms. While GA reaches a solution in approximately 11,100 function evaluations, ACO achieves faster and more cost-effective results in only 5095 evaluations. These results are consistent with studies in the literature showing that ACO is superior in terms of computational performance and solution quality for large-scale facility layout problems [16,17,21].
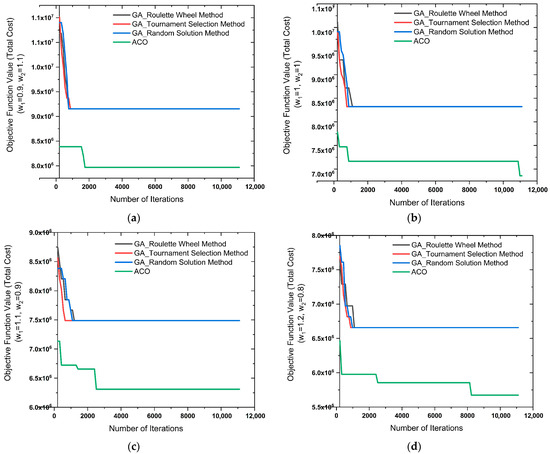
Figure 7.
(a–d) Comparative cost graphs obtained using GA and ACO solution methods for 30 station locations (1535 demand points).
Figure 8 shows the locations of 30 stations identified using a stochastic GA solution. While stations are concentrated in high-demand areas, some areas are overconcentrated, leading to load imbalances among stations. Specifically, some central stations serve many demand points, while stations in peripheral areas experience relatively lower demand.
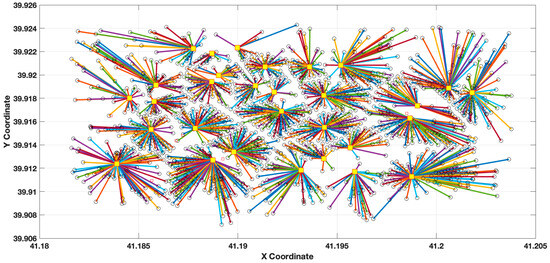
Figure 8.
30 station locations with random GA solution method (1535 demand points).
Figure 9 shows the layout of 30 stations determined using the ACO method. The ACO method better captured the demand distribution, resulting in a more balanced distribution of supply and contributing to the homogenization of station usage. Furthermore, the ACO results resulted in shorter access routes and less congestion, particularly in densely populated areas.
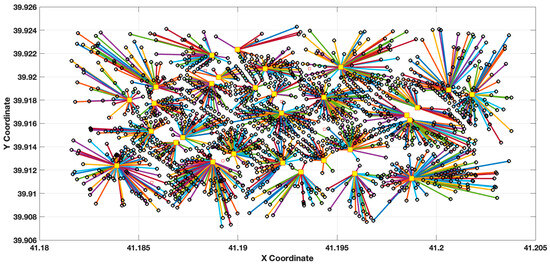
Figure 9.
30 station locations with ACO solution method (1535 demand points).
In the scenario with 1035 demand points in Figure 4 and Figure 5, excessive concentration and imbalances were observed in some regions among the 30 station locations determined using the GA random solution method. In contrast, the ACO method distributed the stations more evenly, shortening commuting distances and providing a more balanced load distribution.
The differences are more pronounced in the scenario with 1535 demand points in Figure 8 and Figure 9. In the GA solutions, imbalances increased with increasing size, and while some central stations had high utilization rates, stations in peripheral areas were considered relatively underutilized. ACO more accurately captured the distribution of demand points, resulting in a more balanced supply distribution and shorter distances between stations, even with increased density.
When the 1035 and 1535 demand point scenarios were analyzed holistically, it was determined that the ACO method was more advantageous than GA in terms of scalability and efficiency.
Figure 10a–d compare the performance of the GA with two different mutation rates ( and ) for 30 charging station locations and 1535 demand points. The results confirm that both settings converge within the first 2000 iterations, but they show variations in speed and stability. While is consistent with commonly reported parameter ranges in the literature and yields faster initial convergence, enhances solution diversity and reduces the risk of premature convergence, leading to more stable performance across repeated runs. These findings suggest that parameter choices affect convergence dynamics, while the final cost values remain broadly comparable. In addition, GA-based station positioning results obtained with are presented in Table 3, and the same values were also achieved with ; however, the solution time was longer in the case. Furthermore, the analysis of weight coefficients highlights the advantage of the scenario. This setting results in reduced overall costs and shorter access distances by giving transportation expenses more weight than installation costs. Such a weighting scheme improves the practical application of charging station placement tactics in urban situations and offers more efficient service coverage for demand points.
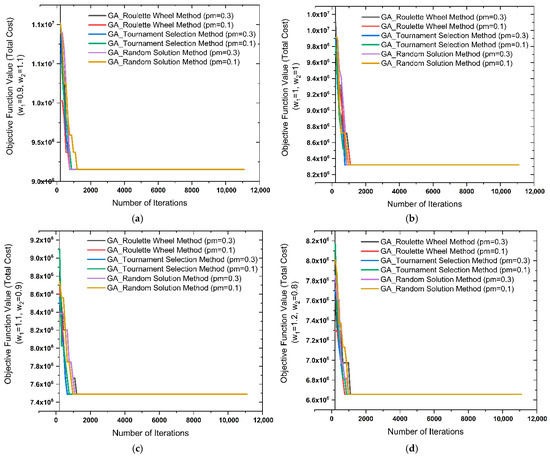
Figure 10.
(a–d) Comparison of GA with different mutation rates (pm = 0.1 vs. pm = 0.3) for the placement of 30 charging stations (1535 demand points).
4. Conclusions
Using a p-median modeling technique, this study investigated the location and capacity planning of EV charging stations in Erzurum. Genetic algorithm (GA) and ant colony optimization (ACO) were used to generate solutions. According to the comparison findings, ACO constantly outperforms GA in terms of cost, quality, and computational efficiency. After 60–80 iterations, GA often stabilizes with output fluctuations of roughly ±8–10%, while ACO reduces costs by 15–25% and yields more consistent results with a smaller variance of ±3–4%. These results highlight the applicability of ACO for planning sustainable EV charging infrastructure and offer a reliable point of reference for future research topics, such as hybrid metaheuristic techniques, dynamic demand modeling, and the incorporation of renewable energy.
Author Contributions
Methodology, H.K.D.; Software, B.B.; Project administration, A.Ö. All authors have read and agreed to the published version of the manuscript.
Funding
This research received no external funding.
Institutional Review Board Statement
Not applicable.
Informed Consent Statement
Not applicable.
Data Availability Statement
The original contributions presented in this study are included in the article. Further inquiries can be directed to the corresponding author.
Conflicts of Interest
The authors declare no conflict of interest.
References
- Ahmad, F.; Iqbal, A.; Ashraf, I.; Marzband, M.; Khan, I. Optimal location of electric vehicle charging station and its impact on distribution network: A review. In Energy Reports; Elsevier Ltd.: Amsterdam, The Netherlands, 2022; Volume 8, pp. 2314–2333. [Google Scholar] [CrossRef]
- Gan, H.; Ruan, W.; Wang, M.; Pan, Y.; Miu, H.; Yuan, X. Bi-Level Planning of Electric Vehicle Charging Stations Considering Spatial–Temporal Distribution Characteristics of Charging Loads in Uncertain Environments. Energies 2024, 17, 3004. [Google Scholar] [CrossRef]
- Csiszár, C.; Csonka, B.; Földes, D.; Wirth, E.; Lovas, T. Location optimisation method for fast-charging stations along national roads. J. Transp. Geogr. 2020, 88, 102833. [Google Scholar] [CrossRef]
- Janjić, A.; Velimirović, L.; Velimirović, J.; Vranić, P. Estimating the optimal number and locations of electric vehicle charging stations: The application of multi-criteria p-median methodology. Transp. Plan. Technol. 2021, 44, 827–842. [Google Scholar] [CrossRef]
- Jordán, J.; Palanca, J.; Martí, P.; Julian, V. Electric vehicle charging stations emplacement using genetic algorithms and agent-based simulation. Expert Syst. Appl. 2022, 197, 116739. [Google Scholar] [CrossRef]
- Loni, A.; Asadi, S. Data-driven equitable placement for electric vehicle charging stations: Case study San Francisco. Energy 2023, 282, 128796. [Google Scholar] [CrossRef]
- Woo, H.; Son, Y.; Cho, J.; Kim, S.-Y.; Choi, S. Optimal expansion planning of electric vehicle fast charging stations. Appl. Energy 2023, 342, 121116. [Google Scholar] [CrossRef]
- Zhou, G.; Zhu, Z.; Luo, S. Location optimization of electric vehicle charging stations: Based on cost model and genetic algorithm. Energy 2022, 247, 123437. [Google Scholar] [CrossRef]
- Wang, M.; Xie, Q. Logistics Pure Electric Vehicle Routing Based on GA-PSO Algorithm. Mechanika 2023, 29, 235–242. [Google Scholar] [CrossRef]
- Yin, L.; Zhang, Y. Particle swarm optimization based on data driven for EV charging station siting. Energy 2024, 310, 133197. [Google Scholar] [CrossRef]
- Chen, J.; Chen, H. Research on the Planning of Electric Vehicle Fast Charging Stations Considering User Selection Preferences. Energies 2023, 16, 1794. [Google Scholar] [CrossRef]
- Bilsel, M.; Kilic, H.S.; Kalender, Z.T.; Tuzkaya, G. Multi-objective model for electric vehicle charging station location selection problem for a sustainable transportation infrastructure. Comput. Ind. Eng. 2024, 198, 110695. [Google Scholar] [CrossRef]
- Mazza, A.; Russo, A.; Chicco, G.; Di Martino, A.; Colombo, C.G.; Longo, M.; Ciliento, P.; De Donno, M.; Mapelli, F.; Lamberti, F. Categorization of Attributes and Features for the Location of Electric Vehicle Charging Stations. Energies 2024, 17, 3920. [Google Scholar] [CrossRef]
- Lazari, V.; Chassiakos, A. Multi-Objective Optimization of Electric Vehicle Charging Station Deployment Using Genetic Algorithms. Appl. Sci. 2023, 13, 4867. [Google Scholar] [CrossRef]
- Mohammed, A.; Saif, O.; Abo-Adma, M.A.; Elazab, R. Multiobjective optimization for sizing and placing electric vehicle charging stations considering comprehensive uncertainties. Energy Inform. 2024, 7, 131. [Google Scholar] [CrossRef]
- Mladenović, N.; Brimberg, J.; Hansen, P.; Moreno-Pérez, J.A. The p-median problem: A survey of metaheuristic approaches. Eur. J. Oper. Res. 2007, 179, 927–939. [Google Scholar] [CrossRef]
- Wang, L.; Miwa, T.; Jiang, M.; Morikawa, T. Heterogeneous residential distribution changes and spillover effects by railway projects: The case study of Nagoya, Japan. Transp. Res. Part A Policy Pract. 2021, 154, 196–223. [Google Scholar] [CrossRef]
- He, S.Y.; Kuo, Y.-H.; Wu, D. Incorporating institutional and spatial factors in the selection of the optimal locations of public electric vehicle charging facilities: A case study of Beijing, China. Transp. Res. Part C Emerg. Technol. 2016, 67, 131–148. [Google Scholar] [CrossRef]
- Cui, J.; Maghyereh, A.; Goh, M.; Zou, H. Risk spillovers and time-varying links between international oil and China’s commodity futures markets: Fresh evidence from the higher-order moments. Energy 2022, 238, 121751. [Google Scholar] [CrossRef]
- Ponnam, V.K.B.; Swarnasri, K. Multi-Objective Optimal Allocation of Electric Vehicle Charging Stations and Distributed Generators in Radial Distribution Systems using Metaheuristic Optimization Algorithms. Eng. Technol. Appl. Sci. Res. 2020, 10, 5837–5844. [Google Scholar] [CrossRef]
- Tan, A.; Wang, C.; Wang, Y.; Dong, C. Electric Vehicle Charging Route Planning for Shortest Travel Time Based on Improved Ant Colony Optimization. Sensors 2025, 25, 176. [Google Scholar] [CrossRef] [PubMed]
- Revelle, C.S.; Swain, R.W. Central Facilities Location. Geogr. Anal. 1970, 2, 30–42. [Google Scholar] [CrossRef]
- Çelik, S. Genetik Algoritma ve Parçacık Sürü Optimizasyonu Yöntemleriyle Optimum Konumu Belirlenen Elektrikli Araç Şarj İstasyonlarının Simülasyon ile Kapasitesinin Planlaması. Master’s Thesis, Atatürk University, Erzurum, Turkey, 2020; p. 111p. [Google Scholar]
- Ekin, E. Solution Approach To P-Median Facility Location Problem with Integer Programming and Genetic Algorithm. Afyon Kocatepe Univ. J. Soc. Sci. 2024, 26, 547–562. [Google Scholar] [CrossRef]
- Kara, S.S.; Yurdakul, G. Raylı Sistem İstasyon Yeri Belirleme Problemi İçin Küme Kapsama ve Alternatif Servis Seviyeli P-Medyan Modelleriyle Çözüm Arayışı: Gebze-Darıca Metro Hattı Uygulaması. Deu Muhendis. Fak. Fen Ve Muhendis. 2021, 23, 845–856. [Google Scholar] [CrossRef]
- Çelik, S.; Ok, Ş. Electric vehicle charging stations: Model, algorithm, simulation, location, and capacity planning. Heliyon 2024, 10, e29153. [Google Scholar] [CrossRef]
- Cinsdikici, M.G.; Aydın, D. Detection of blood vessels in ophthalmoscope images using MF/ant (matched filter/ant colony) algorithm. Comput. Methods Programs Biomed. 2009, 96, 85–95. [Google Scholar] [CrossRef]
- Dorigo, M.; Maniezzo, V.; Colorni, A. Ant system: Optimization by a colony of cooperating agents. IEEE Trans. Syst. Man Cybern. Part B Cybern. 1996, 26, 29–41. [Google Scholar] [CrossRef]
- Gao, W. New Ant Colony Optimization Algorithm for the Traveling Salesman Problem. Int. J. Comput. Intell. Syst. 2020, 13, 44–55. [Google Scholar] [CrossRef]
- Jiang, Q.-J.; Shao, Z.-K.; Jin, T.-L.; Li, J.-Y. Parameter Tuning for Ant Colony Optimization based Multiple Traveling Salesman Problem Optimization. In Proceedings of the 2025 Joint International Conference on Automation-Intelligence-Safety, ICAIS 2025 and International Symposium on Autonomous Systems, ISAS 2025, Xi’an, China, 23–25 May 2025. [Google Scholar] [CrossRef]
- Qi, Z. Application of Improved Ant Colony Algorithm in Optimizing the Charging Path of Electric Vehicles. World Electr. Veh. J. 2024, 15, 230. [Google Scholar] [CrossRef]
- Serin, S. Karınca Kolonisi Yaklaşımıyla Karayolu Üstyapı Rutin Bakım Çalışmalarının Planlanması. Master’s Thesis, Süleyman Demirel University, Isparta, Turkey, 2009; p. 89p. [Google Scholar]
- Taşyürek, M.; Erat, M. Karınca Koloni ve Genetik Algoritma Yöntemleri Kullanarak En iyi Sayaç Okuma Güzergahının Tespit Edilmesi. Dicle Univ. J. Eng. 2022, 13, 405–412. [Google Scholar] [CrossRef]
- Goldberg, D.E. Genetic Algorithms in Search, Optimization and Machine Learning; Addison-Wesley: Reading, MA, USA, 1989. [Google Scholar]
- Mitchell, M. An Introduction to Genetic Algorithms; MIT Press: Cambridge, MA, USA, 1998. [Google Scholar]
- Dorigo, M.; Stützle, T. Ant Colony Optimization; MIT Press: Cambridge, MA, USA, 2004. [Google Scholar]
- Kchaou-Boujelben, M. Charging station location problem: A comprehensive review on models and solution approaches. Transp. Res. Part C Emerg. Technol. 2021, 132, 103376. [Google Scholar] [CrossRef]
Disclaimer/Publisher’s Note: The statements, opinions and data contained in all publications are solely those of the individual author(s) and contributor(s) and not of MDPI and/or the editor(s). MDPI and/or the editor(s) disclaim responsibility for any injury to people or property resulting from any ideas, methods, instructions or products referred to in the content. |
© 2025 by the authors. Licensee MDPI, Basel, Switzerland. This article is an open access article distributed under the terms and conditions of the Creative Commons Attribution (CC BY) license (https://creativecommons.org/licenses/by/4.0/).