Article

Impact of Purification Methods on the Antioxidant Properties of Tannin-Rich Extracts Obtained from Berry Fruit By-Products

Institute of Food Technology and Analysis, Lodz University of Technology, Stefanowskiego 2/22, 90-537 Lodz, Poland
*
Authors to whom correspondence should be addressed.
Appl. Sci. 2025, 15(21), 11701; https://doi.org/10.3390/app152111701
Submission received: 30 September 2025 / Revised: 27 October 2025 / Accepted: 30 October 2025 / Published: 1 November 2025

Abstract

This study evaluates how different purification methods influence the antioxidant properties of polyphenol-rich berry pomace extracts, taking into account both the source of the pomace and the purification strategy used. The extracts were obtained from raspberry, blackberry, strawberry, and wild strawberry pomaces derived from the production of unclarified juices and purées. The extracts were analyzed in three states: crude (CEX), purified using Amberlite XAD 1600N adsorbent resin (XAD), and purified via size-exclusion chromatography (SEC) on a gel filtration resin. Ellagitannins, flavanols, and anthocyanins were determined using HPLC-DAD-FD methods. Antioxidant properties were determined based on: total antioxidant compounds, DPPH radical scavenging activity, and Fe3+ ion reduction power. Purification significantly enhanced the concentration of antioxidant compounds, which increased 2-fold with the XAD method and more than 3-fold using SEC. The extracts exhibited strong DPPH radical scavenging activity, ranging from 65% to 90% for raspberry and blackberry extracts and from 34% to 95% for strawberry and wild strawberry extracts, depending on the degree of purification. Similarly, Fe3+-reducing power increased 2- to 6-fold in extracts purified using XAD and SEC compared to crude extracts. Purification via size-exclusion chromatography enabled the separation of tannin-rich and anthocyanin-rich extract fractions. Ellagitannins were the main class of polyphenols contributing to the enhanced antioxidant potential. Anthocyanins contributed significantly to antioxidant activity only in the case of blackberry extracts.

1. Introduction

Polyphenols are a diverse group of chemical compounds characterized by structural diversity and antioxidant activities [1,2]. Their health-promoting mechanisms, including antioxidant effects, are highly complex and involve multiple pathways such as free radical scavenging, heavy metal chelation, interactions with micro- and macromolecules, hydrogen atom donation, and inhibition of lipid peroxidation [3,4]. Many researchers have attempted to establish correlations between the content of specific polyphenolic compounds, organic acids, vitamins, and overall antioxidant capacity [5,6,7]. Strong antioxidant activity has been closely linked to the presence of polyphenolic compounds [8,9]. Initially, it was believed that the antioxidant properties of polyphenols were primarily determined by molecular weight and the number of hydroxyl groups; however, it has since been demonstrated that factors such as the degree of polymerization and the structural configuration of individual compounds also play a significant role [4,10,11,12].
Tannins are polyphenols with complex and highly diverse structures. Their molecular weight typically ranges from 300 to 4000 Da. Most tannins are oligomeric compounds containing a high number of hydroxyl groups attached to phenolic rings. They are generally classified into two main types: hydrolyzable tannins (e.g., ellagitannins, gallotannins) and condensed tannins (procyanidins). Tannins are widely distributed in nature and, due to their structural complexity, exhibit a wide range of properties including health-promoting, antioxidant, and antimicrobial effects [12,13,14].
Berry fruits are particularly rich in polyphenolic compounds, characterized by a unique profile with high and varied concentrations of ellagitannins (ETs), condensed tannins, and anthocyanins [9,15,16,17,18]. These fruits are often cited as excellent sources of antioxidants and bioactive compounds [1,2,19,20]. However, due to their short shelf life, berries are typically frozen or processed into juices, jams, or purées. These processing methods generate by-products in the form of pomace. It has been shown that both the qualitative and quantitative profiles of polyphenols in pomace may vary depending on the fruit processing method used [18]. During the production of unclarified juices and purées, a significant portion of polyphenols—including oligomeric compounds—remains in the pomace [17,18,21]. As such, berry pomace constitutes a valuable source of polyphenols and represents a promising raw material for the production of polyphenol-rich extracts [22].
The most effective solvent for extracting polyphenolic compounds, including tannins, is aqueous acetone at concentrations ranging from 60% to 80% [23,24,25]. For purification, polyphenol-rich extracts are often treated using adsorptive resins such as Amberlite XAD [26]. In this process, the extract is applied to a resin, and then the adsorbed polyphenols are washed with water and eluted with an appropriately selected solvent, e.g., ethanol. This purification step helps eliminate water-soluble compounds such as sugars, proteins, peptides, and pectins [8,26]. This is particularly important when studying the properties of polyphenols themselves and their antioxidant potential, as unpurified extracts may yield distorted results due to interfering substances [27].
Size-exclusion chromatography (SEC), using gel resins such as Sephadex LH-20 or Toyopearl HW-40 F, has also been identified as an effective method for purifying polyphenolic extracts [8,28,29]. Gel-based resins enable separation of polyphenols based on molecular size, making it possible to isolate tannins from other polyphenol groups or separate monomeric from oligomeric compounds. This allows for targeted analysis of specific polyphenol groups [22,30].
The primary objective of this study was to evaluate how different purification methods influence the antioxidant properties of polyphenol-rich extracts obtained from various types of berry pomace, taking into account both the source of the pomace and the purification strategy used. The novelty of the study lies not only in the comparative analysis of purification techniques, but also in the comprehensive evaluation of multiple berry pomace types—an approach that is rarely addressed in current literature. What distinguishes this study is the use of a wide range of pomace types as raw material, which highlights the variability in polyphenolic composition between different fruit sources and processing methods. Pomaces from four different types of berry fruits—raspberry, blackberry, strawberry, and wild strawberry—were obtained either after pressing for unclarified juice or after purée production. These fruits were chosen due to their broad and diverse polyphenol profiles, which are known to influence antioxidant capacity. Both the unpurified and purified extracts were obtained from the pomace using two distinct purification strategies: adsorptive resin-based and gel filtration-based methods. Purification on the gel resin allowed for the separation of acetone- and methanol-based extract fractions. In total, 32 extracts with high and varied polyphenol content were tested for their antioxidant properties.
Given their strong and differentiated antioxidant potential, the resulting extracts show promise for various industrial applications, particularly in the food, nutraceutical, and cosmetic sectors. Their use as natural antioxidants may support the development of clean-label products, contribute to shelf-life extension, or serve as active ingredients in health-oriented formulations. Future work should focus on the functional performance of the extracts in real product systems and assess their bioavailability and stability during processing and storage.

2. Materials and Methods

2.1. Plant Material

The plant material used consisted of four berry fruits from the Rosaceae family: raspberry (Rubus idaeus L., cultivar ‘Laszka’), blackberry (Rubus fruticosus L., cultivar ‘Black Satin’), wild strawberry (Fragaria vesca L., cultivar ‘Rugia’), and strawberry (Fragaria × ananassa Duchesne, cultivar ‘Sibilla’). The fruits were purchased from the Cajdex wholesale distributor (Łódź, Poland). Until processing, the fruits were stored deep-frozen at −20 °C (±2 °C) in tightly sealed polypropylene bags. The fruits were stored for two days prior to the analysis.

2.2. Pomace Production

Pomace was obtained following the production of unclarified juices and purées, according to the method described in detail by Milczarek et al. [18]. Briefly, the fruits were thawed at 4 °C (±1 °C) for 24 h and then ground using a Zelmer food grinder (Rzeszów, Poland). The fruit pulp was incubated with the pectinolytic enzyme Rohapect Classic (Novozymes, Bagsværd, Denmark) for 1 h at 45 °C (±0.2 °C), with mixing every 10 min. The pulp was then divided into two portions. One portion was pressed into juice using a laboratory hydraulic press (Lodz University of Technology, Łódź, Poland) at a pressure of 100 bar for 5 min. The second portion was processed into purée using a steel food mill (Orion, Katowice, Poland). In total, eight different types of pomace were obtained: pomace from juice production (PJ) and from purée production (PP) from each of the four selected berry fruits. The resulting pomace samples were used immediately for further extraction.

2.3. Extraction of Crude Extracts

Tannin extraction was carried out according to the method described by Klewicka et al. [31], involving a two-step acetone extraction supported by shaking.
First, the pomace (approx. 200 g) was frozen in liquid nitrogen and ground using an IKA Basic cryogenic mill (Staufen, Germany). Each extraction step involved treating the pomace with a 60% aqueous acetone solution at a ratio of 1:5 (w/v), followed by shaking on an orbital shaker (Elmi DOS–10L, Aizkraukles, Latvia) for 6 h at 150 rpm at room temperature. After each step, the pomace was separated from the extract using a cotton cloth and a cellulose filter membrane (Hobrafilt S40N, Hobra–Školnik S.R.O., Broumov, Czech Republic). The extracts from both steps were pooled and acetone was removed by vacuum concentration using a Heidolph Basis Hei–VAP system (Heidolph, Schwabach, Germany), operating at 450–72 mbar and 60 °C (±0.2 °C), until the extract reached a final concentration of 5°Bx. Approximately 10% of the extract was frozen at –36 °C and lyophilized (Christ Alpha 1–2 LDplus, Osterode am Harz, Germany) for 48 h at 0.22 mbar, yielding eight crude extracts, labeled as “CEX”.
The remaining liquid extracts were submitted immediately to purification.

2.4. Extract Purification

2.4.1. Purification Using Amberlite XAD 1600N Adsorbent Resin

The extracts were purified using an Amberlite XAD 1600N (DOW, Midland, MI, USA) adsorption resin, following the procedure described by Klewicka et al. [31]. A glass column (4 cm × 10 cm) was filled with the resin, onto which the liquid extract was loaded by gravity. The column was washed with water and a 10% aqueous ethanol solution (v/v). Polyphenols were eluted at a flow rate of 5–7 mL/min using a 60% aqueous ethanol solution (v/v). Ethanol was removed using a Heidolph Basis Hei–VAP system. The resulting extracts were frozen (–36 °C) and lyophilized (Christ Alpha 1–2 LDplus, Osterode am Harz, Germany) for 48 h at 0.22 mbar, yielding eight purified extracts, labeled as XAD.

2.4.2. Purification via Size-Exclusion Chromatography

Purification by SEC was performed using Toyopearl HW–40F resin (Tosoh Bioscience GmbH, Griesheim, Germany), according to the method described by Srivastava et al. [32], with modifications. A Millipore Vantage column (1.6 cm × 50 cm) was packed with the gel. A 1% aqueous extract (w/v) was loaded onto the column. Washing was performed with a 30% aqueous methanol solution (v/v). Polyphenols were eluted with 70% aqueous methanol and 70% aqueous acetone (v/v). To maintain the stability of the polyphenols, all solvents were acidified with 0.05% formic acid (v/v). Elution was carried out using a Knauer K–501 pump (Berlin, Germany) at a flow rate of 2 mL/min. Because the analytes differ in polarity and exhibit residual interactions with Toyopearl HW-40F, we performed SEC using a step change from 70% methanol to 70% acetone as eluents. Methanol, being more polar, is effective in eluting lower molecular weight and more polar compounds, such as anthocyanins and flavanols. Acetone, with its lower polarity and greater elution strength, facilitates the elution of higher molecular weight, less polar compounds such as ellagitannins [32]. This process yielded methanolic and acetonic extracts, which were immediately concentrated under a vacuum. After water removal, the extracts were lyophilized, resulting in a total of 16 extracts: 8 labeled as SEC methanol and 8 labeled as SEC acetone.

2.5. Polyphenol Determination

In the CEX, XAD, and SEC extracts, the content of polyphenolic compounds was determined, i.e., ellagitannins, anthocyanins, and flavanols. To determine ellagitannins, anthocyanins, and free epicatechin and catechin, the extracts were dissolved in 50% aqueous methanol acidified with 0.1% formic acid (v/v/v) (pH 3.40). The solutions were diluted 1:1 (v/v) with the appropriate mobile phase A and then centrifuged using an MPW–260R centrifuge (Med Instruments, Warsaw, Poland) at 14,000× g.

2.5.1. Ellagitannin Quantification

Quantitative analysis of ellagitannins was performed following the method described by Sójka et al. [17,33].
High-performance liquid chromatography (HPLC) with diode-array detection (DAD) was used. The system consisted of a Smartline Knauer HPLC system (Berlin, Germany) equipped with a PDA 2800 detector. Separation was performed on a Gemini C18 100 Å column (250 mm × 4.6 mm, 5 µm; Phenomenex, Torrance, CA, USA) at a flow rate of 1.25 mL/min, with a 20 µL injection volume. Separation was carried out in gradient elution with phase A—0.05% aqueous phosphoric acid solution (v/w) and phase B—83% aqueous acetonitrile solution in 0.05% phosphoric acid (v/v/w). The proportion of phase B was as follows: 0–5 min—5%; 5–10 min—5–15%; 10–35 min—15–40%; 35–40 min—40–73%; 40–44 min—73%; 44–46 min—73–5%; 46–54 min—5%. Detection was carried out at 250 nm.
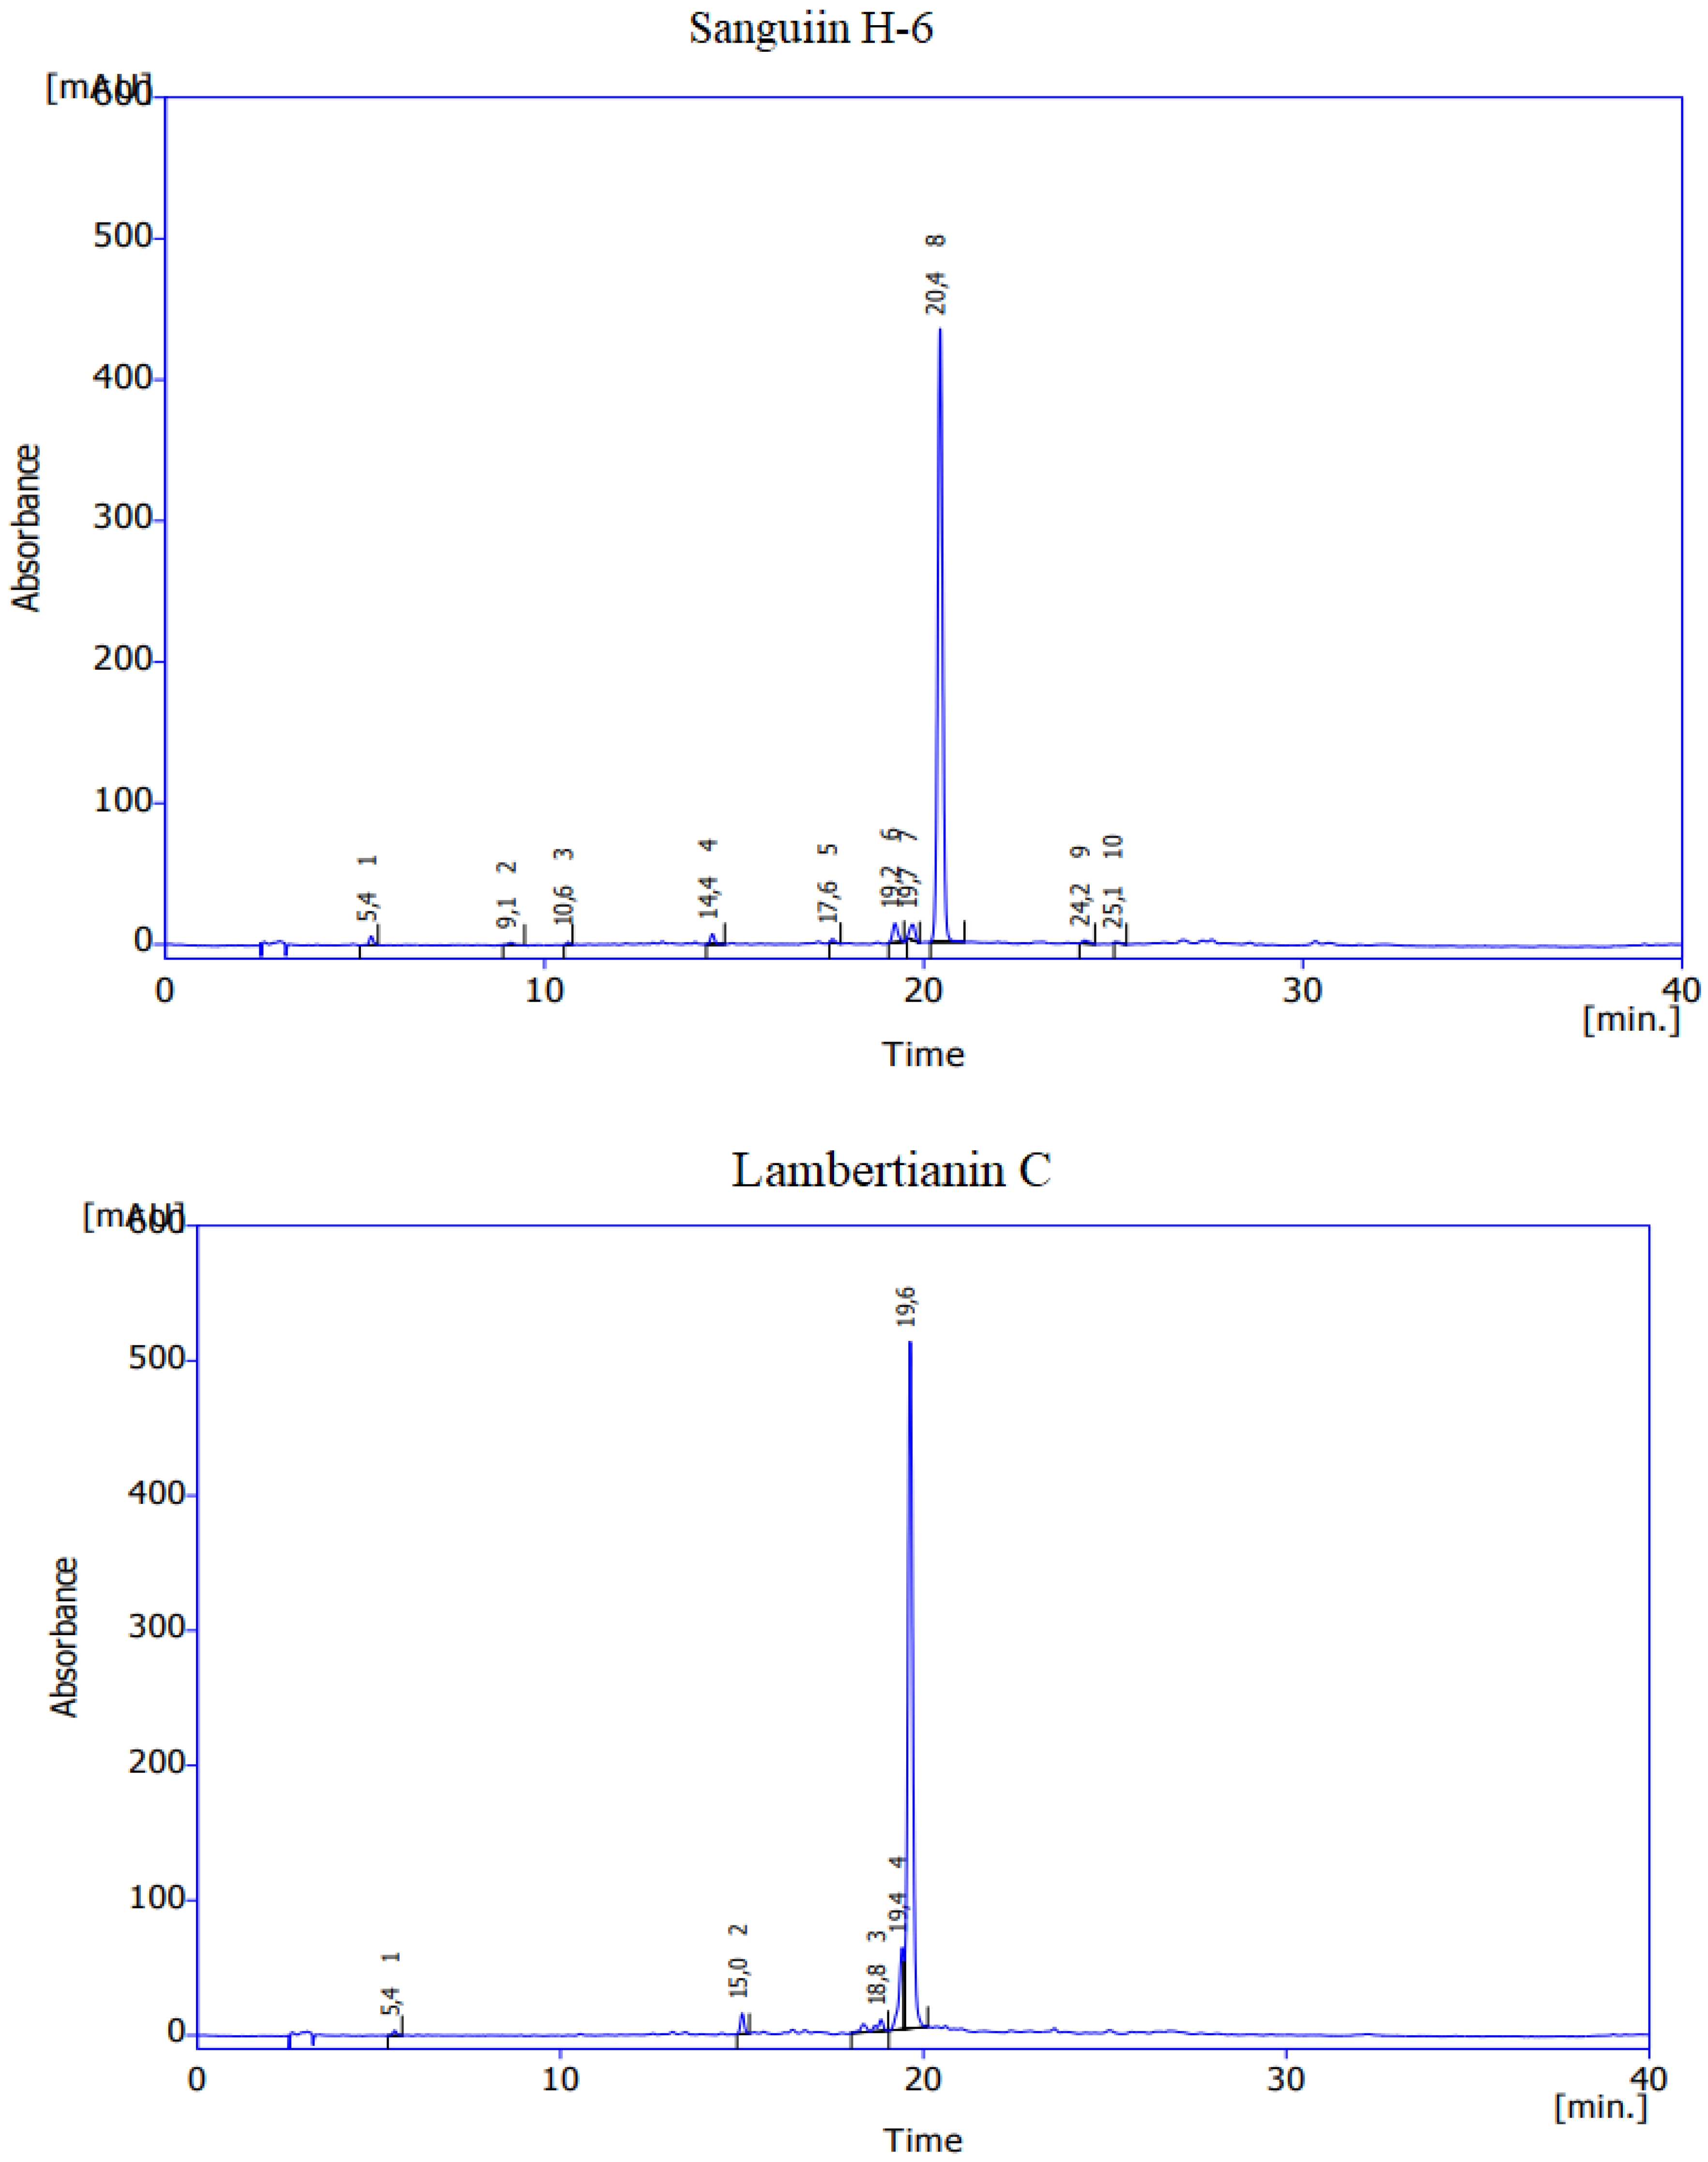
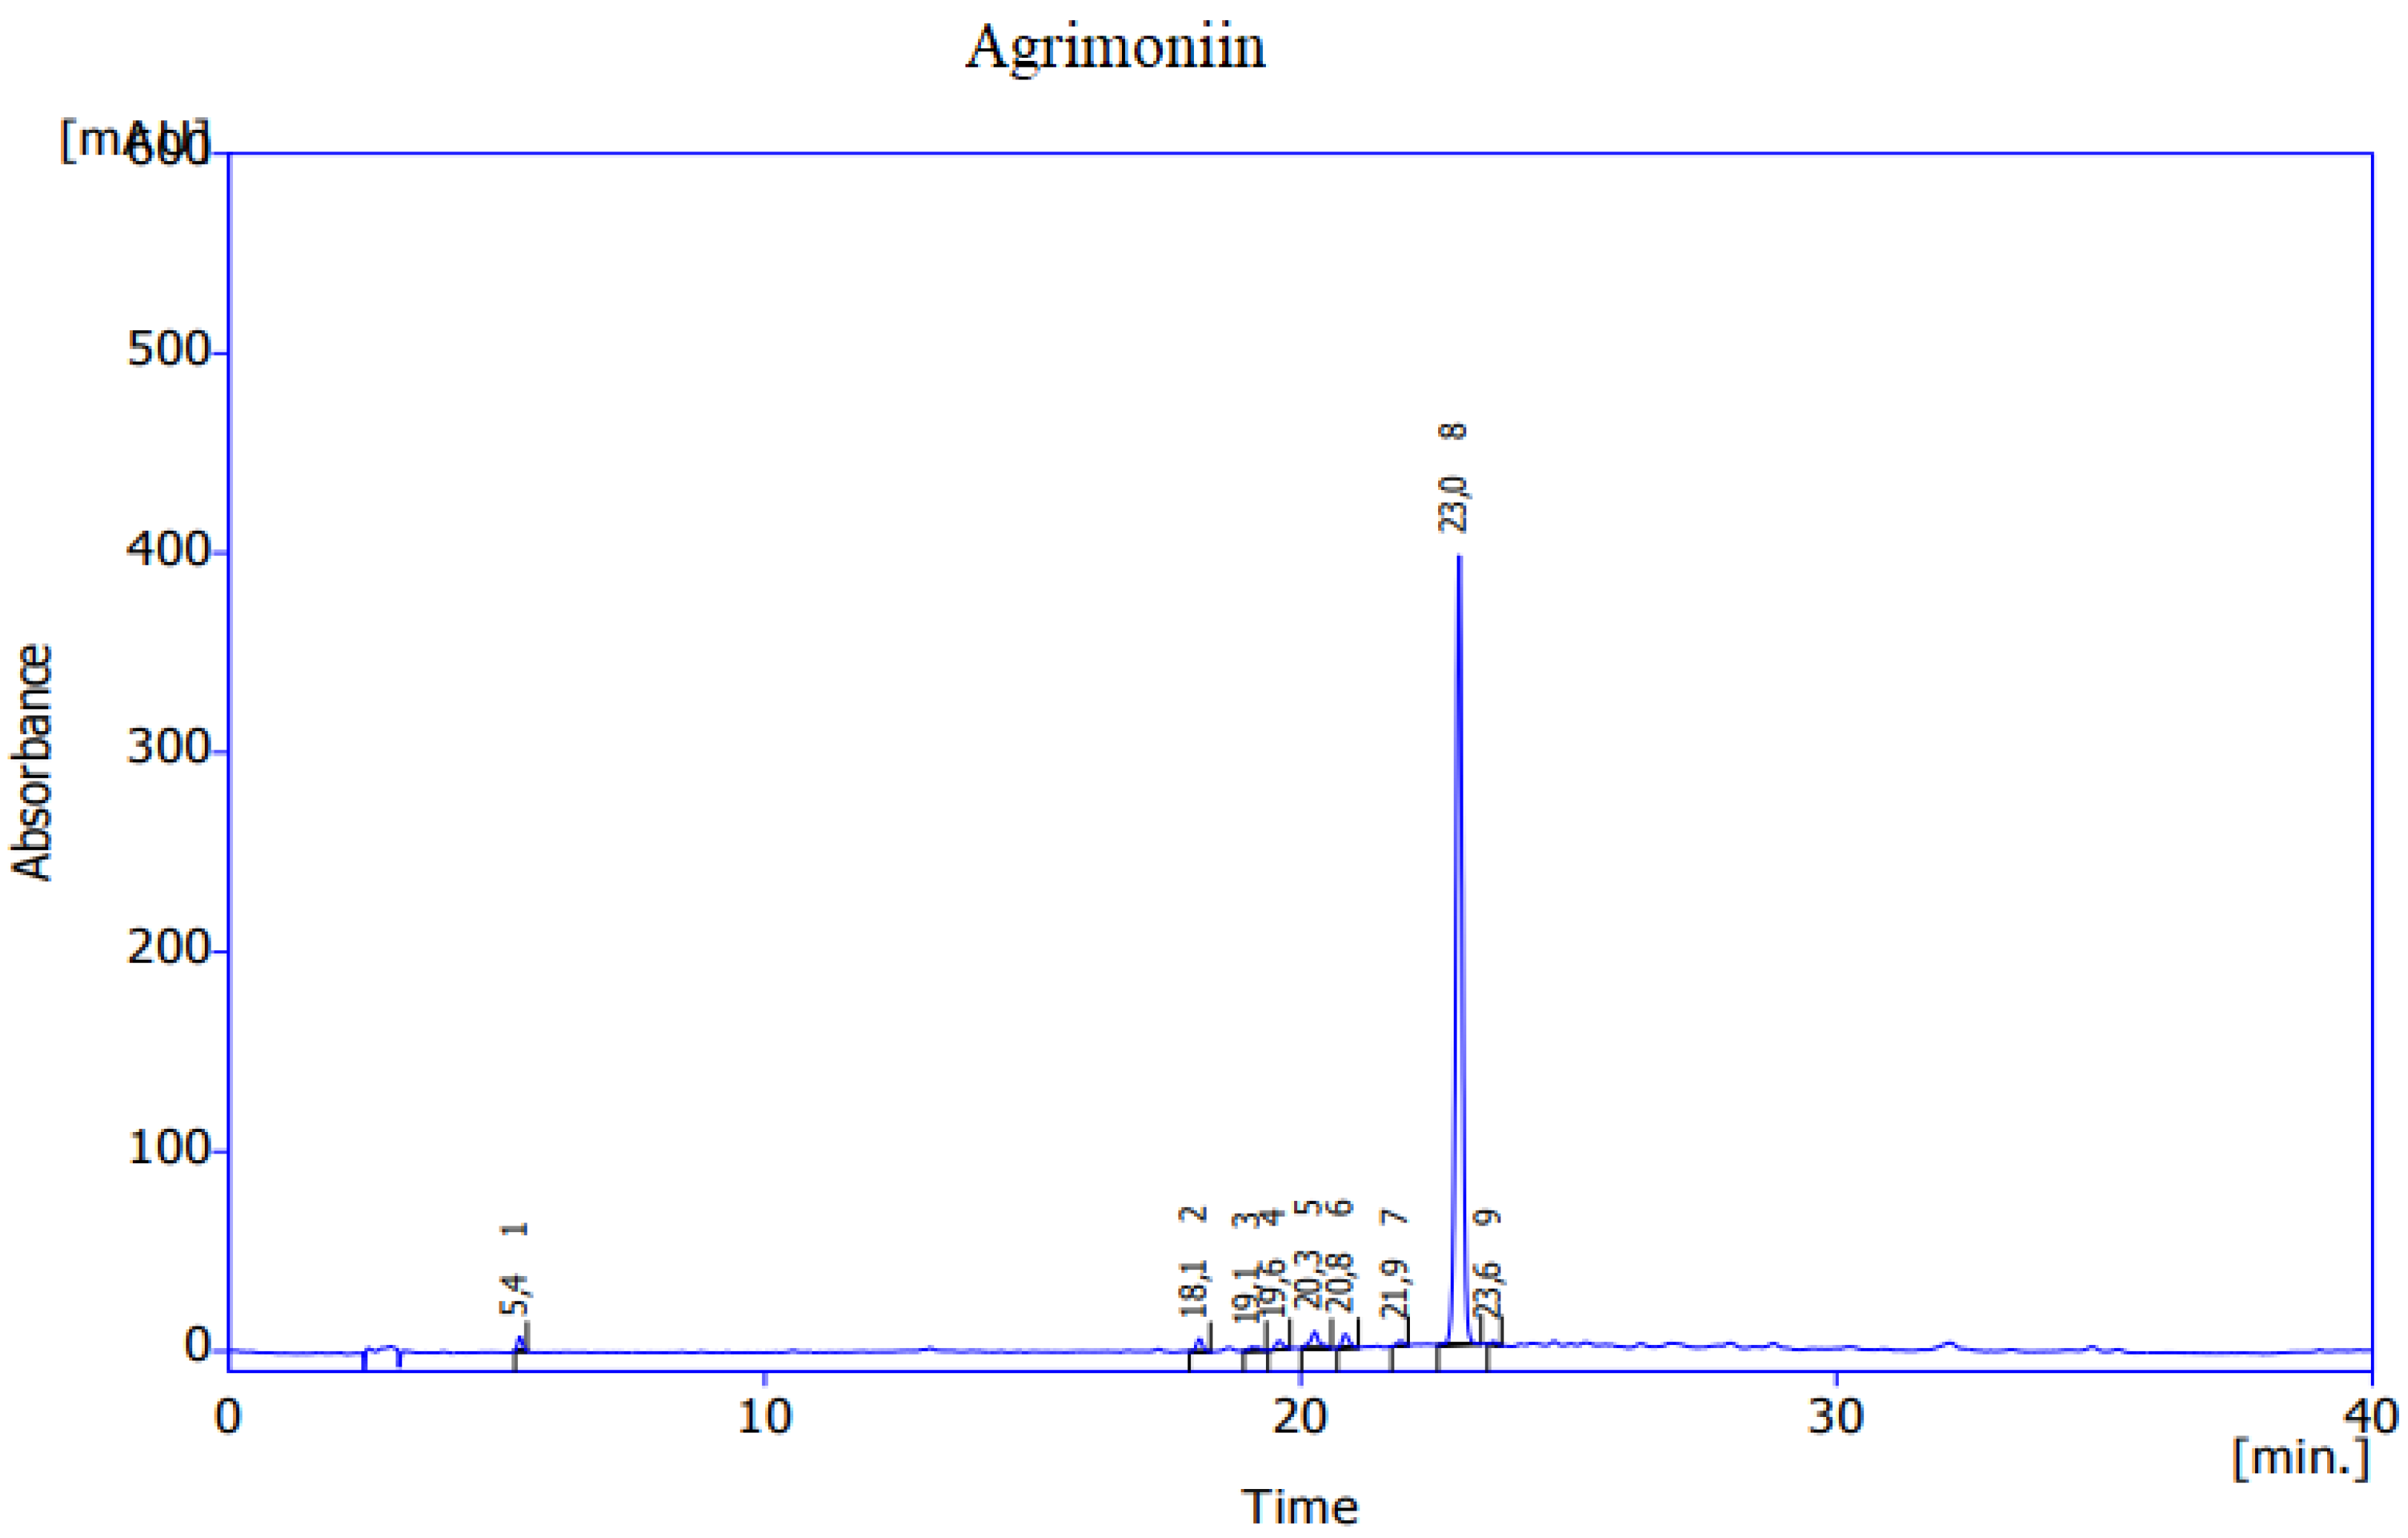
Ellagitannin concentration was expressed as the sum of individual ellagitannins, ellagic acid, and its derivatives identified in the extracts. Calibration curves were prepared for ellagic acid (0.5–20 mg/L), lambertianin C (0.5–225 mg/L), sanguiin H-6 (0.5–300 mg/L), and agrimoniin (0.5–100 mg/L) (Table A1). Standards of oligomeric ellagitannins (minimum purity 90%)—agrimoniin, lambertianin C, and sanguiin H-6—were isolated and purified at the Institute of Food Technology and Analysis, Lodz University of Technology, according to the procedure described by Sójka et al. [17]. The purity of oligomers was verified by HPLC at 210 nm (based on peak area) (Figure A1). Ellagic acid standard (≥90% purity) was purchased from Extrasynthese (Genay, France). Data were collected using ClarityChrom v.3.0.5.505 software (Berlin, Germany).

2.5.2. Determination of Flavanols

Proanthocyanidins were quantified using the phloroglucinolysis method, as described by Kennedy & Jones [34]. Approximately 40 mg of lyophilized extract was reacted with 0.8 mL of phloroglucinol (75 g/L) and ascorbic acid (15 g/L) solution, along with 0.4 mL of 0.1% hydrochloric acid in anhydrous methanol. The mixture was incubated at 50 °C for 30 min using a Thermo-Shaker PHMT PSC24 (Grant Instruments Ltd., Cambridgeshire, UK). After incubation, the solutions were immediately cooled in an ice bath. The reaction was stopped by adding 0.6 mL of 40 mM aqueous sodium acetate. The samples were then centrifuged using an MPW–260R centrifuge (Med Instruments, Warsaw, Poland) at 14,000× g for 15 min. Before HPLC analysis, the samples were diluted 1:1 (v/v) with 40 mM sodium acetate.
Terminal and free catechins, as well as phloroglucinol adducts, were analyzed by HPLC using a Shimadzu system (Tokyo, Japan) equipped with a fluorescence detector (FD, Shimadzu RF–10Axl, Kyoto, Japan). The excitation and emission wavelengths were set at 278 nm and 360 nm, respectively. Chromatographic separation was performed at 30 °C using a Gemini C18 110 Å column (250 mm × 4.6 mm, 5 μm; Phenomenex, Torrance, CA, USA). The injection volume was 20 μL and the flow rate was 1 mL/min. The separation was carried out in a concentration gradient with the phases: A—2.5% aqueous acetic acid solution (v/v) and B—80% aqueous acetonitrile solution (v/v). The phase fractions were as follows: 0–10 min—4–7% B; 10–27 min—7–30% B; 27–29 min—30–70% B; 29–34 min—70% B; 34–35 min—70–4% B; 35–40 min—4% B.
Standard curves were established using the epicatechin-phloroglucinol adduct and terminal epicatechin generated through phloroglucinolysis of the procyanidin B2 standard. The standard was dissolved in anhydrous methanol to obtain a stock solution, which was then serially diluted to prepare five working standards. These standards were subjected to the phloroglucinolysis procedure in the same way as the analyzed samples. A minor modification was introduced into the phloroglucinolysis protocol, consisting of the use of 0.2 mL of a working standard (instead of a sample) and 0.2 mL of hydrochloric acid at a concentration of 0.2%. When determining the working concentration of the adduct and the released epicatechin, it was taken into account that one molecule of procyanidin B2 yields two molecules of epicatechin during phloroglucinolysis. For free catechins, stock solutions of (+)-catechin and (−)-epicatechin were used to prepare seven working solutions, which were then subjected to chromatographic analysis.
Catechin-phloroglucinol adducts and terminal catechins were quantified using the standard curves within a concentration range of 0.8–90 mg/L. To determine the concentrations of free catechin and epicatechin, separate standard curves were constructed over the ranges of 0.25 to 110 mg/L and 0.25 to 95 mg/L, respectively. The total proanthocyanidin content was calculated as the sum of the phloroglucinol adducts and the released terminal units. The procyanidin B2 standard (90% purity) was purchased from Extrasynthese (Genay, France), and standards of (+)-catechin and epicatechin (≥98% purity) were obtained from Sigma Aldrich Chemie (Steinheim, Germany). Data were collected using LabSolutions Lite v. 5.52 software (Shimadzu Corporation, Kyoto, Japan).

2.5.3. Determination of Anthocyanins

Anthocyanin content was determined according to the method described by Sójka et al. [17,33]. The same equipment was employed as was used for ellagitannin analysis. Quantitative determination of anthocyanins was performed using HPLC-DAD. Chromatographic separation was carried out on a Gemini C18 110 Å column (150 mm × 4.6 mm, 5 µm; Phenomenex, Torrance, CA, USA) with gradient elution with phase A—an aqueous solution of 10% formic acid (v/v), and phase B—comprising acetonitrile, water, and formic acid in a ratio of 50:40:10 (v/v/v). The share of phase B was as follows: 0–0.6 min—12%; 0.6–16 min—12–30%; 16–20.5 min—30–100%; 20.5–22 min—100%; 22–25 min—100–12%; 25–35 min—12%. Anthocyanin concentration was calculated using a calibration curve prepared for cyanidin 3-O-glucoside over the range of 1.5–225 mg/L. The standard (≥98% purity) was obtained from Extrasynthese (Genay, France). Chromatograms were recorded at 520 nm. Data were collected using ClarityChrom v. 3.0.5.505 software (Berlin, Germany).

2.6. Total Polyphenol Content (TPC)

Total polyphenol content was determined using the Folin–Ciocalteu (FC) spectrophotometric method, following the procedure described by Singleton & Rossi [35], with slight modifications. Water, the extract solution at a concentration of 1 mg/mL (dissolved in 50% methanol), and the FC reagent were added to a 7 mL test tube in a ratio of 38:1:1 (v/v/v). A blank sample without extract was also prepared. The tubes were manually mixed for 1 min and incubated in the dark for 3 min. Subsequently, 1 mL of 10% aqueous sodium carbonate solution (v/v) was added. The samples were incubated in the dark for 60 min at 20 °C (±1 °C), then centrifuged at 14,000× g using an MPW–260R centrifuge (Med Instruments, Warsaw, Poland). Absorbance was measured at 765 nm using a Rayleigh VIS–7200 G spectrophotometer (Beijing, China). The results were calculated based on a calibration curve prepared for gallic acid (37.5–300 mg/L) and expressed as gallic acid equivalents (GAE) in mg per gram of extract (mg GAE/g).

2.7. Determination of Antioxidant Capacity

2.7.1. Ferric Reducing Antioxidant Power (FRAP)

FRAP was determined according to the method described by Sachett et al. [36], with modifications. Reagent A was prepared by mixing 0.2 M acetate buffer (pH 3.6), 10 mM TPTZ in 40 mM hydrochloric acid, and 20 mM ferric chloride in a ratio of 10:1:1 (v/v/v). The mixture was heated to 37 °C (±1 °C). To 2.9 mL of reagent A was added 0.1 mL of extract solution (1 mg/mL in 50% methanol). A control sample containing 0.1 mL of 50% aqueous methanol instead of the extract was also prepared. The samples were incubated for 8 min at 20 °C (±1 °C). Absorbance was measured at 593 nm using a Rayleigh VIS–7200 G spectrophotometer (Beijing, China), with reference to the blank. A calibration curve of Fe2+ ions was prepared (0–100 µM/L). The results were expressed as µM Fe2+/L.

2.7.2. DPPH Radical Scavenging Activity

The DPPH radical scavenging capacity was assessed using 2,2-diphenyl-1-picrylhydrazyl dissolved in 96% ethanol, following the procedure described by Sachett et al. [37]. To 3.9 mL of a 25 mg/L DPPH solution was added 0.1 mL of extract (1 mg/mL in 50% methanol). A control sample was prepared containing 0.1 mL of 96% ethanol instead of the extract. The samples were incubated for 30 min at 20 °C (±1 °C) in the dark. Absorbance was measured at 515 nm using a Rayleigh VIS–7200 G spectrophotometer (Beijing, China). The results were expressed as percentage inhibition (% inh.) of the DPPH radical, according to the formula
% i n h . = A c A a A c × 100
where Ac is the absorbance of the control and Aa is the absorbance of the sample.

2.8. Statistical Analysis

Statistical analyses were performed using Statistica 12 software (StatSoft, Tulsa, OK, USA). Duncan’s post hoc tests, Spearman correlation, and ANOVA were used. The effects of the extract purification level on antioxidant properties were analyzed, along with the correlations between individual polyphenol concentrations and antioxidant capacity.

3. Results and Discussion

3.1. Extract Characterization

All extracts were analyzed for the presence of ellagitannins, anthocyanins, and flavanols (Figure 1). The crude extracts (CEX) contained 8–19 g/100 g dry weight (d.w.) of ellagitannins in raspberry and blackberry pomace extracts, and 1.5–3 g/100 g d.w. in the extracts obtained from strawberry and wild strawberry pomace. The extracts obtained from the juice-processing residues consistently exhibited higher concentrations of ellagitannins. The flavanol content varied between 0.9 and 6 g/100 g d.w., with higher levels observed in extracts derived from strawberry and wild strawberry pomace. The extracts obtained from pomace after juice production contained 2- to over 3-fold more flavanols compared to those from purée production. Anthocyanins were also detected in the CEX samples; in most cases, their concentrations did not exceed 0.5 g/100 g d.w., except in the case of blackberry pomace extracts, where levels ranged from 1.4 to 2 g/100 g d.w.
Purification of crude extracts using Amberlite XAD 1600N resin with ethanol elution significantly increased the concentration of polyphenols compared to CEX. In XAD-purified extracts from raspberry and blackberry pomace, ellagitannin content ranged from 36 to 62 g/100 g d.w., while Fragaria-derived extracts contained 8–12 g/100 g d.w. These values are slightly lower than those reported by Sójka et al. [38], who obtained 82% ellagitannins during the purification of raspberry extract on Amberlite XAD 1600N using fractionated ethanol elution. No fractionation was applied during the purification process. All XAD extracts contained flavanols in the range of 4–19 g/100 g d.w., with higher concentrations observed in the strawberry and wild strawberry extracts. Anthocyanin concentrations in the XAD extracts ranged from 1 to 7 g/100 g d.w. for Rubus extracts and from 0.6 to 2 g/100 g d.w. for Fragaria-derived extracts.
Further purification of XAD extracts using size-exclusion chromatography (Toyopearl HW-40F) yielded two types of SEC extracts: methanolic and acetonic fractions. The acetonic SEC extracts showed on average a 1.4-fold increase in ellagitannin content compared to the XAD extracts. In Rubus-derived acetonic SEC extracts, ellagitannin content ranged from 59 to 75 g/100 g d.w., with lower concentrations observed in the extracts derived from purée processing pomace. In contrast, Fragaria-derived acetonic SEC extracts contained three to four times less ellagitannins than those from Rubus. No anthocyanins were detected in raspberry-derived acetonic SEC extracts, while in other samples anthocyanin content ranged from 0.1 to 0.5 g/100 g d.w. Flavanols in acetonic SEC extracts ranged from 4 to 9 g/100 g d.w. for Rubus and 6 to 18 g/100 g d.w. for Fragaria extracts.
Analysis of methanolic SEC extracts revealed that they were rich in both anthocyanins and flavanols. The highest anthocyanin content was observed in the blackberry extracts, ranging from 33 to 36 g/100 g d.w. In the raspberry extracts, the anthocyanin content was more than 3-fold lower. Among Fragaria-derived extracts, the anthocyanin content varied considerably, from 0.05 to 15 g/100 g d.w. Flavanols in methanolic SEC extracts ranged from 1 to 7 g/100 g d.w., with the lowest levels observed in wild strawberry extracts. Ellagitannin content in these extracts ranged from 0 to 1 g/100 g d.w.
Each subsequent purification step resulted in a progressive increase in polyphenol concentrations. This is because adsorptive resins remove water-soluble impurities such as sugars and proteins, concentrating the polyphenols. Additionally, size-exclusion chromatography further separates polyphenols based on molecular size, allowing for more precise isolation of specific polyphenol groups. This results in extracts with higher polyphenol purity and content. Compared to the CEX extracts, the total polyphenol content increased on average by 4.7-fold in the XAD extracts and 6-fold in acetonic SEC extracts. Cuevas-Rodríguez et al. [30] and Sánchez-Velázquez et al. [8] reported that purification of Rubus fruit extracts using Amberlite XAD-7 and Sephadex LH-20 resins increased polyphenol concentrations up to 47-fold compared to crude extracts. In the present study, SEC purification resulted in methanolic and acetonic fractions with distinct contents of tannins and anthocyanins, in agreement with literature data. Srivastava et al. [32] also demonstrated that Sephadex LH-20 purification of blackberry extracts rich in polyphenols can yield separate fractions enriched in ellagitannins and anthocyanins.

3.2. Antioxidant Properties of Extracts with Different Degrees of Purification

The antioxidant properties of all extracts were evaluated using multiple assays based on different mechanisms [39]. This comprehensive approach was necessary due to the lack of a single, universal test capable of accurately assessing the total antioxidant capacity of a sample.
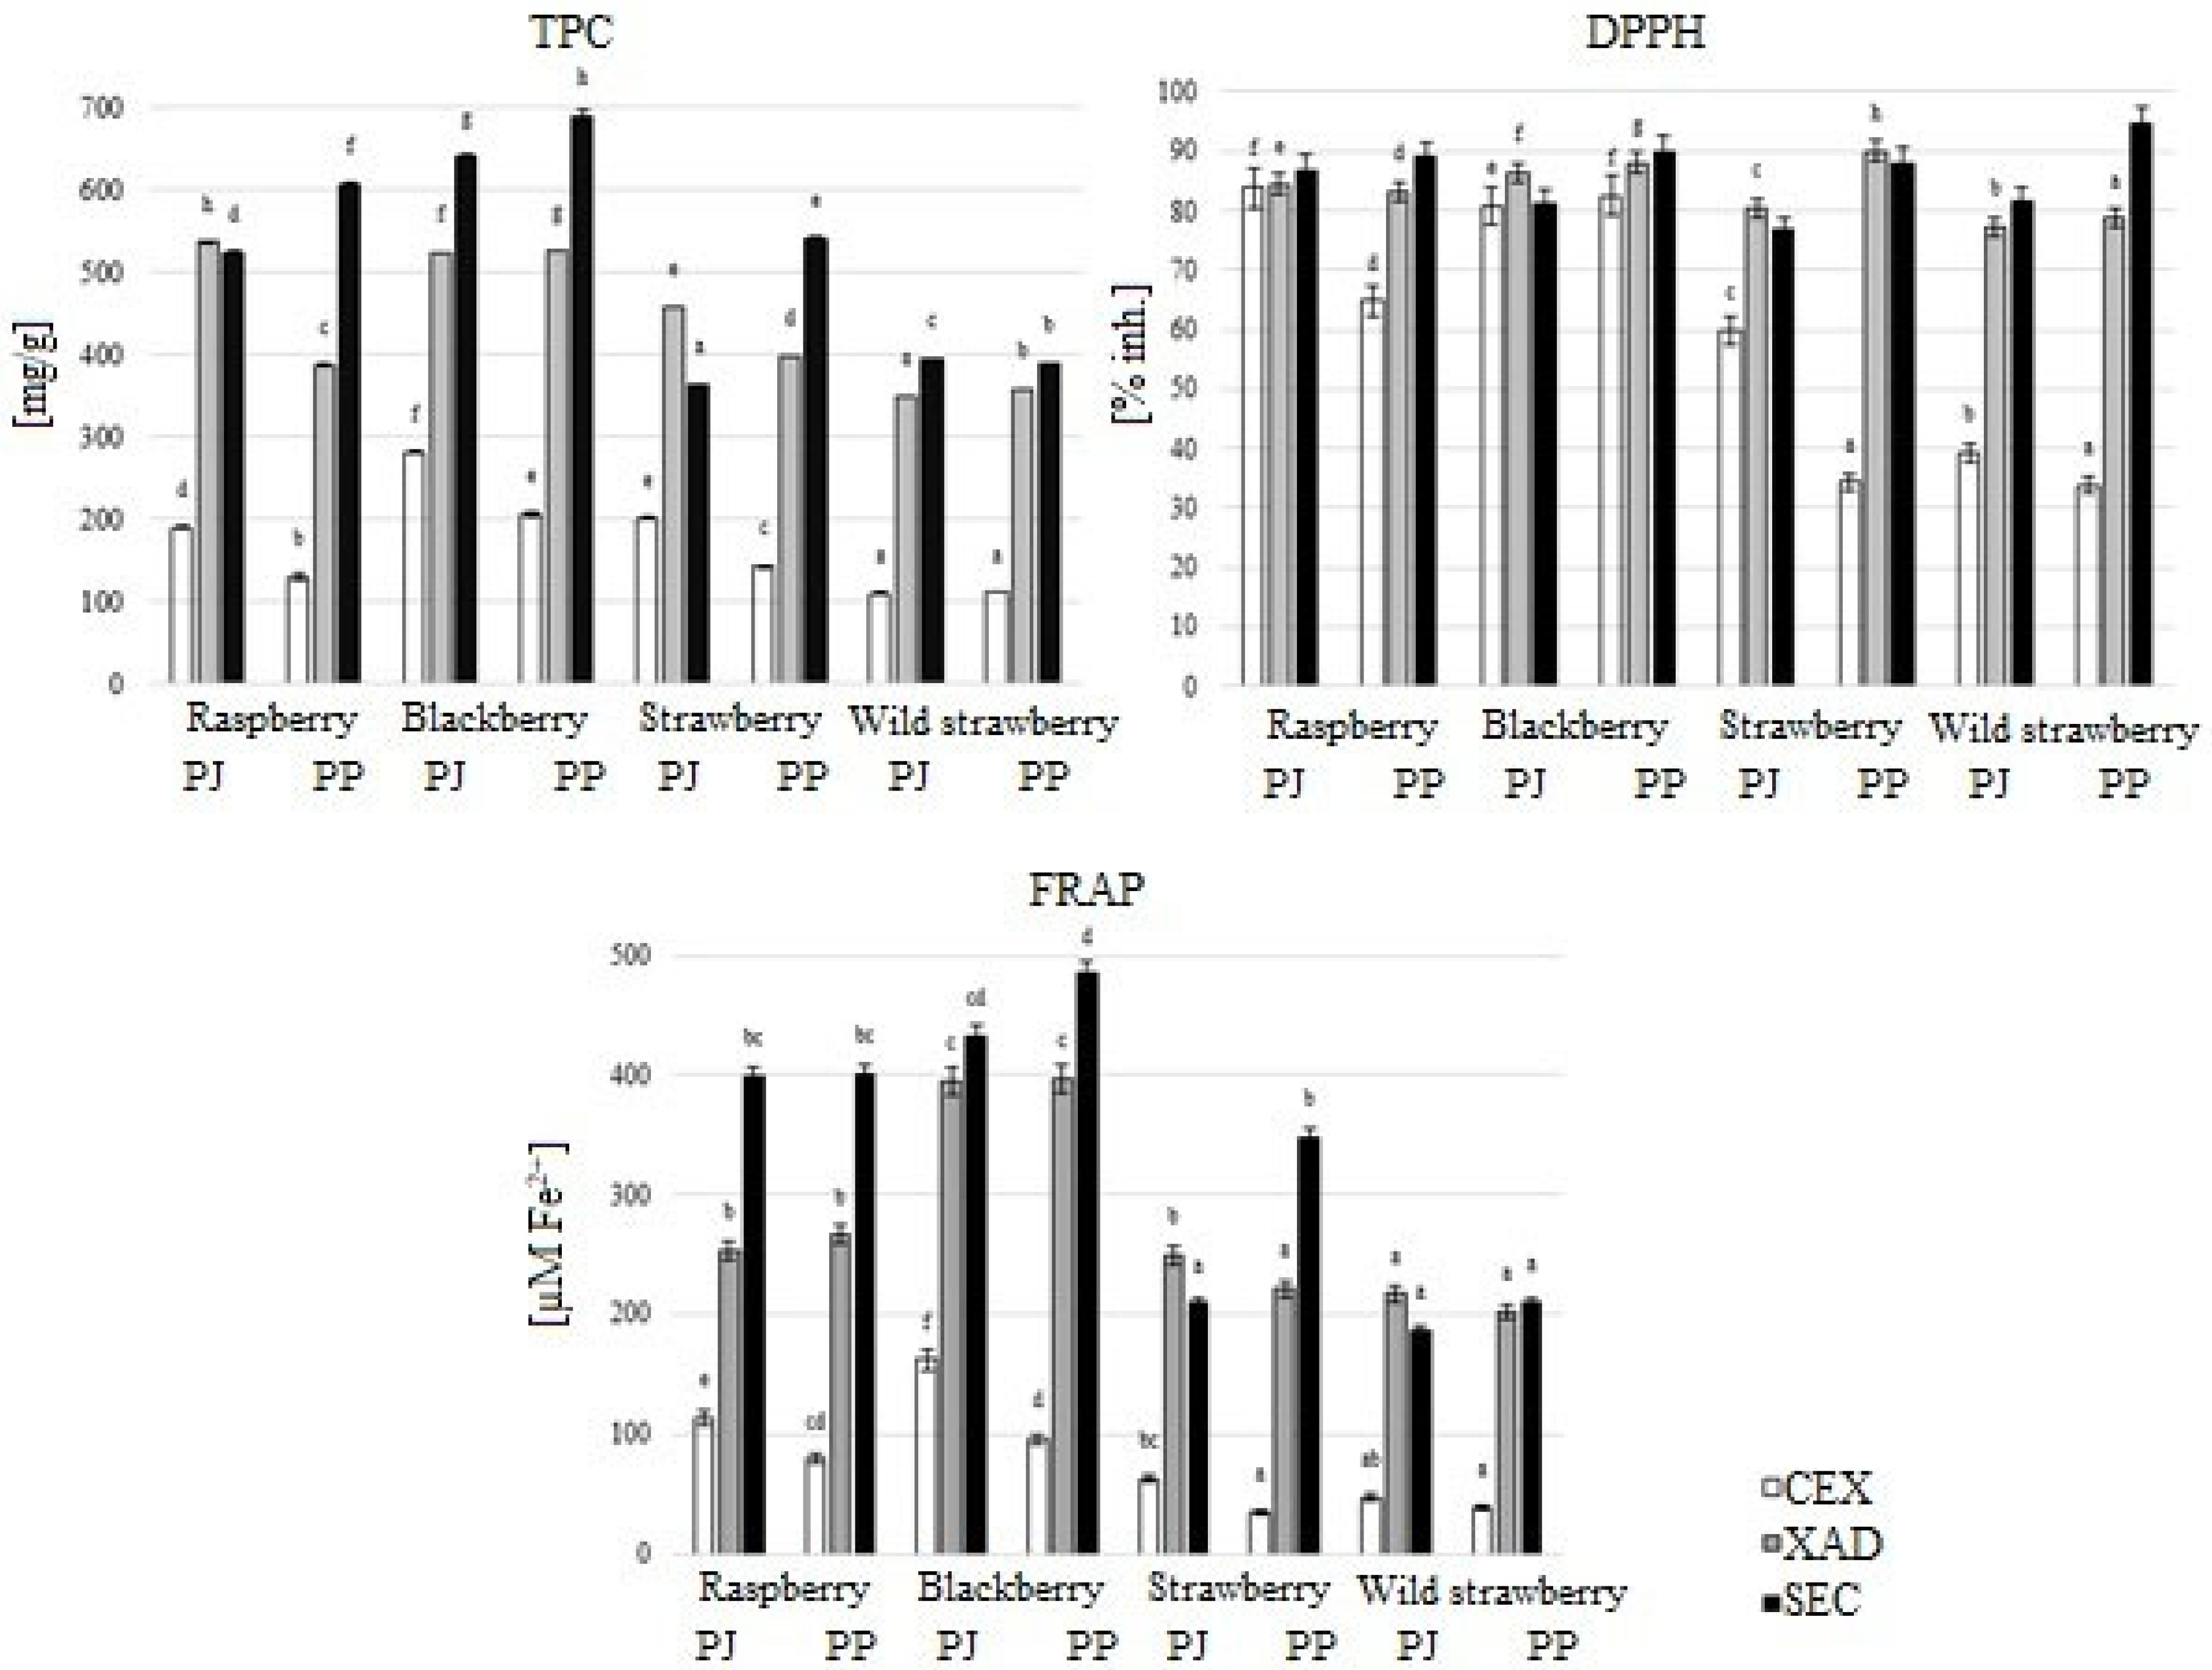
The total phenolic content (TPC), the percentage of DPPH-radical inhibition, and the ferric reducing antioxidant power (FRAP) were determined. The TPC results, expressed as gallic acid equivalents (GAE), revealed that the extracts exhibited high and varied levels of antioxidant compounds (Figure 2). In crude extracts, TPC ranged from 130 to 282 mg GAE/g for Rubus-derived extracts and 109 to 201 mg GAE/g for Fragaria-derived extracts. In XAD-purified extracts, TPC values increased to 387–527 mg GAE/g for Rubus and 349–457 mg GAE/g for Fragaria. The highest TPC levels were observed in acetonic SEC extracts, with concentrations ranging from 524 to 690 mg GAE/g for Rubus, and 363 to 541 mg GAE/g for Fragaria.
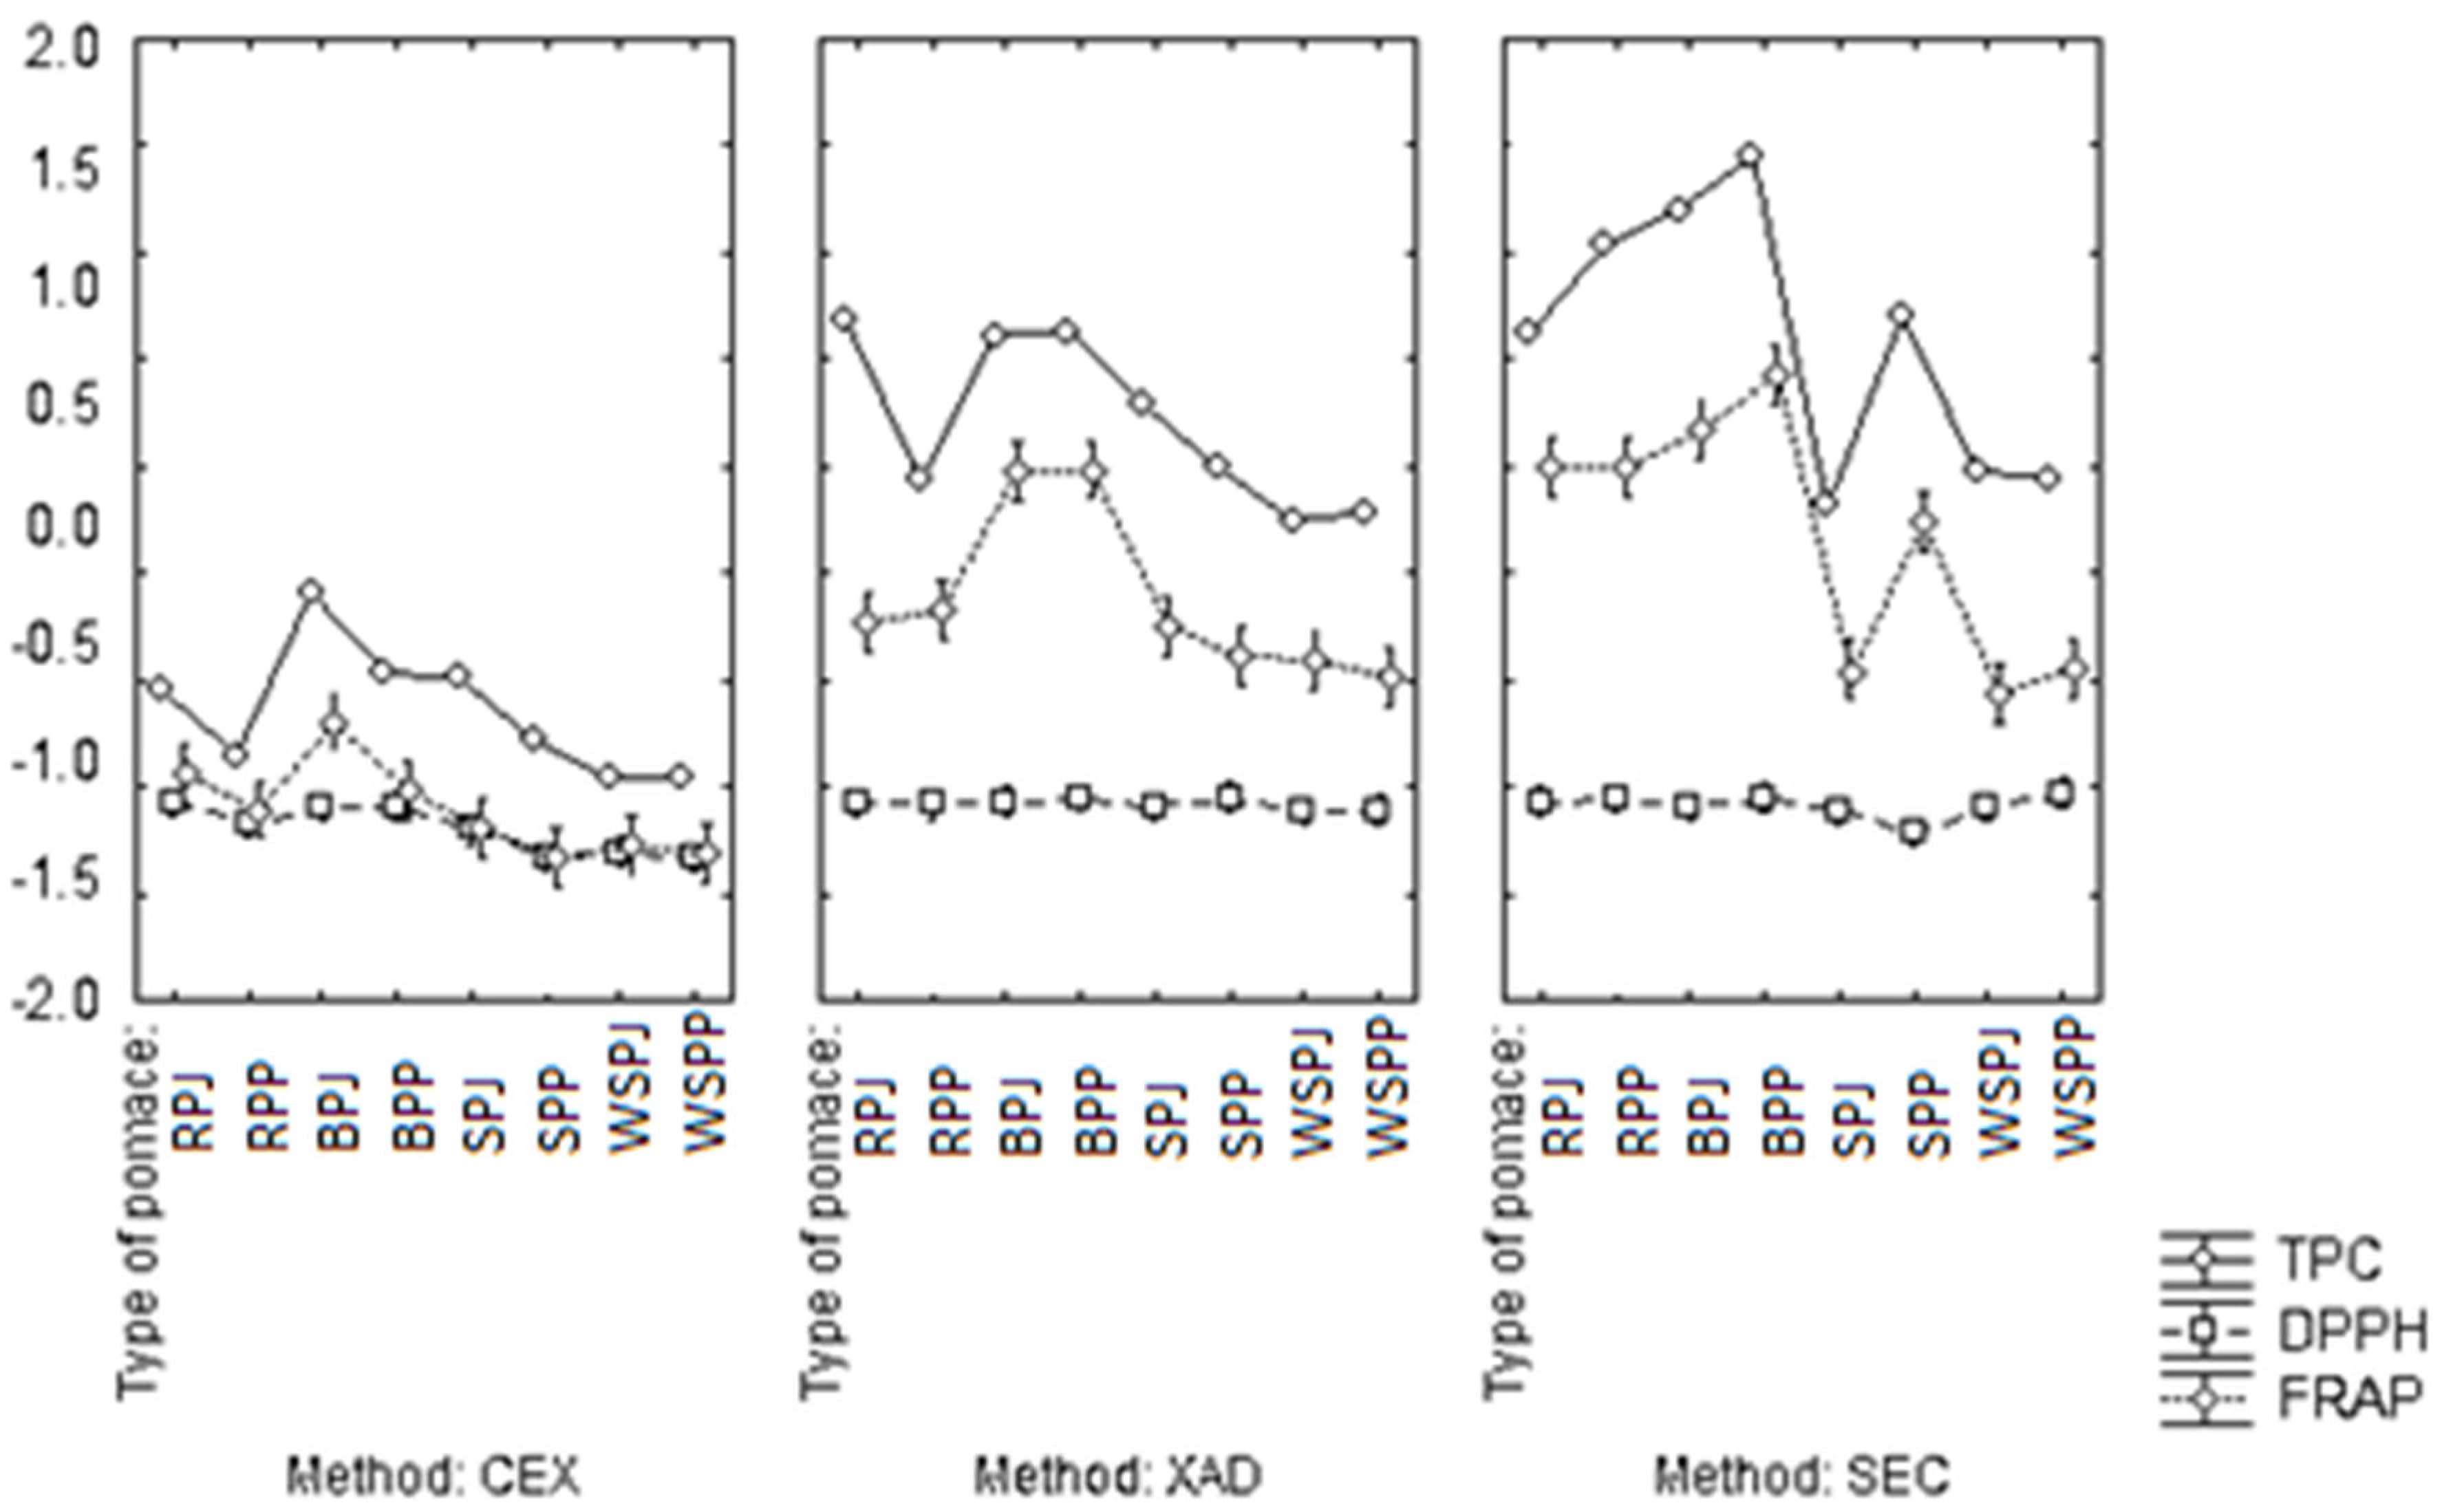
In most of the analyzed cases, regardless of the fruit type or the origin of the pomace, the total phenolic content increased with the degree of extract purification, which is related to the removal of other compounds from the extracts. This observation was confirmed by a two-way ANOVA, which indicated a statistically significant increase in antioxidant capacity in response to purification level (Figure 3). For instance, the TPC of blackberry extracts increased progressively from 282 mg GAE/g in CEX, to 523 mg GAE/g in XAD, reaching 641 mg GAE/g in the SEC extract. In a study by Sánchez-Velázquez et al. [8], analogous CEX, XAD, and SEC extracts from Rubus spp. berries contained on average 16, 193, and 675 mg GAE/g d.w., respectively. In our study, the TPC in the crude blackberry extract was 18-fold higher than the value reported by Sánchez-Velázquez et al. [8]. This discrepancy may result from differences in the composition of other compounds (e.g., vitamins, organic acids, proteins) that may interact with the Folin–Ciocalteu reagent, as well as variations in extraction procedures. For example, Sánchez-Velázquez et al. [8] used methanolic extraction and included a defatting step to remove non-polar compounds, which could have lowered the final TPC value.
In most cases, extracts derived from Rubus pomace exhibited higher TPC values compared to those from Fragaria, which is positively correlated with their polyphenol concentration. An exception was observed in the strawberry extracts, where the total antioxidant content was comparable to that of raspberry and blackberry extracts, despite lower polyphenol concentrations determined by HPLC (Figure 1). This phenomenon has also been reported previously. A likely explanation is that other antioxidant constituents within the matrix—those not removed or quantified during the analysis—may contribute to the overall TPC values [40,41].
All tested extracts (at concentrations of 1 mg/mL) showed high DPPH radical scavenging activity (Figure 2). Depending on the degree of purification, this activity ranged from 65% to 90% for Rubus-derived extracts, and from 34% to 95% for Fragaria. Minor but statistically significant differences in DPPH inhibition were observed across different purification levels for Rubus-based extracts. In contrast, for Fragaria the most notable difference was found between CEX and SEC extracts. For example, crude wild strawberry extract exhibited only 39% inhibition, while the SEC extract reached nearly 95%.
The purification level also influenced the ability of the extracts to reduce ferric ions (Fe3+), as measured by the FRAP assay. This trend was particularly evident for Rubus-derived extracts. In the case of Fragaria, the most substantial increase in FRAP values was observed between the CEX and XAD extracts. Purification using the Amberlite XAD 1600N resin resulted in a 6-fold increase in ferric reducing power. This may be due to the increase in the overall concentration of polyphenolic compounds in the extracts with a higher degree of purification, as well as differences in the individual compounds. Across all tested samples (1 mg/mL), extracts derived from Rubus generally showed higher FRAP values than those from Fragaria. Among all the samples and purification levels, blackberry pomace extracts consistently exhibited the highest ferric-reducing ability. Pellegrini et al. [41] previously reported that blackberry had the highest antioxidant capacity (among blackberry, raspberry, strawberry, and blueberry) measured via the FRAP method (5.2 mmol Fe2+/100 g fresh weight).
To assess the impacts of the purification method, type of pomace, and concentration of specific polyphenol groups on antioxidant properties, a Spearman correlation was performed (Table 1). The analysis showed that the purification method and the concentration of tannins, mainly ellagitannins, were the key factors significantly influencing the increase in antioxidant activities. These findings align with the literature, which already indicated that the enhancement of antioxidant properties correlates with the degree of extract purification. An increase in antioxidant capacity measured by the ORAC method was observed between analogous CEX, XAD, and SEC extracts of Mexican wild berries, in the range of 7–20 times between CEX and XAD extracts, 1- to 2-fold between XAD and SEC extracts, and 11- to 18-fold between CEX and SEC [30]. The literature also suggests that the antioxidant capacity of Rubus fruits is primarily influenced by tannins rather than anthocyanins [30,31,32]. These data from the literature are consistent with the results presented in our study.

3.3. Antioxidant Activity of Acetone and Methanol Extracts After Purification by Size-Exclusion Chromatography

To compare the influence of specific polyphenol groups on antioxidant properties, methanol and acetone extracts obtained after purification using SEC were also analyzed (Figure 4). This comparison is justified because the extracts differed in polyphenol composition. The acetone extracts were rich in ellagitannins, while the methanol extracts were abundant in anthocyanins and flavanols.
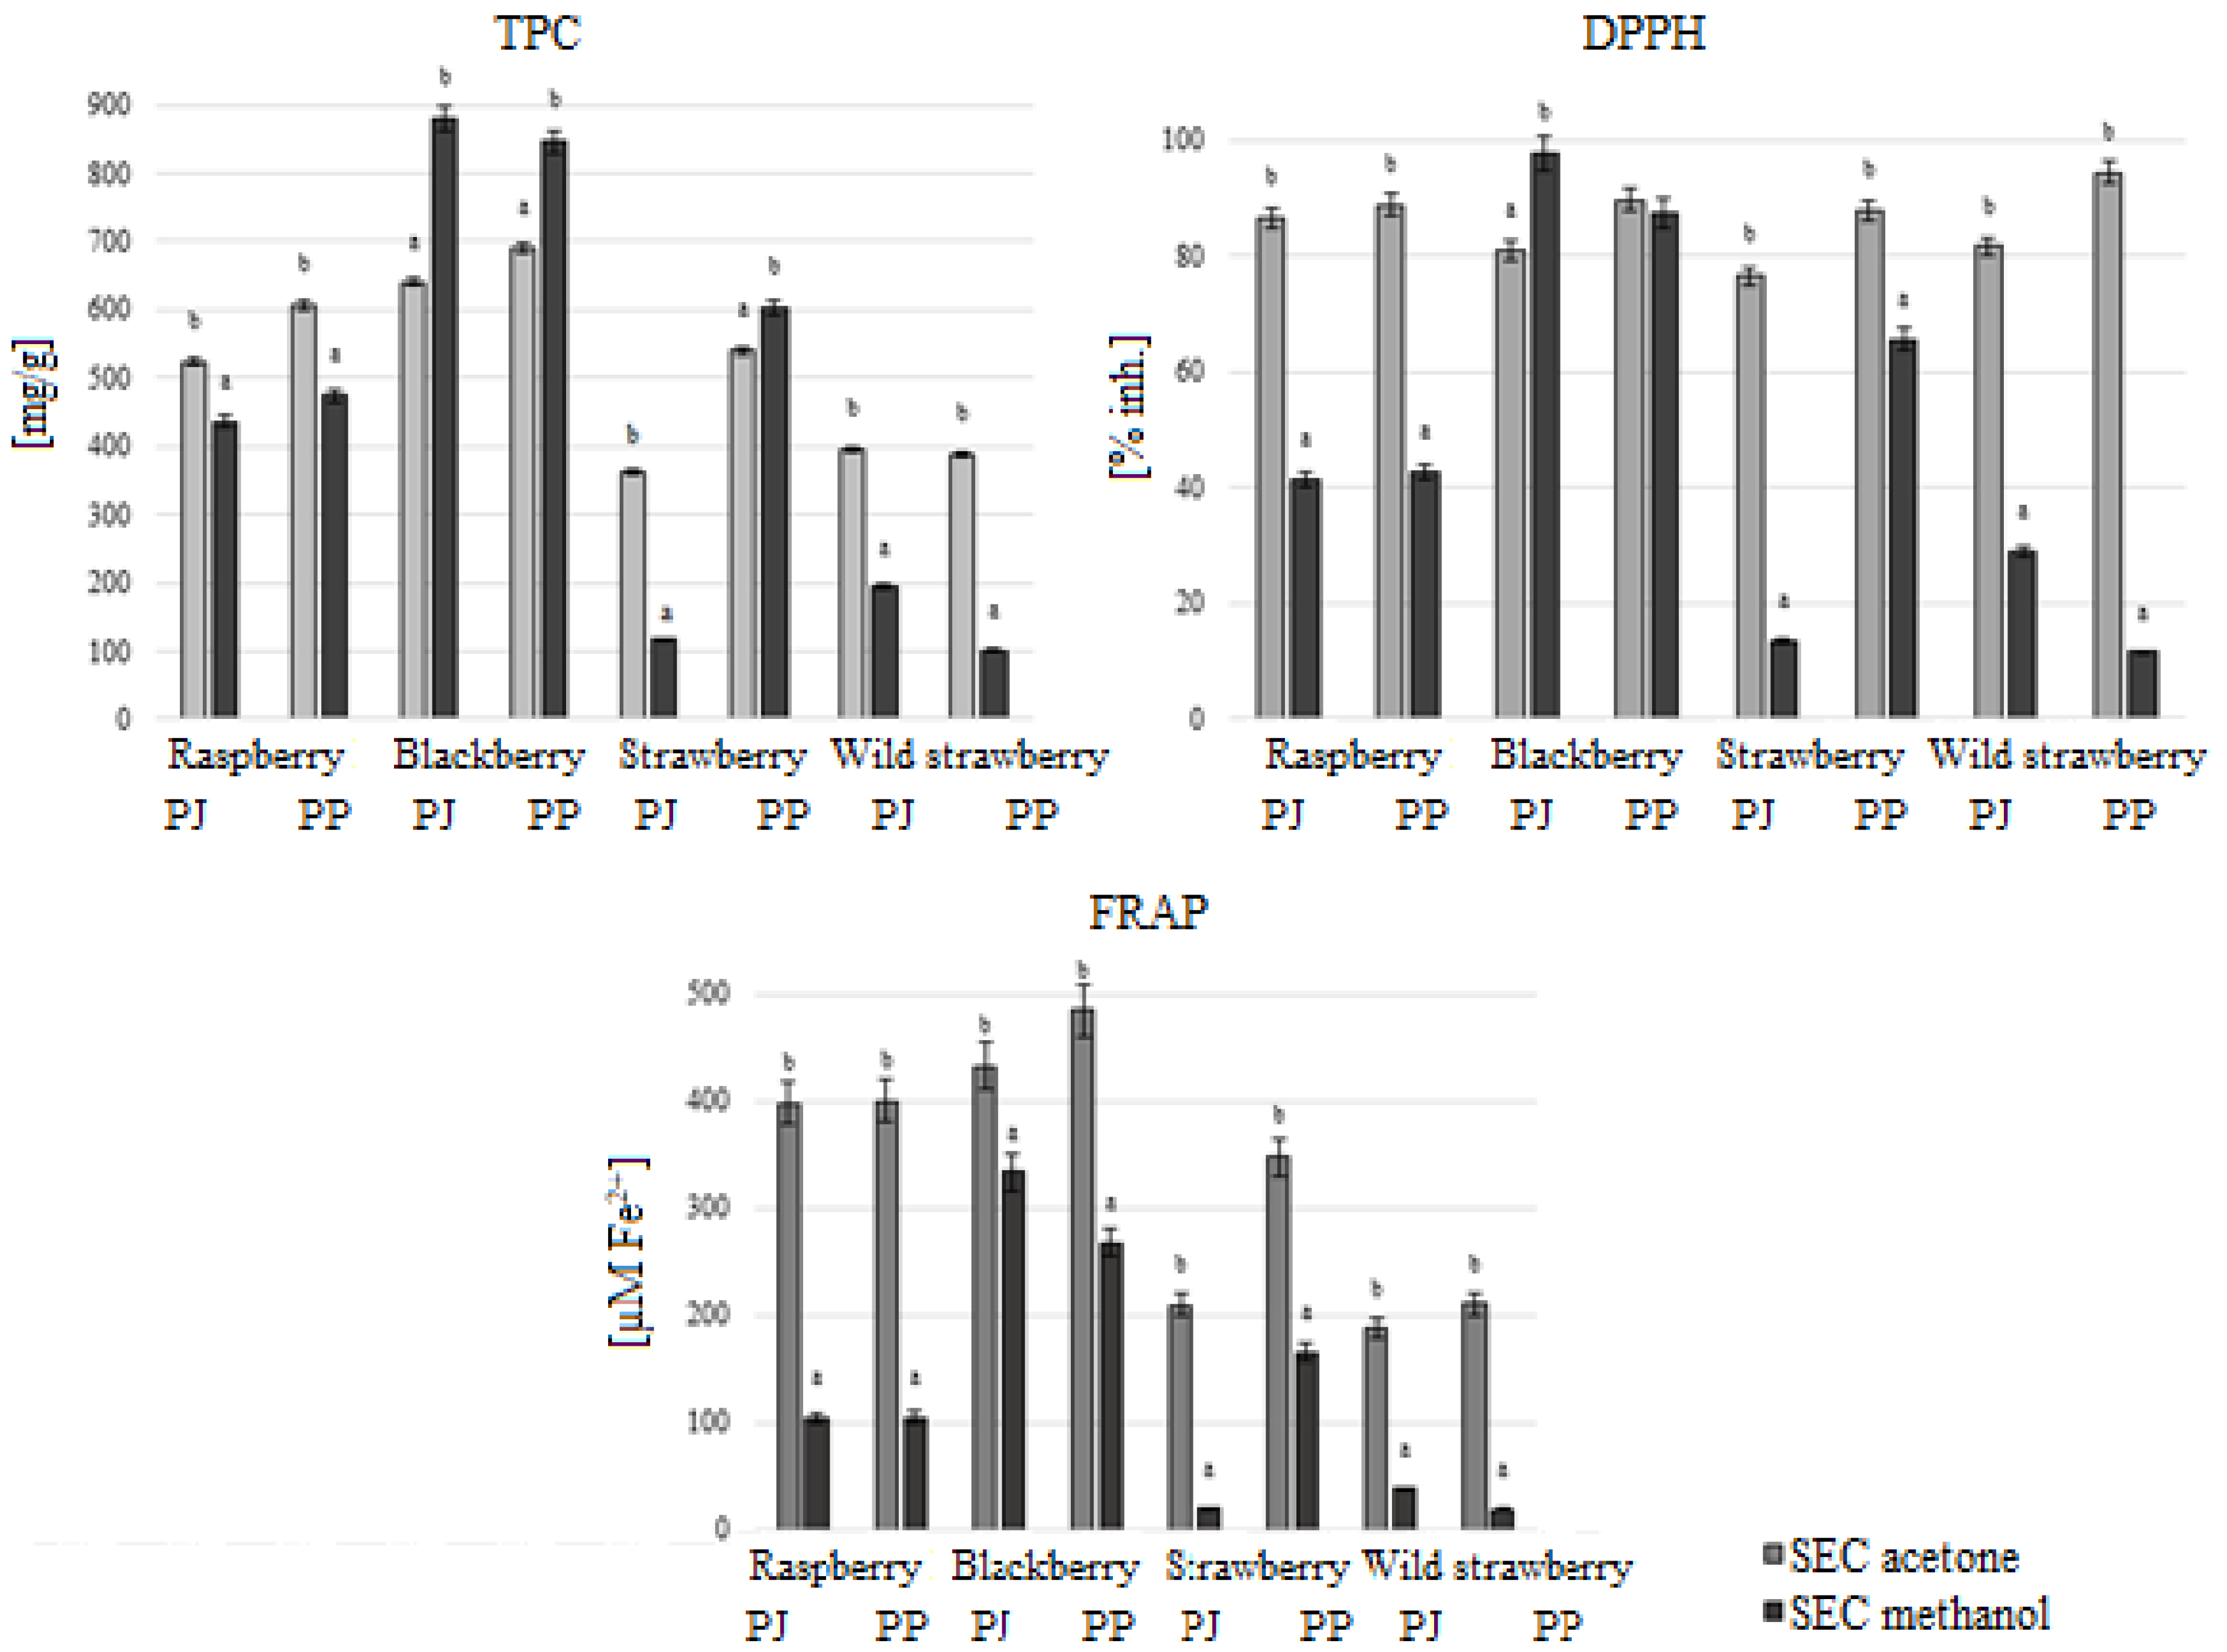
The TPC values for acetone and methanol extracts from Rubus sources ranged from 523 to 690 mg GAE/g and 437 to 880 mg GAE/g, respectively (Figure 4). For both types of extracts from Fragaria, the TPC values were lower, ranging from 363 to 541 mg GAE/g and 100 to 603 mg GAE/g, respectively. DPPH radical inhibition for Rubus extracts ranged from 81 to 89% for acetone extracts (rich in ellagitannins) and 41 to 98% for methanol extracts (rich in other polyphenols). In the case of extracts from Fragaria sources, radical inhibition was 77–95% for acetone extracts and 12–66% for methanol extracts. In most cases, inhibition was higher with acetone extracts.
In the FRAP assay, acetone extracts consistently showed greater iron (III) ion reducing capacity than methanol extracts, with the smallest difference observed for blackberry extracts. Acetone extracts from Rubus and Fragaria showed FRAP values of 398–485 µM Fe2+ and 187–348 µM Fe2+, respectively. Methanol extracts showed FRAP values of 104–334 µM Fe2+ and 18.5–165 µM Fe2+, respectively. For acetone and methanol extracts obtained from blackberry pomace juice, FRAP values were 433 and 334 µM Fe2+, respectively.
For most variants, higher antioxidant capacity values were recorded for acetone extracts rich in ellagitannins. This is consistent with previous reports, including for blackberry extracts [8]. Additionally, Spearman correlation analysis (Table 2) showed that ellagitannin concentration positively correlated with all tested antioxidant capacities. The high contribution of hydrolyzable tannins—and thus their antioxidant role—is primarily due to the large number of hydroxyl groups in the ellagitannin structure [8,30]. An exception was blackberry extracts (TPC and DPPH tests), where higher values were found in SEC extracts rich in anthocyanins and flavanols, highlighting the important role of these polyphenols in antioxidant activity. This exception to the overall trend may be attributed to the exceptionally high concentration of anthocyanins found in the SEC-methanol blackberry extracts (33–36 g/100 g), as well as to potential co-pigmentation or synergistic effects with flavanols. However, statistical analysis found no correlation between anthocyanin concentration and any tested antioxidant capacity. Flavanol concentration positively correlated with antioxidant levels measured by DPPH and FRAP assays.
In a study by Srivastava et al. [32], for extracts isolated from three blackberry cultivars (purified using SEC on Sephadex LH-20: 50% aqueous acetone and 95% aqueous ethanol), the anthocyanin-rich fraction showed TPC values ranging from 68 to 78 mg GAE/100 mg, while the ellagitannin-rich fraction exhibited higher values, from 77 to 90 mg GAE/100 mg. In the same study, ellagitannin-rich fractions demonstrated greater iron (III) reducing capacity, which aligns with the results presented here. Differences in the reported TPC values may stem from variations in purification methods, as well as the presence of other compounds in the extracts that contribute to the overall antioxidant potential measured by the Folin–Ciocalteu reagent [33].
In our study, strawberry extracts showed differences in antioxidant capacity depending on the types of pomace from which they were isolated. Extracts obtained from pomace after juice production exhibited significantly higher FRAP and DPPH values compared to those from pomace after purée production. Differences were also observed between polyphenol groups isolated from each type of pomace. Acetone and methanol SEC extracts from juice pomace showed lower antioxidant potential than their counterparts derived from purée pomace. For example, acetone and methanol extracts from juice pomace inhibited the DPPH radical at levels of 77% and 14%, respectively, whereas for purée pomace these values were 88% and 66%. These differences may be attributed to variations in the polyphenol composition of the extracts, particularly flavanols, of which the concentration in the methanol fraction from purée pomace was over three times higher than in the extracts from juice pomace.

4. Conclusions

This is the first study to evaluate the impact of purification methods on antioxidant properties of extracts obtained from berry pomace produced under different processing conditions. Purification of extracts with various methods allowed for the production of extracts with high and diverse polyphenol content, mainly tannins. Analyzing such a wide range of extracts clearly demonstrated the role of ellagitannins, condensed tannins, and anthocyanins in antioxidant activity. It was shown that antioxidant capacity increased with the degree of extract purification. Purifying polyphenol-rich extracts can enhance antioxidant potential up to 6-fold compared to crude extracts. Analysis of purified extracts rich in tannins (ellagitannins, procyanidins) and methanol extracts rich in other polyphenols indicated that ellagitannins are the primary polyphenol group driving increased antioxidant potential.
The results presented here highlight the strong potential for obtaining tannin-rich extracts from by-products and their further application. Moreover, tailoring antioxidant properties of extracts enables their use in the food, cosmetics, and pharmaceutical industries. Future research in food applications should focus on utilizing extracts with high tannin concentrations and strong antioxidant properties as functional additives in various food products.

Author Contributions

Conceptualization, A.H., M.S. and R.K.; methodology, A.H. and M.S.; formal analysis, A.H. and M.S.; investigation, A.H.; writing—original draft preparation, A.H.; writing—review and editing, M.S. and R.K.; visualization, A.H.; supervision, R.K. All authors have read and agreed to the published version of the manuscript.

Funding

This research received no external funding.

Institutional Review Board Statement

Not applicable.

Informed Consent Statement

Not applicable.

Data Availability Statement

The data presented in this study are available on request from the corresponding author.

Acknowledgments

The work was financed from statutory funds of the Institute of Food Technology and Analysis, Faculty of Biotechnology and Food Sciences, Lodz University of Technology, Poland.

Conflicts of Interest

The authors declare no conflicts of interest.

Appendix A

Table A1. Calibration curves.
StandardCalibration CurveR2Standard Error
Lambertianic CY = 21.659x − 21,7680.99997.2806
Sanguiin H-6Y = 26.265x − 3.2870.99995.2067
AgrimoniinY = 21.910x + 13.1790.99906.8407
Ellagic acidY = 101.77x − 135.790.999484.9484

Appendix B

Figure A1. Chromatograms of oligomeric ellagitannins; 210 nm.
Applsci 15 11701 g0a1aApplsci 15 11701 g0a1b

References

  1. Olas, B.; Kontek, B.; Malinowska, P.; Żuchowski, J.; Stochmal, A. Hippophae rhamnoides L. fruits reduce the oxidative stress in human blood platelets and plasma. Oxidative Med. Cell. Longev. 2016, 2016, 4692486. [Google Scholar] [CrossRef]
  2. Agarwal, P.; Holland, T.M.; Wang, Y.; Bennett, D.A.M.; Morris, C. Association of strawberries and anthocyanidin intake with Alzheimer’s Dementia Risk. Nutrients 2019, 11, 3060. [Google Scholar] [CrossRef] [PubMed]
  3. Kilic, I.; Yeşiloğlu, Y.; Bayrak, Y. Spectroscopic studies on the antioxidant activity of ellagic acid. Spectrochim. Acta Part A Mol. Biomol. Spectrosc. 2014, 130, 447–452. [Google Scholar] [CrossRef]
  4. Selva, M.; Carole, T.; John, S.; Xingqian, Y.; Xue, S.J. Ellagic acid in strawberry (Fragaria spp.): Biological, technological, stability, and human health aspects. Food Qual. Saf. 2017, 1, 227–252. [Google Scholar] [CrossRef]
  5. Veberic, R.; Slatnar, A.; Bizjak, J.; Stampar, F.; Petkovsek-Mikulic, M. Anthocyanin composition of different wild and cultivated berry species. LWT Food Sci. Technol. 2015, 60, 509–517. [Google Scholar] [CrossRef]
  6. Gündoğdu, M.; Kan, T.; Canan, I. Bioactive and antioxidant characteristics of blackberry cultivars from East Anatolia. Turk. J. Agric. For. 2016, 40, 344–351. [Google Scholar] [CrossRef]
  7. Rojas-Ocampo, E.; Torrejón-Valqui, L.; Muñóz-Astecker, L.D.; Medina-Mendoza, M.; Mori-Mestanza, D.; Castro-Alayo, E.M. Antioxidant capacity, total phenolic content and phenolic compounds of pulp and bagasse of four Peruvian berries. Heliyon 2021, 7, e07787. [Google Scholar] [CrossRef] [PubMed]
  8. Sánchez-Velázquez, O.A.; Montes-Ávila, J.; Milán-Carrillo, J.; Reyes-Moreno, C.; Mora-Rochin, S.; Cuevas-Rodríguez, E.-O. Characterization of tannins from two wild blackberries (Rubus spp.) by LC–ESI–MS/MS, NMR and antioxidant capacity. J. Food Meas. Charact. 2019, 13, 2265–2274. [Google Scholar] [CrossRef]
  9. Schulz, M.; Chim, J.F. Nutritional and bioactive value of Rubus berries. Food Biosci. 2019, 31, 100438. [Google Scholar] [CrossRef]
  10. Hatano, T.; Edamatsu, R.; Hiramatsu, M.; Mori, A.; Fujita, Y.; Yasuhara, T.; Yoshida, T.; Okuda, T. Effects of the Interaction of Tannins with Co-existing Substances. VI.: Effects of tannins and related polyphenols on superoxide anion radical, and on 1, 1-diphenyl-2-picrylhydrazyl radical. Chem. Pharm. Bull. 1989, 37, 2016–2021. [Google Scholar] [CrossRef]
  11. Nicoli, M.C.; Anese, M.; Parpinel, M. Influence of processing on the antioxidant properties of fruit and vegetables. Trends Food Sci. Technol. 1999, 10, 94–100. [Google Scholar] [CrossRef]
  12. Kahkonen, M.; Kylli, P.; Ollilainen, V.; Salminen, J.P.; Heinonen, M. Antioxidant activity of isolated ellagitannins from red raspberries and cloudberries. J. Agric. Food Chem. 2012, 60, 1167–1174. [Google Scholar] [CrossRef]
  13. Moilanen, J.; Karonen, M.; Tähtinen, P.; Jacquet, R.; Quideau, S.; Salminen, J.-P. Biological activity of ellagitannins: Effects as antioxidants, pro-oxidants and metal chelators. Phytochemistry 2016, 125, 65–72. [Google Scholar] [CrossRef] [PubMed]
  14. Chen, Y.; Xu, L.; Wang, Y.; Chen, Z.; Zhang, M.; Panichayupakaranant, P.; Chen, H. Study on the active polyphenol constituents in differently colored Rubus Chingii Hu and the structure-activity relationship of the main ellagitannins and ellagic acid. LWT 2020, 121, 108967. [Google Scholar] [CrossRef]
  15. Rao, A.V.; Snyder, D.M. Raspberries and human health: A review. J. Agric. Food Chem. 2010, 58, 3871–3883. [Google Scholar] [CrossRef] [PubMed]
  16. Burton-Freeman, B.M.; Sandhu, A.K.; Edirisinghe, I. Red raspberries and their bioactive polyphenols: Cardiometabolic and neuronal health links. Adv. Nutr. 2016, 7, 44–65. [Google Scholar] [CrossRef]
  17. Sójka, M.; Macierzyński, J.; Zaweracz, W.; Buczek, M. Transfer and mass balance of ellagitannins, anthocyanins, flavan-3-ols, and flavonols during the processing of red raspberries (Rubus idaeus L.) to juice. J. Agric. Food Chem. 2016, 64, 5549–5563. [Google Scholar] [CrossRef]
  18. Milczarek, A.; Sójka, M.; Klewicki, R. Transfer of ellagitannins to unclarified juices and purees in the processing of selected fruits of the Rosaceae family. Food Chem. 2021, 344, 128684. [Google Scholar] [CrossRef] [PubMed]
  19. Zorenc, Z.; Veberic, R.; Stampar, F.; Koron, D.; Mikulic-Petkovsek, M. Changes in berry quality of northern highbush blueberry (Vaccinium corymbosum L.) during the harvest season. Turk. J. Agric. For. 2016, 40, 855–867. [Google Scholar] [CrossRef]
  20. Yang, J.W.; Choi, I.S. Comparison of the phenolic composition and antioxidant activity of Korean black raspberry, Bokbunja, (Rubus coreanus Miquel) with those of six other berries. CyTA J. Food 2016, 15, 110–117. [Google Scholar]
  21. Villamil-Galindo, E.; Van de Velde, F.; Piagentini, A.M. Strawberry agro-industrial by-products as a source of bioactive compounds: Effect of cultivar on the phenolic profile and the antioxidant capacity. Bioresour. Bioprocess. 2021, 8, 61. [Google Scholar] [CrossRef] [PubMed]
  22. Hidalgo, G.-I.; Almajano, M.P. Red fruits: Extraction of antioxidants, phenolic content, and radical scavenging determination: A review. Antioxidants 2017, 6, 7. [Google Scholar] [CrossRef]
  23. Klimczak, E.; Król, B. Oznaczanie zawartości różnych form kwasu elagowego w ubocznych produktach przerobu truskawek. Żywn. Nauka Technol. Jakość 2010, 4, 81–94. [Google Scholar]
  24. Marquez-Lopez, A.; Ayala-Flores, F.; Macias-Pureco, S.; Chavez-Parga, M.D.; Valencia Flores, D.C.; Maya-Yescas, R.; Gonzalez-Hernandez, J.C. Extract of ellagitannins starting with strawberries (Fragaria sp.) and blackberries (Rubus sp.). Food Sci. Technol. 2020, 40, 430–439. [Google Scholar] [CrossRef]
  25. Setlhodi, R.; Mashile, B.; Izu, G.O.; Gbashi, S.; Mashele, S.S.; Bonnet, S.L.; Makhafola, T.J.; Chukwuma, C.I. Effect of solvent extraction on the antioxidant and phytochemical profiles of ellagitannins from “wonderful” pomegranate peel: An advanced chemometrics analysis. Eur. Food Res. Technol. 2023, 249, 1807–1820. [Google Scholar] [CrossRef]
  26. Jurgoński, A.; Juśkiewicz, J.; Fotschki, B.; Kołodziejczyk, K.; Milala, J.; Kosmala, M.; Grzelak-Błaszczyk, K.; Markiewicz, L. Metabolism of strawberry mono- and dimeric ellagitannins in rats fed a diet containing fructo-oligosaccharides. Eur. J. Nutr. 2017, 56, 853–864. [Google Scholar] [CrossRef]
  27. George, S.; Brat, P.; Alter, P.; Amiot, M.J. Rapid determination of polyphenols and vitamin C in plant-derived products. J. Agric. Food Chem. 2005, 53, 1370–1373. [Google Scholar] [CrossRef]
  28. García-Estévez, I.; Escribano-Bailón, M.T.; Rivas-Gonzalo, J.C.; Alcalde-Eon, C. Development of a fractionation method for the detection and identification of oak ellagitannins in red wines. Anal. Chim. Acta 2010, 660, 171–176. [Google Scholar] [CrossRef]
  29. Xue, H.; Shen, L.; Wang, X.; Liu, C.; Liu, C.; Liu, H.; Zheng, X. Isolation and purification of anthocyanin from blueberry using macroporous resin combined Sephadex LH-20 techniques. Food Sci. Technol. Res. 2019, 25, 29–38. [Google Scholar] [CrossRef]
  30. Cuevas-Rodríguez, E.O.; Dia, V.P.; Yousef, G.G.; Garcia Saucedo, P.A.; López-Medina, J.; Paredes-López, O.; Gonzalez de Mejia, E.; Lila, M.A. Inhibition of pro-inflammatory responses and antioxidant capacity of Mexican blackberry (Rubus spp.) extracts. J. Agric. Food Chem. 2010, 58, 9542–9548. [Google Scholar] [CrossRef] [PubMed]
  31. Klewicka, E.; Sójka, M.; Klewicki, R.; Kołodziejczyk, K.; Lipińska, L.; Nowak, A. Ellagitannins from raspberry (Rubus idaeus L.) fruit as natural inhibitors of Geotrichum candidum. Molecules 2016, 21, 908. [Google Scholar] [CrossRef]
  32. Srivastava, A.; Greenspan, P.; Hartle, D.K.; Hargrove, J.L.; Amarowicz, R.; Pegg, R.B. Antioxidant and anti-inflammatory activities of polyphenolics from Southeastern U.S. Range Blackberry Cultivars. J. Agric. Food Chem. 2010, 58, 6102–6109. [Google Scholar] [CrossRef] [PubMed]
  33. Sójka, M.; Kołodziejczyk, K.; Milala, J.; Abadias, M.; Viñas, I.; Guyot, S.; Baron, A. Composition and properties of the polyphenolic extracts obtained from industrial plum pomaces. J. Funct. Foods 2015, 12, 168–178. [Google Scholar] [CrossRef]
  34. Kennedy, J.A.; Jones, G.P. Analysis of proanthocyanidin cleavage products following acid-catalysis in the presence of excess phloroglucinol. J. Agric. Food Chem. 2001, 49, 1740–1746. [Google Scholar] [CrossRef]
  35. Singleton, V.L.; Rossi, J.A. Colorimetry of total phenolics with phosphomolybdic-phosphotungstic acid reagents. Am. J. Enol. Vitic. 1965, 16, 144–158. [Google Scholar] [CrossRef]
  36. Sachett, A.; Gallas-Lopes, M.; Conterato, G.M.M.; Herrmann, A.P.; Piato, A. Antioxidant Activity by FRAP Assay: In Vitro Protocol. 2021. Available online: https://www.protocols.io/view/antioxidant-activity-by-frap-assay-in-vitro-protoc-j8nlk4n35g5r/v1 (accessed on 5 December 2024).
  37. Sachett, A.; Gallas-Lopes, M.; Conterato, G.M.M.; Herrmann, A.P.; Piato, A. Antioxidant Activity by DPPH Assay: In Vitro Protocol. 2021. Available online: https://www.protocols.io/view/antioxidant-activity-by-dpph-assay-in-vitro-protoc-q26g783n9lwz/v1 (accessed on 5 December 2024).
  38. Sójka, M.; Janowski, M.; Grzelak-Błaszczyk, K. Stability and transformations of raspberry (Rubus idaeus L.) ellagitannins in aqueous solutions. Eur. Food Res. Technol. 2019, 245, 1113–1122. [Google Scholar] [CrossRef]
  39. Apak, R.; Özyürek, M.; Güçlü, K.; Çapanoğlu, E. Antioxidant activity/capacity measurement. 1. Classification, physicochemical principles, mechanisms, and electron transfer (ET)-Based Assays. J. Agric. Food Chem. 2016, 64, 997–1027. [Google Scholar] [CrossRef] [PubMed]
  40. Fredes, C.; Montenegro, G.; Zoffoli, J.P.; Santander, F.; Robert, P. Comparison of the total phenolic content, total anthocyanin content and antioxidant activity of polyphenol-rich fruits grown in Chile. Cienc. Investig. Agrar. 2014, 41, 49–60. [Google Scholar] [CrossRef]
  41. Pellegrini, N.; Serafini, M.; Colombi, B.; del Rio, D.; Salvatore, S.; Bianchi, M.; Brighenti, F. Total antioxidant capacity of plant foods, beverages and oils consumed in Italy assessed by three different in vitro assays. J. Nutr. 2003, 133, 2812–2819. [Google Scholar] [CrossRef]
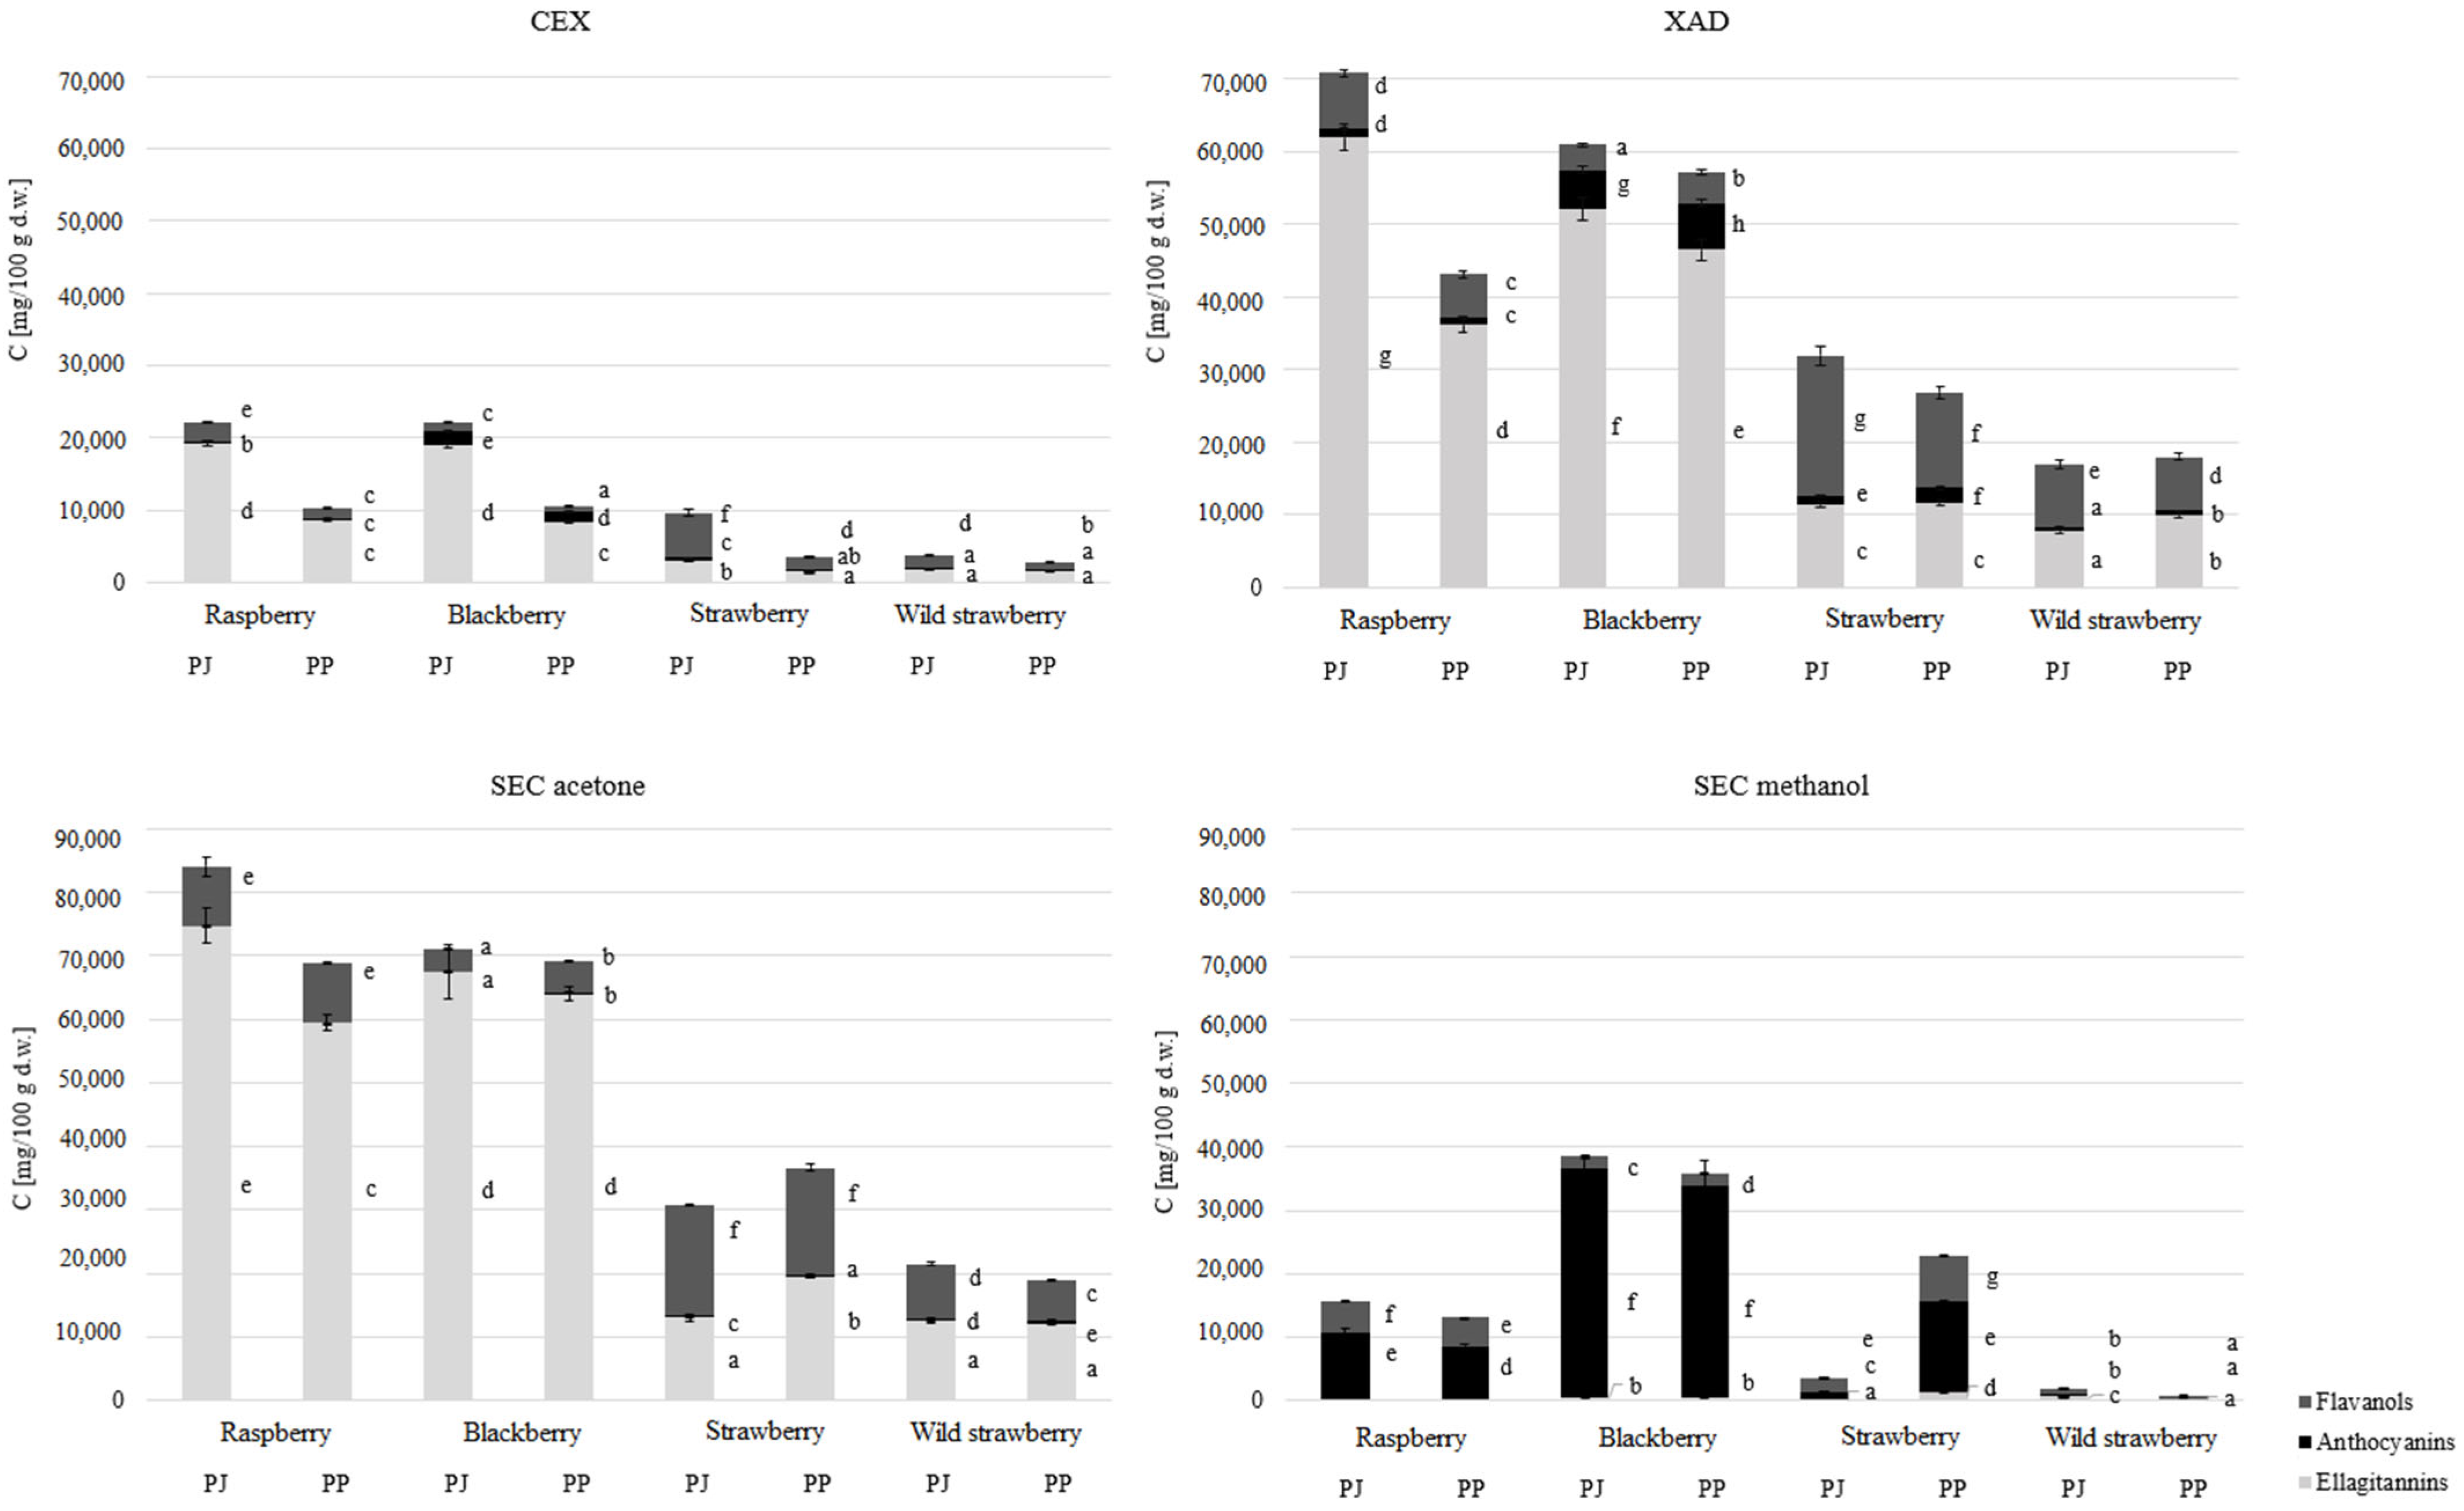
Figure 1. Concentrations of ellagitannins, anthocyanins, and flavanols in extracts purified using different methods: CEX—crude (unpurified) extracts; XAD—extracts purified using adsorption resin; SEC—extracts purified via size-exclusion chromatography; PJ—pomace from juice production; PP—pomace from purée production. Values marked with different letters within each polyphenol group differ significantly at p < 0.05.
Applsci 15 11701 g001
Figure 2. Antioxidant properties of extracts with varying degrees of purification: CEX—crude (unpurified) extracts; XAD—extracts purified using adsorption resin; SEC—acetone extracts purified using size-exclusion chromatography; PJ—pomace from juice production; PP—pomace from purée production. Values marked with different letters show significant differences at p < 0.05 between extracts with the same degree of purification and the fruits from which they were obtained.
Applsci 15 11701 g002
Figure 3. ANOVA analysis—effects of purification method and pomace type on the antioxidant properties of extracts: RPJ—raspberry pomace juice; RPP—raspberry pomace purée; BPJ—blackberry pomace juice; BPP—blackberry pomace purée; SPJ—strawberry pomace juice; SPP—strawberry pomace purée; WSPJ—wild strawberry pomace juice; WSPP—wild strawberry pomace purée. X-axis—standardized antioxidant activity values, Y-axis—extracts with varying purification levels depending on pomace type.
Applsci 15 11701 g003
Figure 4. Comparison of the antioxidant properties of acetone and methanol extracts obtained after purification by SEC: PJ—pomace from juice production; PP—pomace from purée production. Results marked with different letters within the same type of pomace differ significantly at p < 0.05.
Applsci 15 11701 g004
Table 1. Spearman correlation: influence of individual polyphenol groups, purification method, and pomace type on antioxidant activity.
Purification MethodPomace TypeEllagitanninsAnthocyaninsFlavanols
TPC0.8087 *−0.3033 *0.8363 *−0.03290.5386 *
DPPH0.5103 *−0.3355 *0.6609 *0.22060.2665
FRAP0.7625 *−0.3997 *0.8734 *−0.02310.4653 *
* statistically significant correlation at p < 0.050; n = 24.
Table 2. Spearman correlation: influence of polyphenol groups in SEC-purified extracts on antioxidant activity.
Type
of Extract
EllagitanninsAnthocyaninsFlavanols
TPC−0.14220.3592 *0.17740.0585
DPPH−0.5821 *0.5595 *−0.05910.3493 *
FRAP−0.5734 *0.7595 *−0.26220.4043 *
* statistically significant correlation at p < 0.050; acetone extracts were coded as 1 and methanol extracts as 2. Positive correlations therefore indicate that acetone extracts exhibit higher antioxidant activity; n = 16.
Disclaimer/Publisher’s Note: The statements, opinions and data contained in all publications are solely those of the individual author(s) and contributor(s) and not of MDPI and/or the editor(s). MDPI and/or the editor(s) disclaim responsibility for any injury to people or property resulting from any ideas, methods, instructions or products referred to in the content.