Abstract
Apple juice is widely consumed across global beverage markets. Its colour and cloudy appearance play a crucial role in consumer perception. Various physical treatments are available to modify juice turbidity and preserve colour, among which filtration and high-pressure homogenisation are considered the most respectful to the raw juice composition. In this study, red apple juice from the Kissabel® Rouge cultivar was filtered using membranes ranging from 100.0 to 0.2 μm and homogenised at pressures from 20 to 60 MPa. The physicochemical properties were then evaluated after 205 days of storage at two different temperatures. Microfiltration (<5.0 μm) increased juice lightness (87 vs. 66), but compromised cloud and colour stability by reducing cloudiness by 15 days compared with the unfiltered juices. Homogenisation increased turbidity, both in absolute value and during storage, which is typically appreciated in 100% apple juices. Finally, colloidal stability was affected by both treatments; combining mild filtration with low homogenisation pressure yielded the highest colloidal repulsion (−16.3 mV). Elevated storage temperatures generally diminished juice quality in terms of colour tone and intensity, and accelerated particle sedimentation.
1. Introduction
Kissabel® Rouge is a red-fleshed apple variety (Malus domestica) launched in 2016 by the International Fruit Obtention (L’Anguicherie-France) breeder group. Kissabel® Rouge is an iconic variety characterised by its red skin and red-coloured pulp. Although its nutritional profile is comparable to that of other apple varieties, its distinguishing feature is its suitability for producing red apple-based products, such as red juice.
Physical or chemical treatments are required to preserve the colour, taste, and ensure microbiological safety of juice, preventing pectin hydrolysis and limiting browning caused by both enzymatic and non-enzymatic reactions. The most common of these treatments is thermal processes based on pasteurisation [1]. Filtration [2] and high-pressure homogenisation (HPH) [3] are physical non-thermal treatments, which can improve the juice quality with a low impact on flavour and appearance. Filtration is the most common treatment used in beverages; it involves pumping a beverage through a porous medium. All particles with a diameter larger than the pores are retained. Standard filtration processes utilise polymeric membranes in either cross-flow or dead-end configurations. The pressure differential between the inlet and outlet, along with the membrane pore size, is the key parameter driving filtration performance. HPH involves forcing a liquid through a narrow nozzle at pressures ranging from 20 to 600 MPa. The combination of high compression and immediate decompression after the nozzle leads to particle disintegration, affecting biological, enzymatic, and suspended solid properties [4]. While filtration removes a certain amount of solid particles from beverages, HPH preserves all of them but reduces their size, having consequences on their biological and physical profile. However, these treatments may affect juice composition and appearance, including total soluble solids (TSS), colour, turbidity, and natural antioxidant compounds such as polyphenols and ascorbic acid [5,6]. TSS and turbidity directly impact the sensory perception of juice, while antioxidant compounds serve as natural preservatives against oxidative reactions catalysed by enzymes naturally present in apple juice.
Turbidity, or rather the visible effect of suspended particles, generates the cloudiness effect in fruit juices, which is a key quality attribute of 100% apple juice. Cloudiness results from light scattering by microscopic insoluble particles suspended in the liquid, typically pulp and peel fragments. Cloudiness enhances consumer appreciation of the juice in several ways, such as increasing viscosity and improving mouthfeel [7]. Cloudy juice is perceived as more “natural” and is generally more appreciated by consumers than clear juice [8]. Moreover, cloudy juice contains higher levels of health-promoting nutrients, such as polyphenols and other antioxidant compounds, which may play a crucial antigenotoxic role in the human diet [9]. Filtration is a removal strategy for larger particles prone to sedimentation, with minimal effect on cloud stability during storage. However, the filtered juice may contain lower levels of coloured and nutritional compounds because of their absorption from the colloidal matter retained by the membrane [10]. On the other hand, HPH is a holding strategy that disaggregates larger particles; the resulting smaller particles can contribute to the juice’s viscosity, colour, and colloidal stability. The cellulose and pectin fragmentation may increase the suspended particles’ surface. In vegetable-based products, particles have their own charges (usually negative), which play against aggregation driven by intermolecular bonds. Thus, a higher exchangeable surface usually produces a higher surface potential, which may improve colloidal stability [4]. This potential is defined as the ζ-potential, while particle size is defined as the z-size. Moreover, high-intensity HPH can reduce microbiological contamination and lower the content of active enzymes [11,12]. As a consequence, while filtration should reduce the overall particle content, HPH can increase the juice turbidity [10]. Moving towards the colours of the juices, turbidity is usually associated with lower lightness in the juice tint (lightness is represented by L* according to the CIEALab colour space) [1]. On the other hand, HPH can promote warm colour by changing the green and red balance and blue and yellow balance in the juice’s tint (a* and b* indices of the CIEALab colour space) [4].
In addition, colour modification in beverages during storage results from the sedimentation of suspended particles. Unstable colloids are more prone to aggregation and sedimentation, and they may also bind coloured compounds, thereby affecting the juice tint. Furthermore, colour changes may indicate both chemical oxidation and residual enzymatic activity on the colourant compounds. Effective enzyme deactivation is essential for maintaining juice stability after bottling. Oxidases, such as polyphenol oxidases, catalyse the oxidation of colourant compounds (e.g., polyphenols), leading to enzymatic browning, while free metals can promote chemical oxidation. For this reason, several colour indices were specifically devised to assess the colour differences before and after any treatments or before and after a storage period. Among all indices, the most prominent for food and beverage evaluation are: the colour Euclidean distance (ΔE) [13], the browning index (BI), the yellowness index (YI), and the whiteness index (WI) [14]. Moreover, hydrolases, such as pectinesterases, catalyse the breakdown of pectin, altering the structure of suspended particles. Finally, storage temperature strongly influences the rate and extent of both enzymatic and non-enzymatic reactions [15]. Regarding the red-fleshed apple juice, a lack emerged in the scientific literature, because the preservation of the orange–red tint of the original juice is not an obvious outcome for 100% apple juice. This beverage is rich in suspended organic matter, which, on the one hand, ensures a cloudy appearance throughout its shelf life (sought by consumers), but, on the other hand, may also contribute to colour instability.
The present study investigated the combined effects of filtration and HPH on red juice obtained from Kissabel® Rouge apples. Both filtration and HPH are effective pre-bottling treatments; however, their individual effects and potential synergies have not been thoroughly examined in red apple juice, particularly with respect to colloidal stability and any colour improvement. Filtration is expected to prevent browning and extend the juice’s shelf life, whereas HPH may help maintain particle suspension. Notably, no previous studies have focused on the evolution of juice colour and cloudiness during extended storage. In this work, the physical, chemical, and microscopic properties were assessed immediately after treatment and again after 205 days of storage at two different temperatures.
2. Materials and Methods
2.1. Juice Extraction
Red pulp apples (Malus domestica) var. Kissabel® were manually gathered in 2023 from Val di Non (Trento, Italy). Healthy apples were ground with a lab shredder, and the raw juice was extracted by pressing at 2.2 bar using an 80 L hydraulic press (model W80, Griffo Marchetti S.r.l., Piadena Drizzona (CR), Italy). The press also pre-filtered the juice thanks to a 100.0 µm pre-sieve. The juice was poured into small tanks and added with 400 ppm of ascorbic acid to prevent any instant oxidation due to downtimes between the following operations. A first pasteurisation was carried out at 85 °C for 15 min to deactivate enzymes and microorganisms. Then, the juice was cooled to 4 °C.
2.2. Sample Preparation
The control sample (NF) was bottled at this stage using a bottling machine (Enolmatic, Tenco S.r.l., Avegno (GE)-Italy). Part of the juice was homogenised (H) with a lab device (Gea TriplexPanda lab homogeniser 600, Düsseldorf-Germany) at three pressure values, 20, 40, and 60 MPa. Juices passed through the HPH equipment only once at an inlet temperature of 4 °C (with a maximum outlet temperature of 28 °C). Part of the 20 MPa and all the 40 and 60 MPa homogenised juice were bottled at this stage. Thus, the remaining homogenised juices at 20 MPa and the non-homogenised juices were filtered by connecting a dead-end filter housing (Tandem, Tenco S.r.l., Avegno (GE), Italy) to the bottling machine with three different membrane porosities: 0.2 µm, 5.0 µm, and 50.0 µm (F). The 5.0 and 0.2 µm samples were pre-filtered with the 50.0 µm membrane. At the end of the filtration of every sample, membranes were backflushed with tap-warm water until membrane whitening. The bottling machine pumped the juice using a small vacuum pump, operating with a pressure difference of around 50,000 Pa. Membranes of 0.2 µm and 5.0 µm were made of polypropylene, while stainless steel cartridges were used for 50.0 µm filtration (Tenco S.r.l., Italy). Non-homogenised (NH) juice could not undergo 0.2 µm filtration due to filter fouling, which prevents any real industrial applications. The whole process was repeated three times, including the pressing. Finally, three 250 mL screw-cap bottles made of transparent glass were filled with each repetition (about 20 mL of headspace) for a total of 81 bottles (9 samples * 3 repetitions * 3 bottles). A total of 27 bottles were immediately analysed, while 54 were stored for the shelf-life tests. All bottles underwent a second pasteurisation in an oven at 90 °C for 17 min to prevent microbial contamination during the operations mentioned above; a completely sterile workflow was not feasible. Table 1 lists the nine samples obtained by mixing both filtration and homogenisation steps. Filtration rate and HPH pressure steps are visually depicted in Figure 1. The current experimental design allows investigation of the filtration, homogenisation effect, and their interaction.

Table 1.
Sample lists, relative filtration rate, and HPH pressure.
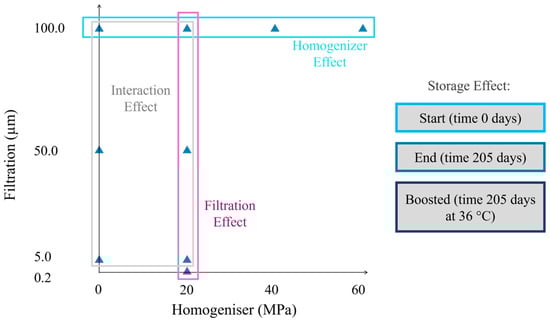
Figure 1.
Experimental plan. Samples are plotted with respect to the filter mesh and the homogeniser pressure chosen.
2.3. Storage
Six bottles for every sample were stored for 205 days in completely dark conditions (in boxes) at two different temperatures: three bottles at ambient temperature (mean 16.4 °C, minimum 11.7 °C, maximum 28.5 °C) and three bottles in an incubator (IVYX Scientific, London, UK) at 36 °C (boosted). While at ambient temperature, the juices’ shelf life was evaluated under standard storage conditions, the accelerated temperature of 36 °C serves as a common benchmark for identifying factors limiting the juices’ shelf-life in the worst-case scenario [16].
2.4. Physical Analysis
The density of each sample was computed by weighing a 100 mL flask. TSS was estimated with a digital refractometer (HANNA instrumental HI96811, sensitivity and absolute error 0.1 °Brix). A digital viscometer (Anton Paar ViscoQC 300L, sensitivity and absolute error 0.1 nNm) was used to measure the juice’s viscosity (spindle L1) at 160 rpm after 1 min. Measurements were done at the laboratory temperature (average of 22 °C).
2.5. Chemical Analysis
A digital pH meter (XS Instruments pH 70 Vio, ceramic electrode 201T DHS Ag/AgCl) was used to measure both pH and redox potential (mV) (stirring at 90 rpm and using a screw-cap designed to allow the introduction of the sensor). The antioxidant capacity (Antiox) was evaluated based on the Trolox equivalent (TE) assay [17]. The samples were centrifuged at 3800 g for 5 min. ABTS [2,20-azino-bis(3-ethylbenzthiazoline-6-sulfonic acid)] was chosen as an electron donor. ABTS 0.007 M was mixed with potassium persulfate at 0.007 M. After 24 h of incubation, ABTS●+ oxidant radical was generated. A phosphate buffer solution was used to set ABTS●+ pH to 7.0. 2.0 mL of diluted ABTS●+ was mixed with 0.2 mL of apple juice, and after 6 min, the absorbance was read at 730 nm with a single ray spectrophotometer, Janway 6300, 10 mm path cuvette. Five solutions ranging from 0.012 to 0.2 µM of Trolox were used to set the calibration line. Results are expressed as TE in µmol*100 g−1 of juice [18].
2.6. Colour Analysis
The apple juice colour was evaluated using a spectrophotometer (Smart Analysis, DNA PHONE SRL, Parma, Italy), which recorded light absorbance from a 10 mm path cuvette, at 420 nm, 520 nm, and 620 nm (blue, green, and red absorbance, respectively), and provided an output colour evaluation according to the CIELab colour space. Because it is a destructive analysis, it was performed only at the beginning and at the end of the experimentation. Specific indices of colour, such as saturation (Chroma), tint (HUE), ΔE, WI, BI, and YI, were computed following the formulas in Equations (1)−(6).
where L* is the lightness value, a* is the red–green tonality, b* is the yellow–blue tonality; while all indices were computed for every sample and time, ΔE was derived by the difference between the initial (0) and the end (i) colour assessment.
Aspect
The juice colour evaluation aimed to describe the colour development of the juice over 205 days of storage. Contrary to colour analysis, the juices were assessed through the bottles using a high-resolution camera. Aspect was monitored approximately every 14 days by acquiring coloured photos of glasses from a dark box illuminated with a fixed LED for a total of fourteen acquisitions. A bottle was photographed under fixed conditions using a Canon EOS R10 camera equipped with a 15–180 mm lens (Canon Inc., Tokyo, Japan). The aspect was evaluated by analysing the bottle’s colour. Pictures were cropped at a fixed location using ImageJ (National Institutes of Health, USA), and colour information was extracted by using a segmentation tool (Food-ImageInspector, Cofilab, Valencia, Spain). The camera correction and the lightness were balanced by using a standard ColourChecker (Sachverständigen-Zubehör, Eschweiler, Germany) as a reference in the background of each photograph. A colour description based on the CIELab colour space was conducted, and the indices listed in Equations (1)–(6) were also calculated. Any colour indices were fitted to linear, logarithmic, and quadratic functions of storage days (except day 0, when the juice properties were not stable), using Equations (7)–(9). A model was fitted for each sample under ambient and boosted storage conditions. The best function was selected for each relevant colour index based on the highest R-squared, the lowest mean absolute percentage error (MAPE), and the lowest Akaike information criterion (AIC) among samples. Finally, the presence of suspended solid particles and any sediment accumulation at the bottom of the bottle was assessed through visual inspection.
2.7. Particle Analysis
2.7.1. Microscope
Insoluble particles were quantified and characterised using the microscope. At the beginning and at the end of the experimentation, bottles were shaken, some droplets were poured on a Thoma counting chamber and visualised with a DM500 microscope (Leica Microsystems Srl, Buccinasco-Italy), 50× magnification, and three pictures of each Thoma chambers were acquired with a embedded digital camera, model ICC50 W. Photos were cropped in 3 * 3 mm cells and analysed with ImageJ (ImageJ 1.53k, National Institutes of Health USA) to count and measure the visible are of particles (scaling factor 0.266 pixel*µm−1). In every photo, the software counted the number of particles (NPart), the average area of each particle (AvArea), and the percentage of the visible area made by particles (%Area).
2.7.2. Colloidal Characterisation
Hydrodynamic size (z-size) and ζ-potential measurements were carried out using the Dynamic Light Scattering (DLS) technique with a Zetasizer Pro model ZSU5800 (Malvern Instruments, Malvern, UK) [19,20]. The laser was a HeNe gas laser working at a wavelength of 632.8 nm. After the detector and laser were aligned, the background was set for each measurement. Samples were diluted 10-fold and analysed with three instrumental replicates at room temperature (25 °C ± 1 °C). For the ζ-potential, folded capillary cells DTS1070 (Malvern Instruments, Malvern, UK) were used, the dispersant phase used was water (refractive index 1.33, viscosity 0.8872 mPa*s at 25 °C), and the Huckel model was used as the electrophoretic model. Measurement attenuators were automatically set by the instrument, while a conductivity lower than 0.1 mS*cm−1 was kept for zeta potential analysis. Z-size and ζ-potential raw data were subsequently processed and analysed using ZS Xplorer software v1.30 (Malvern Instruments, Malvern, UK).
2.8. Experimental Design and Statistical Analysis
Three replicates of every sample were made, sampling random apples from a pallet box; juices were stored under two conditions. The experimental pattern followed a randomised design. The dataset (27 Start samples + 27 End + 27 Boosted = 81 items in total) was split into three groups, and a specific multifactorial analysis of variance (ANOVA) was performed on the effect of filtration, homogenisation, their interaction, and the storage time. In the first group, the effect of homogenization was tested. Specifically, four different levels of HPH were tested, namely 0, 20, 40, and 60 MPa. Three replicates were performed. A multifactorial ANOVA was used to assess significance among homogeniser pressures, excluding Boost as a main effect (formula: y = β0 + β1HPH + β2Time + β3(HPH × Time) + β4Boost + ϵ). The second group was used to assess the effect of filtration. Four different filtration degrees, namely 0.2, 5.0, 50.0, and 100.0 µm, were tested in three replicates. A multifactorial ANOVA was used to assess significance among filtration degrees, time, their interaction, and the Boost main effect (formula: y = β0 + β1Filtration + β2Time + β3(Filtration × Time) + β4Boost + ϵ). The interaction between filtration and homogenisation was tested in a full factorial design. Two levels of homogenization (i.e., 0 and 20 MPa), and three degrees of filtration (i.e., 5.0, 50.0, and 100.0 µm) were tested (formula: y = β0 + β1Filtration + β2HPH + β3(Filtration × HPH) + β4Time + β5Boost + ϵ). Finally, data recorded at the beginning of the trial (Start) were excluded to test the effect of the storage temperature in a one-way ANOVA (formula: y = β0 + β1Boost + ϵ). Two levels of storage, namely End and Boost, were tested in three replicates. The experimental plan is shown in Figure 1. The variance F-value comparison test was performed, and a relevant effect was detected if the p-value was less than 0.05. Residuals Q–Q plots were examined for normality to verify the assumptions of the model and to exclude systematic biases. Where significant effects were found, Tukey’s honestly significant difference (HSD) post-hoc test was applied to identify pairwise differences among factor levels and their combinations. In each ANOVA, Filtration, HPH, and Boost were included as fixed effects, while Time was the random effect. Finally, the descriptors related to the juice aspect were analysed using a Linear Mixed Effects Model (LMM) to verify the Filtration × Time and HPH × Time interactions, while excluding the variance from Boost (main effect). A detailed description was performed only for those colour indices where the LMM was described in Section Aspect. In conclusion, a correlation matrix was computed to detect any relevant relationship between variables.
3. Results
First, the measured density did not significantly differ among samples (1.050 ± 0.013 kg*L−1), regardless of filtration or homogenisation treatments.
The main output from ANOVA is summarised in Table 2. Table 2 is organised into four main columns. As described in Section 2.8 data were grouped according to the three experimental conditions illustrated in Figure 1. The first two models tested the interaction of filtration and HPH with Time. Subsequently, the interaction between filtration and HPH, along with the effects of Time and Boost, was assessed. Finally, the Boost effect was tested independently by grouping all data collected at the end of the trial. The storage was divided into two effects: Time, which provides statistical evidence of the change between the beginning and the end of the trial (Start-End), and Boost, which highlights the storage temperature effect after 205 days (constant 36 °C and variable ambient temperature). The filtration rate played the most important role in determining the composition of apple juice, while homogenisation essentially affected the juice’s appearance. The interaction between them was relevant only in terms of the number of particles and their size. Finally, some features were linked only with the storage phase. Each factor is discussed in the following paragraphs. Details of the Thoma chamber used for the particle assessment are illustrated in Figure 2 for those samples that showed the largest particle population. The effects of filtration and HPH are described in Section 3.1 and Section 3.2, while their interaction is described in Section 3.3.
Table 2.
Outputs of the three multifactorial ANOVA performed on the chemical and physical features measured at the beginning and end of the experimentation. F means filtration effect, H means homogeniser effect, FxH represents the interaction between them, Time underlines the difference between day 0 and day 205, TxF means the Time interaction with F, TxH means the Time interaction with H, and Boost detects the higher temperature effect between storing at ambient temperature and 36 °C. “***” p-value < 0.001, “**” p-value < 0.01, “*” p-value < 0.05, while “ns” non-significant.
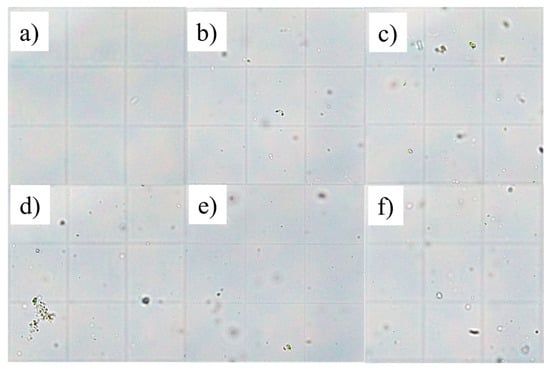
Figure 2.
Details of six sample photos acquired from the Thoma chamber at the microscope, day 0: (a) F0.2H20, (b) F5H20, (c) F50H20, (d) NFH20, (e) NFH40, (f) NFH60.
3.1. Effects of Filtration
The initial findings concern the quantification and size of particles following filtration. In almost all juices filtered through a 0.2 µm membrane, no detectable particles were observed (on average, 7.0 ± 13.5), whereas other samples contained an average of 186.8 ± 117.7 particles (Figure 3a,b). A positive correlation was also observed between filtration rate and AvArea. However, after 205 days of storage and boosted ageing, both the number of detectable particles and their size were reduced, underlining a possible disaggregation of particles. Consequently, the presence of microscopic particles directly influenced the physical and chemical characteristics of apple juices.
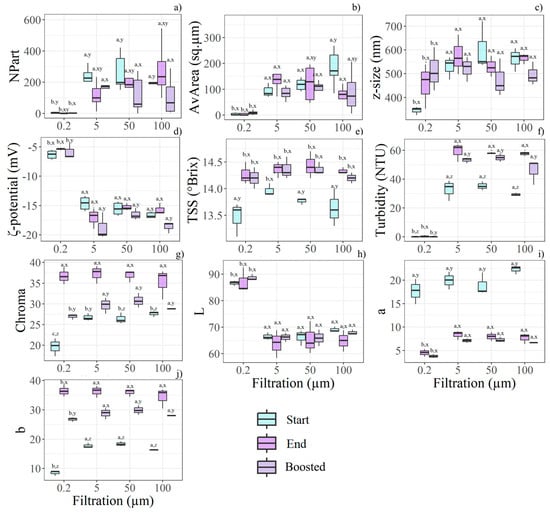
Figure 3.
Boxplots illustrate the most relevant features for filtration rate, time storage, and boost effects, as determined by the statistical analysis (n = 36). Different letters (a, b, c) indicate significant differences between filtration levels, while (x, y, z) denote differences between time and boost conditions within each filtration level. The relevant features found according to the filtration treatment are: (a) NPart, (b) AvArea, (c) z-size, (d) ζ-potential, (e) TSS, (f) turbidity, (g) Chroma, (h) L*, (i) a*, (j) b*.
Viscosity was significantly affected by filtration; specifically, juices filtered at 0.2 µm exhibited the lowest viscosity (6.07 ± 0.03 mPa*s), compared with those subjected to coarser filtration (6.37 ± 0.23 mPa*s). Similarly, TSS and turbidity showed their lowest values in samples filtered at 0.2 µm (Figure 3e,f). Nonetheless, both TSS and turbidity increased over the storage period. Boosted storage also influenced turbidity, which was reduced in these samples compared to those kept at ambient temperature.
As the AvArea of visible particles decreased with finer filtration, the 0.2 µm membrane also yielded the smallest z-average size (415 ± 94 nm compared to 543 ± 99.5 nm). In parallel, the lowest ζ-potential (absolute value) was recorded in juices filtered at 0.2 µm, indicating greater colloidal instability (Figure 3d). A differential behaviour in the ζ-potential was observed with filtration rate and storage duration: at 0.2 µm, the ζ-potential decreased over time, whereas it increased with larger mesh sizes.
Filtration also affected the visual appearance of the samples; however, storage had the most significant impact on colour. Filtration at 0.2 µm resulted in juices with the lowest colour intensity (Figure 3g) and a more neutral tint, due to the lowest a* and b* values (Figure 3i,j). Furthermore, the low particle content in juices filtered at 0.2 µm corresponded to higher L* values, although these were not influenced by storage duration (Figure 3h). Finally, both Chroma and L* were substantially reduced under boosted storage conditions. Again, filtration modified the juice’s chemical composition, as evidenced by the strong reduction in the Antiox measured at the Start. F0.2H20 exhibited the lowest Antiox (748.16 ± 42.15 µmol*100 g−1) compared to the other samples (857.18 ± 41.01 µmol*100 g−1). At the end of the trial, Antiox was null in all samples.
3.2. Homogenisation
Increasing homogenisation pressure enabled the production of smaller particles; in particular, 60 MPa yielded statistically significant differences compared with 20 MPa, as shown by the clear increasing trend in Figure 4b. Particle size was further reduced during storage. Additionally, AvArea decreased more in homogenised samples than in control samples (Figure 4a). The presence of smaller particles may have influenced the visual appearance of the juice. Turbidity and b* increased with both homogenisation pressure and storage time, while boosted samples exhibited intermediate values between those recorded at day 0 and at the end of the trial (Figure 4b,d–Start and End). At Start, HUE showed notable differences across homogenisation pressures; however, all samples converged to a similar colour tint at End (Figure 4c). Boosted samples recorded slightly lower HUE values than standard ones.
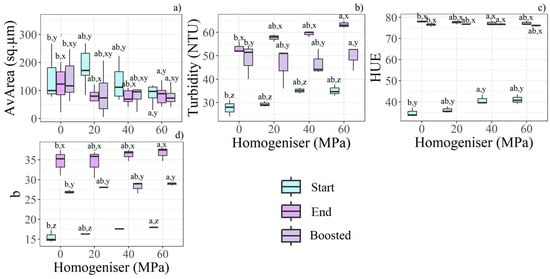
Figure 4.
Boxplots show the most relevant features for HPH pressures, time storage, and boost effects according to the statistical analysis (n = 36). Different letters (a, b) indicate significant differences between HPH levels, while (x, y, z) denote differences between time and boost conditions within each HPH level. The relevant features found according to HPH are: (a) AvArea, (b) turbidity, (c) HUE, (d) b*.
3.3. Interaction FxH
The only significant interaction effects between the two physical treatments were detected in AvArea, Npart, and ζ-potential. NPart increased in samples filtered after homogenisation, while AvArea decreased; it was verified at least at 100.0 µm pre-sieve. The same trend was not observed in non-homogenised samples. Finally, the ζ-potential decreased with increasing filtration rate in homogenised samples, while it increased in non-homogenised ones. Details are shown in Figure 5.
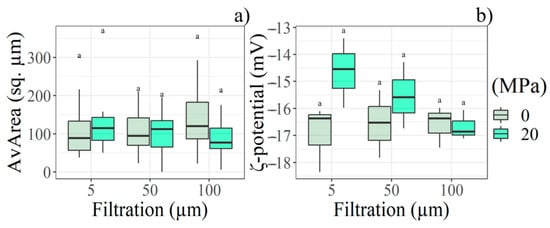
Figure 5.
Boxplot depicts the filter rate and HPH interaction with respect to the (a) AvArea and (b) ζ-potential according to the statistical analysis performed at Start (day 0) (n = 18). Letter (a) indicate significant differences between filtration and HPH levels.
3.4. Storage
An ORP reduction was observed during storage, and the storage temperature intensified this decline (Figure 6a). The same trend was seen in %Area, where the total particle size decreased with both storage time and temperature effects (Figure 6b).
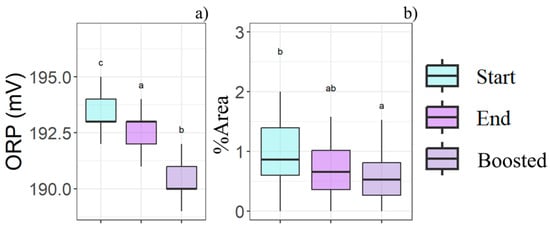
Figure 6.
Boxplots illustrate the storage time (Start-End) and storage temperature (Boosted) effects in relation to the (a) ORP and (b) %Area, as determined by the statistical analysis (n = 81). Different letters (a, b, c) indicate significant differences between time and boost conditions.
3.5. Aspect Through Storage
HUE, WI, a* showed a critical interaction effect between filtration and storage time, while no evidence was found for homogenisation. The quadratic function was selected as the most affordable one to describe the development aspect during the storage time. A model was fitted for every sample; results are listed in Table A1. All three variables exhibited different trends between storing temperatures, as at least one coefficient from the fitted model differed between the boosted and non-boosted samples. Figure 7 highlights how the intercepts and steepness differ from non-boosted (Figure 7a,c,e) and boosted (Figure 7b,d,f). Moreover, in WI, the parabolas exhibit different concavities: downwards for non-boosted and upwards for boosted. Under the same conditions, the intercept differed between filtration at 100.0 µm and filtration at 0.2 µm in both the HUE and WI models. For a*, the intercept differed into three groups: 0.2 µm, 5.0 µm, 50.0 µm, and 100.0 µm. The steepness also differed between 0.2 and 100.0 µm. Generally, a* values decreased in all the samples, but eventually they increased again. HUE increased in most samples during the first 100 days and subsequently decreased, except for filtered at 0.2 µm and boosted samples, which exhibited the highest HUE value at day 9 before declining thereafter. Independent of any physical treatments, colour changes were primarily driven by a decrease in both L* and a* values over the storage period. Furthermore, the highest L* and lowest a* values were observed in samples filtered at 0.2 µm.
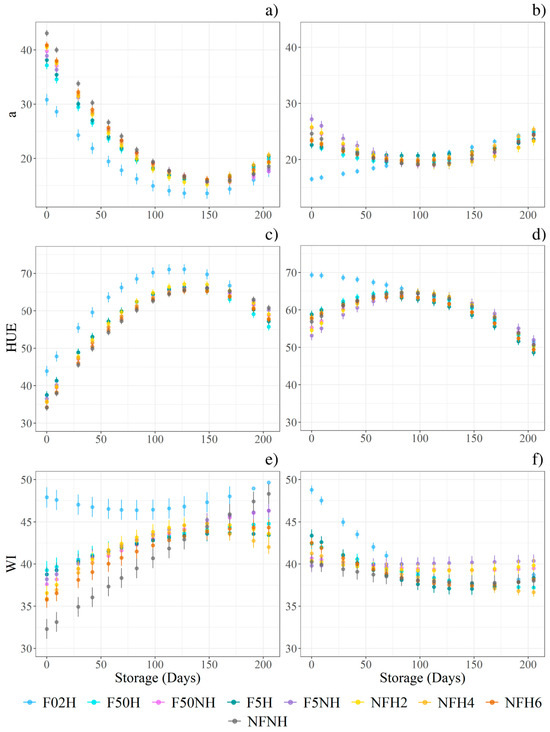
Figure 7.
The point charts depict the models’ predictions during the 14 sampling points. Every model was fitted on the sample’s repetitions (n = 81). All models describe a quadratic function. The vertical error bars represent the model’s standard error. Charts on the left (a,c,e) refer to the ambient temperature storage, while the charts on the right (b,d,f) refer to the boosted storage.
ΔE followed two divergent trends depending on storage conditions, but no interactions were found with filtration or homogenisation. Under ambient conditions, ΔE increased until day 83, then decreased, resulting in a net gain of 20 points by the final sampling compared with 15 points at day 9. In contrast, under boosted conditions, the highest average ΔE was recorded at day 29 (28.2), which declined to 11.7 by day 205. Chroma and BI were found to be higher in boosted samples than in those stored under ambient conditions. Over the 205 days of storage, Chroma decreased by approximately 10 points under boosted conditions, compared with 20 points under ambient conditions.
The aspect was visually assessed to detect suspended particles and sediment on the bottom of the bottle. Sediments deposited on the bottom of the bottle were visible in every sample stored at both conditions, since the first evaluation was conducted nine days after the juices were bottled, except for F0.2H20. Likewise, no suspended particles were detected in the juice in any F0.2H20 repetition. Some examples are depicted in Figure 8. Under the boosted condition, no particles were detected, suggesting fast sedimentation. Filter and homogeniser effects were detectable in Figure 9, as evidenced by the comparison of F5H20 with F5NH, which showed opposite behaviour. Generally, homogenisation promotes suspension for a longer time, at least at ambient temperature storage.
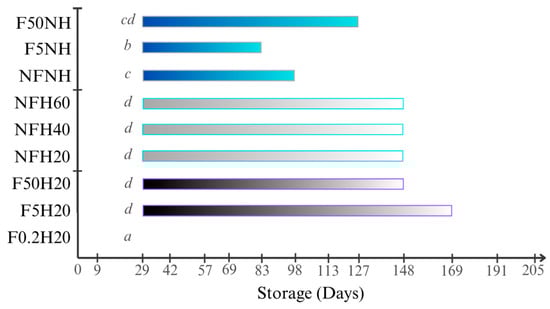
Figure 8.
Bar chart showing the average time period during which the solid particles were visible through the glass bottles for each sample stored at ambient temperature. Days refer to the storage time after bottling during which the photos were acquired. Letters refer to the Tukey’s test output performed among samples.
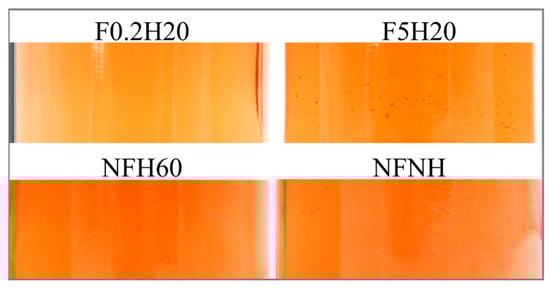
Figure 9.
An example of visible suspended particles in four samples 29 days after bottling.
3.6. Variable Correlations
The relevant correlations mainly included the juice colour and its physical features. Table 3 lists the essential variables and the R-squared values retrieved by a simple Pearson comparison.
Table 3.
R-square values returned from the linear correlation between the variables of the whole dataset (n = 108).
4. Discussion
Microfiltration at 0.2 µm can drastically reduce particle concentration and the AvArea, resulting in secondary effects such as the retention of other soluble compounds. This primarily led to the reduction in NPart, turbidity, and TSS due to the finer filtering meshes applied [21,22,23]. Moreover, the significant removal of solid particles may have caused the observed viscosity differences between 0.2 µm filtration and that of wider filtration rates [23].
With respect to juice colour, filtration influences it from two main perspectives. First, by altering cloudiness, or rather, the presence of suspended particles. Second, by affecting coloured compounds among polyphenols included in Antiox, which may have been captured due to the polarisation effect of the membrane [24]. A 50–70-fold reduction in turbidity may indeed result in a noticeable lightening of colour tone [25,26]. In experiments involving different apple varieties, the polarisation effect associated with forced filtration led to an increase in L*, while the a* and b* parameters tended to decrease, indicating a shift toward duller tones.
Similarly, polar particles may have been retained by the 0.2 µm membrane, causing the lowest absolute ζ-potential (around −5 mV in 0.2 µm permeate against around −20 mV in the remaining samples). Such low magnitude ζ-potential values are associated with weak electrostatic repulsion and therefore an increased propensity for aggregation; consistent with this, the 0.2 µm-filtered samples exhibited an increase in z-size and concomitant decreases in NPart and ζ-potential during storage. Comparison of AvArea and ζ-potential (Figure 3b,d) showed an inverse trend (ζ-potential decreasing as AvArea increased). A plausible mechanism is that microfiltration at 0.2 µm alters the measured particle population (size distribution and surface chemistry), selecting smaller fragments or particle classes with distinct surface composition and lower charge density, which in turn promotes faster aggregation under storage conditions. Examples of the juice’s colour at the bottling stage and after storage are shown in Figure 10. At this point, it is worth discussing the effect of the double pasteurisation step, which was required to enable the experimental trials (as typically, only a single pasteurisation is applied in juice production). Focusing on the starting juices in Figure 10, the double pasteurisation did not have a deleterious impact on the juices’ colour, as the average tint remained predominantly red and orange (HUE figured 30–80°). For example, despite the thermal and subsequent physical operations, the HUE did not vary from the range of values obtained using different juice extraction methods from comparable red-fleshed apple varieties [27]. Furthermore, the double pasteurisation may have affected the filtration and homogenisation treatments, which may be a possible limitation for this study. On the other hand, any interaction effect between pasteurisation and filtration, or between pasteurisation and HPH (not so relevant in our case study), was found in the scientific literature only for ultrafiltration and HPH performed at hundreds of MPa [28,29].
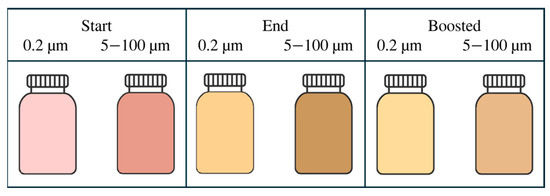
Figure 10.
Average colour retrieved by L*, a*, and b* values from the sample filtered at 0.2 µm, and the larger filtration rates.
The crucial role of turbidity and ζ-potential in colour development is also supported by the considerable linear correlation reported in Table 3. Turbidity and ζ-potential directly affected WI kinetics during storage.
Homogeniser pressure is directly associated with particle size reduction, which may have resulted in increased light scattering and thus higher recorded turbidity values [12]. The highest turbidity levels were maintained in samples homogenised at 60 MPa, even at the end of storage. A clear trend of increasing turbidity with increasing homogeniser pressure was confirmed by the multiple-comparison analysis (Figure 4b) and the multifactorial ANOVA output (Table 2), which highlighted both HPH and Time as significant contributors to turbidity. HPH performed at 60 MPa resulted in the highest turbidity values at both the Start and End stages, supporting the hypothesis that achieving high turbidity during the juice production phase is desirable, as it is associated with improved stability throughout storage [30]. Larger particles (above 0.5–0.65 µm) in apple juice tend to sediment, whereas smaller particles can help maintain a stable cloudy appearance [31]. A similar turbidity increase was observed in the scientific literature [32]. Therefore, the analytical profile of juices subjected to homogenisation differed according to the applied pressure; no significant effects were observed in the aspect analysis, suggesting that 20 MPa is sufficient to improve juice cloudiness. Regarding the ζ-potential, opposite results were found with respect to another study [31], in which the ζ-potential decreased proportionally with homogeniser pressure. However, the gross filtration carried out before HPH altered the juice particle and electrolyte composition, and similar results were indeed found in filtered juice [33]. Pasteurisation may also have previously stabilised the colloids, as no significant changes in z-size or ζ-potential were observed with increasing HPH pressure. Visible consequences of the interaction between homogenisation and filtration on the ζ-potential were detectable from the suspended particles shown in Figure 8 by comparing samples F5H20 and F50H20 with F5NH and F50NH: coupling homogenisation and filtration allowed the suspended particles to remain visible for up to 86 days. Since homogenisation reduced particle size, sedimentation was slowed. However, in all samples stored at ambient temperature, sedimentation occurred after 169 days of storage. Finally, the higher storage temperature may have accelerated particle movement, as no visible suspended particles were detected. Both larger particle size and elevated liquid temperature promote sedimentation according to Stokes’ law [5,31]. Another factor contributing to particle sedimentation may be the inconsistent repulsion strength observed across all samples. None of the samples exhibited the optimal absolute ζ-potential value of 25 mV required to prevent attractive interactions between particles in fruit juices [34], probably mainly because of the polymerisation of phenols and protein [35]. In addition, a strong positive correlation (R2 = 0.72) was found between the initial turbidity (Start) and the time of visible suspended particles. This may underscore the relevance of initial particle content. At the same time, a negative regression (R2 = 0.44) was found between the initial ζ-potential (Start) and the time of visible suspended particles. Hence, a more negative ζ-potential may improve cloudiness.
The ΔE index was not particularly sensitive to homogenisation treatments; however, the average tint changed, with increases in the b* parameter and HUE, especially in unfiltered juices [5,6].
AvArea was the only feature significantly influenced by the interaction between filtration and homogenisation. Specifically, increasing the membrane pore size from 5.0 µm to 100.0 µm appeared to reduce particle size following homogenisation (Figure 5a). This outcome is not widely supported in the scientific literature and may be related to the specific settings of the homogeniser used in the trial.
NPart and AvArea decreased after storage, resulting in a reduced overall area occupied by particles in the juice. These reductions in solid particles were accompanied by increases in TSS and turbidity, which may be explained by chemical or enzymatic hydrolysis of macromolecules. Moreover, residual starch and pectin may have undergone chemical and enzymatic activity during storage [36,37,38]. As a result, HPH was confirmed as the main driver of the increases in TSS and turbidity during storage. Considering that HPH tends to reduce the average particle size, a larger active surface area became available for lysis reactions (mainly of pectins) catalysed by residual enzymes [39] and solubilisation of intracellular compounds [40]. As a consequence, particle lysis contributed to generating greater turbidity despite sedimentation. This may have ensured a more stable cloudiness in the HPH-treated samples, a key feature from the consumer’s perspective [41]. Simultaneously, alteration of the juice particle cloud resulted in changes in colour. L* was mainly associated with juice cloudiness [3,6]. Additional colour modifications were due to both particle sedimentation and non-enzymatic browning reactions, such as the Maillard reaction [42], or chemical oxidation caused by dissolved oxygen and metals [43]. Interactions between storage time and temperature intensified these changes. Generally, storage at higher temperatures promoted degradation of colour and colourant compounds [15]. BI and YI values were consistently higher in boosted samples, indicating a colour shift from an intense red to brown and orange HUEs, indeed. The general ORP decay evidenced oxidations derived from enzymatic or non-enzymatic reactions after 205 days of storage. Moreover, the antioxidant content played a crucial role in HUE, as supported by specific studies [44,45]. Indeed, this experiment highlighted a negative correlation between HUE and antioxidant content: higher antioxidant content was associated with lower HUE values, indicating an orange–red tint (Table 3). For example, the F0.2H20 samples recorded the greatest HUE decrease from the start to the end of storage (on average, from 26° to 82°) and the lowest initial Antiox value (on average, 748 µmol*100 g−1). In contrast, the non-filtered and homogenised samples showed a final HUE of 76° and an Antiox value of 843 µmol*100 g−1 TE. Future investigations could include the quantification of dissolved oxygen to better clarify its role in colour evolution and antioxidant degradation during storage. Moreover, during ambient temperature pressing, apple juice can absorb approximately 6.4 mg*L−1 of oxygen. After filtration and bottling, this amount is roughly halved, indicating that nearly half of the oxygen reacts immediately. The remaining 3 mg*L−1 could, of course, have contributed to browning reactions [46].
Finally, for most of the measured parameters, the average values under boosted conditions were closer to the initial values than those under ambient conditions. As shown in Figure 7, almost all the fitted models described a quadratic (parabola) function. In these cases, modifications occurred during storage, and Boosted appeared to encourage recovery of the original characteristics. As observed in the appearance of the juices, the most significant variations in colour indices were recorded during the middle of the storage period, while both boosted and ambient storage conditions tended to restore the original appearance towards the end of the trial. However, the boosted condition and the filtration rate modified the coefficients that describe each parabola (intercept, linear coefficient, and steepness), underlining the role of the juice temperature on moulding any chemical or enzymatic reaction that slowly occurred during the storage. Likewise, the largest ∆E, together with the highest BI and YI values, was observed at 100 days, while a partial recovery in colour occurred towards the end of the storage period. A possible explanation is a rapid consumption of ascorbic acid during the first weeks [47], while pectin esterase activity and the Maillard reaction rate reached their maximum intensity at four and eight weeks of storage, respectively [48]. A comparable colour trend, characterised by a rapid decrease in Chroma and an increase in HUE during the first 150 days of storage, met expectations, with storage temperature acting as the main factor influencing the steepness of the curve [27]. None of the above-mentioned kinetics followed a linear trend during storage. At the same time, in the middle stage of storage, enzymatic and non-enzymatic reaction products may have produced additional suspended and soluble particles, which partially settled towards the end of the storage period. Thus, the fluctuating population of suspended particles may also have played a crucial role.
In conclusion, 0.2 µm filtration showed the lowest turbidity and the highest colloidal instability. In addition, a greater decrease in the red component of juice filtered at 0.2 µm was detected during storage. These effects are primarily attributed to the highest colloidal instability and lowest antioxidant activity in juices filtered through the narrowest membrane. Generally, 5.0 to 100.0 µm filtration rates resulted in the most suitable juice according to the present type of products. Based on these findings and considering the relationship between membrane pore size and filtration flux [21], microfiltration is not affordable. HPH improved turbidity and AvArea proportionally with processing pressure, with minimal effect on colour. In addition, in this case, differences detected in the homogeniser were flattened after storage.
5. Conclusions
In the present study, red apple juice from the cultivar Kissabel® Rouge was subjected to filtration and HPH treatments. Filtration reduced turbidity and enhanced juice colour; however, filtratering below 5.0 μm resulted in an unstable aspect and significant modifications during the 205-day storage period. HPH improved the cloud effect by increasing turbidity and reducing particle size. In general, Filtration did not enhance the juice’s appearance, particularly from a cloudiness perspective. However, the interaction between treatments suggests that combining mild filtration with HPH at 20 MPa may not only compensate for the filtration effect but also improve cloudiness and extend the suspended particle phase. Storage temperature played a significant role in determining the appearance of the juice. Nevertheless, the preservation of natural antioxidant compounds and the enhancement of colloidal stability contributed to maintaining the red tint in the juice after 205 days of storage.
Author Contributions
Conceptualisation, L.G., N.G., E.B. and M.L.; methodology, A.Z., A.P. and M.F.; formal analysis, A.P., G.R., A.D.I. and A.Z.; investigation, A.Z., G.R., A.D.I. and L.G.; writing—original draft preparation, A.Z.; writing—review and editing, A.Z. and L.G.; supervision, L.G., N.G., E.B. and M.L. All authors have read and agreed to the published version of the manuscript.
Funding
This research received no external funding.
Institutional Review Board Statement
Not applicable.
Informed Consent Statement
Not applicable.
Data Availability Statement
Due to privacy reasons, the data presented in this study are available on request from the authors.
Acknowledgments
The researchers from the University of Padua are grateful to the private company MelindaLab S.A.R.L. for providing the raw apples and some of the devices required for the present experimentation. Furthermore, the researchers from the University of Padua would like to thank the co-authors E.B., N.G., and M.L. for their supervision during the juice sample production and data analysis.
Conflicts of Interest
Authors Nicola Gabardi, Elisa Biada, Marco Luzzini were employed by the company MelindaLab S.A.R.L. The remaining author declare that the research was conducted in the absence of any commercial or financial relationships that could be construed as a potential conflict of interest.
Appendix A
Table A1.
The table presents the performance and coefficients of the models fitted on relevant variables for the variation in juice quality during storage. The I coefficient multiplies the first-degree independent variable, while the II coefficient multiplies the second-degree variable. The letters “a” and “b” refer to the statistical analysis conducted among different storage temperatures. The letters “x”, “y” and “z” refer to filtration.
| Variable | Storage | Sample | R2 | RMSE | MAPE | AIC | Intercept | Linear Coefficient (x) | Steepness (x2) |
|---|---|---|---|---|---|---|---|---|---|
| a | B | F0.2H20 | 0.72 | 1.6 | 5.6 | 154 | 16.5a,x | 0.031a,x | 0.000508a |
| a | B | F50H20 | 0.45 | 1.8 | 6.4 | 166 | 22.6a,y | −0.073a,xy | 0.000407a |
| a | B | F50NH | 0.39 | 2.4 | 8.9 | 187 | 25.7a,y | −0.124a,xy | 0.000578a |
| a | B | F5H20 | 0.15 | 2.1 | 7.8 | 178 | 22.6a,y | −0.041a,xy | 0.000227a |
| a | B | F5NH | 0.32 | 3.0 | 10.6 | 204 | 27.2a,y | −0.136a,xy | 0.000575a |
| a | B | NFH20 | 0.27 | 2.8 | 10.9 | 200 | 25.8a,y | −0.116a,y | 0.000507a |
| a | B | NFH40 | 0.42 | 1.9 | 7.0 | 170 | 23.7a | −0.079a | 0.000427a |
| a | B | NFH60 | 0.30 | 2.1 | 7.7 | 178 | 23.3a | −0.074a | 0.000387a |
| a | B | NFNH | 0.37 | 2.3 | 8.9 | 183 | 24.6a,z | −0.106a,y | 0.000516a |
| a | n | F0.2H20 | 0.60 | 3.6 | 16.8 | 219 | 30.8b,x | −0.251b,x | 0.000912b |
| a | n | F50H20 | 0.83 | 2.5 | 9.5 | 191 | 37.2b,y | −0.29b,xy | 0.001035b |
| a | n | F50NH | 0.90 | 2.2 | 9.7 | 180 | 39.8b,y | −0.307b,xy | 0.000973b |
| a | n | F5H20 | 0.86 | 2.3 | 8.9 | 184 | 38.1b,y | −0.310b,xy | 0.001093b |
| a | n | F5NH | 0.89 | 2.2 | 9.0 | 179 | 38.9b,y | −0.291b,xy | 0.000928b |
| a | n | NFH20 | 0.89 | 2.4 | 9.9 | 186 | 40.5b,y | −0.345b,y | 0.001176b |
| a | n | NFH40 | 0.90 | 2.1 | 8.3 | 176 | 40.8b | −0.343b | 0.001194b |
| a | n | NFH60 | 0.90 | 2.2 | 8.7 | 181 | 40.9b | −0.328b | 0.001092b |
| a | n | NFNH | 0.93 | 2.0 | 8.0 | 171 | 43.1b,z | −0.353b,y | 0.001139b |
| HUE | B | F0.2H20 | 0.79 | 2.9 | 3.6 | 203 | 69.3a,x | −0.014a | −0.000359a |
| HUE | B | F50H20 | 0.69 | 3.0 | 3.8 | 203 | 58.8a | 0.148a | −0.000929a |
| HUE | B | F50NH | 0.59 | 3.5 | 4.8 | 217 | 55.277a | 0.206a | −0.001109a |
| HUE | B | F5H20 | 0.66 | 3.3 | 4.7 | 212 | 58.7a | 0.124a | −0.000845a |
| HUE | B | F5NH | 0.45 | 4.3 | 6.1 | 232 | 53.1a | 0.224a | −0.001121a |
| HUE | B | NFH20 | 0.59 | 3.7 | 5.2 | 221 | 54.6a,y | 0.218a | −0.001167a |
| HUE | B | NFH40 | 0.63 | 3.3 | 4.6 | 212 | 58.1a | 0.141a | −0.000893a |
| HUE | B | NFH60 | 0.60 | 3.5 | 4.9 | 217 | 57.7a | 0.148a | −0.000917a |
| HUE | B | NFNH | 0.55 | 3.8 | 5.3 | 222 | 56.9a,y | 0.177a | −0.001008a |
| HUE | n | F0.2H20 | 0.67 | 4.8 | 6.2 | 241 | 43.9b,x | 0.453b | −0.001882b |
| HUE | n | F50H20 | 0.81 | 3.4 | 5.0 | 214 | 37.5b | 0.444b | −0.001733b |
| HUE | n | F50NH | 0.89 | 2.8 | 4.0 | 199 | 35.6b | 0.443b | −0.001609b |
| HUE | n | F5H20 | 0.84 | 3.1 | 4.6 | 208 | 37.5b | 0.440b | −0.001677b |
| HUE | n | F5NH | 0.86 | 3.1 | 4.4 | 207 | 36.5b | 0.419b | −0.001483b |
| HUE | n | NFH20 | 0.87 | 3.1 | 4.5 | 206 | 35.7b,y | 0.465b | −0.001712b |
| HUE | n | NFH40 | 0.89 | 2.7 | 3.9 | 197 | 35.8b | 0.442b | −0.001629b |
| HUE | n | NFH60 | 0.88 | 2.9 | 4.2 | 202 | 34.2 | 0.456b | −0.001667b |
| HUE | n | NFNH | 0.91 | 2.7 | 3.9 | 196 | 34.1b,y | 0.439b | −0.001506b |
| WI | B | F0.2H20 | 0.75 | 1.8 | 3.6 | 163 | 48.8a,x | −0.145a,x | 0.000467a |
| WI | B | F50H20 | 0.31 | 2.2 | 4.3 | 180 | 42.4a | −0.049a | 0.00012a |
| WI | B | F50NH | 0.03 | 2.1 | 4.1 | 177 | 40.7a | −0.019a | 0.000064a |
| WI | B | F5H20 | 0.31 | 2.5 | 5.3 | 189 | 43.4a | −0.090a | 0.00032a |
| WI | B | F5NH | 0.00 | 2.7 | 5.4 | 195 | 39.8a | 0.002a | 0.000003a |
| WI | B | NFH20 | 0.01 | 2.7 | 5.4 | 197 | 40.4a,y | −0.020a,y | 0.000083a |
| WI | B | NFH40 | 0.36 | 1.8 | 3.6 | 163 | 41.3a | −0.034a | 0.000058a |
| WI | B | NFH60 | 0.32 | 2.0 | 4.3 | 172 | 42.5a | −0.069a | 0.00023a |
| WI | B | NFNH | 0.04 | 3.2 | 6.2 | 209 | 40.2a,y | −0.032a,y | 0.00010a |
| WI | n | F0.2H20 | 0.05 | 4.2 | 7.2 | 230 | 47.9b,x | −0.036b,x | 0.00022b |
| WI | n | F50H20 | 0.15 | 3.8 | 7.2 | 223 | 39.3b | 0.046b | −0.000097b |
| WI | n | F50NH | 0.39 | 3.1 | 6.1 | 208 | 37.6b | 0.065b | −0.00011b |
| WI | n | F5H20 | 0.16 | 3.1 | 6.4 | 208 | 38.8b | 0.058b | −0.00017b |
| WI | n | F5NH | 0.40 | 2.9 | 5.7 | 201 | 38.2b | 0.067b | −0.00014b |
| WI | n | NFH20 | 0.32 | 3.2 | 6.6 | 209 | 36.6b,y | 0.110b,y | −0.00037b |
| WI | n | NFH40 | 0.34 | 2.9 | 5.8 | 201 | 35.9b | 0.118b | −0.00043b |
| WI | n | NFH60 | 0.35 | 3.4 | 6.5 | 214 | 35.8b | 0.088b | −0.00022b |
| WI | n | NFNH | 0.56 | 4.1 | 7.5 | 229 | 32.3b,y | 0.092b,y | −0.000069b |
References
- Krapfenbauer, G.; Kinner, M.; Gössinger, M.; Schönlechner, R.; Berghofer, E. Effect of Thermal Treatment on the Quality of Cloudy Apple Juice. J. Agric. Food Chem. 2006, 54, 5453–5460. [Google Scholar] [CrossRef]
- Girard, B.; Fukumoto, L.R. Apple Juice Clarification Using Microfiltration and Ultrafiltration Polymeric Membranes. LWT Food Sci. Technol. 1999, 32, 290–298. [Google Scholar] [CrossRef]
- Wellala, C.K.D.; Bi, J.; Liu, X.; Liu, J.; Lyu, J.; Zhou, M. Effect of High Pressure Homogenization on Mixed Juice Stability, Rheology, Physicochemical Properties and Microorganism Reduction. J. Food Sci. Technol. 2020, 57, 1944–1953. [Google Scholar] [CrossRef]
- Salehi, F. Physico-Chemical and Rheological Properties of Fruit and Vegetable Juices as Affected by High Pressure Homogenization: A Review. Int. J. Food Prop. 2020, 23, 1136–1149. [Google Scholar] [CrossRef]
- Moscovici Joubran, A.; Katz, I.H.; Okun, Z.; Davidovich-Pinhas, M.; Shpigelman, A. The Effect of Pressure Level and Cycling in High-Pressure Homogenization on Physicochemical, Structural and Functional Properties of Filtered and Non-Filtered Strawberry Nectar. Innov. Food Sci. Emerg. Technol. 2019, 57, 102203. [Google Scholar] [CrossRef]
- Sentandreu, E.; Stinco, C.M.; Vicario, I.M.; Mapelli-Brahm, P.; Navarro, J.L.; Meléndez-Martínez, A.J. High-Pressure Homogenization as Compared to Pasteurization as a Sustainable Approach to Obtain Mandarin Juices with Improved Bioaccessibility of Carotenoids and Flavonoids. J. Clean. Prod. 2020, 262, 121325. [Google Scholar] [CrossRef]
- Włodarska, K.; Pawlak-Lemańska, K.; Górecki, T.; Sikorska, E. Factors Influencing Consumers’ Perceptions of Food: A Study of Apple Juice Using Sensory and Visual Attention Methods. Foods 2019, 8, 545. [Google Scholar] [CrossRef]
- Vallée Marcotte, B.; Verheyde, M.; Pomerleau, S.; Doyen, A.; Couillard, C. Health Benefits of Apple Juice Consumption: A Review of Interventional Trials on Humans. Nutrients 2022, 14, 821. [Google Scholar] [CrossRef] [PubMed]
- Veeriah, S.; Balavenkatraman, K.K.; Böhmer, F.-D.; Kahle, K.; Glei, M.; Richling, E.; Scheppach, W.; Pool-Zobel, B.L. Intervention with Cloudy Apple Juice Results in Altered Biological Activities of Ileostomy Samples Collected from Individual Volunteers. Eur. J. Nutr. 2008, 47, 226–234. [Google Scholar] [CrossRef] [PubMed]
- Xie, X.; Wang, X.; Bi, X.; Ning, N.; Li, M.; Xing, Y.; Che, Z. Effects of Ultrafiltration Combined with High-Pressure Processing, Ultrasound and Heat Treatments on the Quality of a Blueberry–Grape–Pineapple–Cantaloupe Juice Blend. Int. J. Food Sci. Technol. 2022, 57, 4368–4379. [Google Scholar] [CrossRef]
- Pandiselvam, R.; Özaslan, Z.T.; Sahni, P.; Khanashyam, A.C.; Kutlu, N.; Yilmaz, M.S.; Isleroglu, H.; Ramniwas, S.; Rustagi, S. High Pressure Homogenization for Preservation of Liquid Foods- Mechanisms, Molecular Modifications and Recent Developments. Futur. Foods 2024, 10, 100488. [Google Scholar] [CrossRef]
- Marszałek, K.; Trych, U.; Bojarczuk, A.; Szczepańska, J.; Chen, Z.; Liu, X.; Bi, J. Application of High-Pressure Homogenization for Apple Juice: An Assessment of Quality Attributes and Polyphenol Bioaccessibility. Antioxidants 2023, 12, 451. [Google Scholar] [CrossRef]
- MacAdam, D.L. Visual Sensitivities to Color Differences in Daylight. J. Opt. Soc. Am. 1942, 32, 247–274. [Google Scholar] [CrossRef]
- Hirschler, R. Browning in Food Colorimetry. In Color in Food: Technological and Psychophysical Aspects; CRC Press: Boca Raton, FL, USA, 2012; pp. 93–104. [Google Scholar]
- Selen Burdurlu, H.; Karadeniz, F. Effect of Storage on Nonenzymatic Browning of Apple Juice Concentrates. Food Chem. 2003, 80, 91–97. [Google Scholar] [CrossRef]
- Frangopoulos, T.; Koliouskas, A.; Petridis, D. The Effect of Accelerated Storage Temperature Conditions on the Shelf Life of Pasteurized Orange Juice Based on Microbiological, Physicochemical, and Color Attributes. Appl. Sci. 2024, 14, 10870. [Google Scholar] [CrossRef]
- Nour, V. Increasing the Content of Bioactive Compounds in Apple Juice Through Direct Ultrasound-Assisted Extraction from Bilberry Pomace. Foods 2024, 13, 4144. [Google Scholar] [CrossRef]
- Müller, L.; Gnoyke, S.; Popken, A.M.; Böhm, V. Antioxidant Capacity and Related Parameters of Different Fruit Formulations. LWT 2010, 43, 992–999. [Google Scholar] [CrossRef]
- Rilievo, G.; Magro, M.; Tonolo, F.; Cecconello, A.; Rutigliano, L.; Cencini, A.; Molinari, S.; Di Paolo, M.L.; Fiorucci, C.; Rossi, M.N.; et al. Spermine Oxidase–Substrate Electrostatic Interactions: The Modulation of Enzyme Function by Neighboring Colloidal ɣ-Fe2O3. Int. J. Mol. Sci. 2023, 13, 1800. [Google Scholar] [CrossRef]
- Laconi, A.; Cecconello, A.; Molinari, S.; Rilievo, G.; Cencini, A.; Tonolo, F.; Krystofova, A.; Majethia, H.N.; Tolosi, R.; Schiavon, E.; et al. Highly Specific Polyphenolic Colloids as Alternatives to Antimicrobials in Livestock Production. Int. J. Mol. Sci. 2024, 25, 9363. [Google Scholar] [CrossRef]
- Zárate-Rodríguez, E.; Ortega-Rivas, E.; Barbosa-Cánovas, G. V Effect of Membrane Pore Size on Quality of Ultrafiltered Apple Juice. Int. J. Food Sci. Technol. 2001, 36, 663–667. [Google Scholar] [CrossRef]
- Zhu, D.; Shen, Y.; Wei, L.; Xu, L.; Cao, X.; Liu, H.; Li, J. Effect of Particle Size on the Stability and Flavor of Cloudy Apple Juice. Food Chem. 2020, 328, 126967. [Google Scholar] [CrossRef]
- Wu, M.L.; Zall, R.R.; Tzeng, W.C. Microfiltration and Ultrafiltration Comparison for Apple Juice Clarification. J. Food Sci. 1990, 55, 1162–1163. [Google Scholar] [CrossRef]
- Yassari, S.; Mirsaeedghazi, H.; Roozbeh Nasiraie, L.; Fadavi, A. Clarification of Apple Juice with a Scraped-Surface Membrane Unit: The Effect of System Parameters on Process Efficiency Running Title; Scraped-Surface Membrane Unit. Iran. J. Chem. Chem. Eng. 2023, 42, 618–626. [Google Scholar] [CrossRef]
- Fuenmayor, C.A.; Lemma, S.M.; Mannino, S.; Mimmo, T.; Scampicchio, M. Filtration of Apple Juice by Nylon Nanofibrous Membranes. J. Food Eng. 2014, 122, 110–116. [Google Scholar] [CrossRef]
- Drake, S.R.; Nelson, J.W. Apple Juice Quality as Influenced by Ultrafiltration. J. Food Qual. 1986, 9, 399–406. [Google Scholar] [CrossRef]
- Wagner, A.; Dussling, S.; Scansani, S.; Bach, P.; Ludwig, M.; Steingass, C.B.; Will, F.; Schweiggert, R. Comparative Evaluation of Juices from Red-Fleshed Apples after Production with Different Dejuicing Systems and Subsequent Storage. Molecules 2022, 27, 2459. [Google Scholar] [CrossRef] [PubMed]
- Girard, B.; Fukumoto, L.R. Membrane Processing of Fruit Juices and Beverages: A Review. Crit. Rev. Food Sci. Nutr. 2000, 40, 91–157. [Google Scholar] [CrossRef]
- Terefe, N.S.; Yang, Y.H.; Knoerzer, K.; Buckow, R.; Versteeg, C. High Pressure and Thermal Inactivation Kinetics of Polyphenol Oxidase and Peroxidase in Strawberry Puree. Innov. Food Sci. Emerg. Technol. 2010, 11, 52–60. [Google Scholar] [CrossRef]
- Türkyılmaz, M.; Hamzaoğlu, F.; Özkan, M. Effects of Pasteurization and Storage on Turbidity and Copigmentation in Pomegranate Juices Clarified with Various Hydrocolloid Combinations. Food Chem. 2021, 358, 129803. [Google Scholar] [CrossRef]
- Ertugay, M.F.; Başlar, M. The Effect of Ultrasonic Treatments on Cloudy Quality-Related Quality Parameters in Apple Juice. Innov. Food Sci. Emerg. Technol. 2014, 26, 226–231. [Google Scholar] [CrossRef]
- Schnürer, M.; Groll, E.; Gössinger, M. Effects of Harvest Ripeness and Fruit Storage on Turbidity in Cloudy Apple Juice. Mitteilungen Klosterneubg. 2014, 64, 96–104. [Google Scholar]
- Zhu, D.; Kou, C.; Wei, L.; Xi, P.; Changxin, L.V.; Cao, X.; Liu, H. Effects of High Pressure Homogenization on the Stability of Cloudy Apple Juice. IOP Conf. Ser. Earth Environ. Sci. 2019, 358, 22059. [Google Scholar] [CrossRef]
- Filippi, M.V.; Genovese, D.B.; Lozano, J.E. Zeta-Potential as a Way to Determine Optimal Conditions During Fruit Juice Clarification BT-Food Engineering: Integrated Approaches; Gutiérrez-López, G.F., Barbosa-Cánovas, G.V., Welti-Chanes, J., Parada-Arias, E., Eds.; Springer: New York, NY, USA, 2008; pp. 391–397. [Google Scholar]
- Zhou, X.; Wang, W.; Ma, X.; Xu, E.; Liu, D. Ultrasonication of Thawed Huyou Juice: Effects on Cloud Stability, Physicochemical Properties and Bioactive Compounds. Foods 2021, 10, 1695. [Google Scholar] [CrossRef]
- Carrín, M.E.; Ceci, L.N.; Lozano, J.E. Characterization of Starch in Apple Juice and Its Degradation by Amylases. Food Chem. 2004, 87, 173–178. [Google Scholar] [CrossRef]
- Nehmé, L.; El Tekle, M.; Barakat, N.; El Khoury, A.; Azzi-Achkouty, S.; El Rayess, Y. Alternative Processes for Apple Juice Stabilization and Clarification: A Bibliometric and Comprehensive Review. Processes 2024, 12, 296. [Google Scholar] [CrossRef]
- Hameed Sher-i-Kashmir, F.; Avanish Kumar Assistant Professor, I.; Hamid, N.; Fozia Hameed Sher-i-Kashmir, C.; Hameed, F.; Kumar, A. Effect of Thermal Treatment and Storage on the Quality of Apple Juice. J. Pharmacogn. Phytochem. 2019, 8, 1976–1979. [Google Scholar]
- Gerard, K.A.; Roberts, J.S. Microwave Heating of Apple Mash to Improve Juice Yield and Quality. LWT Food Sci. Technol. 2004, 37, 551–557. [Google Scholar] [CrossRef]
- Wang, H.; Yuan, J.; Chen, L.; Ban, Z.; Zheng, Y.; Jiang, Y.; Jiang, Y.; Li, X. Effects of Fruit Storage Temperature and Time on Cloud Stability of Not from Concentrated Apple Juice. Foods 2022, 11, 2568. [Google Scholar] [CrossRef]
- Wojdyło, A.; Teleszko, M.; Oszmiański, J. Physicochemical Characterisation of Quince Fruits for Industrial Use: Yield, Turbidity, Viscosity and Colour Properties of Juices. Int. J. Food Sci. Technol. 2014, 49, 1818–1824. [Google Scholar] [CrossRef]
- Lyu, J.; Liu, X.; Bi, J.; Wu, X.; Zhou, L.; Ruan, W.; Zhou, M.; Jiao, Y. Kinetic Modelling of Non-Enzymatic Browning and Changes of Physio-Chemical Parameters of Peach Juice during Storage. J. Food Sci. Technol. 2018, 55, 1003–1009. [Google Scholar] [CrossRef] [PubMed]
- Xu, Z.; Yang, Z.; Ji, J.; Mou, Y.; Chen, F.; Xiao, Z.; Liao, X.; Hu, X.; Ma, L. Polyphenol Mediated Non-Enzymatic Browning and Its Inhibition in Apple Juice. Food Chem. 2023, 404, 134504. [Google Scholar] [CrossRef] [PubMed]
- Lin, Y.-S.; Huang, W.-Y.; Ho, P.-Y.; Hu, S.-Y.; Lin, Y.-Y.; Chen, C.-Y.; Chang, M.-Y.; Huang, S.-L. Effects of Storage Time and Temperature on Antioxidants in Juice from Momordica charantia L. and Momordica charantia L. Var. Abbreviata Ser. Molecules 2020, 25, 3614. [Google Scholar] [CrossRef]
- Genova, G.; Iacopini, P.; Baldi, M.; Ranieri, A.; Storchi, P.; Sebastiani, L. Temperature and Storage Effects on Antioxidant Activity of Juice from Red and White Grapes. Int. J. Food Sci. Technol. 2012, 47, 13–23. [Google Scholar] [CrossRef]
- Alberti, A.; Braga, C.M.; Jaster, H.; Nogueira, A. Dissolved Oxygen Content in Apple Must: Technological Implications in Cider Processing. J. Inst. Brew. 2014, 120, 65–70. [Google Scholar] [CrossRef]
- Pham, H.T.T.; Kityo, P.; Buvé, C.; Hendrickx, M.E.; Van Loey, A.M. Influence of PH and Composition on Nonenzymatic Browning of Shelf-Stable Orange Juice during Storage. J. Agric. Food Chem. 2020, 68, 5402–5411. [Google Scholar] [CrossRef] [PubMed]
- Wahia, H.; Zhou, C.; Mustapha, A.T.; Amanor-Atiemoh, R.; Mo, L.; Fakayode, O.A.; Ma, H. Storage Effects on the Quality Quartet of Orange Juice Submitted to Moderate Thermosonication: Predictive Modeling and Odor Fingerprinting Approach. Ultrason. Sonochem. 2020, 64, 104982. [Google Scholar] [CrossRef]


Disclaimer/Publisher’s Note: The statements, opinions and data contained in all publications are solely those of the individual author(s) and contributor(s) and not of MDPI and/or the editor(s). MDPI and/or the editor(s) disclaim responsibility for any injury to people or property resulting from any ideas, methods, instructions or products referred to in the content. |
© 2025 by the authors. Licensee MDPI, Basel, Switzerland. This article is an open access article distributed under the terms and conditions of the Creative Commons Attribution (CC BY) license (https://creativecommons.org/licenses/by/4.0/).