Article

Hillslope Morphological Features Modulate Soil Microbial Communities and Chestnut Ink Disease via Clay and Water Redistribution

1
Department of Agricultural and Food Sciences, Alma Mater Studiorum-University of Bologna, 40127 Bologna, Italy
2
Department for Innovation in Biological, Agro-Food and Forest Systems, University of Tuscia, 01100 Viterbo, Italy
3
Department of Agricultural, Food and Environmental Sciences, Polytechnic University of Marche, 60131 Ancona, Italy
*
Author to whom correspondence should be addressed.
Appl. Sci. 2025, 15(21), 11695; https://doi.org/10.3390/app152111695
Submission received: 27 September 2025 / Revised: 15 October 2025 / Accepted: 30 October 2025 / Published: 1 November 2025

Abstract

Ink disease, caused by the soil-borne pathogens Phytophthora cambivora and Phytophthora cinnamomi, is threatening sweet chestnut (Castanea sativa) groves across Europe. This study investigates whether the morphology of soil and related properties influence the development of ink disease throughout the entire soil profile. In a C. sativa stand in Northern Italy, soil pits were excavated near symptomatic (INK1, 978 m a.s.l.) and healthy trees (INK2, 988 m a.s.l.; INK3, 998 m a.s.l.) along an altitudinal transect. The slope gradients at these sites were 3%, 9%, and 30%, respectively. Soils were classified as Luvisols. Results suggest that the lower slope position and gentler gradient of INK1 may have facilitated the downslope transport of clay and water from INK2 and INK3, leading to increased clay accumulation throughout the INK1 soil profiles. This, in turn, enhanced saturated hydraulic conductivity (Ks) and the wilting point (WP), favoring water retention in deeper horizons, where Phytophthora DNA was detected. Indeed, INK1 had a higher WP (14.9%) compared to INK2 (11.7%) and INK3 (8.2%), and exhibited the highest Ks (25.1%), significantly exceeding values in INK2 (4.6%) and INK3 (6.5%). The presence of the pathogen in INK1 appeared to affect microbial functionality, as indicated by the dominance of contact (~20%) and medium-distance ectomycorrhizal (~60%) exploration types over long-distance ones. Overall, our findings highlighted the key role of soil processes, particularly clay and water redistribution, in shaping microbial communities and soil-borne pathogen dynamics through their influence on edaphic properties.

1. Introduction

Since the end of World War II, forested areas in Italy have steadily increased, driven by reforestation efforts and the abandonment of agricultural and pasture lands [1]. Today, forests cover more than 37% of the national territory. Chestnut trees (Castanea sativa Mill.), which thrive in hilly and mountainous regions between 250 and 1000 m above sea level, are an important component of these ecosystems. In the 1950s, the Statistical National Institute (ISTAT) inventory recorded 447,000 hectares of fruit chestnut groves and 275,186 hectares of coppice chestnut stands [2]. At present, fruit chestnut groves have declined to 147,000 hectares, while coppice forests now cover approximately 600,000 hectares. However, many of these forests are aging and abandoned due to socioeconomic changes, policy shifts, and phytosanitary challenges [2,3]. At the European level, chestnut forests are recognized as habitats of community interest (Natura 2000 habitat code: 9260 Castanea sativa forest) [4].
Despite the support of European and local rural development programs aimed at restoring chestnut groves [5,6], their success has been limited. Restoration efforts are often hindered by fragmented landownership and the lack of generational turnover among landowners.
Unmanaged chestnut forests are increasingly vulnerable to phytosanitary threats such as chestnut blight (Cryphonectria parasitica), ink disease (Phytophthora cambivora, P. cinnamomi), brown rot (Gnomoniopsis castanea), and the Asian chestnut gall wasp (Dryocosmus kuriphilus) [7,8,9]. Among these, ink disease is one of the most serious threats, causing crown dieback, leaf yellowing, branch mortality, and in severe cases, rapid tree decline. Symptoms can take years to fully develop [9]. The primary causal agents in Europe are Phytophthora cambivora (Petri) Buisman and Phytophthora cinnamomi Rands, although other species may also be involved [9,10].
Most of the studies have examined the influence of land management, landscape features, and climate on ink disease development. For instance, heavy rainfall, heatwaves, and drought have been linked to its spread [11,12,13,14]. Disease incidence is also higher near natural drainage lines where inoculum moves with surface runoff [15,16], and roads through chestnut stands can serve as dispersal routes [17]. Furthermore, intensive management and tillage have been associated with disease outbreaks in Portugal [18].
Conversely, the role of soil has received less attention, despite its fundamental role in modulating plant resilience and pathogen severity [10]. Prior studies have mainly investigated soil porosity [19,20], while the influence of soil-forming factors linked to landscape morphology (e.g., slope position and gradient) remains understudied. We hypothesize that ink disease risk is higher in chestnut trees growing on soil at lower slope gradients, especially at the base of slopes. Such positions tend to favor water infiltration, increasing soil moisture [21,22], and may create optimal conditions for infection by P. cinnamomi, which spreads via motile zoospores in water-saturated soils [23,24]. Risk is further amplified in foot slope positions, where both surface and subsurface flow accumulate [25,26].
The consequences of ink disease are severe, affecting not only tree vitality but also the landscape, ecosystem services, and local economies that depend on chestnut production. In many cases, the disease symptoms may remain latent for decades following infection [27,28]. However, recent studies in the northern Apennines suggest that some chestnut stands may be coexisting with Phytophthora spp., indicating a potential equilibrium between the pathogen, the host, environmental conditions, and the soil microbiota [29].
While most soil microbiology studies focus on surface layers (up to 30 cm deep), where microbial activity is the highest, much less is known about the microbiome of the subsoil, despite its ecological relevance [30]. Soil microorganisms are key players in organic matter decomposition, nutrient cycling, and the maintenance of soil structure [31,32]. They are also widely recognized as indicators of soil health [33,34]. Furthermore, microorganisms are primary producers of extracellular enzymes that regulate organic matter turnover and nutrient dynamics [35,36]. These enzymes are sensitive to changes in soil properties and climatic conditions [37], making them useful indicators for soil degradation and recovery processes [38,39]. The activity of soil enzymes is generally governed by factors such as soil organic matter, pH, and porosity [40,41].
Soil morphological properties are key factors influencing soil formation and play a critical role in organic carbon storage and cycling. Slope position and aspect regulate hydrological processes and solar radiation exposure, thus shaping the microclimate [42,43]. These microclimatic variations influence microbial biomass and diversity, as well as microbial activity related to respiration and enzymatic functions involved in nutrient cycling and SOM decomposition [41,44].
This study aims to investigate how soil morphological properties affects: (1) the development of chestnut ink disease and (2) the structure of Oomycota, fungal, and bacterial communities across both topsoil and subsoil horizons. To achieve this, we adopted an integrated approach combining pedological investigation on the field, soil physicochemical characterization, microbial DNA metabarcoding, and extracellular enzyme activity assays to provide a holistic understanding the soil–plant–microbial interactions, considering all genetic horizons of investigated soils.

2. Materials and Methods

2.1. Study Area and Experimental Design

The study was conducted in the municipality of Alto Reno Terme, in the Apennine Mountains of Bologna Province (northern Italy), near the border between the Emilia–Romagna and Tuscany regions (Figure 1). The area (WGS 84 UTM 32N: 4,887,250 mN, 656,900 mE) is predominantly covered by fruit chestnut groves, including many centuries-old trees, which represent the dominant land use. Chestnut cultivation has historically shaped this landscape, as documented by initiatives under the National Rural Network Program (2014–2020) [45].
Geologically, the area is characterized by dormant landslide deposits overlying the turbiditic arenaceous–pelitic member of the Castiglione dei Pepoli Formation [46]. The climate features warm summers and moderately cold winters, with a mean annual temperature of 10.9 °C. Monthly averages range from 20.7 °C in August to 2.5 °C in January (Figure S1 of the Supplementary Materials). Mean annual precipitation is 1647 mm, unevenly distributed across the year, with peaks in winter, spring, and autumn, particularly in November. No marked dry season is observed.
An abandoned chestnut grove located on the south-facing slope of Mount Granaglione was selected as the study site. The grove extends from 970 to 1050 m a.s.l. and has been unmanaged since 2008. It contains mature chestnut trees (>60 years old) spaced approximately 10 m apart. The understory is overgrown with ferns and brambles, with average ground cover of 40%.
Three sampling sites were selected along a 60 m altitudinal transect (10 m elevation difference per site): INK1 (978 m a.s.l.; 3% slope), INK2 (988 m a.s.l.; 9% slope), and INK3 (998 m a.s.l.; 30% slope) (Figure 1 and Figure 2).
In July 2023, at each site, three reference trees were selected and a soil profile was excavated 1 m downslope from each of them. Two additional auger samples (designated “a” and “b”) were taken 2 m from each profile to assess horizon variability (Figure 1). Soil profiles and horizons were described following Schoeneberger et al. [47] (see Figure 2).
We acknowledge that investigating a single chestnut grove may limit the generalizability of our results. However, soil heterogeneity can be high even at small spatial scales [48,49], as slight differences in soil-forming factors can strongly affect pedogenetic processes [50]. Vertical and horizontal water movement often varies along hillslopes, even at the microtopographic scale [51,52]. Moreover, mountain landscapes are characterized by pronounced topographic variability, which enhances soil diversity [46,53,54].
Approximately 500 g of soil were collected from each genetic horizon for physicochemical and biochemical analyses. For DNA metabarcoding, each horizon was sampled using a sterile 5 cm diameter soil corer. Samples were stored in a refrigerated container and transported to the laboratory.
Chestnut trees at INK1 showed clear symptoms of decline—reduced canopy density, chlorotic leaves, dead branches, and dark flame-shaped lesions at the root collar—indicative of Phytophthora infection. Trees at INK2 and INK3 appeared healthy (Figure S2 of the Supplementary Materials).
The three reference trees per site were also sampled for leaf nutrient analysis using the protocol described by Vittori Antisari et al. [55]. Leaves from symptomatic trees (site INK1) had lower concentrations of N, K, Ca, and B, while healthy trees had lower Mn content (Table 1) than leaves from healthy plants (sites INK2 and INK3).

2.2. Soil Physicochemical Analyses

Soil pH was determined in a 1:2.5 (w:v) soil-to-water suspension after two hours of shaking, using a Crison pH meter. Total organic carbon (OC) and total nitrogen (TN) were measured by Dumas combustion using a CHN elemental analyzer (Flash 2000, Thermo Fisher Scientific, Waltham, MA, USA). Particle-size distribution was determined using the pipette method [56]. Additional analytical details are provided in Appendix A.

2.3. Soil Biochemical and Enzyme Analyses

Microbial biomass carbon (Cmic), microbial biomass nitrogen (Nmic), and basal respiration (BR) were measured following the protocol described by De Feudis et al. [57], with full details in the Appendix A.
The activities of β-cellobiohydrolase (EC 3.2.1.91), α-glucosidase (EC 3.2.1.21), β-glucosidase (EC 3.2.1.20), and xylosidase (EC 3.2.2.27) were assessed using 4-MUF substrates (4-MUF-β-D-cellobioside, 4-MUF-α-D-glucoside, 4-MUF-β-D-glucoside, and 4-MUF-β-D-xyloside, respectively), following Marx et al. [58] and Vepsäläinen et al. [59]. Moist soil samples (equivalent to 1 g oven-dried) were homogenized in 50 mL of Na-acetate buffer (pH 5.5) using an UltraTurrax (Merck KGaA, Darmstadt, Germany) at 9600 rpm for 3 min. Aliquots (100 µL) of the suspension were dispensed into 96-well microplates in triplicate for each substrate and then mixed with 100 µL of a 1 mM substrate solution (final concentration: 500 µM). Fluorescence was measured at excitation/emission wavelengths of 360/450 nm using a Fluoroskan Ascent plate reader (Thermo Fisher Scientific) at 0, 30, 60, 120, and 180 min, with incubation at 30 °C.
Enzyme activity values were normalized to microbial biomass (Cmic) and total organic carbon (OC), resulting in microbial biomass-specific and organic carbon-specific enzyme activity indices, allowing comparisons across profiles. Specifically, the microbial biomass-specific and organic carbon-specific enzyme activity indices were calculated dividing each enzyme activity by the Cmic and OC contents, respectively.

2.4. DNA Extraction and Taxonomic Assignment

Total DNA was extracted using the DNeasy PowerSoil Kit (Qiagen, Hilden, Germany), following the manufacturer’s instructions. Each sample was analyzed in triplicate. For microbial and fungal communities, the V3–V4 region of the 16S rRNA gene and the ITS region were amplified using primers 341F/805R [60] and ITS1F/ITS4R [61,62], respectively. PCR products included Illumina adapters and unique indices for sequencing.
Libraries were sequenced using 300 bp paired-end reads on an Illumina MiSeq platform (Illumina, San Diego, CA, USA). Base calling, demultiplexing, and adapter trimming were performed with BCL Convert v3.9.3. Reads were trimmed and filtered with Trimmomatic v0.39 and assessed with FastQC. Processed FASTQ files were analyzed with Kraken2 using the SILVA rRNA database (release 138.1) [63], and taxonomic abundances were estimated with Bracken [64].
Microbial communities were analyzed at the phylum level. Fungal communities were further resolved to the genus level to assign ecological guilds, including ectomycorrhizal groups, using the FungalTraits database [65].
All horizons were also tested for Phytophthora spp. using the nested PCR protocol of Burgess et al. [66] with P4 primers, previously validated on positive control DNA of Phytophthora cambivora. DNA from each sample was normalized to 2 ng/μL prior to amplification.
It is worth noting that relic DNA may constitute 20–80% of total soil DNA [67], with persistence times ranging from weeks to years depending on soil characteristics [68]. In this study, relic DNA was not removed, allowing us to capture both active and inactive microbial signatures potentially involved in disease dynamics.

2.5. Indices Calculation and Statistical Analyses

Soil hydraulic properties, including saturation (THS), field capacity (FC, at −330 cm matric potential), wilting point (WP, at −15,000 cm), and saturated hydraulic conductivity (KS), were estimated for each genetic horizon using the EU pedotransfer function interface (https://ptfinterface.rissac.hu/app_direct/ptf/ (accessed on 16 January 2025)) [69]. Input variables included depth, OC, bulk density, and particle-size distribution. Available water capacity (AWC) was calculated subtracting WP to FC. THS, FC, WP, and AWC were corrected for coarse fragments using the formula: adjusted value = value × (100 − Sk)/100, where Sk is the percentage of skeletal content. KS was corrected following Naseri et al. [70], using an m value of 1.8 (intermediate between spherical and oblate fragment shapes).
The Synthetic Enzymatic Index (SEI), which integrates overall microbial functional capacity, was calculated as the sum of enzyme activities and expressed per unit of OC (SEI/OC) and microbial biomass C (SEI/Cmic), following Vittori Antisari et al. [55].
Statistical differences in physicochemical and biological variables among soil profiles were assessed using the Kruskal–Wallis test, following evaluation of heteroscedasticity. All analyses were performed in RStudio (R v4.4.1), using the ‘agricolae’ package.

3. Results

3.1. Soil Classification, Physicochemical and Hydraulic Properties

The investigated soil profiles were classified as Luvisols according to the World Reference Base for Soil Resources [71]. Specifically, INK1 was identified as a Skeletic Luvisol (loamic, epidystric), INK2 as a Leptic Skeletic Luvisol (loamic), and INK3 as a Skeletic Luvisol (loamic). These classifications reflect the high content of coarse fragments throughout the profiles—20%, 22%, and 44% for INK1, INK2, and INK3, respectively.
Using the USDA Soil Taxonomy [72], the presence of clay illuviation features in INK2 and INK3 sites supported their classification as Lithic Hapludalfs (loamy-skeletal, mesic) and Lithic Hapludalfs (loamy-skeletal, mesic, truncated), respectively. In contrast, soil profiles in INK1, which exhibited cambic horizons with only weak argillic development, were classified as a Ruptic-Alfic Dystrudept. Their dystric nature was supported by the low pH (5.6) and base saturation (34.0%).
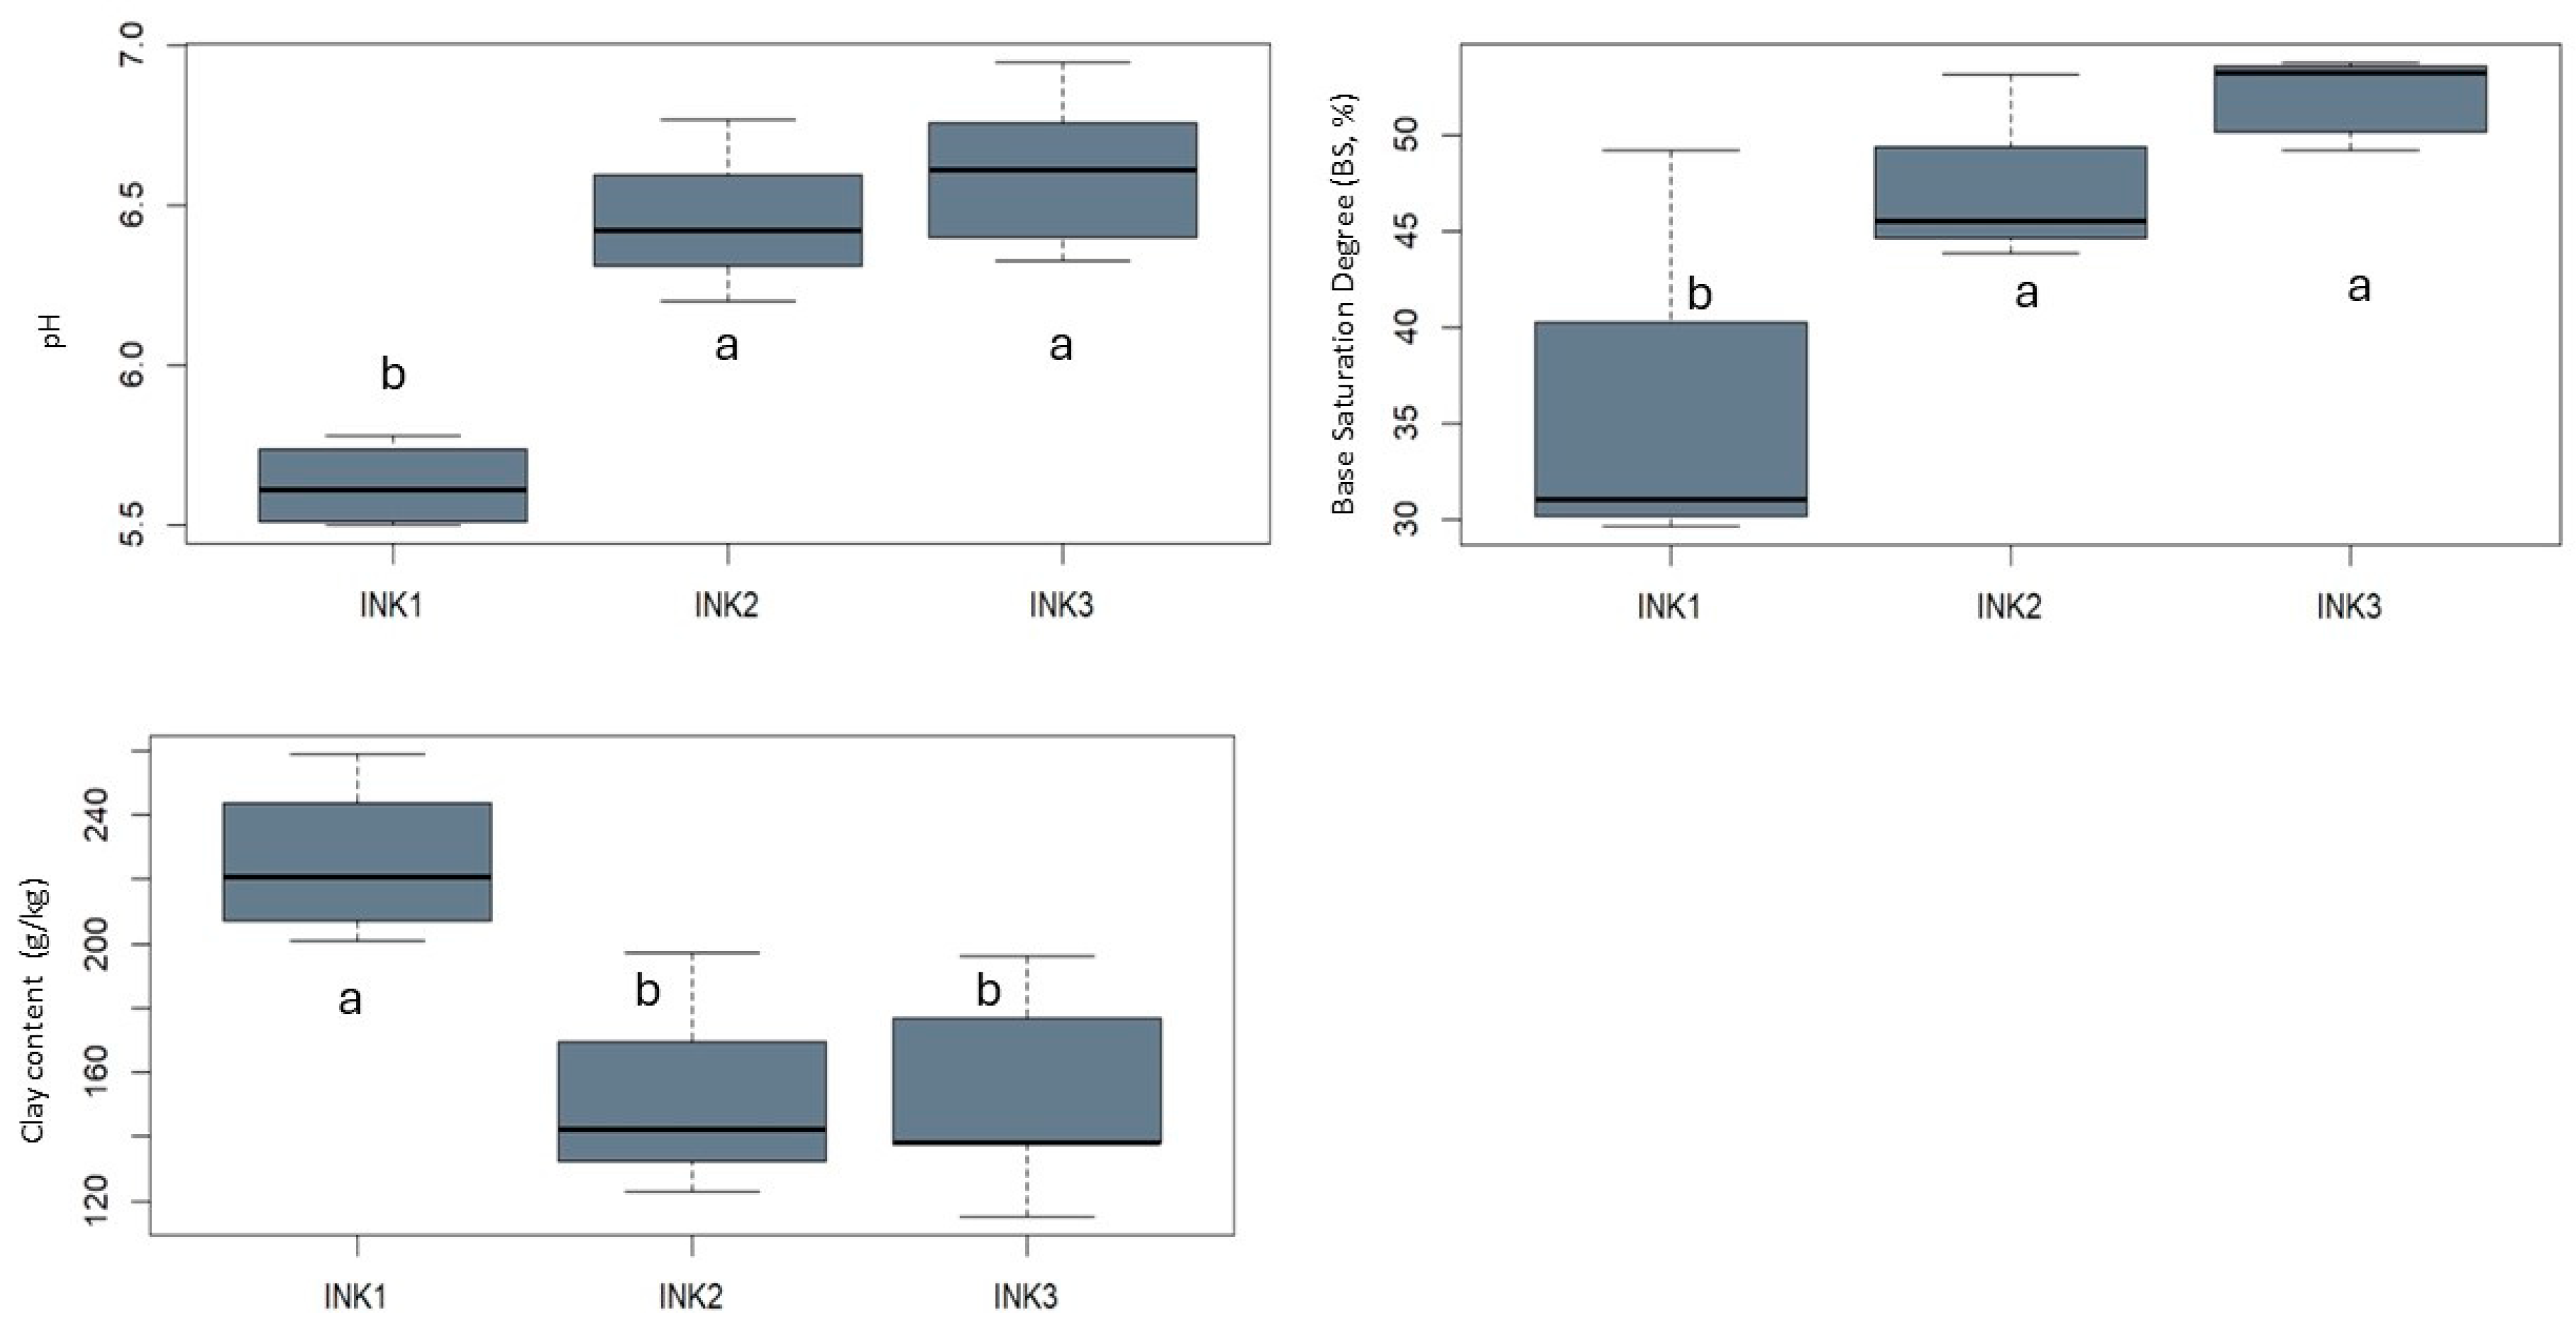
The physicochemical and hydraulic properties of the soils are presented in Tables S1 and S2 of the Supplementary Materials. Overall, the soil texture was silty loam across all horizons, except for the Bw(t) horizon in INK1, which exhibited a loamy texture. Results from the Kruskal–Wallis test (Figure 3) showed significantly lower pH and base saturation values in INK1 (5.6 and 33.9%, respectively) compared to INK2 (6.5 and 47.3%) and INK3 (6.6 and 51.4%). No significant differences in clay content were observed, likely due to high within-profile variability (Figure 3).
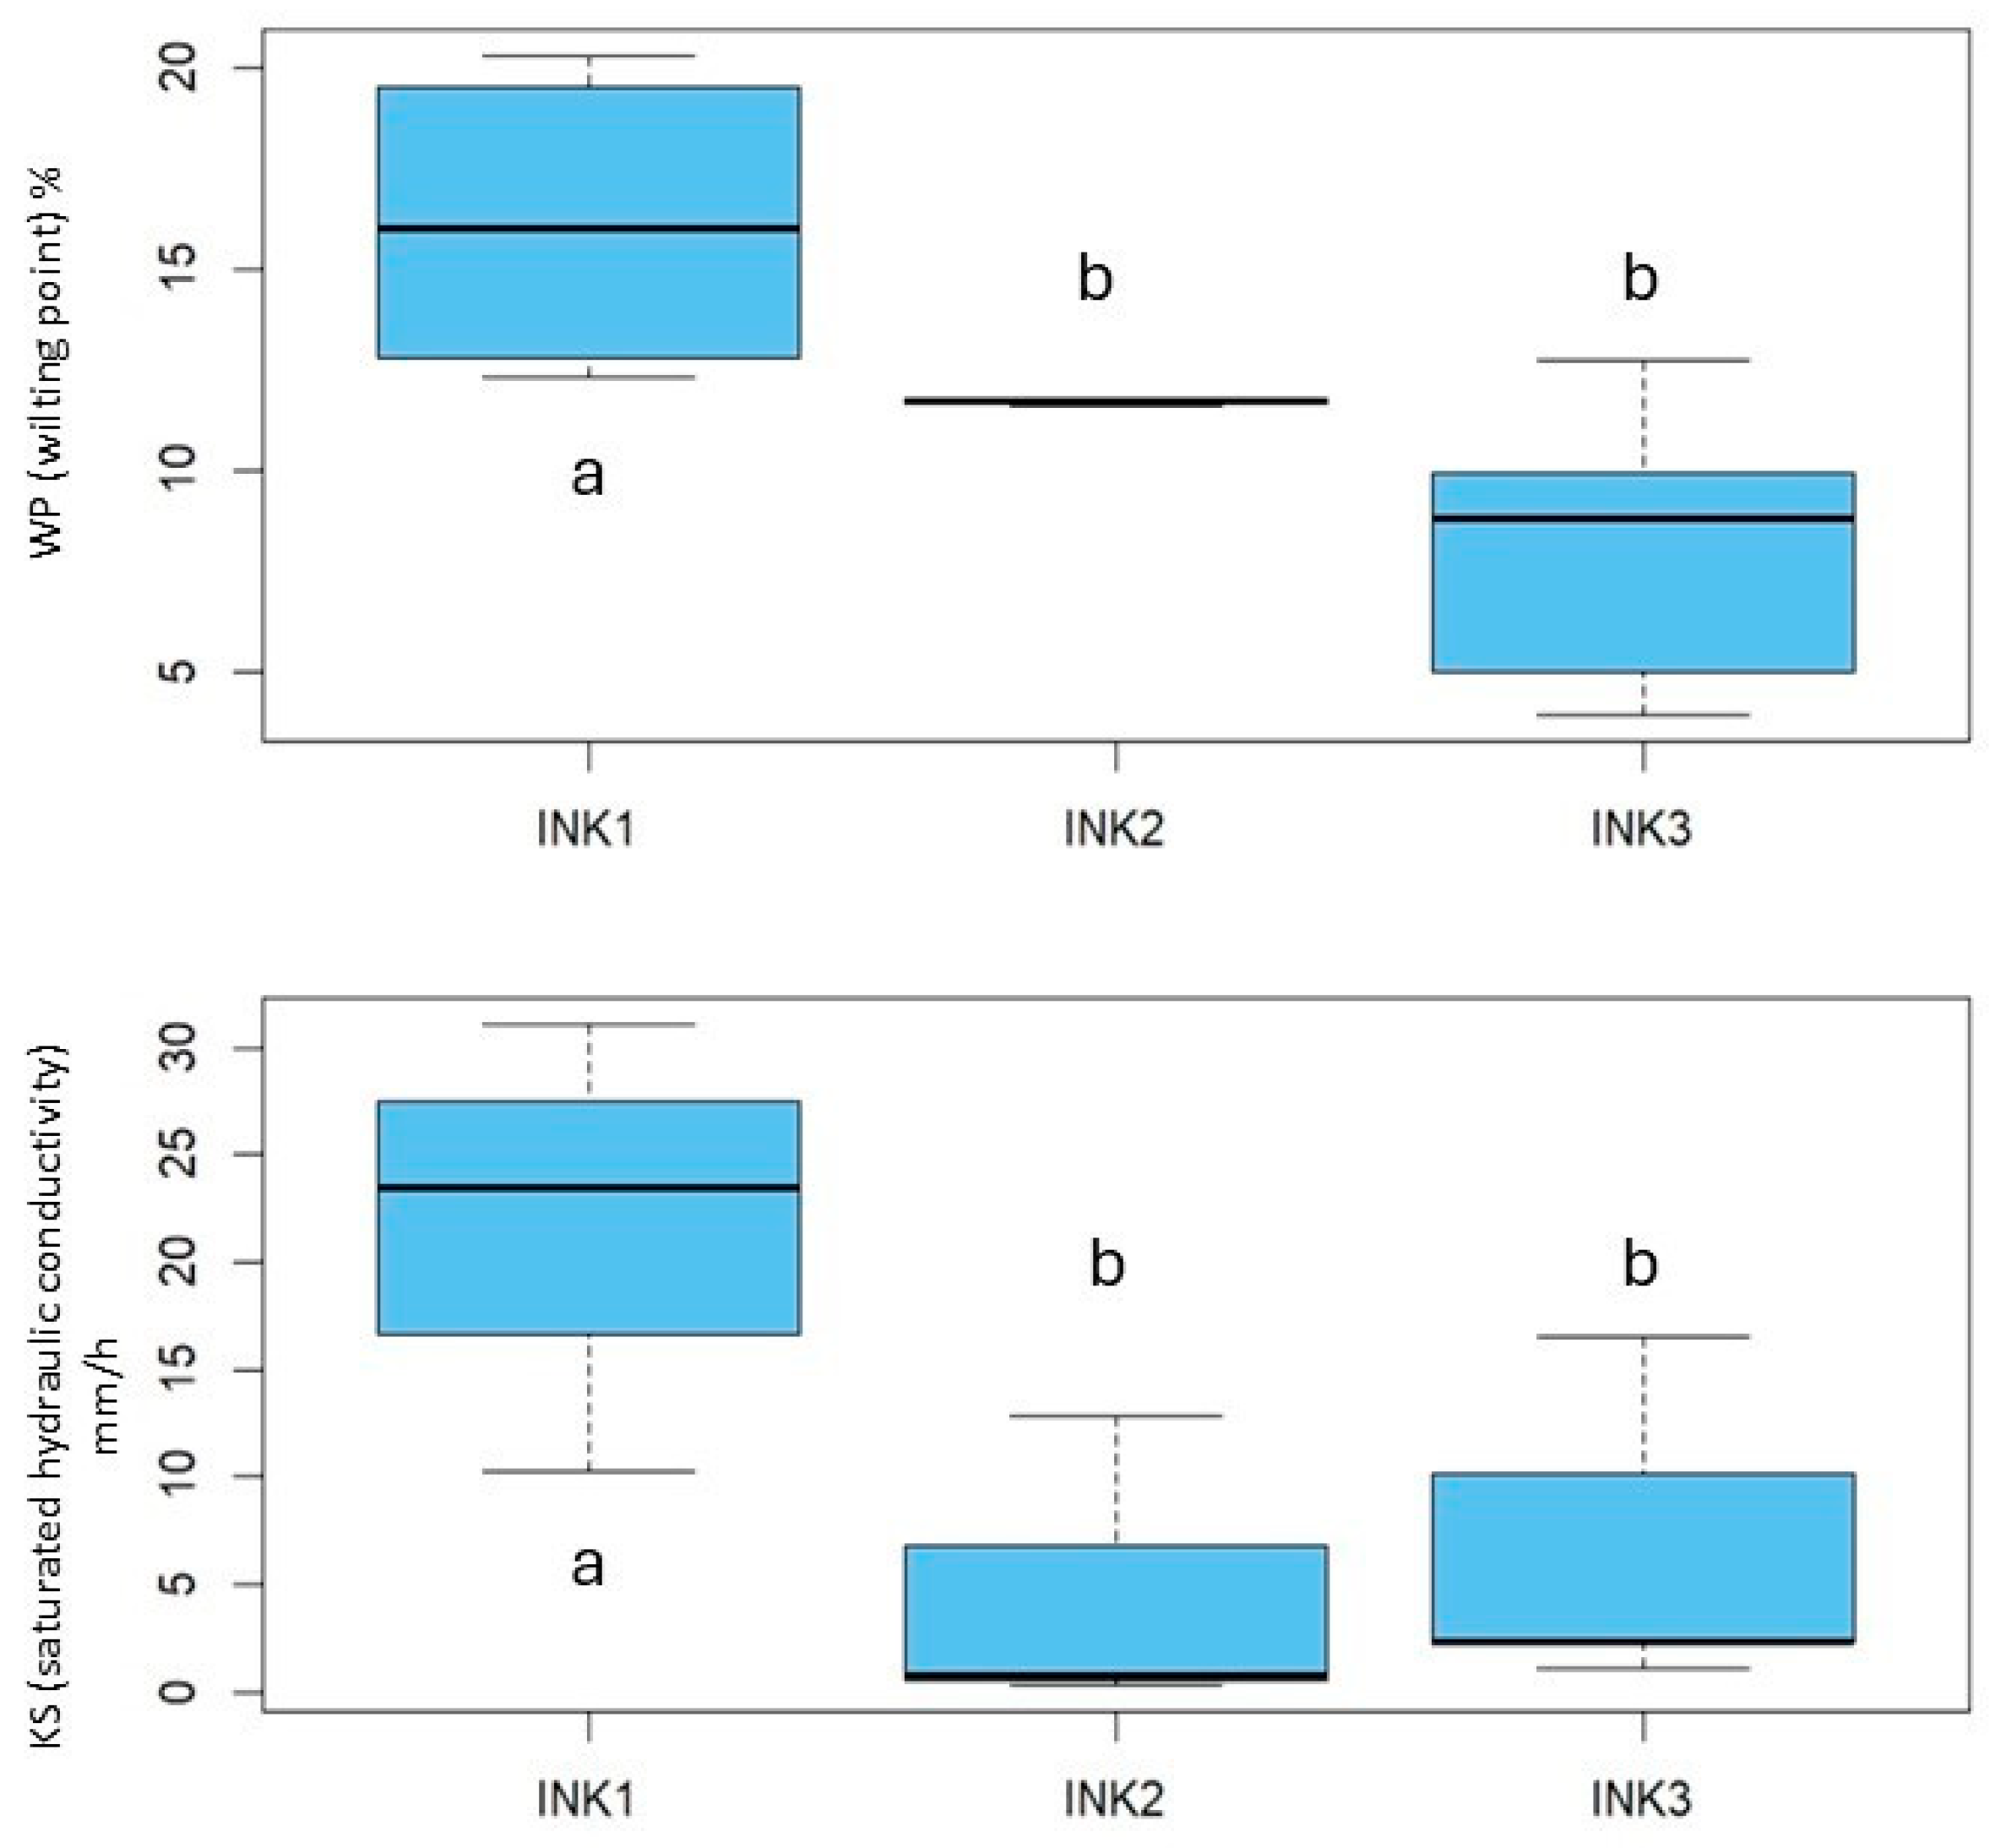
Due to the high within-profile variability in water-related properties, few statistically significant differences emerged. However, notable differences were observed in the permanent wilting point (WP) and saturated hydraulic conductivity (Ks). INK1 had a higher WP (14.9%) compared to INK2 (11.7%) and INK3 (8.2%), and exhibited the highest Ks (25.1%), significantly exceeding values in INK2 (4.6%) and INK3 (6.5%) (Figure 4).

3.2. Soil Organic Matter, Related Properties and Enzyme Activities

As expected, most parameters related to soil organic matter content (Table S3 of the Supplementary Materials) showed the highest values in the A horizon and decreased with depth. Among the carbon and nitrogen cycle indicators, no significant differences were observed across sites, except for water-extractable organic carbon (WEOC) and the WEOC:water-extractable nitrogen (WEN) ratio. These two parameters were significantly higher in INK1 compared to INK2 and INK3 (Figure 5).
Across entire soil profiles, enzyme activities and derived indices did not exhibit statistically significant differences among the sites (Table S4 of the Supplementary Materials), likely due to high within-profile variability. However, when considering specific diagnostic horizons, both organic carbon-specific and microbial biomass-specific enzyme activities reached maximum values in the Bw(t) horizon of INK1 (Figure S3 of the Supplementary Materials). Notably, elevated specific enzymatic activities were also detected in the AB and Bw(t) horizons of INK1.
Overall, the Synthetic Enzymatic Index normalized to organic carbon (SEI/OC) was significantly higher in INK1 (average: 50.5 nmol MUF mg−1 C h−1) than in INK2 (30.1 nmol MUF mg−1 C h−1) and INK3 (22.7 nmol MUF mg−1 C h−1), with a Kruskal–Wallis test result of α = 0.05, p = 0.01 (Figure 5).

3.3. Biodiversity of the Fungal and Bacterial Communities

Figure 6 presents the results of the metagenomic analysis of bacterial communities, showing the relative abundance of the major phyla across different soil horizons. Acidobacteriota and Proteobacteria were the predominant phyla identified. While the relative abundance of Proteobacteria remained relatively stable across all samples, Acidobacteriota showed notable variation. Acidobacteriota abundance was similar in INK2 and INK3 but markedly increased in INK1, especially in the AB horizon. An inverse trend was observed for minor phyla, which decreased in proportion as Acidobacteriota increased. Additionally, Nitrospirota, a group of nitrifying bacteria, were found in appreciable amounts (up to 7%) in deeper horizons of INK2 and INK3—specifically in INK2 Bw(t) and INK3 BC2—whereas they were scarcely represented in INK1.
Phytophthora was detected exclusively in INK1 soils, with a faint amplification band observed in samples from the BC horizon.
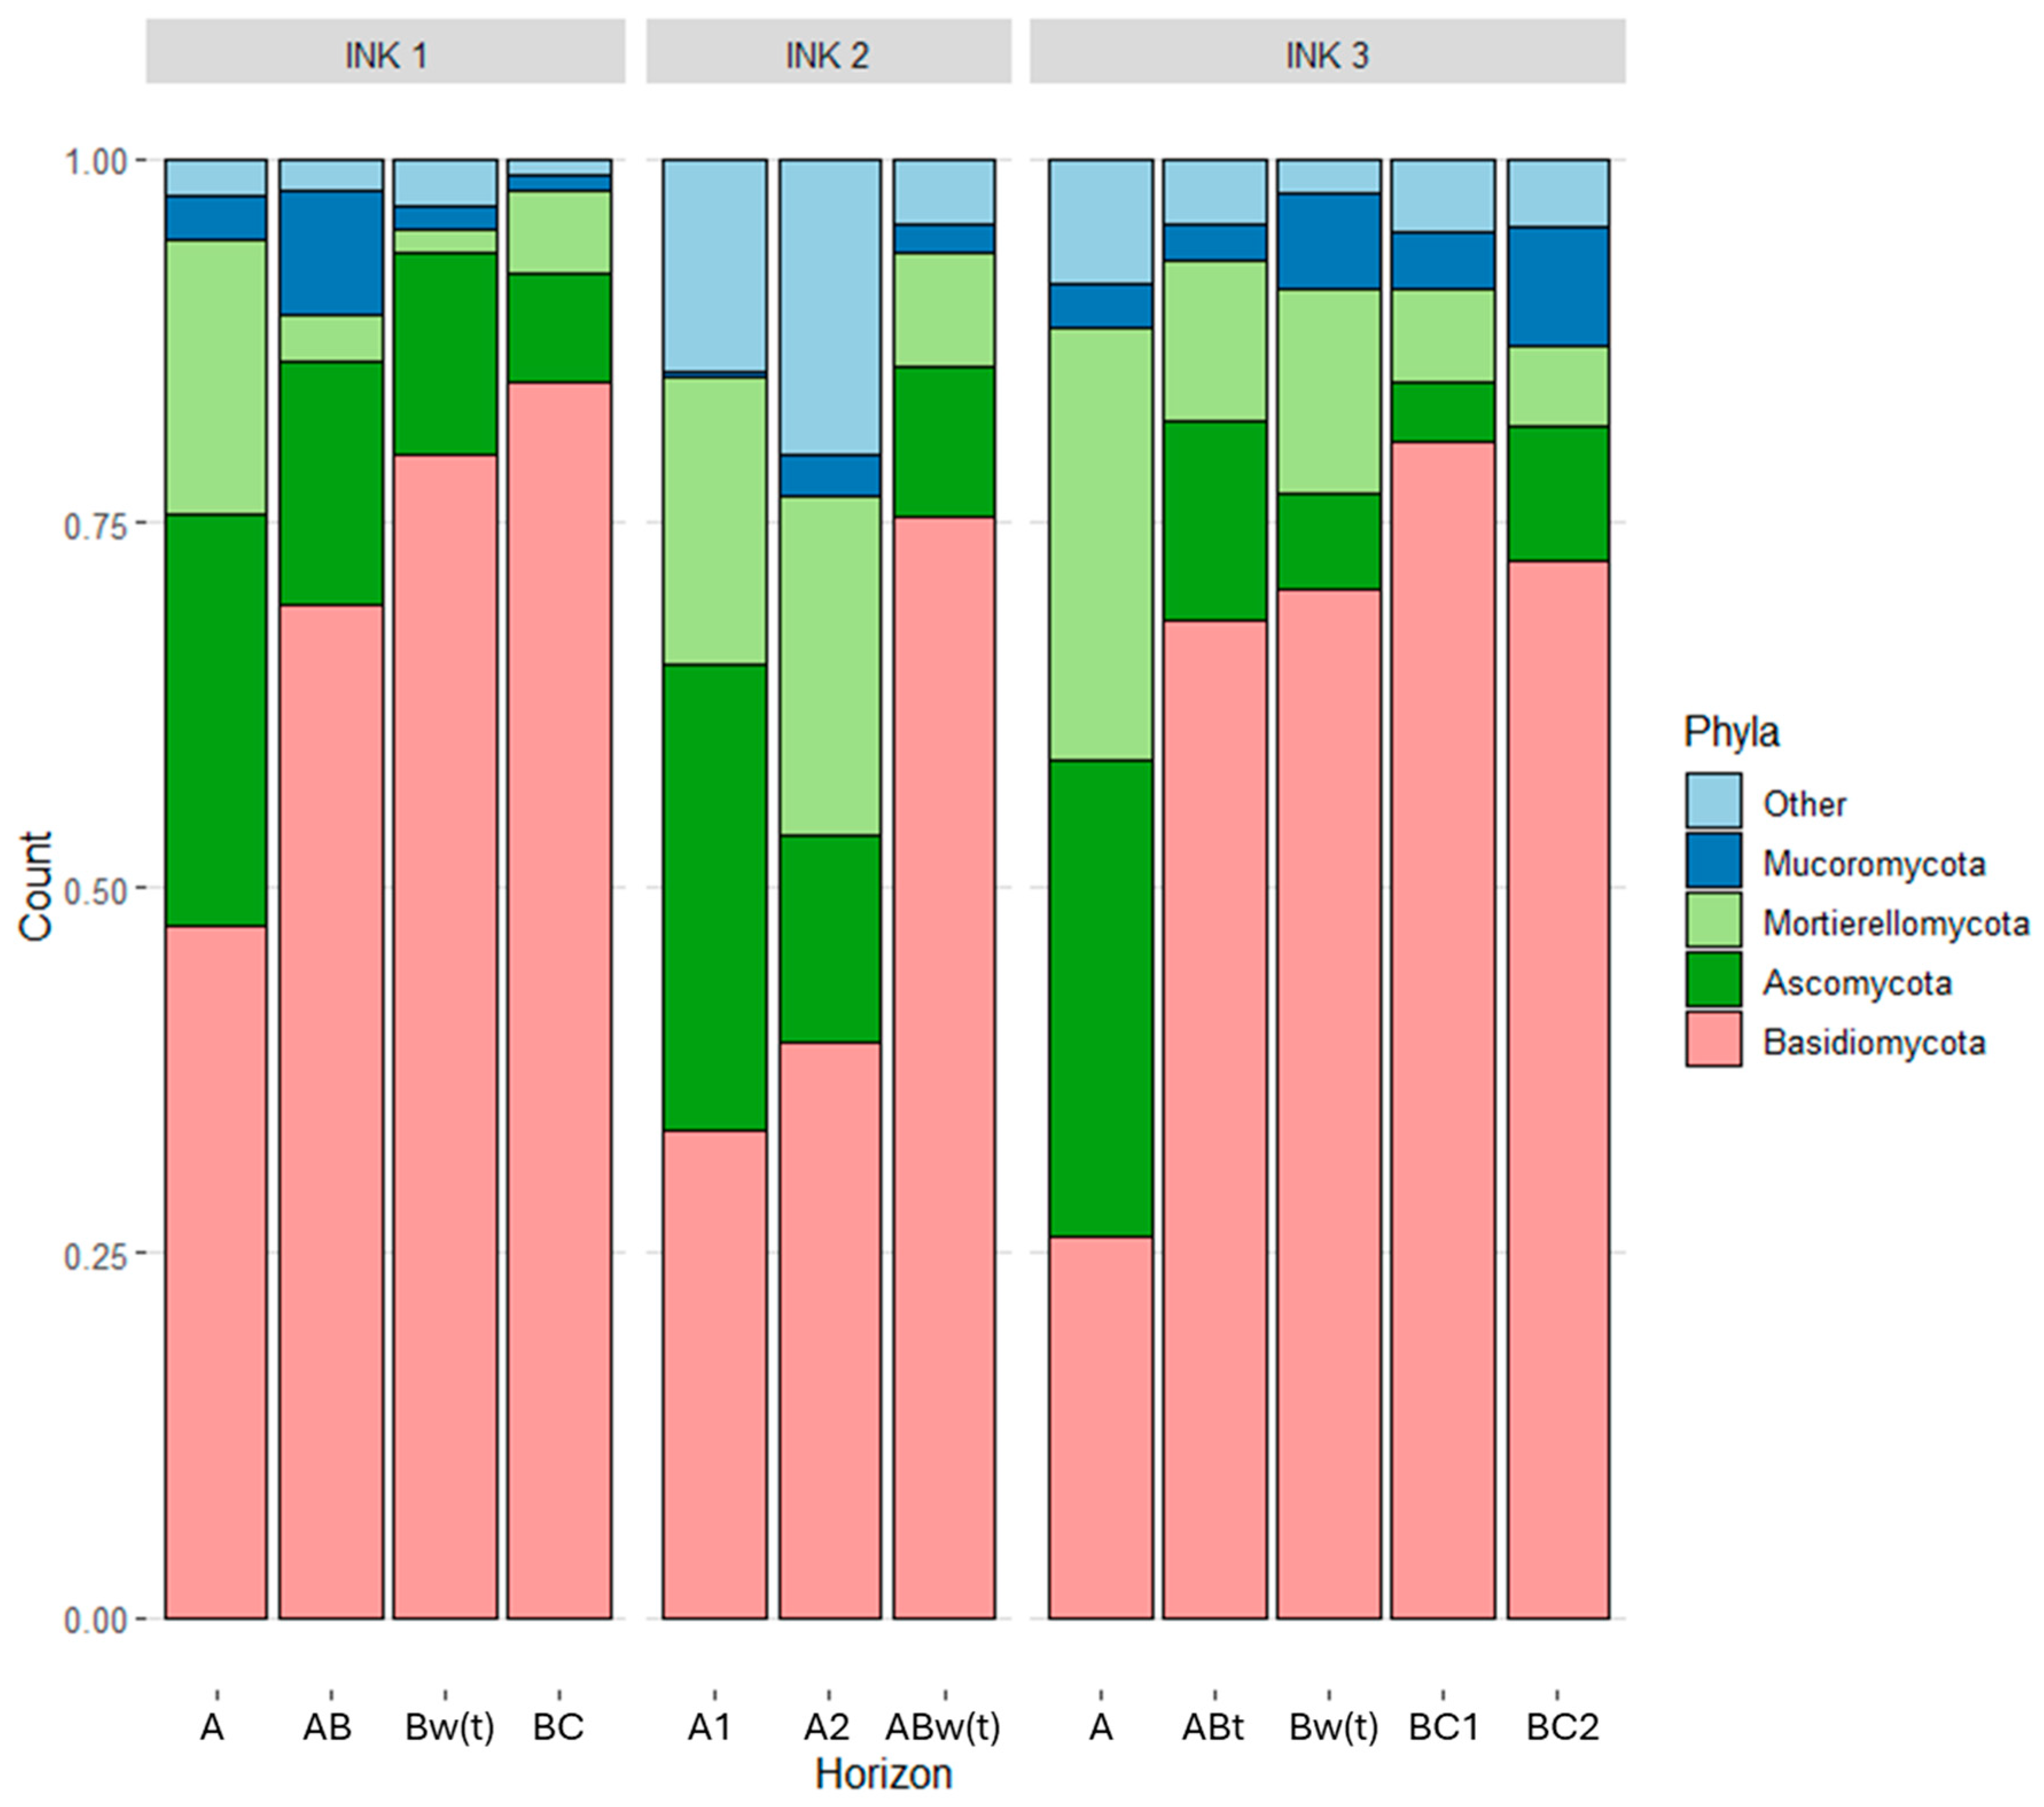
Fungal community composition at the phylum level exhibited greater variability across the profiles compared to bacterial communities. As illustrated in Figure 7, the surface horizons of all profiles harbored fungal assemblages distinct from those in subsoil horizons. In the topsoil, a relatively balanced distribution was observed among Basidiomycota, Ascomycota, and Mortierellomycota. In contrast, Basidiomycota dominated the deeper horizons.
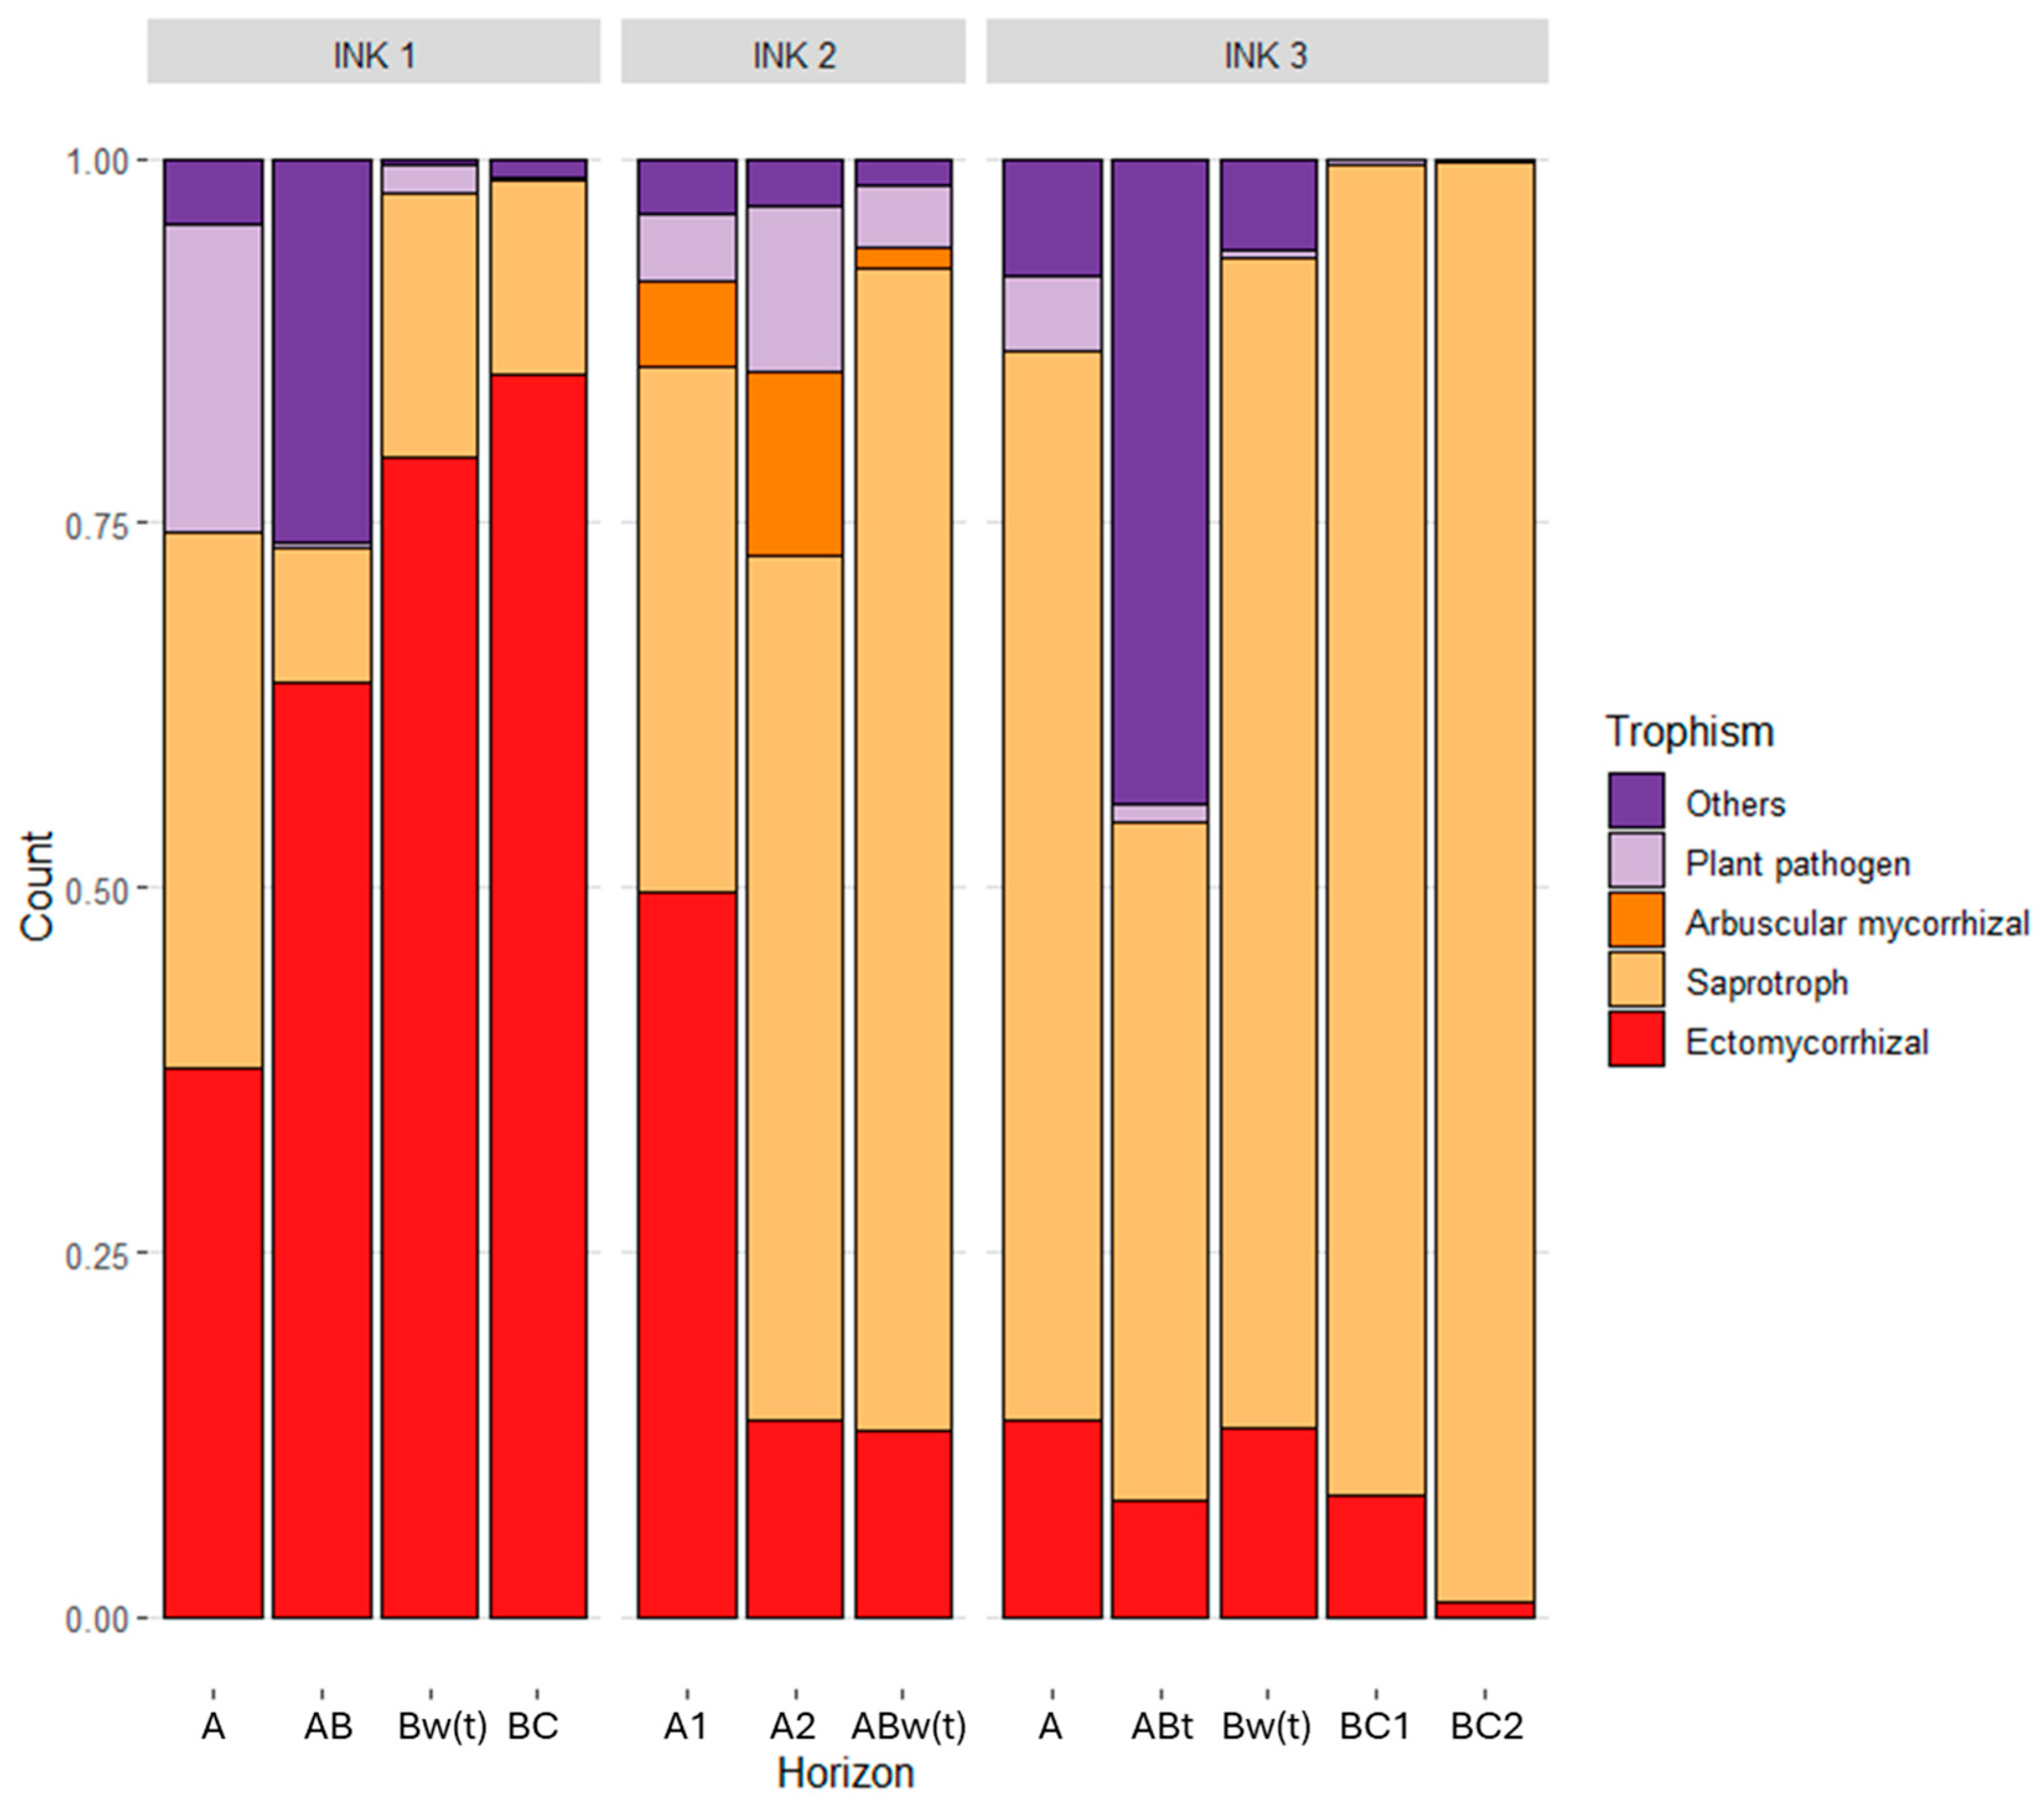
Fungal communities were further analyzed at the genus level to assess trophic strategies (Figure 8). In the mineral horizons of INK1, ectomycorrhizal fungi were dominant, accounting for 36% to 82% of the total fungal community. Notable genera included Russula, Lactarius, and Lactifluus (Figure S4 of the Supplementary Materials). In contrast, INK3 was dominated by soil saprotrophs, which represented 39% to 82% of the fungal assemblage, including genera such as Geminibasidium and Saitozyma. INK2 showed an intermediate pattern: its topsoil was dominated by ectomycorrhizal fungi (48%), while the subsoil exhibited a higher abundance of soil saprotrophs (ranging from 40% to 64%).
An interesting finding was the presence of plant pathogenic fungi in the topsoil of INK1, accounting for up to 20% of the fungal community, predominantly from the genus Rhizoctonia. Similarly, plant pathogens were also found in the A2 horizons of INK2, primarily represented by the genus Bipolaris.
The distribution of mycorrhizal exploration types varied among profiles (Figure 9). In INK1, the mycorrhizal community was primarily composed of contact and medium-distance types, while short-distance types were scarce, and long-distance types were absent. In contrast, both INK2 and INK3 were characterized by a high abundance of short-distance mycorrhizae.

4. Discussion

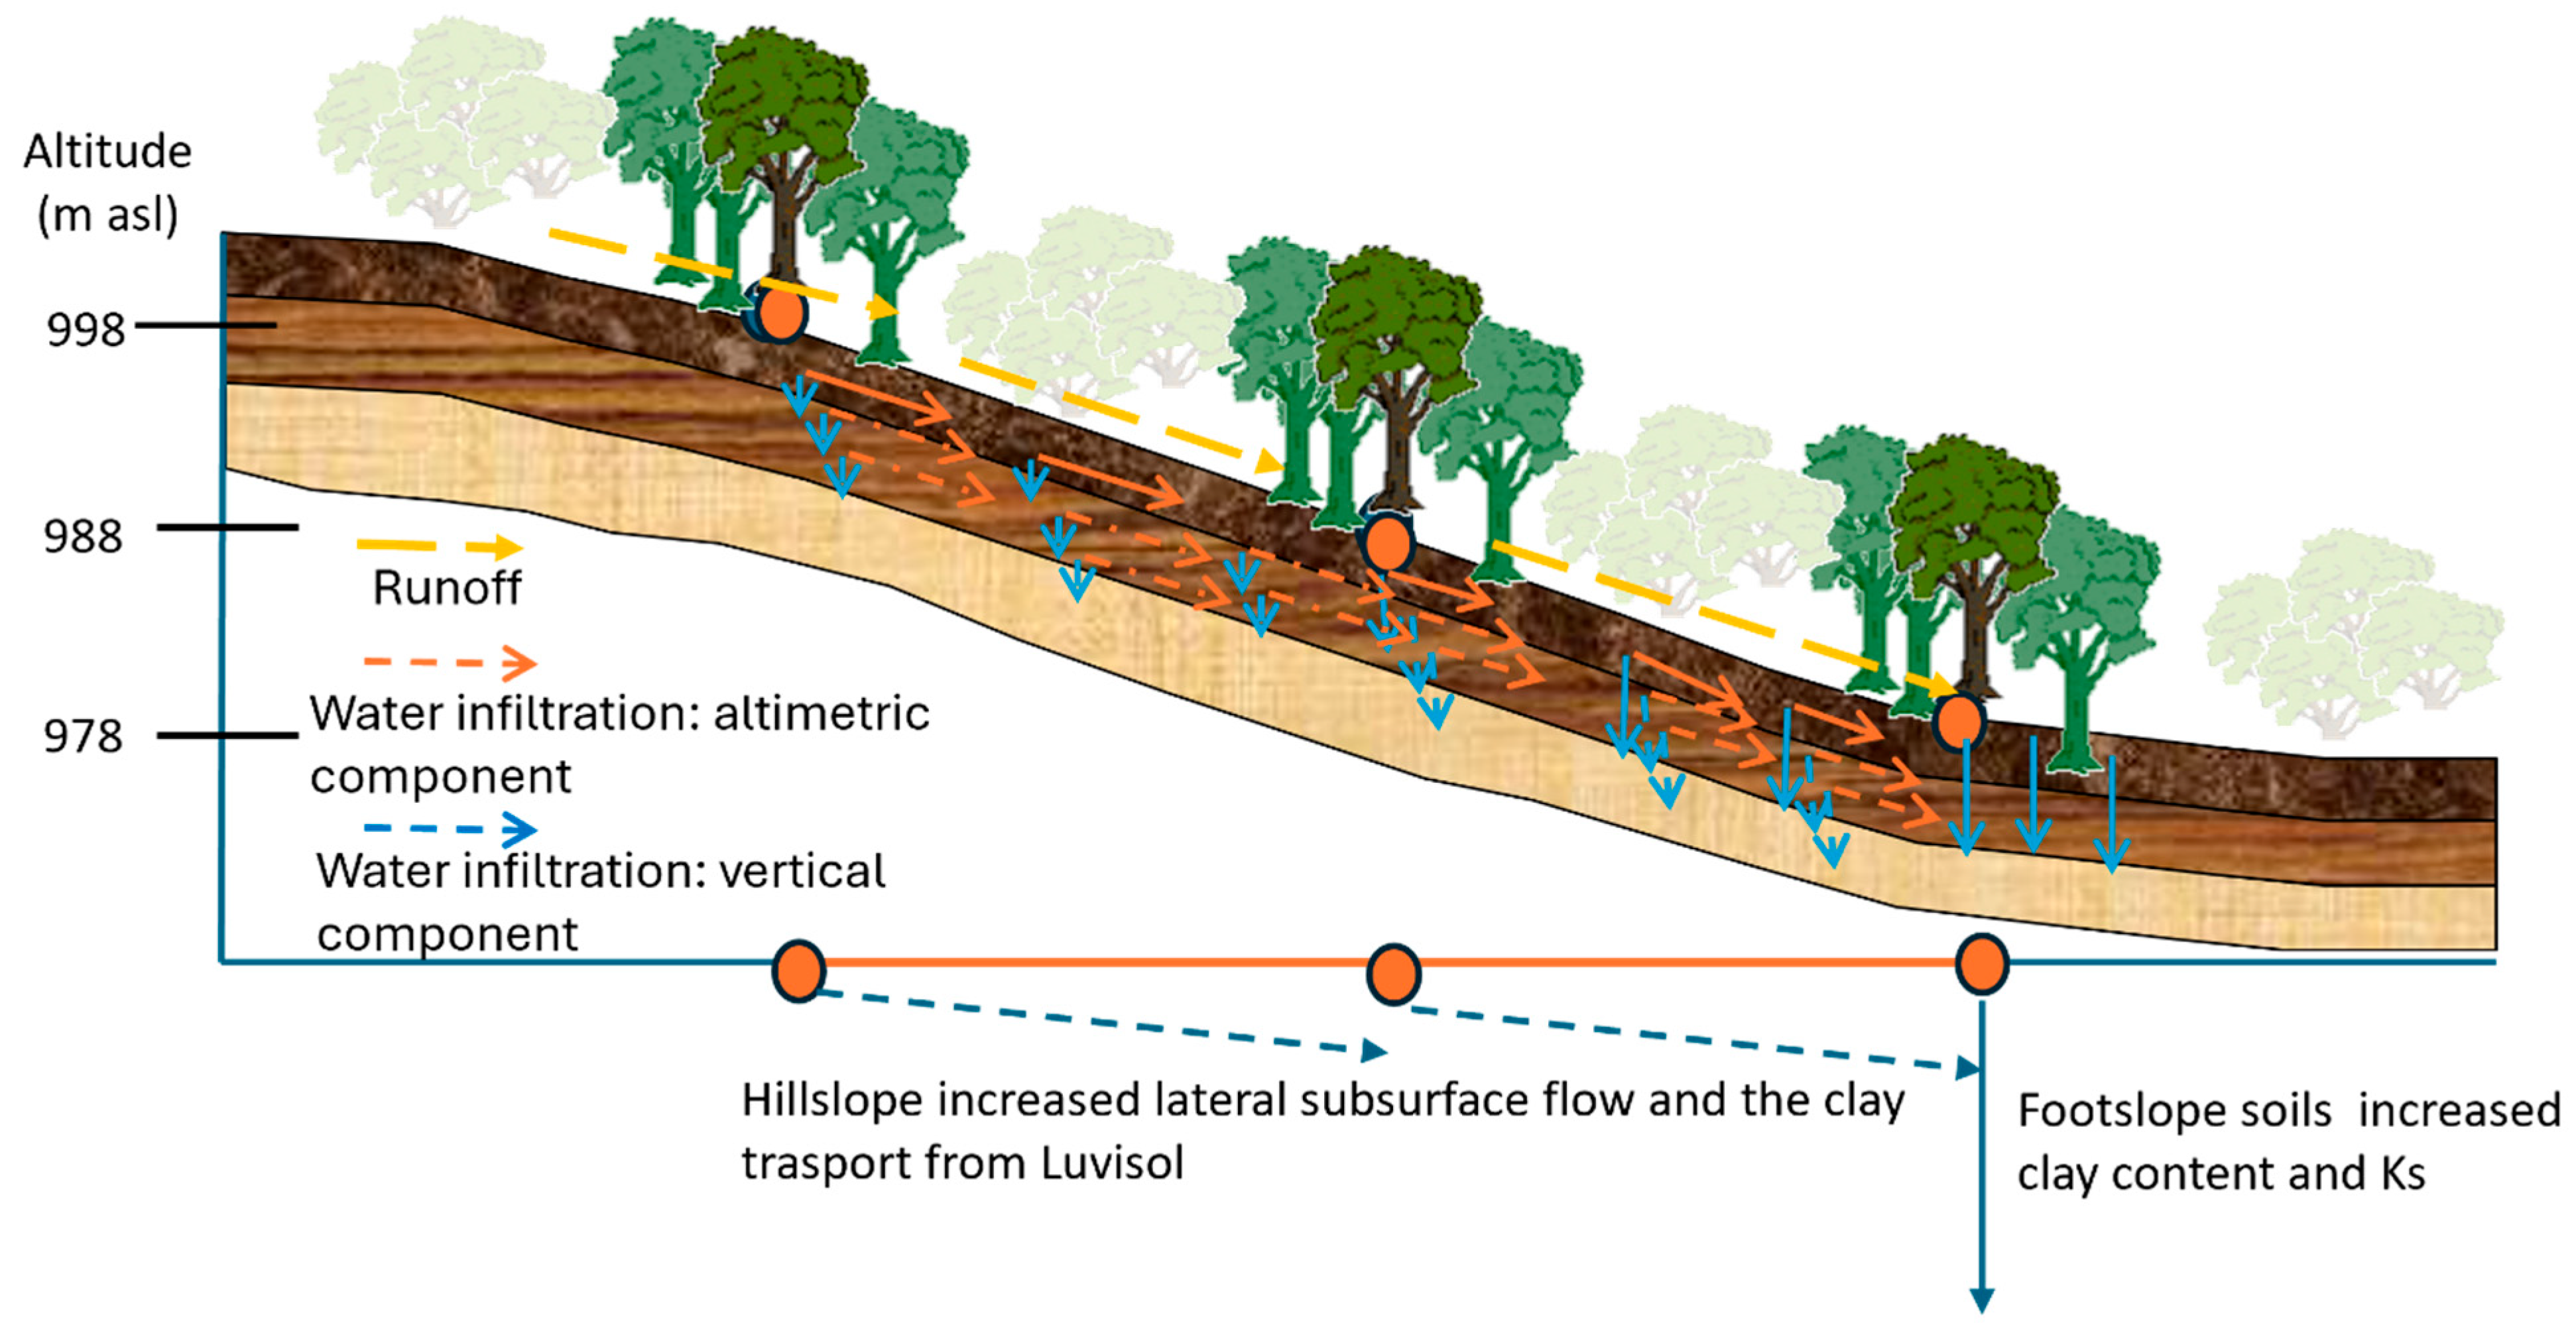
The investigated soils were classified as Luvisols [70], characterized by the mobilization and translocation of clay particles, leading to the formation of argic horizons. This process, known as lessivage, is driven by vertical water flux and facilitated by features such as cracks, pores, sandy-loam textures, organic matter content, and the presence of rock fragments [73]. Additionally, the position on the hillslope influences both vertical and lateral clay redistribution by water flow [74]. At our study site, we hypothesize that clay particles are not only vertically translocated but also move laterally, both on the surface and within the subsurface, from upslope to downslope areas during rainfall events, resulting in a general clay accumulation throughout the soil profiles of INK1 (Figure 10).
The presence of downslope water movement toward INK1 is supported by the higher saturated hydraulic conductivity (KS) observed in these soil profiles compared to the upslope profiles (INK2 and INK3), which exhibit lower KS values [75]. The steeper slope of INK3 further promotes runoff and reduces water infiltration, potentially contributing to the observed differences in horizon development. The absence of an organic horizon in INK3 and its shallow development in INK2, compared to the thicker organic horizon in INK1, supports the hypothesis of more intense runoff in the upper positions [76].
INK1 showed dystric properties in the subsoil, and its location at the footslope likely promotes clay accumulation due to both surface and subsurface lateral water movement. This accumulation may be associated with the higher KS observed in INK1 (>23 mm h−1), which enhances infiltration and leaching, resulting in lower soil pH values [77,78]. Additionally, it is plausible that the elevated KS in INK1 is partly influenced by the higher content of soil organic matter (SOM), which is known to improve soil structure, enhance macroporosity, and thus facilitate water infiltration [79,80]. The presence of organic matter promotes the formation of stable aggregates and biopores, particularly via root and microbial activity, which contributes to increased saturated hydraulic conductivity [81]. Therefore, the increase of specific enzymatic activity may reflect the microbial response to different environmental conditions and soil properties (e.g., SOM and clay content, water retention, pH) established according to the slope aspect and position [41].
The development of Phytophthora-related symptoms appears influenced by topographic position, as suggested by previous studies [82]. The clay content and water infiltration in INK1, evidenced by the presence of redoximorphic features in the AB horizon, indicate sustained moist conditions [83,84]. Such conditions support the survival and activity of Phytophthora, consistent with other findings [85,86]. Phytophthora DNA was detected in the BC horizon of INK1, despite its known short persistence in soil [87].
The elevated WEOC content in INK1 could be related to root exudation stimulated by pathogen infection [88,89,90]. Pathogen-induced changes in plant metabolism may alter the carbon-to-nitrogen ratio of the soluble organic matter, as reflected in the increased WEOC:WEN ratio observed. This suggests lower nitrogen availability, potentially affecting both plant and microbial communities. Pathogens may also induce the rhizodeposition of carbon-rich metabolites, such as phenolics [91,92], further increasing WEOC levels. Alternatively, the elevated WEOC could result from greater soil moisture [93,94,95].
Soil microbial activity generally increases in response to available carbon [96], but limited nitrogen availability may lead to microbial nitrogen immobilization. In this study, nitrogen deficiency in chestnut trees may be partially explained by this process. The microbial community composition in INK1, characterized by a reduced presence of nitrifying taxa such as Nitrospirota, reflects changes in nitrogen cycling. Nitrospirota, sensitive to pH and nutrient availability, are involved in nitrite and complete ammonia oxidation [97]. The decline in pH and altered edaphic conditions may also explain the increased abundance of Acidobacteriota in the deeper horizons of INK1, as these bacteria are adapted to acidic, nutrient-poor environments [98]. This highlights the need to evaluate microbial vertical distribution to better understand soil functioning [99,100,101].
Consistent with other studies [102,103], the dominant bacterial phyla included Acidobacteria, Proteobacteria, Verrucomicrobiota, and Actinobacteria. Significant shifts were observed in INK1, where Acidobacteriota dominated the deeper horizons. These microbial shifts, along with the detection of Phytophthora in INK1, correlate with increased specific enzyme activities, indicating a physiological adaptation rather than a biomass increase [104]. Hydrolytic enzyme activity is influenced by substrate availability and microbial composition [105,106]. The specific enzymatic activity, calculated per unit of organic carbon, allows comparison among horizons and profiles [107].
The elevated hydrolytic activity observed in deeper INK1 horizons, where Phytophthora was present and soil properties altered, suggests that microbial communities maintain nutrient cycling functions despite stress conditions. The higher SEI/OC values in INK1, especially in the AB and Bw(t) horizons, suggest increased metabolic activity in response to the presence of Phytophthora and altered soil characteristics. This may indicate a shift in microbial functional strategies and ecosystem equilibrium [108]. Given the central role of fungi in soil organic matter decomposition [109], shifts in fungal communities likely influenced enzyme dynamics.
We observed changes in fungal trophic strategies and mycorrhizal exploration types in INK1. Our findings align with previous studies indicating a positive correlation between soil moisture and ectomycorrhizal growth [110,111].
Increased water infiltration appears to enhance both pathogen proliferation (e.g., Rhizoctonia spp. In the A horizon) and ectomycorrhizal activity. Ectomycorrhizal fungi, known to offer protection against Phytophthora [112,113,114], were more abundant in INK1 subsoil. Their increased presence may reflect a compensatory mechanism in response to infection.
Variation in mycorrhizal exploration types across INK1 horizons may be driven by soil moisture and nutrient status. The dominance of contact and medium-distance types in INK1 aligns with wetter conditions, as contact exploration strategies prevail in high-moisture soils [115]. Additionally, root pathogen presence may select for these mycorrhizal types, which are more efficient at nutrient acquisition under stress. The reduced nitrogen availability in INK1 may further promote medium-distance exploration forms, better suited to acquiring labile nitrogen [116,117], compared to the short-distance forms dominating INK2 and INK3.
Although the study relied on three fully characterized soil profiles per site, two supporting auger borings were conducted nearby to verify soil morphological properties and kind of genetic horizons. These auxiliary observations confirmed the occurrence of comparable pedogenetic horizons at each site, reinforcing the representativeness of the selected profiles. Nevertheless, as the horizons within a profile are not statistically independent replicates, and site conditions may still vary locally, we acknowledge that the limited number of profiles restricts the statistical inference and generalization of our results [118,119]. However, the sampling by pedogenic horizon, together with the integration of physicochemical, microbiological, and molecular data, provides a robust exploratory framework. This study may therefore serve as a conceptual and methodological basis for future research involving replicated designs.

5. Conclusions

This study explored the relationships between soil morphological properties, microbial communities, and the incidence of ink disease in a chestnut grove located in a mountainous area of the northern Apennines. By combining soil field morphological and physicochemical characterization with microbial community profiling and extracellular enzyme assays, we identified clear differences among three soil profiles situated along a hillslope gradient. The soil profiles located in the footslope position (INK1) was characterized by higher both clay and organic C content, greater moisture retention, and reduced ectomycorrhizal diversity, coinciding with the presence of Phytophthora DNA and foliar nutrient deficiencies in overlying trees.
Our findings suggest that soil-forming factors related to slope morphology can influence both the persistence of pathogenic microorganisms and the functional structure of the soil microbiota. These interactions, in turn, affect host plant health. The study highlights the importance of integrating pedological variables into investigations of forest pathology and soil microbiology, particularly in complex topographic settings.
This work provides a replicable methodological framework for linking soil properties to plant health in forest ecosystems. Applying this approach across replicated designs in other mountainous areas may help inform targeted management strategies aimed at mitigating ink disease risk under changing climate and land-use conditions.

Supplementary Materials

The following supporting information can be downloaded at: https://www.mdpi.com/article/10.3390/app152111695/s1, Figure S1: Walter & Lieth climatic diagram of the municipality of Alto Reno Terme for the period 1991–2020. Numbers at the top indicate mean annual temperature and annual precipitation; numbers on the left indicate daily maximum average temperature of the hottest month and daily minimum average temperature of the coldest month. Plotted with R package “climatol”; Figure S2: Pictures showing symptomatic chestnut plant in INK1 study site (a), and asymptomatic chestnut plants in INK2 (b) and INK3 (c) study sites; Figure S3: Specific enzymatic activities along the horizons of soil profiles per unit of OC (a) and Cmic (b). CELL (cellulase), NAG (chitinase), BG (β-glucosidase), AG (α-glucosidase), PHOS (phosphatase), SU (sulpha tase), XY (xylase), BUT (butyrase), LAP (leucine aminopeptidase); Figure S4: Sankey diagram of the 10 most representative genera for each soil horizon and site: (a) INK1 profile, (b) INK2 profile and (c) INK3 profile; Table S1: Physicochemical characteristics of the soil under ill chestnut plants (INK1) and healthy chestnut plants (INK2 and INK3). CEC: cation exchange capacity; Caexch: exchangeable Ca; BS: base saturation; BD: bulk density; Table S2: Hydraulic properties of the soil under ill chestnut plants (INK1) and healthy chestnut plants (INK2 and INK3). THS: water content at saturation; FC: water content at field capacity = −33 kPa; WP: water content at permanent wilting point = −1500 kPa; AWC: available water capacity; KS: saturated hydraulic conductivity; Table S3: Values of properties related to organic matter in the soil under ill chestnut plants (INK1) and healthy chestnut plants (INK2 and INK3). OC: soil organic carbon; TN: total nitrogen; Cmic: microbial bimass-C; SBR: soil basal respiration; WEOC: water-extractable organic carbon; WEN: water-extractable nitrogen; Table S4: Enzimatic activities in the soil under ill chestnut plants (INK1) and healthy chestnut plants (INK2 and INK3). CELL (cellulase), NAG (chitinase), BG (β-glucosidase), AG (α-glucosidase), PHOS (phosphatase), SU (sulpha tase), XY (xylase), BUT (butyrase), LAP (leucine aminopeptidase), SEI (Synthetic Enzymes Index); OC (organic C); Cmic (microbial biomass-C).

Author Contributions

Conceptualization, L.V.A.; formal analysis, W.T., F.P. and L.V.A.; investigation, W.T., M.D.F., F.P. and R.M.; data curation, W.T. and L.V.A.; writing—original draft preparation, M.D.F. and F.P.; writing—review and editing, M.D.F., G.T., F.G., S.M. (Sergio Murolo), S.M. (Sara Marinari) and L.V.A.; supervision, A.Z., F.G. and L.V.A.; funding acquisition, L.V.A. All authors have read and agreed to the published version of the manuscript.

Funding

This research was funded under the National Recovery and Resilience Plan (NRRP), Mission 4 Component 2 Investment 1.4—Call for tender No. 3138 of 16 December 2021, rectified by Decree n.3175 of 18 December 2021 of Italian Ministry of University and Research funded by the European Union—NextGenerationEU; Project code CN_00000033, Concession Decree No. 1034 of 17 June 2022 adopted by the Italian Ministry of University and Research, CUPJ33C22001190001, Project title “National Biodiversity Future Center—NBFC”.

Institutional Review Board Statement

Not applicable.

Informed Consent Statement

Not applicable.

Data Availability Statement

The datasets used and/or analyzed during the current study are available from the corresponding author on reasonable request.

Acknowledgments

We would like to thank Hugo Ludlam for his thorough English editing of the entire manuscript.

Conflicts of Interest

The authors declare no conflicts of interest.

Appendix A. Soil Physicochemical Analyses

The cation exchange capacity (CEC) and the exchangeable cations contents were determined according to the method proposed by Orsini and Rèmy [120] and modified by Ciesielski and Sterckeman [121] using 0.017 M hexamine cobalt(III) chloride as the extracting solution, and the amounts of Co and exchangeable cations were measured by an inductively coupled plasma optical emission spectrometer (ICP–OES, Ametek, Spectro Arcos, Kleve, Germany).
Microbial biomass C and N were estimated by the fumigation–extraction method using 0.5 M K2SO4 as the extracting solution. Specifically, for each sample, 10 g of 2 mm air-dried soil was adjusted to 50% of field capacity and pre-incubated for 5 days. The soil samples were fumigated with CHCl3 for 24 h at 25 °C. After, the fumigated and non-fumigated samples were mixed with 40 mL 0.5 M K2SO4 for 30 min on a horizontal shaker. The suspensions were filtered through a 0.45 µm membrane filter, and C and N contents in the filtered solution were determined by a TOC–V CPN total organic carbon analyzer (Shimadzu, Kyoto, Japan). The microbial biomass C was calculated as EC/kEC, where EC = (organic C extracted from fumigated soils) − (organic C extracted from non-fumigated soils) and kEC = 0.45. Microbial biomass N was calculated as EN/kEN, where EN = (total N extracted from fumigated soils) − (total N extracted from non-fumigated soils) and kEN = 0.54.
C and N inside the filtered solution obtained from non-fumigated soil samples were considered as water-extractable organic C (WEOC) and water-extractable N (WEN).
Basal respiration was determined by quantifying the CO2 released in the process of microbial respiration during 28 days of incubation at 25 °C after conditioning of the samples at 50% of their field capacity and a pre-incubation of 5 days. In particular, 10 g of 2 mm air-dried soil sample was placed in 0.5 L jars with hermetic lids and after 1–3–7–10–14–21–28 days from the beginning of incubation, the amount of CO2 emitted from incubated soils was measured by alkali (1 M NaOH solution) absorption of the evolved CO2 and titration of the residual OH– with a standardized HCl solution. The soil basal respiration (BR) of each soil sample was calculated as the average of the values measured during the incubation period.

References

  1. Corona, P.; Calvani, P.; Mugnozza, G.S.; Pompei, E. Modelling natural forest expansion on a landscape level by multinomial logistic regression. Plant Biosyst. 2008, 142, 509–517. [Google Scholar] [CrossRef]
  2. Venanzi, R.; Picchio, R.; Piovesan, G. Silvicultural and logging impact on soil characteristics in Chestnut (Castanea sativa Mill.) Mediterranean coppice. Ecol. Eng. 2016, 92, 82–89. [Google Scholar] [CrossRef]
  3. Fernandes, P.; Colavolpe, M.B.; Serrazina, S.; Costa, R.L. European and American chestnuts: An overview of the main threats and control efforts. Front. Plant. Sci. 2022, 13, 951844. [Google Scholar] [CrossRef]
  4. EC. Interpretation Manual of European Union Habitats. 1 January 2007. Available online: https://eunis.eea.europa.eu/references/1271 (accessed on 16 January 2025).
  5. Buckley, P. Coppice restoration and conservation: A European perspective. J. For. Res. 2020, 2, 125–133. [Google Scholar] [CrossRef]
  6. Gullino, P.; Mellano, M.G.; Beccaro, G.L.; Devecchi, M.; Larcher, F. Strategies for the management of traditional chestnut landscapes in Pesio Valley, Italy: A participatory approach. Land 2020, 9, 536. [Google Scholar] [CrossRef]
  7. Maresi, G.; Oliveira Longa, C.M.; Turchetti, T. Brown rot on nuts of Castanea sativa Mill: An emerging disease and its causal agent. IForest 2013, 6, 294–301. [Google Scholar] [CrossRef]
  8. Murolo, S.; Bertoldi, D.; Pedrazzoli, F.; Mancini, M.; Romanazzi, G.; Maresi, G. New symptoms in Castanea sativa stands in Italy: Chestnut mosaic virus and nutrient deficiency. Forests 2022, 13, 1894. [Google Scholar] [CrossRef]
  9. Prospero, S.; Heinz, M.; Augustiny, E.; Chen, Y.Y.; Engelbrecht, J.; Fonti, M.; Hoste, A.; Ruffner, B.; Sigrist, R.; van den Berg, N.; et al. Distribution, causal agents, and infection dynamic of emerging ink disease of sweet chestnut in Southern Switzerland. Environ. Microbiol. 2023, 25, 2250–2265. [Google Scholar] [CrossRef] [PubMed]
  10. Jung, T.; Pérez-Sierra, A.; Durán, A.; Jung, M.H.; Balci, Y.; Scanu, B. Canker and decline diseases caused by soil- and airborne Phytophthora species in forests and woodlands. Persoonia Mol. Phylogeny Evol. Fungi 2018, 40, 182–220. [Google Scholar] [CrossRef]
  11. Brasier, C.M.; Robredo, F.; Ferraz, J.F.P. Evidence for Phytophthora cinnamomi involvement in Iberian oak decline. Plant Pathol. 1993, 42, 140–145. [Google Scholar] [CrossRef]
  12. Davison, E.M. The role of waterlogging and Phytophthora cinnamomi in the decline and death of Eucalyptus marginata in Western Australia. GeoJournal 1988, 17, 239–244. [Google Scholar] [CrossRef]
  13. Jung, T.; Blaschke, H. Phytophthora root rot in declining forest trees. Phyton 1996, 36, 95–102. [Google Scholar]
  14. Jung, T.; Vettraino, A.M.; Cech, T.; Vannini, A. The impact of invasive Phytophthora species on European forests. In Phytophthora: A Global Perspective; CABI: Wallingford, UK, 2013; pp. 146–158. [Google Scholar]
  15. Peterson, E.; Hansen, E.; Hulbert, J. Source or sink? The role of soil and water borne inoculum in the dispersal of Phytophthora ramorum in Oregon tanoak forests. For. Ecol. Manag. 2014, 322, 48–57. [Google Scholar] [CrossRef]
  16. Vannini, A.; Natili, G.; Thomidis, T.; Belli, C.; Morales-Rodriguez, C. Anthropogenic and landscape features are associated with ink disease impact in Central Italy. For. Pathol. 2021, 51, e12722. [Google Scholar] [CrossRef]
  17. Anselmi, N.; Vettraino, A.M.; Franco, S.; Chiarot, E.; Vannini, A. Recrudescenze del “Mal dell’Inchiostro” del castagno in Italia: Nuove acquisizioni e suggerimenti di lotta. Linea Ecol. 1999, 28, 53–58. (In Italian) [Google Scholar]
  18. Martins, L.; Castro, J.; Macedo, W.; Marques, C.; Abreu, C. Assessment of the spread of chestnut Ink disease using remote sensing and geostatistical methods. Eur. J. Plant Pathol. 2007, 119, 159–164. [Google Scholar] [CrossRef]
  19. Fonseca, T.F.; Abreu, C.G.; Parresol, B.R. Soil compaction and chestnut ink disease. For. Pathol. 2004, 34, 273–283. [Google Scholar] [CrossRef]
  20. Martins, L.M.; Oliveira, M.T.; Abre, C.G. Soils and climatic characteristic of chestnut stands that differ in the presence of the Ink disease. Acta Hortic. 1999, 494, 447–449. [Google Scholar] [CrossRef]
  21. Liang, W.; Li, S.; Hung, F. Analysis of the contributions of topographic, soil, and vegetation features on the spatial distributions of surface soil moisture in a steep natural forested headwater catchment. Hydrol. Process. 2017, 31, 3796–3809. [Google Scholar] [CrossRef]
  22. Ribolzi, O.; Patin, J.; Bresson, L.; Latsachack, K.; Mouche, E.; Sengtaheuanghoung, O.; Silvera, N.; Thiébaux, J.P.; Valentin, C. Impact of slope gradient on soil surface features and infiltration on steep slopes in northern Laos. Geomorphology 2011, 127, 53–63. [Google Scholar] [CrossRef]
  23. Davison, E.M. How do Phytophthora spp. de Bary kill trees. N. Z. J. For. Sci. 2011, 41, 25–37. [Google Scholar]
  24. Corcobado, T.; Solla, A.; Madeira, M.A.; Moreno, G. Combined effects of soil properties and Phytophthora cinnamomi infections on Quercus ilex decline. Plant Soil 2013, 373, 403–413. [Google Scholar] [CrossRef]
  25. Lin, H.S.; Kogelmann, W.; Walker, C.; Bruns, M.A. Soil moisture patterns in a forested catchment: A hydropedological perspective. Geoderma 2006, 131, 345–368. [Google Scholar] [CrossRef]
  26. Tromp-van Meerveld, H.J.; McDonnell, J.J. On the interrelations between topography, soil depth, soil moisture, transpiration rates and species distribution at the hillslope scale. Adv. Water Resour. 2006, 29, 293–310. [Google Scholar] [CrossRef]
  27. Ribeiro, O.K. A source book of the genus Phytophthora. Mycologia 1979, 71, 460. [Google Scholar] [CrossRef]
  28. Tsao, P.H. Why many phytophthora root rots and crown rots of tree and horticultural crops remain undetected. EPPO Bull. 1990, 20, 11–17. [Google Scholar] [CrossRef]
  29. Marzocchi, G.; Maresi, G.; Luchi, N.; Pecori, F.; Gionni, A.; Longa, C.M.O.; Pezzi, G.; Ferretti, F. 85 Years counteracting an invasion: Chestnut ecosystems and landscapes survival against Ink disease. Biol. Invasions 2024, 26, 2049–2062. [Google Scholar] [CrossRef]
  30. Jiao, S.; Chen, W.; Wang, J.; Du, N.; Li, Q.; Wei, G. Soil microbiomes with distinct assemblies through vertical soil profiles drive the cycling of multiple nutrients in reforested ecosystems. Microbiome 2018, 6, 146. [Google Scholar] [CrossRef]
  31. Mendes, R.; Kruijt, M.; de Bruijn, I.; Dekkers, E.; van der Voort, M.; Schneider, J.H.M.; Piceno, Y.M.; DeSantis, T.Z.; Andersen, G.L.; Bakker, P.A.H.M.; et al. Deciphering the Rhizosphere Microbiome for Disease-Suppressive Bacteria. Science 2011, 332, 1097–1100. [Google Scholar] [CrossRef] [PubMed]
  32. Piotrowska-Długosz, A.; Długosz, J.; Frąc, M.; Gryta, A.; Breza-Boruta, B. Enzymatic activity and functional diversity of soil microorganisms along the soil profile—A matter of soil depth and soil-forming processes. Geoderma 2022, 416, 115779. [Google Scholar] [CrossRef]
  33. Banerjee, S.; van der Heijden, M.G.A. Soil microbiomes and one health. Nat. Rev. Microbiol. 2023, 21, 6–20. [Google Scholar] [CrossRef]
  34. Kirk, J.L.; Beaudette, L.A.; Hart, M.; Moutoglis, P.; Klironomos, J.N.; Lee, H.; Trevors, J.T. Methods of studying soil microbial diversity. J. Microbiol. Methods 2004, 58, 169–188. [Google Scholar] [CrossRef]
  35. Burns, R.G.; DeForest, J.L.; Marxsen, J.; Sinsabaugh, R.L.; Stromberger, M.E.; Wallenstein, M.D.; Weintraub, M.N.; Zoppini, A. Soil enzymes in a changing environment: Current knowledge and future directions. Soil Biol. Biochem. 2013, 58, 216–234. [Google Scholar] [CrossRef]
  36. Zuccarini, P.; Asensio, D.; Ogaya, R.; Sardans, J.; Peñuelas, J. Effects of seasonal and decadal warming on soil enzymatic activity in a P-deficient Mediterranean shrubland. Glob. Change Biol. 2020, 26, 3698–3714. [Google Scholar] [CrossRef]
  37. Fanin, N.; Mooshammer, M.; Sauvadet, M.; Meng, C.; Alvarez, G.; Bernard, L.; Bertrand, I.; Blagodatskaya, E.; Bon, L.; Fontaine, S.; et al. Soil enzymes in response to climate warming: Mechanisms and feedbacks. Funct. Ecol. 2022, 36, 1378–1395. [Google Scholar] [CrossRef]
  38. Bhaduri, D.; Sihi, D.; Bhowmik, A.; Verma, B.C.; Munda, S.; Dari, B. A review on effective soil health bio-indicators for ecosystem restoration and sustainability. Front. Microbiol. 2022, 13, 938481. [Google Scholar] [CrossRef]
  39. Vázquez, E.; Benito, M.; Espejo, R.; Teutscherova, N. Response of soil properties and microbial indicators to land use change in an acid soil under Mediterranean conditions. Catena 2020, 189, 104486. [Google Scholar] [CrossRef]
  40. Moscatelli, M.C.; Secondi, L.; Marabottini, R.; Papp, R.; Stazi, S.R.; Mania, E.; Marinari, S. Assessment of soil microbial functional diversity: Land use and soil properties affect CLPP-MicroResp and enzymes responses. Pedobiologia 2018, 66, 36–42. [Google Scholar] [CrossRef]
  41. Wang, M.; Ji, L.; Shen, F.; Meng, J.; Wang, J.; Shan, C.; Yang, L. Differential responses of soil extracellular enzyme activity and stoichiometric ratios under different slope aspects and slope positions in Larix olgensis plantations. Forests 2022, 13, 845. [Google Scholar] [CrossRef]
  42. Huang, Y.-M.; Liu, D.; An, S.-S. Effects of slope aspect on soil nitrogen and microbial properties in the Chinese Loess region. Catena 2015, 125, 135–145. [Google Scholar] [CrossRef]
  43. Li, T.; Liang, J.; Chen, X.; Wang, H.; Zhang, S.; Pu, Y.; Xu, X.; Li, H.; Xu, J.; Wu, X.; et al. The interacting roles and relative importance of climate, topography, soil properties and mineralogical composition on soil potassium variations at a national scale in China. Catena 2021, 196, 104875. [Google Scholar] [CrossRef]
  44. Xu, Z.; Yu, G.; Zhang, X.; Ge, J.; He, N.; Wang, Q.; Wang, D. The variations in soil microbial communities, enzyme activities and their relationships with soil organic matter decomposition along the northern slope of Changbai Mountain. Appl. Soil Ecol. 2015, 86, 19–29. [Google Scholar] [CrossRef]
  45. Rete Rurale Nazionale: La Corona di Matilde. Alto Reno. Terra di Castagni. 2023. Available online: https://www.reterurale.it/flex/cm/pages/ServeBLOB.php/L/IT/IDPagina/23098 (accessed on 16 January 2025). (In Italian).
  46. Vittori Antisari, L.; Trenti, W.; Buscaroli, A.; Falsone, G.; Vianello, G.; De Feudis, M. Pedodiversity and organic matter stock of soils developed on sandstone formations in the Northern Apennines (Italy). Land 2023, 12, 79. [Google Scholar] [CrossRef]
  47. Schoeneberger, P.J.; Wysocki, D.A.; Benham, E.C. Soil Survey Staff: Field Book for Describing and Sampling Soils, Version 3.0; US Department of Agriculture, Natural Resources Conservation Service, National Soil Survey Center: Lincoln, NE, USA, 2012.
  48. Cambardella, C.A.; Moorman, T.B.; Novak, J.M.; Parkin, T.B.; Karlen, D.L.; Turco, R.F.; Konopka, A.E. Field-scale variability of soil properties in Central Iowa soils. Soil Sci. Soc. Am. J. 1994, 58, 1501–1511. [Google Scholar] [CrossRef]
  49. Pätzold, S.; Mertens, F.M.; Bornemann, L.; Koleczek, B.; Franke, J.; Feilhauer, H.; Welp, G. Soil heterogeneity at the field scale: A challenge for precision crop protection. Precis. Agric. 2008, 9, 367–390. [Google Scholar] [CrossRef]
  50. Türkeş, M.; Dede, V.; Dengiz, O.; Şenol, H.; Serin, S. Periglacial landforms and soil formation on summit of the mount lda (Kaz Dağı), Biga peninsula-Turkey. Phys. Geogr. 2023, 44, 531–580. [Google Scholar] [CrossRef]
  51. Liu, H.; Zhang, J.; Liao, A.; Liu, C.; Du, M.; Huang, A.; Guo, J. Estimation of variability in soil water content in a forested critical-zone experimental catchment in Eastern China. J. Contam. Hydrol. 2022, 248, 104022. [Google Scholar] [CrossRef]
  52. Thompson, S.E.; Katul, G.G.; Porporato, A. Role of microtopography in rainfall-runoff partitioning: An analysis using idealized geometry. Water Resour. Res. 2010, 46, W07520. [Google Scholar] [CrossRef]
  53. Oueslati, I.; Allamano, P.; Bonifacio, E.; Claps, P. Vegetation and topographic control on spatial variability of soil organic carbon. Pedosphere 2013, 23, 48–58. [Google Scholar] [CrossRef]
  54. Seibert, J.; Stendahl, J.; Sørensen, R. Topographical influences on soil properties in boreal forests. Geoderma 2007, 141, 139–148. [Google Scholar] [CrossRef]
  55. Vittori Antisari, L.; Papp, R.; Vianello, G.; Marinari, S. Effects of Douglas fir stand age on soil chemical properties, nutrient dynamics, and enzyme activity: A case study in Northern Apennines, Italy. Forests 2018, 9, 641. [Google Scholar] [CrossRef]
  56. Gee, G.W.; Bauder, J.W. Methods of Soil Analysis: Part 1—Physical and Mineralogical Methods; SSSA Book Series; Soil Science Society of America, American Society of Agronomy: Madison, WI, USA, 1986. [Google Scholar]
  57. De Feudis, M.; Falsone, G.; Vianello, G.; Vittori Antisari, L. The conversion of abandoned chestnut forests to managed ones does not affect the soil chemical properties and improves the soil microbial biomass activity. Forests 2020, 11, 786. [Google Scholar] [CrossRef]
  58. Marx, M.C.; Wood, M.; Jarvis, S.C. A microplate fluorimetric assay for the study of enzyme diversity in soils. Soil Biol. Biochem. 2001, 33, 1633–1640. [Google Scholar] [CrossRef]
  59. Vepsäläinen, M.; Kukkonen, S.; Vestberg, M.; Sirviö, H.; Maarit Niemi, R. Application of soil enzyme activity test kit in a field experiment. Soil Biol. Biochem. 2001, 33, 1665–1672. [Google Scholar] [CrossRef]
  60. García-López, J.D.; Barbieri, F.; Baños, A.; Madero, J.M.G.; Gardini, F.; Montanari, C.; Tabanelli, G. Use of two autochthonous bacteriocinogenic strains as starter cultures in the production of salchichónes, a type of Spanish fermented sausages. Curr. Res. Food. Sci. 2023, 7, 100615. [Google Scholar] [CrossRef]
  61. Gardes, M.; Bruns, T.D. ITS primers with enhanced specificity for basidiomycetes-application to the identification of mycorrhizae and rusts. Mol. Ecol. 1993, 2, 113–118. [Google Scholar] [CrossRef]
  62. White, T.J.; Bruns, T.; Lee, S.; Taylor, J. Amplification and direct sequencing of fungal ribosomal RNA genes for phylogenetics. PCR Protoc. 1990, 18, 315–322. [Google Scholar]
  63. Wood, D.E.; Lu, J.; Langmead, B. Improved metagenomic analysis with Kraken 2. Genome Biol. 2019, 20, 257. [Google Scholar] [CrossRef]
  64. Lu, J.; Breitwieser, F.P.; Thielen, P.; Salzberg, S.L. Bracken: Estimating species abundance in metagenomics data. PeerJ Comput. Sci. 2017, 3, e104. [Google Scholar] [CrossRef]
  65. Põlme, S.; Abarenkov, K.; Henrik Nilsson, R.; Lindahl, B.D.; Clemmensen, K.E.; Kauserud, H.; Nguyen, N.; Kjøller, R.; Bates, S.T.; Baldrian, P.; et al. FungalTraits: A user-friendly traits database of fungi and fungus-like stramenopiles. Fungal Divers. 2020, 105, 1–16. [Google Scholar] [CrossRef]
  66. Burgess, T.I.; White, D.; Sapsford, S.J. Comparison of primers for the detection of Phytophthora (and Other Oomycetes) from environmental samples. J. Fungi 2022, 8, 980. [Google Scholar] [CrossRef]
  67. Carini, P.; Marsden, P.J.; Leff, J.W.; Morgan, E.E.; Strickland, M.S.; Fierer, N. Relic DNA is abundant in soil and obscures estimates of soil microbial diversity. Nat. Microbiol. 2017, 2, 16242. [Google Scholar] [CrossRef]
  68. Levy-Booth, D.J.; Campbell, R.G.; Gulden, R.H.; Hart, M.M.; Powell, J.R.; Klironomos, J.N.; Pauls, K.P.; Swanton, C.J.; Trevors, J.T.; Dunfield, K.E. Cycling of extracellular DNA in the soil environment. Soil Biol. Biochem. 2007, 39, 2977–2991. [Google Scholar] [CrossRef]
  69. Szabó, B.; Weynants, M.; Weber, T.K.D. Updated European hydraulic pedotransfer functions with communicated uncertainties in the predicted variables (euptfv2). Geosci. Model Dev. 2021, 14, 151–175. [Google Scholar] [CrossRef]
  70. Naseri, M.; Peters, A.; Durner, W.; Iden, S.C. Effective hydraulic conductivity of stony soils: General effective medium theory. Adv. Water Resour. 2020, 146, 103765. [Google Scholar] [CrossRef]
  71. IUSS Working Group WRB. World Reference Base for Soil Resources. International Soil Classification System for Naming Soils and Creating Legends for Soil Maps, 4th ed.; International Union of Soil Sciences (IUSS): Vienna, Austria, 2022. [Google Scholar]
  72. Soil Survey Staff. Keys to Soil Taxonomy; USDA-Natural Resources Conservation Service: Washington, DC, USA, 2022.
  73. Quénard, L.; Samouëlian, A.; Laroche, B.; Cornu, S. Lessivage as a major process of soil formation: A revisitation of existing data. Geoderma 2011, 167, 135–147. [Google Scholar] [CrossRef]
  74. Krevh, V.; Groh, J.; Weihermüller, L.; Filipović, L.; Defterdarović, J.; Kovač, Z.; Magdić, I.; Lazarević, B.; Baumgartl, T.; Filipović, V. Investigation of hillslope vineyard soil water dynamics using field measurements and numerical modeling. Water 2023, 15, 820. [Google Scholar] [CrossRef]
  75. Zambon, N.; Johannsen, L.L.; Strauss, P.; Dostal, T.; Zumr, D.; Cochrane, T.A.; Klik, A. Splash erosion affected by initial soil moisture and surface conditions under simulated rainfall. Catena 2021, 196, 104827. [Google Scholar] [CrossRef]
  76. Berg, B.; McClaugherty, C. What factors may influence the accumulation of humus layers? In Plant Litter; Springer International Publishing: Cham, Switzerland, 2020; pp. 247–272. [Google Scholar]
  77. Jobbágy, E.G.; Jackson, R.B. Patterns and mechanisms of soil acidification in the conversion of grasslands to forests. Biogeochemistry 2003, 64, 205–229. [Google Scholar] [CrossRef]
  78. Slessarev, E.W.; Lin, Y.; Bingham, N.L.; Johnson, J.E.; Dai, Y.; Schimel, J.P.; Chadwick, O.A. Water balance creates a threshold in soil pH at the global scale. Nature 2016, 540, 567–569. [Google Scholar] [CrossRef]
  79. Minasny, B.; McBratney, A.B. Limited effect of organic matter on soil available water capacity. Eur. J. Soil Sci. 2018, 69, 39–47. [Google Scholar] [CrossRef]
  80. Hudson, B.D. Soil organic matter and available water capacity. J. Soils Water Conserv. 1994, 49, 189–194. [Google Scholar] [CrossRef]
  81. de Jonge, L.W.; Moldrup, P.; Jacobsen, O.H.; Schjønning, P. Soil infrastructure, interfaces, and translocation processes. Vadose Zone J. 2009, 8, 651–656. [Google Scholar]
  82. Vannini, A.; Natili, G.; Anselmi, N.; Montaghi, A.; Vettraino, A. Distribution and gradient analysis of ink disease in chestnut forests. For. Pathol. 2010, 40, 73–86. [Google Scholar] [CrossRef]
  83. Doro, L.; Jones, C.; Williams, J.R.; Norfleet, M.L.; Izaurralde, R.C.; Wang, X.; Jeong, J. The variable saturation hydraulic conductivity method for improving soil water content simulation in EPIC and APEX models. Vadose Zone J. 2017, 16, 1–14. [Google Scholar] [CrossRef]
  84. Mohanty, B.P.; Mousli, Z. Saturated hydraulic conductivity and soil water retention properties across a soil-slope transition. Water Resour. Res. 2000, 36, 3311–3324. [Google Scholar] [CrossRef]
  85. Gyeltshen, J.; Dunstan, W.A.; Grigg, A.H.; Burgess, T.I.; Giles, G.E. The influence of time, soil moisture and exogenous factors on the survival potential of oospores and chlamydospores of Phytophthora cinnamomi. For. Pathol. 2021, 51, e12637. [Google Scholar] [CrossRef]
  86. Rhoades, C.C.; Brosi, S.L.; Dattilo, A.J.; Vincelli, P. Effect of soil compaction and moisture on incidence of phytophthora root rot on American chestnut (Castanea dentata) seedlings. For. Ecol. Manag. 2003, 184, 47–54. [Google Scholar] [CrossRef]
  87. Kunadiya, M.B.; Burgess, T.I.; Dunstan, W.; White, D.; Giles, G.E. Persistence and degradation of Phytophthora cinnamomi DNA and RNA in different soil types. Environ. DNA 2021, 3, 92–104. [Google Scholar] [CrossRef]
  88. Lanoue, A.; Burlat, V.; Henkes, G.J.; Koch, I.; Schurr, U.; Röse, U.S.R. De novo biosynthesis of defense root exudates in response to Fusarium attack in barley. New Phytol. 2010, 185, 577–588. [Google Scholar] [CrossRef] [PubMed]
  89. Meier, I.C.; Avis, P.G.; Phillips, R.P. Fungal communities influence root exudation rates in pine seedlings. FEMS Microbiol. Ecol. 2013, 83, 585–595. [Google Scholar] [CrossRef]
  90. Preece, C.; Yang, K.; Llusià, J.; Winkler, J.B.; Schnitzler, J.P.; Peñuelas, J. Combined effects of drought and simulated pathogen attack on root exudation rates of tomatoes. Plant Soil 2024, 497, 629–645. [Google Scholar] [CrossRef]
  91. Dinis, L.T.; Peixoto, F.; Zhang, C.; Martins, L.; Costa, R.; Gomes-Laranjo, J. Physiological and biochemical changes in resistant and sensitive chestnut (Castanea) plantlets after inoculation with Phytophthora cinnamomi. Physiol. Mol. Plant Pathol. 2011, 75, 146–156. [Google Scholar] [CrossRef]
  92. Lovat, C.A.; Donnelly, D.J. Mechanisms and metabolomics of the host–pathogen interactions between Chestnut (Castanea species) and Chestnut blight (Cryphonectria parasitica). For. Pathol. 2019, 49, e12562. [Google Scholar] [CrossRef]
  93. Christ, M.J.; David, M.B. Temperature and moisture effects on the production of dissolved organic carbon in a Spodosol. Soil Biol. Biochem. 1996, 28, 1191–1199. [Google Scholar] [CrossRef]
  94. Fröberg, M.; Berggren, D.; Bergkvist, B.; Bryant, C.; Mulder, J. Concentration and fluxes of dissolved organic carbon (DOC) in three Norway spruce stands along a climatic gradient in Sweden. Biogeochemistry 2006, 77, 1–23. [Google Scholar] [CrossRef]
  95. Kaiser, K.; Kaupenjohann, M.; Zech, W. Sorption of dissolved organic carbon in soils: Effects of soil sample storage, soil-to-solution ratio, and temperature. Geoderma 2001, 99, 317–328. [Google Scholar] [CrossRef]
  96. Jansson, S.L.; Persson, J. Mineralization and immobilization of soil nitrogen. Nitrogen Agric. Soils 2015, 22, 229–252. [Google Scholar]
  97. D’Angelo, T.; Goordial, J.; Lindsay, M.R.; McGonigle, J.; Booker, A.; Moser, D.; Stepanauskus, R.; Orcutt, B.N. Replicated life-history patterns and subsurface origins of the bacterial sister phyla Nitrospirota and Nitrospinota. ISME J. 2023, 17, 891–902. [Google Scholar] [CrossRef]
  98. Kalam, S.; Basu, A.; Ahmad, I.; Sayyed, R.Z.; El-Enshasy, H.A.; Dailin, D.J.; Suriani, N.L. Recent understanding of soil Acidobacteria and their ecological significance: A critical review. Front. Microbiol. 2020, 11, 2712. [Google Scholar] [CrossRef]
  99. Maitra, P.; Hrynkiewicz, K.; Szuba, A.; Jagodziński, A.M.; Al-Rashid, J.; Mandal, D.; Mucha, J. Metabolic niches in the rhizosphere microbiome: Dependence on soil horizons, root traits and climate variables in forest ecosystems. Front. Plant Sci. 2024, 15, 1344205. [Google Scholar] [CrossRef]
  100. Naylor, D.; McClure, R.; Jansson, J. Trends in microbial community composition and function by soil depth. Microorganisms 2022, 10, 540. [Google Scholar] [CrossRef]
  101. Carteron, A.; Beigas, M.; Joly, S.; Turner, B.L.; Laliberté, E. Temperate forests dominated by arbuscular or ectomycorrhizal fungi are characterized by strong shifts from saprotrophic to mycorrhizal fungi with increasing soil depth. Microb. Ecol. 2021, 82, 377–390. [Google Scholar] [CrossRef]
  102. Dukunde, A.; Schneider, D.; Schmidt, M.; Veldkamp, E.; Daniel, R. Tree species shape soil bacterial community structure and function in temperate deciduous forests. Front. Microbiol. 2019, 10, 1519. [Google Scholar] [CrossRef]
  103. López-Mondéjar, R.; Voříšková, J.; Větrovský, T.; Baldrian, P. The bacterial community inhabiting temperate deciduous forests is vertically stratified and undergoes seasonal dynamics. Soil Biol. Biochem. 2015, 87, 43–50. [Google Scholar] [CrossRef]
  104. Marinari, S.; Radicetti, E.; Petroselli, V.; Allam, M.; Mancinelli, R. Microbial indices to assess soil health under different tillage and fertilization in potato (Solanum tuberosum L.) Crop. Agriculture 2022, 12, 415. [Google Scholar] [CrossRef]
  105. Coonan, E.C.; Kirkby, C.A.; Kirkegaard, J.A.; Amidy, M.R.; Strong, C.L.; Richardson, A.E. Microorganisms and nutrient stoichiometry as mediators of soil organic matter dynamics. Nutr. Cycl. Agroecosyst. 2020, 117, 273–298. [Google Scholar] [CrossRef]
  106. Qu, Y.; Tang, J.; Li, Z.; Zhou, Z.; Wang, J.; Wang, S.; Cao, Y. Soil enzyme activity and microbial metabolic function diversity in soda Saline–Alkali rice paddy fields of northeast China. Sustainability 2020, 12, 10095. [Google Scholar] [CrossRef]
  107. Trasar-Cepeda, C.; Leirós, M.C.; Gil-Sotres, F. Hydrolytic enzyme activities in agricultural and forest soils. Some implications for their use as indicators of soil quality. Soil Biol. Biochem. 2008, 40, 2146–2155. [Google Scholar] [CrossRef]
  108. Nannipieri, P.; Giagnoni, L.; Renella, G.; Puglisi, E.; Ceccanti, B.; Masciandaro, G.; Fornasier, F.; Moscatelli, M.C.; Marinari, S. Soil enzymology: Classical and molecular approaches. Biol. Fertil. Soils 2012, 48, 743–762. [Google Scholar] [CrossRef]
  109. Frey, S.D.; Ollinger, S.; Nadelhoffer, K.; Bowden, R.; Brzostek, E.; Burton, A.; Caldwell, B.A.; Crow, S.; Goodale, C.L.; Grandy, A.S.; et al. Chronic nitrogen additions suppress decomposition and sequester soil carbon in temperate forests. Biogeochemistry 2014, 121, 305–316. [Google Scholar] [CrossRef]
  110. Castaño, C.; Alday, J.G.; Parladé, J.; Pera, J.; Martínez de Aragón, J.; Bonet, J.A. Seasonal dynamics of the ectomycorrhizal fungus Lactarius vinosus are altered by changes in soil moisture and temperature. Soil Biol. Biochem. 2017, 115, 253–260. [Google Scholar] [CrossRef]
  111. Kilpeläinen, J.; Barbero-López, A.; Vestberg, M.; Heiskanen, J.; Lehto, T. Does severe soil drought have after-effects on arbuscular and ectomycorrhizal root colonisation and plant nutrition? Plant Soil 2017, 418, 377–386. [Google Scholar] [CrossRef]
  112. Branzanti, M.B.; Rocca, E.; Pisi, A. Effect of ectomycorrhizal fungi on chestnut ink disease. Mycorrhiza 1999, 9, 103–109. [Google Scholar] [CrossRef]
  113. Corcobado, T.; Vivas, M.; Moreno, G.; Solla, A. Ectomycorrhizal symbiosis in declining and non-declining Quercus ilex trees infected with or free of Phytophthora cinnamomi. For. Ecol. Manag. 2014, 324, 72–80. [Google Scholar] [CrossRef]
  114. Scattolin, L.; Dal Maso, E.; Mutto Accordi, S.; Sella, L.; Montecchio, L. Detecting asymptomatic ink-diseased chestnut trees by the composition of the ectomycorrhizal community. For. Pathol. 2012, 42, 501–509. [Google Scholar] [CrossRef]
  115. Agerer, R. Exploration types of ectomycorrhizae. Mycorrhiza 2001, 11, 107–114. [Google Scholar] [CrossRef]
  116. Defrenne, C.E.; Philpott, T.J.; Guichon, S.H.A.; Roach, W.J.; Pickles, B.J.; Simard, S.W. Shifts in ectomycorrhizal fungal communities and exploration types relate to the environment and fine-root traits across interior douglas-fir forests of western Canada. Front. Plant. Sci. 2019, 10, 643. [Google Scholar] [CrossRef]
  117. Hobbie, E.A.; Agerer, R. Nitrogen isotopes in ectomycorrhizal sporocarps correspond to belowground exploration types. Plant Soil 2010, 327, 71–83. [Google Scholar] [CrossRef]
  118. Garten, C.T., Jr. Variability in soil properties at a landscape scale. Soil Sci. Soc. Am. J. 1993, 57, 1693–1700. [Google Scholar]
  119. Conant, R.T.; Paustian, K.; Elliott, E.T. Quantifying and reporting uncertainty in estimates of soil organic carbon stocks and changes. Soil Biol. Biochem. 2003, 35, 19–30. [Google Scholar]
  120. Orsini, L.; Rémy, J. Utilisation du chlorure de cobaltihexamine pour la détermination simultanée de la capacité d’échange et des bases échangeables des sols. Bull. l’Assoc. Fr. d’Etude Sol 1976, 4, 269–279. [Google Scholar]
  121. Ciesielski, H.; Sterckeman, T. Determination of cation exchange capacity and exchangeable cations in soils by means of cobalt hexamine trichloride. Effects of experimental conditions. Agronomie 1997, 17, 1–7. [Google Scholar]
Figure 1. Location of the study area (left) and soil sampling design along the hillslope transect (right). The areas outlined by a dashed line are the study sites INK1, INK2, and INK3. The X–Y line represents the transect across which soil profiles (orange circles) and samples were collected. While 1a, 1b, 2a, 2b, 3a, and 3b denote additional sampling points associated with each profile.
Applsci 15 11695 g001
Figure 2. Diagram of the soil profiles and their relative positions along the hillslope.
Applsci 15 11695 g002
Figure 3. Boxplots showing pH, base saturation, and clay content in soils under diseased chestnut trees (INK1) and healthy chestnut trees (INK2 and INK3). Different letters indicate significant differences (p ≤ 0.05) according to Kruskal–Wallis test.
Applsci 15 11695 g003
Figure 4. Boxplots showing the permanent wilting point (WP) and saturated hydraulic conductivity (Ks) in soils under diseased (INK1) and healthy (INK2, INK3) chestnut trees. Different letters indicate significant differences (p ≤ 0.05) based on Kruskal–Wallis test.
Applsci 15 11695 g004
Figure 5. Boxplots showing WEOC content, the WEOC:WEN ratio, and the synthetic enzymatic index (SEI/OC) in soils under diseased (INK1) and healthy (INK2 and INK3) chestnut trees. Different letters indicate significant differences (p ≤ 0.05) according to Kruskal–Wallis test. WEOC: water-extractable organic carbon; WEN: water-extractable nitrogen; SEI/OC: synthetic enzymatic index per unit of soil organic carbon.
Applsci 15 11695 g005
Figure 6. Distribution of bacterial phyla across soil horizons in profiles under diseased (INK1) and healthy (INK2 and INK3) chestnut trees. Phyla with relative abundance < 5% are grouped as “Other”.
Applsci 15 11695 g006
Figure 7. Distribution of fungal phyla across soil horizons in profiles under diseased (INK1) and healthy (INK2 and INK3) chestnut trees. Phyla with relative abundance < 5% are grouped as “Other”.
Applsci 15 11695 g007
Figure 8. Relative abundance of fungal trophic groups at genus level in the horizons of soil profiles under ill chestnut plants (INK1) and healthy chestnut plants (INK2 and INK3).
Applsci 15 11695 g008
Figure 9. Distribution of fungal mycorrhiza at genus level in the horizons of soil profiles under ill chestnut plants (INK1) and healthy chestnut plants (INK2 and INK3).
Applsci 15 11695 g009
Figure 10. Conceptual figure illustrating water infiltration, surface runoff, and lateral subsurface flow across the study site’s slope positions. KS: saturated hydraulic conductivity.
Applsci 15 11695 g010
Table 1. Mean (n = 3) nutrient content in leaves of the reference chestnut trees located at INK1, INK2 and INK3 sites. Different letters indicate significant differences among the three sites (p ≤ 0.05) according to Kruskal–Wallis’s test.
NutrientUnitINK1INK2INK3
N%2.1 a2.5 b2.7 c
Alg kg−10.12 a0.21 b0.12 a
Feg kg−10.15 a0.27 b0.16 a
Mng kg−10.41 a0.27 b0.27 b
Kg kg−17.1 a7.8 b10.7 c
Cag kg−16.8 a7.6 b10.1 c
Mgg kg−12.22.02.0
Pg kg−11.8 c1.6 a1.7 b
Bmg kg−12.7 a20.2 b20.2 b
Disclaimer/Publisher’s Note: The statements, opinions and data contained in all publications are solely those of the individual author(s) and contributor(s) and not of MDPI and/or the editor(s). MDPI and/or the editor(s) disclaim responsibility for any injury to people or property resulting from any ideas, methods, instructions or products referred to in the content.