Abstract
Verjuice, a green grape juice traditionally produced from grapes obtained through thinning, represents a sustainable alternative for the utilization of viticulture by-products. No standardized methods of production are utilized to make verjuice, highlighting the need for further research. This study evaluated three extraction methods—pressing extraction (PE), steam extraction (SE), and centrifuge juicer extraction (CJE)—to produce verjuice from three Vitis labrusca varietals (Bordô, Concord, and White Niágara). Physicochemical parameters, volatile compounds (VOC), total polyphenol content, antioxidant and anti-hypertensive activities were analyzed. Extraction method and grape varietal influenced physicochemical composition, antioxidant capacity, and VOC. The SE method resulted in higher yields but lower polyphenolic content, while the CJE was more efficient in extracting phenolic compounds and preserving antioxidant properties. Higher concentrations of malic acid were observed in verjuice extracted by PE and CJE methods from Bordô and Concord grapes, while higher tartaric acid content was found in Bordô and Niágara grapes extracted by CJE. Within grapes, verjuices presented wider volatile profile than those described in the literature, and CJE and PE methods yielded higher amounts of VOC. Thus, V. labrusca presents great potential to produce verjuices and CJE shows to be an efficient alternative to the pressing method.
1. Introduction
Unripe grapes derived from thinning are usually considered by-products, as they are typically discarded to rot in the field. This practice, also known as green pruning, is carried out to improve the size and composition of remaining grapes to produce wines and/or juices [1]. A way to use these unripe grapes is by producing verjuice and/or sour grape sauce. Verjuice (‘vert jus’ in French) is defined as an acidic, unfermented unripe grape juice, whereas sour grape sauce is the green juice that goes through an additional stage of heating [2,3]. In addition to sustainable qualities, such as using fruit that would otherwise be discarded, verjuice is also valued for its nutritional and medicinal properties tracing dating back to medieval times [4]. Verjuice contains bioactive compounds known for their anti-inflammatory, cardioprotective, anticancer, and antidiabetic effects, providing benefits to human health [3,5,6].
Verjuice characteristics can be influenced by grape maturity stage in which thinning is conducted [7]. During the period of bunch closure, grapes present a green color, berries are small with hard skin, and are characterized by high acidity and low sugar content. At the veraison period, grape berries begin to expand in volume, their skin softens, and sugars start to accumulate [8]. Verjuice total soluble solids have been shown to range from 2.6 °Brix to 15.7 °Brix, with glucose in the range of 6.59 g/L and 47.06 g/L, and fructose between 0 g/L and 34.22 g/L [7,9]. The main carbohydrates present in grapes are monosaccharides (glucose and fructose) and polysaccharides (mainly pectin), which confers hardness to grape cell wall [10]. Among monosaccharides, glucose predominates over fructose at the beginning of the ripening phase, and they become equimolar through the ripening process [11]. Among organic acids, tartaric and malic acids are the most abundant, composing about 90% of the total acid content at maturity phase of grapes [12]. In the growth phase in which grapes are collected to produce verjuice, malic acid is present in higher amounts than tartaric acid. Depending on when the green pruning is carried out, verjuice can present more acidic or sweeter sensory characteristics [7,9].
Verjuice is typically produced from wine grapes (Vitis vinifera), where grape thinning is a common practice. However, Vitis labrusca varietals also represent an interesting alternative, particularly given their popularity among grape producers in different countries including Brazil [13]. Nevertheless, the first laboratory-scale production of verjuice in Brazil using Concord grapes—a varietal of V. labrusca—was only recently reported by Lassen et al. [14], underscoring its innovative aspect. According to the Grape Observatory in Brazil, the production and consumption of table grapes has grown in recent years and is considered an important source of income for the viticulture in the country [15]. Among those cultivated in Brazil, Concord, Bordô, and White Niágara play an important role in the grape market. In 2021, the top five cultivars harvested in Brazil were Isabella, Bordô, White Niágara, Rosé Niágara, and Concord [16]. Bordô grapes are mainly used to produce juices, wines, vinegars, and jellies, and are characterized for their intense dark red color [17]. Concord grapes are also cultivated for consumption in natura as well as wine production, and are characterized by low red color intensity and acidity [18]. On the other hand, White Niágara is usually cultivated for consumption in natura and the juice produced is characterized by yellow/pale color and high sweetness [19].
Currently, there is no standardized production method of verjuice and, although it has been produced and commercialized in some countries such as New Zealand, Australia, Portugal, Austria, Lebanon, etc. [9], verjuice is underexplored in other countries like Brazil. Therefore, there is a great opportunity to add value to the agrifood sector by using thinned grapes to create new foods/ingredients. Verjuice is most commonly produced by extracting juice from partially ripe grapes through pressing, although other methods have been explored to improve yield and product quality [3]. Steam extraction, for instance, is a technique widely used in small- and medium-scale production of red grape juice, particularly in Southern Brazil. It involves the use of hot water steam to extract juice from the fruit, offering high yield and good retention of color and flavor. At the same time, it pasteurizes the beverage, improving its microbial and biochemical stability [20,21,22]. Another small-scale extraction technique that has been used for grape juice production is the centrifugal juicer, which uses a fast-spinning grinding blade to extract the juice [20,22]. To date, however, steam extraction and centrifugal juicer have not been reported in the literature as methods for verjuice production, making their application in this context highly novel.
To explore new grape varietals and methods to produce verjuice, the aim of the present study was to evaluate the impact of three different extraction techniques—pressing, steam extraction, and centrifugation—on the production of verjuice from different Vitis labrusca grape varietals (Bordô, Concord, and White Niágara). The resulting verjuice samples were assessed for their physicochemical characteristics, volatile profile, polyphenolic composition, and antioxidant activity. This approach aimed to explore non-traditional grape types for verjuice production, broadening raw material choices beyond V. vinifera. This could benefit grape regions where V. labrusca is more prevalent or economically viable.
2. Materials and Methods
2.1. Plant Materials and Chemicals
2.1.1. Grapes
The grapes were harvested at the ripening stage between 29 and 31, according to the phenological classification scheme proposed by Coombe [8], in November 2023 in the Rio Grande do Sul, which is the most southern state in Brazil. Bordô (BO) and White Niágara (WN) grapes were harvested in the city of Roca Sales (29°17′02″ South 51°52′04″ West) and Concord (CO) grapes in Roque Gonzales (28°07′51″ South 55°01′33″ West).
2.1.2. Chemicals
Chemicals for HPLC analysis were obtained from Sigma Aldrich (St. Louis, MO, USA) and other chemicals of analytical grade were acquired from Êxodo Científica (Sumaré, Brazil).
2.2. Extraction Procedures
Grapes were initially destemmed, washed, and sanitized with sodium hypochlorite solution at 100 mg/L for 15 min, followed by rinsing with tap water. Then, three different extraction methods were used (described below).
2.2.1. Pressing Extraction (PE)
PE followed procedure described by Lassen et al. [14]. Batches of 2.5 kg of grapes were manually kneaded with a cylindrical steel device and pressed in a perforated 50 L stainless basket until the juice was completely extracted. Potassium metabisulfite was added at a concentration of 0.4 mg/kg to prevent microbial growth and oxidation. For clarification, the juice was kept in dark 600 mL glass containers at 0 °C for 10 days to precipitate tartrate crystals, and then vacuum filtered (11 µm filter paper). Final juices were bottled into dark 600 mL glass bottles and pasteurized at 75 °C for 1 min [14]. After that, verjuice bottles were left to cool down to room temperature (~20 °C) and then stored at 5 °C until analysis.
2.2.2. Steam Extraction (SE)
SE was performed using a domestic steam juicer (Juice Extractor Pot Capacity 20 kg, Funilaria Estrela, Estrela, Brazil) using conditions proposed by Lopes et al. [20] and Ide et al. [22]. Batches of 2.5 kg of unripe grapes were placed into the upper fruit basket and exposed to a constant flow of water vapor (>80 °C) rising from the lower part of the equipment. The crushed grapes were placed into the perforated container, followed by the addition of 2 L of tap water into the water tank. Addition of potassium metabisulfite, clarification, and pasteurization were performed as described in Section 2.2.1. The juice from the basket was collected and pasteurized in an annular middle part that was heated by the rising steam. The juice residence time (time in which fruits stay in contact with the steam) was ~15 min, until juice extraction ended. The juice was hot filled into dark 600 mL glass bottles and left to cool down at room temperature (~20 °C). Samples were stored at 5 °C until analysis.
2.2.3. Centrifuge Juicer Extraction (CJE)
For this method, a domestic centrifuge juicer (model JCR400 PLUS, Cadence, Balneário Piçarras, Brazil) was used. Three kilograms of grapes were introduced at 300 g batch each time in the equipment and resulting juice collected. Potassium metabisulfite was added, and then clarification as well as pasteurization were performed as described in Section 2.2.1. The juice was hot filled into dark 600 mL glass bottles and left to cool down at room temperature (~20 °C). Samples were then stored at 5 °C until analysis.
Each extraction method for each grape varietal was performed twice (independent experiments), and three bottles of each experiment were used to perform the instrumental analysis (triplicates).
2.3. Yield
The yield of juices was calculated by measuring the volume of juice extracted from the grape weight used in each extraction method. Verjuices were weighted in semi-analytical balance (model AUX220, Shimadzu, Kyoto, Japan) and grapes in a scale with precision of 1 g (model AD2000, Marte, Barueri, Brazil). Results were expressed as % (kg of verjuice per 100 kg of grape).
2.4. Oenological Parameters
The values of pH, titratable acidity (TA), and total soluble solids (TSS) were measured according to AOAC [23]. The pH analysis was performed with digital pH meter (PHOX, model P1000, Colombo, Brazil). TA was measured by titration with sodium hydroxide (0.1 M) using phenolphthalein as indicator, and the result expressed as grams per liter (g/L). TSS was analyzed by using a digital refractometer (model HM-427, Highmed, São Paulo, Brazil) and results were expressed as °Brix.
To measure turbidity, a digital turbidimeter (DLT-WV, Dellab, Araraquara, Brazil) was used and the results were expressed in nephelometric turbidity units (NTU). The degree of non-enzymatic browning was measured following Brandelli and Lopes [24], where 1 mL of sample was mixed with 1.5 mL of 96% ethanol, centrifuged (5000× g for 10 min at 7 °C), and absorbance was measured at 440 nm.
The concentrations of malic acid, tartaric acid, glucose, and fructose were determined by HPLC (model 1260 infinity II LC, Agilent Technologies, LC1260, Santa Clara, CA, USA) equipped with a refractive index detector and Bio-Rad HPX-87H column (300 × 7.8 mm, 9 μm particle size and 8% crosslinking) using 5 mM sulfuric acid as effluent at 45 °C and a flow rate of 0.6 mL/min [25,26]. Verjuice samples were centrifuged at 10,000× g for 10 min at 7 °C and filtered (0.45 μm filter paper) before injecting 20 μL aliquots. Total analysis duration was 67 min. The standards of the analyzed compounds were used for identification (retention time) and quantification (external standard). The results were expressed in g/L.
2.5. Total Polyphenolics, Antioxidant and Anti-Hypertensive Activities
Total phenolic content (TPC) was determined by the Folin–Ciocalteau method [27], which involves the reaction of the sample with the Folin–Ciocalteau reagent (ALZ, Porto Alegre, Brazil) and sodium carbonate saturated solution, followed by absorbance reading at 765 nm. Results were expressed as mg gallic acid equivalent per liter (mg GAE/L).
Antioxidant activity was evaluated using three methods. First, the 2,2′-azino-bis 3-ethylbenzothiazoline-6-sulphonic acid (ABTS) radical scavenging assay was used, which consists of the reaction with ABTS and potassium persulfate solutions with absorbance reading at 734 nm [28]. The results were expressed as mmol of Trolox equivalent per liter (mmol TE/L). Second, the 2,2-difenil-1-picrilhidrazil (DPPH) radical scavenging assay [29] was used. In the dark, samples (0.1 mL) were transferred to test tubes with 3.9 mL DPPH radical (60 µmol/L DPPH solution, diluted in methyl alcohol). After 45 min, the scavenging activity was measured spectrophotometrically by the decrease in absorbance at 517 nm. Likewise, the same proportions (0.1 mL distilled water and 3.9 mL DPPH radical) were used as a control, using methyl alcohol as blank. The results were also expressed as mmol TE/L. Finally, the reducing power (RP) assay was applied [30]. Samples of 1 mL of samples were mixed with 2.5 mL phosphate buffer (0.2 mol/L, pH 6.6) and 2.5 mL potassium ferricyanide (10 mg/mL), and then the mixture was incubated at 50 °C for 20 min. Then, 2.5 mL of tri-carboxylic acid (10%, v/w) was added, and the mixture was centrifuged (3000× g for 10 min). The supernatant (1 mL) was mixed with 2.5 mL distilled water and 0.2 mL ferric chloride (1 mg/mL), and the absorbance measured at 700 nm.
Anti-hypertensive activity was evaluated by the Angiotensin-Converting Enzyme (ACE) procedure [31], with minor modifications. Aliquots of 20 µL of verjuice were added to 200 µL of buffered substrate solution (5 mmol/L hippuryl-histidyl-leucine in 50 mmol/L HEPES-HCl buffer containing 300 mmol/L NaCl, pH 8.3). The reaction started by adding 40 µL of angiotensin I-converting enzyme (0.1 U/mL) to the described system and maintained at 37 °C. Reaction stopped after 30 min with the addition of 150 µL of 1 mol/L HCl. Then, the hippuric acid release was extracted with 1 mL of ethyl acetate, and the organic phase was transferred to a glass tube and heat evaporated. The residue was dissolved with 800 µL of distilled water and measured at 228 nm. Residue extract inhibitory activity was expressed as percentage according to Equation (1):
where A is the absorbance without sample, B is the absorbance without the enzyme, and C is the absorbance with the sample and the enzyme.
2.6. Determination of Volatile Organic Compounds
Volatile organic compounds (VOCs) were determined using the headspace solid phase microextraction (HS-SPME) technique following procedures from Burdzaki et al. [26]. For the extraction of volatile compounds, a manual sampler (SPME fiber Holder (Supelco®, Sigma-Aldrich, Saint Louis, MO, USA) with DVB/Car/PDMS fiber (Supelco®, Sigma-Aldrich, Saint Louis, MO, USA; 50/30 μm, 1 cm long) was used, previously conditioned according to the manufacturer’s recommendation. Approximately 7 mL of verjuice was used, followed by the addition of 30% w/v sodium chloride and 10 μL of internal standard solution (8.6 μg/mL 3-octanol (>99% purity, Sigma-Aldrich) in a 20 mL vial containing polytetrafluoroethylene (PTFE) septum and immediately closed with a screw cap. The HS-SPME extraction was carried out at 40 °C, when initially the samples were kept for 5 min to establish temperature equilibrium (fiber not exposed), after which the SPME fiber was exposed to the sample headspace for 40 min for extraction of volatile compounds at the same temperature. During the extraction, the sample was homogenized with a magnetic bar.
Semiquantitative analyses of volatile compounds were performed on a gas chromatograph coupled to a mass spectrometer (GC-MS) (QP2010-Plus, Shimadzu, Kyoto, Japan). The fiber containing the adsorbed volatile molecules was thermally desorbed in the injector port at 240 °C for 10 min in spitless mode (1 min, ratio 1:10). Helium was used as a carrier gas with a constant linear velocity of 39.4 cm/s. Volatile compounds were separated using a SupelcoWax 10 column (30 m × 0.25 mm × 0.25 μm; Supelco®, Sigma-Aldrich, St. Louis, MO, USA). The column temperature programming started at 40 °C for 2 min, followed by an increase of 3 °C/min up to 180 °C, then moving to 230 °C with an increase of 10 °C/min where it was maintained for 3 min. Finally, it reached 250 °C at a rate of 10 °C/min, remaining in isotherm for 2 min. The temperatures of the GC-MS interface and the ionization source were 230 and 210 °C, respectively. The quadrupole mass analyzer was operated in scan mode with a 35–350 m/z range. A blank was performed between replicates and samples. The chromatographic method itself created a ramp at the end of the run, with a temperature higher than that of the analytes (>20 °C) to allow for column/system cleaning.
VOCs were identified by comparing the mass spectra of the analytes with those found in the spectral library of the National Institute of Standards and Technology (NIST 05 s), with positive identification from standards of esters, ketones, acids, alcohols, aldehydes, and terpenes (Sigma-Aldrich), and were also identified through the experimental linear retention index (LRI) of the analyte with the theoretical LRI reported in the literature (NIST 14.L and Pherobase databases [32]). The experimental LRIs were calculated from the retention times of a homologous series of alkanes (C8-C40) (Sigma-Aldrich) obtained under the same chromatographic conditions as the sample. The quantification of volatile compounds was carried out using internal standardization with the addition of the standard 3-octanol.
2.7. Statistical Analysis
Before analysis of variance (ANOVA), data was checked for normality of the residues and homoscedasticity by the Shapiro–Wilk’s test and Hartley’s maximum F-test, respectively. BoxCox transformation was performed if one of them was significant. The R software v.4.3.0 (R Core Team, 2023) in R studio version 2023.12.1 was used for assumption checking. ANOVA was performed in XLSTAT version 2023.2.0 (Lumivero, New York, NY, USA). The α-risk was set at 0.05. For ANOVA, means of three bottles of each extraction method of two independent extractions were compared by two-way ANOVA considering grape varietal and extraction method as fixed factors as well as its interaction (varietal*extraction), followed by Tukey’s HSD test performed on oenological and biological parameters to ascertain any significant differences or interactions between variables.
For volatiles, beyond ANOVA, means were centered and scaled for variance once in a column-wise direction to prevent the differences in the scale of volatile metabolite abundances from affecting the assessment of sample differences. The order of columns and rows of the scaled data was determined with hierarchical cluster analysis with Euclidean distance and grouping with complete linkage, as described by Dupas de Matos et al. [9]. The heatmap was built using pheatmap package (version 1.0.12) in R (version 4.0.3) and included 36 compounds in total (the four alkanes identified were removed since they are odorless).
3. Results and Discussion
3.1. Yield
Yield of extraction produced is presented in Table 1. Extraction yield ranged from 23.12% to 57.38%. Utilization of PE method resulted in a yield of 41.18%, 33.23%, and 32.40% when CO, WN, and BO grapes were used, respectively. When CJE method was used, 47.34%, 30.13%, and 23.12% of yield was obtained using CO, WN, and BO grapes, respectively. Finally, when SE method was applied, verjuice yields of 57.38%, 42.12, and 31.80% were observed for CO, WN, and BO grapes, respectively.

Table 1.
Verjuice production yield by each extraction method across three grape varietals.
The verjuice yield observed in the present study was within the range previously published in the literature. Specifically, the juice yield from pressing varied from 40% to 60% [3]. The phenological classification at which the grapes were harvested in this study corresponds to between the bunch closure period and veraison [8]. However, phenological stage consistency poses a challenge explaining low yields observed across the extraction methods [3]. High yields were observed in CO-based verjuices, consistent with the yields typically reported for grape juice production from this varietal. Not rarely, the blend for grape juice production is made by combination of CO with BO varietals as a strategy to reach a more ‘balanced’ beverage, since BO grapes highly contribute to red-violet color and CO grapes to higher yield [33]. Overall, SE method resulted in a higher extraction yield, likely due to the addition of exogenous water during the hot water extraction process. This observation aligns with findings from previous studies on grape juice using this extraction method [34].
3.2. Oenological Parameters
Results of oenological parameters of verjuice samples are presented in Figure 1. For most of the parameters evaluated, significant effect (p < 0.05) was found for varietal, extraction, and varietal*extraction interaction, except for pH (interaction varietal*extraction, p > 0.05), indicating that the extraction method may yield higher values of pH in one varietal but not in another.
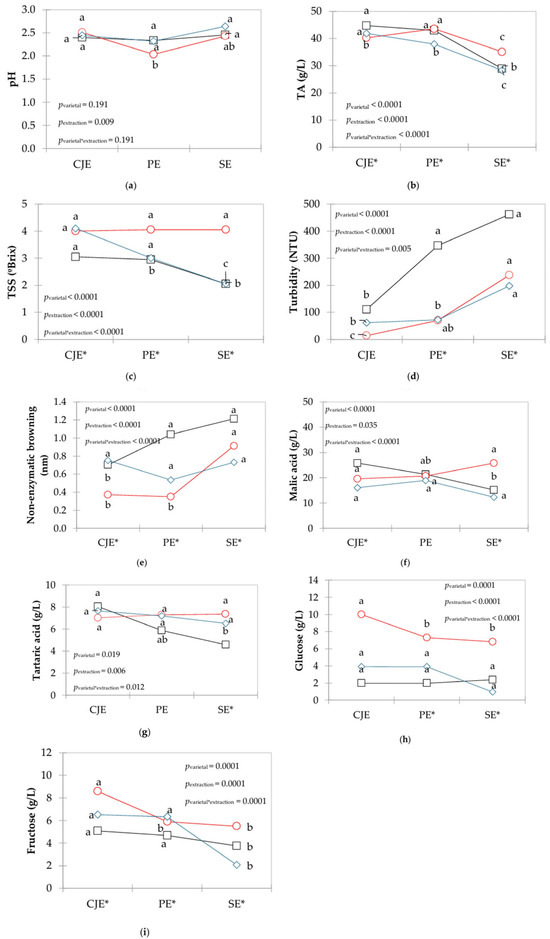
Figure 1.
Interaction plots of mean values of oenological parameters ((a) pH, (b)TA, (c) TSS, (d) turbidity, (e) non-enzymatic browning, (f) malic acid, (g) tartaric acid, (h) glucose and (i) fructose) of verjuices obtained from different grape varietals (□ in black: Bordô, ○ in red: Concord, ◊ in blue: White Niágara) and extraction methods (CJE: centrifuge juicer extraction; PE: pressing extraction; SE: steam extraction). a,b,c Different letters indicate significant differences among extraction methods for each grape varietal based on Tukey’s test. * Indicate significant differences among varietals within the same extraction method.
The values of pH ranged from 2.04 to 2.64 (Figure 1a), and this parameter was not affected by grape varietal (pvarietal = 0.191), but by extraction method (pextraction = 0.009). Higher pH was observed in CO verjuice when CJE was applied compared to PE, but did not differ from SE. Extraction methods did not influence the pH of BO and WN verjuices (p > 0.05).
For TA, values ranged from 28.3 g/L to 44.7 g/L (Figure 1b), and it was affected by grape varietal (pvarietal < 0.0001) and extraction (pextraction < 0.0001), with a significant interaction (pextraction*varietal < 0.0001). The lowest TA values of verjuice made with all grape varietals (p < 0.05) were observed with the SE method. For BO grapes, higher values of TA were observed when CJE and PE methods were applied; meanwhile, for CO, higher values were observed just when PE method was used and for WN grape when CJE was used.
For TSS (Figure 1c), results ranged from 2.1 to 4.1 °Brix and it was affected by grape varietal (pvarietal < 0.001) and extraction (pextraction < 0.001), with significant interaction (pextraction*varietal < 0.001). No differences in TSS were found in CO-based verjuice, regardless of the method used (p > 0.05), whereas for BO and WN grapes, the extraction by SE resulted in lowest values of TSS (p < 0.05) (Figure 1c). For BO grapes, extraction performed by CJE and PE did not differ (p > 0.05), and for WN grapes, the utilization of the CJE method resulted in higher TSS values (p < 0.05).
Turbidity ranged from 13.85 to 461.50 NTU (Figure 1d), and it was affected by grape varietal (pvarietal < 0.0001) and extraction (pextraction < 0.0001) with a significant interaction (pextraction*varietal = 0.005). Higher turbidity was observed when SE was applied, although differences were not significant (p > 0.05) for BO and WN grapes when extraction was performed by the PE method. When CO grape was used, CJE and PE methods presented the lowest values of turbidity (p < 0.05).
For non-enzymatic browning, values varied from 0.350 to 1.214 (Figure 1e), which was impacted by grape varietal (pvarietal < 0.0001) and extraction (pextraction < 0.0001) with a significant interaction (pextraction*varietal < 0.0001). Higher values were observed when SE method was used, but SE did not differ (p > 0.05) from PE and CJE methods for CO and WN grapes, respectively. CJE and PE resulted in lowest values of non-enzymatic browning when CO grape was used (p < 0.05).
Regarding organic acids, malic acid concentration ranged from 4.585 g/L to 8.055 g/L (Figure 1f), and it was significant for grape varietal (pvarietal < 0.0001) and extraction (pextraction = 0.0035), as well as respective interaction (pextraction*varietal < 0.0001). No differences in malic acid were found for both CO and WN grapes (p > 0.05), regardless of the extraction method. In contrast, BO verjuices showed higher malic acid levels when CJE and PE were used, although no significant differences were found between PE and SE methods for this varietal. A similar trend was observed for tartaric acid, with concentrations ranging from 12.295 g/L to 25.790 g/L. Tartaric acid levels were affected by grape varietal (pvarietal = 0.019), extraction method (pextraction = 0.006) with significant interaction (pextraction*varietal = 0.012) (Figure 1g).
For sugars, glucose ranged from 0.995 g/L to 9.995 g/L (Figure 1h), and it was significant for grape (pvarietal = 0.0001), extraction (pextraction < 0.0001), and their interaction (pextraction*varietal < 0.0001). For CO grapes, a higher amount of glucose was observed when verjuice was extracted by CJE (p < 0.05). However, for WN and BO grapes, no differences (p > 0.05) were found in glucose levels when using any of the methods. For fructose, concentration varied from 2.075 g/L to 8.585 g/L (Figure 1i), and it was affected by grape (pvarietal = 0.0001) and extraction (pextraction = 0.0001), with significant interaction (pextraction*varietal = 0.0001). For CO grapes, highest (p < 0.05) values were observed with the CJE method, whereas for both BO and WN grapes, no differences were found when CJE and PE were applied, with lower values found by using the SE method.
The values of pH, TA, TSS, malic and tartaric acids, glucose and fructose observed in the present work (Figure 1) are in line with the previous literature [1,2,7], indicating features similar to V. vinifera-based verjuices. This highlights the great potential of using V. labrusca grapes to produce verjuice as a strategy of innovation in the viticulture sector.
The lower values of TA and TSS generally observed when SE was used are probably due to a dilution caused by the addition of water during the vapor extraction, as described by Bresolin et al. [34]. For CO-based verjuice, although higher extraction yield was observed (Table 1), extraction methods did not influence TSS values (p > 0.05), probably due to incorporation of water in the juice, contributing to the lower concentration of solids in the beverage [20,34]. A similar trend was observed during production of grape juices by steam extraction compared to mechanical extraction procedures [20]. Additionally, hot water extraction induces the depectinization of berry tissues and the increasing of surface tension in the grape skin, causing the release of compounds that contribute to hazy appearance [20], which helps to explain a higher turbidity in verjuices produced by the SE method in the present work. The use of heat in this process contributes to the formation of Maillard reaction compounds [35,36], resulting in increased non-enzymatic browning in verjuices produced by the SE method. During mechanical extraction, the high energy applied during pressing is partially converted into heat, which can also lead to browning due to Maillard reactions [35,36].
Glucose and fructose represent the main sugars in grapes; meanwhile, malic and tartaric acids represent about 90% of the organic acids in the fruit [12]. At the beginning of grape ripening phase, glucose and malic acid predominate over fructose and tartaric acid, respectively [3,7], which was also observed in the present work (Figure 1f–i). Lower values of these parameters in verjuice produced by the SE method may also be related to a dilution during the hot water steam process [34], as observed for TA and TSS values. Glucose and fructose also have important roles such as reducing sugars in Maillard reaction, which is accelerated in high temperatures like with the SE method [35], thus reducing their amounts in the verjuice samples studied.
Results of oenological parameters indicate that steam extraction led to dilution and higher browning [20,34], while mechanical methods implied on better retained natural grape composition. Understanding acid and sugar dynamics (glucose/fructose, malic/tartaric) within verjuice production is crucial for tailoring verjuice style and quality. These findings provide industry with practical insights to guide choice of grape varietal and processing method to achieve desired product qualities, aligning with consumer preferences as demonstrated in the work of Dupas de Matos et al. [9].
3.3. Biological Properties
The results for polyphenolic content (TPC), antioxidant activities (ABTS, DPPH, and RP), and anti-hypertensive activity are shown in Figure 2.
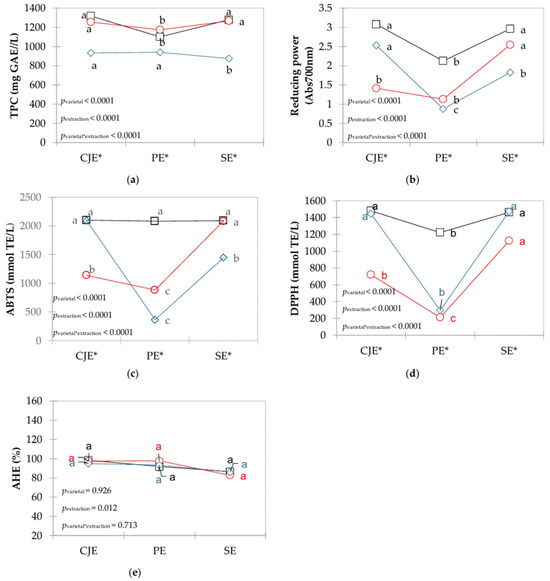
Figure 2.
Interaction plots of means for polyphenolics compounds with antioxidant and anti-hypertensive activities in verjuices obtained from different grape varietals (□ in black: Bordô, ○ in red: Concord, ◊ in blue: White Niágara) and extraction methods (CJE: centrifuge juicer extraction; PE: pressing extraction; SE: steam extraction). a,b,c Different letters indicate significant differences among extraction methods for each grape varietal based on Tukey’s test. * Indicate significant differences among varietals within the same extraction method.
TPC ranged from 874.640 to 1317.415 mg GAE/L, and it was affected by grape (pvarietal < 0.0001) and extraction (pextraction < 0.0001), with a significant interaction (pextraction*varietal < 0.0001). For CO and BO grapes, the highest amount of TPC was found when CJE and SE were used, whereas for WN grapes, the lowest values (p < 0.05) were found with the SE method (Figure 2a).
The antioxidant activity measured as reducing power ranged from 0.877 to 3.077 (Figure 2b) and was affected by grape (pvarietal < 0.0001) and extraction (pextraction < 0.0001), with a significant interaction (pextraction*varietal < 0.0001). Higher values were extracted when the CJE method was used in WN and BO grapes, although for the former varietal the CJE did not differ (p > 0.05) from the SE method. For CO grapes, higher values (p < 0.05) were observed with the SE method. For ABTS, values of antioxidant activity ranged from 365.667 to 2102.33 mmol TE/L (Figure 2c) and was affected by both grape (pvarietal < 0.0001) and extraction (pextraction < 0.0001), with a significant interaction (pextraction*varietal < 0.0001). For BO grapes, the extraction method did not impact on the antioxidant activity (p > 0.05). On the other hand, higher values (p < 0.05) were observed when the CJE method was used in WN grapes and the SE method used in CO grapes. For DPPH, values ranged from 211.200 to 1479.200 mmol TE/L (Figure 2d) and were significant for grape (pvarietal < 0.0001), extraction (pextraction < 0.0001), and its interaction (pextraction*varietal < 0.0001). Higher DPPH antioxidant activity was observed with the SE method, although differences for BO and WN grapes were not significant (p > 0.05) when CJE was employed. When PE was applied, lower DPPH values were observed for all grape varietals (p < 0.05).
The anti-hypertensive activity values ranged from 82.7% to 98.2%, which was affected only by the method (pextraction = 0.012, Figure 2e). Considering only the extraction method as a factor in the ANOVA, CJE and PE yielded higher (p < 0.05) than SE, which is likely due to the thermal degradation by steam from the SE method.
Total phenolic compounds (TPC) in red berries are the main contributors to antioxidant activity and play a role in anti-hypertensive effects [20,37,38,39]. Among these, anthocyanins are important phenolic compounds in red grape varietals and account for a substantial proportion of the TPC [40], in line with the findings of the present study (Figure 2a). Grapes present high amounts of polyphenolics bounded to vegetable cell walls that are not easily extractable [37,40]. The hot water steam can help break down linkage of these compounds in the food matrix by releasing them to the juice [20,22]. In the CJE method, fruits are completely disintegrated, and possibly more polyphenolics are extracted from seeds, increasing TPC and the antioxidant activities studied herein. Also, mechanical press seems to give enough energy to break the polyphenolic and food matrix bonds.
Regarding anti-hypertensive activity, grape varietals did not impact on the capacity of ACE inhibition, but results indicated that extraction method did. Utilization of the SE method resulted in lower activity than both PE and CJE methods, which did not differ between them (p > 0.05). TPC are usually related to anti-hypertensive activity of berries, and they act mainly through modulation of renin–angiotensin–aldosterone system vascular smooth muscle cells contractility [41]. Additionally, phenolic monomers exhibit competitive inhibition of ACE [42], which is a phenomenon that could also happen in the SE, decreasing anti-hypertensive activity in verjuices when hot water steam was applied. Regardless of extraction method or grape varietal, verjuice presents important amounts of compounds with health-related properties which reinforce its utilization of a functional ingredient in food applications in line with its history of use in Iranian folk medicine, for example [43].
3.4. VOC
Forty (40) VOCs were identified in the nine verjuice samples and means are presented in Figure 3 (full details, including codes used within Figure 3, can be found in Table S1). Alkanes (octane, nonane, undecane, and dodecane) were not presented within the results since they are odorless.
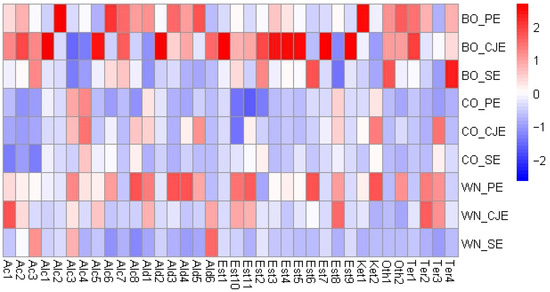
Figure 3.
Heatmap with hierarchical dendrograms of the volatile metabolites identified † in the verjuice samples. Each column represents a metabolite, and each row represents a sample. For heatmap visualization, the abundance of each metabolite was scaled to variance one. Color scale indicates that blue tones are a negative relation and red a positive relation. Metabolite codes are found in Table S1. BO: Bordô grape; CO: Concord grape; WN: white Niágara grape; PE: pressing extraction; CJE: centrifuge juicer extraction; SE: steam extraction. † Alkanes are not presented in the figure since they are odorless.
The VOCs were composed by alkanes (4), acids (3), alcohols (8), aldehydes (6), esters (11), ketones (2), terpenes (4), and others (2). Dupas de Matos et al. [9] identified 31 volatiles across 13 commercial verjuices from different countries. In comparison with the present study, only the aldehydes hexanal and 2,4-dimethyl-benzaldehyde were commonly detected, suggesting that V. labrusca-based verjuices may exhibit a broader aroma profile.
Figure 3 shows that BO verjuices presented higher amounts of volatiles, overall. Specifically, for the BO-based verjuices made from PE and CJE methods (non-thermal treatments), the common volatiles were 2-ethyl-hexanoic acid (Ac1) and octanoic acid (Ac2); 1-nonanol (Alc8); aldehydes benzaldehyde (Ald3) and 1-methylene-1H-indene (Ald4); eucalyptol (Ter1), and p-menth-1-en-8-ol (Ter4); and other compounds such as 2-(hexyn-1-yl)-3-methoxymethylene-oxirane (Oth1) and 2,4-bis(1.1-dimethylethyl)-Phenol (Oth2). The utilization of SE method to produce BO verjuice, compared to other extraction methods, highlighted the extraction of butyl butyrate (Est6) and p-menth-1-en-8-ol (Ter4). For CO verjuices, PE and CJE methods highlighted for alcohols (Z)-4-hexen-1-ol (Alc3) and (E)-2-hexen-1-ol (Alc4); aldehyde hexanal (Ald1), and ester hexyl formate (Est8). For CO verjuice, the SE method had lower concentration of (E)-2-hexen-1-ol (Alc4) compared to both non-thermic methods (PE and CJE). For WN verjuices made from PE and CJE methods, several volatiles were commonly highlighted including 2-ethyl-hexanoic acid (Aci1), (Z)-4-hexen-1-ol (Alc3); hexanal (Ald1), hexyl formate (Est8), propanoic acid, 2-methyl-, 3-hydroxy-2,4,4-trimethylpentyl ester (Est10), and propanoic acid, 2-methyl-,1-(1,1-dimethylethyl)-2-methyl-1,3-propanediyl ester (Est11), linalool (Ter2), and menthol (Ter3). When SE method was used for this grape varietal, nonanoic acid (Ac3), alcohol (Z)-4-hexen-1-ol (Alc3), and 5-(hydroxymethyl)-2-furancarboxaldehyde (Ald6) were highlighted.
Overall, volatile acids and alcohols were commonly found in verjuice made from both PE and CJE methods. These compounds are usually related to fermentation in beverages [44], which is in line with the non-thermal extraction methods used in the present work. Specifically, for the SE method, acids and alcohols were generally present in low amounts which could be due to microbial inactivation and evaporation of these compounds. Dupas de Matos et al. [9] indicated that marginal amounts of ethanol can be present in verjuice, and their previous work [45] showed that fermented flavors were commonly used by consumers to describe commercial verjuices. In general, the alcohols identified (Table S1) are characteristic of herbaceous/green aromas which could be a desired sensory feature when used in cooking and/or salad dressings [9]. Higher amounts of such compounds in the PE method (Figure 3, Table S1) may be due to longer processing time needed for juice extract, enabling initial microbial growth, despite utilization of sulfites during verjuice production (Section 2.2). Differences among grape varietals are likely due to variations in TSS and acidity, which influence the efficiency of compound extraction from grapes [9,44].
Aldehydes are usually derived from lipid oxidation, amino acid degradation, or microbial growth [46]. Hexanal (Ald1), which presents a grassy/green aroma [47], was not identified in BO samples when CJE and SE were used (Table S1). Regarding benzaldehyde (Ald3), known for its burned sugar aroma, cheery, almond, or marzipan-like aromas [48,49], it was not identified in CO verjuice, regardless of the method used (Table S1), and it was not present in WN verjuice when the SE method was used. Based on these compounds recognized aromas in the literature, V. labrusca-based verjuice would also be suitable to be used in marinades, salad dressing, or deglazing, as suggested by Dupas de Matos et al. [9]. Benzaldehyde was highly extracted by the PE method in both BO and WN verjuices, indicating that SE could lead to compound evaporation due to the thermal treatment [20].
Esters are critical compounds in fruit beverages since they contribute to fruit and floral notes and present low odor thresholds [44]. These compounds are important drivers of linking for verjuices, mainly when it is intended to be consumed as a beverage [9]. The majority of esters and aldehydes were identified in lower amounts in SE-based verjuices likely due to high temperatures used in the SE method and thus losses during evaporation. Fruity and floral notes were found to be key drivers of liking in verjuices, mainly when they were proposed as drinks and/or as an ingredient with other beverages [9]. Nine esters were identified in the samples of the present work; meanwhile, Dupas de Matos et al. [9] observed only one ester (ethyl acetate) across commercial verjuices, which was not observed herein, suggesting that verjuice made from V. labrusca may exhibit a broader aromatic profile, although the use of thermal extraction methods could influence the concentration of these compounds.
Terpenes, which are secondary plant metabolites, are biologically synthesized either through the cytosolic mevalonic-acid pathway, originating from three acetyl-CoA molecules, or through the plastidial methylerythritol phosphate pathway, derived from pyruvate and glyceraldehyde-3-phosphate [50]. Terpenes are often characterized by citric and floral aromas in beverages [44], which have been shown to drive liking of verjuice as a beverage [9]. Eucalyptol (Ter1) was not observed in either CO grapes for any extraction method (Table S1) and for WN verjuices it was identified only when CJE was applied. For BO verjuice, eucalyptol was extracted in higher amounts (p < 0.05) when CJE was used compared to the other methods (Table S1), indicating the need for complete disruption of grapes’ material for this compound to be extracted. Similar behavior was observed for menthol (Ter3), in which higher amounts were identified when the CJE method was used, except for WN, in which CJE and PE did not differ (see Table S1). WN showed a higher amount of linalool in both PE and CJE methods, which aligns with the pleasant aroma profile typically associated with fruit juices [51]. For linalool (Ter2), higher (p < 0.05) amounts were observed in BO and WN grapes with both non-thermal methods (PE and CJE), but when SE was used to produce BO verjuice, higher (p < 0.05) amounts of the compound were observed (which did not differ from the CJE method). This highlights the importance of evaluating the combination of grape and extraction method to produce verjuice with these critical compounds driving consumer acceptance.
4. Conclusions
In conclusion, verjuice from V. labrusca varietals exhibited physicochemical characteristics within the range previously reported for V. vinifera verjuices, suggesting that juice grapes, such as V. labrusca varietals, also have potential as raw materials for producing this innovative and sustainable beverage. Additionally, verjuice from V. labrusca varietals showed to be a polyphenolic-rich product with interesting antioxidant and anti-hypertensive activities. Also, the grape varietals used presented a wide range of volatile compounds, with herbaceous-related compounds highlighted. Within the conditions studied, BO grape presented higher amounts of volatile compounds and the CJE method yielded similar results to PE, which is the most documented method in the literature for making verjuice. Additionally, CJE proved to be an efficient method to obtain verjuice similar to those produced by PE, making its application in this context highly novel, expanding the range of possibilities for the production of verjuice. On the other hand, SE showed higher turbidity and non-enzymatic browning and lower concentration of volatile compounds, overall. As highlighted by Dupas de Matos et al. [9], the preferred characteristics of verjuice can vary depending on the intended use case scenario. For example, when consumed as a beverage, higher TSS and lower acidity are likely to be preferred due to sweetness being the main driver of liking. In contrast, for culinary uses such as marinades or salad dressings, higher acidity is often more desirable. Therefore, the optimal extraction method depends on the specific application. However, it is important to emphasize the significance of the interaction between grape varietals and extraction method, indicating that further research is essential for the effective large-scale implementation of verjuice produced from different grape varietals and alternative methods.
Supplementary Materials
The following supporting information can be downloaded at: https://www.mdpi.com/article/10.3390/app152111531/s1, Table S1. Volatile compounds identified in verjuices produced by Concord (CO), Bordô (BO) and White Niágara (WN) grape varietals extracted by different methods (PE: pressing extraction; CJE: centrifuge juicer extraction; SE: steam extraction). a,b,c different letters indicate significant differences among extraction methods for the same grape varietal. n.i.: not identified. References [9,47,48,49,52,53,54] are cited in the file.
Author Contributions
Conceptualization, L.d.S.S., V.S., F.L.L. and A.D.d.M.; Methodology, V.S., J.M.F., F.H.W. and A.B.; Validation, V.S. and A.D.d.M.; Formal analysis, J.M.F., L.T.C., V.S. and A.D.d.M.; Investigation, L.d.S.S., F.H.W., F.L.L. and N.J.C.; Writing—original draft preparation, L.d.S.S. and V.S.; Writing—review and editing, A.D.d.M., A.B. and J.M.F.; Supervision, F.L.L. and A.D.d.M. All authors have read and agreed to the published version of the manuscript.
Funding
The APC was funded by Conselho Nacional de Desenvolvimento Científico e Tecnológico (CNPq, Brazil) [Process 303173/2025-4].
Institutional Review Board Statement
Not applicable.
Informed Consent Statement
Not applicable.
Data Availability Statement
The experimental data obtained in the current study are available from the corresponding author on reasonable request.
Acknowledgments
Authors are thankful to the grape producers for providing the grapes.
Conflicts of Interest
The authors declare no conflicts of interest.
Abbreviations
The following abbreviations are used in this manuscript:
| CO | Concord grape varietal |
| BO | Bordô grape varietal |
| WN | White Niágara grape varietal |
| PE | Pressing extraction |
| CJE | Centrifuge juicer extraction |
| SE | Steam extraction |
| TPC | Total phenolic compounds |
| ABTS | Antioxidant activity measured by the 2,2′-azino-bis(3-ethylbenzothiazoline-6-sulphonic acid) method |
| DPPH | Antioxidant activity measured by 2,2-difenil-1-picrilhidrazil method |
| VOC | Volatile organic compounds |
| GAE/L | Galic acid equivalent per liter |
| mmol TE/L | Mili mol Trolox equivalent per liter |
| TSS | Total soluble solids |
| TA | Titratable acidity |
References
- Guidoni, S.; Ferrandino, A.; Novello, V. Effects of seasonal and agronomical practices on skin anthocyanin profile of Nebbiolo grapes. Am. J. Enol. Vitic. 2008, 59, 22–29. [Google Scholar] [CrossRef]
- Öncül, N.; Karabiyikli, Ş. Factors affecting the quality attributes of unripe grape functional food products. J. Food Biochem. 2015, 39, 689–695. [Google Scholar] [CrossRef]
- Fia, G.; Bucalossi, G.; Proserpio, C.; Vincenzi, S. Unripe grapes: An overview of the composition, traditional and innovative applications, and extraction methods of a promising waste of viticulture. Aust. J. Grape Wine Res. 2022, 28, 8–26. [Google Scholar] [CrossRef]
- Simone, G.V.; Montevecchi, G.; Masino, F.; Matrella, V.; Imazio, S.A.; Antonelli, A.; Bignami, C. Ampelographic and chemical characterization of Reggio Emilia and Modena (northern Italy) grapes for two traditional seasonings: ‘saba’ and ‘agresto’. J. Sci. Food Agric. 2013, 93, 3502–3511. [Google Scholar] [CrossRef] [PubMed]
- Nasser, M.; Cheikh-Ali, H.; Hijazi, A.; Merah, O.; Al-Rekaby, A.E.A.N.; Awada, R. Phytochemical profile, antioxidant andantitumor activities of green grape juice. Processes 2020, 8, 507. [Google Scholar] [CrossRef]
- Mansour, B.; Shaheen, N.; Kmail, A.; Haggag, N.; Saad, S.; Sadiq, O.; Zaid, R.; Saad, B. Anti-Inflammatory and Anti-Adipogenesis Effects of Alchemilla vulgaris L., Salvia officinalis L., and Vitis vinifera L. in THP-1-Derived Macrophages and 3T3-L1 Cell Line. Immuno 2023, 3, 148–159. [Google Scholar] [CrossRef]
- Dupas De Matos, A.; Curioni, A.; Bakalisnki, A.T.; Marangon, M.; Pasini, G.; Vincenzzi, S. Chemical and sensory analysis of verjuice: An acidic food ingredient obtained from unripe grape berries. Innov. Food Sci. Emerg. Technol. 2017, 44, 9–14. [Google Scholar] [CrossRef]
- Coombe, B. Adoption of a system for identifying grapevine growth stages. Aust. J. Grape Wine Res. 1995, 1, 100–110. [Google Scholar] [CrossRef]
- Dupas de Matos, A.; Reis, M.G.; Maggs, R.; Hort, J. Understanding consumer acceptability of verjuice, its potential applications and sensory and chemical drivers of liking. Food Res. Int. 2024, 188, 114480. [Google Scholar] [CrossRef]
- Yakushiji, H.; Sakurai, N.; Morinaga, K. Changes in cell-wall polysaccharides from the mesocarp of grape berries during veraison. Physiol. Plantar 2001, 111, 188–195. [Google Scholar] [CrossRef]
- Seymor, G.B.; Taylor, J.E.; Tucker, G.A. Biochemistry of Fruit Ripening, 1st ed.; Chapman and Hall: New York, NY, USA, 1993; 454p. [Google Scholar]
- Ribéreau-Gayon, P.; Dubourdieu, D.; Donèche, B.; Lonvaud, A. Trattato di Enologia 1. In Microbiologia del Vino e Vinificazioni, 2nd ed.; Edagricole: Bologna, Italy, 2005; 563p. [Google Scholar]
- Souza, P.V.; Foschesato, M.L. Emprego da poda verde para a obtenção de duas safras por ciclo vegetativo em ‘Niagara Branca’. Bragantia 2007, 66, 611–617. [Google Scholar] [CrossRef]
- Lassen, R.S.; Sant’Anna, V.; Leães, F.L.; Lima Filho, T.; Dupas de Matos, A. Exploring the Use of Verjuice for Reduced Sodium Pickle Production: Determination of Hedonic and Rejection Thresholds. J. Sens. Stud. 2025, 40, e70030. [Google Scholar] [CrossRef]
- Grape Observatory. Observatório da Uva. Available online: https://www.embrapa.br/observatorio-da-uva (accessed on 7 June 2024).
- MAPA. SIVIBE. Available online: https://mapa-indicadores.agricultura.gov.br/publico/extensions/SIVIBE/SIVIBE.html (accessed on 1 May 2023).
- Villa, F.; Potrich, C.; Dall’oglio, P.A. Sensory profile and physical-chemical analysis of integral grape juice prepared through steam extraction process. Sci. Agrar. Parana. 2018, 17, 300–304. Available online: https://e-revista.unioeste.br/index.php/scientiaagraria/article/view/19663 (accessed on 15 May 2025).
- Mota, R.V.; Glória, M.B.A.; de Souza, B.S.; Peregrino, I.; Pimentel, R.M.A.; Dias, F.A.N.; de Souza, L.C.; de Souza, A.L.; Regina, M.A. Bioactive compounds and juice quality from selected grape cultivars. Bragantia 2018, 77, 62–73. [Google Scholar] [CrossRef]
- Bender, A.; Souza, A.L.K.; Caliari, V.; Malgarin, M.B.; Andrade, S.B. Perfil físico-químico e sensorial de sucos de uva brancos produzidos por extração a quente. Rev. Eletr. Cient. UERGS 2018, 4, 743–751. [Google Scholar] [CrossRef]
- Lopes, M.L.M.; Miguel, M.A.L.; Fialho, E.; Valente-Mesquita, V.L. Grape juice obtained using steam extraction and other small-scale extraction methods: Phenolic content, antioxidant capacity and stability during storage. Int. J. Food Sci. Technol. 2016, 51, 1696–1702. [Google Scholar] [CrossRef]
- Silva, G.G.; Dutra, M.C.P.; de Oliveira, J.B.; Rybka, A.C.P.; Pereira, G.E.; dos Santos Lima, M. Processing methods with heat increases bioactive phenolic compounds and antioxidant activity in grape juices. J. Food Biochem. 2018, 43, e12732. [Google Scholar] [CrossRef]
- Ide, W.; Sabando, C.; Castaño, J.; Pettinelli, N.; Bustos, R.; Linares, A.; Mora, L.; Müller, N.; Pascual, G.; Rodríguez-Llamazares, S. Grape (Vitis vinifera L. cv. País) Juices Obtained by Steam Extraction. Processes 2021, 9, 1670. [Google Scholar] [CrossRef]
- AOAC. Official Methods of Analysis of AOAC International, 17th ed.; AOAC International: Gaithersburg, MD, USA, 2000. [Google Scholar]
- Brandelli, A.; Lopes, C.G.H.L. Polyphenoloxidase activity, browning potential and phenolic content of peaches during postharvest ripening. J. Food Biochem. 2005, 29, 624–637. [Google Scholar] [CrossRef]
- Dartora, B.; Sant’Anna, V.; Hickert, L.R.; Fabricio, M.F.; Ayub, M.A.Z.; Flôres, S.H.; Perez, K.J. Factors influencing kombucha production: Effects of tea composition, sugar and SCOBY. Food Sci. Technol. 2023, 43, e8123. [Google Scholar] [CrossRef]
- Burdzaki, L.N.; Wagner, R.; Furlan, J.M.; Müller, G.; Hickert, L.R.; Sant’Anna, V. Production of low-alcoholic and low-gluten beer: Physicochemical properties and volatile compounds. Braz. J. Food Technol. 2024, 27, e20244038. [Google Scholar] [CrossRef]
- Singleton, V.L.; Rossi, J.A. Colorimetry of total phenolics with phosphomolybdic–phosphotungstic acid reagents. Am. J. Enol. Viticult 1965, 20, 144–158. Available online: https://www.ajevonline.org/content/16/3/144 (accessed on 10 April 2025). [CrossRef]
- Re, R.; Pellegrini, N.; Proteggente, A.; Panala, A.; Yang, M.; Rice-Evans, C. Antioxidant activity applying an improved ABTS radical cation decolorization assay. Free Radic. Biol. Med. 1999, 26, 1231–1237. [Google Scholar] [CrossRef] [PubMed]
- Brand-Williams, W.; Cuvelier, M.; Berset, C. Use of a free radical method to evaluate antioxidant activity. LWT 1995, 28, 25–30. [Google Scholar] [CrossRef]
- Chang, C.-Y.; Wu, K.-C.; Chiang, S.-H. Antioxidant properties and protein compositions of porcine haemoglobin hydrolysates. Food Chem. 2007, 100, 1537–1543. [Google Scholar] [CrossRef]
- Cushman, D.W.; Cheung, H.S. Spectrophotometric Assay and Properties of the Angiotensin-Converting Enzyme of Rabbit Lung. Biochem. Pharmacol. 1971, 20, 1637–1648. [Google Scholar] [CrossRef]
- Pherobase The Pherobase: Database of Pheromones and Semiochemicals|The World Largest Database of Behavioural Modifying Chemicals. Available online: https://pherobase.com/ (accessed on 10 June 2024).
- Ferri, V.C.; Sainz, R.L.; Bandeira, P.S. Aceitação de blends de uvas ‘Bordô’ e ‘Isabel’ em sucos. Braz. J. Food Res. 2017, 8, 88–101. [Google Scholar] [CrossRef]
- Bresolin, B.; Gularte, M.A.; Manfroi, V. Exogenous water in grape juice obtained through the steam extraction method. Rev. Bras. Tecnol. Agroind. 2013, 7, 922–933. [Google Scholar] [CrossRef]
- Charnock, H.M.; Pickering, G.J.; Kemp, B.S. The Maillard reaction in traditional method sparkling wine. Front. Microbiol. 2022, 13, 979866. [Google Scholar] [CrossRef]
- Göğüş, F.; Bozkurt, H.; Eren, S. Kinetics of Maillard Reactions Between the Major Sugars and Amino Acids of Boiled Grape Juice. LWT 1998, 31, 196–200. [Google Scholar] [CrossRef]
- Sant’Anna, V.; Brandelli, A.; Marczak, L.D.F.; Tessaro, I.C. Kinetic modeling of total polyphenol extraction from grape marc and characterization of the extracts. Separ Purif. Technol. 2012, 100, 82–87. [Google Scholar] [CrossRef]
- Margalef, M.; Bravo, F.I.; Arola-Arnal, A.; Muguerza, B. Natural Angiotensin Converting Enzyme (ACE) Inhibitors with Antihypertensive Properties. Natural Products Targeting Clinically Relevant Enzymes. In Natural Products Targeting Clinically Relevant Enzymes, 1st ed.; Wiley: London, UK, 2017; pp. 45–67. [Google Scholar] [CrossRef]
- Fleck, N.; de Oliveira, W.C.; Padilha, R.L.; Brandelli, A.; Sant’Anna, V. Antimicrobial effect of phenolic-rich jaboticaba peel aqueous extract on Staphylococcus aureus and Escherichia coli. Braz. J. Food Technol. 2023, 26, e2022087. [Google Scholar] [CrossRef]
- Martins, C.C.; Kahmann, A.; Anzanello, M.J.; Rodrigues, R.; Rodrigues, E.; Mercali, G.D. Acid hydrolysis conditions do affect the non-extractable phenolic compounds composition from grape peel and seed. Food Res. Int. 2023, 174, 113636. [Google Scholar] [CrossRef] [PubMed]
- Yousefi, M.; Shadnoush, M.; Khorshidian, N.; Mortazavian, A.M. Insights to potential antihypertensive activity of berry fruits. Phytother. Res. 2020, 35, 846–863. [Google Scholar] [CrossRef] [PubMed]
- Chen, L.; Wang, L.; Shu, G.; Yuan, J.; Zhang, J.; Qin, S.; Li, J. Enhanced antihypertensive potential of fermented pomegranate juice: The contribution of phenolic compounds biotransformation and the resultant angiotensin-I-converting enzyme inhibition mechanism. Food Chem. 2023, 404, 134745. [Google Scholar] [CrossRef]
- Zibaeenezhad, M.J.; Mohammadi, E.; Babaie Beigi, M.A.; Mirzamohammadi, F.; Salehi, O. The effects of unripe grape juice on lipid profile improvement. Cholesterol 2012, 2012, 42–45. [Google Scholar] [CrossRef]
- Hickert, L.R.; Cattani, A.; Manfroi, L.; Wagner, R.; Furlan, J.M.; Sant’Anna, V. Strategies on aroma formation in Chardonnay sparkling base wine: Different Saccharomyces cerevisiae strains, co-inoculation with Torulaspora delbrueckii and utilization of bentonite. Biotechnol. Appl. Biochem. 2024, 71, 96–109. [Google Scholar] [CrossRef]
- Dupas de Matos, A.; Maggs, R.; Hort, J. Exploring consumer and producer views of verjuice: A grape-based product made from viticultural waste. Aust. J. Grape Wine Res. 2023, 2023, 5548698. [Google Scholar] [CrossRef]
- Narváez-Rivas, M.; Gallardo, E.; León-Camacho, M. Analysis of volatile compounds from Iberian hams: A review. Grasas Y Aceites 2012, 63, 432–452. [Google Scholar] [CrossRef]
- Rychlik, M.; Schieberle, P.; Grosch, W. Compilation of Odor Thresholds, Odor Qualities and Retention Indices of Key Food Odorants; Garching (University of Munich) Publisher: Lichtenbergstraße, Germany, 1998; 68p. [Google Scholar]
- Schieberle, P.; Grosch, W. Evaluation of the flavour of wheat and rye bread crusts by aroma extract dilution analysis. Z. Lebensm. Unters. Forsch. 1987, 185, 111–113. [Google Scholar] [CrossRef]
- Burdok, G.A. Fenaroli’s Handbook of Flavor Ingredients, 6th ed.; CRC Press: Boca Raton, NW, USA, 2009; 2160p. [Google Scholar] [CrossRef]
- Robinson, A.L.; Boss, P.K.; Solomon, P.S.; Trengove, R.D.; Heymann, H.; Ebeler, S.E. Origins of grape and wine aroma. Part1. Chemical components and vinicultural impacts. Am. J. Enol. Vitic. 2014, 65, 1–24. [Google Scholar] [CrossRef]
- Frölech, D.B.; de Assis, A.M.; Oliveira, B.A.; Nadal, M.C.; de Mello, L.L.; Lessa, F.d.O.; Schuch, M.W. Physical-chemical and sensory characterization of two important grape cultivars in Brazil. Braz. J. Dev. 2020, 6, 39958–39970. [Google Scholar] [CrossRef]
- Adedeji, J.; Hartman, T.G.; Rosen, R.T.; Ho, C.T. Free and glycosidically bound aroma compounds in hog plum (Spondias mombins L.). J. Agric. Food Chem. 1991, 39, 1494–1497. [Google Scholar] [CrossRef]
- Jirovetz, L.; Smith, D.; Buchbauer, G. Aroma Compound Analysis of Eruca sativa (Brassicaceae) SPME Headspace Leaf Samples Using GC, GC−MS, and Olfactometry. J. Agric. Food Chem. 2002, 50, 4643–4646. [Google Scholar] [CrossRef]
- Marin, A.B.; Acree, T.E.; Barnard, J. Variation in odor detection thresholds determined by charm analysis. Chem. Sens. 1998, 13, 435–444. [Google Scholar] [CrossRef]


Disclaimer/Publisher’s Note: The statements, opinions and data contained in all publications are solely those of the individual author(s) and contributor(s) and not of MDPI and/or the editor(s). MDPI and/or the editor(s) disclaim responsibility for any injury to people or property resulting from any ideas, methods, instructions or products referred to in the content. |
© 2025 by the authors. Licensee MDPI, Basel, Switzerland. This article is an open access article distributed under the terms and conditions of the Creative Commons Attribution (CC BY) license (https://creativecommons.org/licenses/by/4.0/).