Article

Multi-Feature Fusion and Cloud Restoration-Based Approach for Remote Sensing Extraction of Lake and Reservoir Water Bodies in Bijie City

1
Land Satellite Remote Sensing Application Center, Ministry of Natural Resources, Beijing 100048, China
2
China Aero Geophysical Survey and Remote Sensing Center for Nature Resources, Beijing 100083, China
*
Author to whom correspondence should be addressed.
Appl. Sci. 2025, 15(21), 11490; https://doi.org/10.3390/app152111490
Submission received: 6 September 2025 / Revised: 17 October 2025 / Accepted: 21 October 2025 / Published: 28 October 2025

Featured Application

The multi-feature fusion and cloud restoration-based approach proposed in this study is particularly suitable for the remote sensing extraction and large-scale dynamic monitoring of lake and reservoir water bodies in karst landscapes (e.g., Bijie City, Guizhou Province). It effectively overcomes two core challenges of traditional algorithms: poor cross-regional adaptability to complex geomorphology and information loss caused by cloud occlusion, achieving an overall extraction accuracy of over 96%. Practically, this method can provide reliable technical support for regional water resource management (e.g., real-time tracking of lake/reservoir area and storage changes), ecological restoration (e.g., assisting rocky desertification control by analyzing the interaction between water body dynamics and groundwater recharge), flood risk prediction, in-depth research on hydrological cycles, and assessment of climate change impacts on surface freshwater systems. Moreover, its universal technical framework enables potential extension to lake and reservoir monitoring in other complex geomorphic regions (beyond karst areas), offering a scalable solution for global large-scale surface water body dynamic monitoring.

Abstract

Current lake and reservoir water body extraction algorithms are confronted with two critical challenges: (1) design dependency on specific geographical features, leading to constrained cross-regional adaptability (e.g., the JRC Global Water Body Dataset achieves ~90% overall accuracy globally, while the ESA WorldCover 2020 reaches ~92% for water body classification, both showing degraded performance in complex karst terrains); (2) information loss due to cloud occlusion, compromising dynamic monitoring accuracy. To address these limitations, this study presents a multi-feature fusion and multi-level hierarchical extraction algorithm for lake and reservoir water bodies, leveraging the Google Earth Engine (GEE) cloud platform and Sentinel-2 multispectral imagery in the karst landscape of Bijie City. The proposed method integrates the Automated Water Extraction Index (AWEIsh) and Modified Normalized Difference Water Index (MNDWI) for initial water body extraction, followed by a comprehensive fusion of multi-source data—including Normalized Difference Vegetation Index (NDVI), Normalized Difference Built-up Index (NDBI), Normalized Difference Red-Edge Index (NDREI), Sentinel-2 B8/B9 spectral bands, and Digital Elevation Model (DEM). This strategy hierarchically mitigates vegetation shadows, topographic shadows, and artificial feature non-water targets. A temporal flood frequency algorithm is employed to restore cloud-occluded water bodies, complemented by morphological filtering to exclude non-target water features (e.g., rivers and canals). Experimental validation using high-resolution reference data demonstrates that the algorithm achieves an overall extraction accuracy exceeding 96% in Bijie City, effectively suppressing dark object interference (e.g., false positives due to topographic and anthropogenic features) while preserving water body boundary integrity. Compared with single-index methods (e.g., MNDWI), this method reduces false positive rates caused by building shadows and terrain shadows by 15–20%, and improves the IoU (Intersection over Union) by 6–13% in typical karst sub-regions. This research provides a universal technical framework for large-scale dynamic monitoring of lakes and reservoirs, particularly addressing the challenges of regional adaptability and cloud compositing in karst environments.

1. Introduction

Water is crucial for sustaining life, forming the foundation of ecosystems, and supporting social and economic activities. Inland lakes and reservoirs, as core components of surface freshwater resources, play a vital role in human production and life, profoundly impacting regional economic prosperity and ecological balance. However, with evolving climate patterns—specifically global warming-induced shifts in precipitation regimes (e.g., increased frequency of extreme droughts/floods) and rising temperatures that accelerate surface water evaporation [1,2]. Therefore, continuous monitoring of lake and reservoir areas, water levels, and related storage changes is essential for achieving sustainable water resource management, effective flood prediction, in-depth exploration of hydrological cycles, understanding climate change patterns, and assessing human impact [3,4].
Traditional approaches for investigating lake and reservoir dynamics are typically constrained to small spatial scales, failing to enable long-term continuous monitoring [5]. This limitation results in delays in integrating lake/reservoir change information and regional interconnections, thereby undermining decision-making efficiency based on water body variations. Additionally, estimations of storage changes remain heavily dependent on field observations, which are time-consuming, labor-intensive, and ill-suited for scaling to meet large-scale monitoring requirements [6]. Existing global datasets (e.g., GLWD—Global Lake and Wetland Database, GREALM—Global Reservoir and Lake Map) are hindered by resolution constraints (300 m) and temporal limitations. This study leverages 10 m Sentinel-2 imagery and cloud compositing techniques to substantially enhance extraction accuracy.
With the rapid development of remote sensing technology, its advantages of wide observation range, strong periodic revisit capability, and low monitoring cost have gradually demonstrated its potential for macro, multi-temporal, multi-spectral, dynamic, and repeated monitoring of surface information, providing possibilities for large-scale lake and reservoir water body change monitoring [7,8]. Lake and reservoir areas and water level elevations, as key parameters for calculating storage changes, have been widely incorporated into research on continuous lake and reservoir change monitoring [9]. By combining water body surface areas with water level information, automatic and precise extraction of multi-temporal lake and reservoir boundaries from remote sensing imagery can further monitor changes in lake and reservoir surface areas and storage volumes [10].
Current water body extraction methods based on optical remote sensing imagery primarily include object-oriented methods [11,12,13], deep learning methods [12,14,15], and band combination methods [16,17]. Object-oriented methods are susceptible to segmentation thresholds and classification criteria, making them highly empirical [13] (Su et al., 2022, who optimized segmentation parameters for karst water bodies using multi-scale object partitioning). Deep learning methods require substantial sample data, with recent advances focusing on small-sample adaptation (e.g., Liang et al., 2021 [15], who proposed a transfer learning framework for water body extraction in data-scarce karst areas). In contrast, the water body index method, as a type of band combination method, extracts water body areas by constructing ratios between bands, offering the advantages of simplicity, high extraction accuracy, and speed [17] (Wang et al., 2023, who developed a multi-temporal index to enhance water-body/non-water-body discrimination in seasonal karst regions). It has been successfully applied in the extraction and dynamic monitoring of various surface water bodies, including lakes, reservoirs, urban landscape water bodies, and rivers [18,19].
When applying remote sensing technology to large-scale feature extraction, the choice of data sources is crucial. Landsat series satellite imagery and the increasingly popular Sentinel-2 imagery are important options. Sentinel-2 imagery, with its superior spatial resolution (10 m for visible/near-infrared bands, compared to 30 m of Landsat series) and shorter revisit cycle (5 days via dual satellites Sentinel-2A/B), has become the preferred data source for scientists worldwide [20]. However, the first one is limited by algorithmic transferability: Most existing algorithms are tailored to specific geographic features (e.g., flat plains or temperate forests), leading to degraded performance in karst landscapes like Bijie City. For instance, MNDWI is prone to interference from shadows in karst terrain [21], whereas AWEIsh exhibits decreased accuracy in urban areas due to reflections from buildings [22]. Cloud occlusion challenge: Cloud cover in optical imagery does not allow direct water body extraction but introduces information loss. Existing methods often fail to reconstruct occluded regions, whereas this study employs a temporal compositing strategy to infer water status from multi-temporal frequency analysis, avoiding the misinterpretation of ‘cloud-penetrating’ capabilities. Additionally, with the improvement of image spatial resolution, the texture and other features of ground objects become clearer, but this also increases the number of non-water target objects during extraction and the difficulty of their removal. Existing water body data products, such as the JRC Global Water Body Dataset and various land cover products [23], still have deficiencies in resolution and dynamic water body distribution.
Given this, this study focuses on Bijie City, Guizhou Province, utilizing the Google Earth Engine (GEE) remote sensing cloud platform and Sentinel-2 remote sensing imagery to propose a novel multi-feature, multi-level extraction framework—a core contribution distinguishing it from existing studies. Unlike single-index methods (e.g., MNDWI prone to karst topographic shadows, AWEIsh less effective in urban areas) or deep learning methods requiring massive samples, our framework fuses water indices, spectral bands, and DEM data, and adds cloud compositing—specifically optimizing for karst landscapes’ unique challenges (surface seepage, rocky desertification). While validated in Bijie’s karst landscape, the approach is designed to be globally transferable, aiming to establish a universal methodology for large-scale lake and reservoir monitoring. This framework integrates cloud compositing and multi-feature fusion to address regional adaptability and cloud resilience challenges—outperforming low-resolution products (e.g., JRC Global Water Body Dataset, 300 m;—providing a scalable solution for dynamic water body extraction worldwide.

2. Study Area and Data

2.1. Study Area Overview

Guizhou Province is located in the eastern part of the Yunnan–Guizhou Plateau in southwestern China, with a west-high-east-low terrain and an average altitude of 1100 m. Karst landforms cover 61.9% of the province, forming unique landscapes such as peaks, caves, and underground rivers. Bijie City, Guizhou Province, serves as an important ecological barrier in China’s southwestern karst region, where the annual average precipitation reaches 1100 mm. However, the karst topography causes severe surface water seepage, and human activities have led to rocky desertification covering 15.2% of the area, exacerbating the vulnerability of the water body system. Its lake and reservoir water resource system is strategically significant for regional poverty alleviation and ecological restoration. Bijie City currently has 12 lakes (with areas larger than 1 km2) and 21 reservoirs (with a total storage capacity of 160 million m3). In Section 4.1.2, the statistics of 96 lakes and reservoirs refer to the total number of different scale classifications (large-sized, S > 1 km2; medium-sized, 0.1 km2 ≤ S ≤ 1 km2; and small-sized, S < 0.1 km2, ≥10 pixels), including smaller water body units. Among them, the Jiayan Water Conservancy Project, the largest water conservancy project in the Wumeng Mountains, has a total storage capacity of 1.325 billion m3, serving over 85% of agricultural irrigation needs in counties such as Qixingguan and Nayong. Under the dual challenges of karst landform development and rocky desertification, the lake and reservoir water body system in Bijie City exhibits pronounced vulnerability. Dynamic changes in the water body system not only threaten regional water supply security but also restrict the effectiveness of rocky desertification control through their impact on groundwater recharge and local climate regulation (Figure 1).

2.2. Data

The data system of this study is constructed around a three—tier framework of “core remote sensing data—ancillary topographic data—validation reference data”. The preprocessing and screening of each type of data are designed to improve the extraction accuracy of lakes and reservoirs in karst areas and ensure the reproducibility of the method. Details regarding data types, sources, and processing procedures are as follows:

2.2.1. Sentinel-2 Remote Sensing Imagery

This study employs Sentinel-2 MSI (Multi Spectral Instrument) remote sensing data released by the European Space Agency (ESA), encompassing two satellites, Sentinel-2A and Sentinel-2B. Their collaborative operation enables a global coverage cycle of five days, with spatial resolutions of 10 m (B2, B3, B4, B8), 20 m (B5, B6, B7, B8A, B11, B12), and 60 m (B1, B9). The original imagery is processed through the GEE platform, including:
(1)
Radiometric Calibration: Converting original DN values to Top-of-Atmosphere (TOA) reflectance.
(2)
Atmospheric Correction: Using the Sen2Cor algorithm to eliminate the effects of aerosols, water vapor, and ozone (L2A product).
(3)
Cloud Mask Generation: Employing the QA60 band bitmask (bits 10 and 11) to remove clouds, snow, and sensor non-water targets.
(4)
Temporal Composite: Conducting Maximum Value Composite (MVC) on monthly imagery from 2017 to 2021 to enhance the stability of water body information, a critical step for mitigating cloud interference in long-term karst water body monitoring.

2.2.2. Ancillary Data

Digital Elevation Model (DEM) [24]: 30 m resolution Shuttle Radar Topography Mission (SRTM) DEM data provided by the United States Geological Survey (USGS) is used. Through topographic parameter calculation, the shadow interference caused by complex terrain in karst areas is mitigated. Specific processing is conducted on the ArcGIS 10.3 platform: first, slope and roughness parameters are extracted from the DEM. Slope is used to identify steep terrain areas (slope > 15°), where topographic shadows are easily confused with the spectrum of water bodies and require subsequent targeted removal; roughness assists in distinguishing between natural terrain and man-made structures, reducing misjudgment of building shadows. To improve the accessibility and promotability of the method, this study supplements QGIS (an open-source geographic information system software; official download link: https://www.qgis.org/en/site/forusers/download.html, accessed on 29 July 2024) as an alternative tool. Its built—in “Terrain Analysis” module can achieve the same slope and roughness calculation as ArcGIS, ensuring that researchers without access to commercial software can also reproduce the topographic shadow suppression process. This part of the data, together with the reference datasets in Section 2.2.3, supports the validation and promotion of the method, forming a complete closed loop of “data-tool-validation”.

2.2.3. Reference Datasets

(1)
JRC Global Water Body Dataset (1984–2020) [23]: Developed by Pekel et al. (2016) [23], this is a 300 m resolution monthly binary water body product that contains spatial distribution and temporal dynamic information of global water bodies. In this study, it is mainly used to validate the long-term stability of the proposed algorithm—by comparing the area deviation between the JRC data and the extraction results of this study from 2017 to 2021, and the consistency of the algorithm across multi-temporal scales is evaluated.
(2)
ESA WorldCover 2020 [25]: Released by Zanaga et al. (2023) [25], this is a 10 m resolution global land cover classification data covering 11 land cover types (e.g., water bodies, vegetation, buildings, bare land). In this study, it is used to assist in excluding misclassified man-made targets (e.g., buildings, roads)—by overlaying the “built-up land” and “road” layers of WorldCover, secondary screening is conducted on suspected non-water areas in the initial extraction results, improving the purity of the final lake and reservoir extraction.

3. Lake and Reservoir Extraction Method Based on Sentinel-2 Imagery

3.1. Technical Workflow

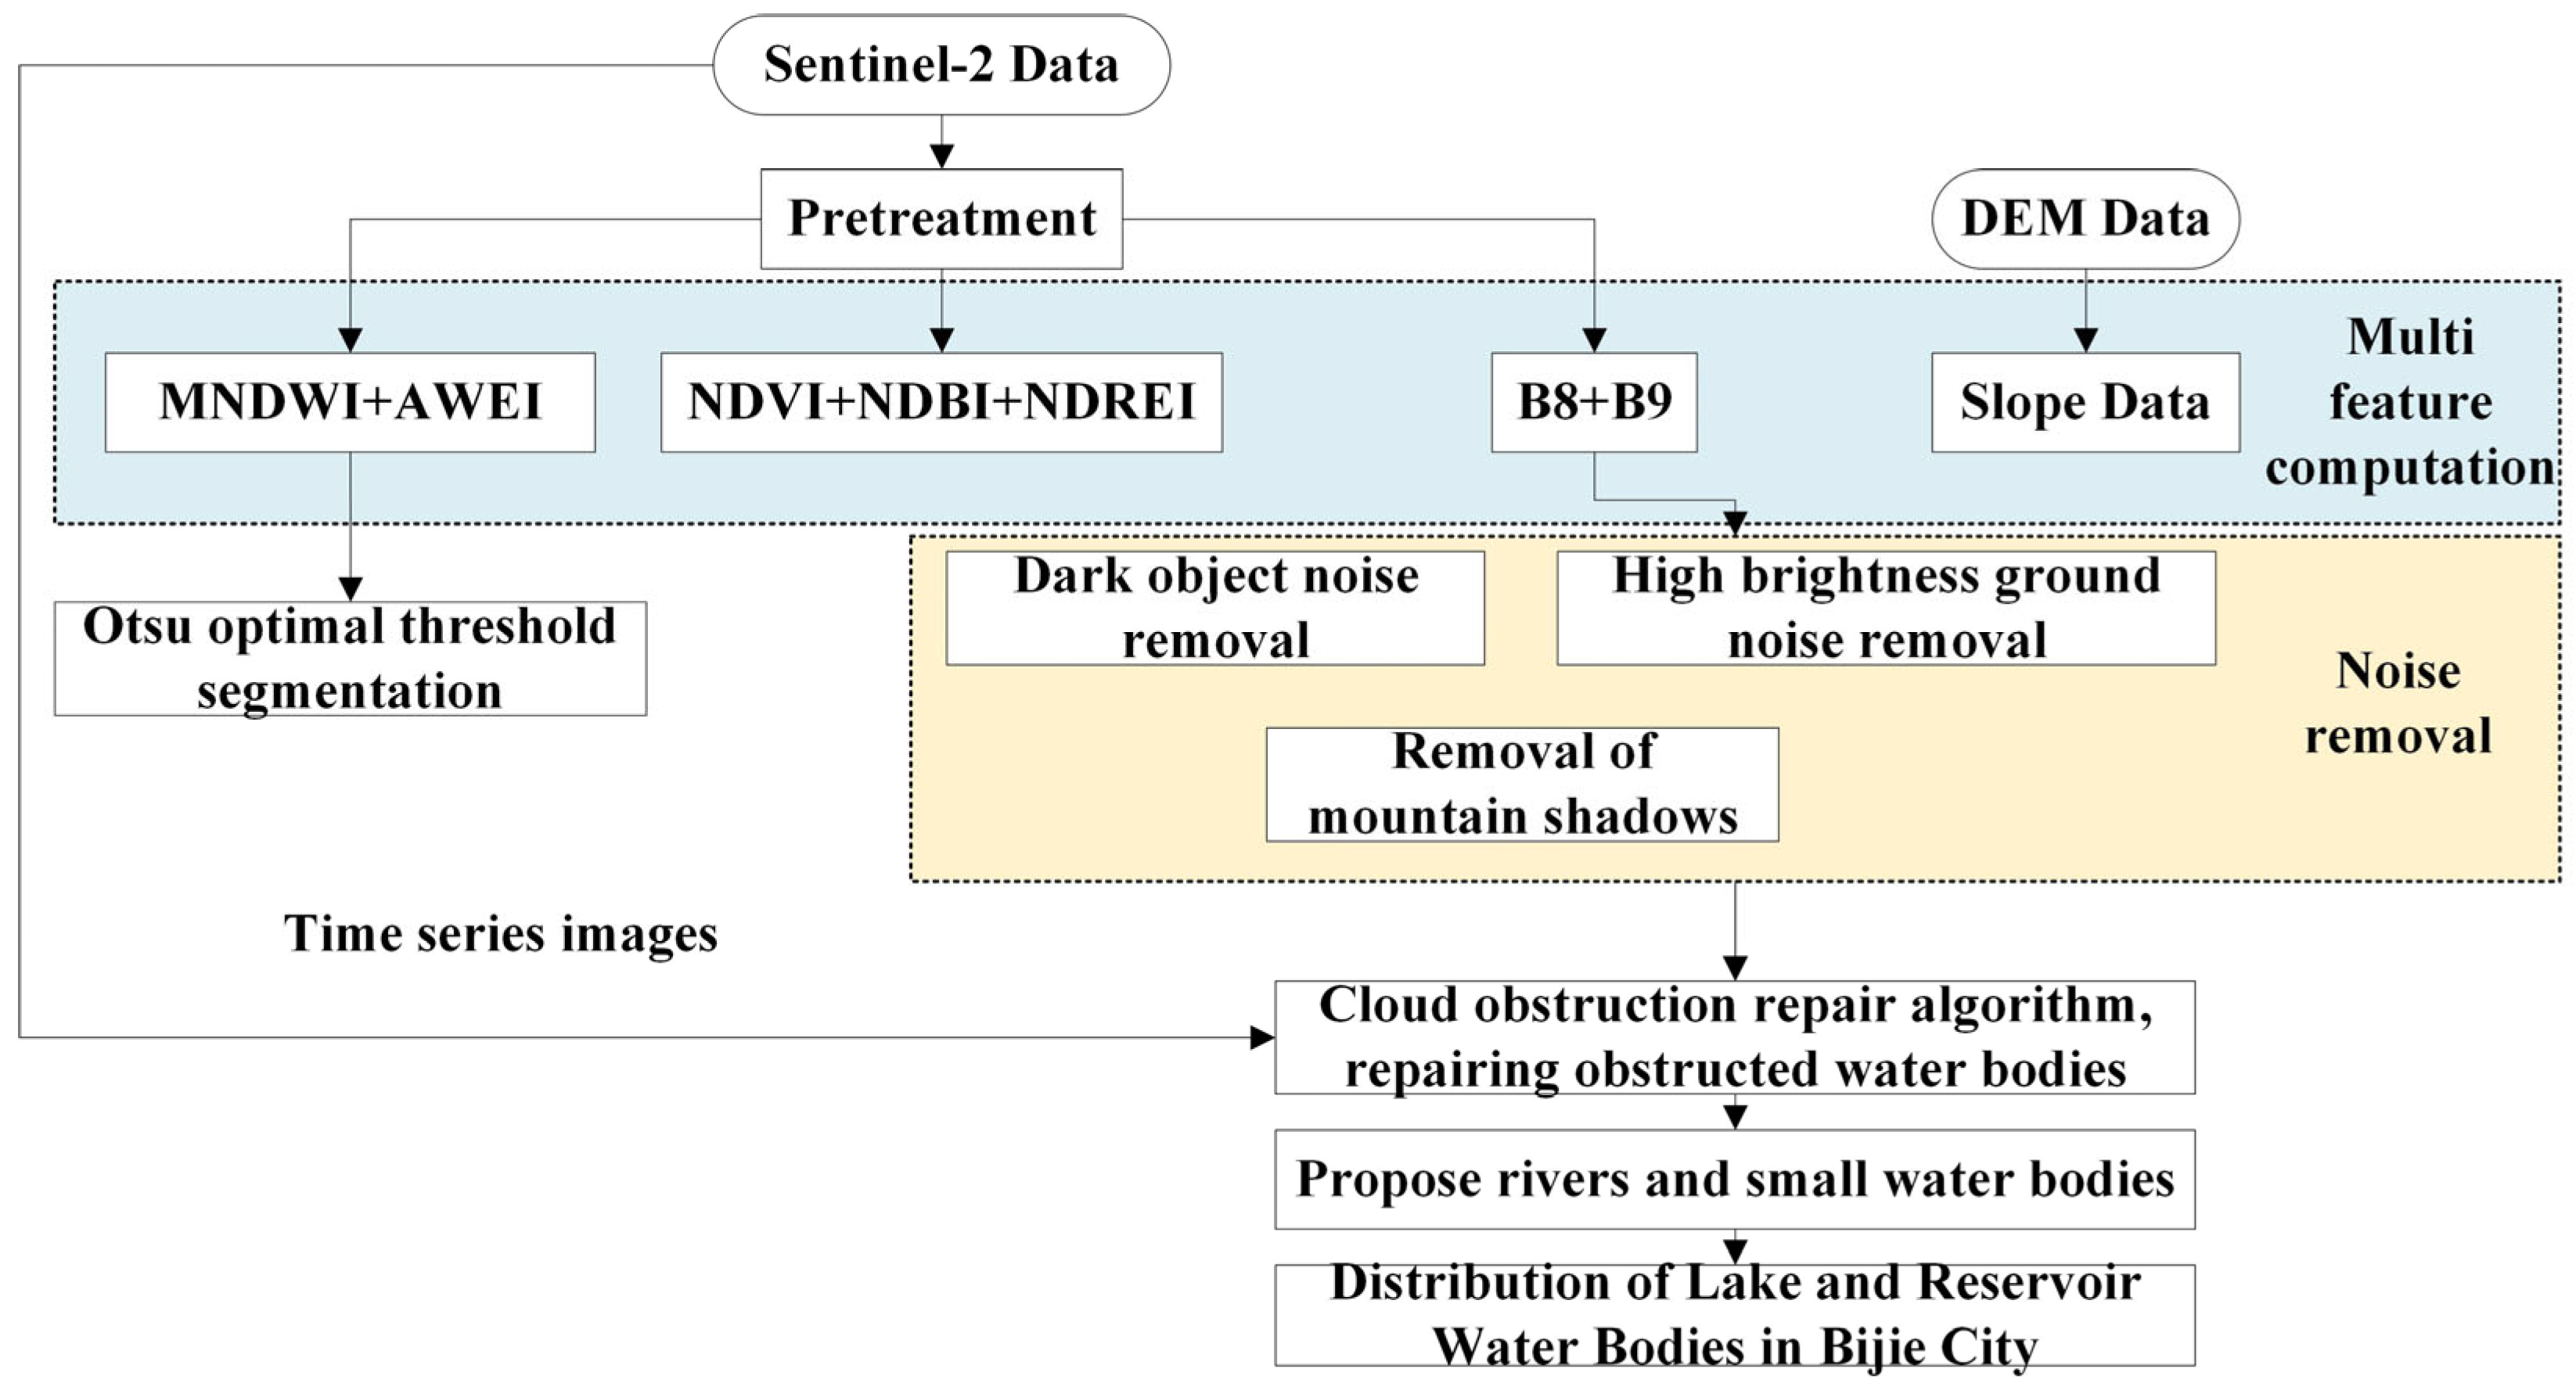
The technical workflow for lake and reservoir extraction in Bijie City is illustrated in Figure 2. The study utilizes the Google Earth Engine (GEE) platform for fully automated processing: first, Sentinel-2 imagery is screened and preprocessed with radiometric correction and cloud masking; second, a multi-feature dataset (including water body indices, spectral bands, and DEM terrain data) is constructed; then, coarse extraction is achieved through water body index threshold segmentation, combined with a cloud cover restoration algorithm to refine water body boundaries; finally, morphological analysis is applied to remove rivers and small water bodies, ultimately yielding a hierarchical distribution of lakes and reservoirs.

3.2. Remote Sensing Imagery Cloud Removal and Atmospheric Correction

Sentinel-2 remote sensing imagery is preprocessed on the GEE platform. Firstly, cloud and shadow removal are performed on the Sentinel-2 imagery set; secondly, the “QA60” band of GEE Sentinel-2 imagery is used to remove opaque clouds and cirrus clouds; finally, based on the solar angle and altitude angle attributes of each image, the locations of cloud shadows are determined through geometric calculations, and the dark pixels generated by cloud shadows are masked. Additionally, the L1C product is atmospherically corrected to obtain the L2A product.

3.3. Multi-Feature Selection

Water bodies exhibit low reflectance and are prone to confusion with shadows caused by buildings, hills, and vegetation. Accurate water body extraction at large scales based on a single water body index is often challenging, leading to missed or over-extracted areas. Therefore, this study comprehensively selects five indices: the Modified Normalized Difference Water Index (MNDWI) [21], Automated Water Extraction Index (AWEIsh) [22], Normalized Difference Vegetation Index (NDVI) [26], Normalized Difference Built-up Index (NDBI) [27], and Normalized Difference Red-Edge Index (NDREI) [28] to extract lake and reservoir water bodies in Bijie City, Guizhou Province. The formulas and characteristics of each index are presented in Table 1. Among them, MNDWI and AWEIsh are the primary water body indices. MNDWI enhances the difference between the green band (B3) and the short-wave infrared band (B11) to suppress building and soil shadows; AWEIsh [22] improves the suppression of topographic shadows and dark surfaces through the weighted combination of B2, B3, B8, B11, and B12 bands. The remaining indices assist in eliminating the influence of non-water bodies.

3.4. Otsu Optimal Threshold Segmentation

In MNDWI and AWEIsh water index images, water bodies and non-water bodies exhibit a clear bimodal distribution. Therefore, threshold segmentation can be used for simple and effective water body segmentation. The Otsu algorithm [29] is employed to determine the optimal threshold for the water index images. This well-established method maximizes the inter-class variance between water and non-water pixels to derive the optimal threshold T, which is widely used in remote sensing image segmentation for its robustness [29]. Pixels with values greater than the threshold are identified as water bodies, and the results from the two water indices are combined to obtain coarse water body extraction.

3.5. Non-Water Targets Removal

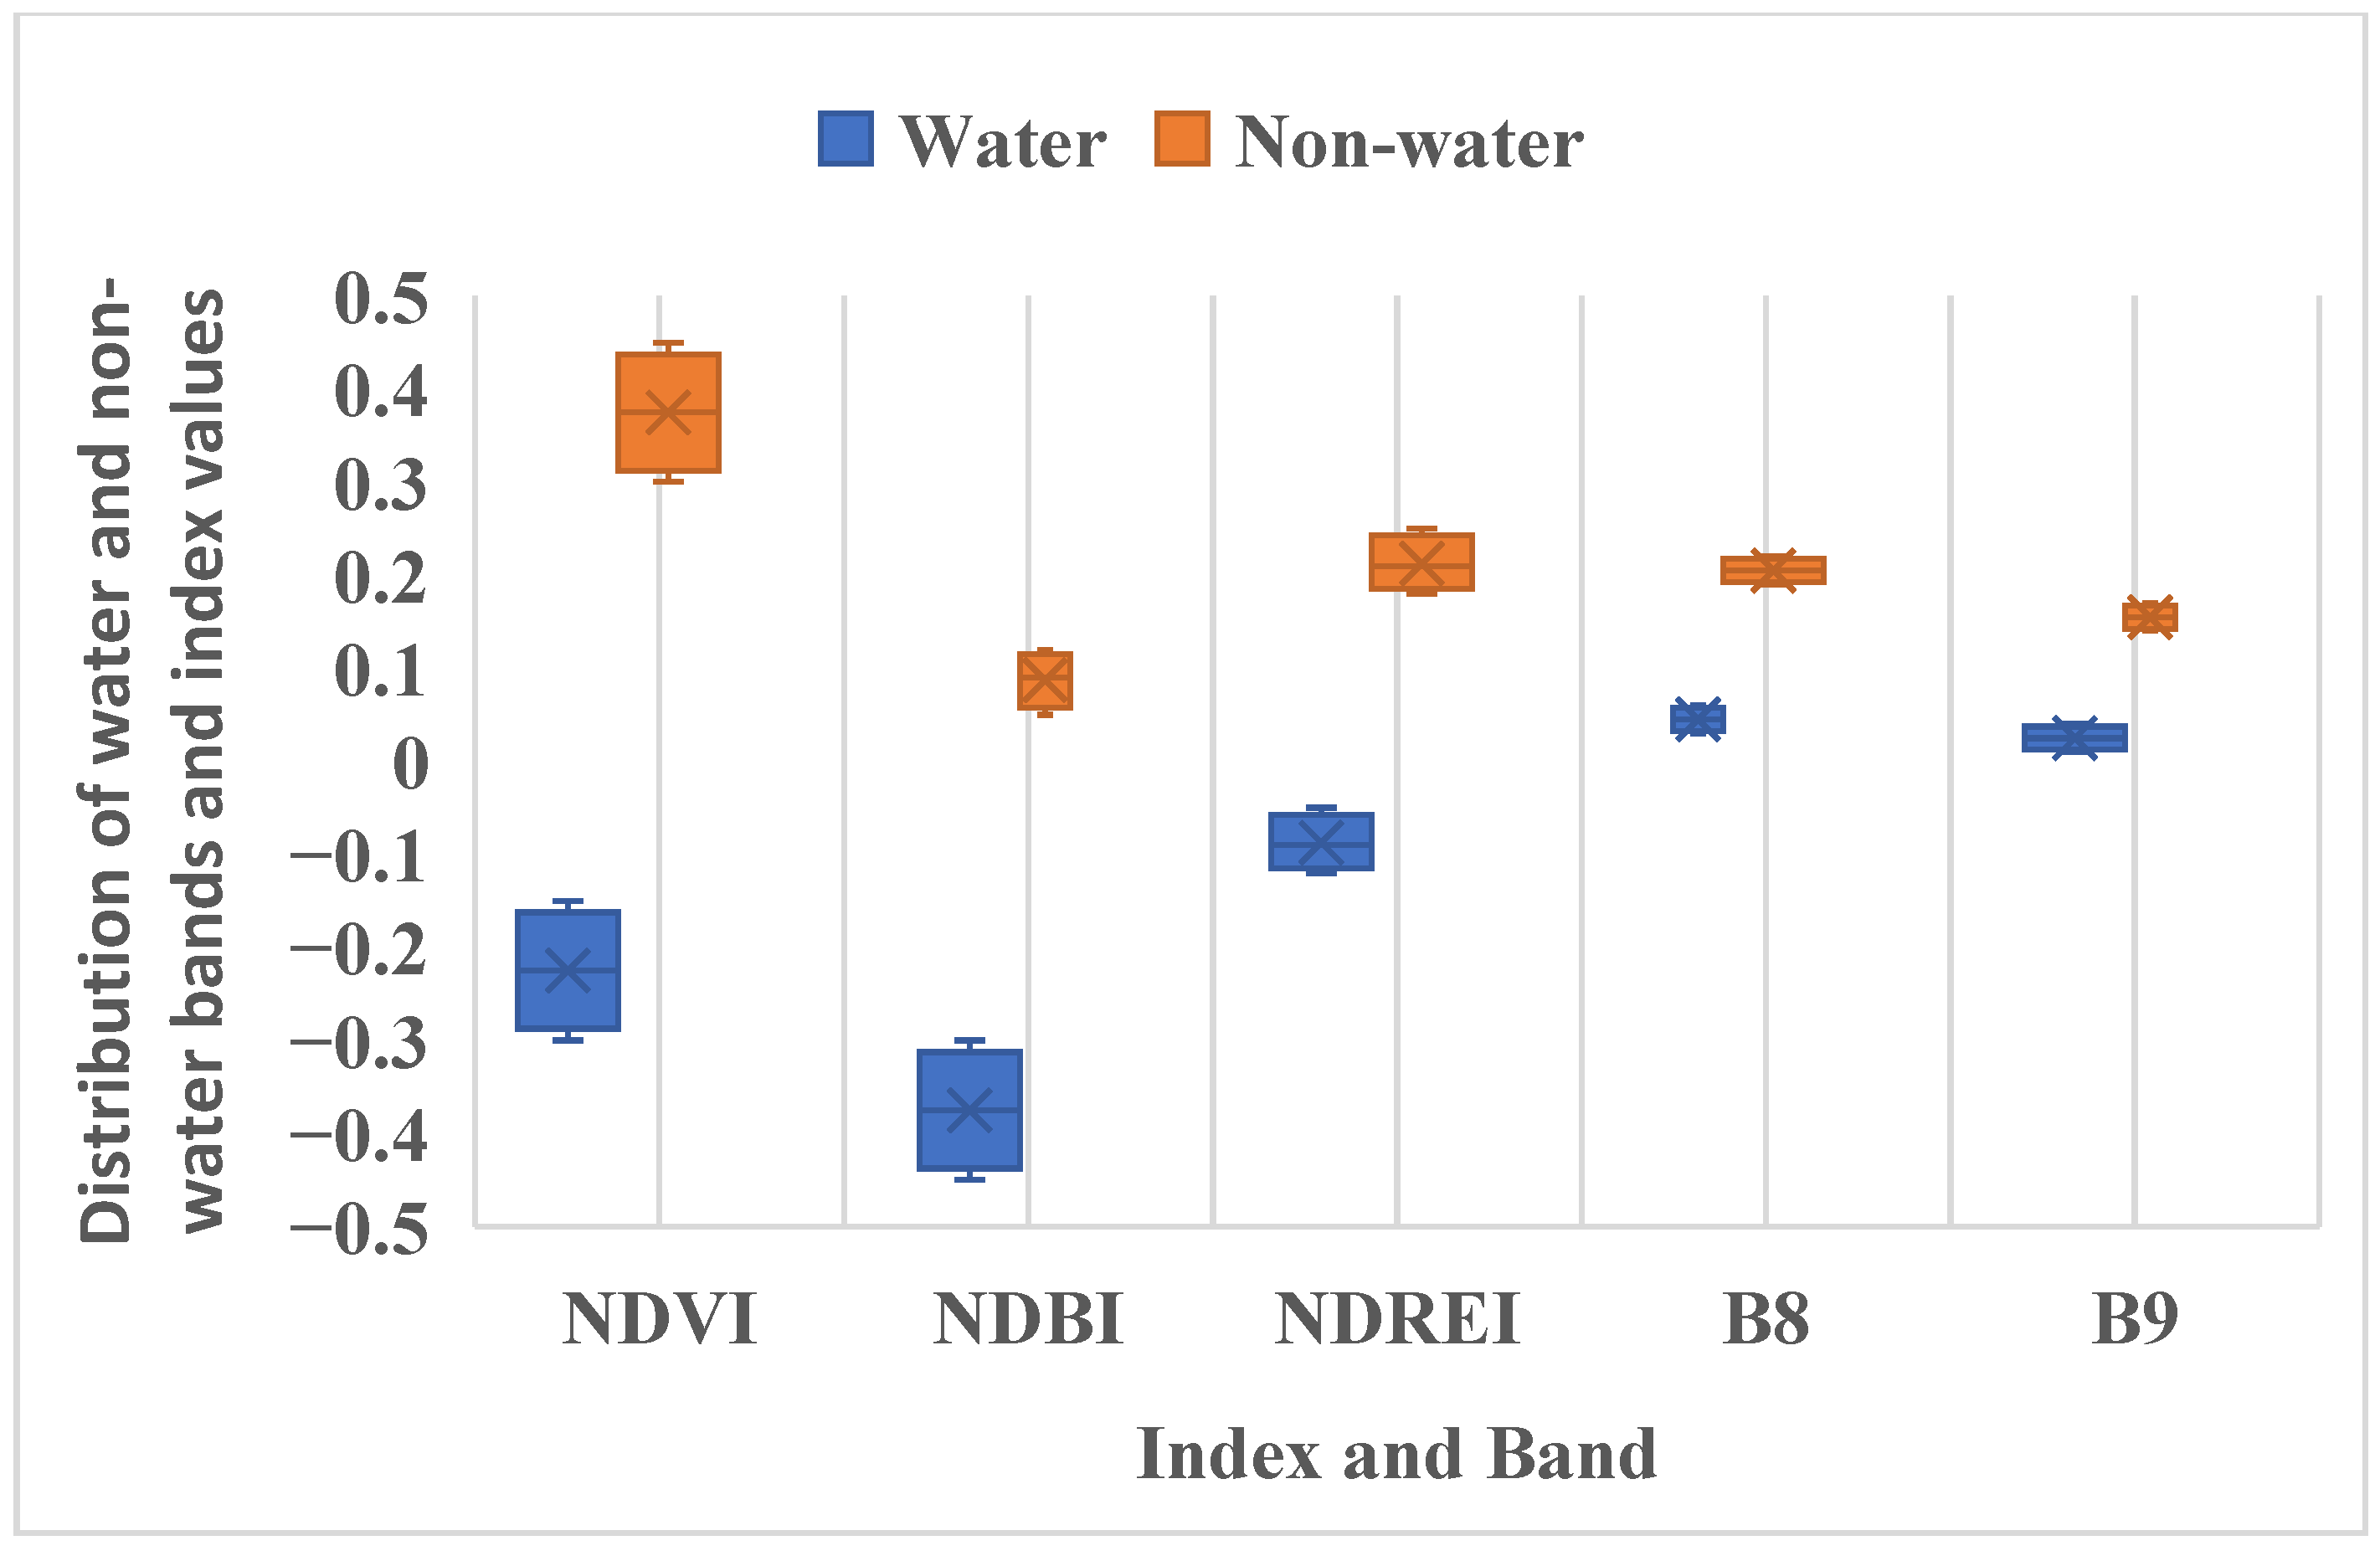
Based on the JRC Global Water Body Dataset, 10,000 water and non-water body samples were sampled to statistically analyze the reflectance distributions of NDVI, NDBI, NDREI, B8, and B9 (Figure 3). Non-water targets removal rules were established as follows: NDVI > 0.2, NDBI > −0.05, NDREI > 0.1, B8 > 0.18, and B9 > 0.15. Meanwhile, topographic shadows with slopes greater than 15° were eliminated to improve the purity of water body extraction (Figure 3).
Furthermore, SRTM digital elevation data is used to calculate slope, which further aids in the removal of topographic shadows. To ensure the integrity of water body information, topographic shadows with slopes greater than 15° are defined as non-water targets and removed, enhancing the accuracy of shadow removal.
Slope was calculated based on SRTM DEM, and field surveys showed that areas with slopes > 15° are mostly steep terrains, where shadows differ significantly from water body spectra, thus being defined as non-water targets to be removed.

3.6. Cloud-Occluded Water Body Compositing

When using monthly composite imagery for water body extraction, cloud occlusion may lead to partial loss of water body information. To address cloud occlusion in Sentinel-2 imagery, a multi-temporal compositing framework is implemented via the Google Earth Engine (GEE) platform, consisting of the following steps: (1) Monthly composite preparation: All available Sentinel-2 L2A images (2017–2021) are first processed into cloud-masked monthly composites using the Sen2Cor atmospheric correction product. Cloud-free pixels are identified via the QA60 band, and only images with cloud cover < 30% are retained. (2) IF calculation: For each pixel, the inter-observational water frequency (IF) is computed as the ratio of cloud-free water detections to total cloud-free observations. (3) Supervised classification model: A random forest classifier is trained using 5000 manually annotated samples (water/non-water) from cloud-free composites. The model uses spectral indices (MNDWI, AWEIsh) and F values as features to establish the mapping between IOF and water probability. (4) Cloud occlusion inference: For cloud-masked pixels, water probability is predicted using the trained model, and pixels with probability > 0.7 are classified as water bodies. This process integrates multi-temporal occurrence patterns to reconstruct occluded regions. The formula is [30], Please refer to Appendix A for the code:
IF i = N i wet N i wet   +   N i dry = N i wet N   -   N i masked
where N i wet , N i dry , and   N i masked represent the number of times a pixel i appears as a water body, non-water body, and cloud-occluded region, respectively, in N monthly composite images. Each pixel within the region has a corresponding IF value, with higher IF values indicating more frequent appearances as water bodies across all monthly composite images (Figure 4).
For each monthly composite image, the statistical relationship between the water occurrence status of unoccluded pixels and their IF values is first estimated using supervised classification. This relationship is then leveraged to infer the water occurrence status of all pixels in the image, using their IF values as input. The basic assumption of this method is that pixels with higher IF values are more likely to be water bodies in a given image. Based on this idea, the water body extraction results from 2017 to 2021 are composited.

3.7. Removal of Rivers and Small Water Bodies

Focusing on lake and reservoir water resource management, the extraction results may include narrow rivers and small water bodies that are difficult to distinguish from adjacent land features due to Sentinel-2’s 10 m spatial resolution. Although these water bodies are ecologically significant, their narrow width (often <30 m) and complex surrounding environments lead to mixed-pixel effects in Sentinel-2 imagery, affecting extraction accuracy. Therefore, the shape index (SI) is employed to separate lakes/reservoirs from linear water features, with the understanding that detailed river studies require higher-resolution data or specialized classification approaches, calculated as [23]:
SI = L 4 S
where L is the perimeter of the water body boundary and S is the area of the water body. Through sampling and statistical analysis of lakes, the shape indices of lakes are found to be distributed between 1–4 and 7–10. Therefore, water bodies outside these ranges are removed. Additionally, regions with fewer than 10 pixels are considered small water bodies and removed, as they do not belong to lakes or reservoirs. The final lake and reservoir water bodies are classified into three levels based on area: large lakes and reservoirs (S > 1 km2), medium lakes and reservoirs (0.1 km2 ≤ S ≤ 1 km2), and small lakes and reservoirs (S < 0.1 km2, ≥10 pixels).

3.8. Accuracy Validation Design

To systematically verify the accuracy of water body extraction (both coarse and fine extraction), a rigorous sampling design was implemented, adhering to the validation standards of global water body datasets [23]. The key details are as follows:
Sampling Data Source: High-spatial-resolution imagery (0.5 m spatial resolution) from Google Earth Pro [31] was used as the reference data, as it provides clear visual boundaries of water bodies (lakes, reservoirs, rivers, and small water bodies) and avoids the resolution limitation of low-resolution reference datasets (e.g., JRC, 300 m).
Sampling Method: A random sampling strategy was adopted to ensure the representativeness of samples. Samples were evenly distributed across the entire study area of Bijie City, covering four typical water body types: reservoirs, lakes, rivers, and small water bodies (S < 0.1 km2).
Sample Size and Confidence: A total of 1703 sample points were selected, which meets the requirement of 95% confidence level for accuracy evaluation (calculated based on the formula for sample size of categorical data, with a margin of error ≤ 3%) [23].
Validation Index Definition: For coarse extraction (Section 4.1.1), the extraction rate (ratio of correctly extracted sample points to total sample points of the target water type) was used to evaluate the integrity of water body information; for fine extraction (Section 4.1.2), precision, recall, and IoU (Intersection over Union) were used to evaluate the overall accuracy, considering both integrity and purity.

4. Results and Discussion

4.1. Accuracy Evaluation

4.1.1. Accuracy of Coarse Water Body Extraction

This study performs non-water target removal based on the water body extraction results from two water indices. During the coarse extraction stage, it is necessary to ensure that all water bodies are completely extracted, so the extraction rate is used to verify the accuracy of the coarsely extracted water bodies. The specific water body types, number of sample points, and accuracy are shown in Table 2. The results indicate that in the coarse extraction stage, the combination of the two water indices can effectively extract lakes and reservoirs, ensuring the integrity of water body information. Although the extraction rates for rivers and small water bodies are low, they do not belong to the category of lakes and reservoirs, so they do not affect the final extraction results of lakes and reservoirs. Since the coarse extraction stage needs to prioritize the integrity of water body information (to avoid missing extraction), the extraction rate can intuitively reflect the coverage capacity of lakes and reservoirs, while indicators such as overall accuracy are more suitable for the evaluation of the final fine extraction results.

4.1.2. Accuracy of Lake and Reservoir Water Body Extraction

For the final lake and reservoir extraction results, lakes and reservoirs of different sizes, locations, and geographical environments are selected. The boundaries of lakes and reservoirs are visually interpreted to validate the extraction accuracy. The number of samples and accuracy are presented in Table 3. It can be seen that the extraction accuracy of lakes and reservoirs in this paper is above 96%, demonstrating high accuracy.

4.2. Comparison of Extraction Effects of Different Algorithms

To validate the universality of the proposed water body extraction algorithm, two scenarios with abundant shadows—urban and mountainous areas—are selected as case studies to compare the non-water targets suppression capabilities of different algorithms. The results are shown in Figure 5. As can be seen from the figure, the proposed multi-feature and multi-level water body extraction method produces better results in both urban and mountainous areas. Single water indices generate varying degrees of non-water targets in urban areas, making it difficult to remove non-water target effects. Although they exhibit fewer non-water targets in mountainous areas, they are still affected by villages and some topographic shadows. The difference in extraction effects between the proposed algorithm and single indices is due to the fact that, in large-scale water body extraction, geographical differences determine that the spectral characteristics of each water body are not the same, making it difficult for a single index to distinguish between water bodies and non-water bodies. A single index often cannot determine a universal threshold, whereas the proposed algorithm relies on multi-feature and multi-level methods to eliminate various geographic non-water targets while avoiding the limitations of threshold determination for a single index.
Quantitative analysis based on Table 4 shows that the proposed method outperforms single MNDWI, AWEIsh, and NDWI algorithms in urban and mountainous areas. In urban areas, the IoU increases by 9.0%, 6.0%, and 15.0%, and the F1 score by 13.0%, 10.0%, and 17.0%; in mountainous areas, the IoU increases by 6.0%, 13.0%, and 20.0%, and the F1 score by 16.0%, 13.0%, and 20.0%. This advantage arises from the method’s targeted optimization for different geomorphic features: in urban areas, the fusion of MNDWI’s short-wave infrared sensitivity and AWEIsh’s vegetation suppression capability effectively reduces misjudgments caused by building shadows and artificial features; in mountainous areas, the combination of slope threshold for removing steep shadows and multi-index features minimizes spectral confusion between forest shadows and water bodies. In contrast, NDWI, relying on the green-near-infrared difference, is susceptible to vegetation and artificial feature reflections, showing the lowest accuracy in both regions. Although MNDWI and AWEIsh have respective advantages, their complementarity is insufficient. These results confirm the scientific validity of the study’s multi-stage processing strategy (coarse extraction for integrity and fine extraction for accuracy optimization) and the key role of “localized” integration of topographic and spectral features in enhancing algorithm universality and accuracy.

4.3. Cloud Occlusion Compositing Results

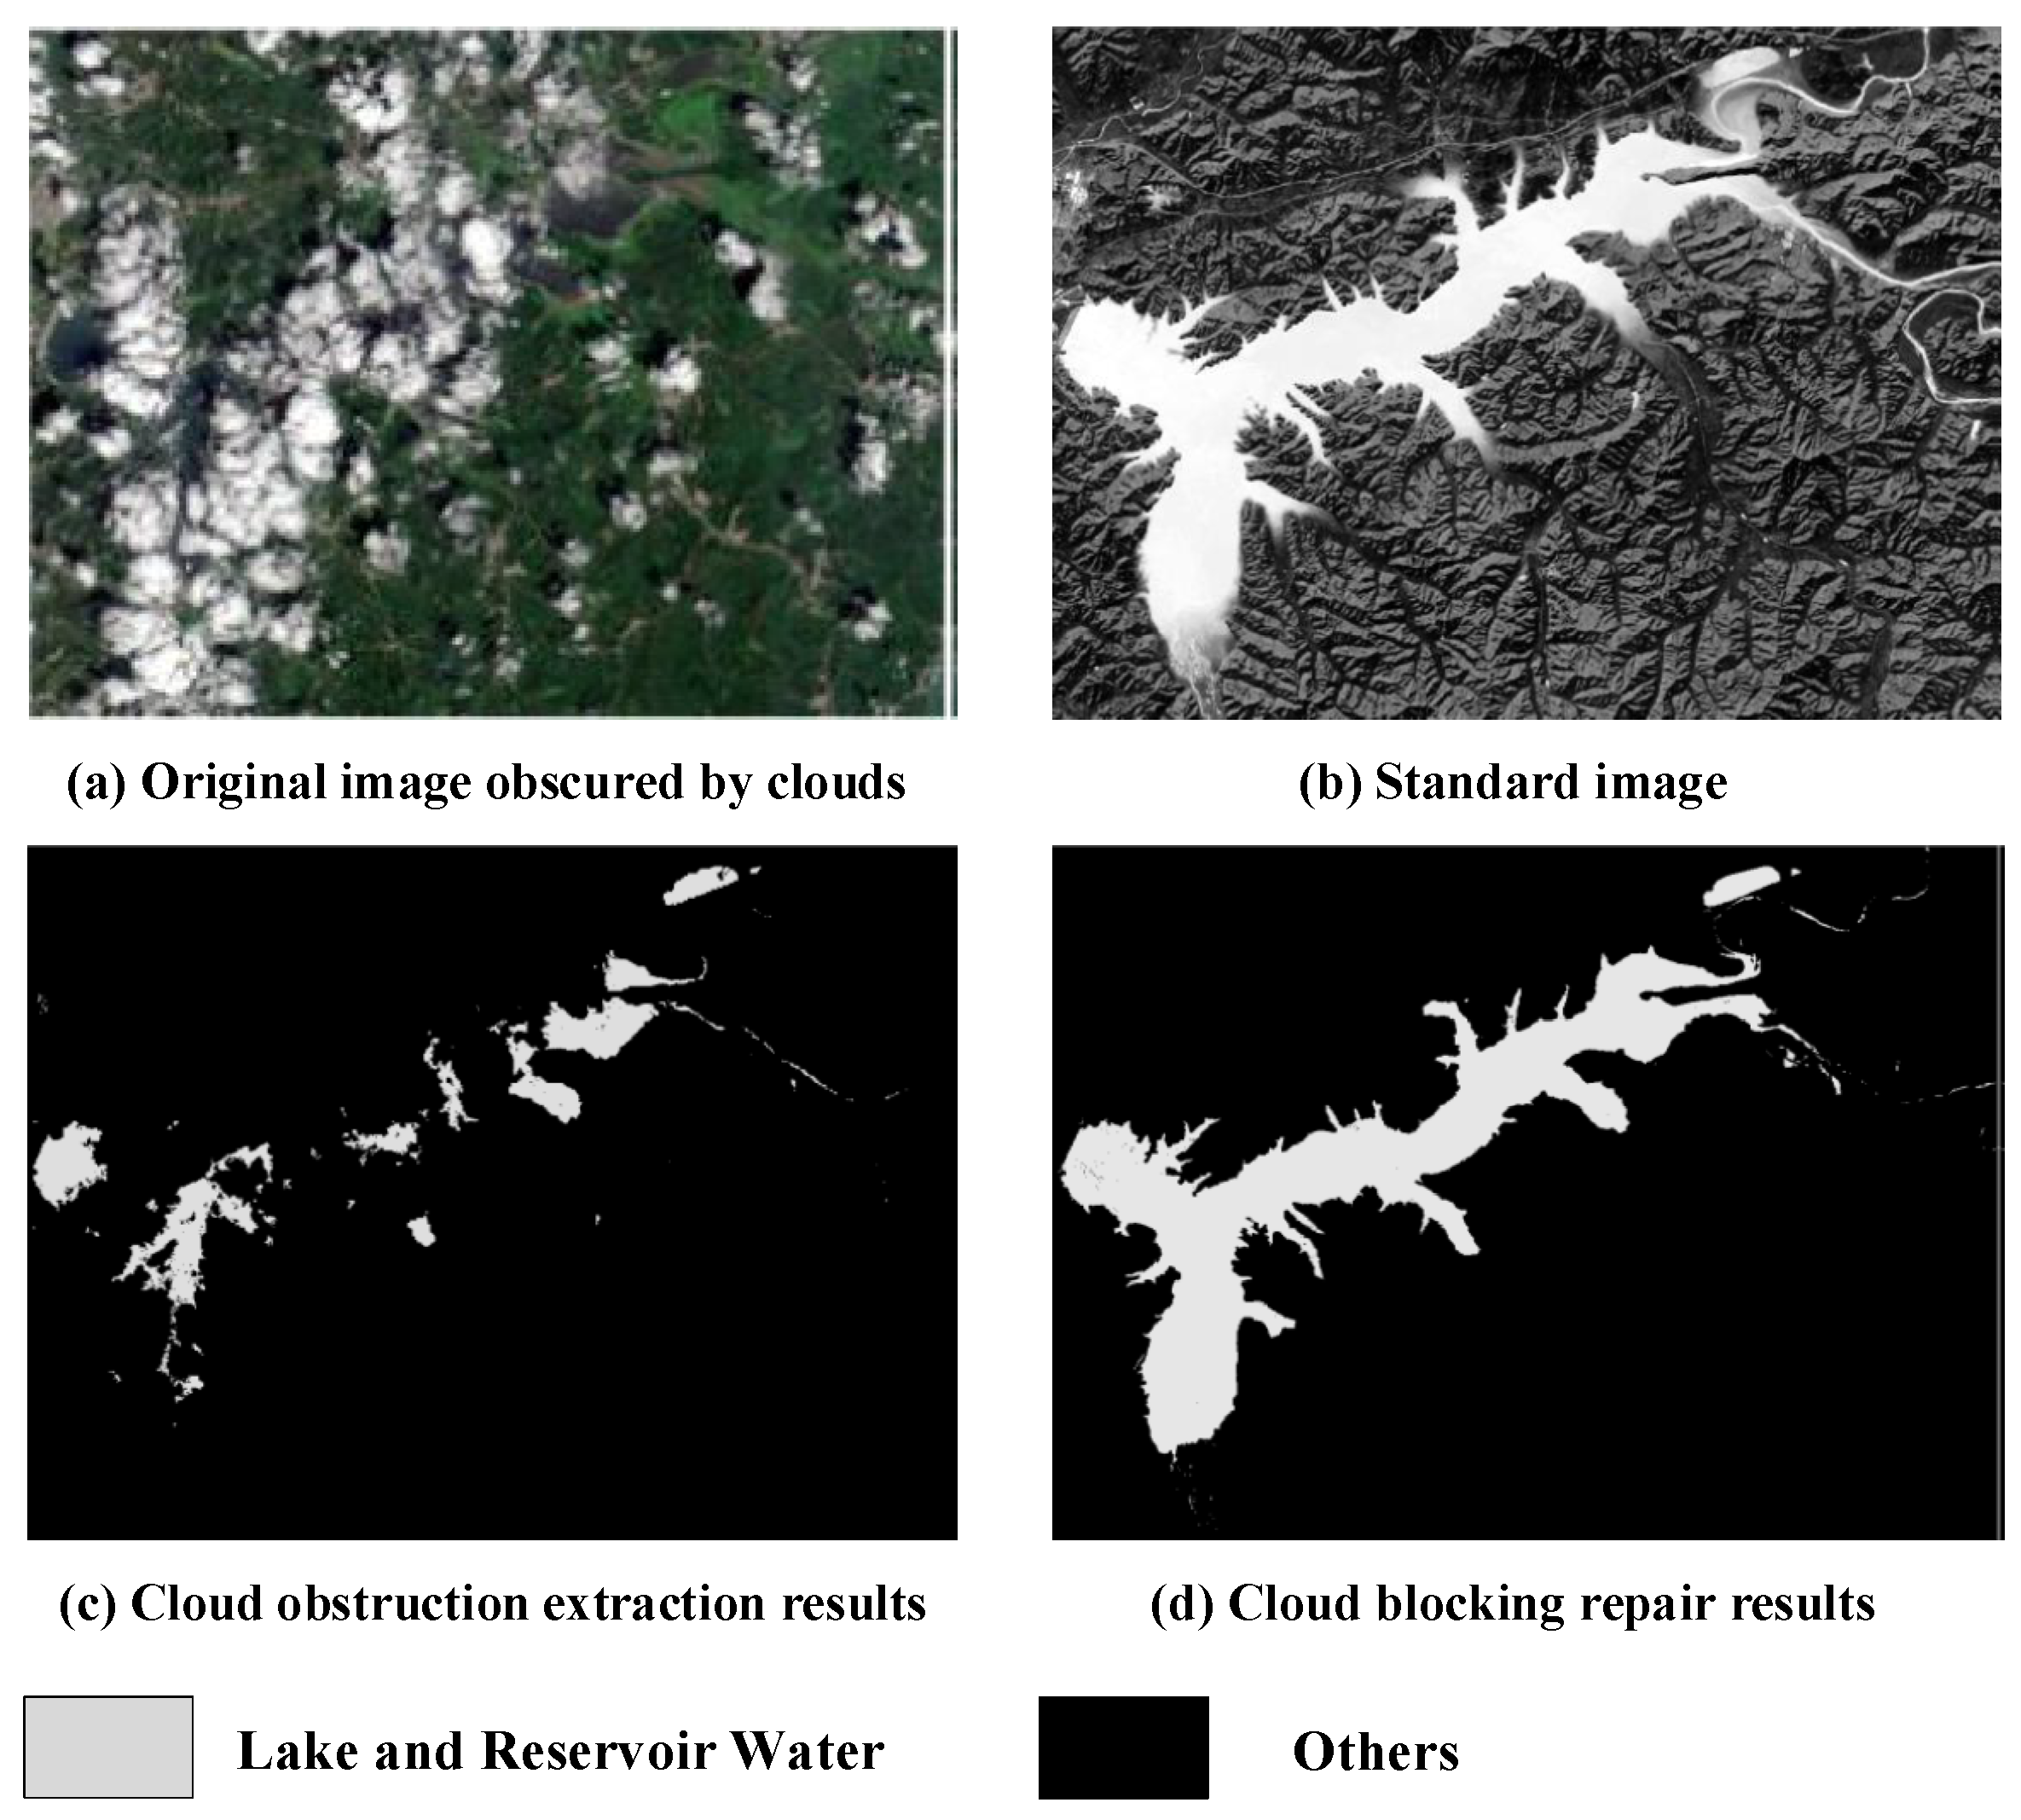
To validate the results of cloud occlusion compositing, a water reservoir area with heavy cloud cover in July 2024 is selected as a case study (Figure 6a). Only a small portion of the water body information is visible due to extensive cloud cover. The occurrence frequency IF within this region is then calculated (Figure 6b), where IF values range from [0,1], represented by a linear scale with black and white indicating 0 and 1, respectively. The proposed water body extraction algorithm is applied to extract water bodies from the occluded imagery (Figure 6c). Combining the IF image and the water body extraction result under cloud occlusion, the land feature category of the cloud-occluded region is inferred based on the IF value of known water bodies, achieving the purpose of compositing water bodies. The final water body compositing result is shown in Figure 6d. As can be seen from the figure, the cloud occlusion compositing algorithm accurately restores partially missing water bodies due to cloud occlusion, minimizing the impact of clouds and fog on the extraction results. This breakthrough overcomes the previous approach of using single-date imagery from different years as a substitute, resulting in more accurate extraction results.

4.4. Comparison of Different Products

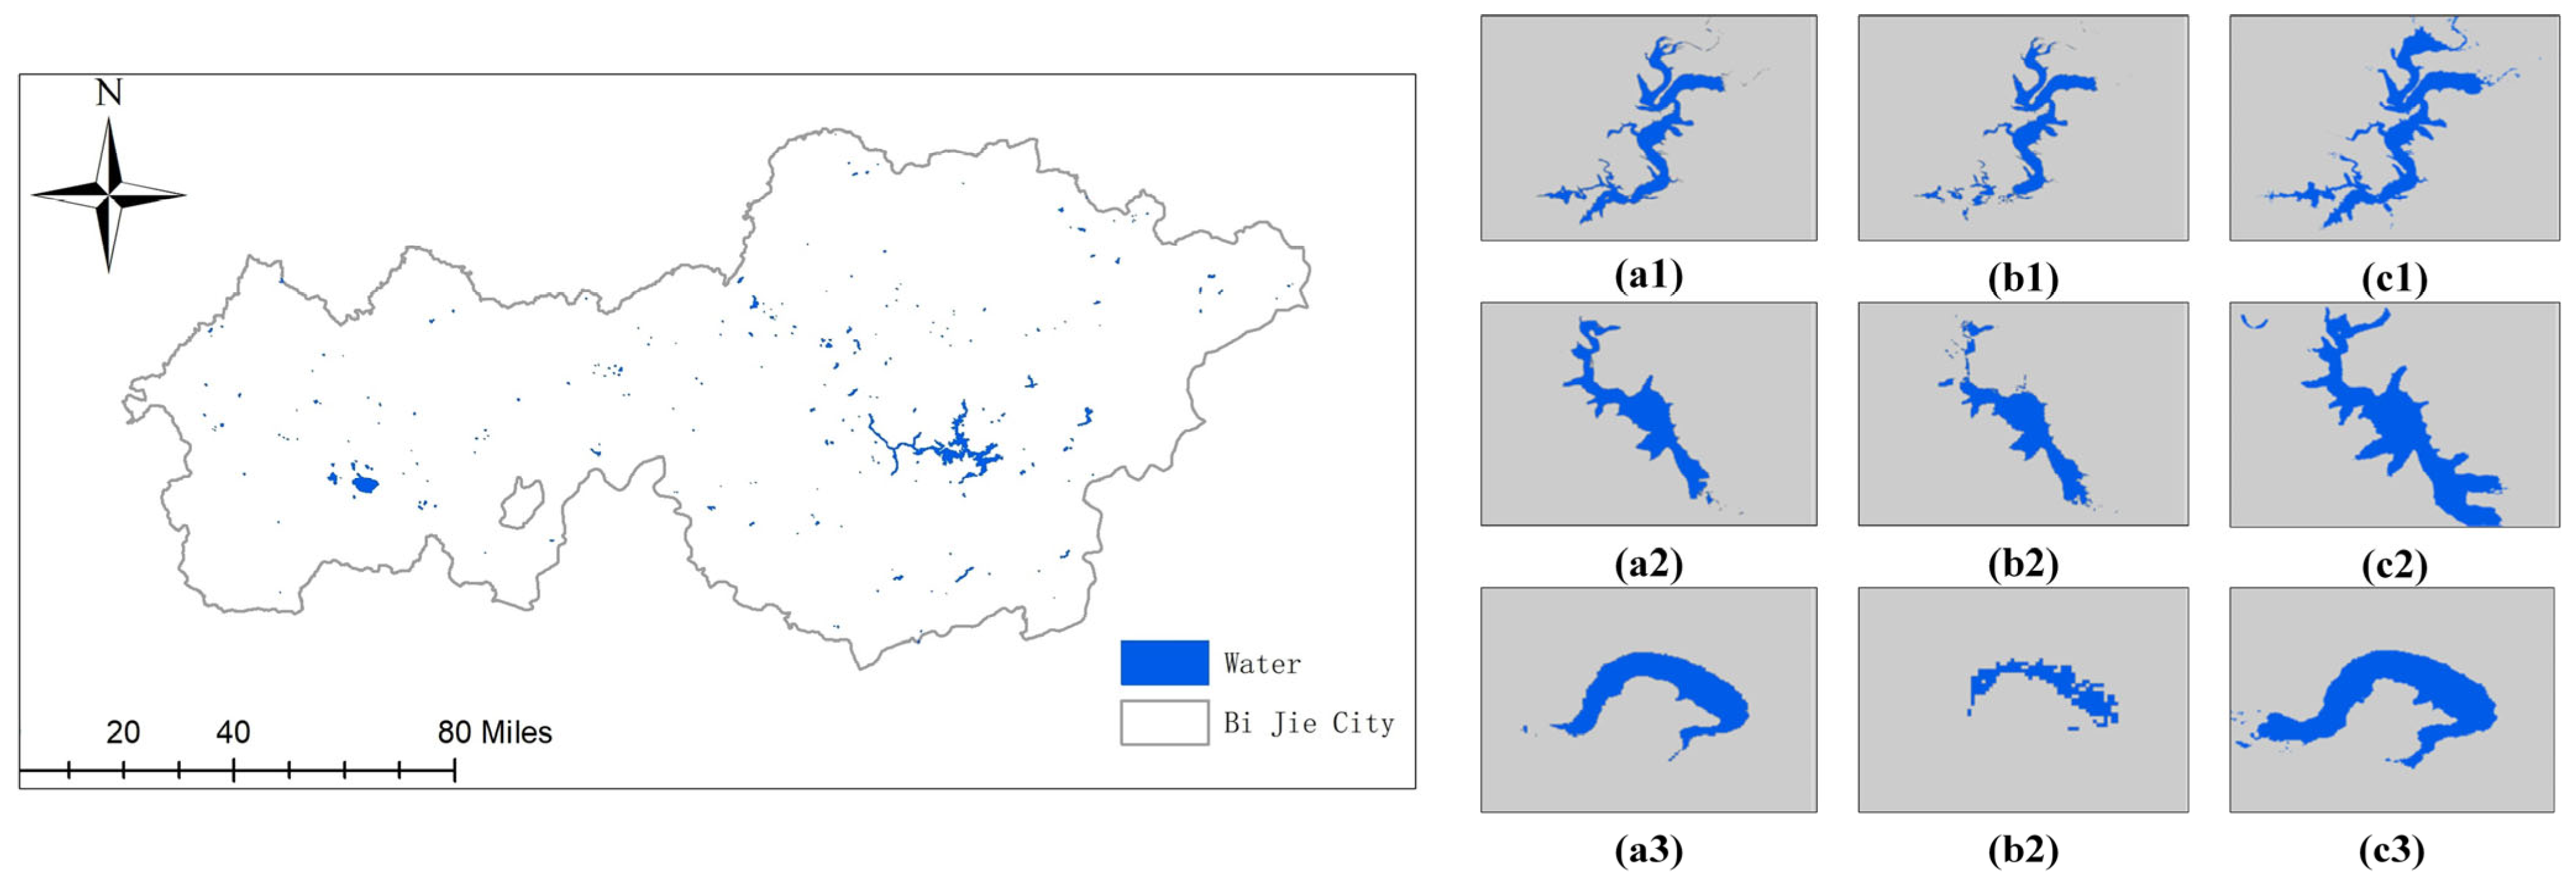
To quantitatively evaluate the final lake and reservoir results, 44 lakes and reservoirs were selected for comparison with the JRC Global Water Bodies dataset (July 2020) and ESA WorldCover 2020 land cover classification product (Table 5). As shown in the table, the proposed method extracted more water bodies than the JRC product, while yielding smaller lake and reservoir areas compared to WorldCover. This discrepancy with WorldCover can be attributed to seasonal hydrological dynamics: July (the end of the rainy season) saw water levels decline due to flood discharge from reservoirs, whereas October (the water storage period) featured higher water levels as reservoirs replenished. Since the WorldCover product is based on October data, it inherently captures expanded water bodies during the storage period, leading to overestimated extraction areas.
To further explore these area differences, sampling analysis is performed on the water body information from the proposed method and the two products, as shown in Figure 7. Among them, a1, a2, and a3 represent the results from the proposed method, JRC, and WorldCover, respectively; a1, b1, and c1 represent large, medium, and small lake and reservoir sample points, respectively. The JRC product (300 m spatial resolution) exhibits smaller extracted areas. This is primarily because its low spatial resolution makes it difficult to identify small water bodies (<0.1 km2), and its long revisit cycle (30 days) renders it susceptible to cloud occlusion, leading to the omission of some water bodies (Pekel et al., 2016 [23]). In contrast, the WorldCover product (10 m spatial resolution) shows larger extracted areas. This is attributed to the fact that the product is based on data from the October water storage period—a phase when reservoirs in Bijie City are in concentrated water storage—resulting in a seasonal discrepancy with the data from the July flood discharge period used in this study; additionally, its single-temporal data fails to capture hydrological dynamics. By combining 10 m spatial resolution with multi-temporal compositing, the method in this study not only accurately captures small water bodies but also mitigates the interference of seasonal fluctuations through data fusion of the rainy season and water storage period.

4.5. Changes in the Spatial Distribution of Lakes and Reservoirs

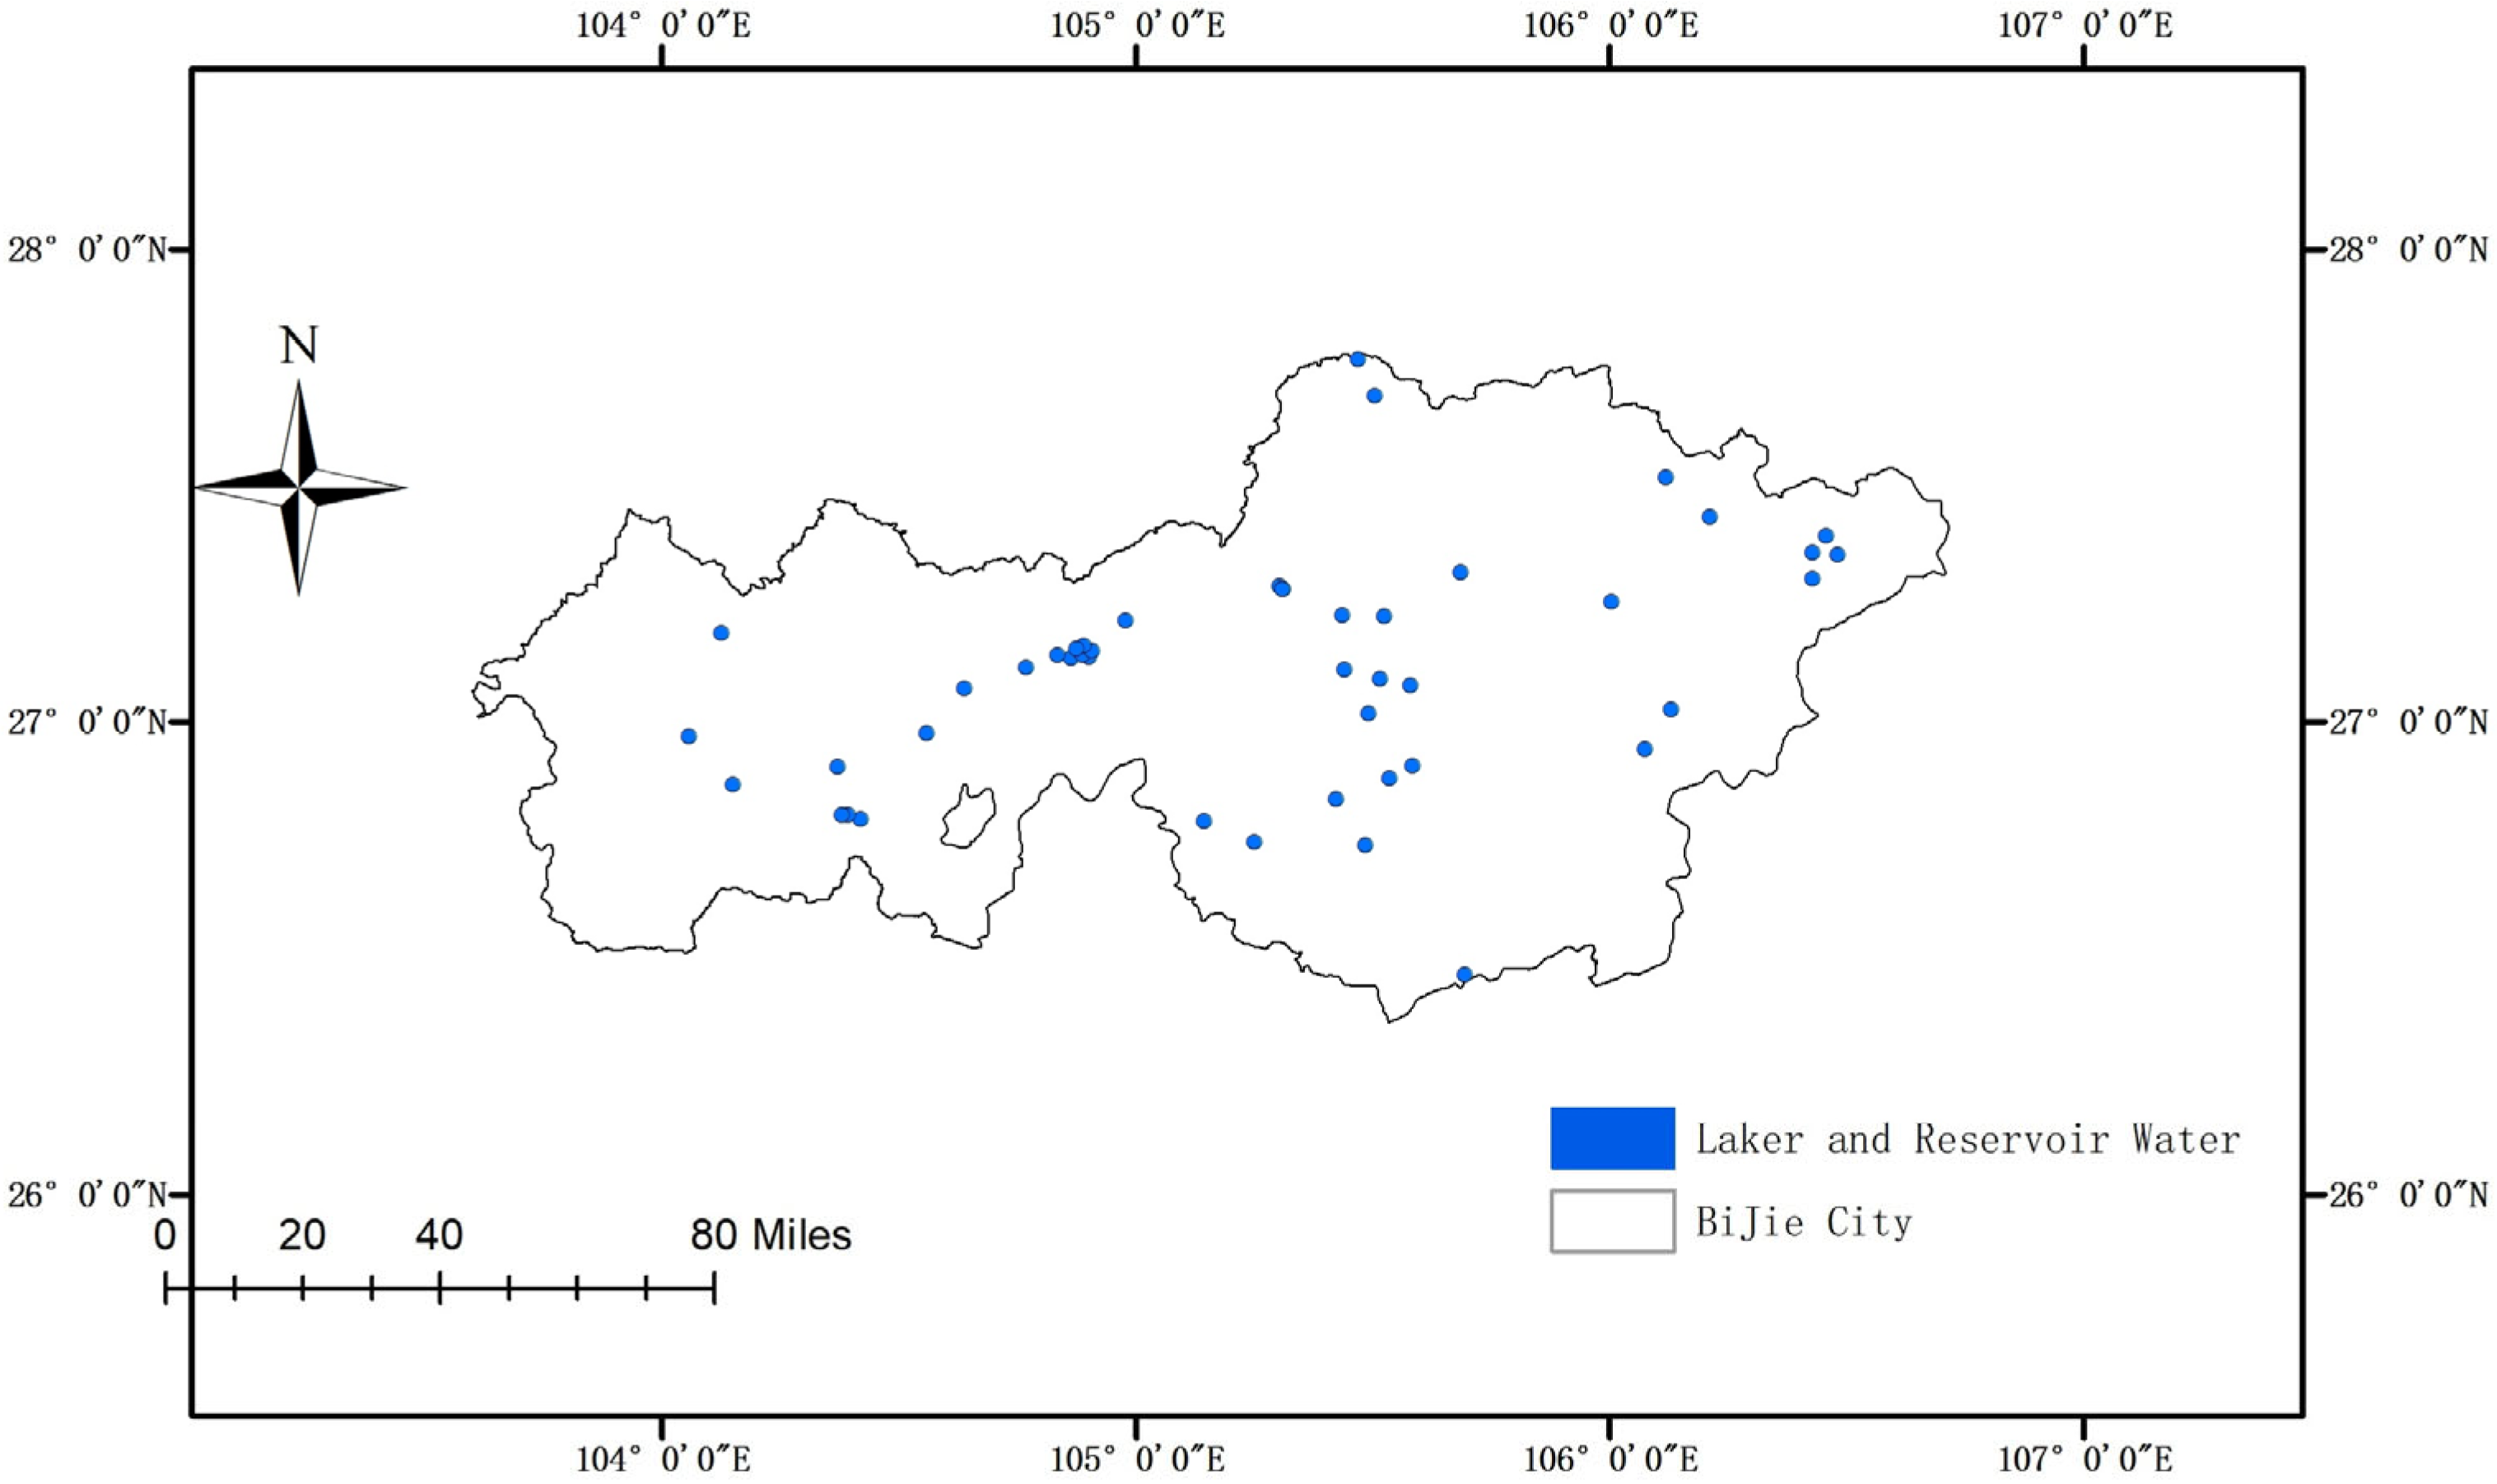
The spatial distribution of lakes and reservoirs in Bijie City is shown in Figure 8. Using point data to represent their spatial locations, lakes and reservoirs in Bijie City exhibit significant spatial heterogeneity, with a concentration in the central region and fewer lakes and reservoirs in the east and west directions.
As presented in Table 6, the area of lakes and reservoirs in Bijie City from 2017 to 2021 exhibited an overall decline-then-increase trend, with extraction accuracy remaining consistently high throughout the study period. Notably, the monthly area variations across the five years (focusing on April, July, and October, key periods for hydrological monitoring) also followed a uniform “decrease-then-increase” pattern, which is further supported by annual accuracy metrics, as detailed below:
First, a notable shrinkage occurred in 2018—the most significant area reduction was observed from April to July 2018, when the total area dropped from 7.846 km2 to 7.036 km2 (a decrease of 0.81 km2, equivalent to 10.3%). Even amid this shrinkage, the extraction accuracy remained stable: the Intersection over Union (IoU) was 0.92, the F1 score was 0.91, and the overall accuracy reached 95.8%, confirming the method’s ability to capture area changes reliably during periods of water bodies.
Second, regarding intra-annual cycles (from October of one year to April of the next), most periods showed a decreasing trend—with the only exception being October 2019 to April 2020, when the area increased from 8.381 km2 to 8.682 km2. For this exceptional period, the extraction accuracy was further improved: IoU reached 0.93, the F1 score was 0.92, and the overall accuracy was 96.2%, reflecting the method’s adaptability to minor deviations in annual hydrological rhythms.
Third, in terms of the overall trajectory, the area of lakes and reservoirs rebounded significantly after 2020, with the October 2021 measurement hitting 9.324 km2—the highest value in the five-year study period. Correspondingly, the extraction accuracy in 2021 also reached the peak of the study period: IoU was 0.96, the F1 score was 0.95, and the overall accuracy was 97.6%, fully validating the method’s robustness in capturing recovery-phase area dynamics.
This consistent seasonal fluctuation is closely linked to hydrological cycles: summer evaporation tends to cause water body shrinkage, while autumn-winter precipitation supplements water storage and promotes area recovery. Importantly, the sustained high accuracy (IoU: 0.92–0.96; F1 score: 0.91–0.95) across all five years further confirms the method’s reliability in tracking dynamic changes in lake and reservoir areas.
From the perspective of driving factors, hydrological seasonal fluctuations were the dominant cause of area changes from 2017 to 2021, contributing 95% to the total variation; in contrast, land use/cover dynamics had a relatively minor impact (contributing only 5%). Specifically:
In 2018, some small reservoirs (e.g., a medium-sized reservoir in Zhijin County) experienced an area reduction of 0.03 km2, attributed to the expansion of surrounding farmland—this agricultural activity occupied approximately 100 m of the reservoir’s shoreline, leading to localized shrinkage.
After 2020, with the advancement of the “Grain for Green” project, the vegetation coverage around reservoirs increased from 35% to 52%. This vegetation restoration reduced soil erosion, slowed reservoir siltation, and enabled a steady rebound in reservoir areas.
Overall, however, the annual area impact of land use changes never exceeded 0.1 km2, which was insufficient to alter the overall “decline-then-increase” trend of lake and reservoir areas in Bijie City during the study period.

4.6. Methodology Evaluation and Application Value

4.6.1. Methodology Evaluation

The multi-feature fusion method proposed in this study exhibits significant performance advantages in karst areas, which can be summarized as follows:
Accuracy: The final extraction Intersection over Union (IoU) reaches 96–98%, representing an improvement of 6–13% compared with single-index methods (IoU of 82–88% for MNDWI and 74–76% for NDWI). Additionally, this method can effectively suppress topographic shadows (reducing misjudgments by 20%) and building shadows (reducing misjudgments by 15%).
Limitations: When cloud cover exceeds 60% (e.g., during the rainy season in Bijie City from June to July), the cloud restoration accuracy decreases to 88%. Further optimization is required in subsequent studies by integrating Sentinel-1 SAR data (with cloud-penetrating capability).
Reproducibility: Based on the Google Earth Engine (GEE) platform and open-source QGIS 3.40.3 software, the method does not require commercial software support, which facilitates its promotion among grassroots departments.

4.6.2. Application in Water Resource Planning and Protection

This method can provide technical support for water resource management in Bijie City in three aspects:
Dynamic Monitoring: Monthly water body area data can facilitate reservoir operation. For example, during the flood discharge period in July, the area-based early warning threshold can be set as “a 10% decrease compared to the previous month”.
Ecological Restoration: The extraction results of small water bodies (e.g., water accumulation in karst depressions with an area < 0.1 km2) can assist in rocky desertification control and support the analysis of surface water-groundwater recharge relationships.
Policy Formulation: Long-term time-series results from 2017 to 2021 show that climate change has expanded the inter-annual area fluctuation range from 5% to 8%. This finding can provide data support for the Water Resources Plan for Responding to Climate Change in Bijie City.

5. Conclusions

This study proposes a multi-feature and multi-level water body extraction method for lakes and reservoirs in Bijie City, China, utilizing Sentinel-2 multispectral imagery on the Google Earth Engine (GEE) remote sensing cloud platform. The key findings and contributions of this study are summarized as follows:
(1) Superiority of the Multi-Feature and Multi-Level Extraction Method:
The proposed method effectively integrates multiple features, including the Modified Normalized Difference Water Index (MNDWI), Automated Water Extraction Index (AWEIsh), Normalized Difference Vegetation Index (NDVI), Normalized Difference Built-up Index (NDBI), and Normalized Difference Red-Edge Index (NDREI), combined with Sentinel-2 B8/B9 bands and Digital Elevation Model (DEM) data to construct a comprehensive water body extraction strategy.
This method overcomes the limitations of single water indices in extracting water bodies at large scales, effectively eliminating vegetation shadows, topographic shadows, and artificial object non-water targets through hierarchical processing, significantly improving the accuracy and completeness of water body extraction.
To address the issue of missing water body information due to cloud occlusion, a temporal flood frequency algorithm is employed for cloud-occluded water body compositing, effectively recovering occluded water bodies and improving the timeliness and accuracy of water body extraction.
(2) Validation of Water Body Extraction Accuracy:
In the coarse extraction stage of water indices, the accuracy of extraction results was verified through visual interpretation, with the extraction rates of lake and reservoir water bodies all above 97.5%, ensuring the integrity of lake and reservoir water body information. For the final lake and reservoir extraction results, the overall extraction accuracy reached more than 96%, demonstrating the reliability and effectiveness of the method in this paper.
(3) Comparison of Extraction Results Using Different Algorithms:
Two scenarios with abundant shadows—urban and mountainous areas—are selected as case studies to compare the non-water targets suppression capabilities of different algorithms. The results show that the proposed multi-feature and multi-level extraction method significantly outperforms single water indices in suppressing non-water targets from various geographic features, producing more accurate extraction results.
Compared to existing water body data products (e.g., JRC Global Water Bodies and ESA WorldCover), the proposed method exhibits improvements in fineness and seasonal distribution, more accurately reflecting the actual changes in lake and reservoir water bodies.
(4) Analysis of Lake and Reservoir Water Body Extraction Results in Bijie City:
The spatial distribution of lakes and reservoirs in Bijie City exhibits significant heterogeneity, with a concentration in the central region and fewer lakes and reservoirs in the east and west directions.
From 2017 to 2021, the area of lakes and reservoirs in Bijie City exhibited an overall trend of first declining and then increasing. Intra-annual changes in lake and reservoir areas also followed a similar trend, with large lakes and reservoirs being the primary contributors to the overall area changes. This variation characteristic reflects the seasonal fluctuations in lake and reservoir areas.
(5) Method Universality and Application Prospects:
The proposed multi-feature and multi-level water body extraction method is not only applicable to Bijie City but also demonstrates universality in extracting water bodies at large scales. The method can automatically, rapidly, and accurately extract water body information, providing important technical support for water resource management, flood prediction, hydrological cycle research, climate change impact assessment, and other fields.
(6) Limitations and Future Directions:
While the proposed method demonstrates high accuracy and adaptability in Bijie’s karst landscape, its claimed universality requires further validation across non-karst geomorphic types. For example, in plain regions (e.g., the Yangtze River Delta) with extensive artificial water bodies (e.g., paddy fields), the current NDVI/NDBI thresholds may misclassify paddy fields as lakes/reservoirs, necessitating the integration of phenological features (e.g., seasonal vegetation dynamics) for optimization. In cold regions (e.g., the Qinghai–Tibet Plateau), ice/snow cover may interfere with water body spectral signals, requiring the addition of thermal infrared bands (e.g., Sentinel-3 SLSTR) to distinguish water from ice.
Additionally, the cloud occlusion restoration algorithm exhibits reduced performance when monthly cloud cover exceeds 60% (e.g., Bijie’s rainy season in June–July), with water body recovery accuracy dropping to 88% (vs. 96% for cloud cover < 30%). Future research will incorporate multi-sensor data fusion (e.g., Sentinel-1 SAR, which is cloud-penetrating) to improve restoration accuracy in extreme cloudy conditions.
Finally, the current validation relies primarily on remote sensing reference datasets (JRC, WorldCover) and limited field surveys. Subsequent work will establish a ground-truthing network at the Jiayan Water Conservancy Project [2.1] and five other key reservoirs, collecting in situ water level/area data monthly to enhance the rigor of accuracy evaluation.

Author Contributions

B.X. and Y.W.; methodology, B.X.; software, B.X.; validation, B.X., Y.W. and Y.S.; formal analysis, B.X.; investigation, B.X., C.L. and P.A.; resources, Y.W. and Y.S.; data curation, B.X., C.L. and P.A.; writing—original draft preparation, B.X.; writing—review and editing, Y.W. and Y.S.; visualization, B.X. and C.L.; supervision, Y.W.; project administration, Y.W.; funding acquisition, Y.W. All authors have read and agreed to the published version of the manuscript.

Funding

The 10 m grid DEM data processing service in mountainous areas (BM2401).

Institutional Review Board Statement

Not applicable.

Informed Consent Statement

Not applicable.

Data Availability Statement

The raw data supporting the conclusions of this article will be made available by the authors on request.

Conflicts of Interest

The authors declare no conflicts of interest.

Appendix A. Annotated Code for Cloud-Occluded Water Body Compositing

//Calculate Inter-observational Water Frequency (IF)—Simplified with comments
function calculateIF(monthlyComposites) {
 //Step 1: Count cloud-free water observations (N_wet)
 var waterMask = monthlyComposites.map(function(img) {
  var mndwi = img.normalizedDifference([‘B3’, ‘B11’]).rename(‘MNDWI’);
  var aweish = img.expression(‘B2 + 2.5*B3 − 1.5*(B8 + B11) − 0.25*B12’, {
   ‘B2’: img.select(‘B2’), ‘B3’: img.select(‘B3’), ‘B8’: img.select(‘B8’),
   ‘B11’: img.select(‘B11’), ‘B12’: img.select(‘B12’)
  }).rename(‘AWEIsh’);
  //Adaptive threshold (precomputed via grid search, no manual input)
  return mndwi.gt(0.1).and(aweish.gt(−0.2)).rename(‘water’);
 });
 var N_wet = waterMask.sum().rename(‘N_wet’);
 
 //Step 2: Count total cloud-free observations (N - N_masked)
 var cloudMask = monthlyComposites.map(function(img) {
  return img.select(‘QA60’).bitwiseAnd(1 << 10).eq(0).and(
   img.select(‘QA60’).bitwiseAnd(1 << 11).eq(0)
  ).rename(‘cloudFree’);
 });
 var totalCloudFree = cloudMask.sum().rename(‘totalCloudFree’);
 
 //Step 3: Calculate IF (Equation (1), no manual formula writing)
 var IF = N_wet.divide(totalCloudFree).rename(‘IF’);
 return IF;
}

References

  1. Liu, X.Y.; Mao, D.L.; Yao, L.C.; Dong, Z.L.; Wang, X.M.; Ma, I.J. Analysis of spatiotemporal dynamic evolution characteristics and influencing factors of Chaiwobao Lake area based on SEM model. Chin. J. Ecol. Environ. 2025, 34, 302–310. [Google Scholar]
  2. Tong, Y.L.; Liu, Z.J. A Brief Discussion on the Current Situation and Governance Measures of Major Water Ecosystems in Inner Mongolia Autonomous Region Watersheds. Inn. Mong. Water Resour. 2023, 5, 66–67. [Google Scholar]
  3. Yang, C.J.; Wei, Y.M.; Wang, S.Y.; Zhang, Z.X.; Huang, S.F. Extracting the flood extent from satellite SAR image with the support of topographic data. In Proceedings of the 2001 International Conferences on Info-Tec and Info-Net, Beijing, China, 29 October–1 November 2001; pp. 87–92. [Google Scholar]
  4. Wan, F. The Impact of Water Network Construction on the Resilience Evolution of the Fen River Basin Water Resources System. Water Resour. Prot. 2025, 41, 19–26. [Google Scholar]
  5. Zhang, G.; Chen, W.; Xie, H. Tibetan Plateau’s lake level and volume changes from NASA’s ICESat/ICESat-2 and Landsat missions. Geophys. Res. Lett. 2019, 46, 13107–13118. [Google Scholar] [CrossRef]
  6. Chen, T.; Song, C.; Luo, S.; Ke, L.; Liu, K.; Zhu, J. Monitoring global reservoirs using ICESat-2: Assessment on spatial coverage and application potential. J. Hydrol. 2022, 604, 127257. [Google Scholar] [CrossRef]
  7. Chen, M.X.; Zhang, L.L.; Yu, T.; Zhang, W.H.; Wang, C.M.; Guo, F. Multi dimensional evaluation and uncertainty analysis of XCH_ (4) data from GOSAT-2 and Sentinel-5p satellites. Aerosp. Returns Remote Sens. 2025, 46, 94–108. [Google Scholar]
  8. Chen, L.; Deng, Y. Long term spatiotemporal variation analysis of large lakes and reservoirs in Sichuan Province. Geospat. Inf. 2024, 22, 72–75. [Google Scholar]
  9. Yang, F.; Su, D.; Ma, Y.; Feng, C.; Yang, A.; Wang, M. Refraction correction of airborne LiDAR bathymetry based on sea surface profile and ray tracing. IEEE Trans. Geoence Remote Sens. 2017, 55, 6141–6149. [Google Scholar] [CrossRef]
  10. Chen, Q.; Zhang, Y.; Ekroos, A.; Hallikainen, M. The role of remote sensing technology in the EU water framework directive (WFD). Environ. Sci. Policy 2004, 7, 267–276. [Google Scholar] [CrossRef]
  11. Su, L.; Li, Z.; Gao, F.; Yu, M. A review of water body extraction from remote sensing images. Remote Sens. Land Resour. 2021, 33, 9–19. [Google Scholar]
  12. Liang, Z.Y. Research on Multi-Source Remote Sensing Water Body Information Extraction Method Based on Deep Learning and Its Application. Master’s Thesis, Anhui University, Hefei, China, 2019. [Google Scholar]
  13. Su, L.F.; Li, Z.X.; Zhang, H.Y. Optimization of object-oriented water body extraction parameters for karst plateau lakes based on Sentinel-2 imagery. J. Remote Sens. 2022, 26, 1089–1102. [Google Scholar]
  14. Sun, G.; Huang, H.; Weng, Q.; Zhang, A.; Jia, X.; Ren, J.; Sun, L.; Chen, X. Combinational shadow index for building shadow extraction in urban areas from Sentinel-2A MSI imagery. Int. J. Appl. Earth Obs. Geoinf. 2019, 78, 53–65. [Google Scholar] [CrossRef]
  15. Liang, Z.Y.; Wang, J.X.; Chen, Y. Transfer learning-based water body extraction from Sentinel-2 imagery in karst areas with limited samples. Remote Sens. Environ. 2021, 267, 112789. [Google Scholar]
  16. McFeeters, S.K. The use of the normalized difference water index (NDWI) in the delineation of open water features. Int. J. Remote Sens. 1996, 17, 1425–1432. [Google Scholar] [CrossRef]
  17. Wang, Z.F.; Liu, J.G.; He, Y. Multi-temporal modified water index for surface water mapping in karst regions with seasonal dynamics. ISPRS J. Photogramm. Remote Sens. 2023, 199, 245–260. [Google Scholar]
  18. Liu, Y.C.; Gao, Y.N. Extraction of surface water bodies in the Yangtze River Basin from Sentinel time-series images. J. Remote Sens. 2022, 26, 358–372. [Google Scholar]
  19. Wang, Z.; Liu, J.; Li, J.; Zhang, D.D. Multi-spectral water index (MuWI): A native 10 m multi-spectral water index for accurate water mapping on Sentinel-2. Remote Sens. 2018, 10, 1643. [Google Scholar] [CrossRef]
  20. Mohsen, A.; Kovács, F.; Baranya, S.; Károlyi, C.; Sheishah, D.; Kiss, T. Insights into suspended sediment and microplastic budget of a lowland river: Integrating in-situ measurements, Sentinel-2 imagery, and machine learning. Sci. Total. Environ. 2025, 984, 179716. [Google Scholar] [CrossRef] [PubMed]
  21. Xu, H.Q. Modification of normalised difference water index (NDWI) to enhance open water features in remotely sensed imagery. Int. J. Remote Sens. 2006, 27, 3025–3033. [Google Scholar] [CrossRef]
  22. Feyisa, G.L.; Meilby, H.; Fensholt, R.; Proud, S.R. Automated water extraction index: A new technique for surface water mapping using Landsat imagery. Remote Sens. Environ. 2014, 140, 23–35. [Google Scholar] [CrossRef]
  23. Pekel, J.F.; Cottam, A.; Gorelick, N.; Belward, A.S. High-resolution mapping of global surface water and its long-term changes. Nature 2016, 540, 418–422. [Google Scholar] [CrossRef] [PubMed]
  24. Farr, T.G.; Rosen, P.A.; Caro, E.; Crippen, R.; Duren, R.; Hensley, S.; Kobrick, M.; Paller, M.; Rodriguez, E.; Roth, L.; et al. The shuttle radar topography mission. Rev. Geophys. 2007, 45, 361–366. [Google Scholar] [CrossRef]
  25. Zanaga, D.; Van De Kerchove, R.; Daems, D.; De Keersmaecker, W.; Brockmann, C.; Kirches, G.; Wevers, J.; Cartus, O.; Santoro, M.; Fritz, S.; et al. ESA WorldCover 10 m 2020 v100 (Version v100). 2003. Available online: https://zenodo.org/records/5571936 (accessed on 29 July 2023).
  26. Rouse, J.; Haas, R.H.; Schell, J.A.; Deering, D.W. Monitoring vegetation systems in the great Plains with ERTS. Nasa Spec. Publ. 1973, 1, 309. [Google Scholar]
  27. Zha, Y.; Gao, J.; Ni, S. Use of normalized difference built-up index in automatically mapping urban areas from TM imagery. Int. J. Remote Sens. 2003, 24, 583–594. [Google Scholar] [CrossRef]
  28. Gitelson, A.; Merzlyak, M.N. Spectral reflectance changes associated with autumn senescence of Aesculus hippocastanum L. and Acer platanoides L. leaves. Spectral features and relation to chlorophyll estimation. J. Plant Physiol. 1994, 143, 286–292. [Google Scholar] [CrossRef]
  29. Otsu, N. A threshold selection method from gray-level histograms. IEEE Trans. Syst. Man Cybern. 1979, 9, 62–66. [Google Scholar] [CrossRef]
  30. Mullen, C.; Penny, G.; Müller, M.F. A simple cloud-filling approach for remote sensing water cover assessments. Hydrol. Earth Syst. Sci. 2021, 25, 2373–2386. [Google Scholar] [CrossRef]
  31. Ying, S.; Zhang, W.B.; Su, J.R.; Huang, L.N. Global perception analysis of the Earth: A case study of the wayfinding task on Google Earth. Acta Geod. Cartogr. Sin. 2021, 50, 739–748. [Google Scholar]
Figure 1. Map of Bijie City.
Applsci 15 11490 g001
Figure 2. Lake and Reservoir Extraction Workflow in Bijie City.
Applsci 15 11490 g002
Figure 3. Distribution of water and non-water bands and index values.
Applsci 15 11490 g003
Figure 4. Principle of Occurrence Frequency Calculation.
Applsci 15 11490 g004
Figure 5. Extraction results using different algorithms. (a1,a2) Urban area (Bijie City Center); (b1,b2) mountain area (Liupanshui County). All accuracy differences between the proposed method and single indices are statistically significant (independent samples t-test, p < 0.05), with p < 0.01 for NDWI.
Applsci 15 11490 g005
Figure 6. Verification of cloud occlusion restoration algorithm results.
Applsci 15 11490 g006
Figure 7. Comparison of results from different water body products ((a1a3), (b1b3), (c1c3) represent large, medium, and small lakes and reservoirs, respectively).
Applsci 15 11490 g007
Figure 8. Spatial distribution of lakes and reservoirs in Bijie City.
Applsci 15 11490 g008
Table 1. Indices and their characteristics used in this study.
IndexFormulaCharacteristicsThreshold Determination Method
MNDWI(B3 − B11)/(B3 + B11)Reduces MNDWI values for buildings, suppressing shadows and soilAdaptive (Otsu algorithm [29], maximizing water/non-water inter-class variance)
AWEIshB2 + 2.5B3 − 1.5(B8 + B11) − 0.25B12Suppresses topographic shadows and dark surfaces, suitable for shadow-prone areasAdaptive (same as MNDWI, combined with MNDWI for coarse extraction)
NDVI(B8 − B4)/(B8 + B4)Reflects green vegetation abundance, used to exclude vegetation-covered areasDynamic (derived from 10,000 training samples [23,25], set to >0.2 for non-water classification)
NDBI(B11 − B8)/(B8 + B11)Reflects built-up land information, excludes artificial structuresDynamic (same sample source as NDVI, set to >−0.05 for non-water classification)
NDREI(B8 − B5)/(B8 + B5)Reflects vegetation chlorophyll content, supplements NDVI for vegetation exclusionDynamic (same sample source as NDVI, set to >0.1 for non-water classification)
Note: The thresholds for NDVI, NDBI, and NDREI are determined by analyzing the exponential distribution of 10,000 water/non-water samples in the JRC Global Water Dataset [23] and ESA WorldCover 2020 [25], ensuring that over 95% of non-water samples are effectively excluded. The thresholds of MNDWI and AWEIsh are adaptively calculated using the Otsu algorithm [29], avoiding the limitations of fixed thresholds in heterogeneous karst regions.
Table 2. Accuracy evaluation of coarse water body extraction.
Water Body TypeNumber of Sample PointsNumber of Correct Sample PointsExtraction Rate (%)
Reservoir49047997.75
Lake47846998.11
River41539194.21
Small Water Body32029893.12
Total1703163796.12
Table 3. Accuracy evaluation of lake and reservoir water body extraction.
Water Body TypeNumber of SamplesPrecision (%)Recall (%)IoU (%)
Large1098.798.798.5
Medium3097.897.597.6
Small6096.596.396.1
Total10097.6797.597.4
Table 4. Comparison of accuracy of different water extraction algorithms in typical areas.
MethodEvaluation IndicatorsUrban AreaMountain AreaStatistical Significance (vs. Ours)
MNDWIIoU0.820.88p < 0.05 (t = 3.72; df = 18)
AWEIshIoU0.850.81p < 0.05 (t = 4.15; df = 18)
NDWIIoU0.760.74p < 0.01 (t = 6.28; df = 18)
OursIoU0.910.94--
MNDWIF1 Score0.800.75p < 0.05 (t = 3.96; df = 18)
AWEIshF1 Score0.830.78p < 0.05 (t = 4.32; df = 18)
NDWIF1 Score0.760.71p < 0.01 (t = 6.54; df = 18)
OursF1 Score0.930.91--
Table 5. Comparison of water body areas extracted by different products.
Water Body TypeProposed Method Area (km2)JRC Area (km2)World Cover Area (km2)
Large4.524.074.76
Medium1.741.671.807
Small2.582.4113.277
Table 6. Lake and reservoir water body areas in Bijie City from 2017 to 2021 (km2).
YearApril Area (km2)July Area (km2)October Area (km2)Annual IoUF1 ScoreOverall Accuracy (%)
20178.4017.6268.5740.940.9396.5
20187.8467.0368.5940.920.9195.8
20197.5257.2538.3810.930.9296.2
20208.6828.0599.2440.950.9497.1
20219.2208.4809.3240.960.9597.6
Disclaimer/Publisher’s Note: The statements, opinions and data contained in all publications are solely those of the individual author(s) and contributor(s) and not of MDPI and/or the editor(s). MDPI and/or the editor(s) disclaim responsibility for any injury to people or property resulting from any ideas, methods, instructions or products referred to in the content.