Article

A Bayesian Grid-Free Framework with Global Optimization for Three-Dimensional Acoustic Source Imaging

1
Collaborative Innovation Center of Steel Technology, University of Science and Technology Beijing, Beijing 100083, China
2
Key Laboratory of Fluid Interaction with Material, Ministry of Education, University of Science and Technology Beijing, Beijing 100083, China
3
School of Civil Aviation, Northwestern Polytechnical University, Xi’an 710072, China
4
State Key Laboratory of Airliner Integration Technology and Flight Simulation, Shanghai 200126, China
5
National Key Laboratory of Strength and Structural Integrity, Xi’an 710065, China
*
Author to whom correspondence should be addressed.
Appl. Sci. 2025, 15(20), 11028; https://doi.org/10.3390/app152011028
Submission received: 11 September 2025 / Revised: 8 October 2025 / Accepted: 12 October 2025 / Published: 14 October 2025
(This article belongs to the Special Issue Machine Learning in Vibration and Acoustics (3rd Edition))

Abstract

A common challenge in traditional three-dimensional grid-free localization is the struggle to balance computational efficiency with localization accuracy. To address this trade-off, a Bayesian grid-free framework with global optimization (BGG) for three-dimensional acoustic source imaging is proposed. In this method, a Bayesian inference model is established based on equivalent source theory, where the negative log-posterior of the equivalent source positions serves as the fitness function. This function is minimized using a global optimization algorithm to estimate the source locations. Subsequently, the source strengths and noise variances are inferred via fixed-point iteration and projection-based estimation. Through both simulations and experiments with spatially distributed sources, a superior balance of computational efficiency and localization accuracy is demonstrated by the proposed BGG algorithm when compared to other state-of-the-art grid-free approaches.

1. Introduction

Over recent decades, acoustic source imaging has been widely applied in fields such as aircraft and automotive noise source localization [1,2,3,4], as well as mechanical fault diagnosis [5,6]. When extended from a two-dimensional plane to three-dimensional space, this technique enables the identification of spatially distributed sources, including those that overlap along certain directions. It provides more comprehensive information about the spatial distribution of acoustic sources. Conventional imaging methods, such as beamforming [2,7] and the equivalent source method [8,9], typically assume that sources are located at predefined grid points. However, when actual sources lie off the grid, this assumption leads to basis mismatch, resulting in errors in both source localization and intensity estimation [10]. Although off-grid approaches [11,12] have been proposed to mitigate this issue, they still require a large number of grid points, especially for large-scale 3D problems. To address this limitation, grid-free source imaging methods [13,14,15,16,17] have been developed. These methods treat the source locations as continuous unknown parameters and estimate them directly. In theory, this approach eliminates the basis mismatch problem and improves localization accuracy in three-dimensional acoustic imaging.
According to the solution strategies for source localization, grid-free acoustic imaging methods can be categorized into mathematical programming [14,18,19,20], global optimization [15,21], Bayesian inference [16,22,23,24], and machine learning approaches [17,25,26].
The first category formulates the source localization problem as a convex optimization task within the framework of functional analysis, where the sources are modeled in a continuous atomic dictionary space or a measure space. Mathematical programming techniques are then employed to obtain the solution. Yang et al. [18] modeled the acoustic imaging problem as a convex optimization task constrained by the atomic norm minimization (ANM), based on an atomic set of steering vectors defined over a continuous spatial domain. The problem was efficiently solved via the ADMM algorithm, achieving grid-free source localization. The iterative reweighting strategy was subsequently incorporated into the ANM algorithm, leading to enhanced resolution in grid-free acoustic imaging [19]. A key limitation of the ANM method is that its computational efficiency relies critically on the algebraic structure (e.g., the Toeplitz matrix) inherent to uniform arrays. The absence of this structure in non-uniform array geometries leads to a dramatic increase in computational complexity, thereby limiting the method’s practical applicability. Chardon [14] modeled sound source distributions as Dirac measures and formulated an infinite-dimensional covariance matrix fitting problem. The problem was solved iteratively using a sliding Frank–Wolfe algorithm to estimate source locations and power. Since the method assumes that the source amplitudes are mutually uncorrelated and also uncorrelated with the measurement noise, it becomes challenging to localize coherent sources.
The second category establishes a fitness function based on the acoustic field transfer relationship and employs a global optimization algorithm to search for the optimal source locations and strengths. Malgoezar et al. [15] proposed the Bartlett energy function and the cross-spectral matrix (CSM) energy function as fitness functions, and employed a differential evolution algorithm to locate the global optimum. Zhai et al. [21] combined the CSM energy function with the image source model and employed a state transition algorithm to achieve grid-free sound source localization in three-dimensional reverberant environments. In grid-free acoustic imaging, source locations and source strengths are two mutually coupled optimization parameters, and simultaneous optimization of both using an energy function is prone to convergence to local optima.
The third category constructs a Bayesian inference model based on the acoustic field transfer relationship and employs either the Expectation–Maximization (EM) algorithm or Markov Chain Monte Carlo (MCMC) sampling to estimate the posterior distribution of source coordinates. Wang et al. [22] developed an EM-based framework in which the E-step evaluates the covariance matrix of the latent source contributions, and the M-step updates the estimates of source locations and powers. Antoni et al. [23] estimated sound source locations using a Gibbs sampler, and sequentially updated source parameters, noise variance, and prior source variances. Subsequently, the more computationally efficient Hamiltonian Monte Carlo (HMC) sampler was applied to high-dimensional acoustic imaging [16]. Although MCMC sampling methods demonstrate competent acoustic imaging performance, they inherently suffer from high computational complexity and require meticulous parameter tuning.
The last category involves data-driven neural network models that directly establish a mapping between the observed signals and the spatial distribution of sound sources in a continuous domain. Castellini et al. [17] used the CSM from microphone arrays as input and employed a Multi-Layer Perceptron network to predict the positions and strengths of two sound sources in a grid-free manner. Kujawski et al. [25] adopted a transformer-based framework to predict the locations and intensities of an unknown number of sources. Zhao et al. [26] designed a 121-layer DenseNet model to directly extract features from beamforming maps and output continuous sound source coordinates. Although machine learning methods can achieve superior spatial resolution and computational efficiency, they typically require substantial amounts of training data, exhibit poor model interpretability, and demonstrate limited generalization capabilities.
To address these limitations, a Bayesian grid-free framework with global optimization for three-dimensional acoustic source imaging (BGG) is proposed. This method initially establishes a Bayesian inference model for three-dimensional acoustic imaging within the framework of equivalent source theory. This model quantifies the uncertainty of parameters including the positions and strengths of equivalent sources and measurement noise. Subsequently, the posterior probability distribution of the equivalent source positions is utilized to construct a fitness function for global optimization. Finally, the equivalent source positions are optimized using a global optimization algorithm. The equivalent source strengths and noise parameters are solved via fixed-point iteration and orthogonal projection methods, respectively. Simulations and experiments on three-dimensional acoustic source imaging show that the proposed method achieves the best balance between computational efficiency and localization accuracy among existing 3D source imaging approaches. The main contributions of the paper are as follows:
a.
Based on a Bayesian inference model, the negative log-posterior of the source positions is established as the fitness function, replacing the conventional CSM energy function and improving the accuracy of source localization.
b.
A global optimization algorithm is introduced to estimate source positions, replacing the HMC sampling procedure and enhancing the computational efficiency of source localization.
The remainder of the paper is then organized as follows. Section 2 outlines the limitations of the fitness functions used in traditional grid-free algorithms. Section 3 presents the theoretical foundation of the BGG method, including the grid-free Bayesian inference model, the derivation of the fitness function, the global optimization strategy, and the algorithmic procedure. Section 4 introduces the simulation and experimental setup for spatially distributed acoustic source localization and analyzes the corresponding localization results. Finally, some conclusions are given in Section 5.

2. Problem Statement

Within the framework of equivalent source theory [7,27], the acoustic pressure at the m-th receiver can be mathematically represented as the superposition of acoustic wavefields generated by a series of equivalent sources distributed on the radiating surface
p m = n = 1 N G m r n q n + ϵ m ,
where m = 1 , , M and n = 1 , , N denote the indices of the receivers and equivalent sources, respectively. G m r n represents the Green’s function describing the sound pressure propagation from the source position r n to the m-th receiver position r m . q n denotes the source strength at r n . ϵ m denotes the additive noise measured at the m-th receiver. In free field conditions, G m r n is expressed as
G m r n = exp ( i k r n r m ) 4 π r n r m ,
where i denotes the imaginary unit, the wavenumber k is defined as k = 2 π f / c , with c being the speed of sound and f the source frequency, and r m denotes the position of m-th receiver. The forward model of three-dimensional acoustic propagation is illustrated in Figure 1.
Expressed in matrix form, the relationship in Equation (1) becomes
p = G r q + ϵ ,
where p = p 1 , , p M T C M × 1 , q = q 1 , , q N T C N × 1 , and ϵ = ϵ 1 , , ϵ M T C M × 1 are column vectors. G ( r ) C M × N denotes the propagation matrix, with its ( m , n ) -th entry given by the Green’s function G m r n .
Based on Equation (3), the CSM energy function [15] is derived by quantifying the discrepancy between the measured CSM C meas and the model CSM C model
E csm = C meas C model F 2 = p p H G ( r ) q G ( r ) q H F 2 = m , n ( Re C meas Re C model 2 + Im C meas Im C model 2 ) .
Conventional approaches, such as Differential Evolution and machine learning-based algorithms, estimate both the source locations and source strengths by minimizing the CSM energy function [15,17]. However, the simultaneous optimization of these two variables can easily become trapped in local minima. In addition, the energy function does not explicitly account for noise, making it potentially sensitive to measurement noise.
To address these limitations, this paper proposes a Bayesian grid-free framework with global optimization for three-dimensional acoustic source imaging, which will be elaborated in Section 3. The framework employs a Bayesian inference model to perform uncertainty quantification of the source locations, source strengths, and noise parameters, and uses the negative logarithm of the posterior distribution of the source locations as the fitness function. To mitigate the risk of local minima associated with joint multi-parameter optimization, a stepwise optimization strategy is adopted: a global optimization algorithm is first applied to estimate the source locations, followed by the estimation of the source strengths and noise parameters using fixed-point iteration and orthogonal projection techniques.

3. The Theoretical Description of BGG Method

3.1. 3D Grid-Free Bayesian Inference Model

In the Bayesian framework, the source locations, source strengths, and measurement noise are all treated as random variables. The plate notation of the 3D grid-free Bayesian inference model is shown in Figure 2.
The additive noise is assumed to follow a zero-mean, complex Gaussian distribution with mutually independent components across measurements and a variance of β . Based on this assumption and Equation (3), the likelihood function of the observed acoustic pressure follows a complex Gaussian process with a mean of G ( r ) q and a covariance matrix of Σ n = β I .
P p q , r = C N G r q , Σ n ,
where P ( · ) denotes a probability density function (PDF), and CN ( · ) denotes a complex Gaussian distribution.
The prior PDF represents the knowledge or expectations available before the measurements are taken. Assuming that the position parameters { r n } n = 1 N are mutually independent, their prior distribution is modeled as Gaussian with zero mean and covariance λ n :
P ( r ) = n = 1 N N ( r n ; 0 , λ n ) = N ( r ; 0 , Σ r ) ,
where Σ r is defined as the block diagonal matrix diag ( λ 1 , , λ N ) . This Gaussian prior assumes that the equivalent source positions are concentrated around the acoustic center with independent perturbations, which is consistent with typical localization uncertainties and facilitates analytical derivation of the posterior. Moreover, as r approaches infinity, the prior probability density approaches zero, which is essential to ensure the integrability of the posterior probability density function.
The hyperparameter λ n , governing the position variance, is assumed to follow inverse-Gamma distributions to facilitate the analytical derivation of the posterior distribution. This choice offers two main advantages: firstly, it guarantees the positivity of the hyperparameters; secondly, it is conjugate to the Gaussian distribution, thereby significantly simplifying the inference of the posterior probability density function. Given shape and scale parameters a n and b n , the corresponding prior PDF of λ n is
P λ n = I G λ n ; a n , b n .
The source strength parameters { q n } n = 1 N are assumed to be mutually independent and follow zero-mean complex Gaussian priors with variances γ n . Formally, the joint prior distribution can be expressed as
P ( q ) = n = 1 N CN q n ; 0 , γ n = CN q ; 0 , Σ q .
where Σ q = diag ( γ 1 , , γ N ) .
Within the Bayesian inference framework, the posterior distribution of the parameters can be estimated via the EM algorithm or MCMC sampling. However, due to the high computational complexity of these methods, the proposed approach employs a global optimization algorithm combined with a fitness function derived from the posterior distribution to optimize the source locations. The source strength parameters are updated via fixed-point iteration, the noise parameters are updated using orthogonal projection, and the hyperparameters are updated by leveraging the properties of the inverse Gamma distribution.

3.2. Derivation of the Fitness Function

The simultaneous optimization of all equivalent source positions { r n } n = 1 N constitutes a high-dimensional joint optimization problem in R N × 3 . However, its computational complexity scales exponentially with N and is prone to convergence to local optima. To address this issue, a residual sound pressure vector p / n is constructed, and each equivalent source position r n is iteratively updated by solving N independent three-dimensional optimization subproblems. The residual vector is defined as:
p / n = p s n G ( r s ) q s ,
where G ( r s ) denotes the s-th column of the acoustic transfer matrix. p / n contains contributions from the n-th equivalent source and measurement noise.
According to Bayes’ theorem and Equations (3) and (9), the posterior distribution of the n-th equivalent source position can be expressed as
P r n p / n P r n P p / n r n .
The marginal likelihood P ( p / n r n ) , which depends only on r n , is obtained by integrating out the latent variable q n , as it is not directly observed in P ( p / n q n , r n ) . The integration is given as
P ( p / n r n ) = P ( p / n q n , r n ) P ( q n ) d q n .
where the probability density functions of P ( p / n q n , r n ) and P ( q n ) are given by
P ( p / n q n , r n ) = 1 ( π β ) M exp 1 β p / n G ( r n ) q n 2 2 P ( q n ) = 1 π γ n exp | q n | 2 γ n .
P ( p / n r n ) = 1 ( π β ) M ( π γ n ) exp 1 β p / n A n q n 2 2 | q n | 2 γ n d q n = 1 ( π β ) M ( π γ n ) exp q n μ n H C n 1 q n μ n p / n H β 1 I β 2 G ( r n ) C n G H ( r n ) p / n d q n ,
where
C n = 1 γ n + 1 β G H ( r n ) G ( r n ) 1 , μ n = C n 1 β G H ( r n ) p / n .
By exp ( ( q μ ) H C 1 ( q μ ) ) d q = π det ( C ) , we obtain
P ( p / n r n ) = det ( C n ) ( π β ) M ( π γ n ) exp p / n H β 1 I β 2 G ( r n ) C n G H ( r n ) p / n .
Apply the Woodbury identity and the matrix determinant lemma
β I + γ n G H ( r n ) G ( r n ) 1 = β 1 I β 2 G ( r n ) 1 γ n + 1 β G H ( r n ) G ( r n ) 1 G H ( r n ) = β 1 I β 2 G ( r n ) C n G H ( r n ) det β I + γ n G ( r n ) G H ( r n ) = β M det I + γ n β G ( r n ) G H ( r n ) = β M 1 + γ n β G n H ( r ) G n ( r ) = β M γ n C n .
Hence, defining
Σ p ( r n ) : = β I + γ n G ( r n ) G ( r n ) H ,
we can rewrite the marginal likelihood as the complex normal density
P p / n r n = 1 π M | Σ p ( r n ) | exp p / n H Σ p ( r n ) 1 p / n .
Substituting the above expressions into Equation (10) yields
P r n p / n P r n exp p / n H Σ p ( r n ) 1 p / n | Σ p ( r n ) | .
Taking the negative logarithm of the above equation yields
log P r n p / n = log P ( r n ) + p / n H Σ p ( r n ) 1 p / n + log Σ p ( r n ) + const ,
where the right-hand side consists of the position prior term, the data fitting term, and the regularization term. The position prior incorporates prior knowledge or constraints on r n , guiding the optimization to converge to reasonable locations. The data fitting term measures how well the model explains the observed data, ensuring consistency between the predicted and measured sound pressures. The regularization term models the noise, helping to stabilize the optimization process and prevent overfitting.
Given that G ( r n ) is a rank-one matrix, the Sherman–Morrison formula enables simplification of the data fitting term:
p / n H Σ p 1 ( r n ) p / n = 1 β p / n H p / n γ n G H ( r n ) p / n 2 β β + γ n G ( r n ) 2 .
By applying the matrix determinant lemma, the regularization term can be simplified as
log Σ p ( r n ) = M log β + log 1 + γ n G ( r n ) 2 β .
Using Equations (21) and (22), the computation of the negative logarithm of P r n p / n can be simplified.
Minimizing Equation (20) balances fitting the observed data accurately while respecting prior knowledge and controlling noise effects. This balance ensures that the optimization converges to physically meaningful and statistically robust source locations. Therefore, the negative log-posterior serves as a suitable fitness function for optimizing r n , and the global optimization algorithm is employed to minimize this fitness function for source position estimation.

3.3. Source Position Estimation Based on the Global Optimization Algorithm

The presence of multiple modes in the negative log-posterior presents a significant challenge for optimization. To address this, we have implemented the Particle Swarm Optimization (PSO) algorithm, a robust global optimization method [28,29].
The PSO algorithm is fundamentally inspired by the collaborative behavior and information sharing among particles within the swarm. By iteratively updating particle positions and velocities, PSO effectively searches for the global optimum of an optimization problem. To achieve this, each particle moves toward its personal best position pbest and the global best position pbest found by the swarm. At each iteration, the velocity v and position x of each particle are updated according to the following equations:
v i ( t + 1 ) = w · v i ( t ) + c 1 · r 1 · ( pbest i ( t ) x i ( t ) ) + c 2 · r 2 · ( gbest ( t ) x i ( t ) )
and
x i ( t + 1 ) = x i ( t ) + v i ( t + 1 ) ,
where the subscript i denotes the particle index, and t represents the current iteration number. The inertia weight w, which decreases linearly over iterations, is employed to balance global exploration and local exploitation. The acceleration coefficients c 1 and c 2 quantify a particle’s learning ability from its own experience and from the swarm, respectively. The terms r 1 and r 2 are two independently generated random numbers uniformly distributed in the range [ 0 , 1 ] , which introduce stochasticity into the algorithm and facilitate escape from local optima. Personal best position pbest and the global best position pbest are updated by
pbest i ( t + 1 ) = x i ( t + 1 ) if f ( x i ( t + 1 ) ) < f ( pbest i ( t ) ) pbest i ( t ) otherwise
and
gbest ( t + 1 ) = arg min pbest i ( t + 1 ) f ( pbest i ( t + 1 ) ) ,
where the fitness function f ( · ) corresponds to the negative log-posterior defined in Equation (20). The objective of the optimization is therefore to locate the set of parameters that minimizes this function, which is equivalent to maximizing the posterior probability. Consequently, for a given residual vector p / n , its corresponding equivalent source location is determined by the final global best position, gbest , upon the termination of the PSO algorithm.

3.4. Updating Source Strength, Noise, and Position Hyperparameters

The update rule for the source strength variance, γ n , which is a parameter within the pressure covariance matrix Σ p ( r n ) , is derived by differentiating the log-posterior probability log p r n p / n with respect to γ n and setting the result to zero. This procedure yields the following fixed-point iteration:
γ n ( new ) = γ n ( old ) · G H ( r n ) Σ p 1 ( r n ) p / n p / n H Σ p 1 ( r n ) G ( r n ) G H ( r n ) Σ p 1 ( r n ) G ( r n ) .
This iteration can be interpreted as a reweighting scheme. Specifically, if the contribution of the n-th equivalent source to the residual field power is larger than its modeled contribution, its corresponding variance γ n is adjusted upward. Conversely, if its contribution is smaller, γ n is decreased.
The noise variance β is updated using an orthogonal projection method. First, an orthogonal projection matrix is constructed as:
Π = I G peak ( r ) G peak ( r ) ,
where G peak ( r ) C M × K is the transfer matrix composed of the column vectors corresponding to the K strongest equivalent sources, and ( · ) denotes the Moore–Penrose pseudoinverse. This matrix projects the observed pressure vector p onto the subspace orthogonal to that spanned by the basis functions of the identified sources. The resulting noise variance is then estimated as:
β ( new ) = Re tr Π p p H M K ,
where the numerator represents the residual energy in the projected subspace, while the denominator, M K , accounts for the degrees of freedom, providing an unbiased estimate of the noise variance.
The position hyperparameter λ n is updated using the expectation of its posterior distribution. For an inverse-gamma distribution, IG ( a , b ) , the mean is given by b / a 1 . Hence, the update rule for λ n is expressed as
λ n new = b n post a n post 1 = b n + r n T Λ 1 r n ( a n + 3 N ) 1 .

3.5. Termination Criteria and Algorithm Procedure

The algorithm terminates when either the maximum number of iterations is reached or the convergence criterion is satisfied, given by
γ [ i ] γ [ i 1 ] 2 / γ [ i 1 ] 2 < ε ,
where γ = [ γ 1 , , γ N ] , the superscript [ k ] indicates the iteration index, and ε represents the convergence threshold. The procedure involved in the BBG algorithm is briefly explained in Algorithm 1.
Algorithm 1: Bayesian grid-free framework with global optimization for three-dimensional acoustic source imaging (BGG)
Input:
  Initial source positions r , initial covariance matrix Σ r , Σ q , Σ n , measured data p , iteration steps K, number of Equivalent Sources N, convergence threshold ε
Output:
 Final source positions r, final covariance matrix Σ q
Applsci 15 11028 i00

4. Simulations and Experiments on Spatially Distributed Acoustic Source Localization

4.1. Simulation and Experiment Setup

To validate the proposed method, both numerical simulations and experiments were conducted using the setup shown in Figure 3. In the simulations, three pulsating-sphere sources were placed at A (0.20, 0.23, 0.30) m, B (0.03, 0.00, 0.20) m, and C (−0.20, −0.10, 0.22) m to emulate a spatially distributed acoustic scene. Each source had a radius of 0.04 m and a surface vibration velocity of 0.03 m/s, generating in-phase sinusoidal signals. To evaluate the robustness of the algorithm against interference, Gaussian white noise with varying levels from 0 dB to 30 dB, in steps of 5 dB, was added to the original signals. In the experiments, the speakers were positioned identically to the simulated sources and driven with the same in-phase sinusoidal signals, with Gaussian white noise at 30 dB added. In both simulations and experiments, the acoustic signals were acquired by two orthogonal microphone arrays: an 89-element top array located on the z = 0.5 m plane and a 32-element side array on the y = 1 m plane. In the simulations, array signals were generated for 27 frequencies ranging from 400 Hz to 3000 Hz in 100 Hz increments to evaluate algorithmic performance. In contrast, the experiments were conducted at eight discrete frequencies: [400, 600, 800, 1000, 1500, 2000, 2500, 3000] Hz. The search space for source localization was defined as x [ 0.5 , 0.5 ] m, y [ 0.5 , 0.5 ] m, and z [ 0 , 0.5 ] m.
For 3D acoustic source localization, we compared our method against three benchmarks: the on-grid beamforming algorithm Clean-SC, and two grid-free algorithms based on differential evolution (GF-DE) and Hamiltonian Monte Carlo (GF-HMC). The Clean-SC algorithm was implemented with a spatial resolution of 0.01 m, utilizing the steering vector from Formulation III as described by Sarradj [30]. For the grid-free algorithms, the number of equivalent sources (N) was set to 5. Following the methodology in [15], the GF-DE algorithm was configured with the following key parameters: a population size of 128N, a crossover probability of 0.75, a scale factor of 0.8, and a maximum of 200 generations. The GF-HMC algorithm employed a leapfrog integration procedure with a fixed step size of 0.005 and a step count of 40. In the BGG algorithm, the PSO algorithm is configured as follows: the population size was set to 128N (where N denotes the number of equivalent sources). The inertia weight was linearly decreased from 1.1 to 0.1 throughout the iterations, while both acceleration coefficients, c 1 and c 2 , were fixed at 1.49 to balance exploration and exploitation. The optimization process was terminated when the fitness improvement between consecutive iterations fell below 10 6 , or when the maximum number of 200 iterations was reached.
To quantitatively evaluate the performance of the 3D acoustic source localization methods, we use two indicators: the absolute localization error ( A L E ) and the sound pressure level (SPL) estimation error ( S E E ). The spatial localization error for the i-th source, A L E ( i ) , is calculated as the Euclidean distance between the estimated and actual source positions:
A L E ( i ) = x l ( i ) x o ( i ) 2 + y l ( i ) y o ( i ) 2 + z l ( i ) z o ( i ) 2 ,
where ( x o ( i ) , y o ( i ) , z o ( i ) ) is the estimated position from the localization map and ( x l ( i ) , y l ( i ) , z l ( i ) ) is the ground-truth (actual) position of the i-th source. The indicator S E E is defined as:
S E E = L p ref L p est ,
where L p est is the estimated SPL and L p ref is the reference SPL. Both values are normalized relative to the maximum source power. In summary, A L E assesses localization accuracy, while S E E quantifies the precision of source strength estimation.

4.2. Simulation Results and Analysis

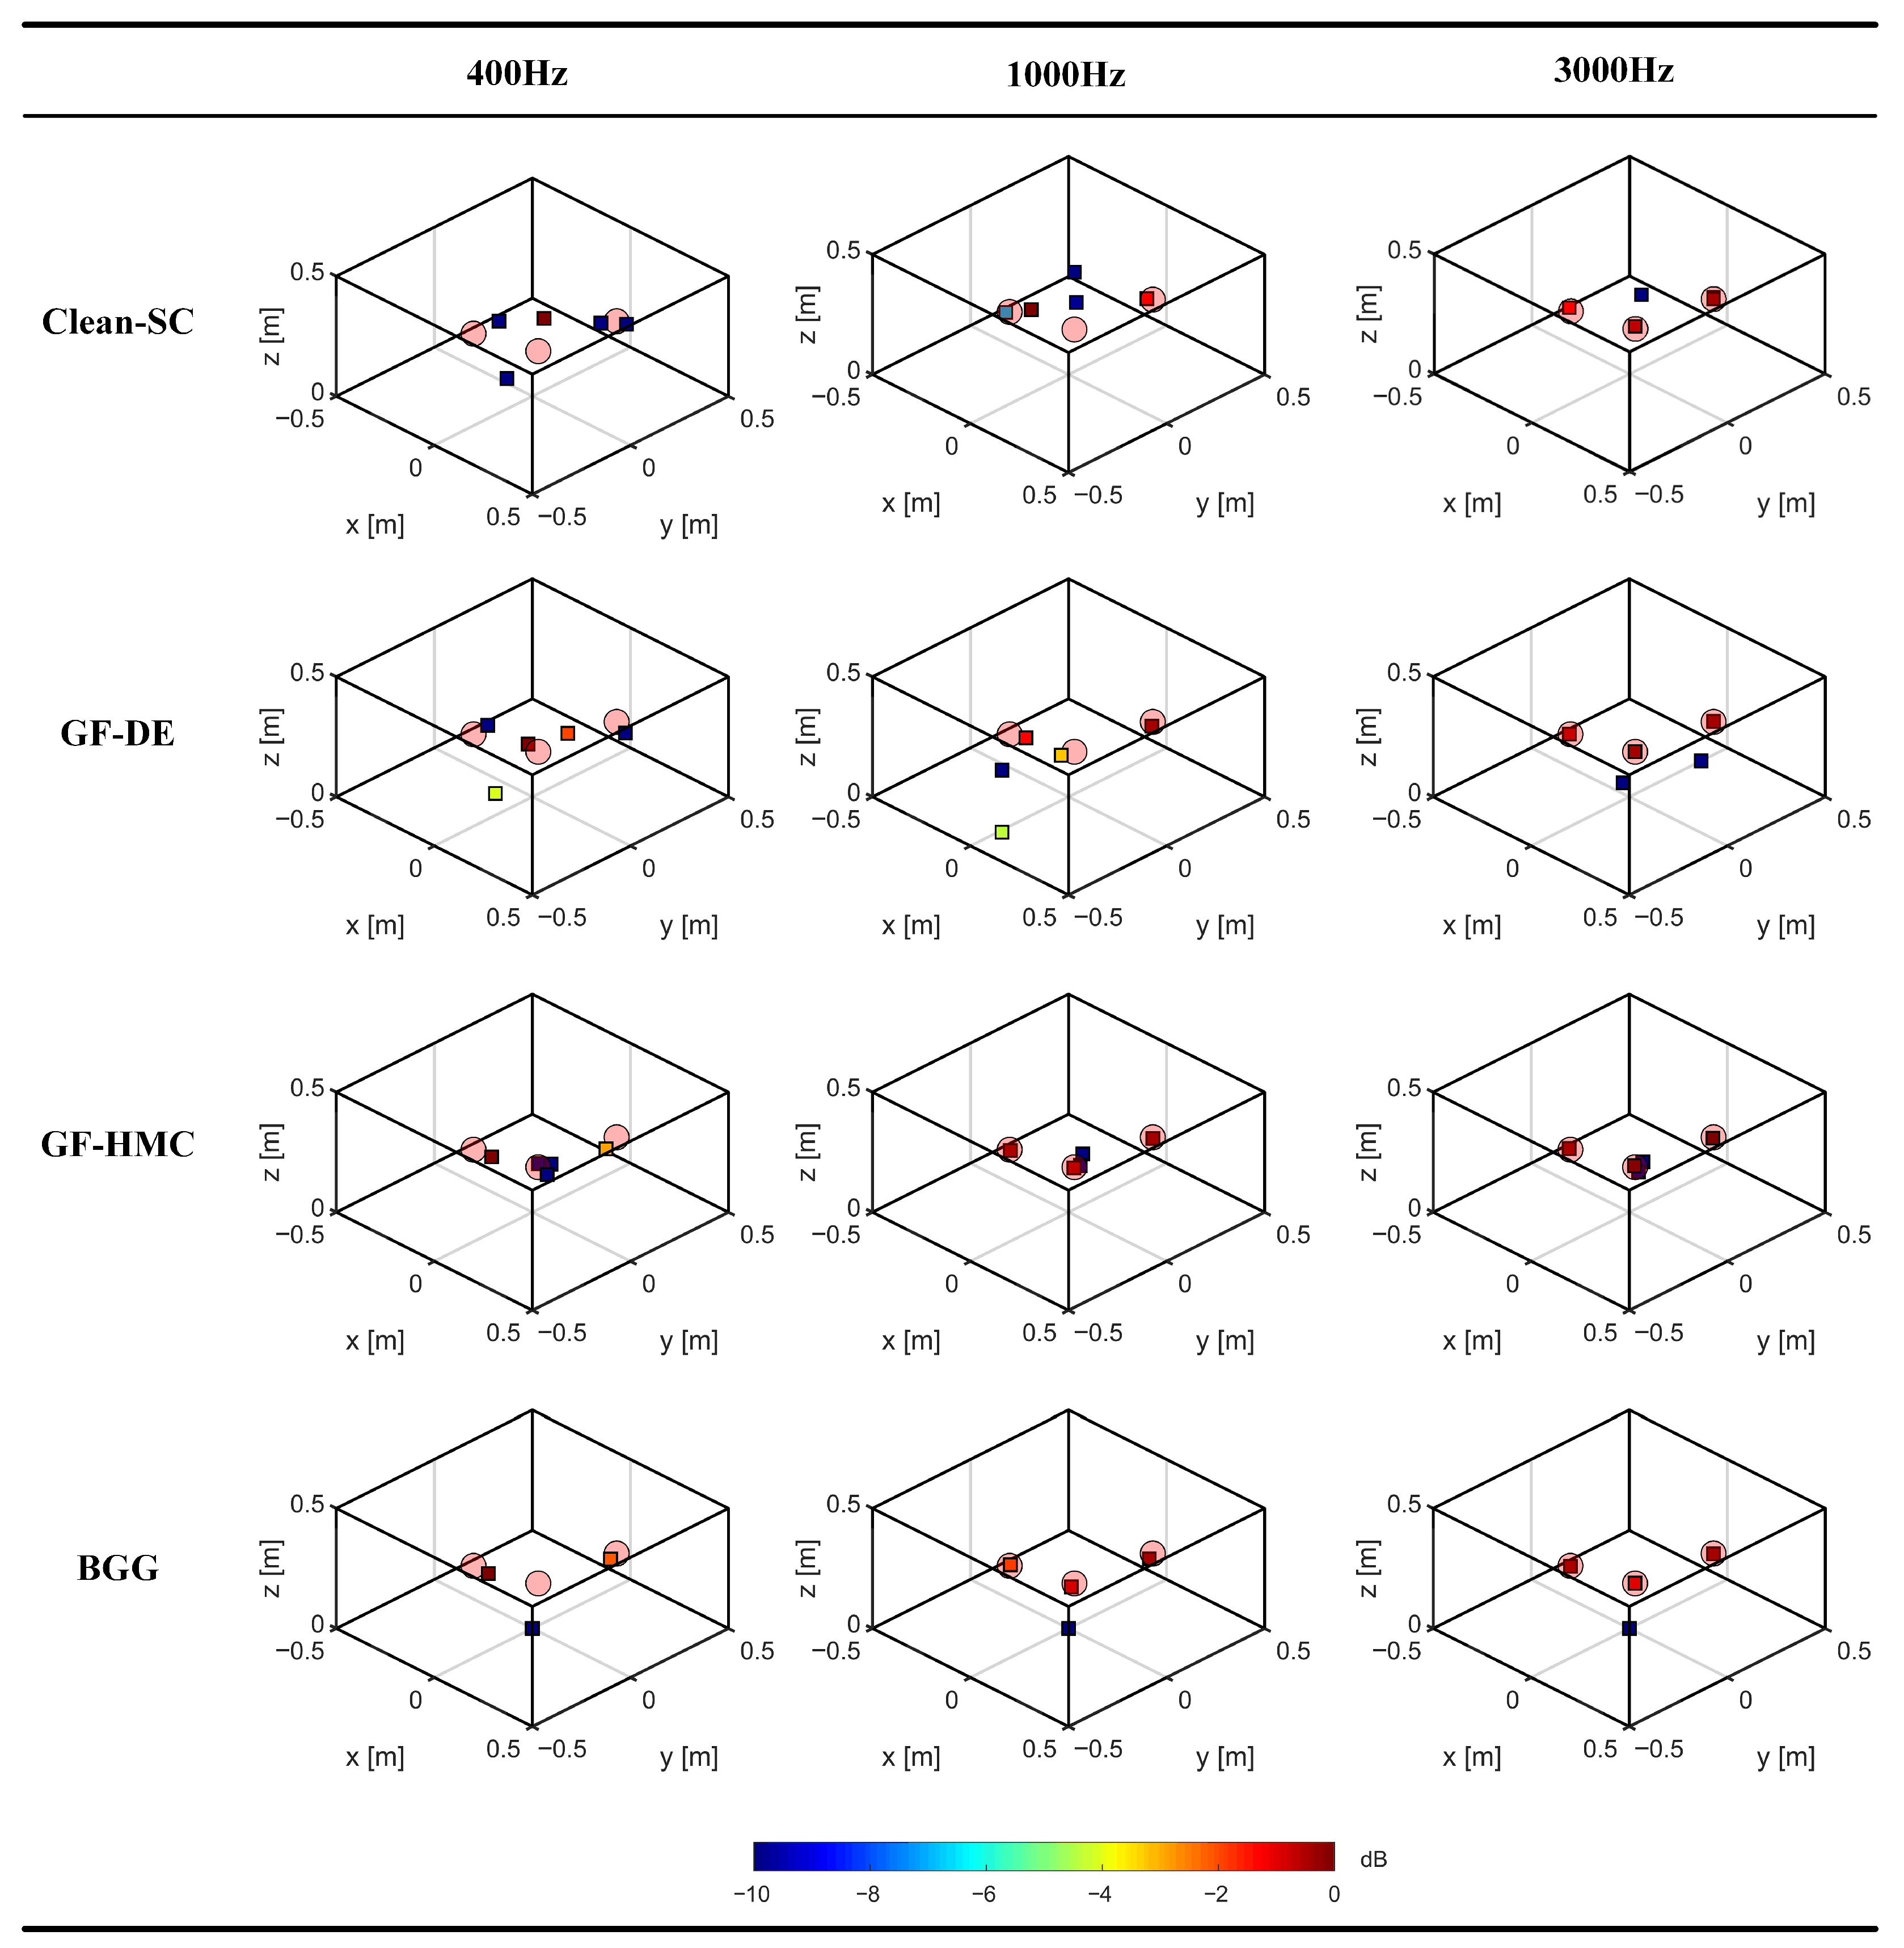
Figure 4 compares the simulation localization performance of four algorithms at 400, 1000, and 3000 Hz. The true source positions are indicated by pink circles, while squares represent the estimated locations, with their color mapped to the normalized SPL. Among all source identification results, the GF-HMC method demonstrates the highest localization accuracy, successfully resolving all sources across the entire 400–3000 Hz frequency range. The proposed BGG algorithm achieves the second-best performance; while it accurately identifies the sources at 1000 Hz and 3000 Hz, its precision for Source B at (0.03, 0.00, 0.20) m is inferior to that of GF-HMC at 400 Hz. Although both algorithms optimize the same negative log-posterior objective function, HMC achieves superior optimization by constructing Hamiltonian energy, outperforming the PSO-based approach used in BGG. In contrast, the performance of the GF-DE algorithm degrades as the source frequency decreases, with a corresponding decline in the estimation accuracy of both source position and amplitude. This is attributed to its simultaneous optimization of position and strength, which renders it more susceptible to converging to local optima at lower frequencies. Finally, the Clean-SC method, being constrained by the Rayleigh criterion, exhibits lower resolution than the other acoustic inverse methods. Consequently, it is only capable of identifying the 3000 Hz source.
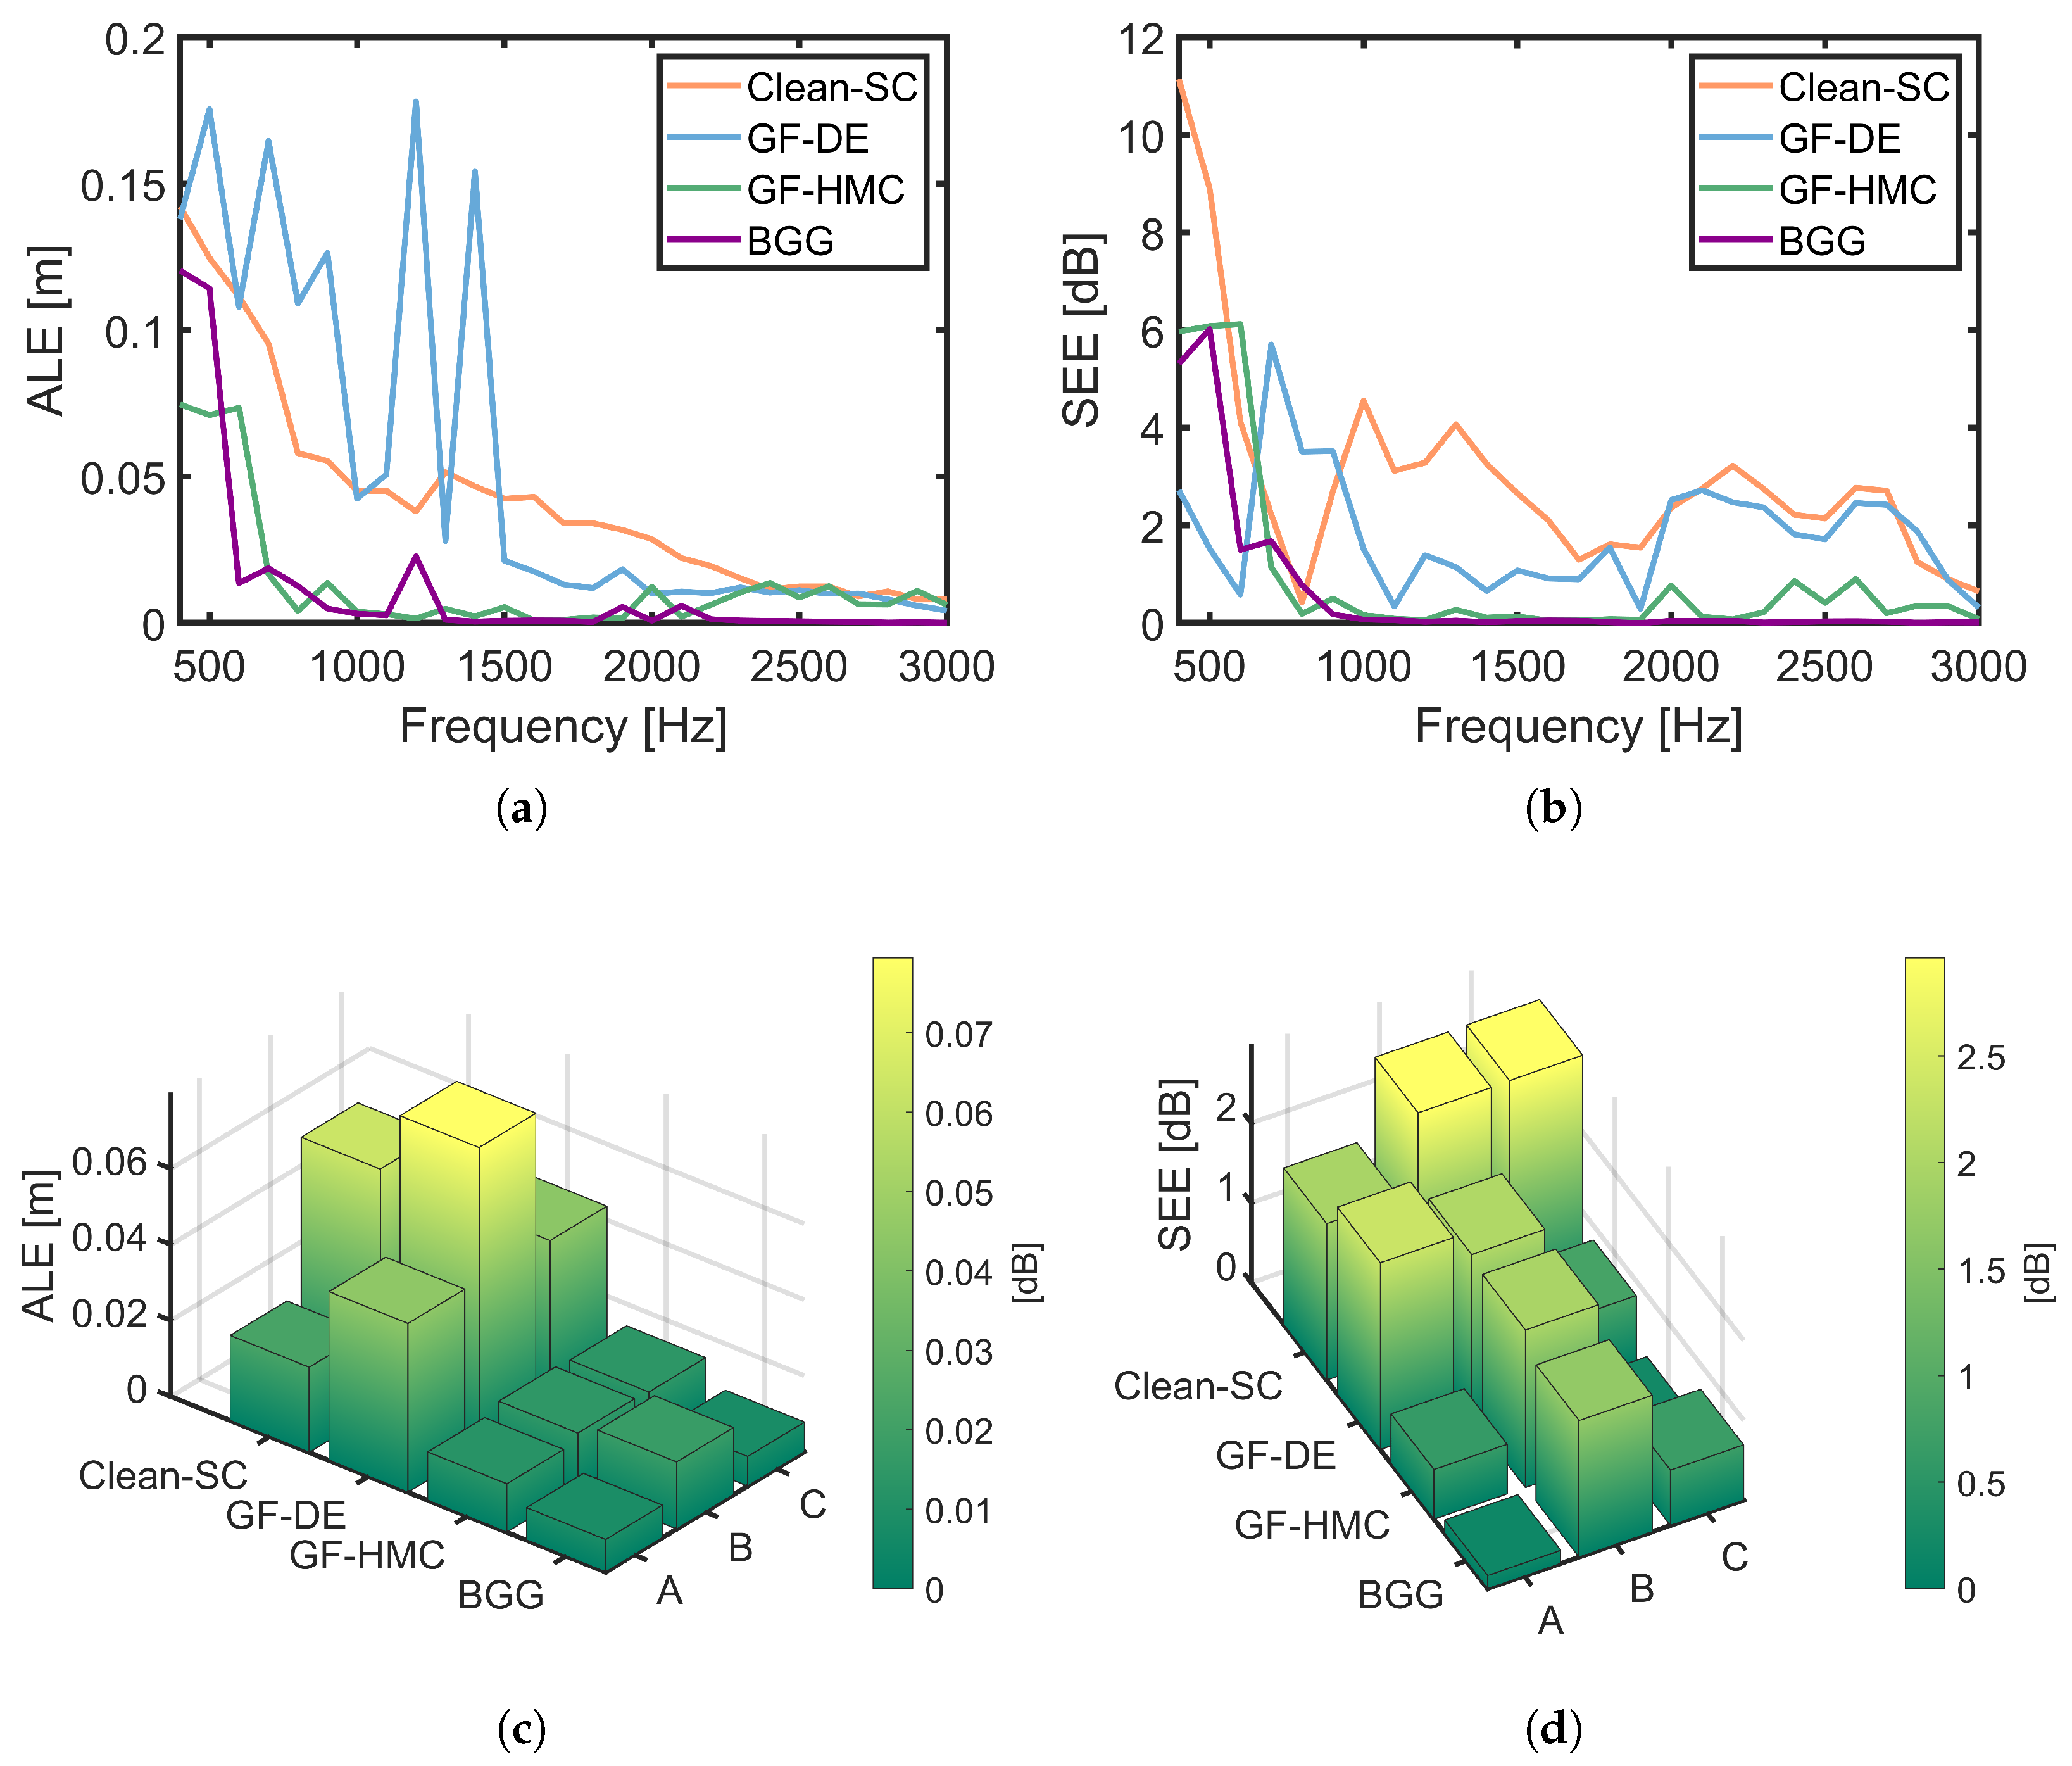
Figure 5 presents a quantitative comparison of the algorithms’ localization performance in the simulations, based on absolute localization error and SPL estimation error. Panels (a) and (b) show the error trends as a function of frequency, averaged across the three sources. Panels (c) and (d) present the corresponding errors for each individual source after averaging across the frequency range. As shown in Figure 5a,b, both ALE and SEE show an increasing trend as frequency decreases. This phenomenon is attributed to the greater difficulty in source identification at lower frequencies, where the spatial rate of phase change slows. Among all evaluated methods, the proposed BGG algorithm and GF-HMC exhibit the best performance. Notably, at frequencies above 600 Hz, the BGG algorithm’s ALE and SEE are nearly consistently lower than those of GF-HMC, with a particularly pronounced advantage above 2000 Hz. This suggests that the PSO-based optimization in BGG is more effective than HMC for the same negative log-posterior objective function in this high-frequency regime, likely due to the fixed step size and step count used in our HMC implementation. Conversely, below 600 Hz, the ALE and SEE of the BGG algorithm are higher than those of GF-HMC. This reversal suggests that by constructing Hamiltonian energy, HMC is more capable of surmounting potential energy barriers of local optima to find the global minimum, a distinct advantage over PSO at challenging low frequencies.
As shown in Figure 5c,d, the BGG algorithm demonstrates the best overall source identification performance. Its ALE, averaged across all frequencies, is less than 0.018 m, and its average SEE is below 1.71 dB. Compared to GF-DE, BGG achieves superior accuracy in both source localization and strength estimation. This suggests that BGG’s negative log-posterior fitness function is more effective than the CSM energy function used by GF-DE.
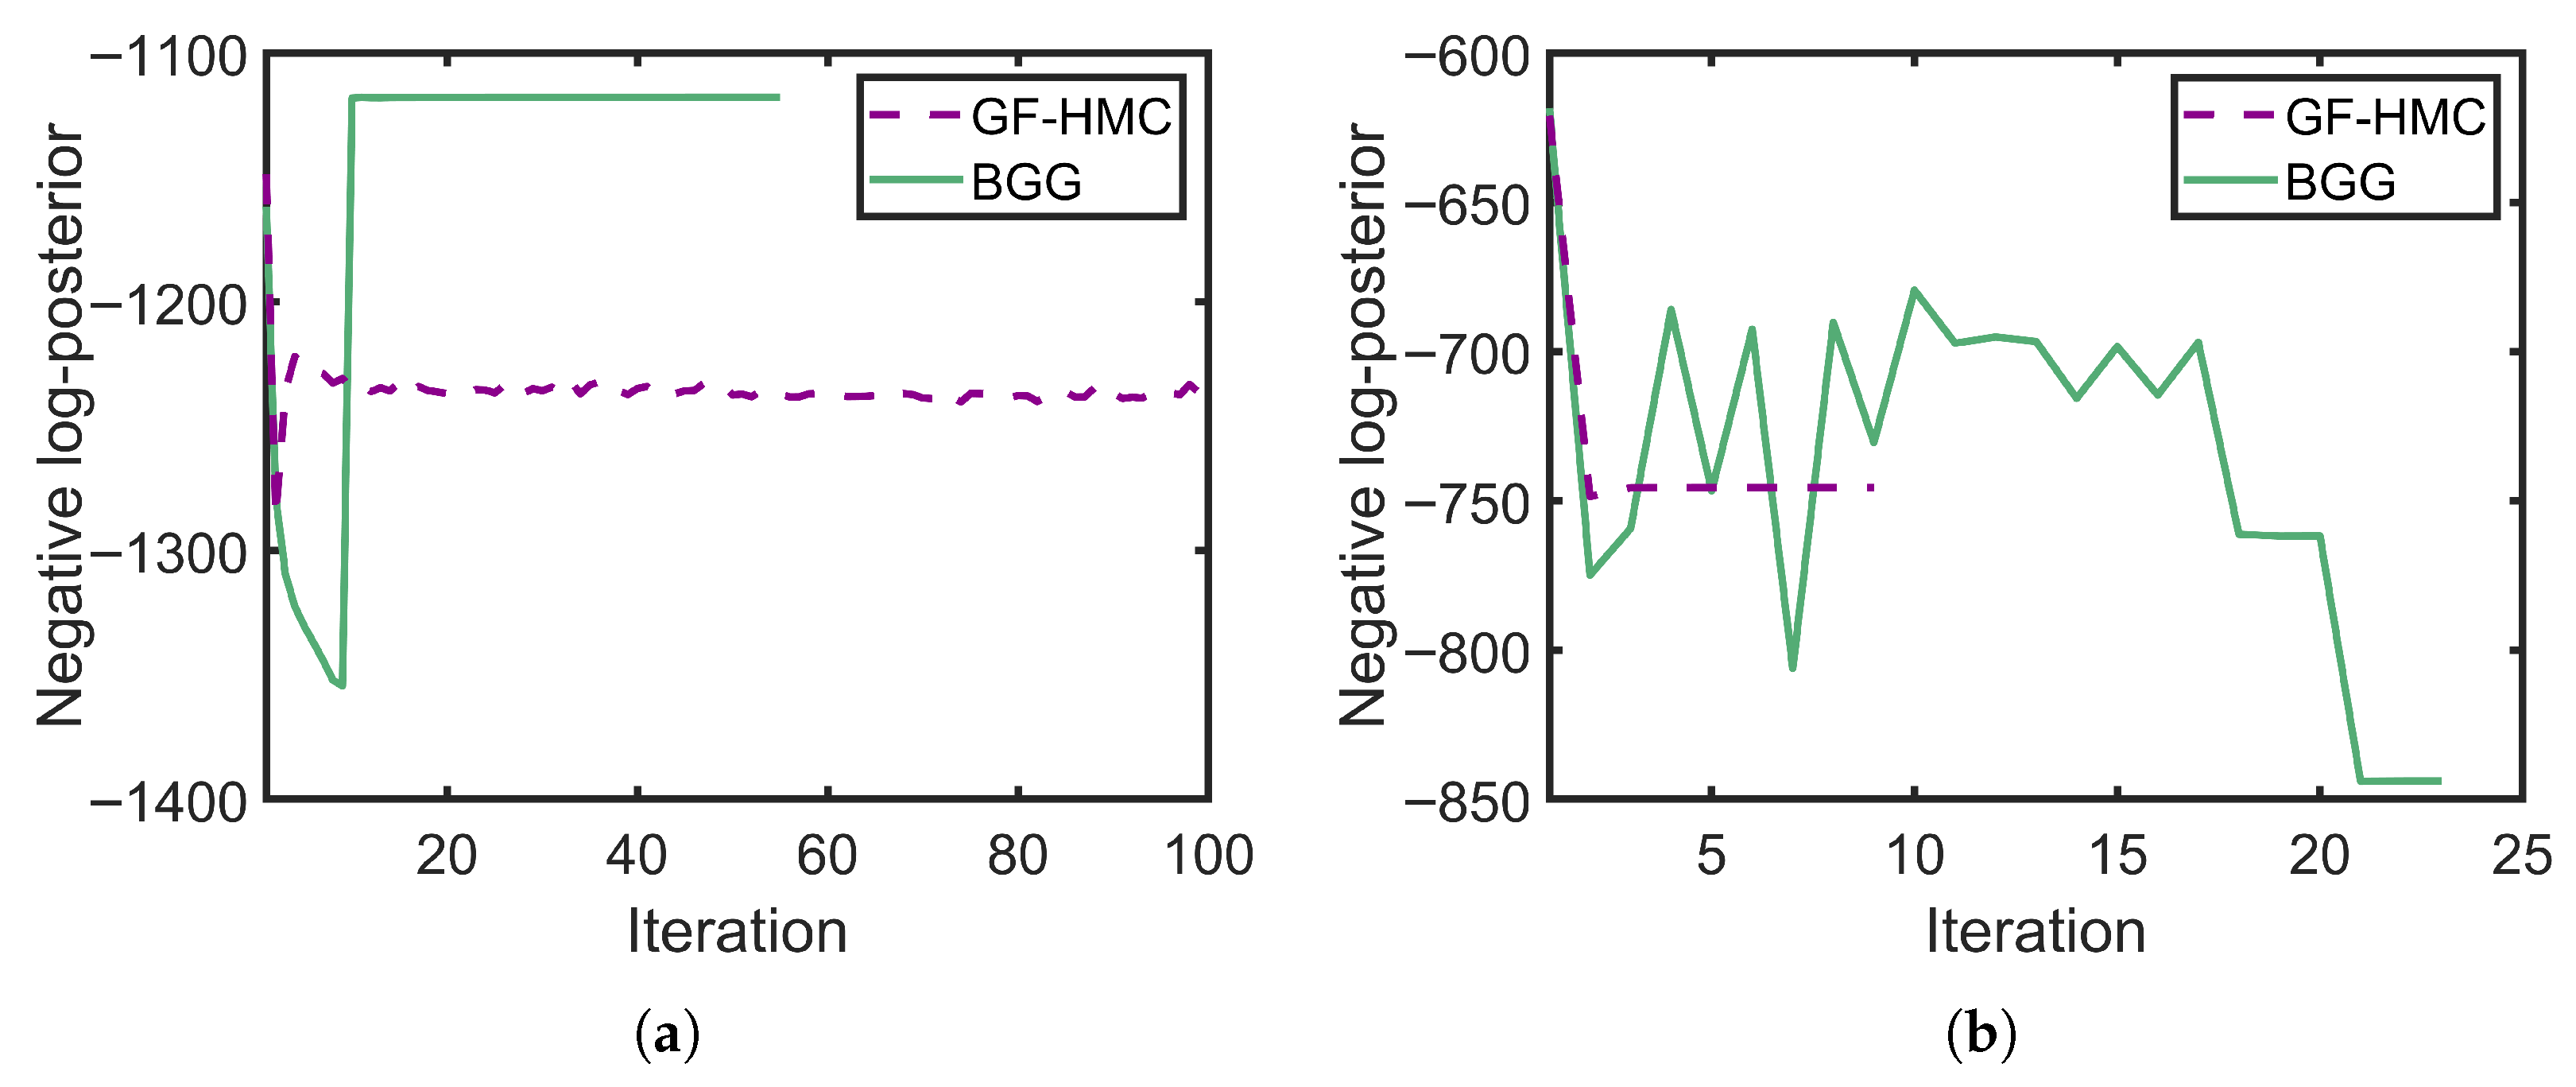
Figure 6 compares the negative log-posterior obtained by GF-HMC and BGG for Source B at (0.03, 0.00, 0.20) m at 400 Hz (Figure 6a) and 3000 Hz (Figure 6b). The larger number of iterations required by both algorithms at 400 Hz, as shown in Figure 6, reflects the greater difficulty of source localization at this lower frequency compared to 3000 Hz. At 400 Hz, the source identification results of BGG are inferior to those of GF-HMC. This performance difference arises from the final negative log-posterior value, which is lower for GF-HMC’s leapfrog integration than for BGG’s particle swarm optimization. However, the negative log-posterior value obtained by GF-HMC is not the global minimum, which explains the discrepancy between its localization result and the ground truth. Conversely, at 3000 Hz, BGG attains a lower negative log-posterior value than GF-HMC, which accounts for BGG’s smaller ALE and SEE at this frequency. Overall, these results confirm that the negative log-posterior functions as an effective fitness function for optimizing acoustic source locations.
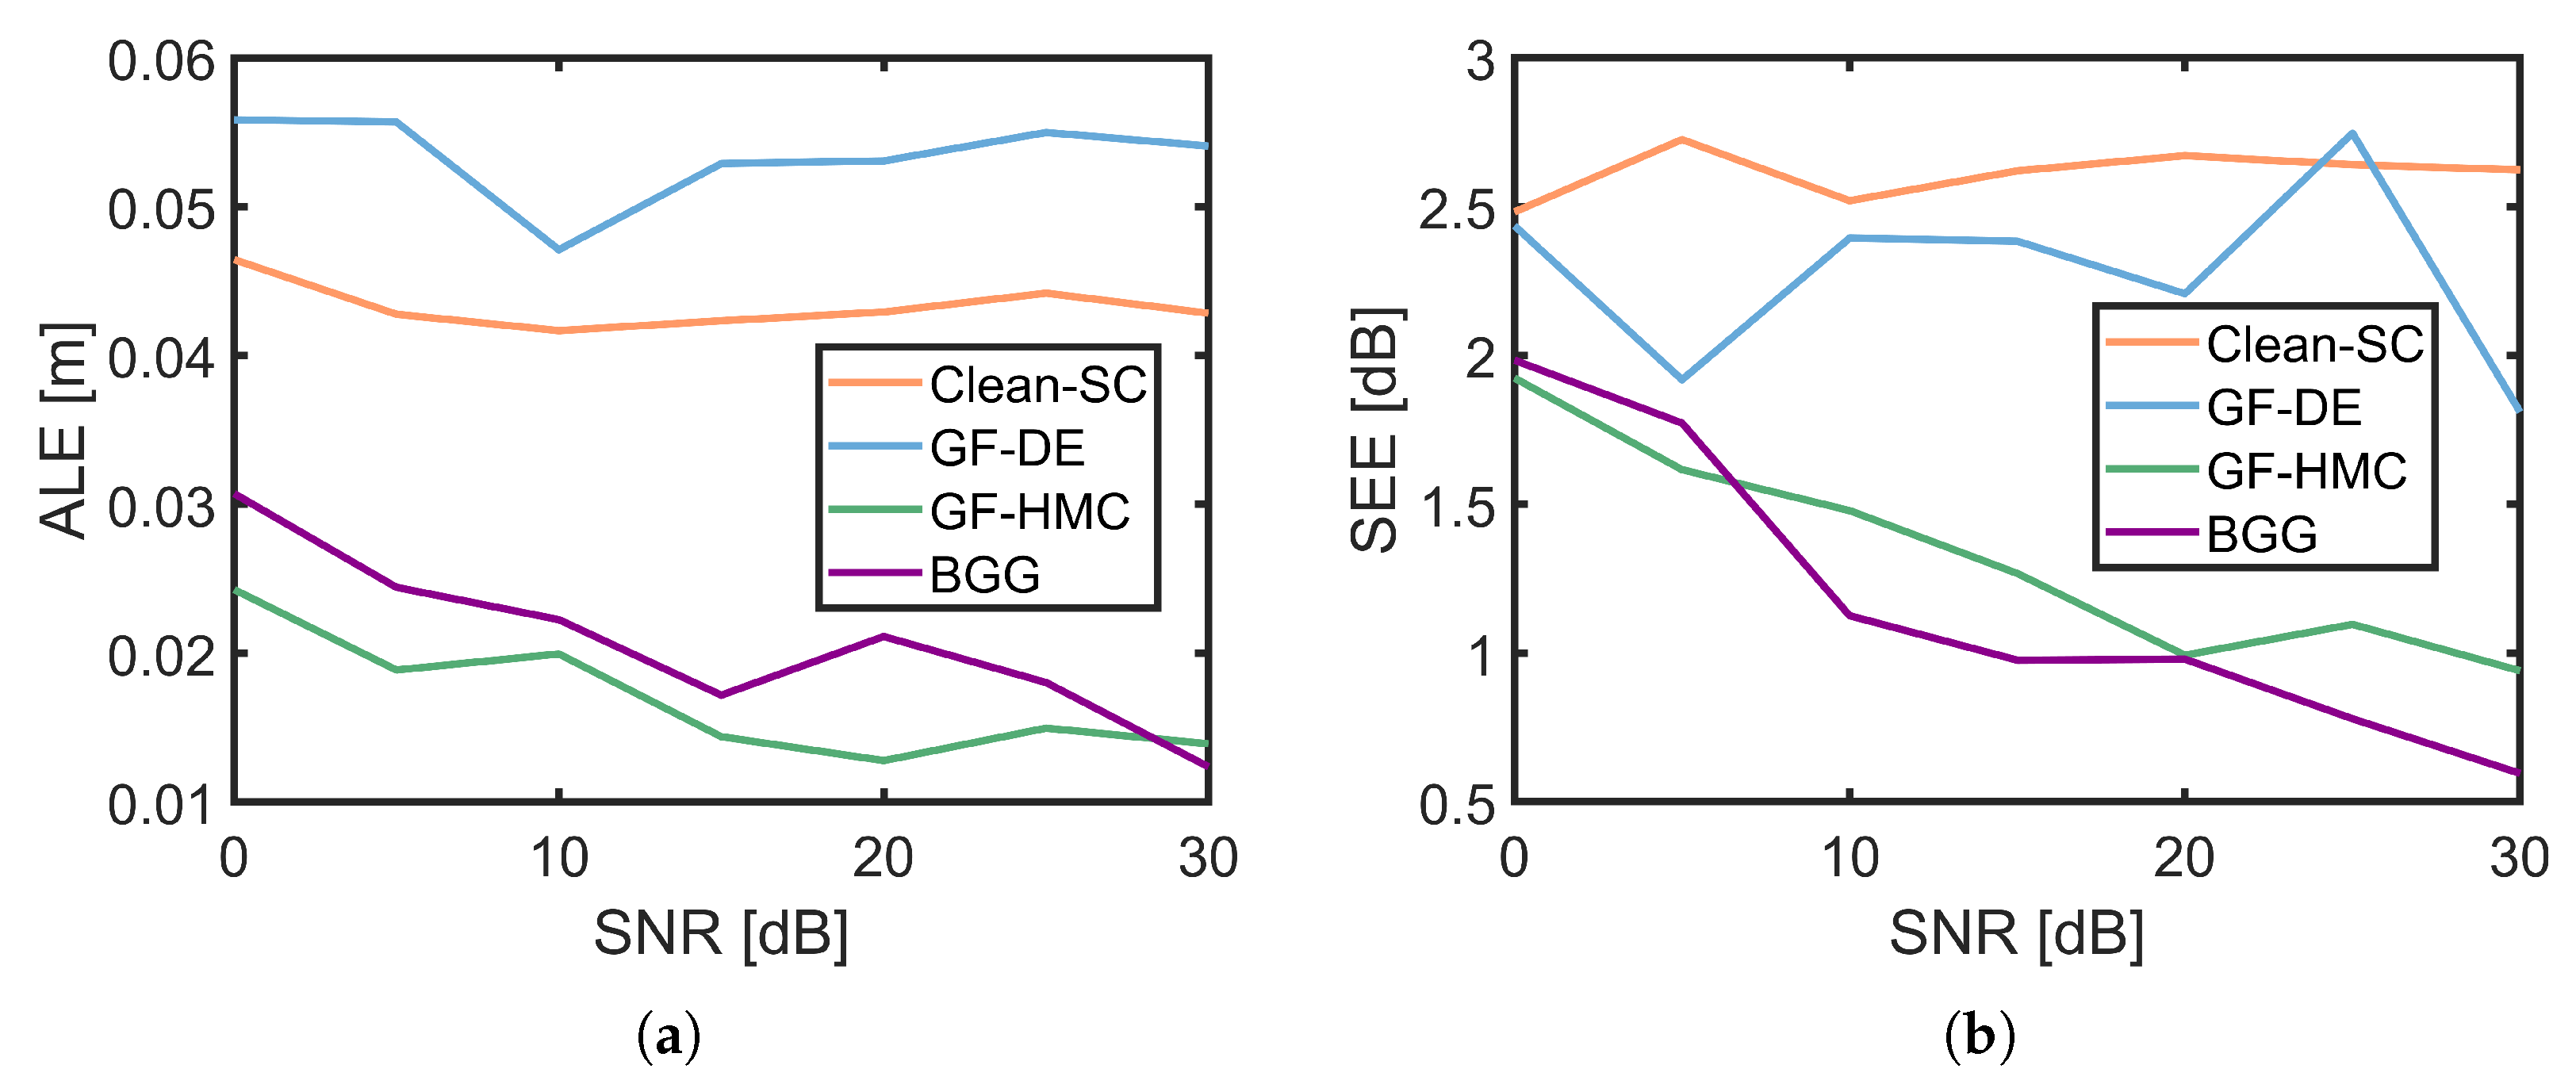
Figure 7 presents the comparison of absolute localization error and sound pressure level (SPL) estimation error as functions of the signal-to-noise ratio (SNR). Both ALE and SEE are averaged over 27 frequencies ranging from 400 Hz to 3000 Hz. As shown in the figure, the ALE and SEE of the GF-DE and Clean-SC algorithms remain almost unchanged with decreasing SNR, whereas those of the HMC and BGG algorithms increase significantly. This is because variations in SNR primarily affect the low-frequency performance of the HMC and BGG algorithms, while the GF-DE and Clean-SC methods already exhibit poor accuracy at low frequencies and are therefore less sensitive to noise levels. Owing to its use of Hamiltonian dynamics, the HMC algorithm demonstrates stronger noise robustness at low frequencies, resulting in lower ALE values compared with the BGG algorithm.
Table 1 shows the average computation time of the four algorithms, measured in CPU seconds from MATLAB R2022a implementations across 27 frequencies. All algorithms are executed in MATLAB on a 13th Gen Intel(R) Core(TM) i9-13900KF processor (Intel Corporation, Santa Clara, CA, USA). It can be seen from the table that the computation time of BGG is slightly higher than that of GF-DE, primarily because evaluating the negative log-posterior involves greater computational effort than the CSM energy function. However, the computation time of BGG is nearly one-quarter that of GF-HMC, since BGG employs PSO to optimize the negative log-posterior, which is far less computationally intensive than leapfrog integration.
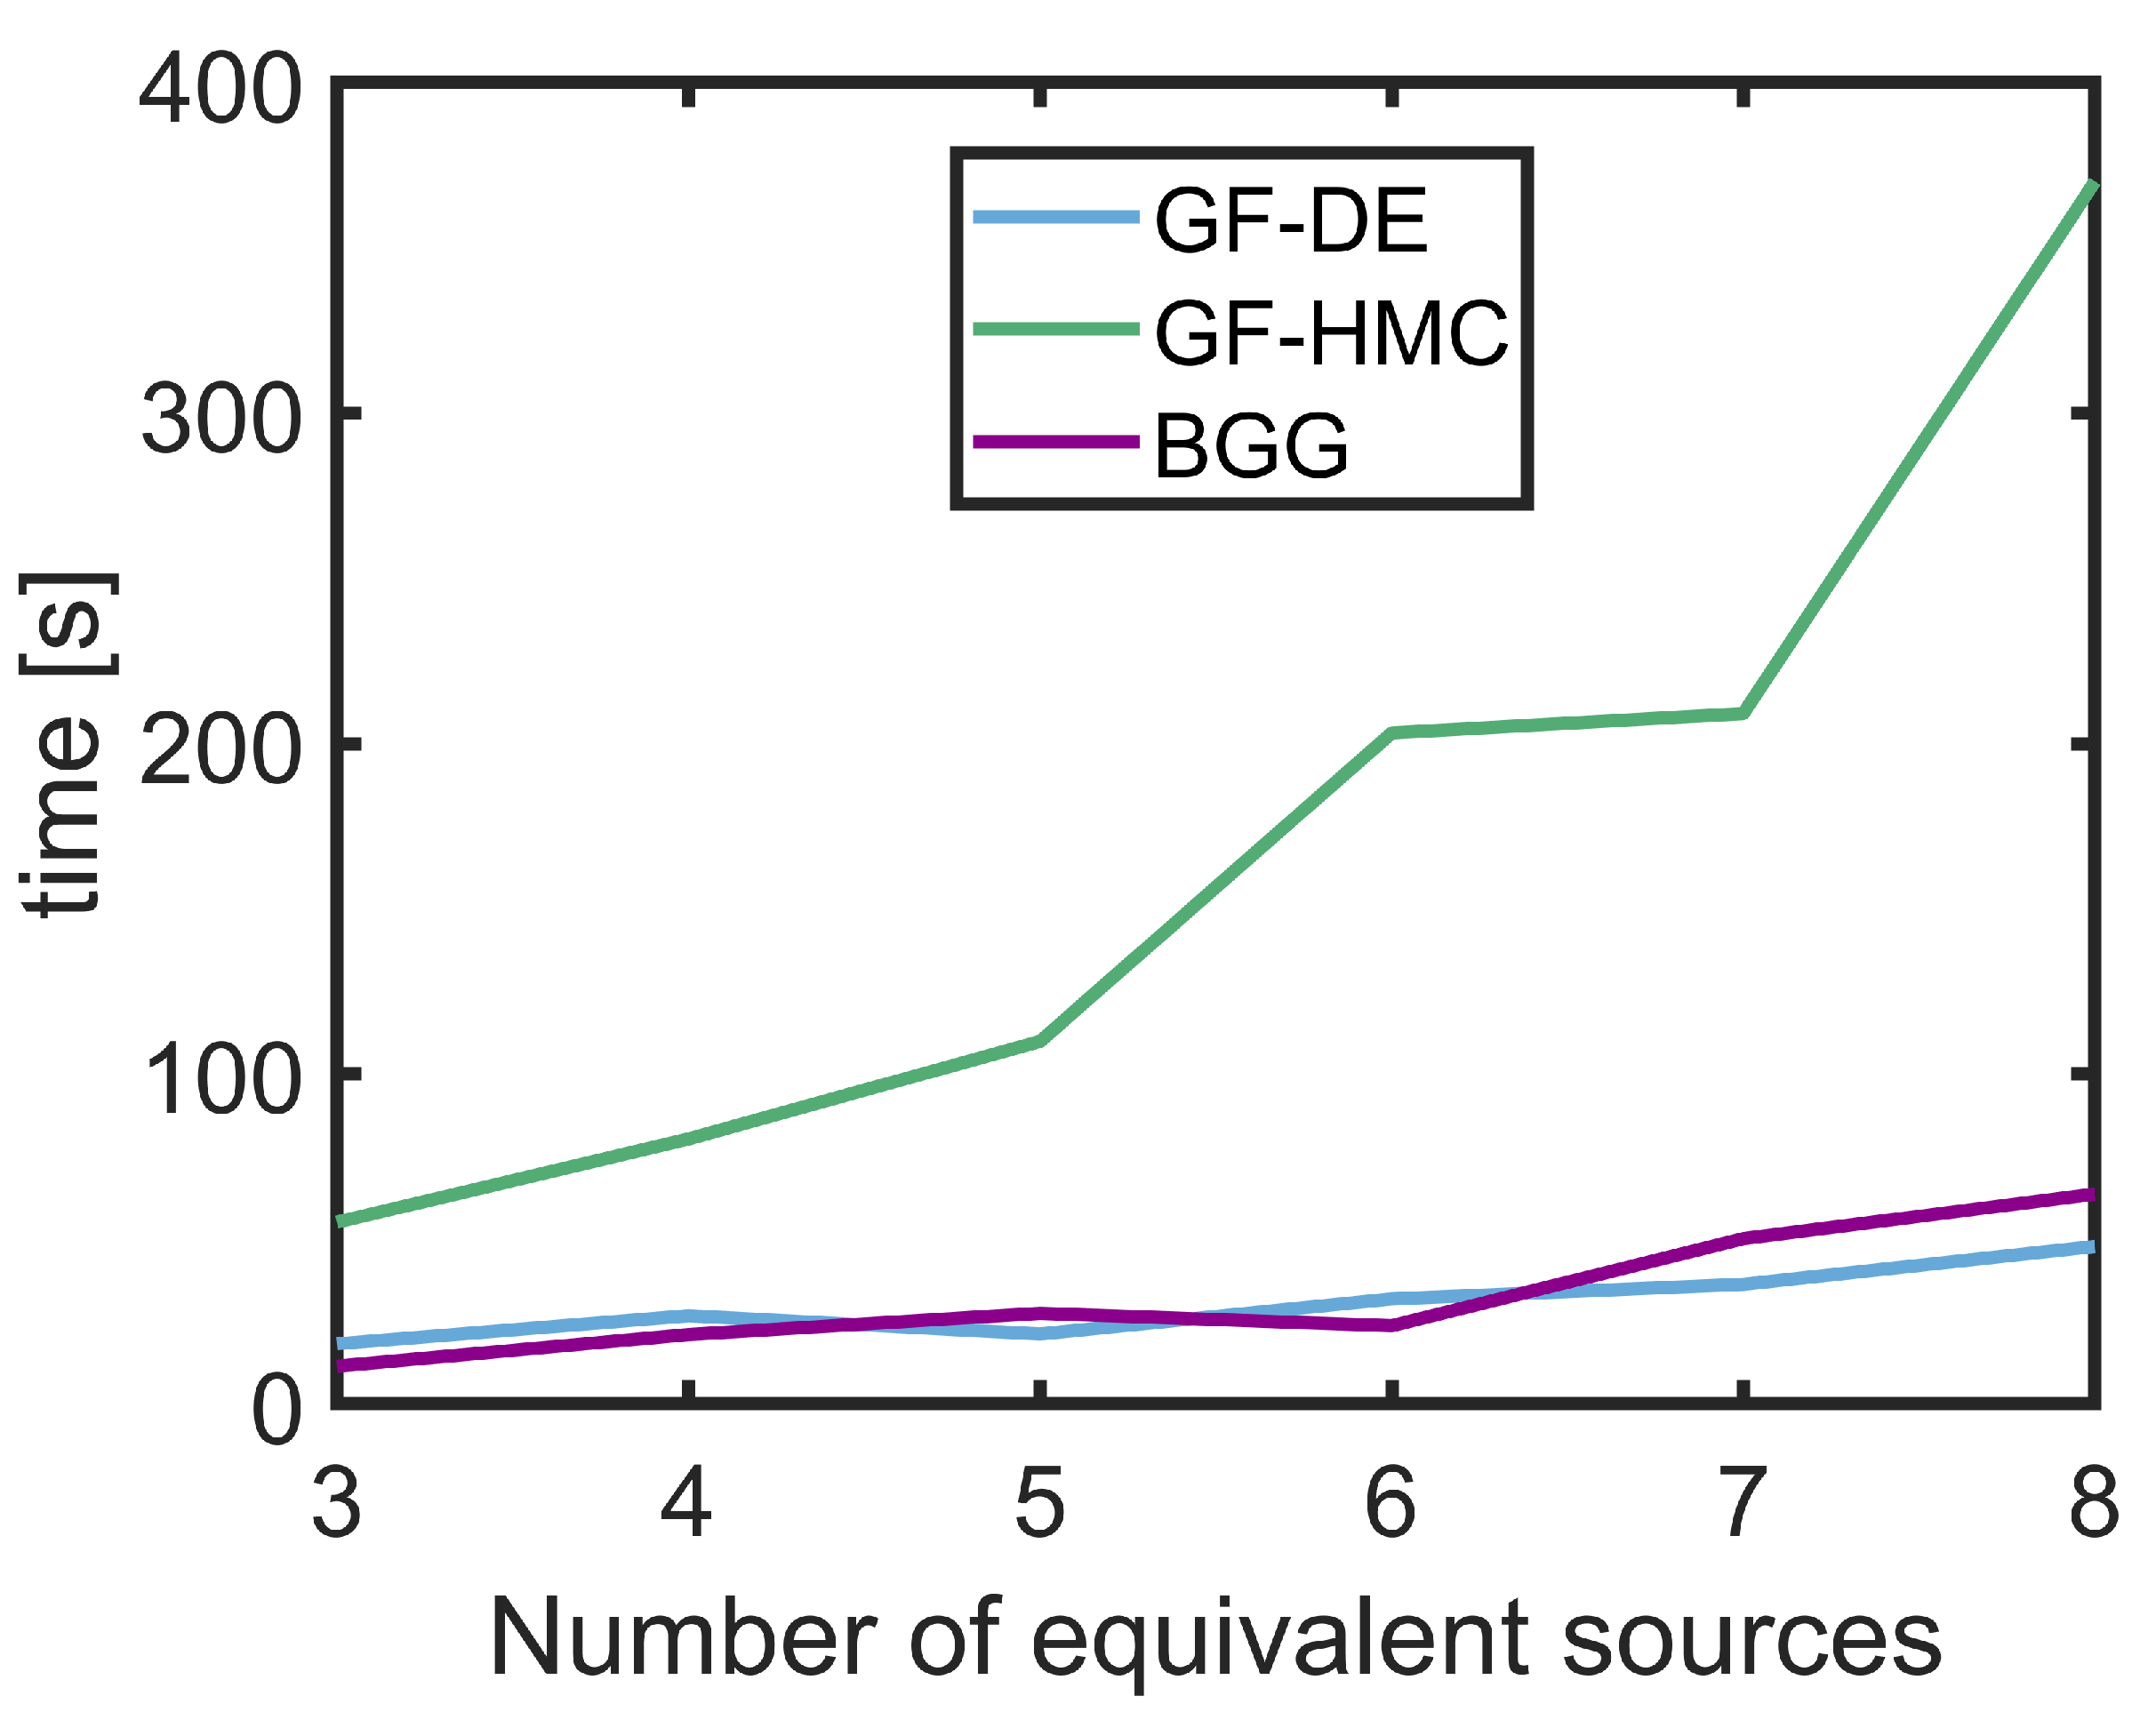
Figure 8 illustrates the computational time of the GF-DE, GF-HMC, and BGG algorithms as a function of the number of equivalent sources. It can be observed that the runtime of all three algorithms increases nearly linearly with the number of sources. For the GF-HMC and BGG algorithms, this linear trend arises because the optimization of equivalent source positions is decomposed into N independent subproblems through the construction of the residual sound pressure vector. Although the GF-DE algorithm simultaneously optimizes all source parameters, its computational complexity is primarily dictated by the evaluation cost of the fitness function. Each evaluation for a candidate solution—encompassing all N sources—requires computing the complete sound field at M microphones. This process, dominated by operations involving an M × N transfer matrix, exhibits a computational complexity of O ( M N ) . Consequently, for a fixed M, the evaluation cost scales linearly with N, leading to the overall near-linear increase in runtime. While the exact optimization time may vary slightly depending on the initialization, the overall computational cost of the BGG and GF-DE algorithms remains comparable and significantly lower than that of GF-HMC.

4.3. Experiment Results and Analysis

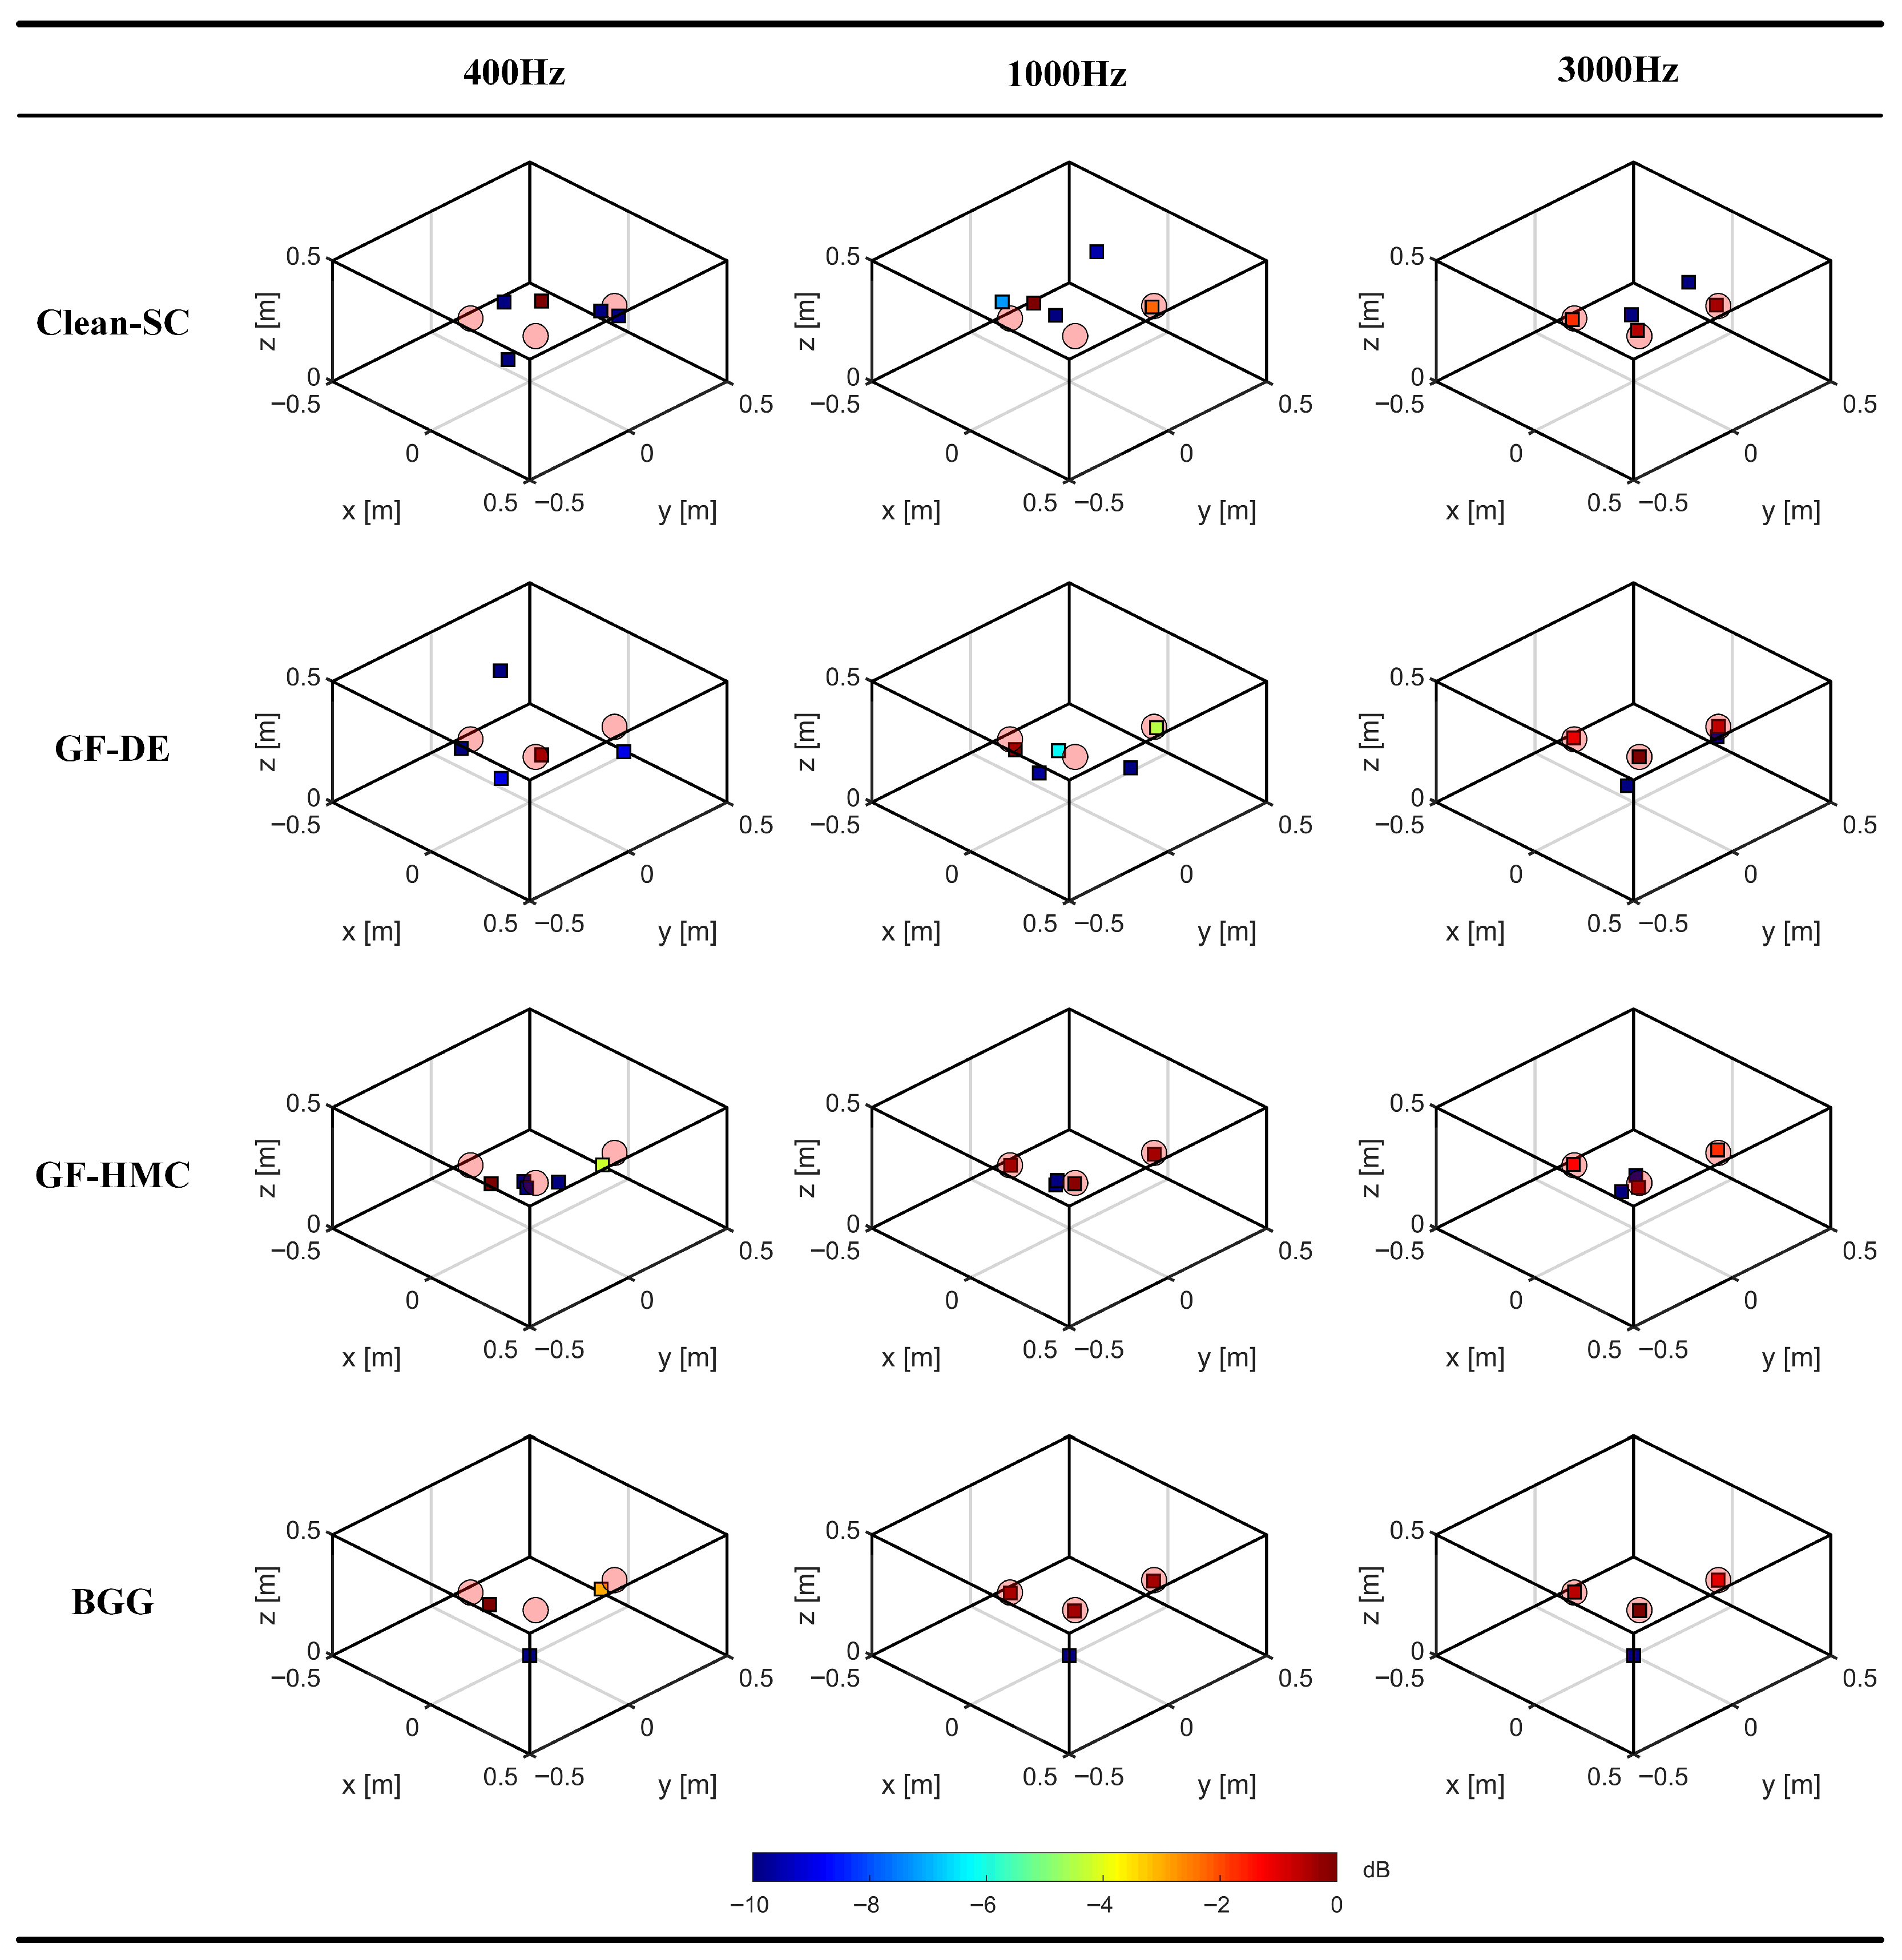
Figure 9 compares the experiment localization performance of four algorithms at 400, 1000, and 3000 Hz. The true source positions are indicated by pink circles, while squares represent the estimated locations, with their color mapped to the normalized SPL. As shown in Figure 9, the proposed BGG algorithm achieves better localization performance than the CleanSC and GF-DE algorithms. This improvement arises because BGG employs the negative log-posterior of the equivalent source positions as the fitness function, which provides a more accurate fit to the measured data while mitigating the impact of experimental noise. The only exception occurs at 400 Hz, where the localization of Source B at (0.03, 0.00, 0.20) m by BGG is slightly inferior to that of GF-HMC, primarily due to the reduced resolution of the algorithm at low frequencies.
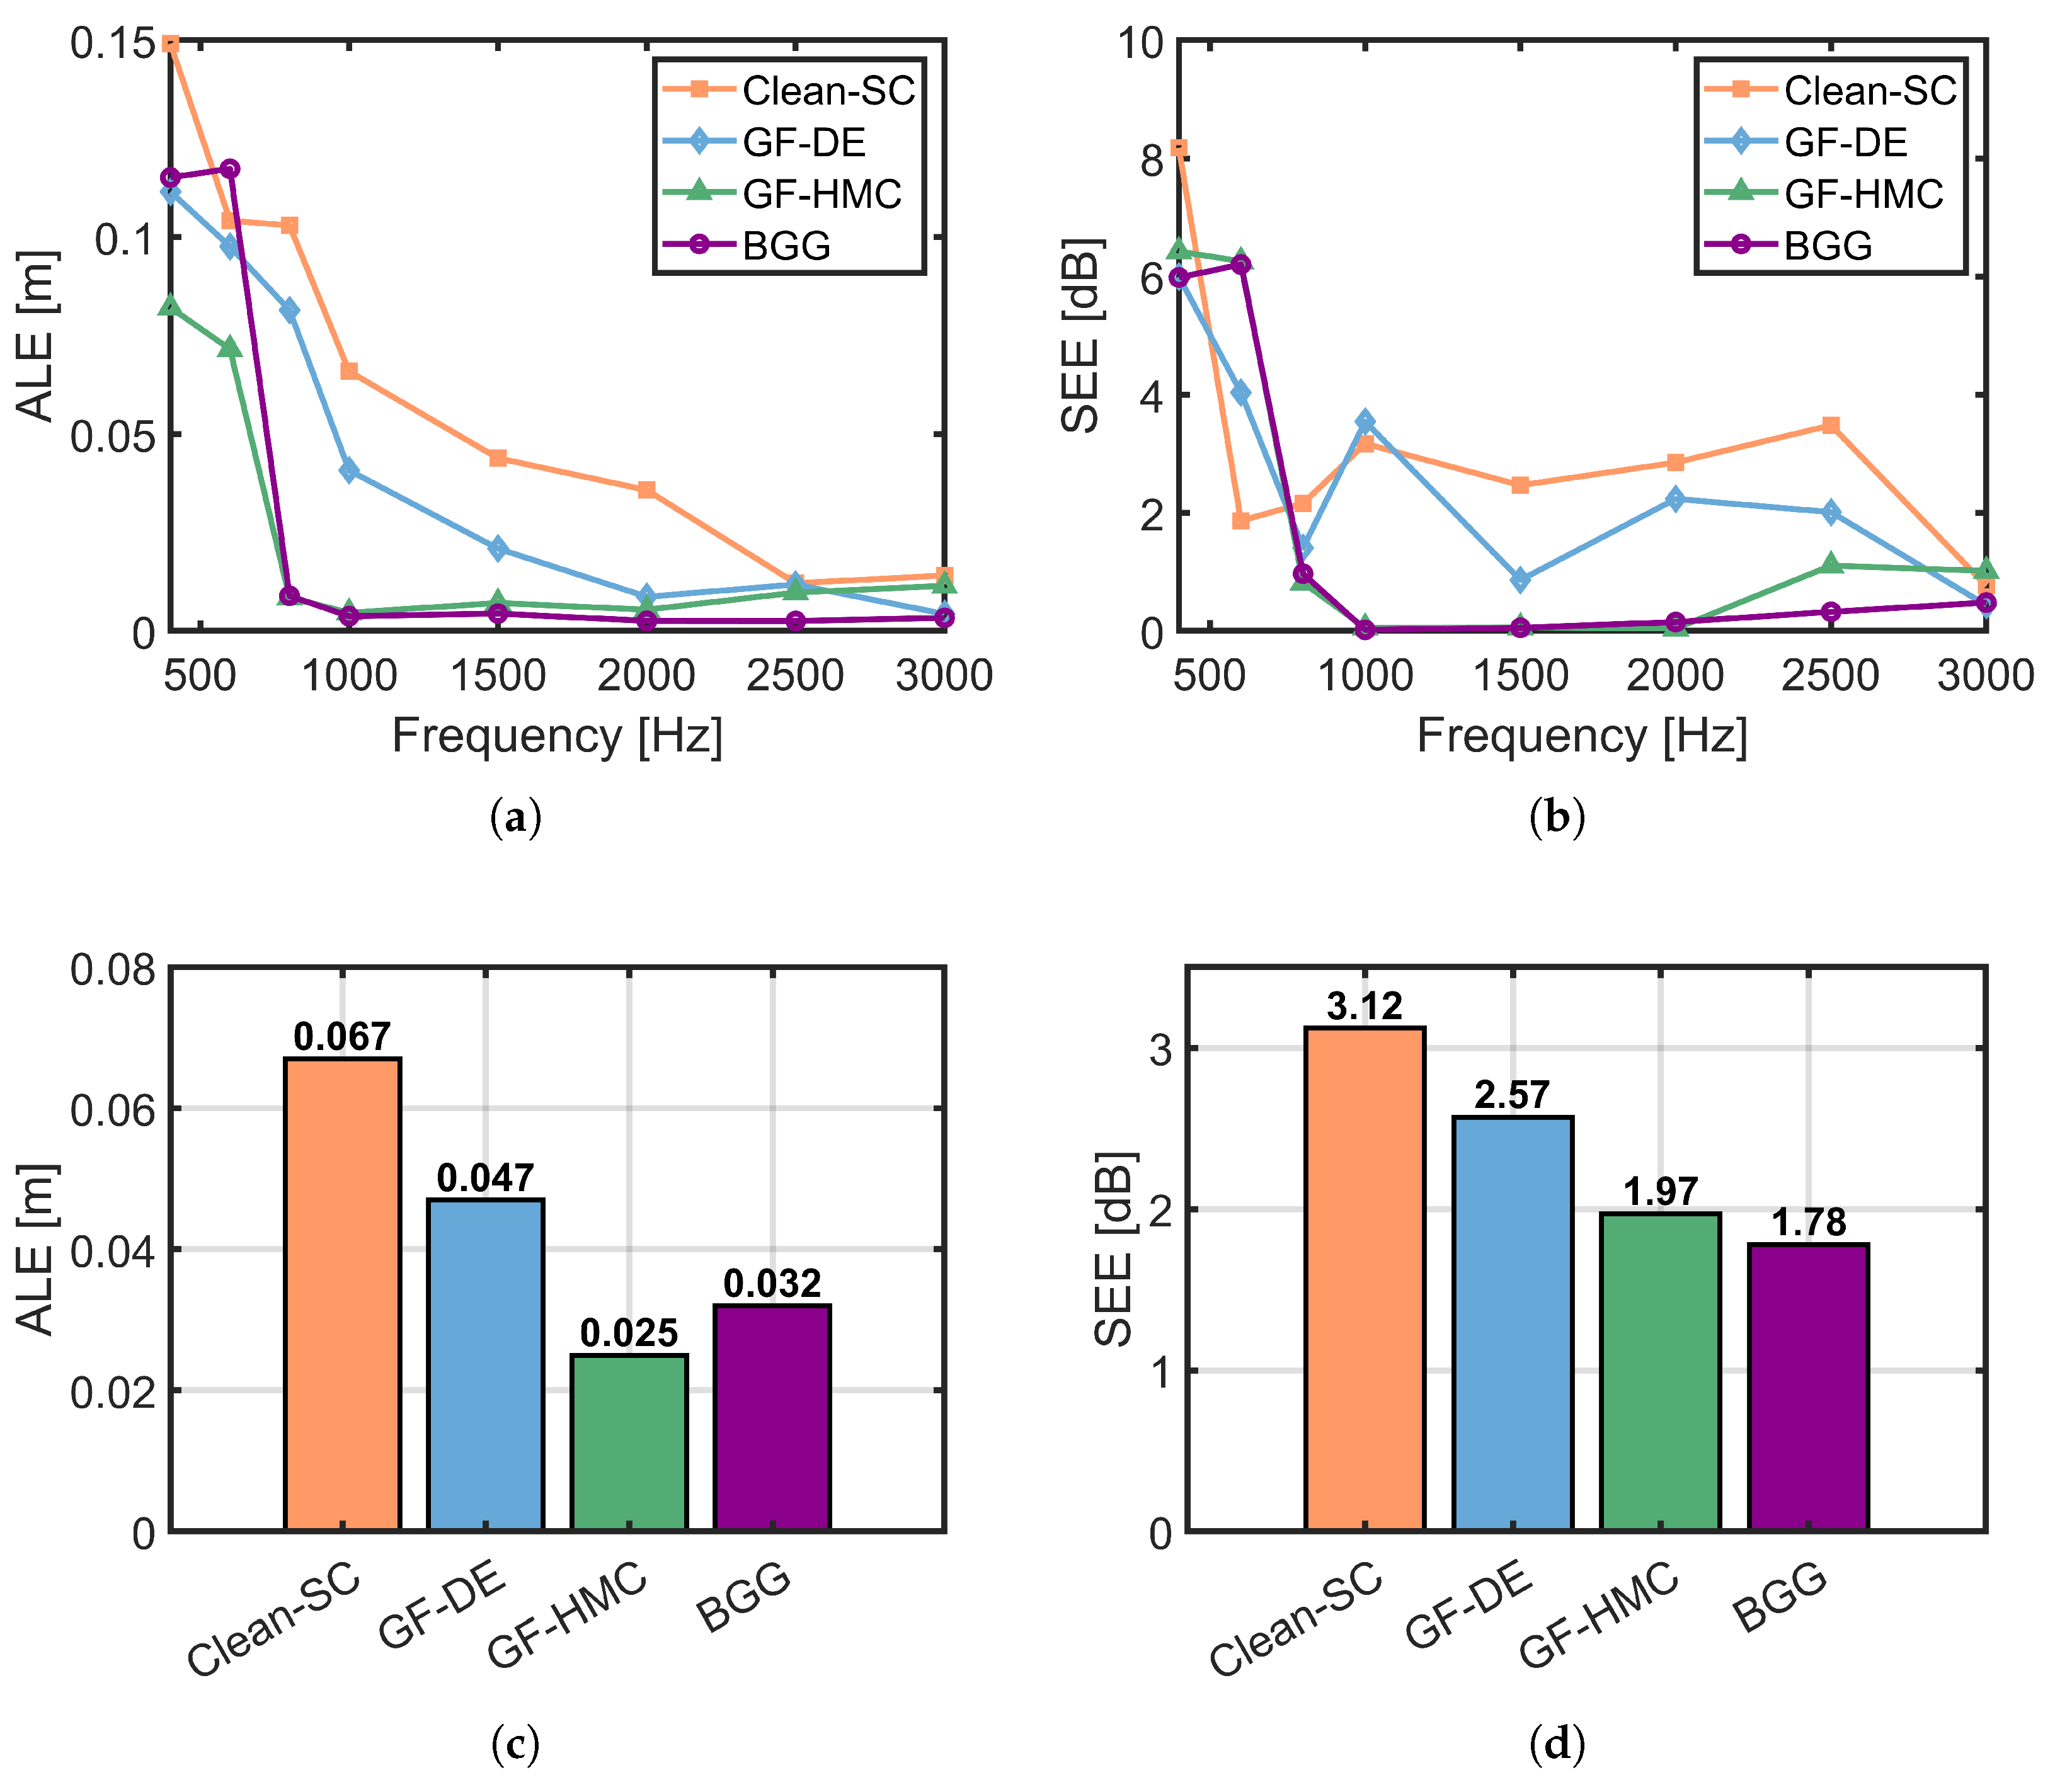
Figure 10 presents a quantitative comparison of the algorithms’ localization performance in the experiments, based on absolute localization error and SPL estimation error. Panels (a) and (b) show the error trends as a function of frequency, averaged across the three sources. Panels (c) and (d) present the corresponding errors after averaging across the frequency range.
As shown in Figure 10a,b, the ALE and SEE of the proposed BGG algorithm are relatively high below 800 Hz due to deviations in the estimated position and amplitude of Source B at (0.03, 0.00, 0.20) m. However, above 800 Hz, the ALE and SEE achieved by BGG are substantially lower than those of the CleanSC and GF-DE algorithms. This demonstrates the advantage of using the negative log-posterior as the fitness function over the CSM energy function adopted by GF-DE, as well as the superiority of acoustic inverse methods compared with beamforming approaches. In comparison with GF-HMC, the benefit of the proposed algorithm is most pronounced above 2000 Hz. This is because GF-HMC employs a fixed number of leapfrog steps with a fixed step size, which limits its ability to explore the solution space, whereas the PSO in BGG provides stronger local exploration capability. As shown in Figure 10c,d, the BGG algorithm achieves an average ALE of 0.032 m across all frequencies. Although slightly higher than GF-HMC due to the poorer localization performance of Source B at low frequencies, it is 0.015 m lower than that of GF-DE. The average SEE of BGG is 1.78 dB, the lowest among all algorithms, being 0.79 dB lower than GF-DE and 0.19 dB lower than GF-HMC. In summary, the proposed BGG algorithm demonstrates a superior balance between computational efficiency and localization accuracy compared with other state-of-the-art grid-free approaches.

5. Conclusions

This study has proposed a novel Bayesian Grid-free framework with Global optimization (BGG) for three-dimensional acoustic source imaging. In this framework, a Bayesian inference model is constructed based on equivalent source theory. The negative log-posterior of the equivalent source positions is employed as the fitness function, replacing the conventional Cross-Spectral Matrix (CSM) energy function. To optimize this function, a global optimization algorithm (Particle Swarm Optimization, PSO) is used to estimate the source positions, offering an alternative to traditional Hamiltonian Monte Carlo (HMC) methods. The effectiveness and robustness of the proposed BGG method are validated through comprehensive simulations and experiments involving spatially distributed acoustic sources.
Compared with HMC-based grid-free algorithm, BGG requires only one-quarter of the computation time and achieves superior localization performance above 800 Hz, particularly above 2000 Hz. Compared with differential-evolution-based grid-free algorithm, BGG exhibits similar computation time while reducing the absolute localization error by 0.015 m and the SPL estimation error by 0.79 dB. Overall, BGG demonstrates the best balance between computational efficiency and source localization accuracy among grid-free methods.

Author Contributions

Conceptualization, D.F. and K.W.; methodology, D.F.; software, D.F. and K.W.; validation, D.F., K.W. and Y.S.; formal analysis, D.F. and K.W.; investigation, D.F. and K.W.; resources, M.L. and L.Y.; data curation, D.F., K.W., and Y.S.; writing—original draft preparation, D.F., K.W. and Y.S.; writing—review and editing, D.F., K.W. and Y.S.; visualization, D.F. and K.W.; supervision, M.L. and L.Y.; project administration, M.L. and L.Y.; funding acquisition, M.L. and L.Y. All authors have read and agreed to the published version of the manuscript.

Funding

This research was funded by the National Key R&D Program of China (Grant No. 2020YFA0405700). This work was also supported by National Natural Science Foundation of China (Grant No. 12474464).

Institutional Review Board Statement

Not applicable.

Informed Consent Statement

Not applicable.

Data Availability Statement

The data presented in this study are available on request from the corresponding author.

Conflicts of Interest

The authors declare no conflicts of interest.

References

  1. Amoiridis, O.; Zarri, A.; Zamponi, R.; Pasco, Y.; Yakhina, G.; Christophe, J.; Moreau, S.; Schram, C. Sound Localization and Quantification Analysis of an Automotive Engine Cooling Module. J. Sound Vib. 2022, 517, 116534. [Google Scholar] [CrossRef]
  2. Ballesteros, J.A.; Sarradj, E.; Fernández, M.D.; Geyer, T.; Ballesteros, M.J. Noise Source Identification with Beamforming in the Pass-by of a Car. Appl. Acoust. 2015, 93, 106–119. [Google Scholar] [CrossRef]
  3. Joshi, A.; Rahman, M.M.; Hickey, J.-P. Recent Advances in Passive Acoustic Localization Methods via Aircraft and Wake Vortex Aeroacoustics. Fluids 2022, 7, 218. [Google Scholar] [CrossRef]
  4. Bu, H.; Huang, X.; Zhang, X. An Overview of Testing Methods for Aeroengine Fan Noise. Prog. Aerosp. Sci. 2021, 124, 100722. [Google Scholar] [CrossRef]
  5. Sun, S.; Wang, T.; Yang, H.; Chu, F. Damage Identification of Wind Turbine Blades Using an Adaptive Method for Compressive Beamforming Based on the Generalized Minimax-Concave Penalty Function. Renew. Energ. 2021, 181, 59–70. [Google Scholar] [CrossRef]
  6. Wang, W.; Xue, Y.; He, C.; Zhao, Y. Review of the Typical Damage and Damage-Detection Methods of Large Wind Turbine Blades. Energies 2022, 15, 5672. [Google Scholar] [CrossRef]
  7. Yu, L.; Antoni, J.; Wu, H.; Leclère, Q.; Jiang, W. Fast Iteration Algorithms for Implementing the Acoustic Beamforming of Non-Synchronous Measurements. Mech. Syst. Signal Process. 2019, 134, 106309. [Google Scholar] [CrossRef]
  8. Wang, R.; Zhang, C.; Yu, L.; Li, J. Sparsity-Enhanced Equivalent Source Method for Acoustic Source Reconstruction via the Generalized Minimax-Concave Penalty. Mech. Syst. Signal Process. 2022, 167, 108508. [Google Scholar] [CrossRef]
  9. Feng, D.; Yu, L.; Wei, L.; Shi, Y.; Pan, W.; Li, M. Acoustic Inversion Method Based on the Shear Flow Green’s Function for Sound Source Localization in Open-Jet Wind Tunnels. Mech. Syst. Signal Process. 2024, 220, 111650. [Google Scholar] [CrossRef]
  10. Yang, Y.; Chu, Z.; Yang, Y.; Yin, S. Two-Dimensional Newtonized Orthogonal Matching Pursuit Compressive Beamforming. J. Acoust. Soc. Am. 2020, 148, 1337–1348. [Google Scholar] [CrossRef]
  11. Sun, S.; Wang, T.; Chu, F.; Tan, J. Acoustic Source Identification Using an Off-Grid and Sparsity-Based Method for Sound Field Reconstruction. Mech. Syst. Signal Process. 2022, 170, 108869. [Google Scholar] [CrossRef]
  12. Park, M.; Memon, S.A.; Kim, G.; Choo, Y. 3D Off-Grid Localization for Adjacent Cavitation Noise Sources Using Bayesian Inference. Sensors 2023, 23, 2628. [Google Scholar] [CrossRef]
  13. Xenaki, A.; Gerstoft, P. Grid-Free Compressive Beamforming. J. Acoust. Soc. Am. 2015, 137, 1923–1935. [Google Scholar] [CrossRef] [PubMed]
  14. Chardon, G. Gridless Covariance Matrix Fitting Methods for Three Dimensional Acoustical Source Localization. J. Sound Vib. 2023, 551, 117608. [Google Scholar] [CrossRef]
  15. Malgoezar, A.; Snellen, M.; Merino-Martinez, R.; Simons, D.G.; Sijtsma, P. On the Use of Global Optimization Methods for Acoustic Source Mapping. J. Acoust. Soc. Am. 2017, 141, 453–465. [Google Scholar] [CrossRef] [PubMed]
  16. Niu, Z.; Antoni, J.; Bouley, S. Gridless Three-Dimensional Acoustic Imaging Based on the Concept of Sonons: Reconstruction of Source Directivity and Equivalent Spatial Distribution. J. Sound Vib. 2024, 575, 118266. [Google Scholar] [CrossRef]
  17. Castellini, P.; Giulietti, N.; Falcionelli, N.; Dragoni, A.F.; Chiariotti, P. A Neural Network Based Microphone Array Approach to Grid-Less Noise Source Localization. Appl. Acoust. 2021, 177, 107947. [Google Scholar] [CrossRef]
  18. Yang, Y.; Chu, Z.; Xu, Z.; Ping, G. Two-Dimensional Grid-Free Compressive Beamforming. J. Acoust. Soc. Am. 2017, 142, 618–629. [Google Scholar] [CrossRef]
  19. Yang, Y.; Chu, Z.; Ping, G.; Xu, Z. Resolution Enhancement of Two-Dimensional Grid-Free Compressive Beamforming. J. Acoust. Soc. Am. 2018, 143, 3860–3872. [Google Scholar] [CrossRef]
  20. Yang, Y.; Chu, Z.; Yin, S. Two-Dimensional Grid-Free Compressive Beamforming with Spherical Microphone Arrays. Mech. Syst. Signal Process. 2022, 169, 108642. [Google Scholar] [CrossRef]
  21. Zhai, Q.; Ning, F.; Deng, Z.; Hou, H.; Li, J.; Wei, J.; Li, B. A Grid-Free Global Optimization Algorithm for Sound Sources Localization in Three-Dimensional Reverberant Environments. Mech. Syst. Signal Process. 2023, 188, 109999. [Google Scholar] [CrossRef]
  22. Wang, X.; Quost, B.; Chazot, J.-D.; Antoni, J. Iterative Beamforming for Identification of Multiple Broadband Sound Sources. J. Sound Vib. 2016, 365, 260–275. [Google Scholar] [CrossRef]
  23. Antoni, J.; Vanwynsberghe, C.; Le Magueresse, T.; Bouley, S.; Gilquin, L. Mapping Uncertainties Involved in Sound Source Reconstruction with a Cross-Spectral-Matrix-Based Gibbs Sampler. J. Acoust. Soc. Am. 2019, 146, 4947–4961. [Google Scholar] [CrossRef]
  24. Li, J.; Wang, X. Super-Resolution Localization and Orientation Estimation of Multiple Dipole Sound Sources: From a Maximum Likelihood Framework to Wind Tunnel Validation. J. Sound Vib. 2025, 595, 118764. [Google Scholar] [CrossRef]
  25. Kujawski, A.; Sarradj, E. Fast Grid-Free Strength Mapping of Multiple Sound Sources from Microphone Array Data Using a Transformer Architecture. J. Acoust. Soc. Am. 2022, 152, 2543–2556. [Google Scholar] [CrossRef]
  26. Zhao, Y.; He, Y.; Chen, H.; Zhang, Z.; Xu, Z. Three-Dimensional Grid-Free Sound Source Localization Method Based on Deep Learning. Appl. Acoust. 2025, 227, 110261. [Google Scholar] [CrossRef]
  27. Fernandez-Grande, E.; Xenaki, A.; Gerstoft, P. A Sparse Equivalent Source Method for Near-Field Acoustic Holography. J. Acoust. Soc. Am. 2017, 141, 532–542. [Google Scholar] [CrossRef] [PubMed]
  28. Zhang, Y.; Wang, S.; Ji, G. A Comprehensive Survey on Particle Swarm Optimization Algorithm and Its Applications. Math. Probl. Eng. 2015, 2015, 931256. [Google Scholar] [CrossRef]
  29. Jain, M.; Saihjpal, V.; Singh, N.; Singh, S.B. An Overview of Variants and Advancements of PSO Algorithm. Appl. Sci. 2022, 12, 8392. [Google Scholar] [CrossRef]
  30. Sarradj, E. Three-Dimensional Acoustic Source Mapping with Different Beamforming Steering Vector Formulations. Adv. Acous. Vib. 2012, 2012, 292695. [Google Scholar] [CrossRef]
Figure 1. The illustration of the forward modeling from sound sources to receivers. The acoustic pressure measured by the microphone array can be modeled as a superposition of acoustic waves radiated from the equivalent sources. The Green’s function G m r n describes the sound pressure propagation from a source at position r n to the m-th receiver at position r m .
Applsci 15 11028 g001
Figure 2. 3D grid-free Bayesian inference model using plate notation.
Applsci 15 11028 g002
Figure 3. The layout of the sound sources and the microphone array. (a) Simulation: Three sources, labeled A, B, and C, are located at (0.20, 0.23, 0.30) m, (0.03, 0.00, 0.20) m, and (–0.20, –0.10, 0.22) m, respectively. The microphone array configuration includes an 89-element top array positioned in the z = 0.5 m plane and a 32-element side array in the y = 1 m plane. (b) Experiment: Measured layout of the same sources and microphone array as in the simulation.
Applsci 15 11028 g003
Figure 4. Comparative simulation results of the localization performance of the four algorithms at 400, 1000, and 3000 Hz. The ground-truth source positions are marked with pink circles, while the locations estimated by the algorithms are represented by squares. The color of each square corresponds to the normalized SPL.
Applsci 15 11028 g004
Figure 5. Comparison of absolute localization and SPL estimation errors across four algorithms. (a,b) Error as a function of frequency, averaged over all sources. (c,d) Errors for each individual source, averaged over all frequencies. In the bar charts, the height and color of each bar indicate the error magnitude.
Applsci 15 11028 g005
Figure 6. Comparison of the negative log-posterior objective function for Source B located at (0.03, 0.00, 0.20) m, evaluated at 400 Hz (a) and 3000 Hz (b). Both the GF-HMC and BGG algorithms aim to minimize this function.
Applsci 15 11028 g006
Figure 7. Comparison of absolute localization and SPL estimation errors as a function of SNRs. (a) Absolute localization errors versus SNRs. (b) SPL estimation errors versus SNRs.
Applsci 15 11028 g007
Figure 8. Computational time comparison of the GF-DE, GF-HMC, and BGG algorithms as a function of the number of equivalent sources.
Applsci 15 11028 g008
Figure 9. Comparative experiment results of the localization performance of four algorithms at 400, 1000, and 3000 Hz. The ground-truth source positions are marked with pink circles, while the locations estimated by the algorithms are represented by squares. The color of each square corresponds to the normalized SPL.
Applsci 15 11028 g009
Figure 10. Comparison of absolute localization and SPL estimation errors across four algorithms. (a,b) Error as a function of frequency, averaged over all sources. (c,d) Errors averaged over all frequencies.
Applsci 15 11028 g010
Table 1. Average computation time (CPU seconds) of the four algorithms over 27 frequencies.
Clean-SCGF-DEGF-HMCBGG
3.3021.27109.8527.58
Disclaimer/Publisher’s Note: The statements, opinions and data contained in all publications are solely those of the individual author(s) and contributor(s) and not of MDPI and/or the editor(s). MDPI and/or the editor(s) disclaim responsibility for any injury to people or property resulting from any ideas, methods, instructions or products referred to in the content.