1. Introduction
In recent years, the Internet of Things (IoT) ecosystem has evolved to encompass new contexts such as the Industrial Internet of Things (IIoT), which has gained rapid momentum, driven by the increasing demand for intelligent, efficient, and real-time adaptive industrial solutions to enhance productivity and safety in modern industrial environments [
1,
2]. This transformation brings with it new technical requirements, including ultra-low latency, distributed data processing, and dynamic resource management across increasingly complex and heterogeneous environments. In this context, edge computing [
3] has emerged as a key technology for bringing intelligence closer to the source of data generation, the point where true value is created. In industrial settings, the data generated by sensors, devices, and production processes are highly dynamic, voluminous, and time-sensitive. Processing such data at the edge significantly reduces latency and core network load, while enabling highly localized, context-aware, and near-instantaneous responses to critical events or rapidly changing conditions [
4]. This paradigm facilitates the adoption of a so-called
data-driven approach, where system behavior, decision-making, and service orchestration are not statically programmed but instead emerge dynamically based on data collected, processed, and analyzed in real time. The integration of edge computing with softwarized architectures—leveraging microservices, lightweight virtualization, and open standards—allows for the flexible and scalable deployment of advanced functionalities. This, in turn, enables novel use cases within IIoT environments, such as real-time monitoring, autonomous decision making, and network self-reconfiguration using Artificial Intelligence (AI) models [
5]. Furthermore, this technological evolution aligns with the long-term vision of sixth generation of cellular networks (6G) networks [
6,
7], which promote distributed, cooperative, data-centric architectures, as well as with the emerging principles of industrial data spaces. In this regard,
edge intelligence is expected to play a fundamental role in future infrastructures by fostering interoperability and coordination between devices, networks, and services.
Despite recent conceptual and standardization advances, significant challenges remain. These include issues related to solution scalability, security mechanisms, and, most notably, the lack of practical implementations that validate these principles in real-world industrial settings [
8]. As highlighted in recent initiatives within the framework of the 3rd Generation Partnership Project (3GPP) specifications, particularly since Release 18 [
9], there is a growing effort to standardize these capabilities. Nevertheless, there is still a shortage of integrated architectures and reproducible, open Proof-of-Concept (PoC) implementations that bring these ideas to life. In this paper, we propose and evaluate a softwarized, data-driven architecture designed to operate across the cloud/edge/IIoT continuum. The proposed architecture builds upon a previous virtualized PoC [
10], extending it with a microservice-oriented experimental setup orchestrated via Kubernetes. This system demonstrates the ability to process data at the edge, minimize latency, and dynamically adapt the architecture to changing conditions. It also supports seamless cooperation between heterogeneous IIoT nodes, enabling autonomous decision-making and network reconfiguration powered by Machine Learning (ML) inference. By doing so, this work aims to bridge the gap between theoretical designs and practical deployments, contributing to the development of next-generation, data-centric IIoT ecosystems aligned with emerging trends in distributed intelligence and future communication systems.
The remainder of this paper is organized as follows.
Section 2 provides an overview of the existing softwarized architectures in the context of IIoT.
Section 3 presents the main components of the proposed architecture.
Section 4 focuses on data as a starting point, detailing the implementation of functional blocks and their orchestration through Kubernetes.
Section 5 describes the testbed and presents the results of the experimental evaluation.
Section 6 discusses the significance and limitations of the results obtained. Finally,
Section 7 summarizes the main findings and outlines directions for future work.
2. Related Work
The development and deployment of IIoT systems have led to a rich body of research focused on enabling architectures and supporting technologies that deliver scalability, security, efficiency, and flexibility. In this section, we present a comprehensive and chronological survey of the most influential contributions in this domain. We emphasize architectural frameworks and real-world implementations that address the coordination of smart sensor management and monitoring, as well as network adaptability to evolving application requirements. Our review begins with early, purely theoretical reference models and progresses through practical case studies, ranging from gateway and fog-based deployments in industrial settings to digital twin and blockchain-enhanced networks, culminating in recent advances that integrate AI techniques for predictive maintenance and dynamic network reconfiguration. By tracing this evolution, we illustrate how IIoT architectures have matured from conceptual blueprints to robust AI-driven platforms that underpin Industry 4.0 and beyond.
Hu et al. [
11] proposed SD-IIoT, a software-defined architecture that unifies field devices, gateways, network infrastructure, and cloud services to meet IIoT requirements for reliability, security, scalability, timeliness, and Quality of Service (QoS). Using WirelessHART, Constrained Application Protocol (CoAP), WebSocket, and Software-Defined Networking (SDN), they introduced a CoAP + SDN QoS scheme tailored to safety-critical timing constraints. Validation through case studies and simulations demonstrates enhanced system flexibility, responsiveness, and deterministic behavior under configurable conditions. Another architectural approach that focuses more on energy efficiency is
Wang et al. [
12], where a three-layer IIoT architecture (sense, gateway, and control) is presented and specifically designed to minimize energy consumption in large sensor deployments. By tunneling all communications through gateway nodes rather than peer-to-peer sensor exchanges and implementing a predictive sleep-wake scheduling protocol, the system dynamically alternates sensors between active and low-power states. A central control node assigns sensors to the gateways and orchestrates their duty cycles. Simulations confirm that this hierarchical, schedule-driven design substantially improves resource utilization and prolongs network lifetime.
Another notable approach was presented by
Strauß et al. [
13], who, rather than proposing an entirely new IIoT framework, demonstrated the retrofit and deployment of existing architectures on BMW’s production line. They equipped legacy machinery with low-cost sensors and integrated them into a Cyber-Physical System (CPS) that leverages ML for condition monitoring and anomaly detection. Their cost-effective, flexible, and scalable solution was validated on a heavy-lift electric monorail system of the BMW Group, yielding clear gains in overall equipment effectiveness. The authors recommend an incremental ML pipeline, starting with a semi-supervised anomaly detector to harvest irregular patterns, then applying clustering on the accumulated anomaly set (with expert labeling) to generate datasets for downstream supervised fault-classification models.
Dejene et al. [
14] proposed TD2SecIoT, a lightweight, temporal, data-driven security architecture for IIoT that employs Elliptic Curve Cryptography (ECC) to provide mutual authentication and data confidentiality with minimal computational overhead. Validated via Contiki OS and simulated in Cooja, TD2SecIoT achieves faster key generation, reduced processing load, and robust defense against replay, man-in-the-middle, chosen-cipher, quantum, and lattice-based attacks. Compared to previous schemes, it offers an improved balance of security and efficiency for resource-constrained devices. Building on the move toward adaptive, user-centric IIoT platforms,
Zhang et al. [
15] introduced an open ecosystem architecture designed to maximize the flexibility, scalability, and extensibility of the end user. Designed for bidirectional interaction, their framework allows users to both adopt and develop web- or mobile-based applications that interface directly with electrical assets and back-end services. Validated in a wind farm maintenance scenario, the architecture deploys diverse turbine sensors whose data streams are routed through advanced analytics pipelines to drive real-time user-adjustable maintenance strategies. The experimental results confirmed significant gains in operational efficiency and reliability, highlighting the promise of open IIoT ecosystems for the management of smart grid and electrical assets.
Extending the focus from open, user-driven IIoT ecosystems to robust security mechanisms,
Taheri et al. [
16] introduced Fed-IIoT, a two-tier federated learning framework for Android malware detection in IIoT networks. On the participant side, Generative Adversarial Networks (GANs) and federated GANs simulate data-poisoning attacks, while the server side employs an adversarial aggregation-aware GAN (A3GAN) to filter anomalies during model updates. This design enables collaborative training without exposing raw data, preserving device privacy. Evaluation on three IIoT-related malware datasets demonstrates that Fed-IIoT not only maintains high detection accuracy but also increases resilience to poisoning by up to 8% compared to existing defenses.
Zhang et al. [
17] presented an IIoT gateway architecture that transparently bridges heterogeneous networks and cloud platforms. Their design employs a multi-protocol parser to translate industrial protocols (e.g., OPC UA, Modbus, and Siemens S7) into Message Queuing Telemetry Transport (MQTT) for unified cloud integration. An asynchronous processing engine with breakpoint continuation ensures real-time reliability under concurrent loads, while a three-layer encryption scheme secures data in transit. Hardware and software experiments in process control equipment confirm seamless protocol decoupling, secure data fusion, and robust interoperability between legacy devices and modern IIoT services. Building on the integration of IIoT frameworks with cutting-edge mobile networks,
Chandra et al. [
18] developed a fifth generation of cellular networks (5G) enabled IIoT architecture tailored for smart manufacturing under Industry 4.0. They identified the shortcomings of legacy 3G/4G (insufficient bandwidth, limited device density, higher latency, and variable reliability) and leveraged 5G’s core capabilities (enhanced Mobile Broadband (eMBB), massive Machine-Type Communications (mMTC), Ultra-Reliable Low Latency Communication (URLLC), and NarrowBand Internet of Things (NB-IoT)) to deliver real-time monitoring, intelligent automation, and collaborative machine operations. This design ensures robust, low-latency communication among cyber-physical manufacturing systems, thus improving responsiveness and smartness in production processes.
An alternative proposal, and the closest to our work, is SEGA by
Ghosh et al. [
19], which introduces a secured edge-gateway microservices architecture for IIoT machine monitoring. The architecture guarantees secure data acquisition, transmission, and temporary storage at the edge through a combination of active and passive encryption. A k-nearest neighbors analytics module processes real-time metrics (current consumption, power factor, energy usage, and vibration) to autonomously evaluate machine health. Although computationally heavier tasks can be offloaded to the cloud, edge-based inference preserves low latency. Experiments demonstrate that encryption introduces only 84 ms of additional delay at sensor nodes, with minimal impact on gateway throughput, underscoring SEGA’s feasibility in industrial deployments. However, SEGA’s Docker-based microservice deployment presents scalability limitations, particularly in data ingestion and storage, since it lacks dynamic orchestration. In contrast, our Kubernetes-driven platform not only maintains SEGA’s low-latency edge processing but also seamlessly scales services and data pipelines on demand. Furthermore, by feeding inference outcomes back into a network reconfiguration engine, our solution adapts in real time to evolving operational conditions, providing both the security and flexibility required for next-generation IIoT systems. Complementing our enhancements in orchestration and edge processing,
Lin et al. [
20] shift the paradigm toward fully decentralized IIoT systems by integrating blockchain, oracle services, and federated learning. They embed an oracle layer to securely ingest external data in real time into a blockchain-secured platform, preserving integrity while enabling dynamic data feeds. A peer-to-peer collaboration mechanism governs trusted data and resource exchange, and a distributed computing module amplifies collective model training. The benchmarks reveal that this architecture consistently reduces processing delays, enhances system stability, and increases learning accuracy. Extending decentralized IIoT paradigms into domain-specific applications,
Sarkar et al. [
21] presented i-Health, an SDN-enabled fog architecture for healthcare. Here, a smart controller uses historical and real-time data to decide which patient measurements should be relayed to the fog layer. To further optimize performance, the fog ranking and fog probing services dynamically select and evaluate the best fog nodes, reducing transmission delays and extending the network lifetime. i-Health also implements mechanisms for failure recovery and achieves superior efficiency and resilience compared to traditional fog deployments.
Advancing the design of software-defined architectures for IIoT ecosystems,
Isah et al. [
22] introduced a data-driven Digital Twin Network (DTN) framework to address the growing operational complexity brought by 5G, cloud, and IoT technologies. A three-layer architecture comprising a Physical Network Layer (PNL), a Digital Twin Layer (DTL), and an Application Layer (AL) is introduced to facilitate bi-directional synchronization between real and virtual assets. A southbound interface embeds SDN mechanisms for secure PNL-DTL communication, while a northbound interface closes the control loop between the DTL and AL. The authors also specify DTN data types and protocols to ensure seamless data integration. Together, these elements produce a resilient, adaptive and intelligent IIoT network powered by digital twin interoperability.
A different work that departs slightly from the preceding network-centric architectures is
Gupta et al. [
23], who developed an IIoT-driven information system grounded in Organizing Vision Theory (OVT) and Organizational Information Processing Theory (OIPT). Their model emphasizes transparency, coherence, and continuity along with customized information processing capabilities. By integrating real-time IIoT data collection, AI/ML analytics, and self-organizing control loops, the system supports context-aware decision making and maintenance scheduling. A case study illustrates how their architecture not only rationalizes data flows but also drives organizational transformation by embedding intelligent decision support across departments. Associated with the organizational and decision-support focus of
Gupta et al. [
23],
Peruthambi et al. [
24] advanced the IIoT maintenance landscape with a big-data-driven predictive framework. They fuse ML (Random Forest, Long Short-Term Memory (LSTM), Convolutional Neural Network (CNN), and XGBoost), digital twins, and optimization (Koopman observables and Dynamic Mode Decomposition with control (DMDc)) to maximize fault prediction accuracy (peaking at 96.4% for XGBoost) and reduce computational overhead by 35%. A blockchain-enabled federated learning layer further secures the training of decentralized models, reducing false alarms by 28%.
Finally,
Banitalebi [
25] introduced EDBLSD-IIoT, a hybrid edge-blockchain-SDN-cloud architecture that holistically addresses IIoT challenges related to security, latency, energy use, scalability, and QoS variability. Edge computing minimizes delay through local processing, while SDN orchestrates traffic and, using the Whale Optimization Algorithm (WOA), elects energy-optimal cluster heads. The blockchain secures transmissions with a tamper-proof ledger. Simulations in Mininet show that EDBLSD-IIoT maintains considerable throughput in dense deployments and under heavy load.
To provide a clear overview of the surveyed works,
Table 1 presents a concise comparative analysis across the following dimensions:
Article: Authors and reference.
Year: Year of publication.
Description: Brief description of the paper.
Evaluation and Tools: Nature of the validation, ranging from theoretical and analytical studies to simulations, proofs of concept, and full-scale implementations (reflecting increasing Technology Readiness Level (TRL)), alongside any specific tools or platforms employed.
Relevance to our study: Assessment of each work’s impact relative to our study. Proposals demonstrating practical implementations and higher TRL generally receive elevated contribution scores.
The reviewed literature reveals significant progress in IIoT architectures and in enabling technologies for softwarised networks, encompassing edge/fog and cloud. However, several open challenges persist. First, many proposals remain confined to theoretical models or closed-source, with few providing open, reproducible implementations on real industrial hardware or simulated. Second, there is a lack of unified edge-cloud orchestration frameworks that leverage live inference outputs to trigger dynamic network reconfiguration, service placement, and preventive maintenance. Third, existing microservice-based architectures often struggle to maintain performance under high-density sensor deployments or bursty workloads, as they lack elastic, cloud-native autoscaling mechanisms. Addressing these gaps is essential to advance truly adaptive, scalable, and transparent IIoT systems.
Therefore, after analyzing the state of the literature and identify the existing gaps, we summarize the main contributions of our work as follows:
End-to-End Continuum Architecture: We design and implement a unified framework that operates seamlessly across the cloud-edge-IIoT continuum, enabling data processing at the source, reducing end-to-end latency, and supporting hierarchical analytics.
Microservice-Oriented Deployment: Building on our prior virtualized proof-of-concept [
10], we develop a production-grade, Kubernetes-managed experimental setup that orchestrates containerized microservices for data ingestion, preprocessing, inference, and feedback.
Dynamic Adaptivity and Reconfiguration: We introduce a runtime control plane that ingests live ML inference outputs and telemetry to trigger on-the-fly network reconfiguration based on the operational state of IIoT nodes.
Practical Validation and Open-Source Implementation: We validate the proposed system on real hardware and realistic network emulations, demonstrating significant latency reductions and scalable performance under high-density sensor workloads. All code, deployment scripts, and datasets are released as open-source [
26] to foster reproducibility and accelerate future development of the IIoT architectures.
3. System Architecture
Our architecture builds upon the general design framework established by the 6G-DATADRIVEN-02 project [
27], initially validated through a proof-of-concept [
10]. It is engineered to operate seamlessly and natively across the entire cloud-edge-IIoT continuum. The primary objective is to leverage the data generated by heterogeneous industrial devices (sensors, actuators, and gateways (GWs)) to enable localized processing with minimal response times and network adaptability and reconfiguration, as well as collaborative coordination across multiple facilities and a unified global perspective in the cloud.
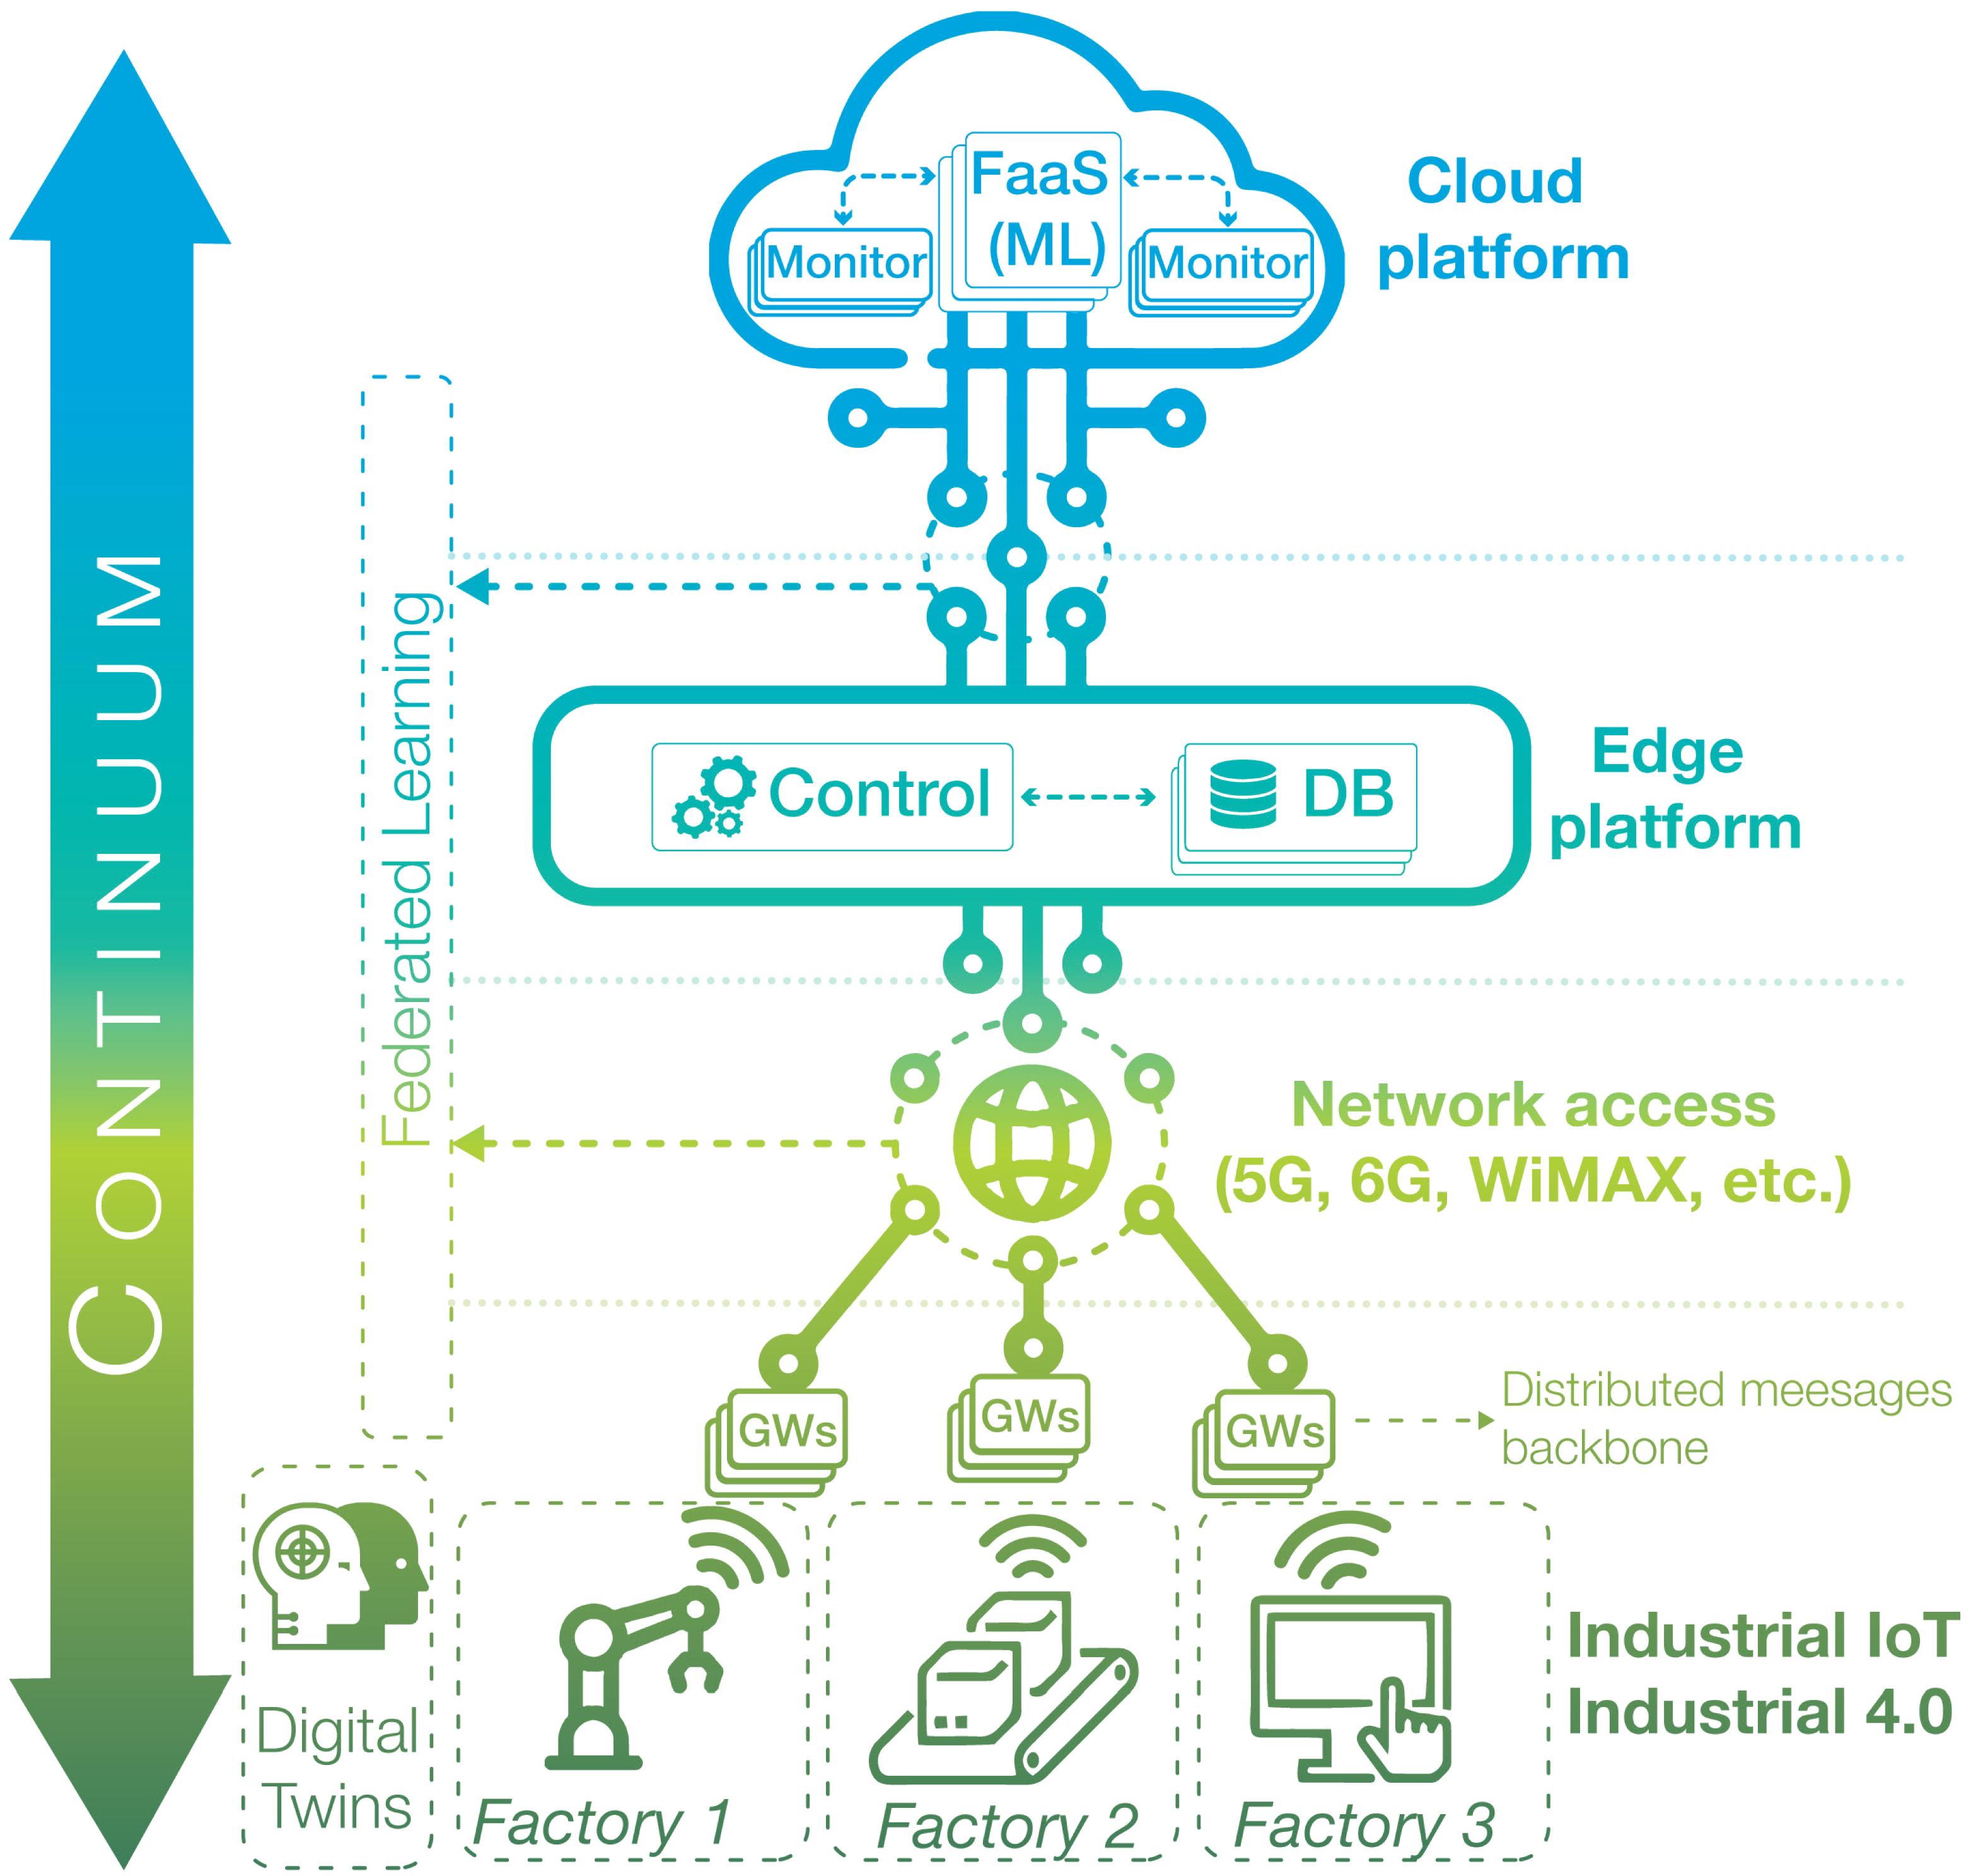
Figure 1 depicts the overall system architecture.
The figure illustrates a multi-tier architecture enabling IIoT deployments across a cloud–edge–factory continuum. At the bottom tier, the architecture starts at the factory floor, where IIoT devices (e.g., robotic arms, transport systems, and control terminals) are connected via IIoT GWs. These GWs collect data streams from sensors and actuators within factories and relay them upstream. Network access technologies such as 5G, 6G, or WiMAX interconnect these gateways with an edge platform, where a control module oversees traffic routing and orchestration. Data streams are selectively stored in distributed edge-level databases (DBs). This edge control plane dynamically governs multiple factory floors, optimizing network utilization and IIoT application performance. Moving upward, the cloud platform hosts Function-as-a-Service (FaaS) modules incorporating AI/ML pipelines. These modules consume data from edge DBs to run predictive analytics, such as fault detection or adaptive control, reducing latency and computational overhead at the factory level. Monitoring modules provide observability and enable users to receive real-time feedback across tiers.
The architecture supports federated learning, in which insights from one factory floor can inform global models, ensuring shared intelligence across facilities. The cloud tier consolidates the outputs of all factories, providing a unified operational view and enabling the edge control module to enforce global policies on service placement, routing, and resource allocation. In addition, the design allows the incorporation of foundational services that ensure scalability and resilience. A distributed messaging backbone decouples IIoT data producers and consumers, while local digital twins on each factory floor participate in federated learning loops. Finally, end-to-end observability (through logging, metrics, and tracing) provides visibility throughout the entire continuum, supporting proactive monitoring and long-term strategic planning.
Overall, this continuous, softwarized, data-driven architecture enables:
Automated reconfiguration of IIoT networks based on the operational state of each factory.
Distributed, low-latency processing at the edge, ensuring immediate reactive actions.
Federated collaboration between factories for joint learning and knowledge transfer.
Unified operational view, global control, and continuous optimization from the cloud and edge.
4. Implementation and Deployment of the Architecture
This section details the implementation and deployment of the architecture introduced in
Section 3. As previously outlined, the architecture is fundamentally data-driven. Accordingly,
Section 4.1 begins with an analysis of the dataset used to simulate the IIoT sensor readings at the factory floor, along with the machine learning models used for classification tasks. This subsection is introduced first, as some key data-driven aspects, such as the notion of sensor efficiency status and its role in triggering reconfiguration events, are essential to understand the logic and behavior of the components described subsequently.
Section 4.2 describes the implementation of the architecture’s core components. Finally,
Section 4.3 introduces the Kubernetes-based deployment, which adopts a microservice-oriented approach, ensuring scalability, resilience, and flexibility across the factory floor–edge–cloud continuum.
4.1. Dataset Analysis and Model Training
The architecture operation is driven by data generated from the IIoT sensors. Given the lack of access to a physical industrial environment, we rely on a publicly available IIoT dataset containing time-series sensor and actuator readings. The chosen dataset, hosted on Kaggle [
28], is subjected to statistical analysis to extract the relevant features, which are then used to simulate sensor behavior within our deployment. Based on these features, a classification model is trained to detect anomalous states in nodes, triggering network reconfiguration mechanisms when necessary.
4.1.1. IIoT Dataset Analysis
The selected dataset includes comprehensive time-series measurements of industrial processes. It captures physical sensor data (temperature, vibration, and power consumption), network performance indicators (latency, packet loss, and communication efficiency), and production metrics (defect rates and operational errors). It enables the assessment of machine efficiency by considering sensor readings, network conditions, and production performance indicators.
Table 2 summarizes the key characteristics of the dataset.
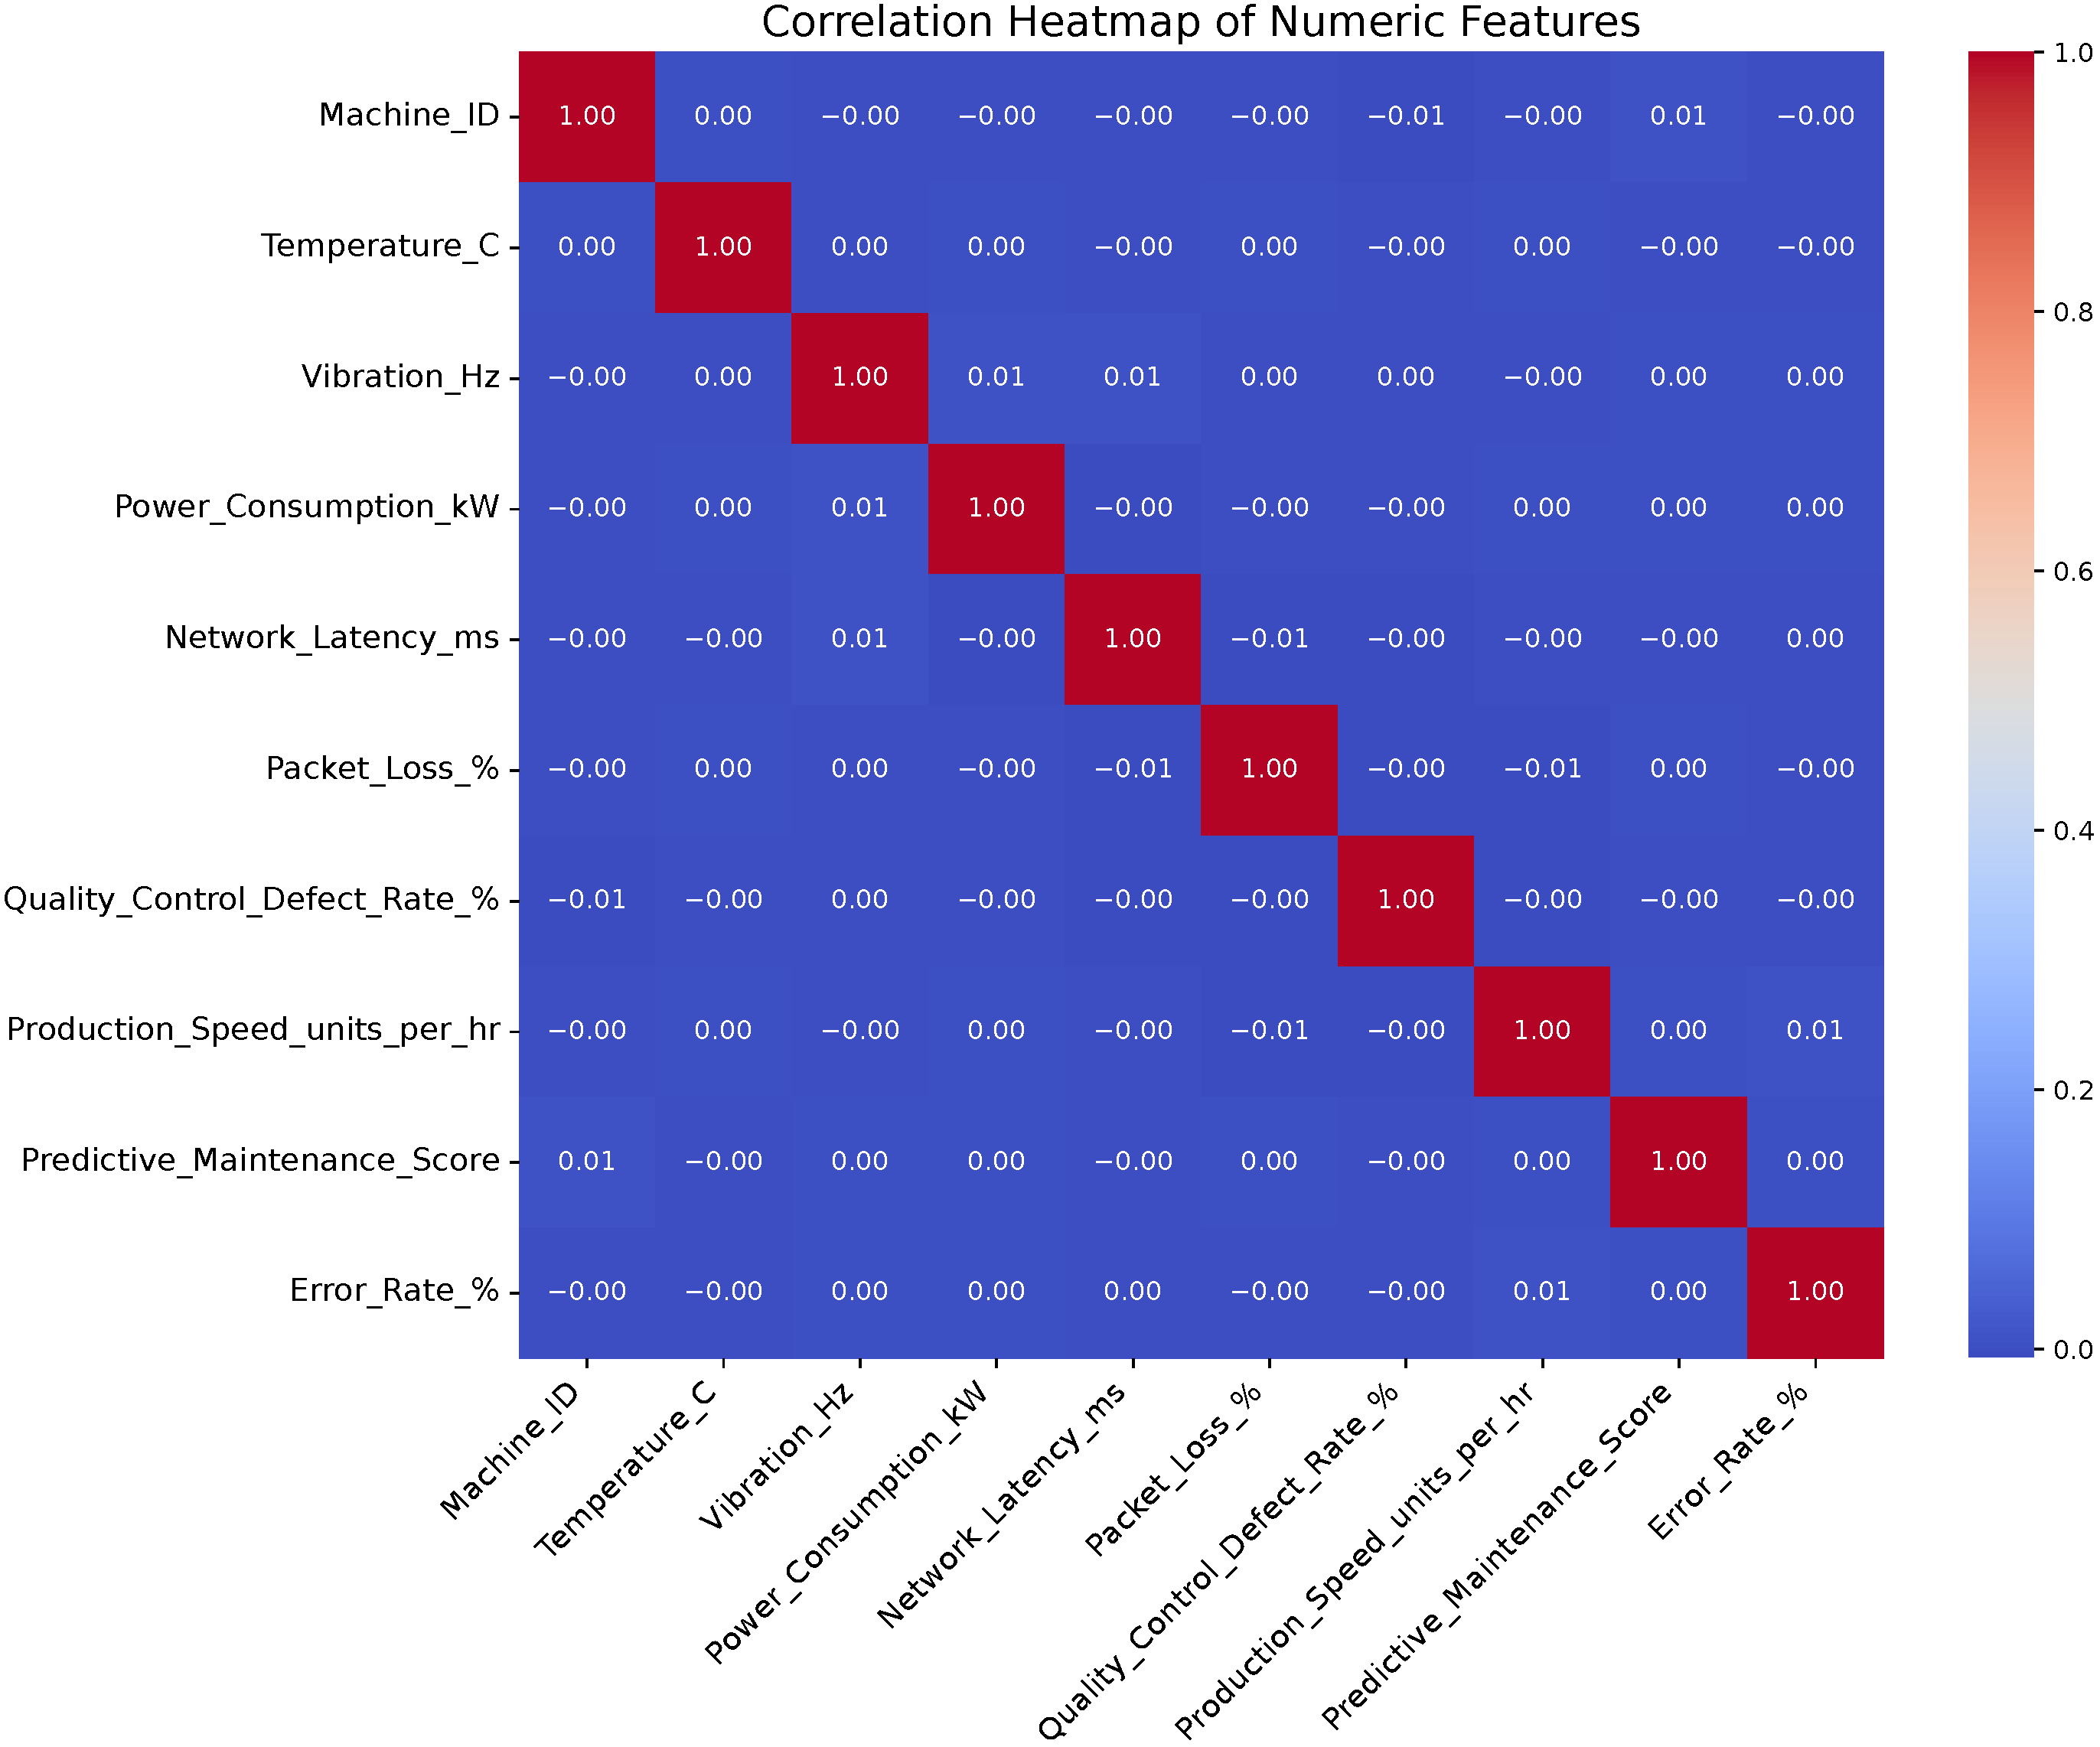
The dataset is subjected to statistical analysis to extract the relevant features, which are then used to emulate the sensor behavior of our deployment. A structural analysis of the dataset, based on the correlation matrix (see
Figure 2), reveals that the numerical features listed in
Table 2 exhibit very low linear correlation with each other. This lack of redundancy is advantageous, as it suggests that each feature provides distinct, non-overlapping information to the system.
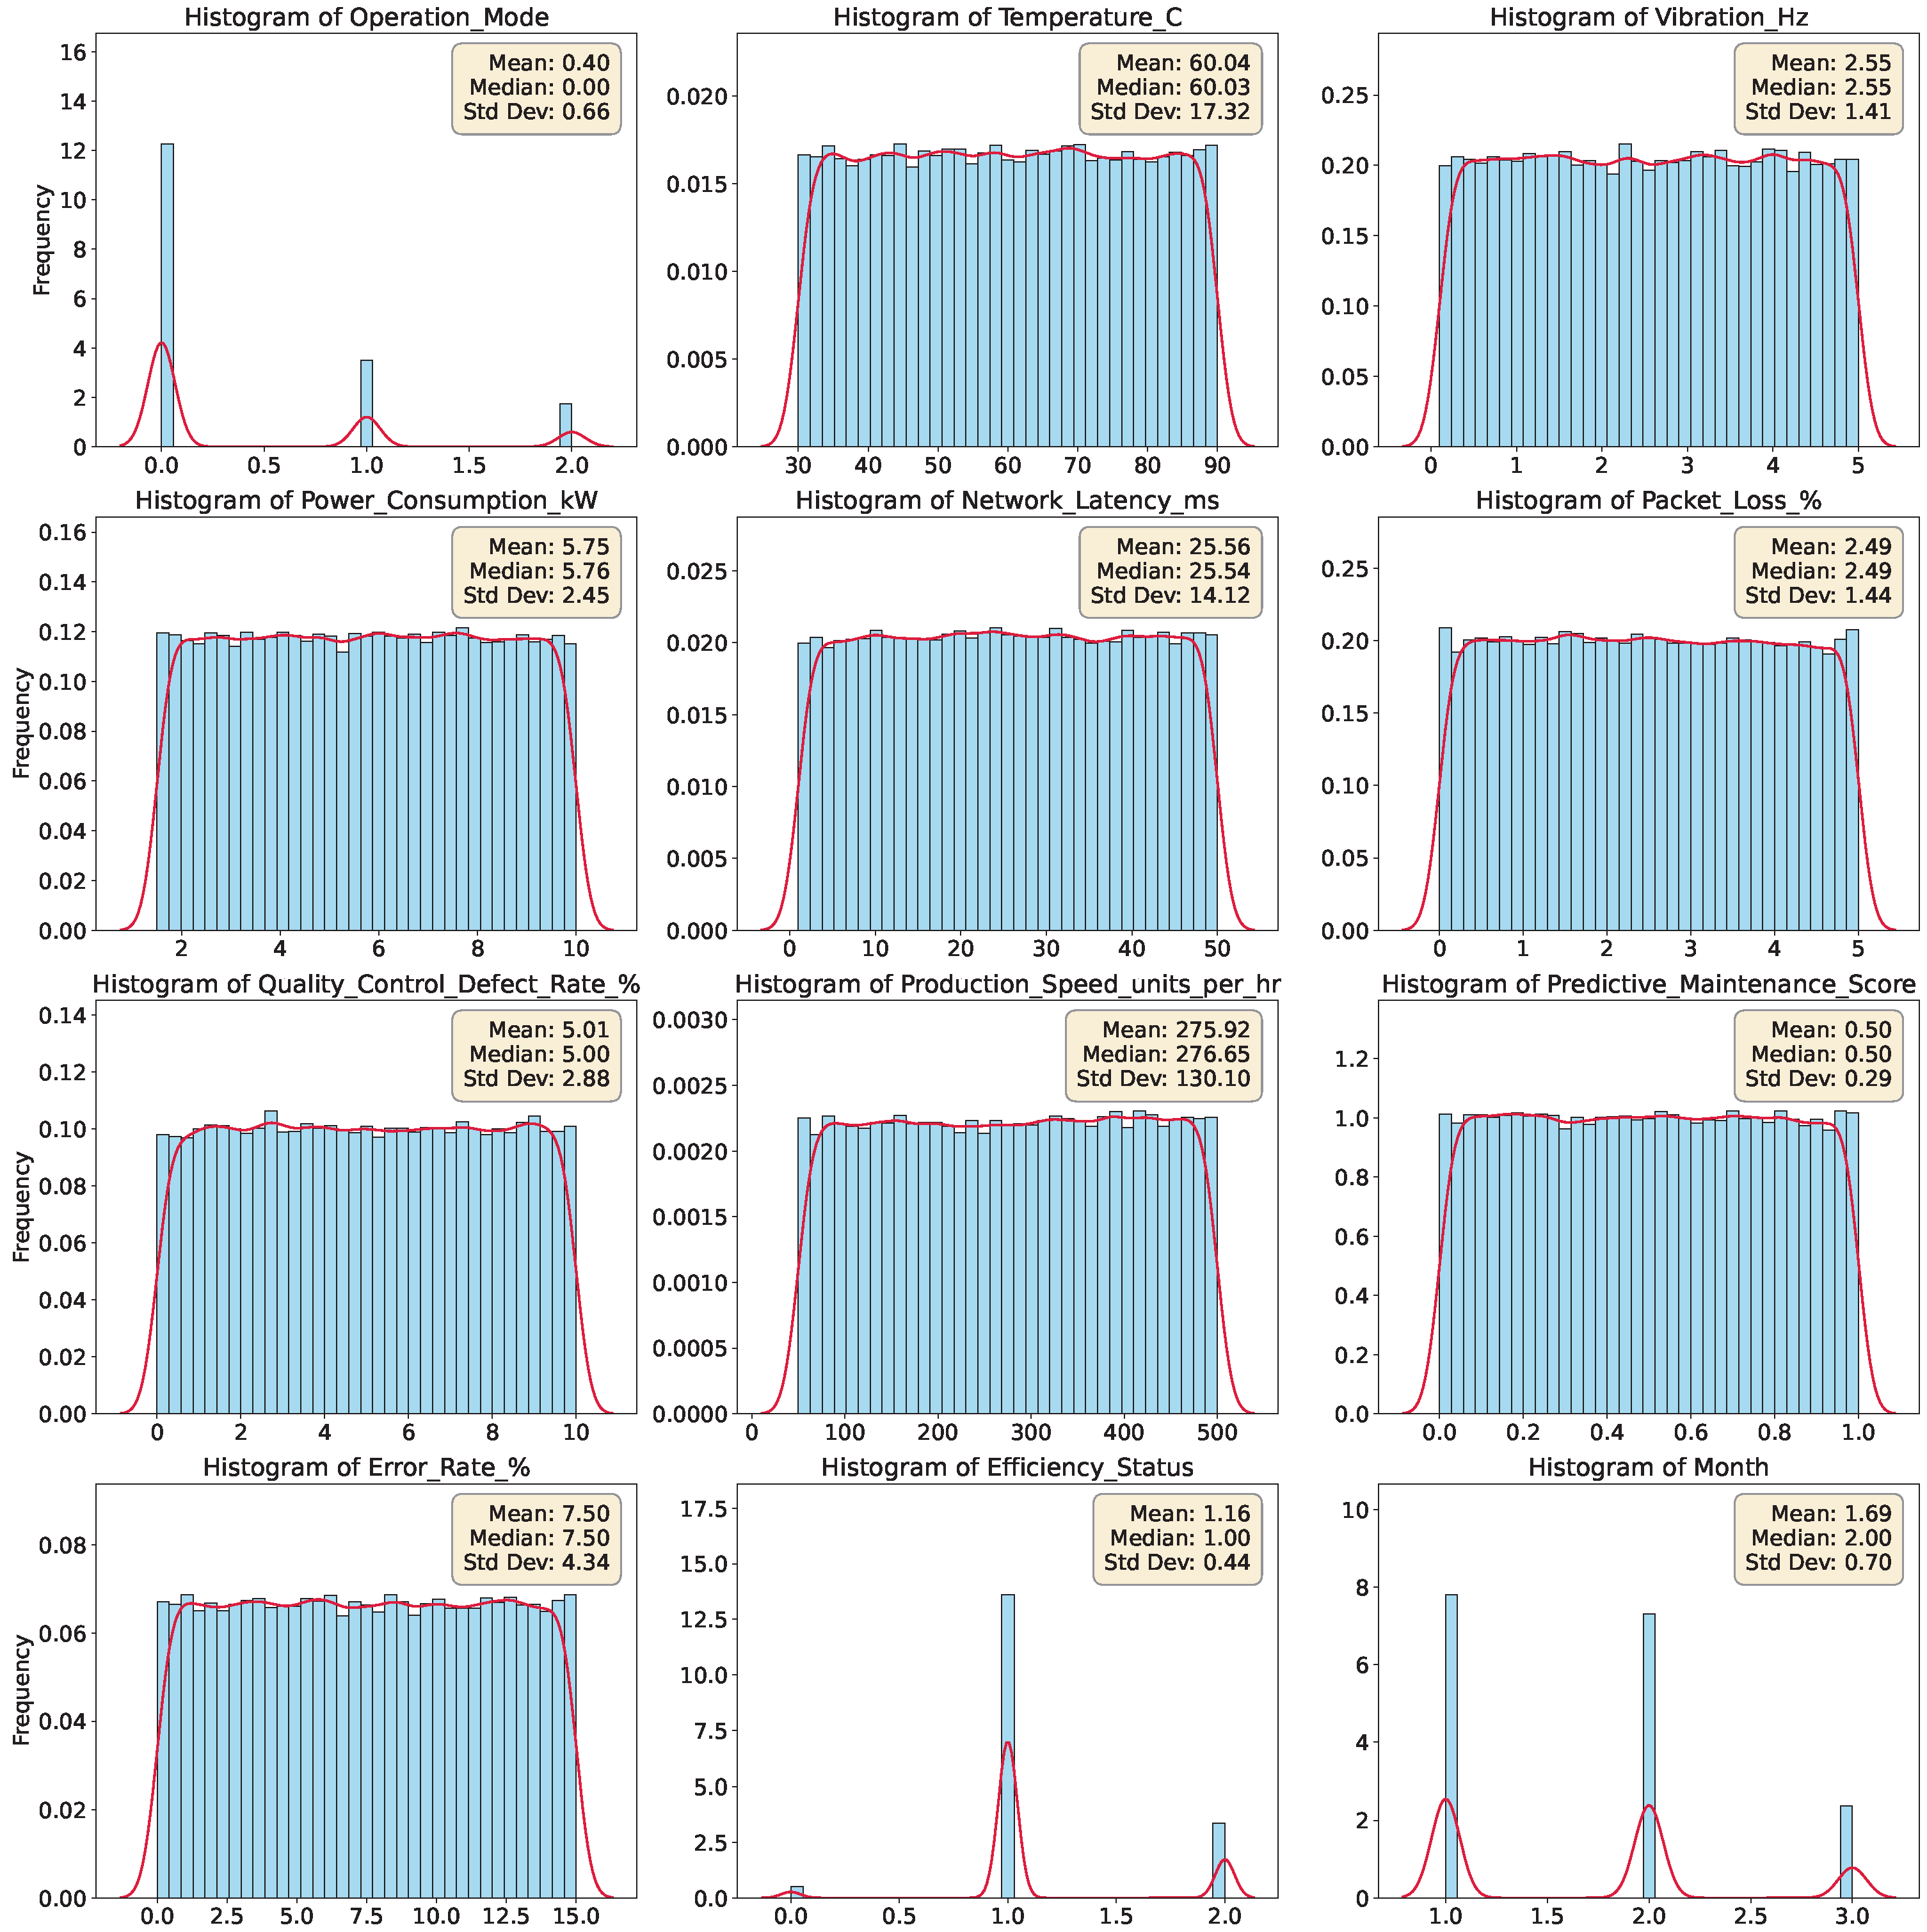
Further statistical analysis of the feature distributions shows that all numerical variables follow an approximately uniform distribution (see
Figure 3). This is particularly relevant for our architecture, as it supports the extraction of descriptive statistics to simulate realistic sensor data in the absence of physical hardware. In contrast, the categorical variables,
Operation_Mode and
Efficiency_Status, display delta distributions, with certain categories being notably overrepresented (as illustrated in
Figure 3). Furthermore, the dataset exhibits temporal irregularities, as the
Month attribute shows a strong concentration of records in January and February.
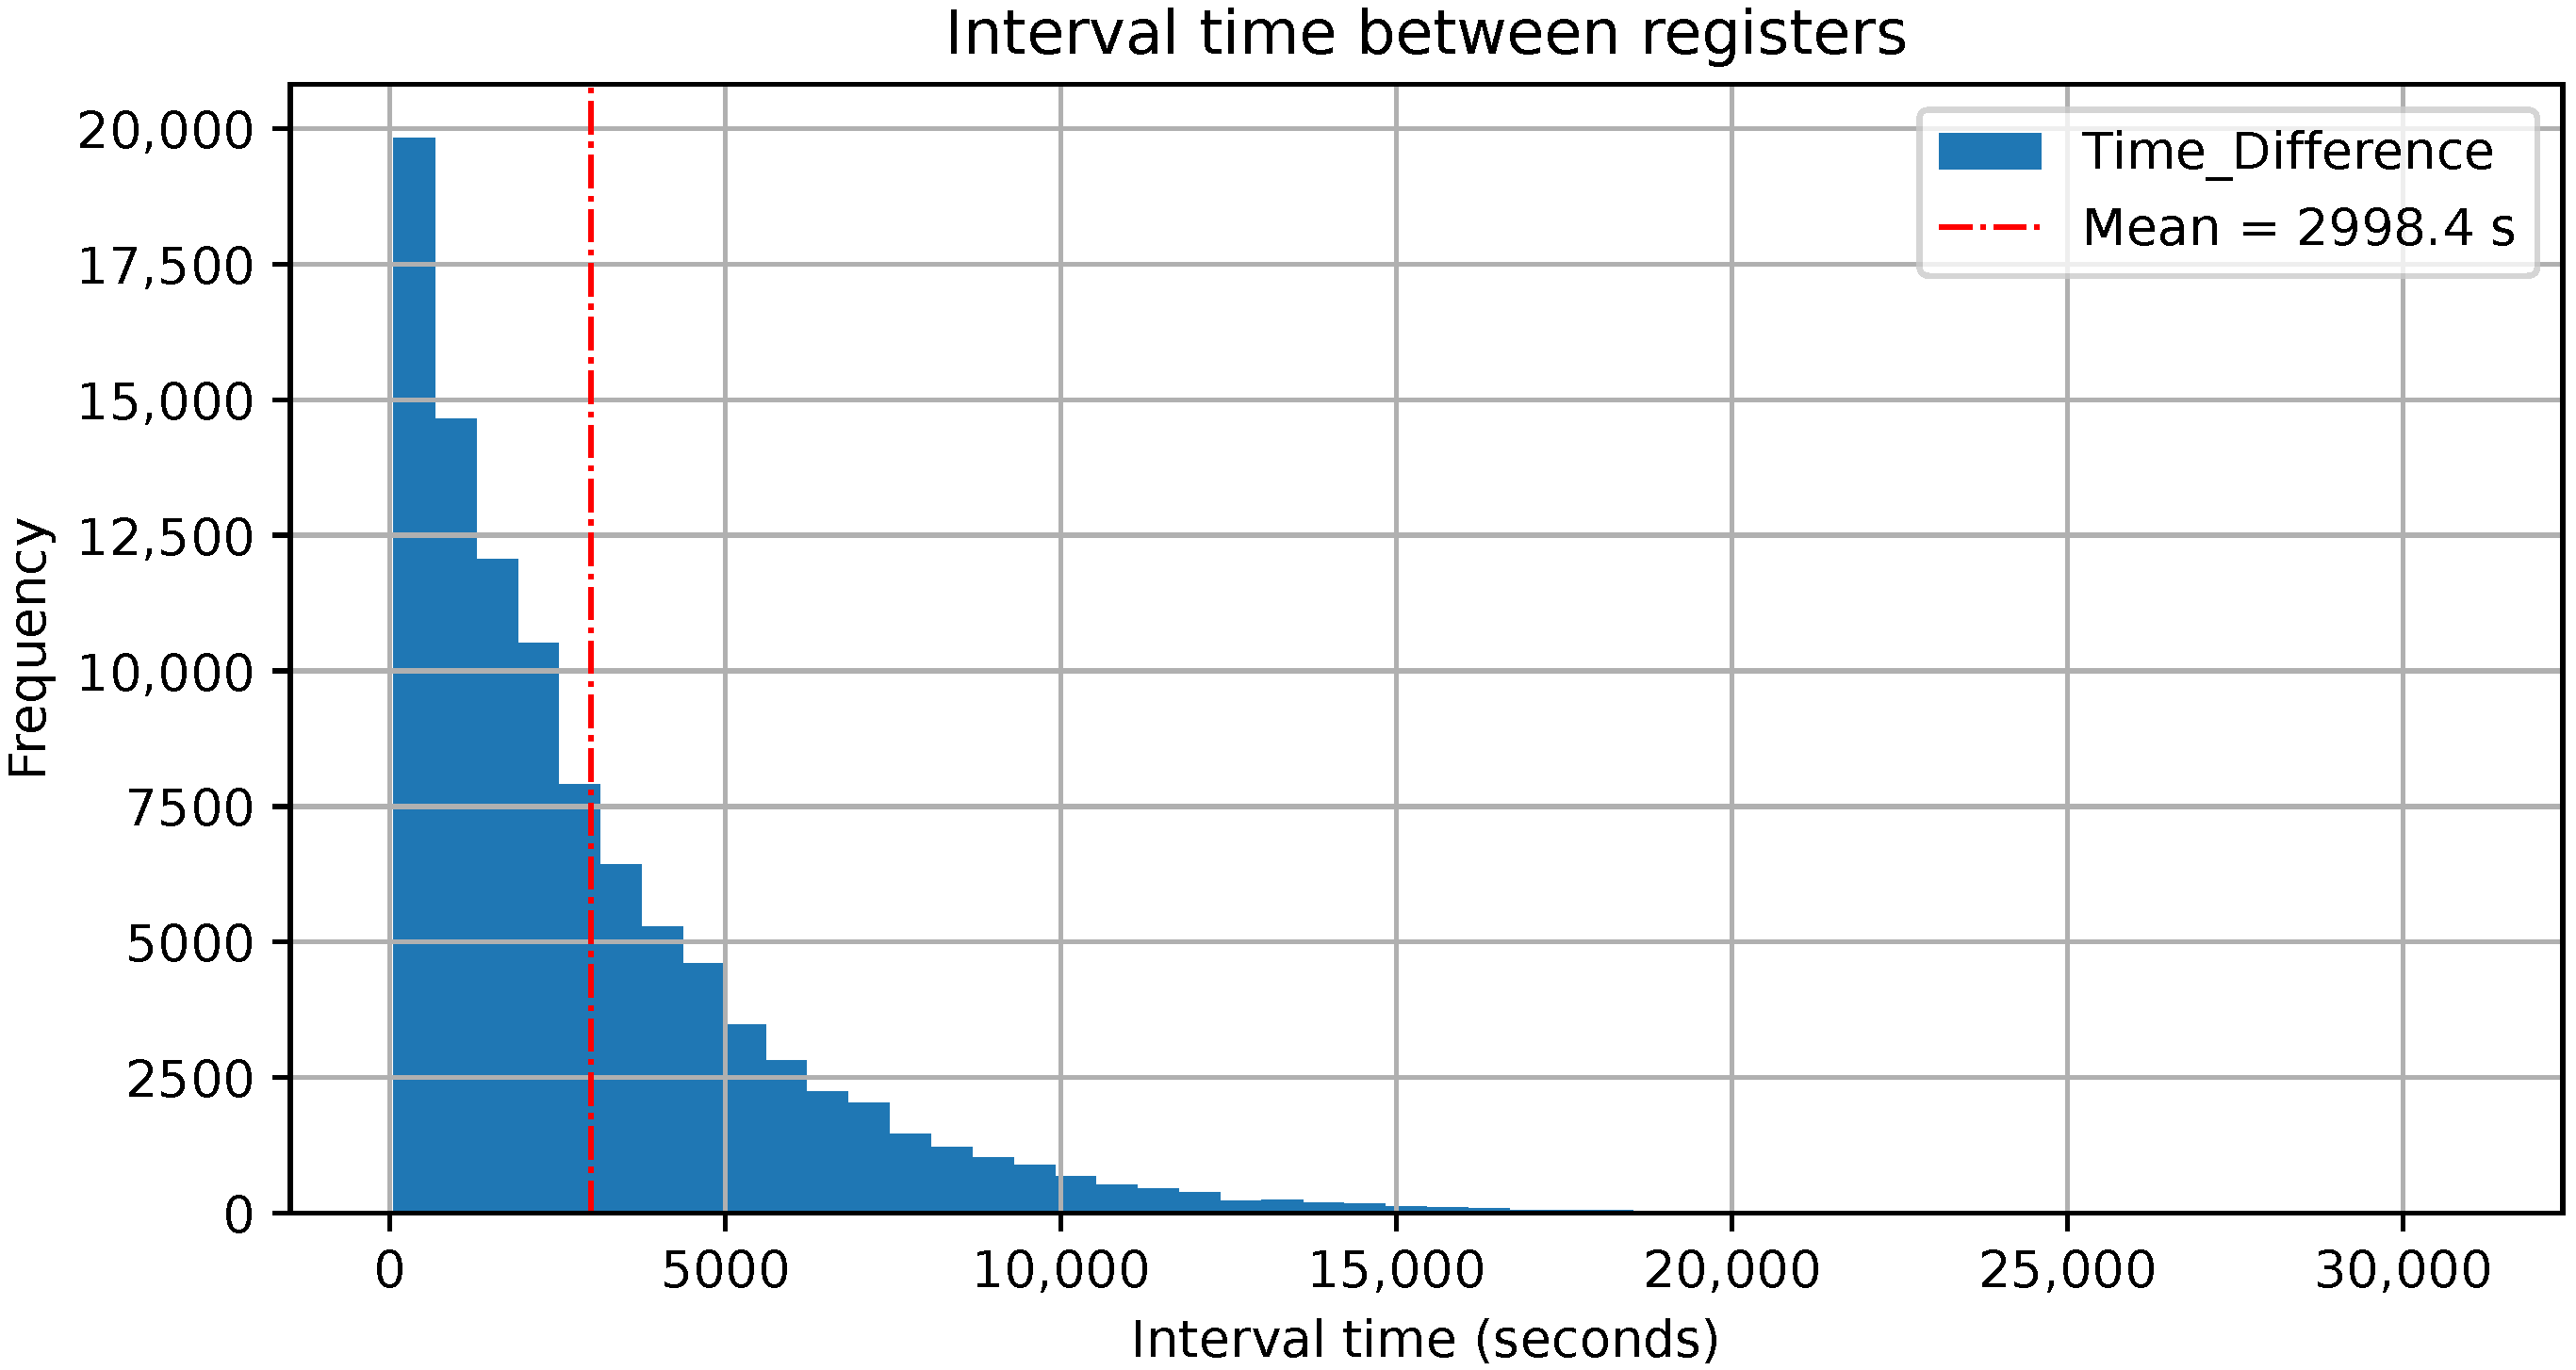
To simulate the data realistically, we analyzed the time intervals between consecutive sensor readings. The histogram of these intervals, shown in
Figure 4, reveals a right-skewed distribution, with most intervals clustered at low values. However, the dataset also contains sporadic gaps of up to 8.5 h (approximately 514 min or 30,840 s). The mean time interval is approximately 2998.40 s (roughly 50 min), while the median is 2100.00 s. The difference between the mean and the median confirms the prevalence of shorter intervals due to the skewness of the distribution. The high standard deviation further indicates considerable variability in sensor reporting times. For implementation purposes, this average interval has been normalized to a configurable simulation interval of 1 s, preserving relative timing patterns while enabling real-time testing of the architecture.
4.1.2. Training of IIoT Sensor Efficiency Status Classification Model
As described in
Section 3, the cloud layer includes an FaaS module responsible for executing inference functions that determine whether a sensor is operating anomalously. To support this functionality, we trained an ML model using the
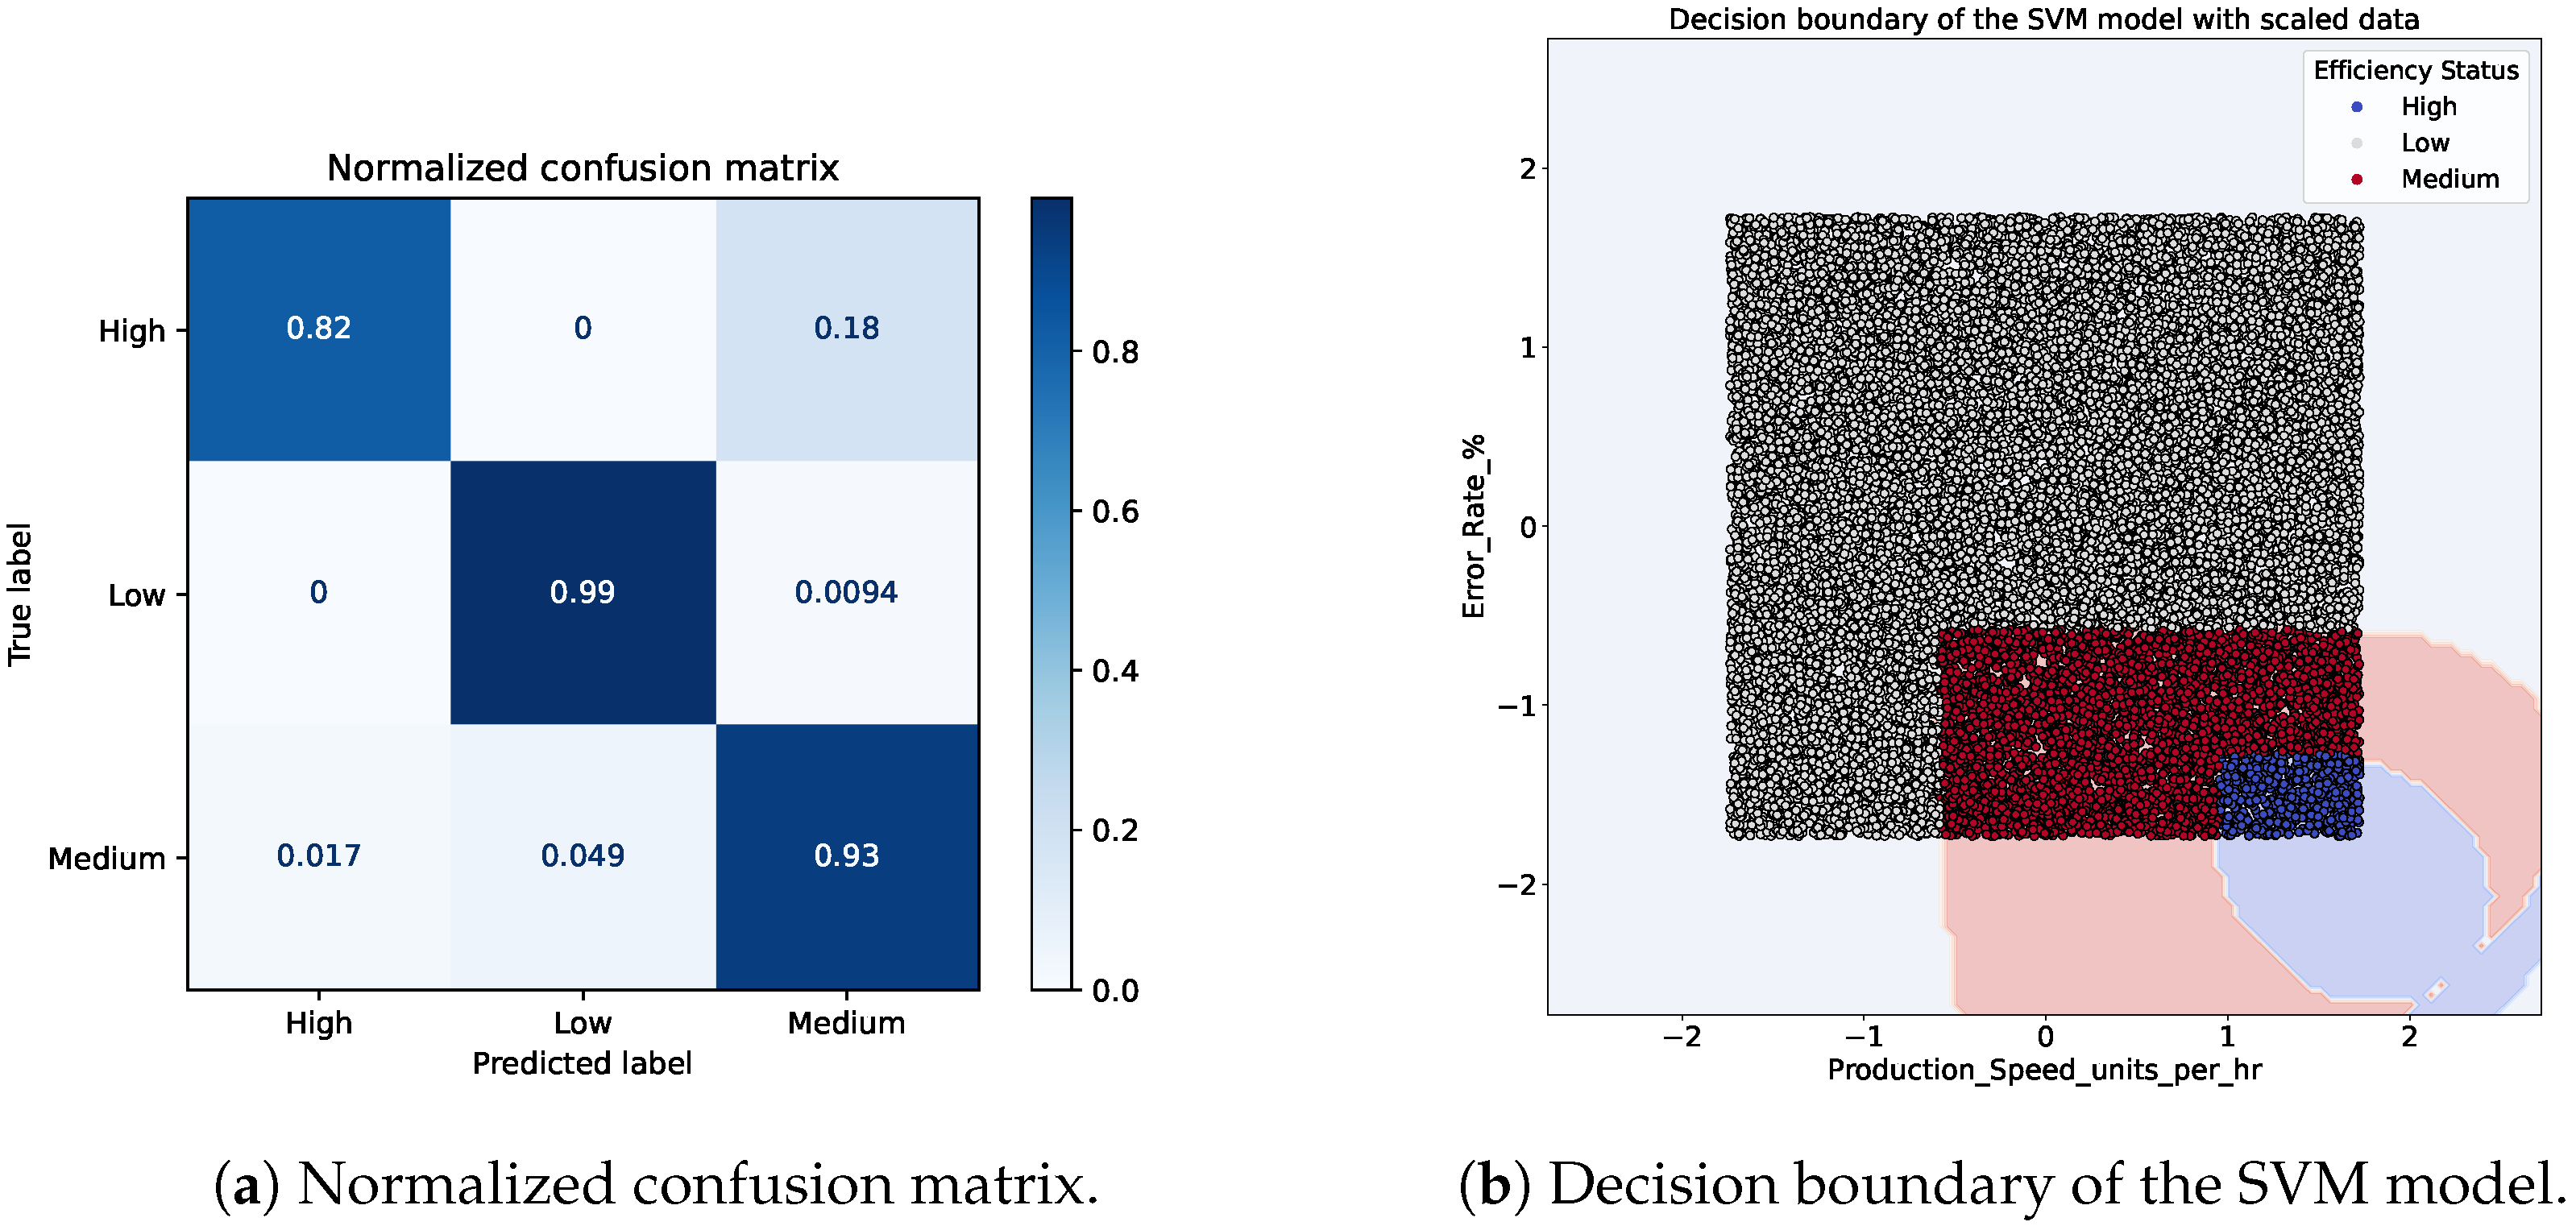
Efficiency_Status attribute available in the dataset, which labels sensor behavior across three classes: low, medium and high efficiency. A Support Vector Machine (SVM) classifier was selected due to its high performance on the task. The trained model achieved precision and recall scores of 97.5%, demonstrating high precision in differentiating between efficiency levels. Although additional models could have been explored, the focus of this work is not on optimizing ML performance, but rather on designing an architecture capable of integrating diverse AI/ML models as needed for different use cases.
Figure 5a shows the normalized confusion matrix that confirms the ability of the classifier to accurately distinguish between the three efficiency classes with minimal misclassification. Furthermore,
Figure 5b visualizes the decision boundaries derived from the normalized SVM model, trained specifically on the features
Production_Speed_units_per_hr and
Error_Rate_%. This plot clearly illustrates the separation of the efficiency classes in the feature space, with the high-efficiency region concentrated in the lower-right quadrant (characterized by high production speed and low error rate), while low-efficiency instances cluster in the upper-left (low speed and high error). The medium class occupies the intermediate zones, reflecting transitional behavior. This visual inspection validates the effectiveness of the svm classifier in delineating operational states relevant for triggering architectural reconfigurations.
4.2. Implementation of Core Functional Blocks
This section describes the implementation of all the functional blocks in the architecture. The explanation begins at the lowest tier with the factory floor components, followed by the functional modules deployed at the edge layer, namely the control module and the database, and concludes with the components hosted on the cloud platform, including the monitoring system and the FaaS module responsible for executing the inference service.
4.2.1. Factory Floor
The factory floor represents the foundational layer of the architecture, encompassing the IIoT devices and the wireless infrastructure that generate and transmit data. Its implementation is intended to be adaptable to the specific requirements of the final industrial use case. However, due to the lack of access to a real factory environment, the entire system is emulated using Mininet-WiFi [
29]. Mininet-WiFi enables the emulation of wireless software-defined networks, supporting the configuration of resource-constrained nodes and variable link capacities to create a highly realistic IIoT testbed. In this setup, we instantiate a baseline wireless topology composed of three programmable OpenFlow-enabled Access Point (AP), each connected to a configurable number of wireless stations. The access points are connected to the control module, which dynamically manages traffic by issuing flow rules to guide packet forwarding behavior, while the wireless stations act as individual IIoT sensors.
Each IIoT sensor runs an isolated Python-based application within its own network namespace. This application performs two main functions: authenticating with the edge database service and simulating and transmitting synthetic sensor data based on the statistical analysis previously discussed in
Section 4.1.
Figure 6 presents the flow diagram of the emulated IIoT sensors behavior. The process begins with the initialization of the simulators for each feature, based on the previously extracted statistical parameters. After initialization, the system checks connectivity with the database service hosted on the edge. Upon successful connection, the sensor retrieves organization and factory identifiers (mapped to specific data buckets) via an OAuth2-based authentication exchange with the edge database agent. Once authorization is granted, the sensor receives a fine-grained write token that enables data insertion exclusively into authorized buckets. Then, the sensor enters a loop where it continuously simulates and transmits data values at fixed time intervals (1 s, configurable) until interrupted.
4.2.2. Control Module
The control module is responsible for managing the control plane of the IIoT factory AP networks, as well as for retrieving data from the IIoT sensors through the edge layer database module. It also establishes inference pipelines with the FaaS module deployed in the cloud to determine whether any sensor exhibits anomalous behavior. When such anomalies are identified, the control module triggers reconfiguration actions at the corresponding AP to optimize network performance. The implementation leverages Ryu [
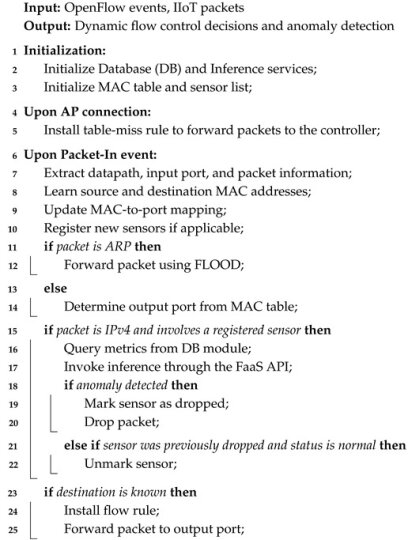
30] as the core controller for two main reasons: (1) it provides a southbound Application Programming Interface (API) supporting the OpenFlow protocol, allowing dynamic control-plane configuration of the APs; (2) its application-oriented design facilitates the creation of new control profiles that encapsulate the decision logic, including interactions with the database module, remote inference requests to the cloud, and dynamic IIoT network reconfiguration. The logic implemented in Ryu is detailed in Algorithm 1.
The control logic is driven by a tightly integrated decision loop combining real-time monitoring, ML-based inference, and policy enforcement. When an AP forwards a packet to the controller (via a PacketIn event), the controller queries the database for recent readings associated with the corresponding sensor. In the current implementation, the retrieved data consists of aggregated averages over a 10-min window, though this is configurable. This data is submitted to the FaaS API as a JSON payload, triggering a remote inference using the classification model described above. The FaaS service returns a label indicating whether the sensor should be considered efficient, inefficient, or in transition. The result is recorded in an internal sensor dictionary to track the operational state of each sensor and support centralized decision-making. If the sensor is classified as inefficient, the controller initiates a reconfiguration action. In the current prototype, this involves dissociating the sensor from its current AP, allowing it to reconnect to another access point with potentially better performance. This behavior demonstrates the feasibility of dynamic, ML-driven network reconfiguration, which can be extended or customized for various IIoT use cases.
| Algorithm 1: Flow Control and Anomaly Detection in the Ryu Controller. |
![Applsci 15 10829 i046 Applsci 15 10829 i046]() |
4.2.3. Database Module
InfluxDB [
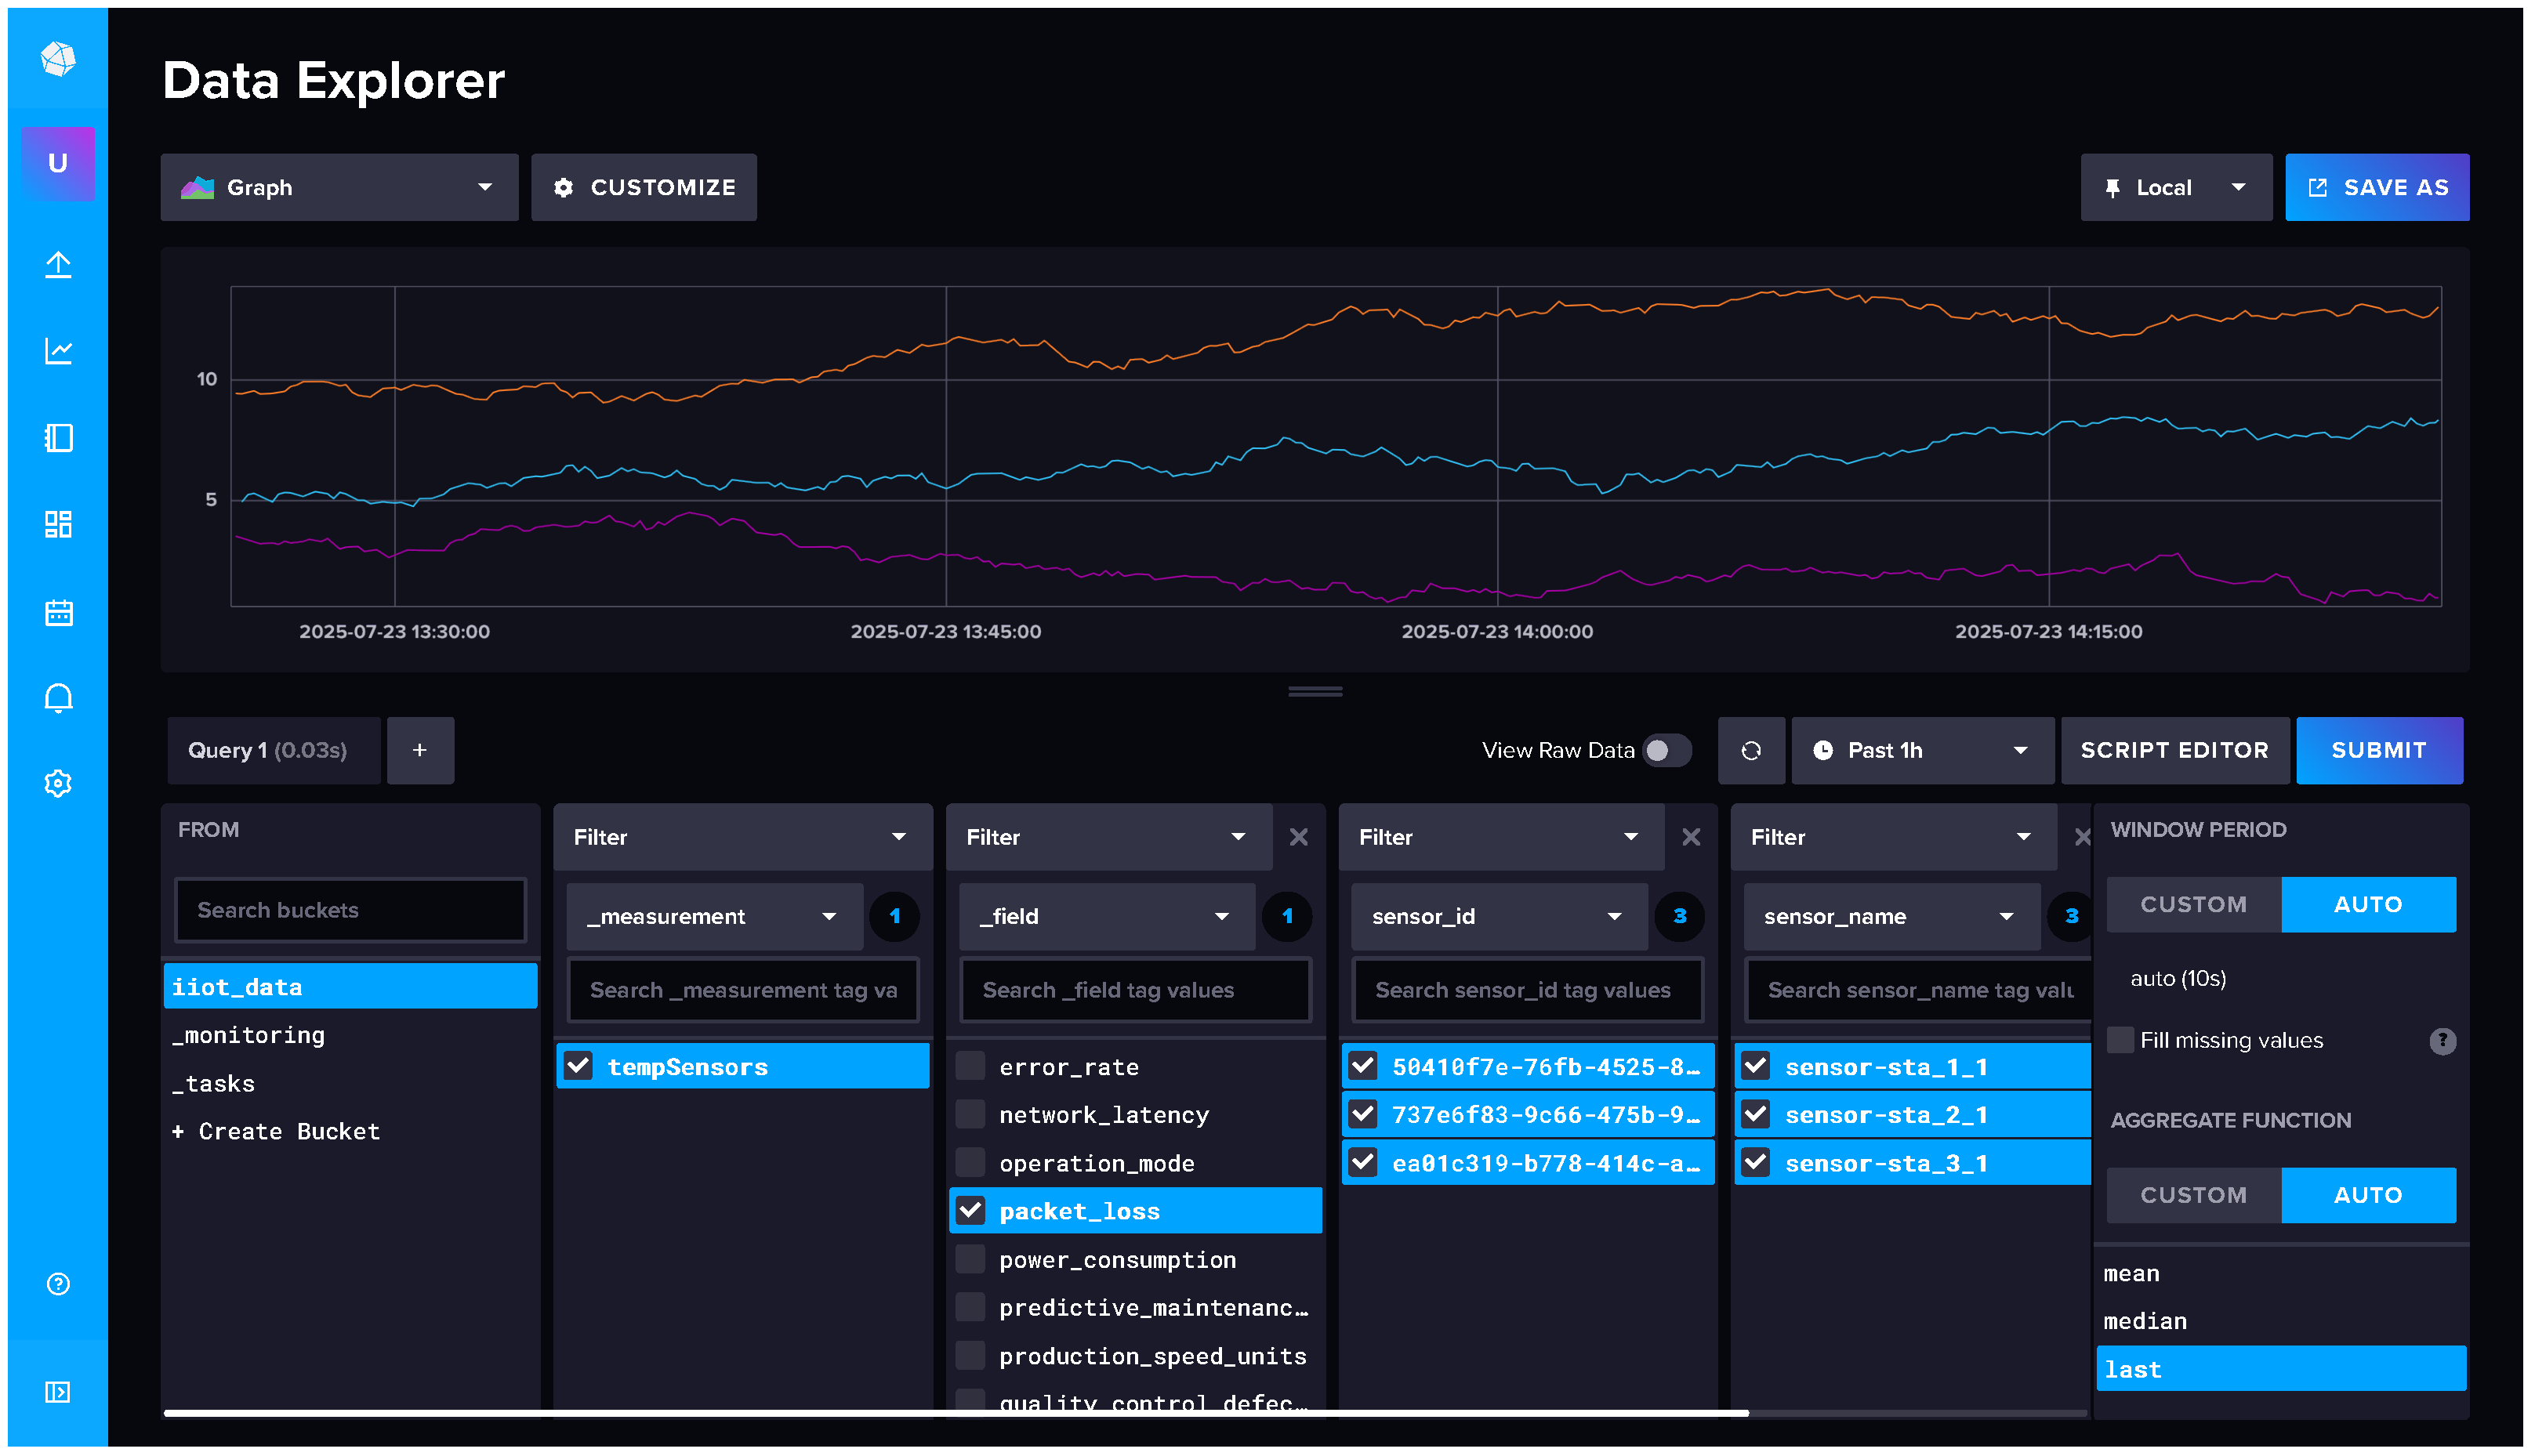
31] has been selected for the implementation of the database module, as it is a time-series database specifically optimized for data ingestion and querying in real time. This choice is motivated by several critical factors for IIoT monitoring systems: its high efficiency in handling write-intensive operations, its native support for time-window aggregations, and its seamless integration with platforms such as Grafana. In particular, InfluxDB enables the storage of periodic sensor readings with precise timestamps and supports aggregated queries with minimal latency.
Figure 7 presents the InfluxDB front-end user interface, showing an example of the time-series data stored in the database (with different colored lines). These data contain the temporal evolution of different variables recorded by the IIoT sensors.
4.2.4. FaaS Module
At the cloud tier, the FaaS module hosts the inference service that enables the control module to trigger reconfigurations of the IIoT network. Although the design follows a FaaS-like philosophy, namely, deploying stateless and on-demand inference services, no dedicated serverless platform, such as AWS Lambda or OpenFaaS, is used. Instead, the service is deployed as a containerized microservice managed by Kubernetes. We employ BentoML [
32] to package the ML model developed in
Section 4.1.2 and expose it via a RESTful API. BentoML was selected for its robust features in model serialization, versioning, and deployment, as well as its built-in support for scalable serving environments. This approach ensures seamless model updates and high availability of inference endpoints under varying load conditions while maintaining low latency.
4.2.5. Monitoring Module
The final functional block of the architecture is the monitoring module. Grafana [
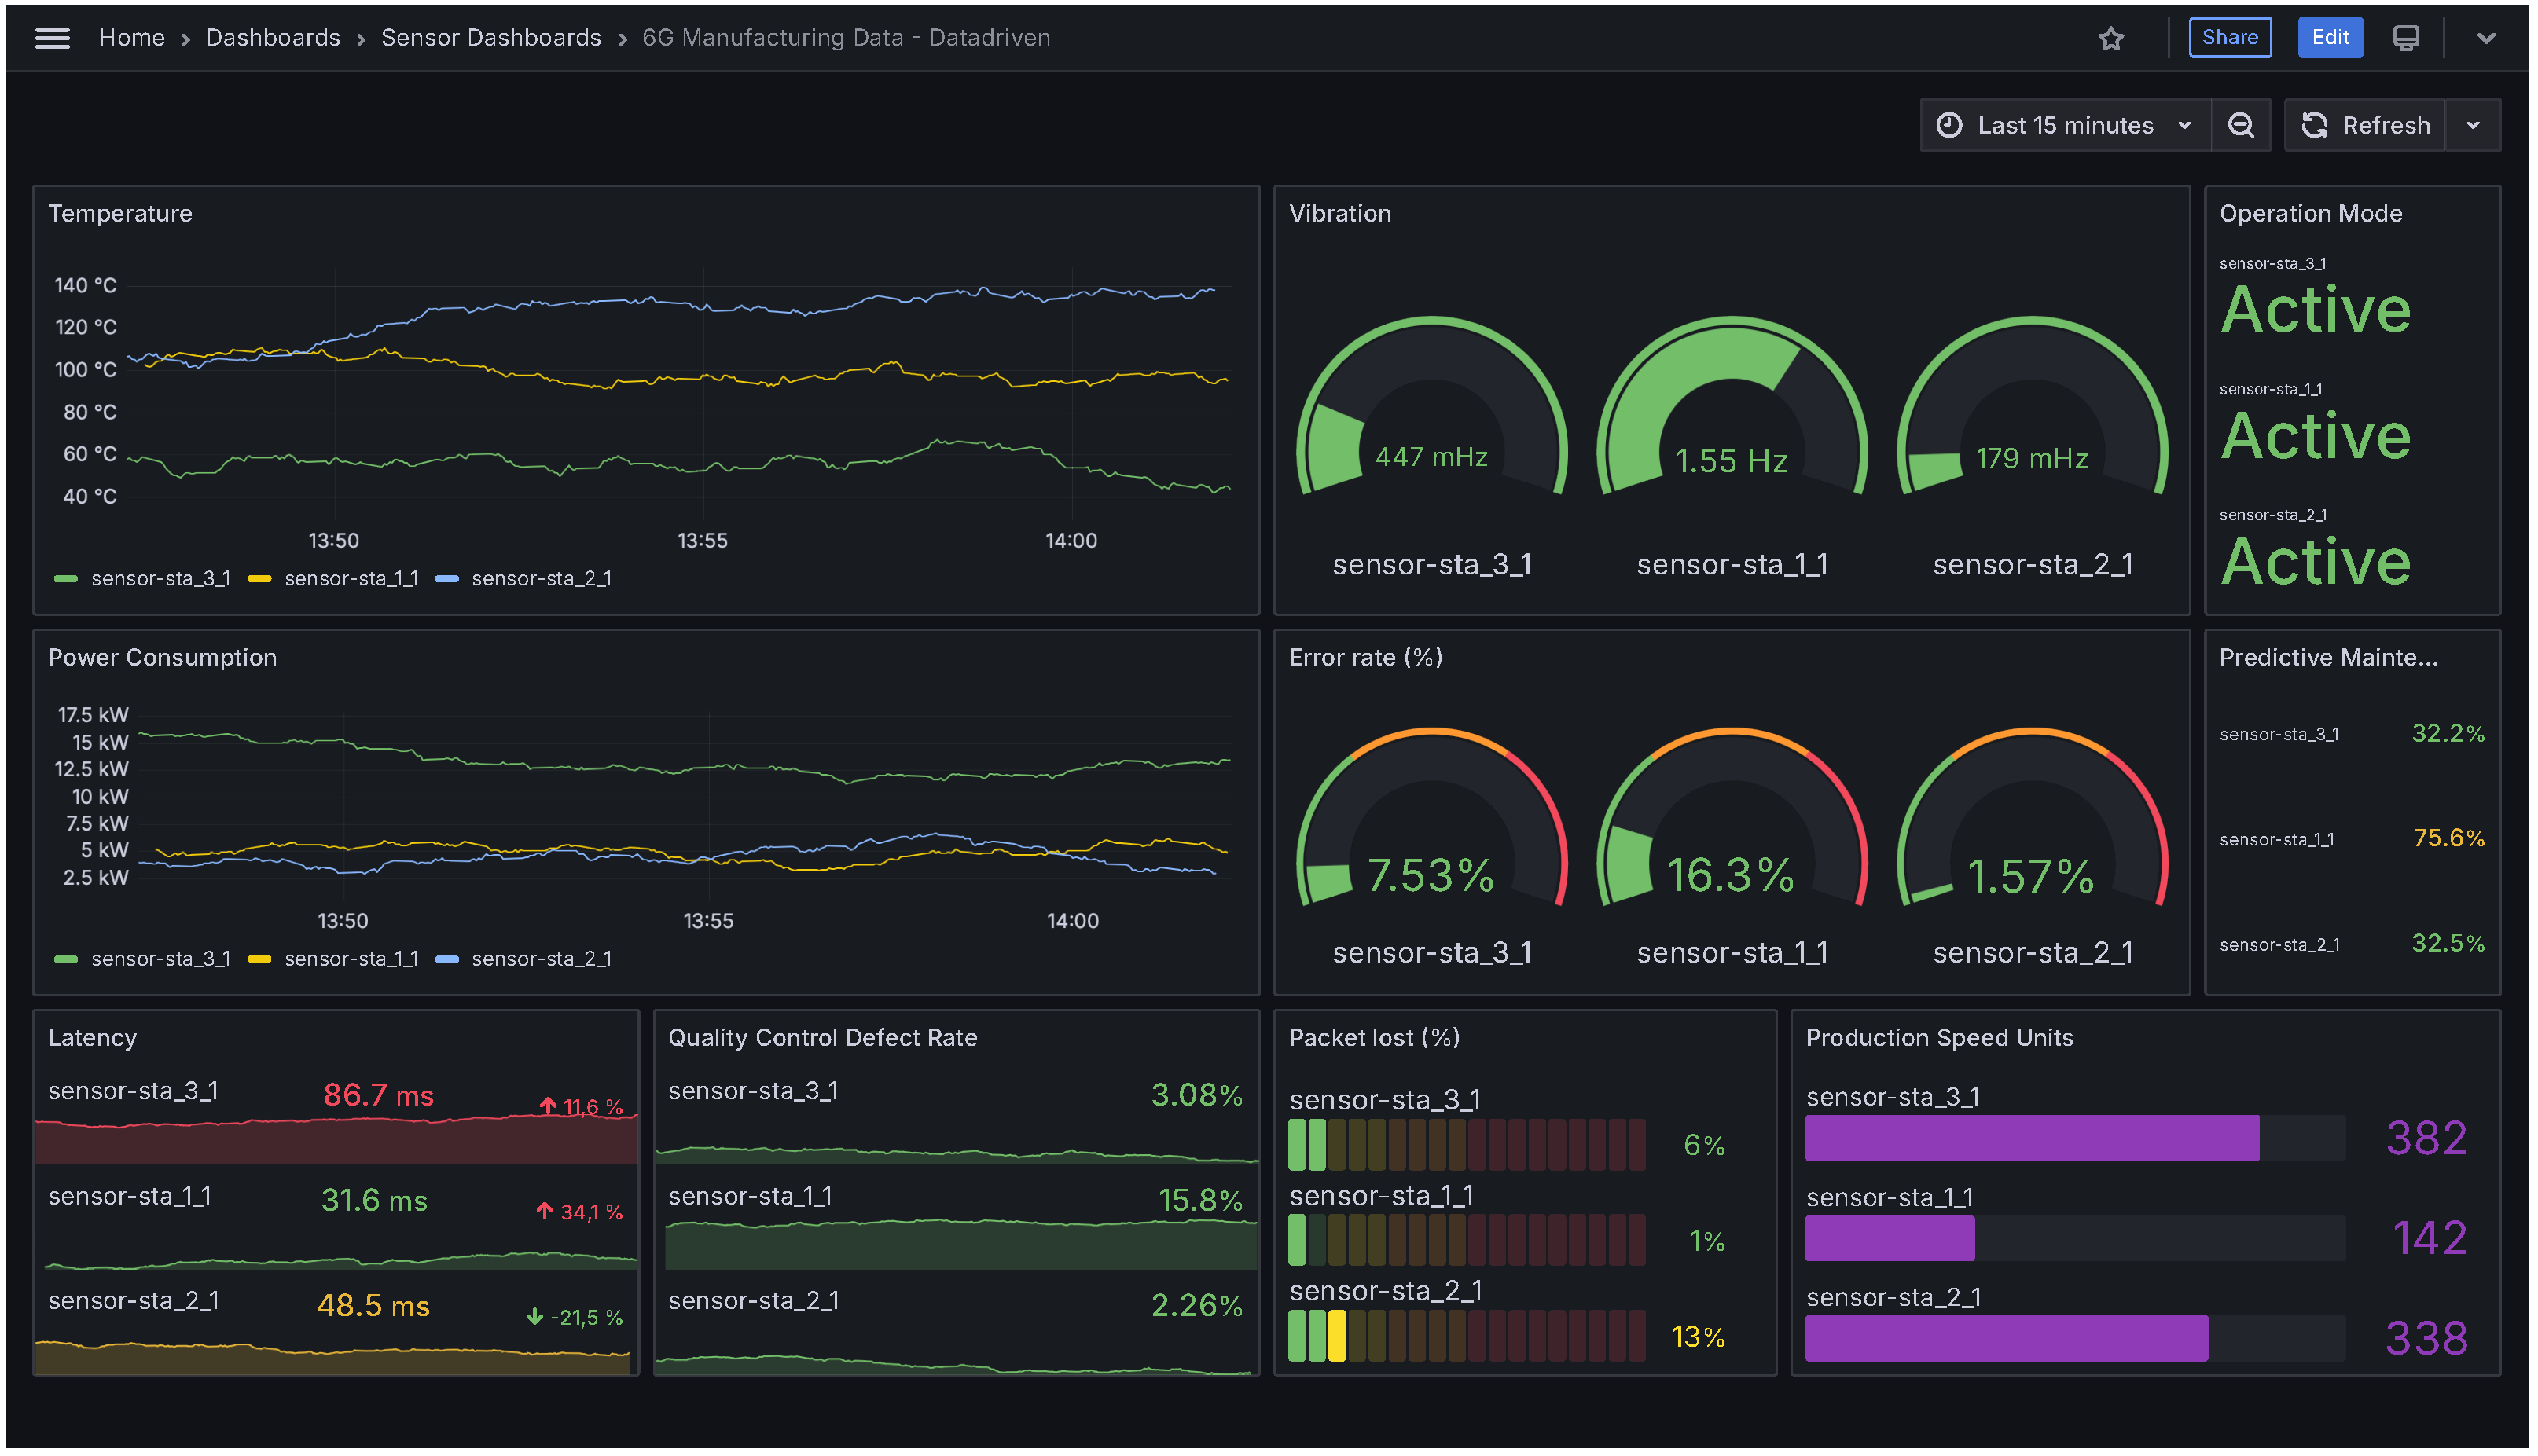
33] has been selected for this purpose due to its seamless integration with InfluxDB and its rich visualization capabilities. Using Grafana’s dashboard features and the plugin ecosystem, operators can construct interactive panels in real time that display key IIoT metrics, such as sensor readings, network latency, and system health, directly sourced from InfluxDB.
Figure 8 illustrates the configured frontend interface, which provides factory operators with a comprehensive, at-a-glance view of the entire IIoT network topology and real-time performance.
4.3. Architecture Deployment on Kubernetes
This section describes the complete deployment architecture used to integrate all components of the proposed IIoT system using a microservice-oriented approach based on Kubernetes.
Containerization is the preferred deployment strategy for complex systems composed of multiple, lightweight, and independently managed services that must interact to provide cohesive functionality. By isolating each logical block as a standalone container, the system becomes more modular, portable, and easier to scale or update independently. Kubernetes extends this model with built-in features such as autoscaling, load balancing, fault tolerance, persistent storage through Persistent Volume Claims (PVCs), and seamless inter-service communication. While simpler tools like Docker Compose can orchestrate basic setups, production-grade deployments often require more advanced platforms such as Kubernetes, OpenShift, Nomad, or Rancher. These orchestrators offer critical enterprise-level features such as health checks, high availability, service discovery, and declarative deployment. The motivation for adopting this model with Kubernetes lies in its ability to provide modularization, scalability, fault tolerance, and fine-grained service management, which are difficult to achieve in bare-metal deployments or with simpler orchestration tools.
To support the deployment, we set up a three-node Kubernetes cluster (containerd as a container runtime) using the official
kubeadm tool, which provides a streamlined method for initializing and managing Kubernetes deployments. As shown on the left side of
Figure 9, the cluster consists of (1) one master node that runs the Kubernetes control plane. It is responsible for managing the state of the cluster, including scheduling workloads, distributing configuration, and exposing APIs for managing services. This node does not run application services, but orchestrates deployments across the cluster. It also consists of (2) two worker nodes, which host the actual application components. These nodes run the containerized services. Kubernetes organizes containers into logical units named pods, which represent the smallest deployable unit. Each pod typically runs one or more tightly coupled containers that share networking and storage resources. In our deployment, each core component (e.g., database, controller, and FaaS) runs inside its own pod, managed by the Kubernetes scheduler. To ensure connectivity between pods across different nodes, we employ Calico as the Container Network Interface (CNI) plugin. Calico provides a secure overlay network and policy enforcement for communication between pods, both within the same node and between nodes.
The logical deployment scheme is visualized on the right side of
Figure 9. It illustrates how the physical infrastructure (cluster nodes) maps to virtual environments (namespaces), services, and pods. The architecture is logically divided into two namespaces (ns),
Factory-floor and
Data-driven.
Factory-floor emulates the IIoT environment using a virtual machine deployed via KubeVirt and QEMU-Libvirt. This virtual machine runs Mininet-WiFi, within which wireless network topologies are instantiated and IIoT sensors are simulated. These sensors behave as described in
Section 4.2.1.
Data-driven hosts all edge and control services required for decision-making and monitoring. These include the edge services, Ryu controller, and InfluxDB, deployed in an active–standby configuration to provide resilience, and the BentoML inference service and Grafana dashboards, both configured with Horizontal Pod Autoscaler (HPA), allowing them to scale based on CPU and memory usage to maintain performance under varying loads. A summary of the hardware resources allocated to run the infrastructure is provided in
Table 3.
4.3.1. Scalability and Fault Tolerance Mechanisms
To support adaptive scaling under varying workloads, we configure HPAs for the Grafana and BentoML services. Each HPA maintains a minimum of one and a maximum of five pod replicas. Scaling is triggered automatically when CPU utilization exceeds 70%, ensuring that services remain responsive during load peaks. CPU resource limits are defined with a minimum of 100 millicores and a maximum of 500 millicores per pod.
For stateful components, such as InfluxDB and Ryu, HPA is not used. Instead, these services are deployed with active–standby redundancy to support fault tolerance and ensure service continuity. Two pods are provisioned for each component: one acts as the primary node, handling both read and write operations, while the second remains in standby mode. Write requests are replicated across both instances to maintain consistency. In the event of primary failure, the standby instance is automatically promoted to active, assuming full operational responsibilities with minimal disruption to the system. The Kubernetes built-in service handles load balancing between replicas, automatically routing traffic to all active pods. Newly created pods are labeled and integrated into the service mesh without requiring reconfiguration. This hybrid approach, which combines autoscaling for stateless services and manual redundancy for stateful ones, ensures both performance elasticity and high availability across the deployed architecture.
4.3.2. Data Flow Across Architectural Components
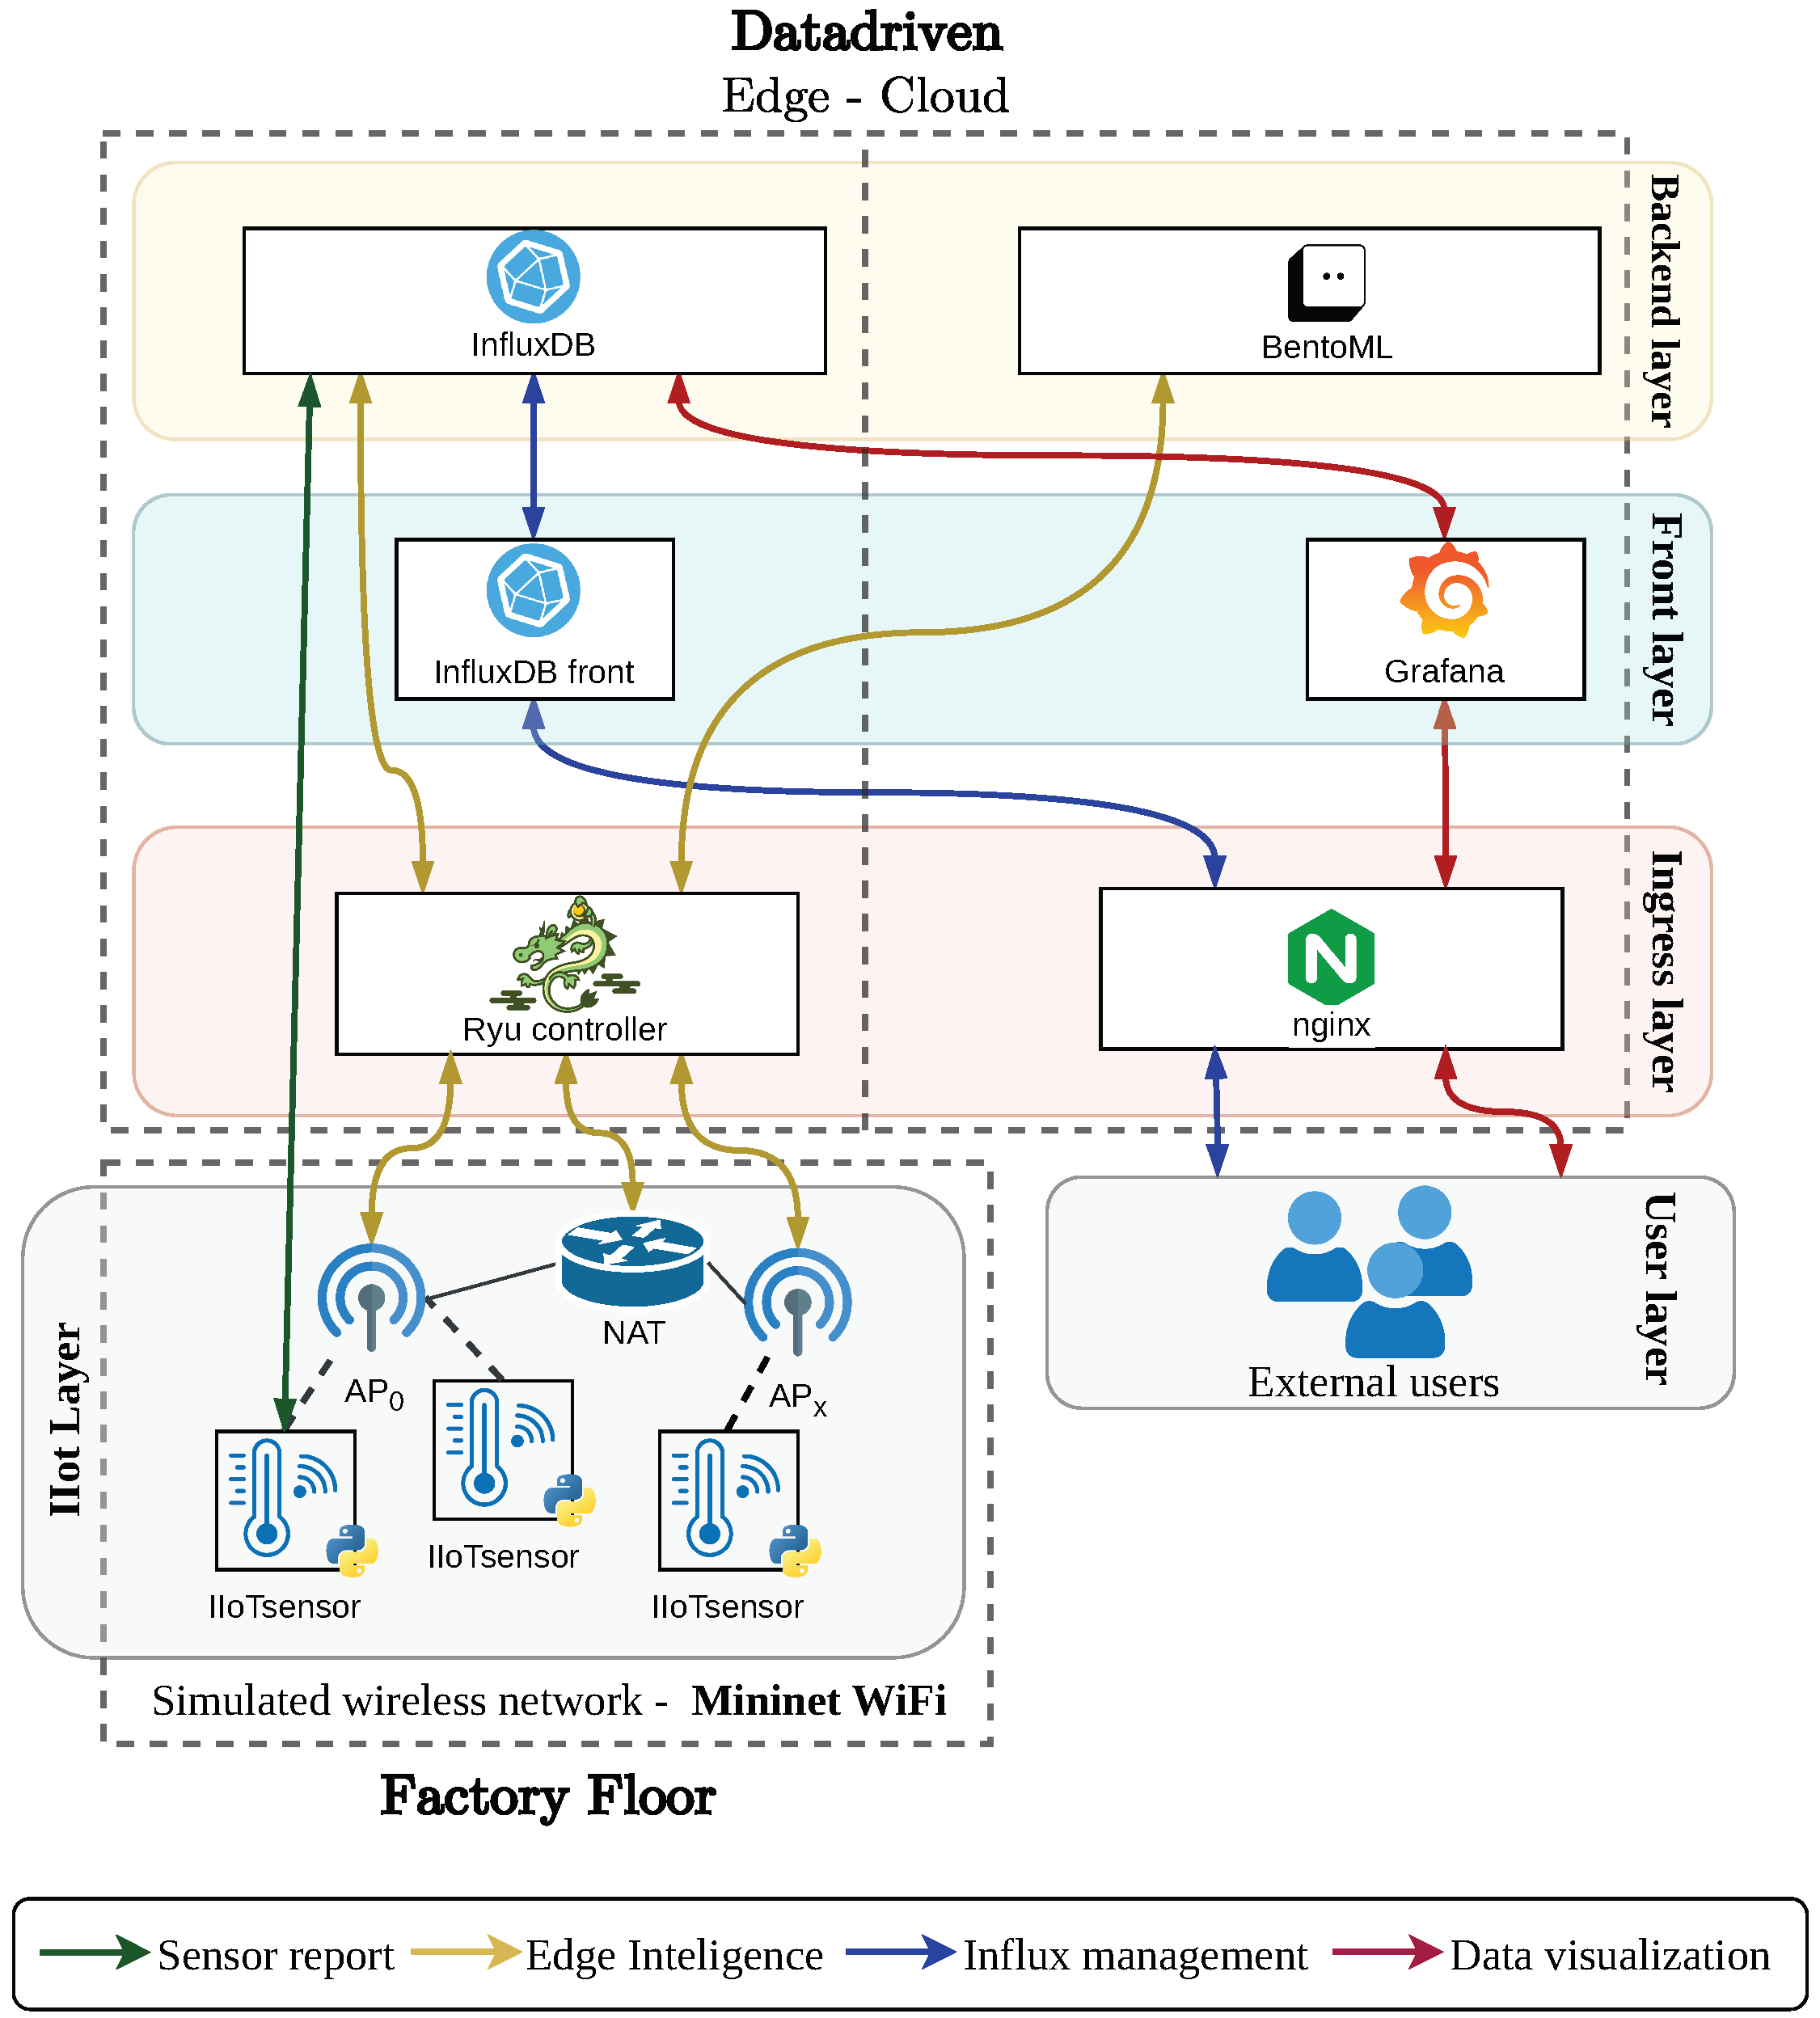
Following the description of the Kubernetes cluster and the logical deployment, the operational data flow between the key components of the system is now examined and illustrated in
Figure 10.
In the bottom-left of the diagram, the IIoT layer represents the emulated factory floor using Mininet-WiFi which instantiates a wireless SDN-enabled mesh network composed of virtual IIoT sensor nodes (denoted IIoTSensor) and AP. Each sensor generates and transmits periodic measurements as stated above in
Section 4.2.1. The generated packets traverse the SDN mesh, reach an Access Point (AP), and are routed through a Network Address Translation (NAT) gateway to the Ryu controller in the ingress layer. The Ryu controller processes the messages from the IIoT layer and enables the evaluation of sensor efficiency and the monitoring of the network in real time by dynamically consulting two services: (1) InfluxDB, to retrieve recent sensor metrics, and (2) BentoML, to invoke the inference pipeline that determines if a sensor is in an anomalous state. Based on the outcome of these interactions, the controller may trigger reconfiguration actions, such as disassociating a sensor from its current AP and redirecting it to a better-performing one.
Parallel to this, external users interact with the system through the Users layer. All incoming HTTP requests are routed via an Nginx proxy, which acts as the system’s single entry point for external access. From there, the proxy forwards traffic to two front-end services: (1) Grafana, which periodically queries InfluxDB to generate real-time dashboards of sensor data, and (2) InfluxDB’s web UI, which allows system administrators to inspect, query, and manage the time-series data directly.
This multilayered data flow design enables continuous monitoring, intelligent inference, and user observability while maintaining architectural separation between emulated devices, control logic, and user-facing services.
5. Experimental Evaluation
In this section, we present the experimental evaluation of the proposed architecture, organized into three subsections: (i) Resource Utilization and Scalability, where we analyze CPU, memory, and deployment time metrics as functions of system load and the number of IIoT sensors; (ii) Inference and Data Ingestion Latency, which measures the average inference time and the data ingestion latency into the database module using the hey tool; and (iii) Average Network Reconfiguration Time, in which we study the mean network reconfiguration delay as the number of IIoT sensors varies. All tests were carried out on a DELL PowerEdge R650 server equipped with two Intel® Xeon® Silver-4310 processors at 2.10 GHz (18 MB cache), 512 GB of DDR4 RAM. The goal of this experimental evaluation is to quantify the architecture’s performance and to assess its flexibility and scalability, as well as its ability to adapt to varying QoS requirements and to autonomously reconfigure itself in response to changing operational conditions.
5.1. Resource Utilization and Scalability
In this subsection, we evaluate the performance and scalability of the proposed architecture, focusing exclusively on the Edge and Cloud components. The Factory floor layer is highly dependent on the specific requirements of each use case and may vary substantially depending on the operational environment. As explained in previous sections, in our implementation, the Factory floor is emulated through a virtual machine running Mininet-WiFi, emulating a wireless SDN topology with constrained IIoT nodes. However, for the purpose of this analysis, we limit the evaluation scope to the core functional blocks located at the Edge and Cloud tiers of the architecture. We begin by analyzing the deployment time of the entire system, broken down into its individual stages.
Table 4 presents the mean execution time for each step, along with its Confidence Interval (CI), repeating all the deployment 20 times. The total mean deployment time amounts to approximately
s.
The most time-consuming phase is the installation of the container runtime and the Kubernetes cluster, which includes the setup of containerd and essential Kubernetes components. This step takes roughly s, representing nearly 74% of the total deployment time. Following this, the setup of the master node requires around s, which includes cluster initialization and control-plane configuration. Subsequent steps, such as the provisioning of virtual machines ( s), namespace configuration ( s), and deployment of the datadriven services ( s), contribute marginally to the overall duration. The addition of worker nodes is almost instantaneous, each requiring only one second, indicating the efficiency of the horizontal scaling process once the cluster is operational. These results confirm that, despite the complexity of the system, the deployment process is both time-efficient and repeatable, allowing for rapid resetting in dynamic or multi-tenant environments.
Following the deployment time analysis, we examine the memory consumption patterns of the key functional blocks located in the Edge and Cloud tiers.
Table 5 reports the average memory usage, expressed in MiB, along with the corresponding confidence intervals, for each core service—BentoML, Grafana, InfluxDB, and Ryu—as a function of the number of IIoT stations (STAs) per AP. As expected, BentoML exhibits the most significant growth in memory consumption with increasing network load. Starting at
MiB with a single STA, its usage peaks around
MiB for 9 STAs per AP. Beyond this point, memory consumption fluctuates moderately but remains within a stable operational range between approximately 750 and 985 MiB. These results confirm that BentoML scales with the number of concurrent inference requests, although horizontal scaling mitigates resource saturation as described in the autoscaling configuration.
Grafana maintains relatively stable memory usage across all tested configurations. With a baseline of MiB, its consumption only slightly increases, reaching MiB at 17 STAs, before decreasing as fewer rendering operations are triggered in higher-load scenarios—possibly due to visualization throttling or refresh limitations. A sharp drop is observed after 23 STAs, likely caused by internal dashboard optimizations or saturation effects. InfluxDB shows a consistent and gradual increase in memory usage as the number of STAs grows. Beginning at MiB with one STA, it reaches MiB at 29 STAs. This behavior reflects the expected trend for time-series databases under increased write and query operations, with no indication of performance degradation or memory leakage.
In contrast, Ryu demonstrates constant memory usage throughout the tests, maintaining approximately 56 MiB regardless of system load. This consistency stems from its lightweight nature as an SDN controller, whose control logic remains independent of the number of STAs once the topology is instantiated. Overall, these results confirm the memory efficiency and scalability of the architecture. The services behave predictably under stress, and their resource profiles validate the decision to adopt a microservice-based deployment strategy.
Table 6 presents the average CPU usage in millicores (A unit of measurement for CPU resources, representing one-thousandth of a core (1/1000), 1000 millicores is equivalent to one full core) for each core component of the architecture—BentoML, Grafana, InfluxDB, and Ryu—as a function of the number of IIoT sensor nodes. As expected, BentoML exhibits a sharp increase in CPU usage as the number of IIoT sensors grows, reaching its peak consumption at 25 STAs with approximately
millicores. This trend highlights the computational demand required to perform AI/ML inference tasks as more data is ingested. However, beyond this point, the load shows a slight decline, likely due to load balancing or inference batching effects at the service level. InfluxDB also demonstrates a consistent growth in CPU consumption, with usage rising from
millicores at 1 STA to a peak of
millicores at 25 STAs. This behaviour is consistent with the expected increase in write operations and query volume resulting from higher sensor activity.
Ryu, the control module, shows a significant increase in CPU usage between 1 and 9 STAs, reaching millicores, and then continues to fluctuate moderately. This indicates that Ryu actively participates in the control loop and OpenFlow event handling, particularly during network reconfiguration and routing decisions. In contrast, Grafana remains relatively lightweight until the 11 STAs mark, after which a sharp drop in CPU consumption is observed, settling near millicores for 25 or more STAs/AP. This behaviour is attributed to Grafana’s internal optimization, caching, and the fact that it only renders dashboards periodically, reducing its load during periods of steady-state operation.
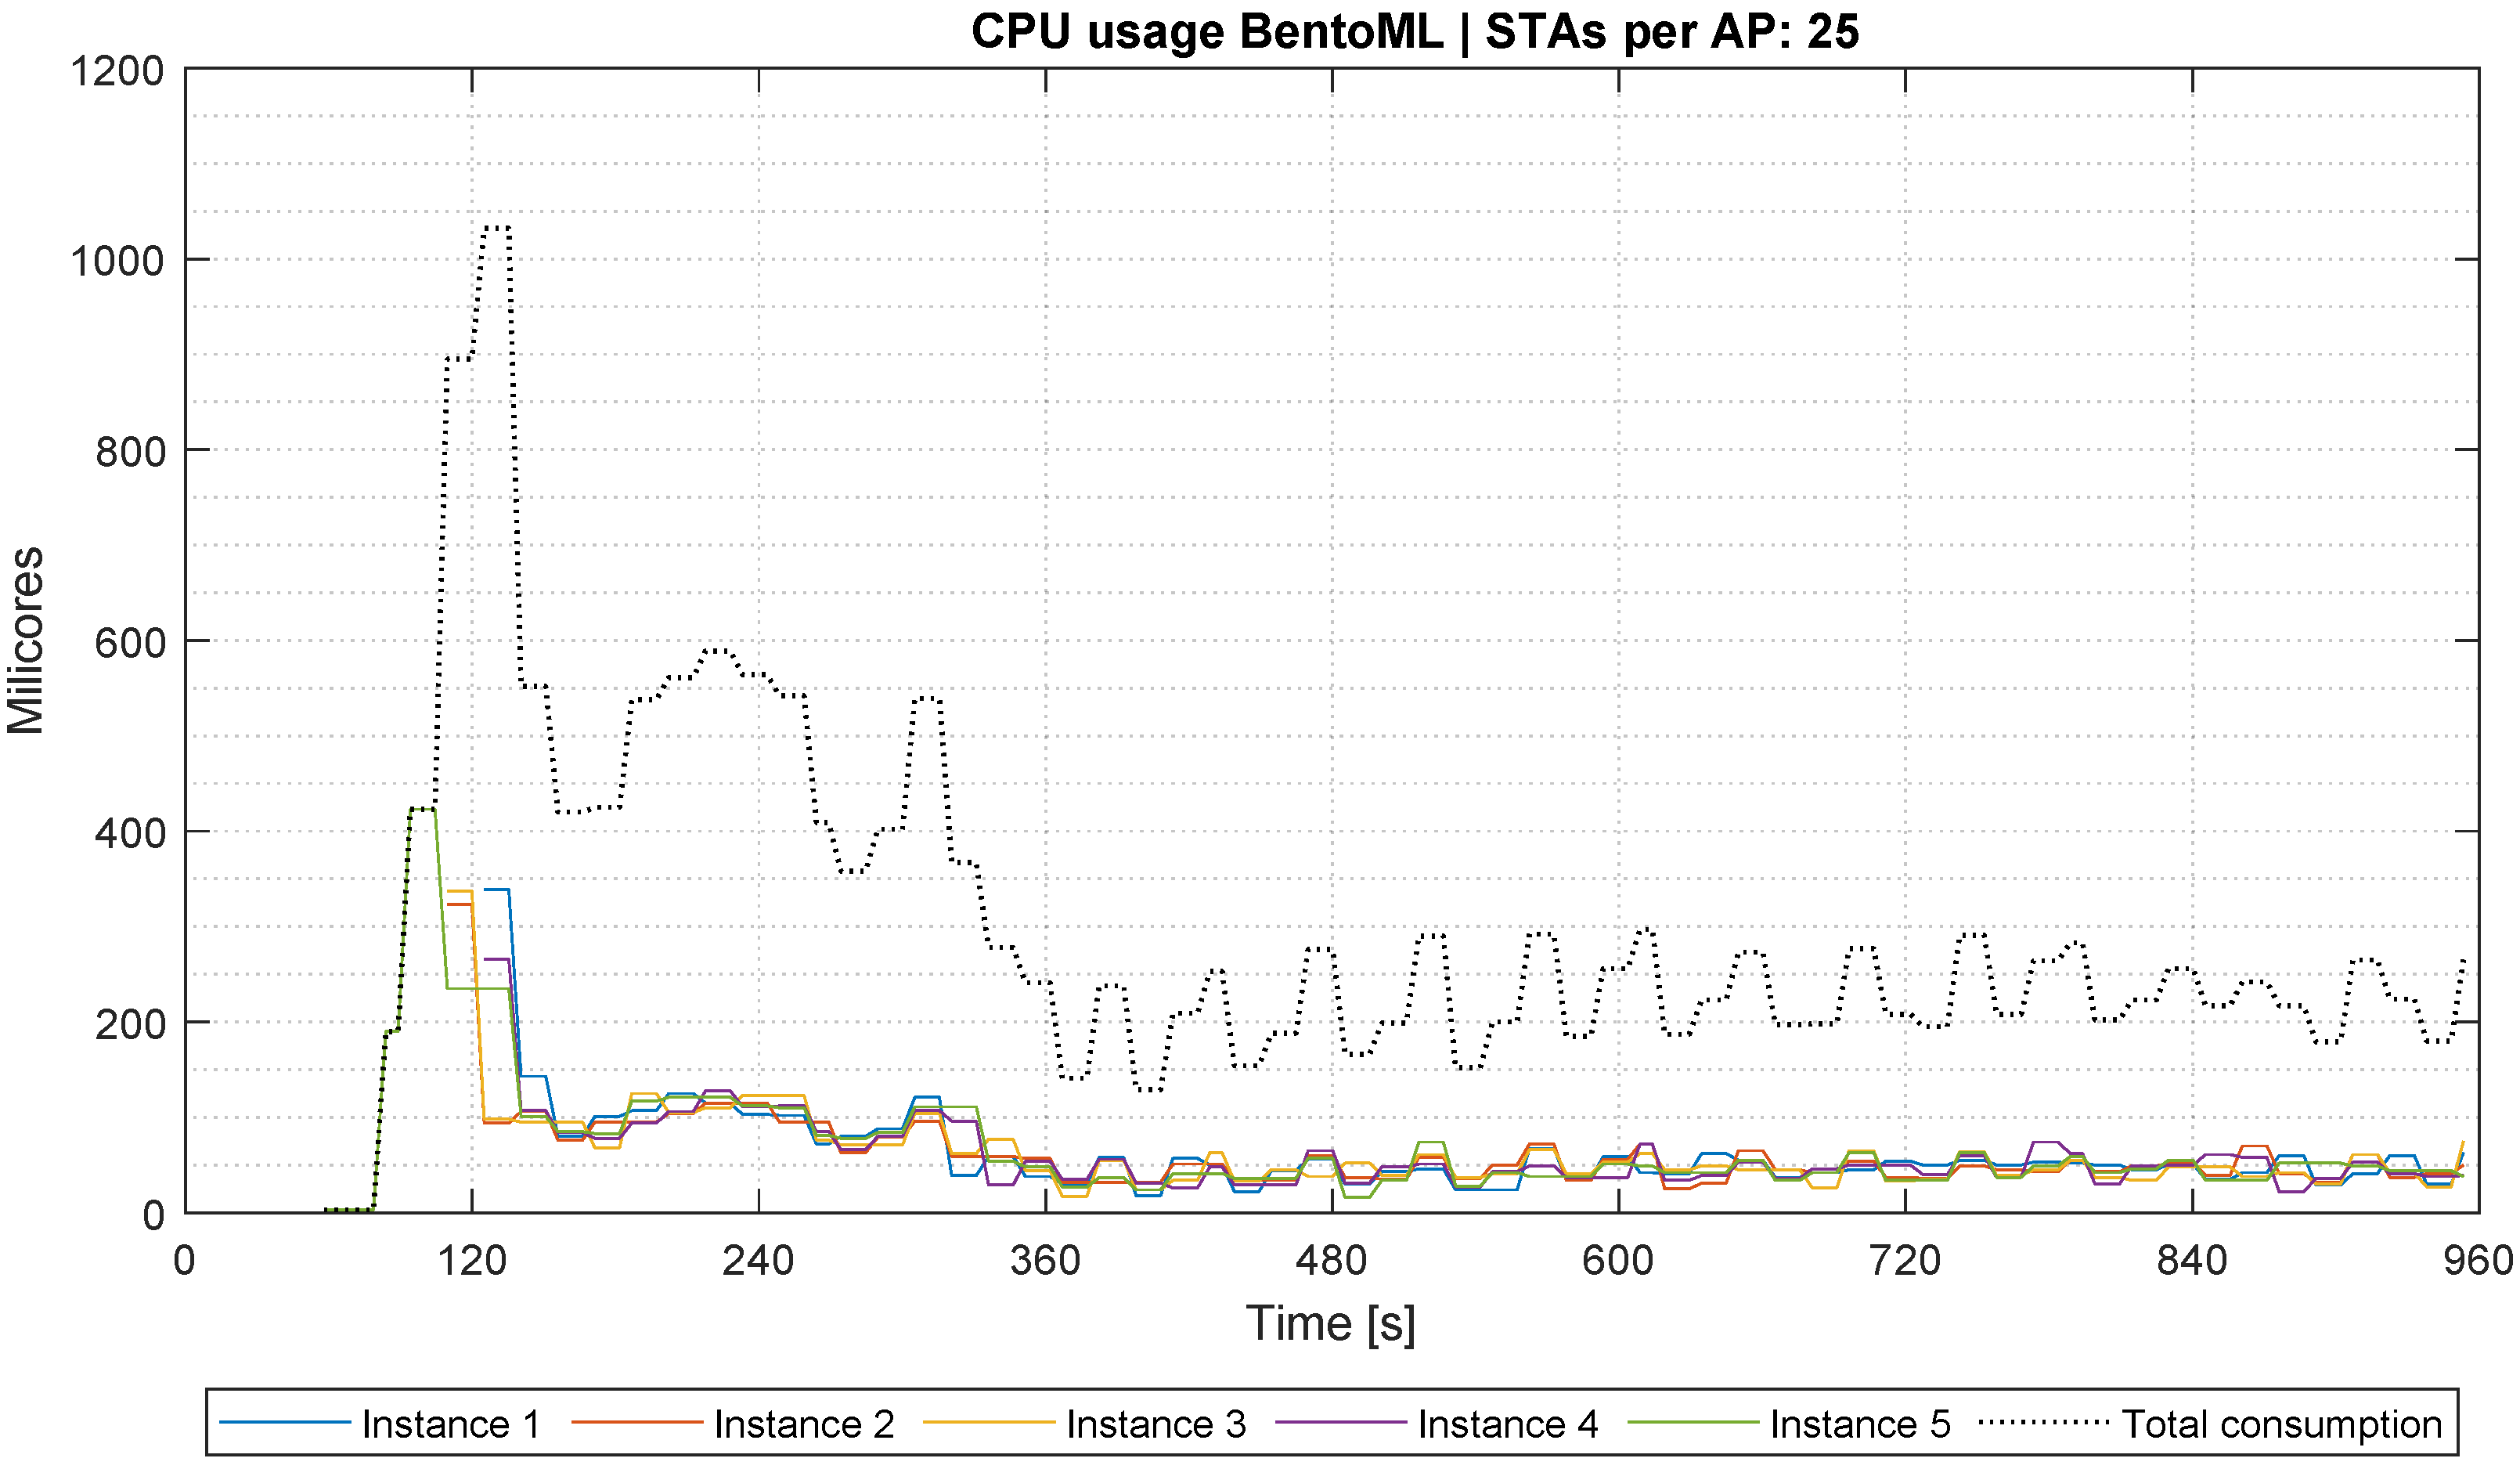
To further investigate the scaling behaviour of BentoML, the CPU consumption was analysed in greater detail for the scenario with 25 STAs per AP. As illustrated in
Figure 11, an initial CPU usage peak is observed due to a single instance handling the entire incoming workload. However, the system progressively spawns additional BentoML replicas in response to the growing demand, effectively distributing the workload. This behavior reflects the activation of the HPA and demonstrates that while the architecture scales with the number of active IIoT devices, the components show varying degrees of sensitivity to workload increases. In particular, BentoML and InfluxDB are the most CPU-intensive services, warranting particular attention in sizing and autoscaling strategies.
Finally, an evaluation of the worst-case recovery time of the proposed architecture is presented. Obtaining these estimates delimits the system’s expected behavior and characterizes its response capacity. To measure these times for each deployed service, a controlled failure is induced, and the interval during which the service remains unresponsive is measured. The measured downtime comprises the time for Kubernetes to detect that the container is unhealthy, schedule and instantiate a replacement container, initialize it, and attach it to the ingress network. The analysis is conducted under a worst-case scenario in which the fault-tolerance and reliability mechanisms discussed earlier are disabled. To obtain representative estimates, the experiment proceeds as follows. The service health endpoint is probed continuously at intervals of
. While probing, the container is deliberately terminated. The test ends when the service regains availability. Independence between tests is ensured by an idle period of
without traffic before each subsequent iteration. Each test is repeated 30 times per service. The results shown in
Table 7 indicate no significant differences in recovery times across services, reflecting that recovery is delegated to the container orchestrator and depends largely on the underlying hardware, yet with worst-case recovery times remaining on the order of one minute substantiating the reliability of the architecture even without service-specific redundancy mechanisms, with Grafana exhibiting
as the highest mean and the Ryu controller
as the lowest.
5.2. Inference and Data Ingestion Latency
This subsection evaluates the average inference latency of the BentoML service and the average data access latency of the InfluxDB database. Both tests are conducted using the
hey [
34] benchmarking tool, through a custom script that generates concurrent load targeting the BentoML inference service and the InfluxDB data query interface.
The objective is to assess the impact of autoscaling on BentoML and the responsiveness of InfluxDB, thus providing insight into the system’s overall performance under realistic workloads. To this end, concurrent HTTP requests are issued, progressively increasing the number of simultaneous connections from 1 to 100. Each batch of concurrent requests, denoted by
, is treated as a single test instance. For instance, setting
implies the launch of 10 parallel requests constituting one experimental run. This methodology is critical to ensure consistency and statistical reliability in the results; otherwise, fragmented or asynchronous measurements would compromise validity. For each test,
requests are issued, where
. Following each batch, a cooldown period is enforced to allow the system to return to its idle state—specifically, when BentoML runs with only one active container and InfluxDB exhibits baseline load conditions. Each test scenario is repeated 25 times, originating from the Ryu controller container (which would normally trigger such data flows), while keeping the Mininet topology inactive to eliminate interference. The average results are shown in
Figure 12,
Figure 13,
Figure 14 and
Figure 15.
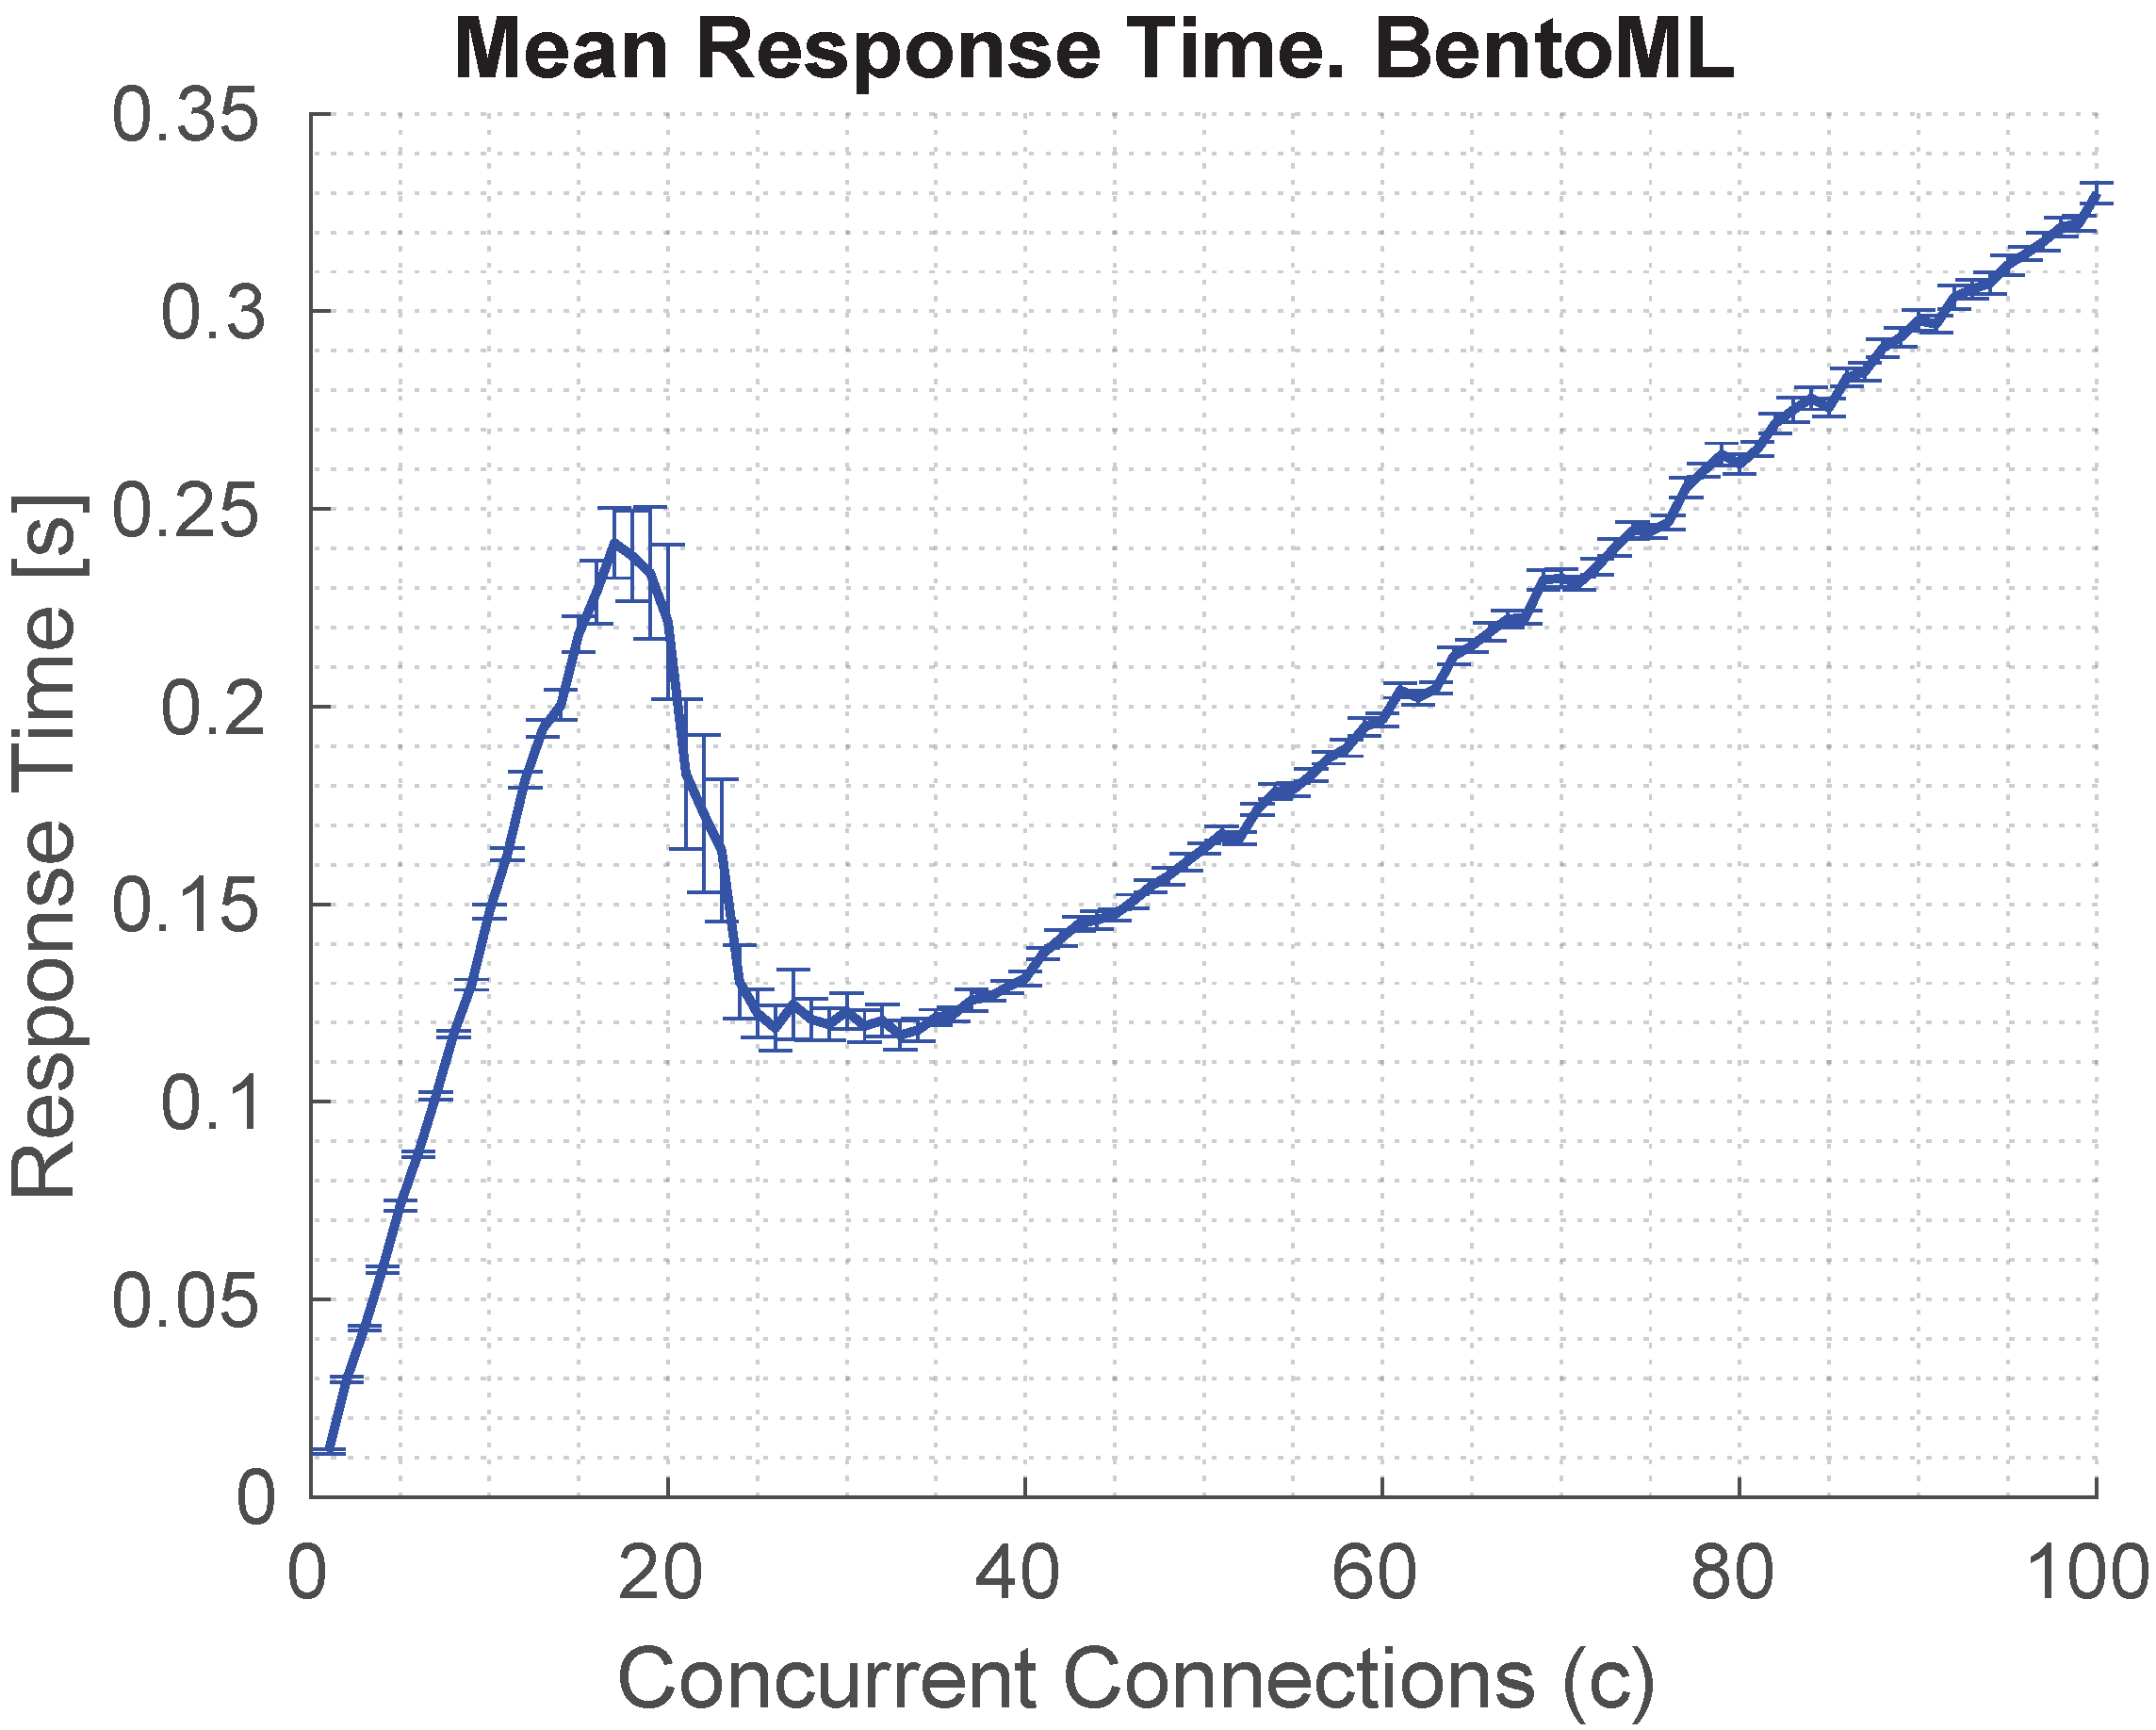
Figure 12 presents the average response time of the BentoML service as a function of the number of concurrent requests. A quasi-linear increase in response time is observed, reaching a maximum latency of approximately 350 ms under 100 concurrent requests. The figure exhibits three distinguishable phases. In the initial phase, from 0 to 15 concurrent requests, only a single container is active, resulting in the steepest latency slope. This delay triggers the autoscaling policy, initiating the deployment of additional BentoML replicas. The intermediate phase, from 15 to 25 concurrent requests, shows a continued increase in response time, as the autoscaler gradually adds replicas until the upper limit of five is reached. Beyond 25 requests, in the final phase, the response time continues to grow but at a significantly reduced rate, reflecting the load balancing across multiple replicas and the amortization of computational cost.
In contrast,
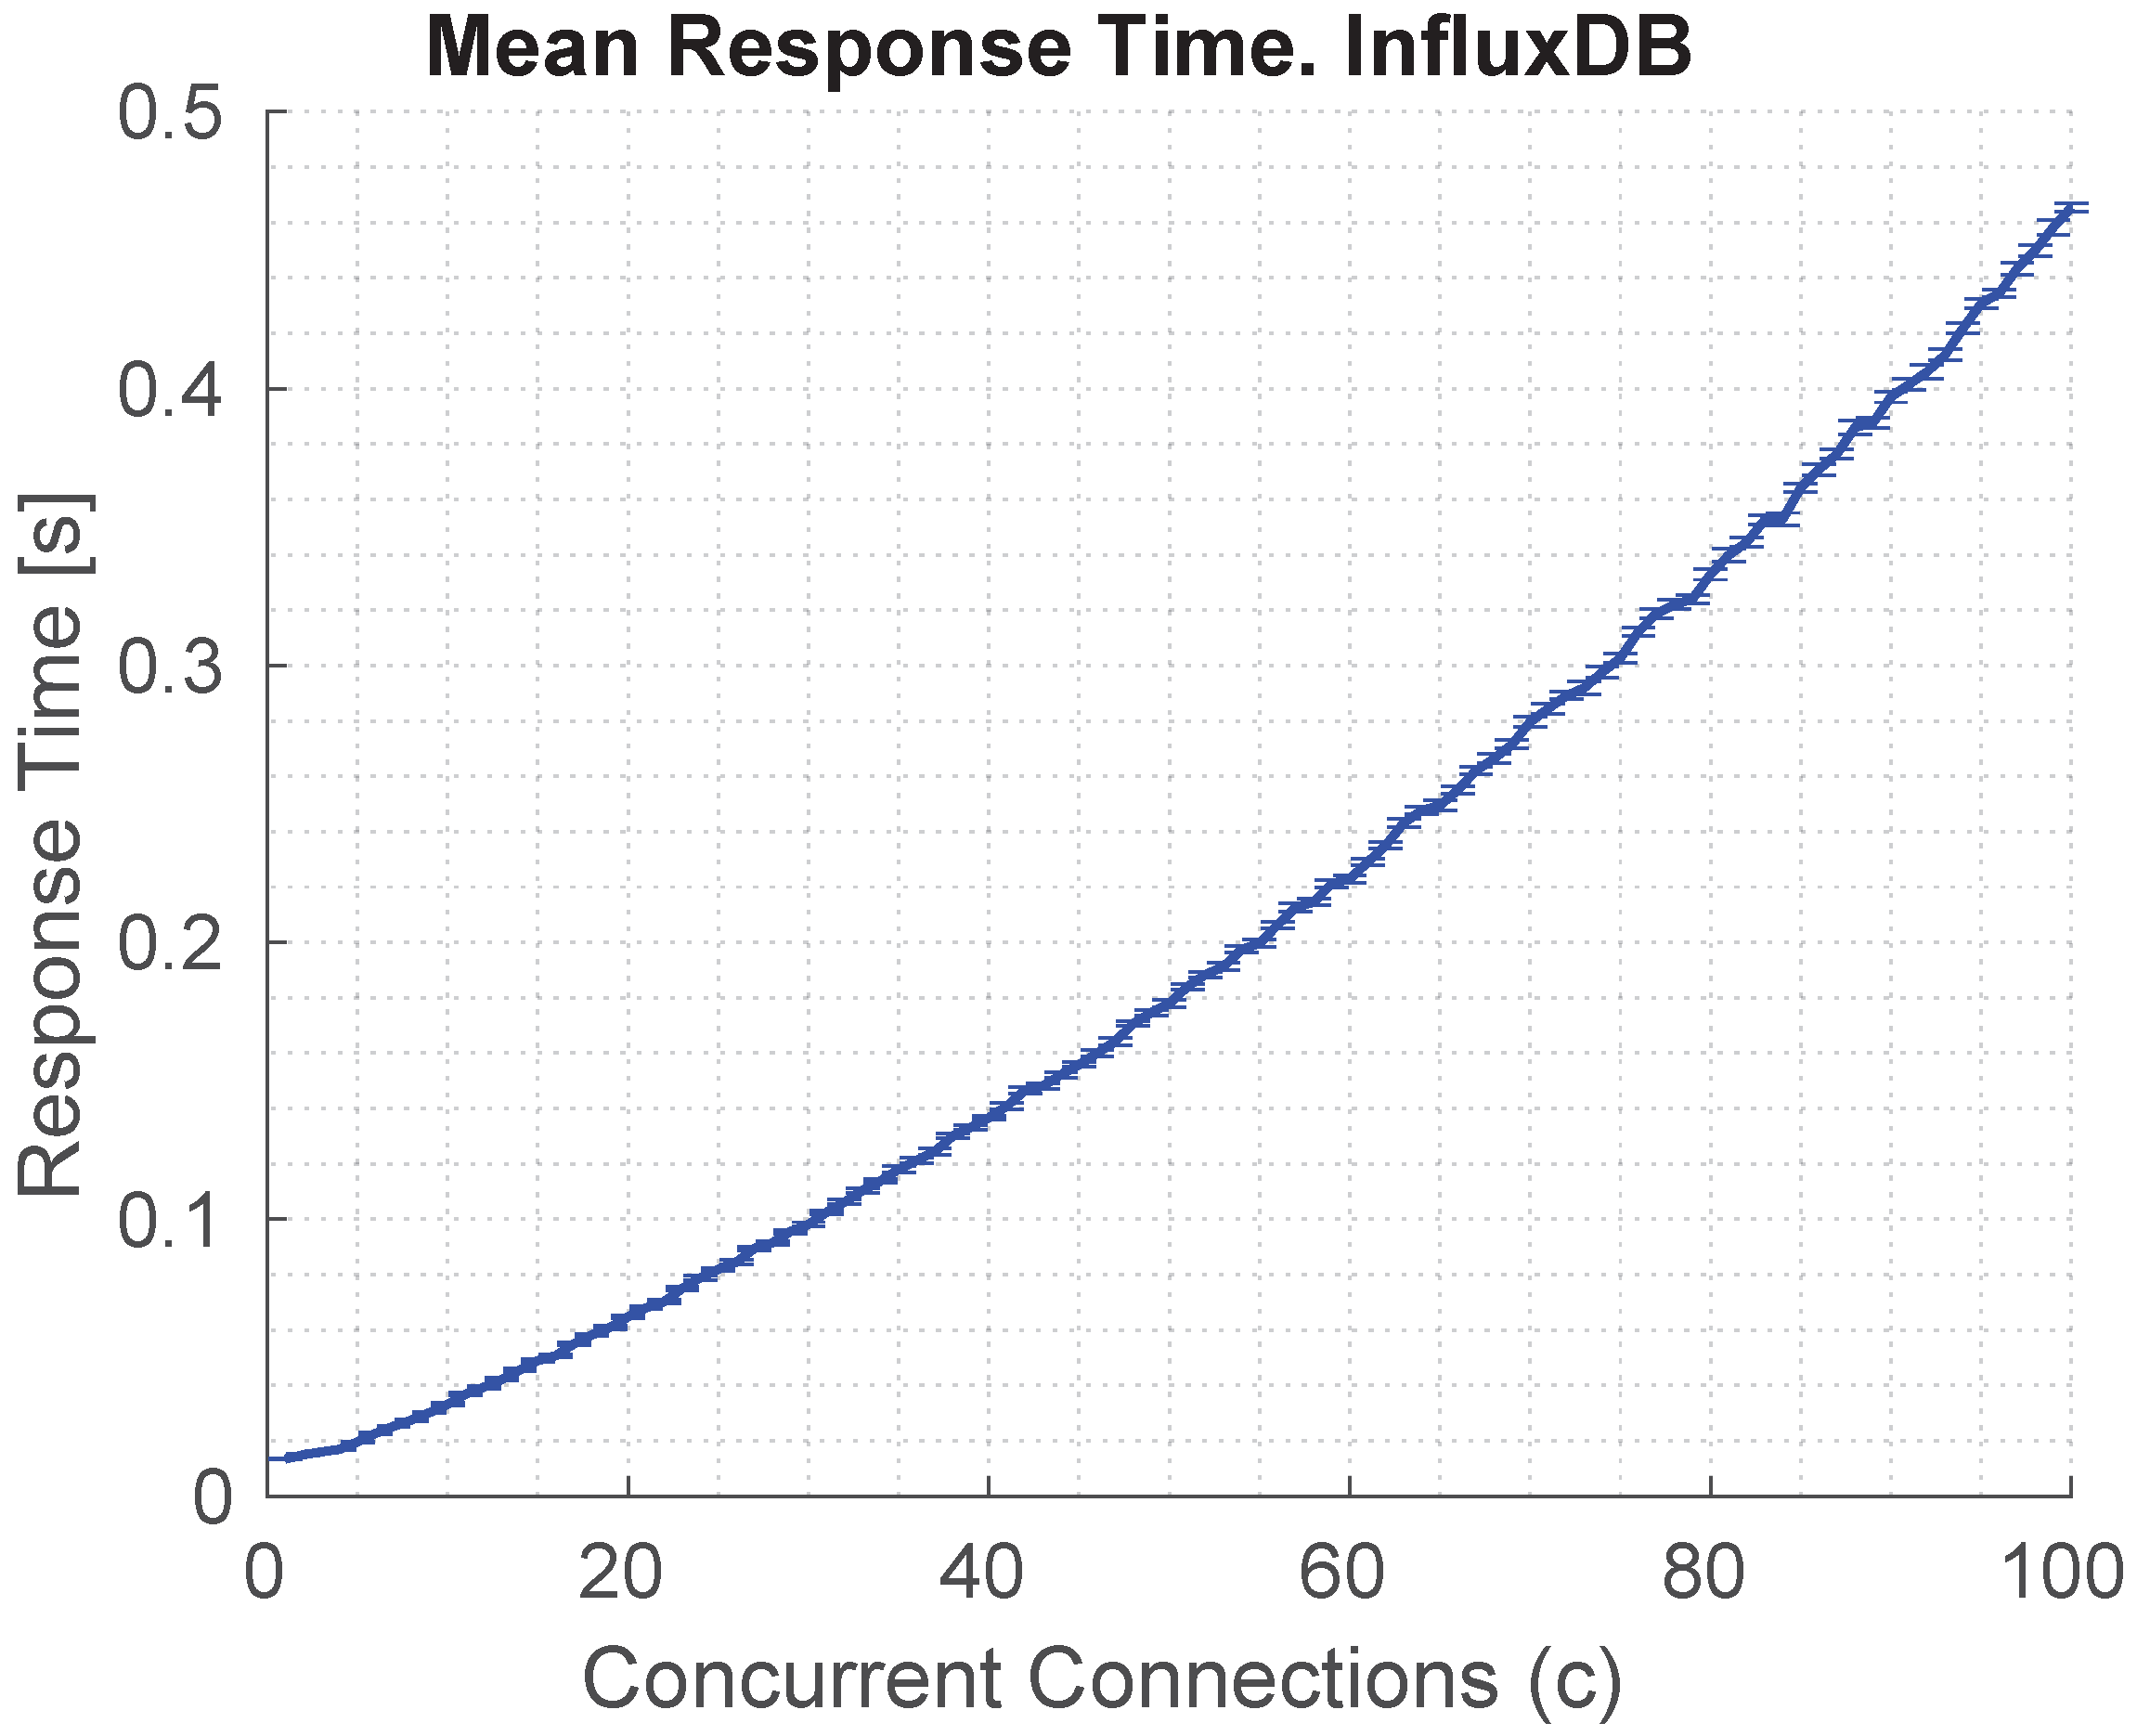
Figure 13 depicts the results of the same experimental procedure applied to the InfluxDB service, focusing on database read operations instead of inference tasks. The observed latency remains remarkably stable throughout the experiment, with a maximum delay of approximately 480 ms under peak concurrency. This behavior is particularly notable given the absence of an autoscaling mechanism in InfluxDB—a design choice intended to preserve data consistency. The figure reveals a potential logarithmic growth trend in the response time, indicating scalable performance despite increasing load.
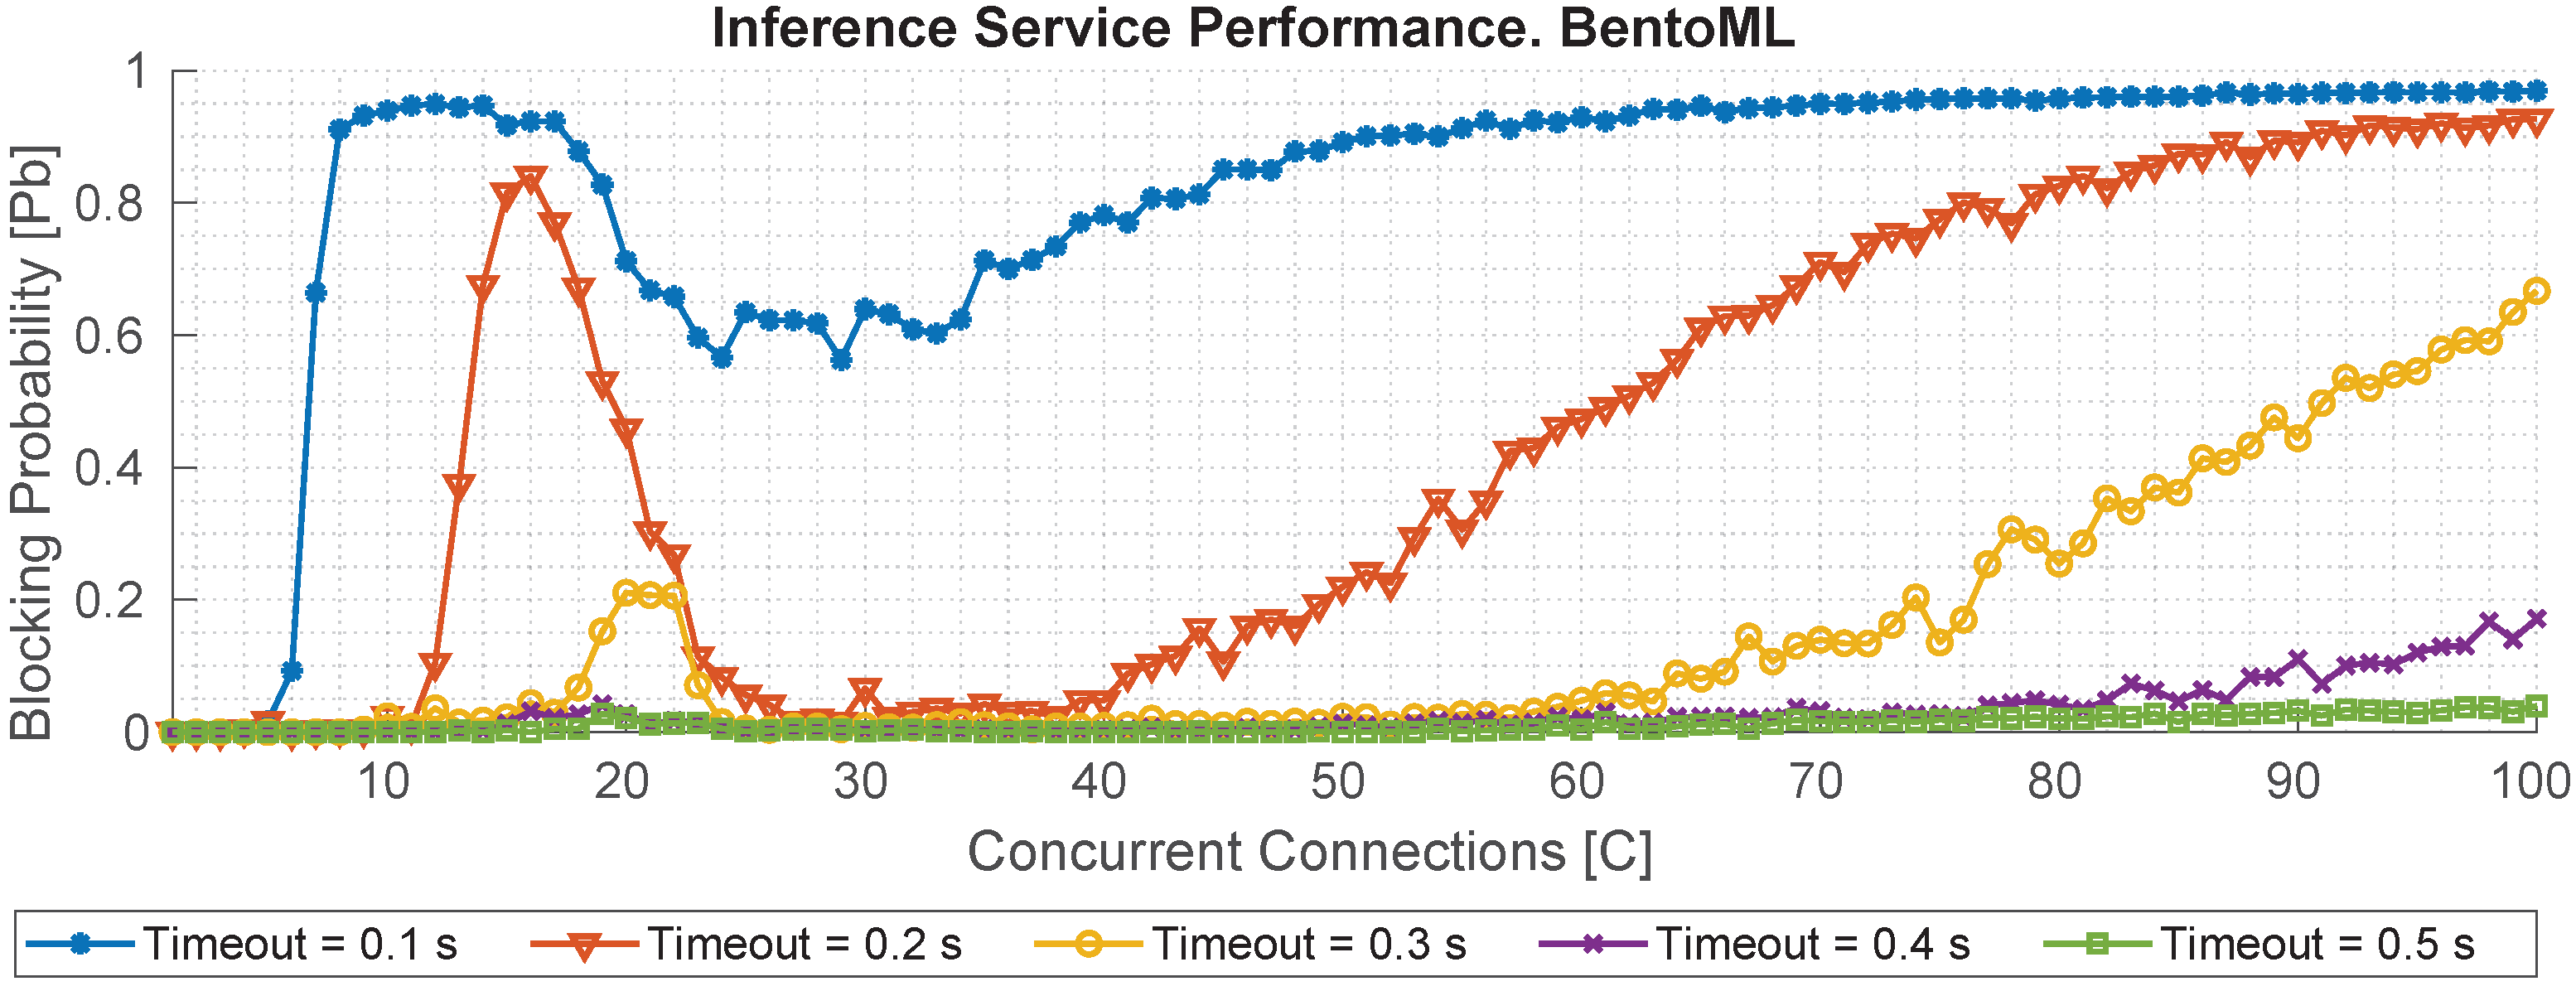
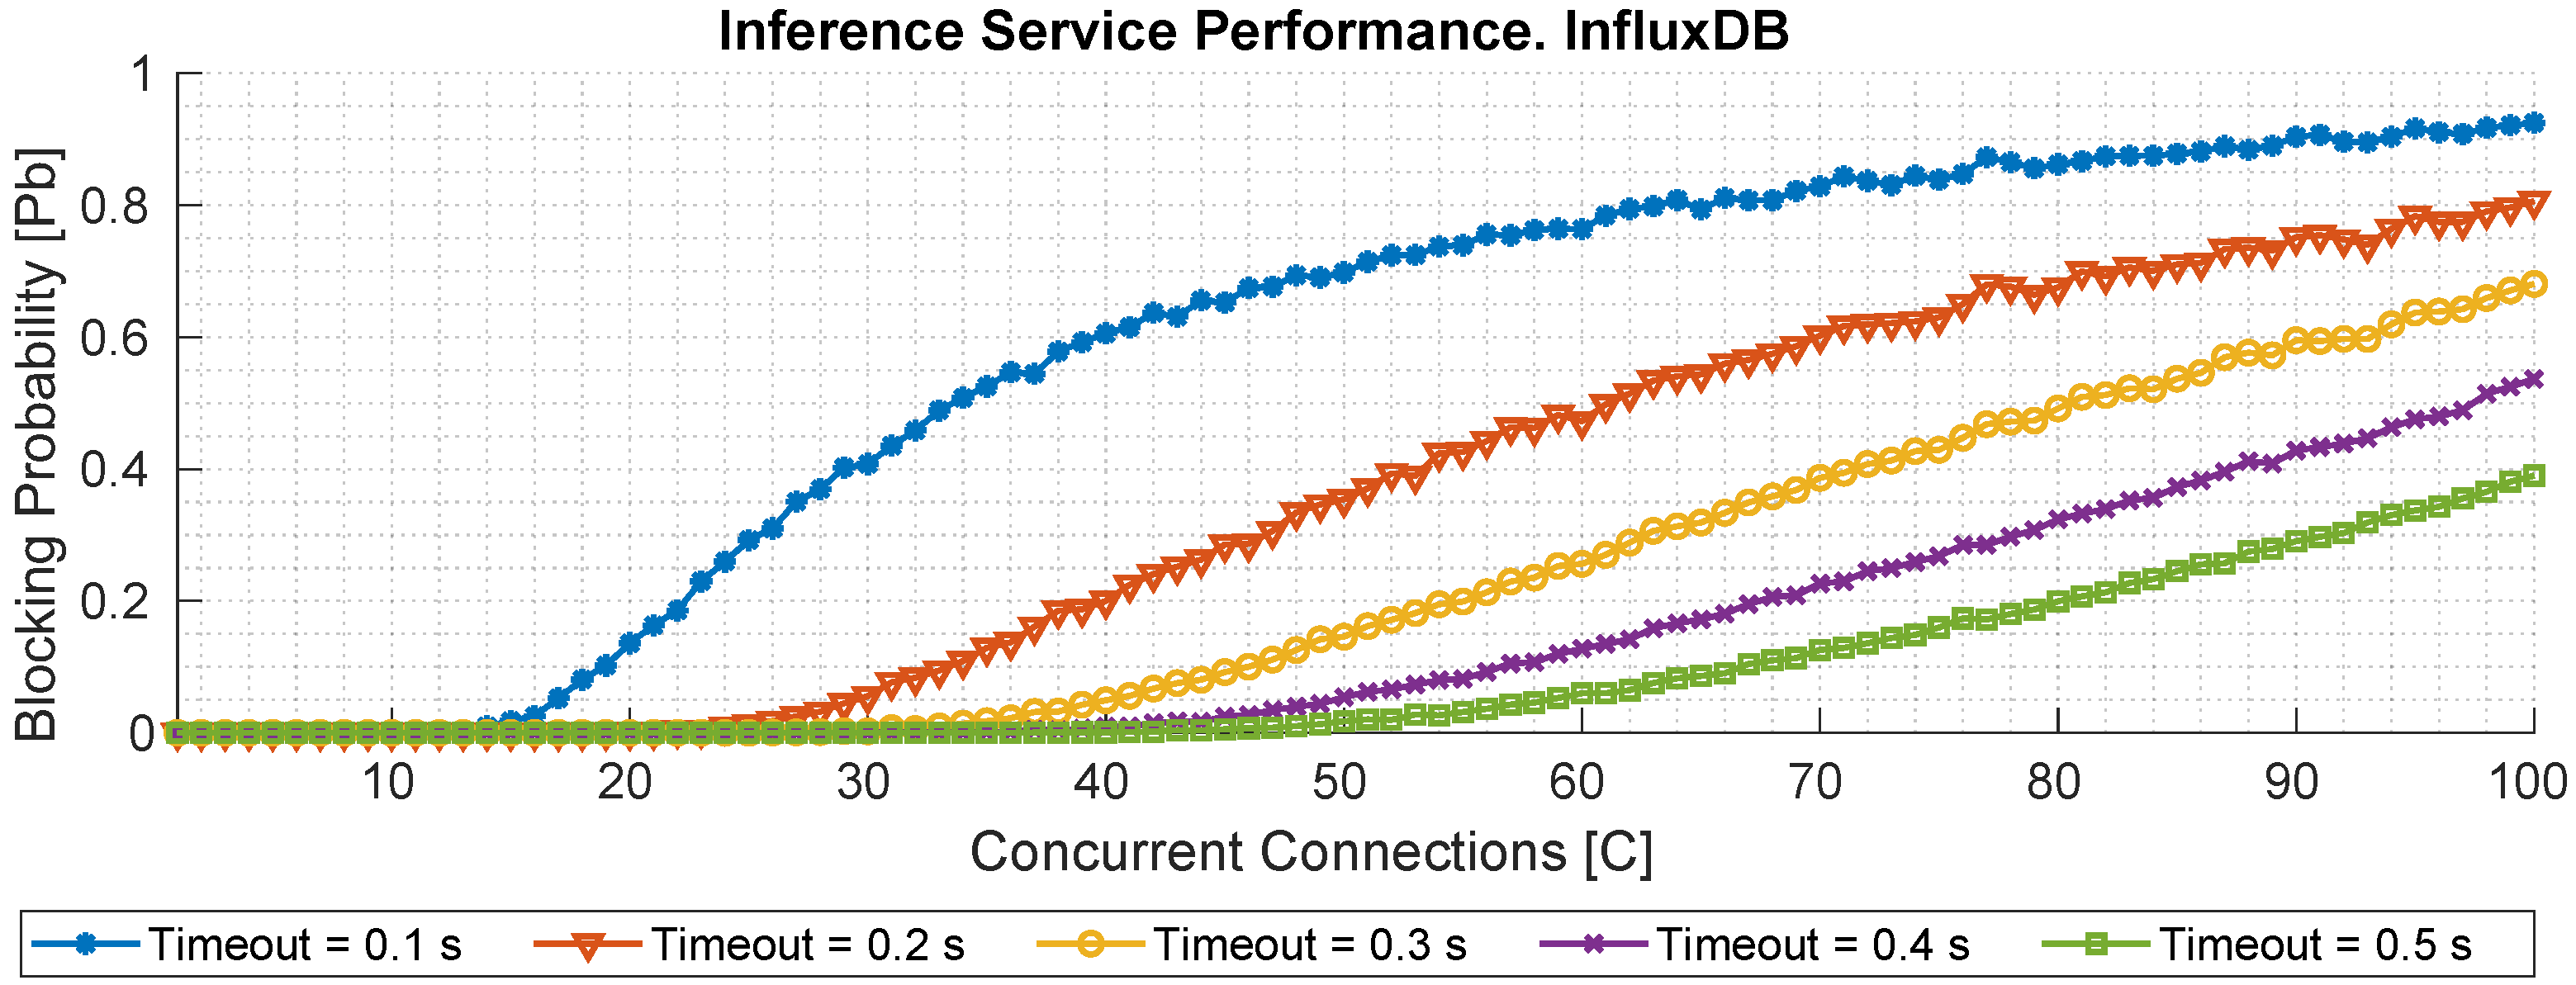
The following two figures complement the previous analysis by incorporating HTTP response codes into the evaluation. This enhancement enables the identification of successful and failed requests, where any status code other than 200 OK is considered a failure. Additionally, this study integrates QoS constraints by examining how the system behaves under different maximum response time thresholds (
), specifically from 0.1 to 0.5 s. To estimate the blocking probability (
) of each service, we compute the ratio between the number of failed requests (those with non-200 responses or those exceeding the
threshold) and the total number of requests. The results for both BentoML and InfluxDB are depicted in
Figure 14 and
Figure 15, respectively. In
Figure 14, each curve illustrates the evolution of
as a function of concurrent request load under varying QoS levels. The autoscaling mechanism of BentoML significantly mitigates
once more than one replica is deployed. For example, at
s,
drops from 0.9 with 15 concurrent requests to below 0.02 when the load ranges between 25 and 40 requests. This highlights the efficacy of autoscaling in maintaining service quality under increasing demand. However, for more stringent QoS thresholds (
s), even moderate loads lead to higher blocking probabilities, mainly due to the additional overhead introduced by the dynamic load balancer and the inherent computational time required by each inference, which, as shown previously, may reach up to 0.05 s even under minimal load.
In contrast,
Figure 15 displays the blocking probability analysis for the InfluxDB service. In this case, the behavior is more predictable and less sensitive to load variations. Although no autoscaling mechanism is employed, the database maintains a relatively stable performance, and its blocking probability increases gradually with the load. This confirms the robustness of InfluxDB for moderate querying workloads even in the absence of elastic scalability.
These results also provide an opportunity to contextualize the notion of QoS and real-time requirements in the IIoT domain. While the measured blocking probability and latency values indicate that the system can deliver consistent soft real-time performance, they do not guarantee the stringent determinism required by hard real-time industrial control loops. In this sense, the proposed architecture is well-suited for applications such as predictive maintenance, anomaly detection, and monitoring tasks, where sub-second responsiveness is sufficient to preserve operational efficiency. However, time-critical operations that demand bounded and deterministic delays in the order of milliseconds, such as closed-loop actuation, fall beyond the current scope of this framework.
5.3. Estimation of the Average Network Reconfiguration Time
This subsection presents the estimation of the average time required to complete a reconfiguration cycle of the proposed architecture. The reconfiguration process is triggered by the SDN controller implemented using the Ryu framework, which reacts to anomalous behaviors detected in the IIoT sensor network. To quantify the reconfiguration time, we decompose the process into its two principal time components: (i) the time needed by Ryu to access and retrieve the sensor data from the InfluxDB time series database, and (ii) the time required to send these data to the cloud-based inference service hosted via BentoML and obtain a classification result. Since both communication exchanges (Ryu → InfluxDB and Ryu → BentoML) have previously been characterized in terms of their average response times under concurrent workloads, we define the mean reconfiguration time, denoted
, as:
where
represents the average time required to retrieve the latest sensor readings from InfluxDB, and
denotes the average inference time of the BentoML service. These two operations encapsulate the dominant latencies in the reconfiguration loop.
Although an additional processing stage takes place within the Ryu controller—responsible for composing the request to the inference service and interpreting the returned result—this local computational effort involves a minimal number of Python operations (e.g., parsing and condition checking), and its execution time is negligible compared to the network communication and inference overhead. This becomes increasingly valid as the number of IIoT stations grows, as local operations do not scale proportionally with the number of sensors. Hence, the estimated serves as a realistic upper bound for the average time required to detect an anomaly and initiate a reconfiguration policy in the network, allowing responsive and scalable management in dynamic industrial environments.
6. Discussion
The experimental results presented in the previous section provide clear evidence in support to the main contributions of this work, demonstrating the feasibility and effectiveness of the proposed end-to-end continuum architecture for IIoT environments. The following sections elaborate on three complementary perspectives: (i) the strengths and key performance aspects of the architecture, which highlight the contributions of this work in comparison with similar proposals; (ii) the limitations and particularities of the emulated environments, which are expected to differ from real-world industrial settings; and (iii) the security considerations associated with deploying the proposed framework in critical IIoT domains, where confidentiality, authentication, and resilience to cyberattacks play a decisive role.
6.1. Performance and Strengths of the Proposed Architecture
First, the deployment analysis confirms that our microservice-oriented solution, orchestrated through Kubernetes, achieves fast initialization times and efficient service management. All core components—including Ryu, InfluxDB, Grafana, and BentoML—exhibit consistent behavior during deployment, with the overall setup fully operational in less than 270 s. These findings validate the practicality of the proposed infrastructure in scenarios requiring rapid provisioning or frequent redeployments.
Regarding resource utilization, we observe that memory consumption remains stable across all services, with predictable increases only in BentoML and InfluxDB as the number of simulated IIoT sensors increases. This trend is expected due to the higher computational and storage demands associated with inference and data ingestion in time series. CPU consumption, on the other hand, showcases the scalability of the system. BentoML in particular demonstrates effective dynamic scaling behavior: horizontal autoscaling is triggered under increasing load, leading to a more balanced distribution of CPU usage across replicas.
The latency evaluation further highlights the architecture’s ability to support soft real-time operations. The BentoML inference service, even under high concurrency, maintains an average response time below 350 ms, while InfluxDB consistently delivers sub-500 ms read latencies. The estimation of the mean reconfiguration time, approximately 800 ms, computed as the sum of average data access and inference durations, indicates that the system can react to network changes and anomalies with sub-second responsiveness. However, such delay values are more suitable for applications like predictive maintenance or anomaly detection, where near-real-time reaction is acceptable, rather than for closed-loop control tasks that typically require delays below tens of milliseconds. This contextualization is critical to understand the applicability of the proposed solution in different IIoT domains.
Additionally, the blocking probability analysis under different QoS thresholds reveals that autoscaling plays a key role in preserving service availability. BentoML’s blocking probability drastically decreases when the number of concurrent requests falls within the scaling threshold, underscoring the benefit of elastic service provisioning. InfluxDB maintains a relatively stable performance profile without scaling, confirming its robustness for read-heavy workloads.
To further substantiate the performance and strengths of the proposed architecture, we provide a qualitative comparison against two representative state-of-the-art approaches: (i) the SEGA framework [
19], which adopts Docker-based containerization for secured machine monitoring, and (ii) the PoC reference implementation [
10], which relies on traditional virtualization techniques for edge-cloud orchestration. By contrast, our proposal builds upon a microservice paradigm orchestrated with Kubernetes, providing a higher degree of elasticity and automation. This comparison is intentionally qualitative, as the architectural paradigms differ significantly and a direct numerical benchmarking would be misleading. Instead, the table below highlights relative characteristics in terms of reliability, redundancy, autoscaling capabilities, and resource consumption.
As
Table 8 indicates, the proposed Kubernetes-based microservice architecture stands out in terms of elasticity, automated redundancy, and scalability, while SEGA provides strong security and container-level modularity optimized for machine monitoring, and PoC highlights the robustness of traditional virtualization, albeit with higher overhead. This qualitative benchmarking underlines the relative advantages of the proposed approach within the broader landscape of IIoT architectural designs.
6.2. Limitations and Particularities of the Emulated Industrial Environment
The entire system has been implemented and validated on a high-performance server, relying on emulated wireless topologies that approximate realistic IIoT deployments. While this approach enables repeatable experimentation and controlled benchmarking, it inevitably introduces a gap with respect to real-world industrial networks. In particular, link models provided by emulation tools such as Mininet-WiFi cannot fully capture the deterministic and time-sensitive behavior of industrial field networks, including features such as bounded latency, guaranteed reliability, and traffic scheduling mechanisms characteristic of Time-Sensitive Networking (TSN). As a result, latency and jitter results reported here should be interpreted as indicative rather than definitive for industrial-grade deployments. The reproducibility of our results is guaranteed by the open-source release [
26] of all deployment scripts, implementation, and datasets. This ensures transparency, facilitates community adoption, and enables further extensions of this work by other researchers. Nonetheless, it is also important to acknowledge that several of the networking protocols cited in this work (e.g., 5G, WiMAX, Wi-Fi, and 6G) are either unavailable in certain industrial environments or still at a theoretical stage. In practice, many industrial deployments rely on private 5G backbones or dedicated wired infrastructures to guarantee service continuity. The reliability of the proposed architecture in scenarios with constrained or unreliable bandwidth is thus an open issue. Future work will extend the evaluation toward industrial-grade connectivity technologies and IIoT hardware, with a particular focus on TSN, redundant wired backbones, and consolidated fieldbus standards, to strengthen robustness under realistic communication constraints. Finally, while this work has focused on manufacturing-oriented IIoT scenarios, it is important to emphasize that the proposed architecture is not limited to this vertical. Potential extensions include its application to other critical domains such as smart energy grids, logistics, and healthcare, where the ability to combine cloud-edge collaboration, elastic scaling, and real-time monitoring could also provide significant benefits. Highlighting these additional scenarios broadens the applicability and impact of the framework, paving the way for future cross-domain validation.
6.3. Security Considerations in IIoT Deployments
While the primary focus of this work has been on performance, scalability, and orchestration, it is essential to acknowledge that security is a critical concern in industrial environments. In particular, mechanisms for ensuring data confidentiality, robust authentication, and resilience against cyberattacks are indispensable for the safe deployment of IIoT architectures. The proposed framework already benefits from the inherent isolation and modularity provided by containerized microservices orchestrated through Kubernetes. This enables the enforcement of access control policies, namespace isolation, and secure inter-service communication. Additionally, existing Kubernetes-native solutions, such as secrets management and role-based access control, can be directly integrated to strengthen authentication and authorization across the continuum.
Regarding confidentiality and integrity of the data, encrypted communication channels (e.g., Transport Layer Security (TLS) or Internet Protocol Security (IPsec)) can be employed to secure telemetry flows between sensors, edge nodes, and cloud services. Furthermore, the adoption of industrial standards for secure networking, including OPC UA Security and IEEE 802.1X, represents a promising direction to reinforce trust in data exchange. Finally, the resilience of the system to cyberattacks and failures can be enhanced through redundancy and rapid recovery mechanisms. The proposed architecture already supports active–standby strategies and autoscaling, which mitigate denial-of-service conditions and facilitate fast recovery from component failures. Future work will extend these aspects by exploring intrusion detection mechanisms tailored for IIoT traffic patterns, as well as formal resilience testing under fault-injection scenarios.
7. Conclusions
This work has presented a novel, fully containerized edge-cloud architecture designed to support adaptive and data-driven decision-making in IIoT environments. The proposed architecture addresses critical limitations identified in the state of the art, including the lack of end-to-end integration across the IIoT-edge-cloud continuum, the absence of runtime reconfiguration mechanisms based on online analytics, and the limited scalability and deployment readiness of existing prototypes.
Through a comprehensive experimental evaluation, several key findings have emerged. First, the system demonstrates rapid deployment capabilities, achieving full operational readiness in less than five minutes. Second, the architecture exhibits stable and efficient resource utilization, with predictable memory and CPU usage patterns across the microservices. Notably, the BentoML inference service benefits significantly from horizontal autoscaling, maintaining low response times even under high concurrent request loads. Furthermore, InfluxDB maintains low-latency data access throughout all experiments, highlighting its suitability for continuous monitoring in IIoT scenarios. This enables us to obtain the estimation of the average network reconfiguration time, derived from the combination of DB access and inference response times. Results indicate that the system can support sub-second reconfiguration cycles, essential for real-time adaptation in industrial deployments. Moreover, the blocking probability analysis under various QoS thresholds underscores the benefits of elastic scaling, as it substantially reduces the probability of service degradation under load.
Beyond its technical validation, this work introduces a disruptive architecture that bridges gaps in the literature by integrating inference, telemetry, and SDN control into a unified and reproducible framework by releasing the entire system and datasets as open source. Looking forward, future work will focus on two main directions. First, we aim to extend the validation towards industrial-grade connectivity technologies and IIoT hardware, with a particular focus on TSN, redundant wired backbones, and consolidated fieldbus standards. These additions will strengthen the robustness of the architecture under realistic communication constraints and further bridge the gap between emulated environments and operational industrial deployments. Second, we plan to explore the use of advanced SDN controllers, specifically TeraFlowSDN, in conjunction with a Programming Protocol-independent Packet Processors (P4) based southbound interface via P4Runtime. This shift from OpenFlow to P4 is motivated by the growing need for programmable data planes in industrial networks, where customized and deterministic packet processing can offer significant advantages. Leveraging programmable hardware compatible with P4 may unlock new opportunities for fine-grained control, performance optimization, and security enforcement in next-generation IIoT infrastructures.
In addition, while the current inference service is deployed in the cloud, where virtually unlimited computational resources can be assumed, the migration of this service toward the edge will be investigated in future work. Such a shift will necessarily impose constraints on computation and memory, and will therefore require a systematic study of alternative machine learning models (e.g., lightweight Deep Neural Networks (DNNs) or ensemble methods) to balance accuracy, inference latency, and resource consumption in constrained environments. Another important direction concerns the evaluation of the architecture with more representative datasets. In the present work, a publicly available dataset was employed primarily to validate the end-to-end orchestration and reconfiguration mechanisms. Although changing the dataset would not affect the latency of data movement across the architecture, it would directly impact the accuracy of the inference service. Thus, future work will consider heterogeneous and industrial-grade datasets to capture the variability and dynamics of real production environments, thereby increasing the external validity of the experimental results.
