Abstract
The expansion of Internet of Things (IoT) networks has enabled real-time data collection and automation across smart cities, healthcare, and agriculture, delivering greater convenience and efficiency; however, exposure to diverse threats has also increased. Machine learning-based Intrusion Detection Systems (IDSs) provide an effective means of defense, yet they require large volumes of data, and the use of raw IoT network data containing sensitive information introduces new privacy risks. This study proposes a novel privacy-preserving synthetic data generation model based on a tabular diffusion framework that incorporates Differential Privacy (DP). Among the three diffusion models (TabDDPM, TabSyn, and TabDiff), TabDiff with Utility-Preserving DP (UP-DP) achieved the best Synthetic Data Vault (SDV) Fidelity (0.98) and higher values on multiple statistical metrics, indicating improved utility. Furthermore, by employing the DisclosureProtection and attribute inference to infer and compare sensitive attributes on both real and synthetic datasets, we show that the proposed approach reduces privacy risk of the synthetic data. Additionally, a Membership Inference Attack (MIA) was also used for demonstration on models trained with both real and synthetic data. This approach decreases the risk of leaking patterns related to sensitive information, thereby enabling secure dataset sharing and analysis.
1. Introduction
Data containing personal information is increasingly utilized for advances in big data analysis and artificial intelligence. Article 89 of the European General Data Protection Regulation (GDPR) [1] outlines provisions for providing robust, high-quality knowledge to advance science and technology in areas such as education, health records, and official statistics. However, unprotected use of privacy information can lead to violations of rights like privacy information leakage or abuse. This is also becoming an issue in Internet of Things (IoT) networks, which are used across diverse domains. Using the vast amount of data from IoT networks has led to technological advancements, but it has also provided opportunities for attack. Intrusion Detection Systems (IDSs) [2] are designed to detect malicious attacks on networks or systems. They have shown great performance by utilizing machine learning and deep learning [3], using the abundant data from IoT networks. However, during the data-sharing process, this has led to new privacy risks, such as inferring sensitive information from datasets or re-identification. Therefore, all institutions that use privacy information need a method to prevent these threats in advance. Figure 1 shows an attack scenario where an attacker extracts sensitive information when using IoT network data for modeling.
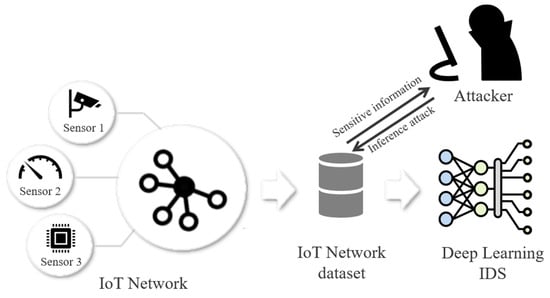
Figure 1.
An attack scenario for an IoT dataset containing sensitive information.
Synthetic data plays a key role in protecting privacy information while providing the necessary data for model training. Especially in IDSs, it can enhance detection of attacks on IoT networks by using synthetic data to augment rare or diverse attack types, which helps mitigate the data scarcity problem. Furthermore, when data containing sensitive information is synthesized, the identifying information within it is only partially generated. This allows for the protection of privacy at a certain level while providing users with maximum data utility.
Generative models learn to capture the underlying data distribution and generate synthetic data that closely resembles real datasets. A Generative Adversarial Network (GAN) [4] is a representative generative model composed of two neural networks. A generator that generates synthetic data and a discriminator that discriminates whether the data are real or synthetic have shown impressive performance in image generation. Prior studies [5,6] utilized Conditional Tabular GAN (CT-GAN) [7] to generate synthetic tabular datasets. However, GANs have critical limitations, such as mode collapse, non-convergence, and training instability [8], which can lead to incomplete distribution.
Diffusion models [9] consist of a forward process that progressively adds noise to data and a reverse process that progressively removes it. Unlike GANs, they allow for stable training within a single network and can accurately model complex, high-dimensional distributions by gradually denoising the data. This overcomes the limitations of GANs and enables the generation of high-quality data. Because of these advantages, diffusion models have achieved state-of-the-art results in the field of image generation, but they have received relatively less attention in tabular data. In contrast to image data, tabular data is complex and difficult to process because its features are heterogeneous, consisting of both categorical and numerical features. To address this, TabDDPM [10], TabSyn [11], and TabDiff [12] have been proposed to handle tabular data, enabling the generation of high-quality synthetic data.
While the generation of high-quality synthetic data provides privacy, a risk of sensitive information leakage still exists because the data is based on real data. Differential Privacy (DP) [13] is one of the techniques to prevent the leakage of sensitive information by adding noise to the data to ensure privacy-preserving. Prior work used CT-GAN for synthetic data generation and applied DP to protect sensitive information.
This study proposes training a tabular-based diffusion model on a dataset containing various attack types from an IoT environment. Based on the high-quality data generated by the diffusion model, a DP mechanism is applied to minimize privacy risk. A key challenge in preserving privacy is finding a solution that balances the trade-off between the potential for obtaining useful results from processing privacy information and the privacy risks that arise in the process. This trade-off is evaluated by assessing the quality of the synthetic data generated by the proposed method using utility and privacy metrics. This study demonstrates that a pipeline integrating Advanced DP and a high-quality synthetic data generator can be a solution to the problem of sensitive information leakage in IoT network datasets.
1.1. Research Contribution
This study makes the following key contributions:
- An IoT IDS specialized tabular diffusion pipeline is proposed. This work presents a domain-specific operational protocol that combines diffusion models with DP, positioning its contribution not as a new mechanism but as a reproducible integration design and an attacker centric evaluation.
- A DP combination strategy is designed. Synthetic data generated from the diffusion model is compared and analyzed after applying various DP mechanisms to find the most effective one.
- An integrated evaluation metric is established to quantify the utility–privacy trade-off. Distribution similarity (e.g., Kolmogorov–Smirnov Test (KST), Jensen–Shannon Divergence (JSD), Wasserstein) and Synthetic Data Vault (SDV) Fidelity are adopted as utility metrics, while DisclosureProtection, attribute inference and Membership Inference Attack (MIA) are used as a privacy metric.
- Focusing on the MQTT-IoT-IDS2020 dataset, this study aims to demonstrate the pipeline’s excellence and verify its generalizability and robustness by performing cross-validation on other IoT datasets.
1.2. Paper Structure
The rest of this article is organized as follows: Section 2 introduces generative models for synthetic data generation and DP mechanisms for privacy-preserving. Section 3 reviews the methodology, including the diffusion model used to achieve the research objectives and the metrics used for evaluation. Section 4 evaluates the results of the proposed methodology by measuring its utility and privacy risk. Section 5 discusses the significance and findings of the proposed methodology. Finally, Section 6 summarizes the overall study and provides future research directions.
2. Related Works
To minimize privacy risks, recent studies have explored applying DP either during the training of deep learning-based synthetic data generators or directly to the generated datasets. This section introduces approaches aimed at ensuring privacy guarantees while maintaining high-quality synthetic data generation.
2.1. Limitations of CT-GAN
GANs generate synthetic data that resembles real data through the adversarial training of a generator and a discriminator. CT-GAN is tailored for tabular data containing a mixture of categorical and continuous features. This characteristic allows them to generate high-quality datasets. Prior work [6] proposed Utility-Preserving DP (UP-DP), which maintains the trade-off between utility and privacy, to preserve the semantics of the real data while protecting against privacy risk. Applying this to a CT-GAN generated high-quality IoT network data. Comparing the statistical metrics before and after applying DP, this approach minimized the difference in utility and showed better defense performance in privacy risk. However, GAN-based approaches have structural limitations: mode collapse, where the diversity of outputs drops sharply and only a few outcomes are produced, non-convergence, where training oscillates or diverges instead of reaching equilibrium, and instability that arises when gradients vanish. To address these limitations, we conducted the same experiment using a tabular based diffusion model with a stable learning method.
2.2. Data Generation Using Diffusion Model
The diffusion model mitigates the limitations of GANs by generating high-quality synthetic data. It consists of a forward process that progressively adds noise and a reverse process that removes it. The forward process of Equation (1) is a Markov chain that adds Gaussian noise step-by-step using the noise schedule ; at each step , the previous state is corrupted to generate .
The reverse process of Equation (2) is the process of recovering data from noise. It generates the synthetic data by progressively denoising from step to step .
While diffusion models have achieved state-of-the-art status in image generation, there is no established methodology for tabular data, and research in this direction is ongoing.
Compared with images, tabular data exhibit far more complex and diverse distributions [14]; as the number of columns increases, estimating the full joint distribution becomes increasingly challenging. Moreover, tabular data have a mixed modality, including continuous (numerical) features and categorical (discrete) features.
2.3. Differential Privacy
DP provides well-founded mathematical guarantees that statistical analysis and machine learning with sensitive datasets will not expose individual-level information. It protects sensitive information from re-identification or attribute-inference attacks [15], ensuring that analysis results are nearly invariant to whether a particular data point is included. Let , denote adjacent datasets that differ in exactly one record. A randomized mechanism M satisfies -DP if, for all measurable sets . Here, ε denotes the privacy budget, and δ bounds the probability of an exceptional failure of the guarantee. Equation (3) defines the DP equation.
DP is used not only for simple datasets but also to protect the privacy of data used in machine learning model training. The application of DP is typically divided into two categories: one that ensures privacy by applying it during model training to control the influence of training data (e.g., DP-Stochastic Gradient Descent [16]), and another that protects sensitive information by applying DP after data generation (e.g., Laplace, Exponential, Piecewise, and UP-DP).
In this process, a strong application of DP to a training model leads to a decrease in the quality of the real data. Conversely, improving the quality of the real data results in a decline in privacy performance, creating a trade-off. Therefore, research is needed to reduce this trade-off between utility and privacy.
2.4. Privacy-Preserving Synthetic Data for IoT-IDS
The performance of IDSs designed to enhance security in IoT environments is heavily dependent on the quality of their training data. However, collecting diverse attack data from IoT networks presents significant practical constraints, including potential service disruptions, high costs, and extensive time consumption. To address these challenges, research focused on generating synthetic training data from models that mimic real systems has gained attention. A framework for generating synthetic data for Denial-of-Service attack detection has been proposed using a Markov Decision Process model to simulate optimal attack paths [17]. While this foundational study demonstrated the viability of model-based synthetic data for IDS training, it did not explicitly address the critical issue of privacy preservation. Raw network data, even when used to build a model, often contains sensitive information, and generating data based on its distribution may inadvertently leak private patterns or expose individuals.
3. Methodology
This section introduces the datasets, implementation environment, generative models, and evaluation metrics used in this study. Section 3.1 describes the IoT network datasets used for training and validation. Section 3.2 details the hardware and software environment to ensure reproducibility. Section 3.3 and Section 3.4 then provide a detailed description of the diffusion models and the DP mechanisms, respectively. Section 3.5 defines the utility and privacy metrics used to evaluate the quality and security of the generated data.
3.1. IoT Network Dataset
This study utilizes the MQTT-IoT-IDS2020 [18,19] dataset as the primary basis for analysis and employs two additional standard datasets, TON-IoT [20] and CSE-CIC-IDS2018 [21], for validation to ensure the generalizability of the findings.
3.1.1. MQTT-IoT-IDS2020 Dataset
This study used the MQTT-IoT-IDS2020 dataset. Data was collected by recording Ethernet traffic using tcpdump and exporting the packets as pcap files, with tools such as Nmap, VLC, and MQTT-PWN utilized in the process. The dataset includes attacks on IoT networks such as aggressive scan (Scan A), User Datagram Protocol (UDP) scan (Scan sU), and Sparta Secure Shell (SSH) brute force (Sparta). It contains a total of 15 features and 238,678 data, with an equal ratio of attack and normal data. Table 1 shows the description of each feature.

Table 1.
Description of MQTT-IoT-IDS2020 dataset.
3.1.2. Validation Datasets
To validate the generalizability of the proposed pipeline, we utilized two additional IoT network datasets, TON-IoT and CSE-CIC-IDS2018, which have distinct characteristics from the primary MQTT-IoT-IDS2020 dataset.
The TON-IoT dataset integrates network and system logs with IoT sensor telemetry data collected from various platforms. It provides detailed classifications of modern attack scenarios, including Scanning, DoS, DDoS, and Ransomware. Furthermore, its inclusion of application-layer data, such as HTTP and DNS, in addition to network flows, makes it suitable for multifaceted validation.
The CSE-CIC-IDS2018 dataset is based on network traffic and system logs from an enterprise environment. It processes captured traffic to generate over 80 sophisticated flow features, including transmission rates and packet length statistics. The dataset also encompasses complex attack scenarios such as Brute Force, Botnet, and Infiltration.
Thus, as these two datasets represent different network architectures, protocols, and attack vectors, they play a crucial role in cross-validating the results obtained from the MQTT-IoT-IDS2020 dataset. This process is essential for demonstrating that the proposed methodology is not overfitted to a specific data environment.
3.2. Implementation Environment
All experiments in this study were conducted in a specific hardware and software environment to ensure reproducibility. The detailed specifications of our experimental setup, including hardware components, software libraries, and model hyperparameters, are summarized in Table 2.

Table 2.
Specifications of the Implementation Environment.
3.3. Synthetic Dataset Using Diffusion Model
In Section 1, we discussed the challenges of tabular data modeling and proposed Tabular based diffusion, which is suitable for the mixed-type features of our dataset, as a solution. In this section, we describe the architecture and theoretical principles of the diffusion model used in our dataset.
TabDDPM introduces diffusion-based tabular data generation, using Gaussian noise for numerical and multinomial noise for categorical features. For preprocessing, a Quantile Transformer [22] is used to normalize continuous numerical features, while One-Hot Encoding is applied to normalize categorical features. Especially during the noise-removing reverse process, categorical features are processed with softmax and trained Kullback–Leibler Divergence (KLD) Loss.
TabSyn is a methodology that synthesizes tabular data by leveraging a diffusion model within latent space crafted by a Variational Auto Encoder (VAE) [23]. It adopts a latent diffusion architecture in which a VAE embeds mixed-type data into a continuous latent space. A score-based diffusion model is then used to learn the density of the continuous latent embedding () obtained from the VAE. The forward process involves progressively adding Gaussian noise to the latent vector ( over time to transform it into a pure noise vector . Equation (4) defines the variable (.
The reverse process learns the inverse transformation of the forward process. Starting from pure noise, it progressively removes noise to generate a new latent vector . This process (5) can be expressed as solving a Stochastic Differential Equation (SDE).
TabDiff is a unified diffusion framework that learns the multimodal joint distribution of tabular data in a single model. Equation (6) is the forward process of TabDiff.
The noise is added to all features over time, with the rate of noise injection increasing as time, , progresses from 0 to 1. For numerical features , a SDE is used to add Gaussian noise according to a noise schedule . For each categorical feature , a masking technique is used to gradually replace the real data with a special MASK token, also based on the noise schedule . The use of an adaptively learnable noise schedule for each feature allows noise to be added at an optimal rate tailored to the characteristics of each column, which enables the generation of more accurate data.
Equation (7) shows the reverse process of TabDiff. Numerical features are recovered to their original values through an Ordinary Differential Equation (ODE) update that estimates the current amount of noise and removes it step-by-step. Categorical features are UNMASKED, reversing the masking applied in the forward process. Specifically, during the unmasking process at each step, a stochastic sampling method is applied. This method re-applies a very weak mask and then recovers the value, which helps to correct any incorrectly recovered values.
3.4. DP Mechanism with Synthetic Data
This section introduces the DP mechanisms applied to the synthetic data generated by the models described in Section 2.3, with the main objective of minimizing the utility-privacy trade-off. For this purpose, Laplace, Exponential, Piecewise, and UP-DP mechanisms were applied to each synthetic dataset, and a detailed description of UP-DP, which showed the best performance, is provided. Table 3 presents a brief description of the DP mechanisms other than UP-DP.

Table 3.
Description of DP Mechanism.
The UP-DP precisely controls noise injection based on smooth sensitivity when applying the Laplace mechanism to categorical data and the Gaussian mechanism to continuous data. After noise injection, data utility is more effectively restored through Quantile Matching and Dynamic Kolmogorov–Smirnov (KS) Adjustment processes. Quantile Matching restores statistical distortion by aligning the distribution of the noisy data to the quantiles of the real data, with a small amount of jittering added to prevent overfitting. Dynamic KS Adjustment measures the distribution similarity between real and synthetic data using the KST. If the difference between the two distributions exceeds a threshold, it adjusts the values to be within a specific bin, thereby increasing similarity to the original distribution. Through these processes, UP-DP effectively improves upon the limitations of the utility-privacy trade-off found in traditional DP mechanisms by minimizing the loss of utility while ensuring privacy. Figure 2 illustrates the structure of the diffusion-based DP pipeline proposed in this study. The pipeline classifies the IoT network dataset into categorical and numerical features and trains a tabular diffusion model on it. Subsequently, DP is applied to the generated dataset, and its similarity to the original data is measured using statistical metrics while its effectiveness in reducing privacy risk against various attacks is evaluated.
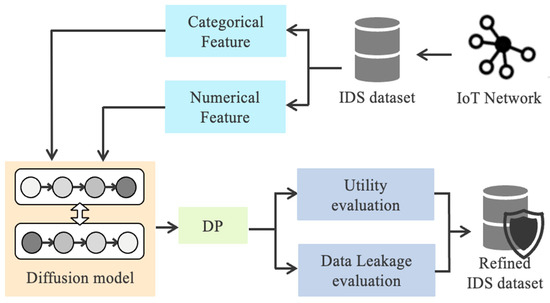
Figure 2.
An overview of the proposed diffusion-based DP methodology.
3.5. Utility and Privacy Metrics
This section evaluates the results of applying DP to each synthetic dataset, based on utility and privacy. To evaluate the quality of the synthetic data, we introduce statistical and structural metrics. For privacy, we show the actual leakage of sensitive information.
3.5.1. Utility Metrics
The utility of the synthetic data was evaluated by comparing its statistical similarity to real data using various metrics. In previous research, the utility of synthetic data was evaluated using the KST, JSD, and Wasserstein distance. A summary of these metrics is provided in Table 4.

Table 4.
Description of statistical metrics.
However, statistical evaluation metrics have the disadvantage of representing all features at once without considering the structure of tabular data, which obscures distinct modes of model failure into a single uninterpretable score [24,25].
SDV Fidelity [26] evaluates the Fidelity of synthetic data, that is, how well it reproduces the distribution and patterns of real data, by comparing it with the real data based on its statistical features and dimensions. Column Fidelity as defined in Equation (8) calculates each column. For numerical features, KST is used to measure the difference in their distributions, while for categorical features, Total Variation Distance (TVD) is used to compare their distributions.
Row Fidelity of Equation (9) is a metric that measures the relationships between attribute pairs. Pearson correlation coefficients are used for numerical features, while for categorical features, TVD and contingency tables are applied. A contingency table is a concept that organizes the frequency of combinations for two categorical variables into a table.
The overall Fidelity score of Equation (10) is calculated as an equally weighted average of Column Fidelity and Row Fidelity. Using SDV Fidelity enables a more precise analysis of tabular data characteristics that traditional statistical metrics do not capture.
3.5.2. Privacy Metrics
Privacy metrics are indicators that evaluate how well a synthetic dataset protects privacy against privacy risks. In this study, the DisclosureProtection metric provided by SDMetrics [27], attribute inference and MIA are used to demonstrate effectively the generated synthetic dataset defends against privacy risks.
The attribute inference is an attack that uses public or unknown attributes to infer sensitive information. The attacker uses k-Nearest Neighbors to infer the sensitive information in the dataset most similar to these known attributes. Especially, k is set to 1 since averaging multiple neighbors can decrease accuracy. This approach simulates the most intuitive and effective type of inference attack and is suitable for conservatively evaluating the privacy risk of synthetic data.
DisclosureProtection evaluates whether an attacker who knows some quasi-identifiers in the real data can infer a sensitive attribute by consulting an accessible synthetic dataset. The metric uses the Correct Attribution Probability (CAP). For each query, it finds in the synthetic data the equivalence class defined by the known values. If that combination does not exist, it selects the closest match by Hamming distance, then computes the frequency of the target sensitive value within the class. The final score is the average probability of correct attribution. Values near 1 indicate strong protection against leakage, while values near 0 indicate high leakage risk. The detailed procedure appears in Algorithm 1.
| Algorithm 1. The Algorithm of CAP-based DisclosureProtection to calculate a known column. | |
| Input: | |
| Output: | |
| 1: | |
| 2: | |
| 3: | : Find known column |
| 4: | |
| 5: | Find closest match instead of exact match using hamming distance |
| 6: | |
| 7: | Score = (incorrect predictions)/(total predictions) |
| 8: | |
A MIA [28,29,30] is a technique that determines whether a specific data point was used in a machine learning model’s training, that is, whether it is a member. Machine learning models tend to memorize data during training, so the output distribution for members and non-members differs even for the same input. Attackers exploit this difference in distribution to infer membership. MIAs are primarily conducted in a black box setting, where an attacker has no knowledge of the model’s structure and can only access its outputs. To overcome the limitations of a black-box environment, the shadow model is a concept introduced to replicate and train the target model’s learning behavior. The dataset is classified into members, which are used for training, and non-members, used for validation and testing. As the model becomes more overfit, it shows a lower loss for members and a relatively higher loss for non-members. This difference in loss clarifies the distributional difference, making membership information easier to leak. Therefore, to maximize the accuracy of the attack, overfitting is intentionally induced in the experiment. A MIA performance is typically evaluated using Area Under the Curve-Receiver Operating Characteristic (AUC-ROC). The ROC curve plots the True Positive Rate (TPR) against the False Positive Rate (FPR). The area under the ROC curve is known as the AUC. As the AUC value approaches 1, the distinction between members and non-members is made more effectively, while a value closer to 0.5 indicates performance close to random guessing.
4. Experimental Results
This section evaluates the utility preservation of the proposed pipeline using both statistical metrics and structural metrics. A privacy risk evaluation is also applied, based on the most effective DP mechanism, to demonstrate its robustness against sensitive information leakage. The evaluation is conducted primarily on the MQTT-IoT-IDS2020 dataset, with the findings subsequently validated on the TON-IoT and CSE-CIC-IDS2018 datasets to confirm their generalization.
4.1. Utility Metrics Results
The statistical similarity of synthetic data generated by TabDDPM, TabSyn, and TabDiff was evaluated by comparing with real data using KST, JSD, and Wasserstein distance. For KST, a higher value indicates better performance, while for JSD and Wasserstein, a lower value indicates better performance.
The results are presented in Table 5, Table 6, Table 7 and Table 8. Notably, TabDiff with UP-DP in Table 6 confirmed the best similarity, achieving KST 0.98, JSD 0.07, and Wasserstein 0.01. This demonstrates that TabDiff generates synthetic data most similar to the real data, and that applying UP-DP minimizes the degradation of utility. When UP-DP was used, both CT-GAN and the diffusion models demonstrated high performance while preserving utility. However, when compared to the real data, the diffusion models showed better results than CT-GAN. This indicates that diffusion models can generate higher quality data than synthetic data created by CT-GAN, suggesting that the structural limitations of GANs present clear limitations on data generation. In conclusion, the performance of utility depends solely on the model used to generate synthetic data, as a model with better performance can maintain higher utility.

Table 5.
Performance of CT-GAN on statistical utility metrics.

Table 6.
Performance of TabDDPM on statistical utility metrics.

Table 7.
Performance of TabSyn on statistical utility metrics.

Table 8.
Performance of TabDiff on statistical utility metrics.
To compensate for the limitations of statistical metrics, SDV Fidelity was introduced to evaluate the synthetic data. Figure 3 shows a graph measuring SDV Fidelity for synthetic data generated by CT-GAN, TabDDPM, TabSyn, and TabDiff under each DP mechanism applied. All three diffusion models achieved the highest score without DP, and the scores were closest to this with UP-DP. Conversely, the scores dropped in the order of Laplace, Exponential, and Piecewise. These results, including those from the statistical metrics, suggest that while DP degrades utility, UP-DP minimizes this degradation in similarity compared to other DP mechanisms.
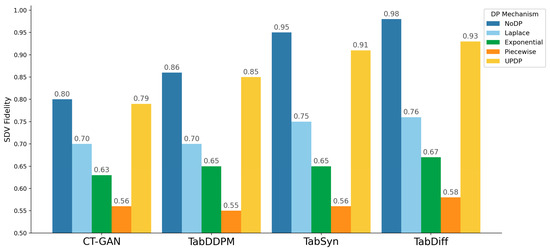
Figure 3.
SDV Fidelity when applying DP to TabDDPM, TabSyn, and TabDiff.
Figure 4 shows a heatmap comparing the KST and TVD scores of each feature for TabDDPM, TabSyn, and TabDiff, with and without UP-DP. The results show that TabDDPM, TabSyn and TabDiff exhibited minimal changes across all features before and after applying UP-DP. This indicates that UP-DP effectively preserves the characteristics of the real data. Additionally, compared with TabDDPM, TabSyn and TabDiff, which generate higher quality data, showed higher scores.
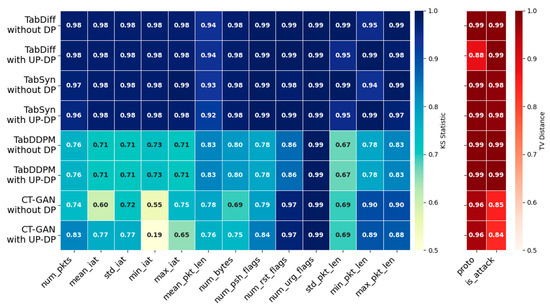
Figure 4.
A heatmap of the KST and TVD per feature for different synthetic data. The color intensity represents the metric value (left: KST, right: TVD), with darker colors indicating values closer to 1.
4.2. Privacy Metrics Results
Privacy risk metrics measure how well the proposed method preserves privacy using DisclosureProtection, attribute inference, and MIA. Based on the results of the prior utility metrics, UP-DP was selected for its ability to generate synthetic data most similar to the real data. To determine the degree of improvement in preventing sensitive information leakage, the DisclosureProtection and attribute inference scores of synthetic data generated by TabDDPM, TabSyn and TabDiff are compared before and after UP-DP. A MIA was performed on a simple model, such as a Multi-Layer Perceptron (MLP), which was trained on the synthetic data. Figure 5, Figure 6 and Figure 7 show the evaluation of the DisclosureProtection score for 14 features.
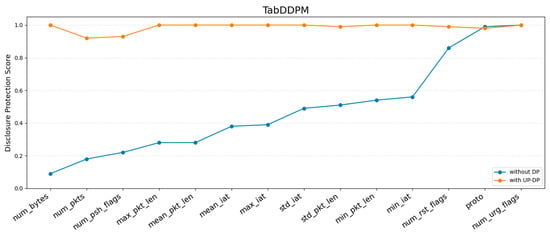
Figure 5.
The sensitive information leakage scores of TabDDPM with and without UP-DP.
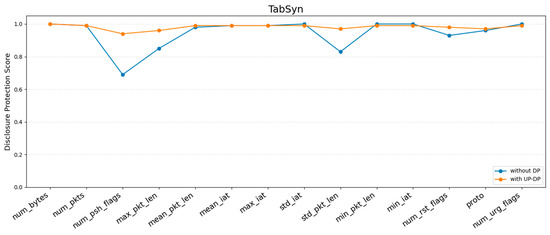
Figure 6.
The sensitive information leakage scores of TabSyn with and without UP-DP.
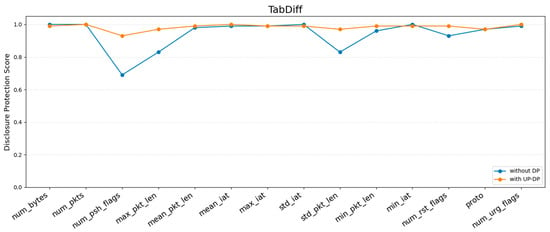
Figure 7.
The sensitive information leakage scores of TabDiff with and without UP-DP.
Figure 5 shows the DisclosureProtection evaluation for each feature of the synthetic data generated by TabDDPM. With DP, many features had scores lower than 0.5, with num_bytes showing a score of 0.09. This indicates that most features could potentially leak sensitive information. However, after applying UP-DP, all features improved to above 0.9, which demonstrates an effect similar to that of sharing random values.
Figure 6 and Figure 7 present the CAP-based DisclosureProtection scores for each feature of TabSyn and TabDiff. Even without DP, both models showed a generally stronger level of protection compared to TabDDPM, with most features scoring above 0.5. With the application of UP-DP, all features surpassed 0.9, demonstrating a robust performance against sensitive information inference in both numerical and categorical columns. While the difference was not significant, TabDiff exhibited a slightly better performance than TabSyn. This suggests that high-quality synthetic data leads to slightly stronger privacy. Overall, these results imply that generative quality raises the privacy floor, and UP-DP further pushes the protection level close to its maximum.
Figure 8 compares the DisclosureProtection scores for TabDDPM, TabSyn, and TabDiff focusing on the top 5 features that exhibited the most significant changes with and without UP-DP. For all models, the DisclosureProtection score approaches 1.0 after applying UP-DP, demonstrating its effectiveness against sensitive information leakage. TabDDPM exhibited the largest changes in top 5 features with UP-DP, whereas TabSyn and TabDiff showed no significant difference.
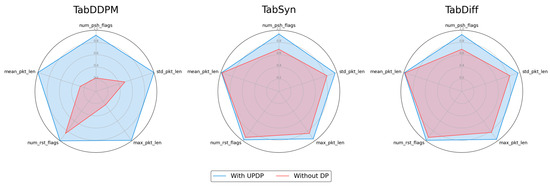
Figure 8.
Comparison of DisclosureProtection on the top 5 most impacted features.
Table 9 compares the attribute inference results for TabDDPM, TabSyn, and TabDiff to highlight the effectiveness of UP-DP. Without DP, all models recorded a score of 0.98, and all consistently reduced the attribute inference risk when DP was applied. While TabDDPM lowered the attribute inference score from 0.98, TabSyn reduced it to 0.34, and TabDiff to 0.33. This shows that TabSyn and TabDiff, which generate higher-quality data than TabDDPM, are also more effective at mitigating privacy risks.

Table 9.
Performance of Attribute Inference.
Figure 9 shows the results of a MIA on an MLP model. An MLP is suitable for evaluating MIA because its simple architecture is prone to overfitting, which highlights differences in output distributions, and it is easy to reproduce. For this attack, all target and shadow models were trained for 200 epochs, and we utilized an ensemble of 3 shadow models to effectively train the attack classifier. The models were trained separately on the real dataset and on synthetic data generated by applying UP-DP to TabDDPM, TabSyn, and TabDiff, respectively. For the model trained on the unprotected original (Real) data, the AUC score was 0.9530. This means the attack was successful to a near-perfect degree, revealing a critical privacy vulnerability where the model severely “memorizes” the training data, leading to the near-complete exposure of membership information. In contrast, the proposed pipeline greatly mitigated this risk. When UP-DP was applied, the AUC scores decreased to 0.5507 for TabDDPM and 0.5504 for TabSyn, while TabDiff achieved the lowest score of 0.5198. Notably, TabDiff’s score is extremely close to the random guess baseline of 0.5, proving its outstanding defense performance that nearly neutralizes the attacker’s inference ability. This demonstrates that secure protection of datasets is essential to counter privacy-violating attacks such as MIA.
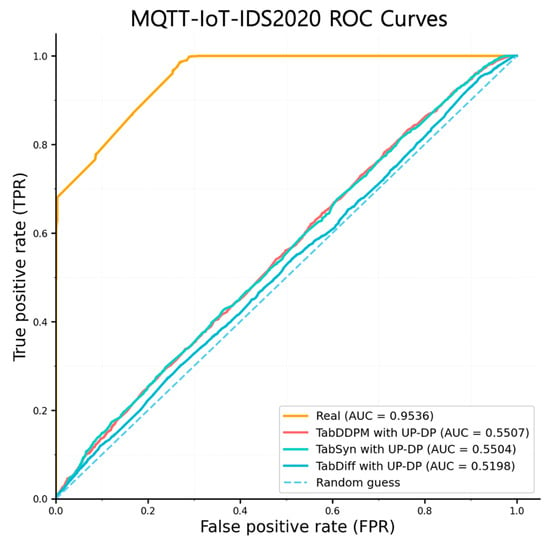
Figure 9.
ROC curve of a MIA on real, TabDDPM, TabSyn, and TabDiff.
4.3. Validation on Additional Datasets
To validate the findings from our primary dataset, MQTT-IoT-IDS2020, and to demonstrate the pipeline’s generalizability, we performed additional validation on the TON-IoT and CSE-CIC-IDS2018 datasets. For a concise and impactful comparison, we used SDV Fidelity for data utility and MIA for privacy risk as our representative metrics.
Figure 10 and Figure 11 show the SDV Fidelity when applying each DP mechanism to CT-GAN, TabDDPM, TabSyn, and TabDiff on the two datasets, TON-IoT and CSE-CIC-IDS2018. Consistent with the results from the primary dataset, UP-DP achieved consistently higher scores than other DP mechanisms across all model and dataset combinations, minimizing the degradation in utility. This indicates that the proposed pipeline can generate high-quality synthetic data that preserves the structure of the original data, regardless of the unique characteristics or complexity of the dataset.
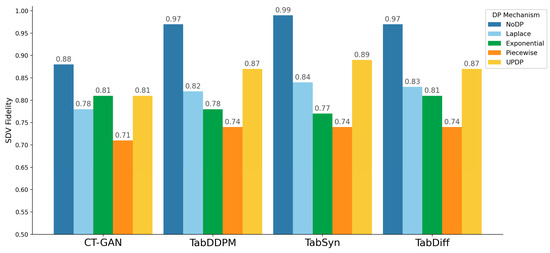
Figure 10.
SDV Fidelity when applying DP to TabDDPM, TabSyn, and TabDiff on TON-IoT dataset.
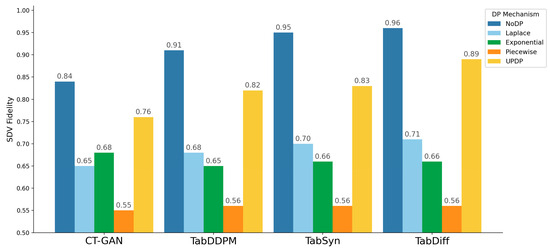
Figure 11.
SDV Fidelity when applying DP to TabDDPM, TabSyn, and TabDiff on CSE-CIC-IDS2018 dataset.
Figure 12 shows the MIA results for the two validation datasets, TON-IoT and CSE-CIC-IDS2018. Models trained on real data showed AUCs of 0.8380 and 0.9845, respectively, revealing severe personal information leakage vulnerabilities. Particularly on the CSE-CIC-IDS2018 dataset, this indicates near-perfect attack success, analyzed to stem from over 80 features in that dataset causing extreme model overfitting. This result clearly demonstrates the necessity of robust privacy protection mechanisms in sensitive IoT data environments.
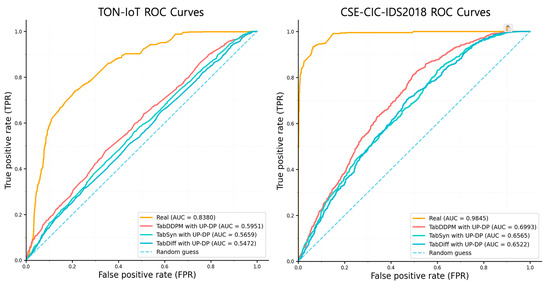
Figure 12.
ROC curve results of a MIA on real, TabDDPM, TabSyn, and TabDiff on TON-IoT and CSE-CIC-IDS2018 dataset.
In contrast, the proposed pipeline effectively mitigated these MIA risks. A consistent performance improvement was observed across both datasets, with AUC scores gradually decreasing from TabDDPM to TabSyn and then to TabDiff. The combination of TabDiff and UP-DP, which demonstrated the best performance, significantly lowered the AUC score to 0.5472 on TON-IoT and to 0.6522 on the extremely vulnerable CSE-CIC-IDS2018 dataset. Although the score on CSE-CIC-IDS2018 did not quite reach 0.5, considering the extreme initial risk level of 0.9845, this represents highly significant performance.
In conclusion, the consistently demonstrated defensive capability across three distinct datasets proves that the proposed methodology is a robust and generalized solution applicable to diverse IoT environments.
5. Discussion
This study showed the effectiveness of privacy-preserving by generating synthetic data using a diffusion model and DP on multiple IoT network datasets. This section discusses the quality of the synthetic data and its effectiveness against privacy leakage, as measured by utility and privacy metrics. Maintaining a balance between privacy and utility is the most important aspect when generating synthetic data. Previous studies [31,32] have identified a significant drop in data utility as a major limitation when applying DP. DP-Stochastic Gradient Descent (DP-SGD) [33,34,35] is easily integrated into standard training pipelines, but it suffers from performance degradation due to noise injection and gradient clipping and is highly sensitive to hyperparameters such as batch size and noise multiplier [36,37]. We experimentally confirmed that applying UP-DP can preserve utility and reduce privacy risk. Furthermore, since UP-DP is applied to the data after generation, while DP-SGD is applied during training, their evaluation metrics and outputs differ, making a direct comparison difficult. Therefore, we excluded it from the quantitative comparison in this study and limited its mention to the discussion and related work sections.
To demonstrate this, the study evaluated CT-GAN, TabDDPM, TabSyn, and TabDiff using the KST, JSD, and Wasserstein metrics. The utility evaluation showed that the diffusion models were superior to CT-GAN. While large language models [38,39,40] are actively being researched for generating tabular data, they have limitations. Issues like prompt sensitivity and structural distortion can arise during the tokenization process [41,42]. Given their nature as text-based sequence processors, these models struggle to fully capture the complex interdependencies within mixed categorical and continuous data. Furthermore, the substantial computational resources required for large-scale model training and inference restrict their applicability in certain IoT and edge environments. In contrast, the diffusion model used in this study reflects the unique characteristics of tabular data. It incorporates stepwise Gaussian noise injection and removal for continuous data and a process of progressive masking and restoration for categorical data. This approach allows for more detailed modeling of the data’s intrinsic structure and the dependencies between variables. In this regard, our study’s combination of a diffusion model and column-wise UP-DP provides a practical alternative in terms of reproducibility, resource efficiency, and structural validity.
When applied with UP-DP, the results showed that TabDDPM, TabSyn, and TabDiff performed well compared to CT-GAN. TabDiff was particularly superior, demonstrating significantly better performance by achieving scores of KST 0.98, JSD 0.07, and Wasserstein 0.01. Even with SDV Fidelity, a metric that reflects how faithfully each feature is reproduced based on the structure of the tabular data, the combination of TabDiff and UP-DP was superior when UP-DP was applied; the difference compared to synthetic data without DP was only 0.01. These trends of preserving high utility were consistently observed in the validation datasets as well, confirming that applying UP-DP to synthetic data generated by TabDiff can minimize the loss of utility.
Based on the superior utility of the diffusion models, DisclosureProtection, attribute inference, and MIA were used to evaluate the privacy risk of TabDDPM, TabSyn, and TabDiff. In the case of TabDDPM, the DisclosureProtection showed that without DP, 11 features scored near 0.5, indicating a potential risk of sensitive information leakage. However, after applying UP-DP, all features showed scores near or above 0.9. This demonstrates that UP-DP effectively protects against sensitive information leakage. TabSyn and TabDiff showed scores of almost 0.9 or higher for all but a few features, even without DP. After applying UP-DP, all scores approached a maximum of 1.0. For attribute inference, all models recorded a score of 0.98 without DP, indicating a privacy risk. However, with UP-DP, TabDDPM, TabSyn, and TabDiff achieved scores of 0.40, 0.34, and 0.33, respectively. This suggests that high-quality synthetic data further enhances privacy protection, and that UP-DP significantly reduces the utility–privacy trade-off gap. Similarly, the robust privacy protection of the proposed methodology was consistently demonstrated on the TON-IoT and CSE-CIC-IDS2018 datasets. The best-performing combination, TabDiff with UP-DP, recorded an AUC of 0.5472 on TON-IoT and 0.6522 on CSE-CIC-IDS2018. Notably for the CSE-CIC-IDS2018 dataset, considering the original data’s extreme vulnerability (AUC of 0.9845), the significant reduction in the AUC score to 0.6522 demonstrates that the proposed methodology provides a meaningful defense even in a highly challenging environment. In conclusion, this suggests that our pipeline, which applies UP-DP to high-quality synthetic data, can effectively protect training data from privacy risks across datasets with diverse characteristics.
6. Conclusions
This study proposes a pipeline that uses diffusion models to generate a synthetic dataset for an IoT network and then applies DP. By using TabDDPM, TabSyn, and TabDiff, which are specialized for tabular data, the pipeline mitigates the limitations of conventional GANs and generates data that closely resembles the real data. Furthermore, it utilizes UP-DP to protect privacy without significantly degrading utility.
In the utility evaluation using statistical metrics (KST, JSD, and Wasserstein) and the structural metric (SDV Fidelity), TabDiff showed scores indicating high similarity to the real data. When used with UP-DP, the loss of utility was the least.
Furthermore, the privacy risk of the synthetic data was validated using DisclosureProtection, attribute inference and MIA. In the DisclosureProtection, while some features showed a potential to expose sensitive information without DP, all models archived scores of 0.9 or higher with UP-DP. Similarly, attribute inference also showed a score of 0.9 without DP but achieved a significantly lower score. This demonstrates that the proposed pipeline can be an effective solution for mitigating privacy risks in IDSs that handle sensitive information. For the MIA, the real dataset showed an ROC curve of 0.8, indicating that a specific data point could be easily identified as a member and thus demonstrating a very high privacy risk. In contrast, TabDDPM, TabSyn, and TabDiff with UP-DP applied showed a decrease in their ROC curve values, which signifies a reduced ability to distinguish training data. TabDiff showed a score close to 0.5, demonstrating a significant reduction in privacy risk.
The core contribution of this work is demonstrating that the proposed pipeline’s superior performance is not confined to a single environment. Validation against the TON-IoT and CSE-CIC-IDS2018 datasets, which feature different network and attack scenarios, confirmed the method’s robustness and generalizability. Across these diverse environments, key metrics such as SDV Fidelity and MIA consistently showed high data utility and strong privacy protection.
In conclusion, this study confirms that a tabular-based synthetic data generation pipeline with DP is a highly effective approach that satisfies both utility and privacy in IoT networks. This research provides a crucial foundation for secure data sharing and analysis in fields where both privacy and high-quality data are paramount, such as healthcare and education.
For future work, to more rigorously verify the utility and safety of synthetic datasets from specific domains containing sensitive information, we plan to utilize existing attack techniques such as Training Data Extraction [43], Re-identification [44], and Reconstruction [45] to conduct a multifaceted analysis of utility and privacy risk metrics. This will allow for a more effective analysis of the key trade-off between utility and privacy in DP mechanisms.
Author Contributions
Conceptualization, J.K. and Y.S.; methodology, J.K. and Y.S.; software, J.K., E.S. and J.C.; validation, J.K., E.S. and J.C.; formal analysis, J.K., S.P., J.C. and Y.S.; investigation, J.K., E.S. and J.C.; resources, J.K. and S.P.; data curation, J.K. and S.P.; writing—original draft preparation, J.K., J.C. and E.S.; writing—review and editing, J.K. and Y.S.; visualization, J.K., E.S. and J.C.; supervision, Y.S.; project administration, Y.S.; funding acquisition, Y.S. All authors have read and agreed to the published version of the manuscript.
Funding
This research was supported by the MSIT (Ministry of Science and ICT), Korea, under the ITRC (Information Technology Research Center) support program (IITP-2025-2020-0-01789), and the Artificial Intelligence Convergence Innovation Human Resources Development (IITP-2025-RS-2023-00254592) supervised by the IITP (Institute for Information & Communications Technology Planning & Evaluation). This work was supported by the Commercialization Promotion Agency for R&D Outcomes (COMPA) grant funded by the Korea government (Ministry of Science and ICT) (2710086167).
Institutional Review Board Statement
Not applicable.
Informed Consent Statement
Not applicable.
Data Availability Statement
The network dataset MQTT-IoT-IDS2020 is publicly available and can be downloaded from: https://ieee-dataport.org/open-access/mqtt-iot-ids2020-mqtt-internet-things-intrusion-detection-dataset (accessed on 21 July 2025). The TON-IoT datasets are publicly available and can be downloaded from: https://research.unsw.edu.au/projects/toniot-datasets (accessed on 23 September 2025), and the CSE-CIC-IDS2018 dataset is provided by the Canadian Institute for Cybersecurity (CIC) and can be accessed at: https://www.unb.ca/cic/datasets/ids-2018.html (accessed on 23 September 2025).
Conflicts of Interest
The authors declare no conflicts of interest.
References
- Anande, T.J.; Al-Saadi, S.; Leeson, M.S. Generative Adversarial Networks for Network Traffic Feature Generation. Int. J. Comput. Appl. 2023, 45, 297–305. [Google Scholar] [CrossRef]
- Awajan, A. A Novel Deep Learning-Based Intrusion Detection System for IoT Networks. Computers 2023, 12, 34. [Google Scholar] [CrossRef]
- Alqarni, A.A.; El-Alfy, E.-S.M. Improving Intrusion Detection for Imbalanced Network Traffic Using Generative Deep Learning. Int. J. Adv. Comput. Sci. Appl. 2022, 13, 959–967. [Google Scholar] [CrossRef]
- Goodfellow, I.J.; Pouget-Abadie, J.; Mirza, M.; Xu, B.; Warde-Farley, D.; Ozair, S.; Courville, A.; Bengio, Y. Generative Adversarial Nets. Adv. Neural Inf. Process. Syst. 2014, 27, 2672–2680. [Google Scholar] [CrossRef]
- Alabdulwahab, S.; Kim, Y.-T.; Seo, A.; Son, Y. Generating Synthetic Dataset for ML-Based IDS Using CTGAN and Feature Selection to Protect Smart IoT Environments. Appl. Sci. 2023, 13, 10951. [Google Scholar] [CrossRef]
- Alabdulwahab, S.; Kim, Y.-T.; Son, Y. Privacy-Preserving Synthetic Data Generation Method for IoT-Sensor Network IDS Using CTGAN. Sensors 2024, 24, 7389. [Google Scholar] [CrossRef]
- Xu, L.; Skoularidou, M.; Cuesta-Infante, A.; Veeramachaneni, K. Modeling Tabular Data using Conditional GAN. Adv. Neural Inf. Process. Syst. 2019, 32, 7333–7343. [Google Scholar] [CrossRef]
- Mescheder, L.; Geiger, A.; Nowozin, S. Which Training Methods for GANs do Actually Converge? In Proceedings of the 35th International Conference on Machine Learning (ICML 2018), Stockholm, Sweden, 10–15 July 2018; PMLR: Stockholm, Sweden, 2018; pp. 3481–3490. [Google Scholar] [CrossRef]
- Ho, J.; Jain, A.; Abbeel, P. Denoising Diffusion Probabilistic Models. Adv. Neural Inf. Process. Syst. 2020, 33, 6840–6851. [Google Scholar] [CrossRef]
- Kotelnikov, A.; Baranchuk, D.; Rubachev, I.; Babenko, A. TabDDPM: Modelling Tabular Data with Diffusion Models. In Proceedings of the 40th International Conference on Machine Learning (ICML 2023), Honolulu, HI, USA, 23–29 July 2023; PMLR: Honolulu, HI, USA, 2023. [Google Scholar] [CrossRef]
- Zhang, H.; Zhang, J.; Srinivasan, B. Mixed-Type Tabular Data Synthesis with Score-based Diffusion in Latent Space. In Proceedings of the International Conference on Learning Representations (ICLR 2024), Vienna, Austria, 7–11 May 2024; OpenReview: Vienna, Austria, 2024; pp. 1–21. [Google Scholar] [CrossRef]
- Shi, J.; Xu, M.; Hua, H.; Zhang, H.; Ermon, S.; Leskovec, J. TabDiff: A Mixed-type Diffusion Model for Tabular Data Generation. In Proceedings of the International Conference on Learning Representations (ICLR 2025), Singapore, 24–28 April 2025; OpenReview: Singapore, 2025. [Google Scholar] [CrossRef]
- Dwork, C. Differential Privacy. In Proceedings of the 33rd International Colloquium on Automata, Languages and Programming (ICALP 2006), Part II., Venice, Italy, 10–14 July 2006; Lecture Notes in Computer Science; Springer: Berlin, Heidelberg, 2006; Volume 4052, pp. 1–12. [Google Scholar] [CrossRef]
- Vadim, B. Language Models are Realistic Tabular Data Generators. arXiv 2022, arXiv:2210.06280. [Google Scholar] [CrossRef]
- Richter, H.; Chen, Z.; Stutzman, F. Inferring Private Information Using Social Network Data. In Proceedings of the 18th International Conference on World Wide Web (WWW 2009), Madrid, Spain, 20–24 April 2009; ACM: New York, NY, USA, 2009; pp. 771–780. [Google Scholar] [CrossRef]
- Song, S.; Chaudhuri, K.; Sarwate, A.D. Stochastic gradient descent with differentially private updates. In Proceedings of the 2013 IEEE Global Conference on Signal and Information Processing (GlobalSIP), Austin, TX, USA, 3–5 December 2013; pp. 245–248. [Google Scholar] [CrossRef]
- Arnaboldi, L.; Morisset, C. Generating Synthetic Data for Real World Detection of DoS Attacks in the IoT. In Federation of International Conferences on Software Technologies: Applications and Foundations; Springer International Publishing: Cham, Switzerland, 2018. [Google Scholar] [CrossRef]
- Hindy, H.; Brosset, D.; Bayne, E.; Seeam, A.K.; Tachtatzis, C.; Atkinson, R.; Bellekens, X. A Taxonomy of Network Threats and the Effect of Current Datasets on Intrusion Detection Systems. Appl. Sci. 2020, 10, 5355. [Google Scholar] [CrossRef]
- Hindy, H.; Tachtatzis, C.; Atkinson, R.; Belle, E.; Bures, M.; Tair, A.; Shojafar, M.; Loukas, G. Machine Learning Based IoT Intrusion Detection System: An MQTT Case Study (MQTT-IoT-IDS2020 Dataset). In Proceedings of the International Networking Conference (INC 2020), Plymouth, UK, 24–26 June 2020; Springer: Cham, Switzerland, 2020; pp. 297–308. [Google Scholar] [CrossRef]
- Alsaedi, A.; Moustafa, N.; Tari, Z.; Mahmood, A.; Anwar, A. TON_IoT Telemetry Dataset: A New Generation Dataset of IoT and IIoT for Data-Driven Intrusion Detection Systems. IEEE Access 2020, 8, 165130–165150. [Google Scholar] [CrossRef]
- Leevy, J.L.; Khoshgoftaar, T.M. A survey and analysis of intrusion detection models based on CSE-CIC-IDS2018 Big Data. J. Big Data 2020, 7, 104. [Google Scholar] [CrossRef]
- Pedregosa, F.; Varoquaux, G.; Gramfort, A.; Michel, V.; Thirion, B.; Grisel, O.; Blondel, M.; Prettenhofer, P.; Weiss, R.; Dubourg, V.; et al. Scikit-learn: Machine Learning in Python. J. Mach. Learn. Res. 2011, 12, 2825–2830. [Google Scholar] [CrossRef]
- Kingma, D.P.; Welling, M. Auto-Encoding Variational Bayes. arXiv 2013, arXiv:1312.6114. [Google Scholar] [CrossRef]
- Bozkir, E.; Lopez-Paz, D.; Ghahramani, Z. Evaluating Generative Models for Tabular Data: Novel Metrics and Benchmarking. arXiv 2025, arXiv:2504.20900. [Google Scholar] [CrossRef]
- Theis, L.; Oord, A.V.; Bethge, M. A note on the evaluation of generative models. arXiv 2015, arXiv:1511.01844. [Google Scholar] [CrossRef]
- Hudovernik, V.; Jurković, M.; Štrumbelj, E. Benchmarking the Fidelity and Utility of Synthetic Relational Data. arXiv 2024, arXiv:2410.03411. [Google Scholar] [CrossRef]
- DataCebo, Inc. SDMetrics: A Synthetic Data Evaluation Library. Available online: https://docs.sdv.dev/sdmetrics/ (accessed on 22 August 2025).
- Shokri, R.; Stronati, M.; Song, C.; Shmatikov, V. Membership Inference Attacks Against Machine Learning Models. In Proceedings of the 2017 IEEE Symposium on Security and Privacy (SP), San Jose, CA, USA, 22–26 May 2017; pp. 3–15. [Google Scholar] [CrossRef]
- Duan, J.; Kong, F.; Wang, S.; Shi, X.; Xu, K. Are Diffusion Models Vulnerable to Membership Inference Attacks? In Proceedings of the 40th International Conference on Machine Learning (ICML 2023), Honolulu, HI, USA, 23–29 July 2023; pp. 8717–8730. [Google Scholar]
- Niu, J.; Liu, P.; Zhu, X.; Shen, K.; Wang, Y.; Chi, H.; Shen, Y.; Jiang, X.; Ma, J.; Zhang, Y. A survey on membership inference attacks and defenses in machine learning. Inf. Intell. 2024, 10, 404–454. [Google Scholar] [CrossRef]
- Hittmeir, M.; Mayer, R.; Ekelhart, A. A Baseline for Attribute Disclosure Risk in Synthetic Data. In Proceedings of the Tenth ACM Conference on Data and Application Security and Privacy (CODASPY 2020), New Orleans, LA, USA, 16–18 March 2020; ACM: New York, NY, USA, 2020; pp. 11–22. [Google Scholar] [CrossRef]
- Carlini, N.; Hayes, J.; Nasr, M.; Jagielski, M.; Sehwag, V.; Tramer, F.; Balle, B.; Ippolito, D.; Wallace, E. Extracting Training Data from Diffusion Models. In Proceedings of the 32nd USENIX Security Symposium (USENIX Security 23), Anaheim, CA, USA, 14–18 August 2023; USENIX Association: Berkeley, CA, USA, 2023; pp. 2326–2343. [Google Scholar] [CrossRef]
- Abadi, M.; Chu, A.; Goodfellow, I.; McMahan, H.B.; Mironov, I.; Talwar, K.; Zhang, L. Deep Learning with Differential Privacy. In Proceedings of the 2016 ACM SIGSAC Conference on Computer and Communications Security (CCS ’16), Vienna, Austria, 24–28 October 2016; ACM: New York, NY, USA, 2016; pp. 308–318. [Google Scholar] [CrossRef]
- Rajkumar, A.; Agarwal, S. A Differentially Private Stochastic Gradient Descent Algorithm for Multiparty Classification. In Proceedings of the Fifteenth International Conference on Artificial Intelligence and Statistics (AISTATS 2012). Proceedings of Machine Learning Research, La Palma, Canary Islands, 21–23 April 2012; Volume 22, pp. 933–941. Available online: https://proceedings.mlr.press/v22/rajkumar12.html (accessed on 16 September 2025).
- Truda, G. Generating Tabular Datasets under Differential Privacy. arXiv 2023, arXiv:2308.14784. [Google Scholar] [CrossRef]
- Bagdasaryan, E.; Poursaeed, O.; Shmatikov, V. Differential privacy has disparate impact on model accuracy. Adv. Neural Inf. Process. Syst. 2019, 32, 15453–15462. [Google Scholar]
- Sander, T.; Stock, P.; Sablayrolles, A. Tan without a burn: Scaling laws of dp-sgd. In Proceedings of the International Conference on Machine Learning, Honolulu, HI, USA, 23–29 July 2023; PMLR: Honolulu, HI, USA, 2023; pp. 29937–29949. [Google Scholar]
- Naveed, H.; Khan, A.U.; Qiu, S.; Saqib, M.; Anwar, S.; Usman, M.; Akhtar, N.; Barnes, N.; Mian, A. A Comprehensive Overview of Large Language Models. arXiv 2023, arXiv:2307.06435. [Google Scholar] [CrossRef]
- Brown, T.B.; Mann, B.; Ryder, N.; Subbiah, M.; Kaplan, J.; Dhariwal, P.; Neelakantan, A.; Shyam, P.; Sastry, G.; Askell, A.; et al. Language Models are Few-Shot Learners. arXiv 2020, arXiv:2005.14165. [Google Scholar] [CrossRef]
- Fang, X.; Xu, W.; Tan, F.A.; Zhang, J.; Hu, Z.; Qi, Y.; Nickleach, S.; Socolinsky, D.; Sengamedu, S.; Faloutsos, C. Large Language Models (LLMs) on Tabular Data: Prediction, Generation, and Understanding—A Survey. arXiv 2024, arXiv:2402.17944. [Google Scholar] [CrossRef]
- Xu, S.; Lee, C.-T.; Sharma, M.; Yousuf, R.B.; Muralidhar, N.; Ramakrishnan, N. Why LLMs Are Bad at Synthetic Table Generation (and What to Do About It). arXiv 2024, arXiv:2406.14541. [Google Scholar] [CrossRef]
- Recasens, P.G.; Gutierrez, A.; Torres, J.; Berral, J.L.; Halimi, A.; Fraser, K. In-Context Bias Propagation in LLM-Based Tabular Data Generation. arXiv 2025, arXiv:2506.09630. [Google Scholar] [CrossRef]
- Sarmin, F.J.; Sarkar, A.R.; Wang, Y. Synthetic data: Revisiting the privacy-utility trade-off. Int. J. Inf. Secur. 2025, 24, 156. [Google Scholar] [CrossRef]
- Adams, T.; Birkenbihl, C.; Otte, K.; Ng, H.G.; Rieling, J.A.; Näher, A.F.; Sax, U.; Prasser, F.; Fröhlich, H. On the fidelity versus privacy and utility trade-off of synthetic patient data. iScience 2025, 28, 111535. [Google Scholar] [CrossRef]
- Liu, S.; Wang, Z.; Chen, Y.; Lei, Q. Data Reconstruction Attacks and Defenses: A Systematic Evaluation. arXiv 2024, arXiv:2402.09478. [Google Scholar] [CrossRef]
Disclaimer/Publisher’s Note: The statements, opinions and data contained in all publications are solely those of the individual author(s) and contributor(s) and not of MDPI and/or the editor(s). MDPI and/or the editor(s) disclaim responsibility for any injury to people or property resulting from any ideas, methods, instructions or products referred to in the content. |
© 2025 by the authors. Licensee MDPI, Basel, Switzerland. This article is an open access article distributed under the terms and conditions of the Creative Commons Attribution (CC BY) license (https://creativecommons.org/licenses/by/4.0/).