Abstract
Many transportation structures collapse or sustain severe damage as a result of natural disasters such as earthquakes, floods, wars, and similar attacks. These collapsed or severely damaged structures must be rebuilt and returned to service as quickly as possible. Water is used in the mix for cement-bound concrete roads. It is known that drought problems are emerging due to climate change and that water resources are rapidly depleting. Significant amounts of water are used in concrete production, further depleting water resources. In order to contribute to the elimination of these two problems, the usability of polyurethane resin binder in road pavement construction was investigated. Polyurethane resin binder road pavement is a new type of pavement that does not contain cement or bitumen as binders and does not contain water in its mixture. This new type of road pavement can be opened to traffic within 5–15 min. After determining the aggregate and binder mixture ratios, four different curing methods were applied to the created samples. After the curing, the samples were subjected to compression test, flexural test, Bohme abrasion test, freeze–thaw test, bond strength by pull-off test, ultrasonic pulse velocity (UPV) test, SEM-EDX analysis, XRD analysis, and FT-IR analysis. The new type of road pavement created within the scope of this study exhibited a compression strength of 41.22 MPa, a flexural strength of 25.32 MPa, a Bohme abrasion value of 0.99 cm3/50 cm2, a freeze–thaw test mass loss per unit area of 0.77 kg/m2, and an average bond strength by pull-off value of 4.63 MPa. It was observed that these values ensured the road pavement specification limits.
Keywords:
road pavement; polyurethane resin; compression and flexural test; Bohme abrasion test; freeze-thaw test; ultrasonic pulse velocity (UPV) test; bond strength by pull-off test; scanning electron microscopy (SEM)-Energy dispersive X-ray (EDX) spectroscopy analysis; X-ray diffraction (XRD) analysis; Fourier transform infrared (FT-IR) spectroscopy analysis 1. Introduction
Many transportation structures collapse or sustain severe damage as a result of natural disasters such as earthquakes, floods, wars, and similar attacks. These collapsed or severely damaged structures must be rebuilt and returned to service as quickly as possible. Transportation problems arise when highways are severely damaged and rendered inoperable after an earthquake. Road pavements traditionally used for the reconstruction of demolished or severely damaged highways after an earthquake have been bitumen- or cement-based. Road pavements made with either binder are typically opened to traffic within 3–24 h. In this study, a new road pavement was created using a polyurethane resin binder and aggregate. This pavement can be opened to traffic within 5–15 min after production.
Another important aspect of this study is that water is not used in the pavement production mix during road pavement construction. Water is used in the mix for cement-bound concrete roads. It is known that drought problems are emerging due to climate change and that water resources are rapidly depleting. Significant amounts of water are used in concrete production, further depleting water resources. This study has introduced a new type of pavement that does not contain cement or bitumen as binders and does not contain water in the mix. Consequently, the two most important objectives of this study are as follows:
- In road pavements that have been destroyed or severely damaged after natural disasters, the pavement is cured in 5–15 min and opened to traffic.
- In today’s world where water resources are rapidly decreasing, absolutely no water was used in the construction of the new type of road pavement produced in this study.
Polyurethane resin-bound road paving is a new type of paving that does not contain cement or bitumen as binders and does not contain water in the mixture. The binder used in the mixture is a two-component polyurethane resin. In the production of polyurethane resin-bound road paving, the mixture is composed of two materials: polyurethane resin and aggregate.
Polyurethane resins fall into the thermoset group of plastics. Due to the rigidity of thermosets, their elastic modulus and strength are higher than those of other polymer types (thermoplastics and elastomers). Thermoset materials form a strong structure after curing. Polyurethanes have high heat and corrosion resistance. Polyurethanes were first isolated by German scientist Otto Bayer in 1937. Immediately after World War II, the United Kingdom and the United States adopted the German polyurethane synthesis method and implemented it in industrial production. Significant cost reductions led to a significant increase in the use of polyurethanes. Between the 1950s and 1960s, the United States, Germany, and the United Kingdom were important contributors to the development of polyurethanes. By the late 1960s, the polyurethane industry experienced more rapid growth. In the 2000s, polyurethanes were used in the development of high-performance porous and water-resistant elastic flooring and similar applications. Polyurethanes are durable, lightweight, and processable. Because they combine the strength and hardness of metals with the flexibility of rubber, they have replaced metals, plastics, and rubber in engineering. The two main components of polyurethane resin are the resin (polyol) and the hardener (isocyanate). Polyurethane resins of various consistencies can be obtained by mixing the two [1,2,3]. Today, multifaceted research is being conducted on polyurethanes.
In a study by [4], an innovative polyurethane thin coating was developed for the maintenance of existing roads and the construction of new ones. The study indicated that significant improvements were observed in functional properties and environmental performance compared to traditional tunnel lining materials. Composite structures formed with polyurethane material have high thermal insulation properties [5]. In a study, the flexural strength of glass fiber-reinforced polyurethane-faced sandwich beams is investigated. The study concluded that glass fiber further increased the flexural strength of the samples [6]. In another study, the design of polyurethane concrete for rapid repair of concrete in the anchorage area of expansion joints is optimized. The study indicated that the new type of concrete yielded positive results [7]. A type of fatigue-resistant, elastic polyurethane concrete by adding waste rubber particles to polyurethane concrete to address fatigue damage issues in bridge girders, expansion joints, and road surfaces is designed by [8].
A new type of highly chemically resistant coating system designed for concrete and metal substrates was designed by [9]. The study concluded that coatings based on polyurethane and epoxy resins can be used in environments affected by sewage and aggressive chemical environments. The study explained that the developed coating systems exhibited better properties than the compared reference coatings [9]. The synthesis and characterization of polyurethane resins are investigated by [10]. The study indicated that flexible and rigid structures can be formed with different mixing ratios of polyurethane resins [10]. A study experimentally demonstrated the corrosion resistance of polyurethane coatings [11]. An experimental study concluded that polyurethanes have high adhesion to surfaces they contact [12]. The load-carrying capacity of a severely deteriorated concrete manhole cover using polyurethane is evaluated by [13]. The study found that the repair method restored up to 76% of the flexural stiffness of the manhole cover in heavily corroded sections [13]. It was reported by [14] that polyurethane protects the material it contacts in harsh weather conditions. The effect of polyurethane on material properties was investigated by [15]. The study found that the polyurethane-coated surface had a wear resistance three times greater than the original material and a tensile strength over 1.5 times greater [15].
The effects of different grouts on concrete crack parameters (crack aperture and roughness) were investigated through impermeability tests by [16]. The study revealed that the grouts providing the highest impermeability were epoxy resin, polyurethane, ultrafine cement, and Portland cement [16]. Modified polyurethane concrete was applied to steel deck slabs by [17]. The study concluded that cracks caused by excessive tensile stress caused by slab temperature changes were reduced, the tensile properties of the concrete were improved, and the fracture surfaces of the samples were observed, indicating that the adhesion between the binder and aggregate was high at different temperatures [17].
In this study, after determining the aggregate and binder mixture ratios, the samples were subjected to four different curing methods. After curing, the samples were subjected to compressive strength, flexural strength, Bohme abrasion strength, freeze–thaw strength, bond strength by pull-off, and ultrasonic pulse velocity (UPV) tests. SEM-EDX, XRD, and FT-IR analyses were also performed. As a result of the study, the new type of thermoset road pavement was found to have a compressive strength of 41.22 MPa, a flexural strength of 25.32 MPa, a Bohme abrasion value of 0.99 cm3/50 cm2, a freeze–thaw mass loss per unit area of 0.77 kg/m2, and an average bond strength by pull-off value of 4.63 MPa. These values meet the road specification limits.
2. Materials and Methods
2.1. Materials
Polyurethane resin-bound road paving is a new type of paving that does not contain cement or bitumen as binders and does not contain any water in the mixture. The binder used in the mixture is a two-component polyurethane resin. In polyurethane resin-bound road paving, the mixture is composed of two materials:
- Aggregate;
- Polyurethane resin.
Crushed quartz aggregates of 0–1 mm, 1–3 mm, and 3–5 mm were used in all experiments. The quartz aggregates are shown in Figure 1.
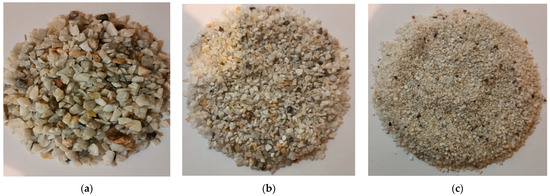
Figure 1.
Quartz aggregate appearances. (a) 3–5 mm; (b) 1–3 mm; (c) 0–1 mm.
Plastics are basically divided into three main groups:
- Thermoplastic;
- Thermoset;
- Elastomer.
Polyurethanes are polymers containing a urethane group (−NH−CO−O−) in their structures. Polyurethane chains contain elements such as hydrogen, oxygen, and nitrogen in addition to carbon. These polymers contain one or more functional groups such as ester, ether, urea, and amide in addition to the urethane group. The chemical structure of polyurethanes varies depending on the monomers used in their synthesis. Polyurethanes are block copolymers consisting of hard and soft segments. The soft segments, consisting of polyols, impart elastomeric properties to the polyurethane. The hard segments, consisting of diisocyanates, play an important role in the mechanical properties of the polyurethane [18,19].
The binder components used in this study were measured to have polyol unit volume weights (ɣp) of 0.92 g/cm3 and isocyanate unit volume weights (ɣi) of 1.14 g/cm3. Figure 2 shows the polyol (a) and isocyanate (b) of the polyurethane resin components.
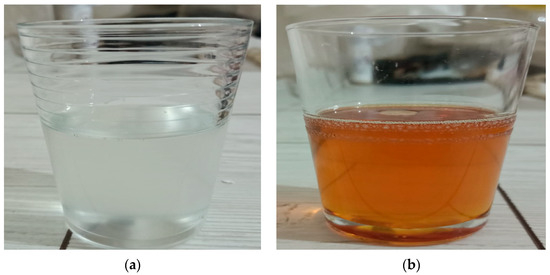
Figure 2.
View of polyurethane resin components. (a) Polyol; (b) isocyanate.
2.2. Methods
After determining the aggregate and binder mixture ratios, 4 different curing methods were applied to the samples:
- 7-day air curing;
- 7-day water curing;
- 28-day air curing;
- 28-day water curing.
The following experiments and analyses were applied to the samples after curing:
- Compressive strength test (TS EN 12390-3) [20];
- Flexural test (TS EN 12390-5) [21];
- Freeze–thaw test (TS 2824 EN 1338) [22];
- Bohme abrasion test (TS 2824 EN 1338) [22];
- Ultrasonic pulse velocity (UPV) test (TS EN 12504-4) [23];
- Scanning electron microscopy (SEM) analysis;
- Energy-dispersive X-ray (EDX) spectroscopy analysis;
- X-ray diffraction (XRD) analysis;
- Fourier transform infrared (FT-IR) spectroscopy analysis;
- Bond strength by pull-off test (TS EN 1542) [24].
2.2.1. Compressive and Flexural Strength Test
Compressive test was performed in accordance with the TS EN 12390-3 (2010) standard [20]. In accordance with the TS EN 12390-3 (2010) standard, the loading rate of the pressure test apparatus was selected as 0.4 MPa/s. Samples were prepared with dimensions of 150 × 150 × 150 mm3 and subjected to post-curing testing. The compressive strength can be calculated using Equation (1). The compressive strength of the samples was automatically calculated by the device after the test.
Fc = P/Dc
Here,
- Fc: Compressive strength (MPa, N/mm2);
- P: Maximum load (N);
- Dc: Surface area (mm2).
Flexural test was performed in accordance with the TS EN 12390-5 (2010) standard [21]. The flexural testing machine was set to a test speed of 0.50 N/s and a preload of 80 N. The flexural strength value of the test samples is calculated using Equation (2).
Fb = 3 × P × A/2 × a1 × a22
Here,
- Fb: flexural strength (MPa, N/mm2);
- P: maximum load (N);
- A: the length between two loading points (mm);
- a1: sample cross-section horizontal length (mm);
- a2: sample cross-section vertical length (mm).
For the flexural test, samples were prepared with dimensions of 40 × 40 × 160 mm3 and subjected to testing after curing. The compression and flexural testing devices are shown in Figure 3.
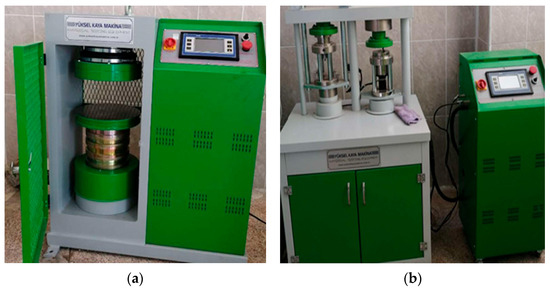
Figure 3.
Strength testing devices. (a) Compressive strength device; (b) flexural strength device.
2.2.2. Freeze–Thaw Test
Freeze–thaw test was performed to measure the durability of the materials. The freeze–thaw test was carried out in accordance with the TS 2824 EN 1338 standard [22]. Samples for the freeze–thaw test were created with dimensions of 100 × 100 × 100 mm3. The surface area applied for the freeze–thaw test was 10,000 mm2. The mass loss per unit area of the sample (I) was calculated using Equation (3):
I = M/A
Here,
- I: mass loss per unit area (kg/m2);
- M: total mass loss of material after 28-day cycles (kg);
- A: surface area applied for freeze–thaw (m2).
2.2.3. Bohme Abrasion Test
The Bohme abrasion test was conducted to measure the resistance of materials to surface wear. The Bohme abrasion test was carried out in accordance with the TS 2824 EN 1338 standard [22]. Samples were subjected to a total of 16 cycles, each consisting of 22 subcycles. Density calculations were performed using an Archimedes balance. At the end of the 16 cycles, the abrasion loss (ΔV) was calculated using Equation (4):
ΔV = Δm/ρr
Here,
- ΔV: volume loss of the sample after 16 cycles (cm3);
- Δm: mass loss of the sample after 16 cycles (g);
- ρr: density of the sample (g/cm3).
The Bohme abrasion testing device is shown in Figure 4.
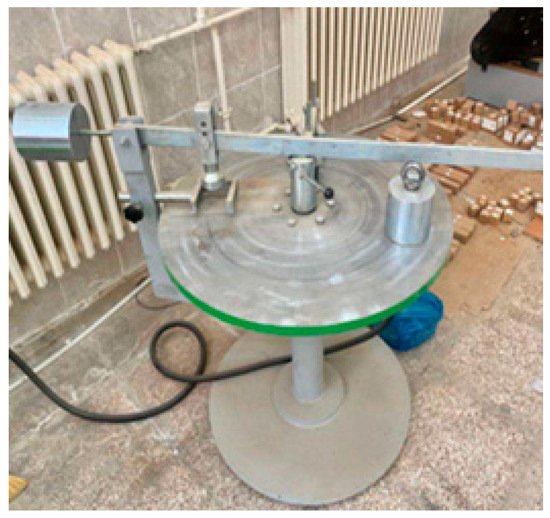
Figure 4.
Bohme abrasion testing device.
2.2.4. Ultrasonic Pulse Velocity (UPV) Test
The ultrasonic pulse velocity (UPV) technique is emerging as a non-destructive method used to evaluate the mechanical properties of various materials [25,26]. The versatility, repeatability, and simplicity of UPV testing make it highly effective for material condition assessments. This method involves measuring the velocity of ultrasonic pulses propagating through given material samples [27]. The UPV value was determined using a direct transmission technique, which involves placing transducers on opposing surfaces of the polyurethane samples. The velocity of the ultrasonic pulses is calculated as shown in Equation (5):
UPV = x/t
Here,
- UPV: ultrasonic pulse velocity (m/s);
- x: distance traveled (m);
- t: travel time through the sample (s).
The UPV test setup includes a transmitter, receiver amplifier, ultrasonic pulse generator, and timer display unit [28]. The UPV test was conducted according to the TS EN 12504-4 (2021) standard [23]. UPV values can provide an idea of the void structure and strength of two materials. The higher the UPV value, the lower the void ratio of the material. The higher the UPV value, the higher the compressive strength of the material.
There is an inverse relationship between UPV and void ratio, and a linear relationship between UPV and compressive strength. The UPV test measuring device is shown in Figure 5.
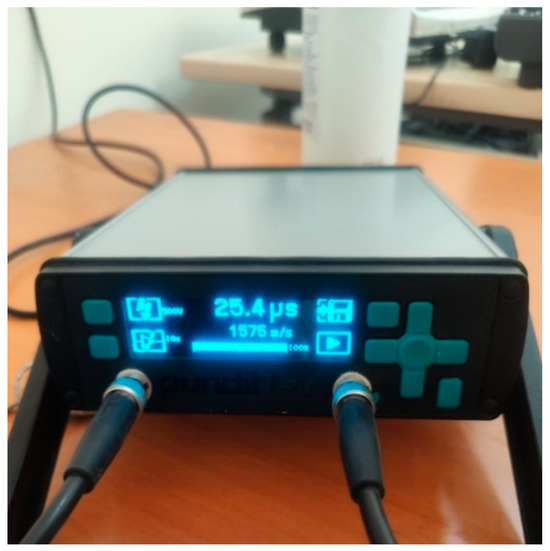
Figure 5.
UPV test device.
2.2.5. SEM-EDX Analysis
Scanning electron microscopy (SEM) and energy-dispersive X-ray (EDX) analysis represent an analytical method that facilitates the rapid and efficient collection of quantitative data on the chemical composition of elemental components, maintains the integrity of the sample with a non-destructive approach, and achieves high resolutions, providing detailed information on the properties of the investigated material [29].
2.2.6. X-Ray Diffraction (XRD) Analysis
This analysis examines the crystalline structure of materials and provides information about their overall composition [30]. The amorphous, crystalline, or semi-crystalline structure of materials is determined by XRD analysis. Amorphous materials produce broad, low-intensity peaks in XRD, while crystalline materials, such as metals, produce sharp, high-intensity peaks [31].
2.2.7. Fourier Transform İnfrared (FT-IR) Spectroscopy Analysis
FT-IR spectroscopy is a simple, non-destructive method for identifying chemical bonds in any substance and finding chemical combinations. A few milligrams of material are required for experimental work [32]. The ranges include the typical strong hydroxyl bands (unbonded OH stretching band at ν = 3600–3650 cm−1) and the broad C-H alkyl stretching band (ν = 2850–3000 cm−1) shown on the FT-IR graph [33]. Strong asymmetric stretching in the 400–600 cm−1 range and strong asymmetric bending in the 900–1100 cm−1 region are characteristic of Si-O bonds [34]. Calcium silicate hydrate (C-S-H) is represented by vibrations in these bands. The 954 cm−1 band of the sample represents the peak corresponding to C-S-H at room temperature [35]. In FT-IR spectroscopy, strong absorption bands for quartz, SiO2, and silica typically appear in the 400–4000 cm−1 region [36]. In particular, strong bands are generally observed for quartz and silica around 1080 cm−1 and 800 cm−1 [37]. In FT-IR spectroscopy, kaoline typically exhibits strong absorption bands in the following ranges: 3620–3690 cm−1: This region corresponds to -OH stretching vibrations [38]. The 1000–1030 cm−1 range is associated with Si-O stretching vibrations. The 400–500 cm−1 range includes Al-OH and Al-O bending vibrations [39]. These bands are characteristic of kaoline and can be used to identify and analyze this clay mineral in samples [40].
2.2.8. Bond Strength by Pull-Off Test
Bond strength by pull-off testing is performed for the following applications:
- Bond strength by pull-off of mortar and plaster;
- Bond strength by pull-off of asphalt;
- Bond strength by pull-off of tiles;
- Bond strength by pull-off of coatings and layers;
- Bond strength by pull-off of repair materials.
The technical specifications of the equipment used in the adhesion strength testing are shown in Table 1.

Table 1.
Technical specifications of the bond strength by pull-off testing device.
Bond strength by pull-off test was conducted according to TS EN 1542 [24]. This test is performed to determine the bond strength by pull-off of grout, mortar, concrete, and surface protection systems used for concrete protection and repair. The average bond strength by pull-off is determined by taking the arithmetic mean of the three lowest valid test results. The type of failure in the sample after the test is determined by observation. The type of failure in the sample can be as follows:
- A: separation within the concrete sub-layer;
- A/B: separation at the contact point between the first layer (primer, bonding grout, or mortar) and the concrete;
- B: separation within the first layer;
- B/C: separation at the contact point between the first layer and the second layer;
- C: separation within the second layer (in two-layer repair systems);
- -/Y: separation at the contact point between the final layer and the bond layer (in two-layer repair systems, C/Y);
- Y: separation within the bond layer;
- Y/Z: separation at the contact point between the bond layer and the steel circular foot.
If these separation shapes occur together, observations are made on the separation surface to determine the area-based ratio of each separation shape, and the separation ratios are expressed as a percentage as seen in the example below:
Invalid failure is defined as the premature separation of the bond layer. Any separation of type -Y, Y/Z, or -/Y on any part of the surface is considered an invalid separation, and the test is repeated. Valid separation includes types A, A/B, and B. Test results are evaluated based on the separation type.
When a new thermoset concrete pavement is installed over an existing concrete pavement, the bond strength by pull-off between the two pavements is crucial. Road pavements are subjected to compressive, flexural, and tensile stresses due to traffic loads. Under tensile stresses, the upper layer must maintain stability by not slipping over the lower layer. Thermoset concrete pavement can also be used in existing road repair and maintenance projects. It also allows for patching potholes on the surface. Thermoset concrete can be patched onto an existing concrete pavement requiring repair. The hardening phase of thermoset concrete poured into a mold is shown in Figure 6.
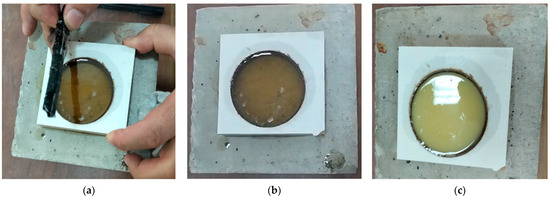
Figure 6.
Hardening stage of thermoset concrete. (a) Start of mixing; (b) 1.5 min after mixing; (c) 3 min after mixing.
The appearance of thermoset concrete on the concrete surface after hardening is shown in Figure 7.
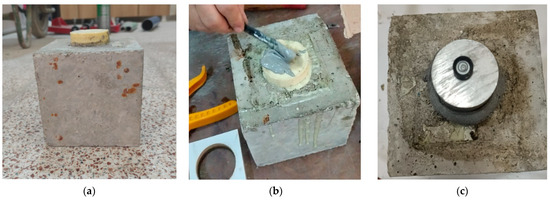
Figure 7.
Appearance of thermoset concrete on the concrete surface after hardening. (a) Appearance after hardening; (b) application of bond after hardening; (c) placing a tension disk on the bond after application.
3. Results and Discussion
3.1. Determination of Optimum Binder Consistency Ratio
In the study, the polyol volume (Vp) and isocyanate volume (Vi) were mixed in five different volumes as shown below to determine the optimum binder consistency ratio.
3.1.1. Binder Consistency Ratio (Case 1) (Vp = 20%, Vi = 80%)
Polyurethane resin components, comprising 20% polyol and 80% isocyanate of the total steel cube volume, were poured into 7 × 7 × 7 cm3 steel cube molds and mixed. However, despite waiting for a long time, such as 24 h, the mixture did not harden. The mixture remained liquid and did not exhibit any binding properties. Observations revealed that these mixing ratios could not be used as the optimum binder.
3.1.2. Binder Consistency Ratio (Case 2) (Vp = 30%, Vi = 70%)
Polyurethane resin components, comprising 30% polyol and 70% isocyanate of the total steel cube volume, were poured into steel cube molds of the same size and mixed. After 15 min of rest, the mixture hardened elastically. When a load was applied to the sample surface, surface depressions were observed, but these depressions quickly returned to their original state when the load was removed.
3.1.3. Binder Consistency Ratio (Case 3) (Vp = 50%, Vi = 50%)
Similarly, polyurethane resin components, comprising 50% polyol and 50% isocyanate of the total steel cube volume, were poured into steel cube molds and mixed. After 3 min of rest, the mixture hardened plastically. No depressions were observed when a load was applied to the sample surface. The sample was found to be stable and rigid.
3.1.4. Binder Consistency Ratio (Case 4) (Vp = 70%, Vi = 30%)
Similarly, polyurethane resin components, comprising 70% polyol and 30% isocyanate by volume of the total steel cube volume, were poured into steel cube molds and mixed. After 6 min of waiting, the mixture hardened elasto-plastically. No surface collapse was observed when load was applied to the sample surface. The sample initially cured more smoothly than the sample in Case 3. After 24 h, it reached a fully stable and rigid structure. The curing time was longer than that of the sample in Case 3.
3.1.5. Binder Consistency Ratio (Case 5) (Vp = 80%, Vi = 20%)
Similarly, polyurethane resin components, comprising 80% polyol and 20% isocyanate by volume of the total steel cube volume, were poured into 7 × 7 × 7 cm3 steel cube molds and mixed. After 15 min of waiting, the mixture hardened elastically. No surface collapse was observed when a load was applied to the sample surface. Even after 24 h, the sample maintained its elastic structure. No rigid hardening was observed over time. The curing time was longer than that of the sample in Case 3.
Among the five mixing ratios in this study, the optimum binder consistency was found to be that in Case 3. Therefore, the optimum binder consistency ratio for all studies was considered: 50% polyol and 50% isocyanate of the polyurethane resin.
3.2. Determination of Aggregate and Binder Mixture Proportions
As a result of the calculations made for 1 m3 of mixture, the following Equation (6) was created:
VA = VK × (ɣK − 1)/(ɣA − 1)
Here,
- VA: aggregate volume (m3);
- ɣA: aggregate unit volume weight (t/m3);
- VK: total volume of the mixture (m3);
- ɣK: unit volume weight of the mixture (t/m3).
Table 2 was created using Equation (6). Table 2 shows the material mix quantities based on their unit volume weights. Mix ratios No. 5 were used throughout the study. As seen in Table 2, mix designs were created to ensure that the unit volume weight of all samples to be produced was approximately 2.05 t/m3.

Table 2.
Material mix quantities.
While creating Table 2, the unit volume weight of the average polyurethane was taken as 1.00 (t/m3).
In Table 2,
- VS: polyurethane volume in 1 m3 mixture (m3);
- WA: total aggregate weight in 1 m3 mixture (t);
- WS: total polyurethane weight in 1 m3 mixture (t);
- WK: total weight of 1 m3 mixture (t).
3.3. Aggregate Sieve Analysis
Quartz aggregates of 0–1 mm, 1–3 mm, and 3–5 mm sizes were used in all experiments. Sieve analysis of the quartz aggregates used in the production of thermoset concrete is shown in Table 3.

Table 3.
Thermoset concrete aggregate sieve analysis.
As seen in Table 3, in the entire study, 67% of the quartz aggregate to be used in the experiments was taken as between 3 and 5 mm, 22% as between 1 and 3 mm, and 11% as between 0.5 and 1 mm.
3.4. Compressive Strength Test Results
Steel cube molds with dimensions of 15 × 15 × 15 cm3 were used for the compressive strength test. Three samples were created for each curing. A total of 12 samples were produced for the four curing methods. The appearance of these 12 samples is given in Figure 8.
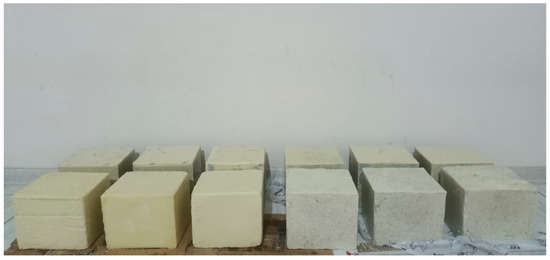
Figure 8.
Samples prepared for curing application.
The samples were subjected to 7 days of air curing, 7 days of water curing, 28 days of air curing, and 28 days of water curing. After curing, all samples were subjected to compression testing. Reference samples were produced for the cure that provided the maximum compressive strength. Only polyurethane resin was used in the reference samples. In the thermoset concrete samples, polyurethane resin was used as both the aggregate and binder. No aggregate was used in the reference samples; only polyurethane resin was used. Cement and water were not used in any of the tests. The test results are shown in Table 4.

Table 4.
Compressive strength results of the samples after curing.
As seen in Table 4, there is no significant difference in the compressive strengths of the samples obtained in all curing conditions. The samples yielded similar results under all curing conditions. This is believed to be due to the samples’ water absorption values being close to zero. It can be said that samples with water absorption values close to zero (0.03%) are not affected by climatic conditions. Furthermore, it can be concluded that structures made with this type of mixture can be constructed underwater as well as above water and maintain their strength for long periods of time, just as they did on the first day. This is because the pressure difference between the 7- and 28-day water curing is very low. As seen in Table 4, the 28-day air curing cure type yielded the highest compressive strength. The sample resulting from this curing type was designated the ideal thermoset concrete road pavement (TCRP) sample. The rigid road pavement concrete pavement specification requires the minimum compressive and flexural strengths of the concrete to be 28 MPa and 4.5 MPa, respectively [41]. Reference samples were prepared and stored in the ideal sample cure type (28 days air curing), and a post-curing compression test was performed.
The appearances of the reference samples removed from the molds are shown in Figure 9.
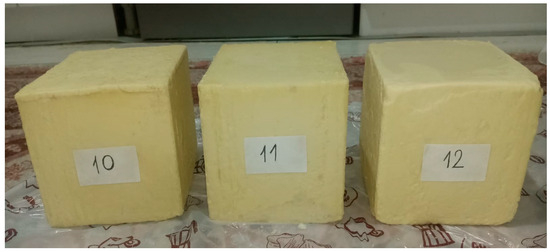
Figure 9.
Appearance of reference samples.
The average compressive strength of the reference sample is shown in Table 5.

Table 5.
Compressive strength test results.
As seen in Table 5, it can be said that the compressive strength of TCRP sample is approximately 43% higher than the compressive strength of the reference sample.
3.5. Flexural Strength Test Results
The flexural strength test pictures of the reference and TCRP samples are shown in Figure 10.
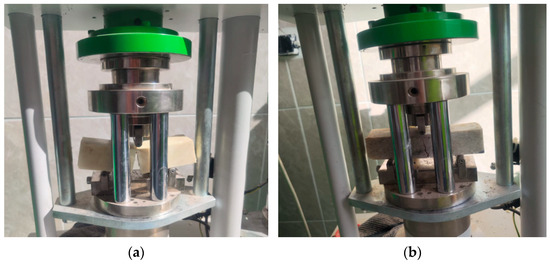
Figure 10.
Appearance of reference and thermoset concrete road pavement (TCRP) samples while performing the flexural strength test. (a) Reference sample; (b) thermoset concrete road pavement (TCRP) sample.
Steel molds with dimensions of 4 × 4 × 16 cm3 were used for the flexural strength test. Three reference flexural strength test samples and three ideal thermoset concrete road pavement (TCRP) samples were prepared separately and kept in the ideal curing type (28-day air curing). After curing, all samples were subjected to flexural strength testing. No aggregate was used in the production of the reference samples for the flexural strength test. In ideal thermoset concrete road pavement (TCRP) mixing, quartz aggregate and polyurethane resin were used. Cement and water were not used in any of the tests. Flexural strength test results are shown in Table 6.

Table 6.
Flexural strength test results.
According to Table 6, it can be concluded that the flexural strength of TCRP sample is approximately 23% greater than that of the reference sample. It is known that the flexural strengths of cement-bound normal- and high-strength concretes are between 3 and 10 MPa. Test results have shown that the flexural strength of TCRP produced in this study is approximately 2.5–8.5 times greater than the flexural strengths of cement-bound normal- and high-strength concretes.
3.6. Ultrasonic Pulse Velocity (UPV) Test Results
The appearance of the UPV test is shown in Figure 11.
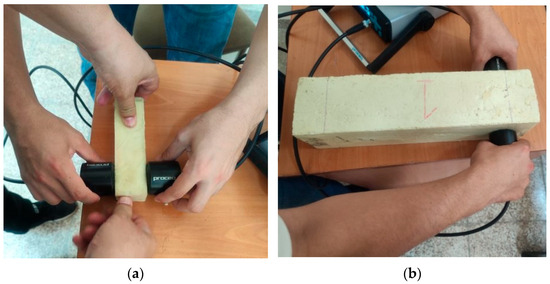
Figure 11.
UPV test appearance. (a) Placing the sample; (b) UPV test.
The UPV test results are shown in Table 7.

Table 7.
UPV test results.
UPV values can provide insight into the void structure and strength of two materials. The higher the UPV value, the lower the void ratio of the material. The higher the UPV value, the higher the compressive strength of the material. There is an inverse relationship between UPV and void ratio, while there is a linear relationship between UPV and compressive strength. Table 7 shows that the void ratio of the thermoset concrete road pavement (TCRP) sample is lower than the void ratio of the reference sample. Table 7 indicates that the compressive strength of the TCRP sample is higher than the compressive strength of the reference sample. The results in Table 5 confirm these statements.
3.7. Bohme Abrasion Test Results
In the Bohme test, as seen in Figure 12, an Archimedes balance for density measurements (a) and a Bohme abrasion test device (b) were used.
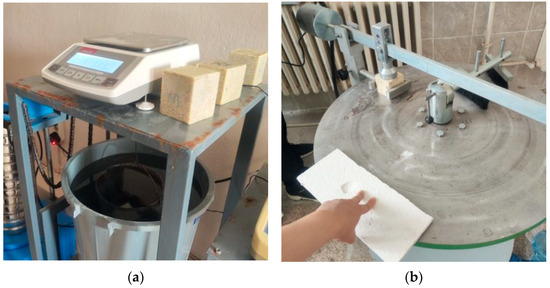
Figure 12.
Bohme abrasion test. (a) Archimedes balance; (b) Bohme abrasion device.
The Bohme abrasion test results are shown in Table 8.

Table 8.
Bohme abrasion test results.
According to Table 8, the abrasion loss of thermoset concrete road pavement (TCRP) samples is approximately 5.5 times greater than the abrasion loss of the reference sample. The specification states that the abrasion loss of the pavement used in road pavement should be less than 18% within the specification limits [22]. Both the reference and ideal samples meet the specification limits. Therefore, they can be used as road pavements.
3.8. Freeze–Thaw Test Results
Freeze–thaw test results are shown in Table 9.

Table 9.
Freeze–thaw test results.
As shown in Table 9, both the reference and ideal thermoset concrete road pavement (TCRP) samples meet the specification limits. Therefore, they can be used in road pavement construction. Furthermore, the average mass losses per unit area of both the reference and TCRP samples were equal.
3.9. SEM-EDX Analysis Results
One study indicated that the independent microvoids within the material reduce the material’s water absorption and specific gravity [42]. These properties make microvoid polyurethane suitable for applications where moisture resistance and lighter weight are advantageous [43,44,45].
The morphology and microstructure of the reference and thermoset concrete road pavement (TCRP) samples were examined with the SEM device operating at 5 kV.
In Figure 13a,b, the bubbles visible in the SEM images are spherical microvoids, as seen in SEM photographs taken after the concrete was cut with a concrete cutter. There are no microchannels to connect them. Therefore, it is thought that the water absorption and specific gravity would be low due to the lack of a connection between the voids. Figure 13c shows the EDX graphic.
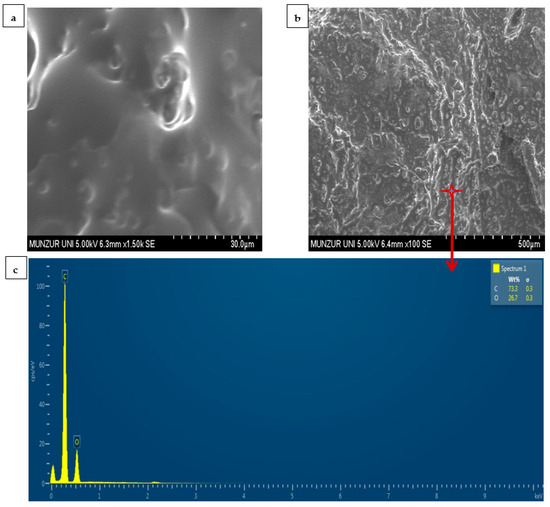
Figure 13.
Reference sample SEM-EDX analysis. (a) SEM image 1.5 k SE; (b) SEM image 100 SE; (c) EDX graphic.
Figure 14a,b show the morphology of the thermoset concrete road pavement (TCRP) sample. Energy-dispersive X-ray (EDX) analysis results indicate the presence of silica (SiO2) in the Si/O ratio. The peaks in Figure 14c also indicate a high silicon content. This is due to the quartz aggregate incorporated into the mixture. As seen in Figure 14b, the quartz aggregates are embedded in the polyurethane binder. These SEM images demonstrate the strong interfacial adhesion between the quartz aggregate and the polyurethane binder.
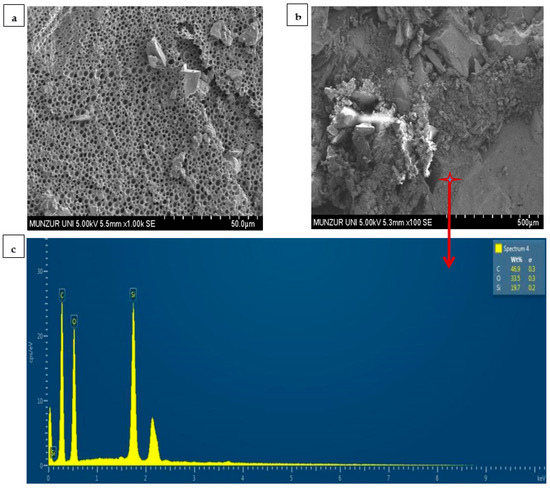
Figure 14.
Thermoset concrete road pavement (TCRP) sample SEM-EDX analysis. (a) SEM image 1.0 k SE; (b) SEM image 100 SE (c) EDX graphic.
3.10. Fourier Transform Infrared (FT-IR) Spectroscopy Analysis Results
A simple, non-destructive method for identifying chemical bonds and finding chemical combinations in any substance is FT-IR spectroscopy. As shown in Figure 15, quartz and silica have strong peaks in the 1098 cm−1 region.
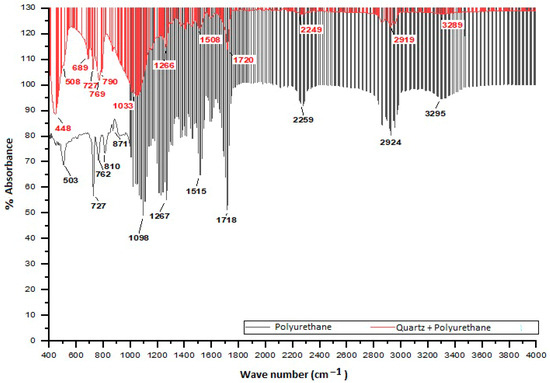
Figure 15.
FT-IR analysis results of quartz + polyurethane in thermoset concrete road pavement (TCRP) and polyurethane in reference sample.
Figure 15 shows the FT-IR spectra of quartz + polyurethane in thermoset concrete road pavement (TCRP) and polyurethane in the reference sample mixture. When comparing the two spectra, no shift in the peaks or the formation of a new peak is observed. According to this result, the quartz aggregate added to the polyurethane binder does not cause any change in the structure of the binder polyurethane matrix.
Figure 15 shows that quartz + polyurethane in thermoset concrete road pavement (TCRP) and polyurethane in the reference sample mixture are analyzed together, and the peaks in polyurethane in the reference sample mixture are higher. This is thought to be due to the aromatic ring stretching of the polyurethane resin [46,47].
3.11. X-Ray Diffraction (XRD) Analysis Results
The amorphous, crystalline, or semi-crystalline structure of materials is determined by XRD analysis. As seen in the XRD graph in Figure 16, silica is seen at 2θ ≈ 21°, quartz at 2θ ≈ 27°, and kaolin at 2θ ≈ 36.5°.
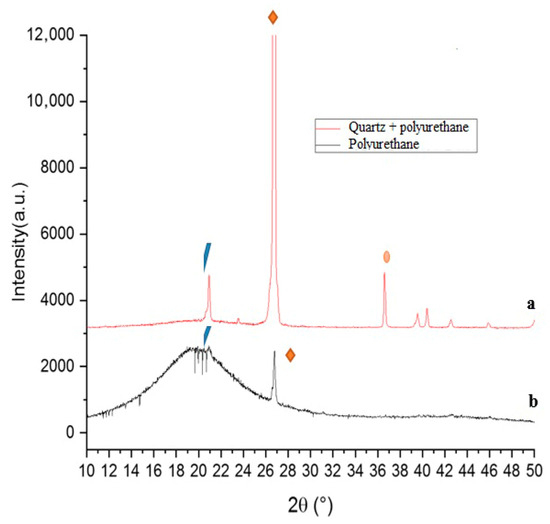
Figure 16.
XRD analysis result. (a) Quartz + polyurethane in thermoset concrete road pavement (TCRP) (  ) quartz, silica (
  ), kaoline (
  ); (b) polyurethane.
 ) quartz, silica (
  ), kaoline (
  ); (b) polyurethane.
3.12. Bond Strength by Pull-Off Test Results
Bond strength by pull-off test images are shown in Figure 17.
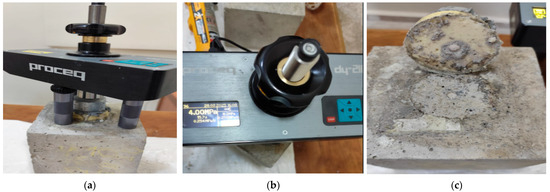
Figure 17.
Bond strength by pull-off test images. (a) Fixing the pulling disk to the device; (b) bond strength by pull-off value automatically recorded on the device after test; (c) separation shape of the sample after the test.
The bond strength by pull-off of the five samples was found to be 3.95 MPa, 3.99 MPa, 3.97 MPa, 4.00 MPa, and 3.92 MPa, respectively. After the test, the bond strength value of the sample is automatically recorded by the testing device, as shown in Figure 17b.
The bond strength value is determined by taking the arithmetic average of the three smallest values from these five values. The sample’s separation pattern is shown in Figure 17c. As seen in Figure 17c, the sample’s A/B separation pattern was observed as 100%.
According to the TS EN 1542 standard, the A/B failure pattern is a valid separation pattern, and the bond strength by pull-off test result automatically recorded on the device is acceptable [24]. Test results are shown in Table 10.

Table 10.
Bond strength by pull-off test results.
As seen in Table 10, when thermoset concrete road pavement (TCRP) is applied on the concrete road, it can be said that bond strength between the two layers is high. Research on subgrade stabilization has gained momentum in recent years [48]. The bond strength that TCRP will exhibit upon application to the subgrade is an important issue. The degree of adhesion between the road pavement and the subgrade should not be overlooked. As a suggestion, the direct applicability of TCRP to the subgrade could be investigated.
4. Conclusions
Thermoset concrete road pavement (TCRP) test results are seen in Table 11.

Table 11.
Thermoset concrete road pavement (TCRP) test results.
- Thermoset concrete road pavement (TCRP) produced in this study can be used as road pavement since it meets the highway specification limits.
- There are no specification limits for this in the bond strength by pull-off test standard. In concrete-to-concrete bond strength by pull-off tests, bond strength by pull-off strength results range from 1 to 3 MPa. When TCRP is applied to a concrete road, the bond strength by pull-off between the two layers is 3.95 MPa (Table 11), indicating high bond strength by pull-off.
- TCRP is not affected by adverse climatic conditions. According to Table 11, it can be said that TCRP has high damage resistance in adverse weather conditions.
- According to Table 11, the Bohme abrasion loss of TCRP is 0.99. This result shows the usability of TCRP as road pavement. In other words, it can be said that TCRP has high abrasion strength under heavy traffic loads.
- Due to rapid curing, TCRP can be opened to traffic within 5–15 min.
- In the production of TCRP, not using water in the mixture contributes to the protection of water resources.
- Quartz aggregate was used as the aggregate in this study. New types of TCRP can be created using different types of aggregates.
- No steel fiber was used in any phase of the study. The study could be expanded by incorporating steel fibers.
- In this study, rigid TCRP was produced. Flexible thermoset road pavements can also be produced by varying the polyurethane resin ratio.
- Polyurethane generally poses no health risks. Therefore, manufacturers often classify it as an environmentally friendly material. Consequently, it can be said that polyurethane products pose no health risks or harm [49].
- Different studies on polyurethane resin road pavements can be conducted, such as improving traffic safety by preventing excessive surface shine [50], and evaluating adhesion and moisture damage resistance at the polyurethane resin–aggregate interface by combining pull-off testing with fluorescence tracing [51].
Author Contributions
Conceptualization, F.K. and A.B.; methodology, F.K. and A.B.; validation, F.K. and A.B.; formal analysis, A.B.; investigation, resources, F.K. and A.B.; data curation, A.B.; writing—original draft preparation, A.B.; writing—review and editing, A.B.; visualization, F.K. and A.B.; supervision, A.B. All authors have read and agreed to the published version of the manuscript.
Funding
This research received no external funding.
Institutional Review Board Statement
Not applicable.
Informed Consent Statement
Not applicable.
Data Availability Statement
No new data were created or analyzed in this study. Data sharing is not applicable to this article.
Acknowledgments
The authors would like to thank Batman University and Siirt University for their support in this study. They would also like to thank Mahmut Durmaz and Seher Dalgic for their assistance with the experimental work.
Conflicts of Interest
The authors declare no conflicts of interest.
Abbreviations
| UPV | Ultrasonic pulse velocity |
| SEM | Scanning electron microscopy |
| EDX | Energy-dispersive X-ray |
| XRD | X-ray diffraction |
| FT-IR | Fourier transform infrared |
| TCRP | Thermoset concrete road pavement |
References
- Szycher, M. Structure-property relations in polyurethanes. Szycher’s Handbook of Polyurethanes, 2nd ed.; CRC Press: Boca Raton, FL, USA, 2012; pp. 37–86. [Google Scholar]
- Engels, H.W.; Pirkl, H.G.; Albers, R.; Albach, R.W.; Krause, J.; Hoffmann, A.; Casselmann, H.; Dormish, J. Polyurethanes: Versatile Materials and Sustainable Problem Solvers for Todays Challenges. Angew. Chem. Int. Ed. 2013, 52, 9422–9441. [Google Scholar] [CrossRef]
- Randall, D.; Lee, S. The Polyurethanes Book; Wiley: New York, NY, USA, 2002; pp. 113–126. [Google Scholar]
- Leng, C.; Lu, G.; Gao, J.; Liu, P.; Xie, X.; Wang, D. Sustainable green pavement using bio-based polyurethane binder in tunnel. Materials 2019, 12, 1990. [Google Scholar] [CrossRef]
- Hassan, A.; Rashid, Y.; Mourad, A.H.I.; Ismail, N.; Laghari, M.S. Thermal and structural characterization of geopolymer-coated polyurethane foam-phase change material capsules/geopolymer concrete composites. Materials 2019, 12, 796. [Google Scholar] [CrossRef] [PubMed]
- Cagdas, I.U.; Yildirim, O. Experimental evaluation of flexural stiffness of sandwich composite beams having glass fiber reinforced polyurethane faces. Gazi J. Eng. Sci. 2020, 5, 273–279. [Google Scholar]
- Ding, H.; Sun, Q.; Wang, Y.; Jia, D.; Li, C.; Ji, C.; Feng, Y. Flexural behavior of polyurethane concrete reinforced by carbon fiber grid. Materials 2021, 14, 5421. [Google Scholar] [CrossRef]
- Jia, Z.; Jia, D.; Sun, Q.; Wang, Y.; Ding, H. Preparation and mechanical-fatigue properties of elastic polyurethane concrete composites. Materials 2021, 14, 3839. [Google Scholar] [CrossRef]
- Hodul, J.; Mészárosová, L.; Drochytka, R. New chemically resistant coating systems with progressive incorporation of hazardous waste in polyurethane and epoxy matrices. Materials 2022, 15, 3235. [Google Scholar] [CrossRef] [PubMed]
- Karacoban, E.D. Synthesis and Characterization of UV-Curable Linear and Branched Urethane Acrylate Resins. Master’s Thesis, Bilecik Seyh Edebali University, Bilecik, Turkey, 2023. [Google Scholar]
- Schaaf, B.; Abeln, B.; Feldmann, M.; Stammen, E.; Dilger, K. Full-Locked Coil Ropes with HDPE Sheath: Studies of Mechanical Behavior of HDPE Under Accelerated Aging. Materials 2024, 18, 106. [Google Scholar] [CrossRef]
- Chełmecki, J.; Szeptyński, P.; Jasińska, D.; Kwiecień, A. Analyzing the Vibration Response of Adhesively Bonded Composite Cantilevers. Materials 2024, 18, 93. [Google Scholar] [CrossRef] [PubMed]
- Garbowski, T.; Pawlak, T.G.; Szymczak-Graczyk, A. Efficient Load-Bearing Capacity Assessment of a Degraded Concrete Manhole Using Sectional Homogenization. Materials 2024, 17, 5883. [Google Scholar] [CrossRef]
- Martha, R.; George, B.; Gérardin-Charbonnier, C.; Fredon, E.; Rahayu, I.S.; Darmawan, W.; Gérardin, P. Surface Characteristics and Artificial Weathering Resistance of Oil-Based Coatings on the Chemically and Thermally Modified Short-Rotation Teak Wood. Materials 2024, 17, 3881. [Google Scholar] [CrossRef] [PubMed]
- Zhang, X.; Hou, F.; Du, H.; Yan, L.; Guo, A.; Ma, X.; Liu, J. Preparation of ceramic fiber threads with enhanced abrasion resistance performance. Materials 2024, 17, 599. [Google Scholar] [CrossRef]
- Zhang, L.; Huang, C.; Li, Z.; Wang, A.; Gao, M.; Gao, Y.; Wang, X. Experimental Study on Water-Plugging Performance of Grouted Concrete Crack. Materials 2024, 17, 1568. [Google Scholar] [CrossRef] [PubMed]
- Han, Y.; Meng, X.; Feng, F.; Song, X.; Huang, F.; Wen, W. Study on Temperature-Dependent Uniaxial Tensile Tests and Constitutive Relationship of Modified Polyurethane Concrete. Materials 2023, 16, 2653. [Google Scholar] [CrossRef]
- Krol, P. Synthesis methods, chemical structures and phase structures of linear polyurethanes. Properties and applications of linear polyurethanes in polyurethane elastomers, copolymers and ionomers. Prog. Mater. Sci. 2007, 52, 915–1015. [Google Scholar] [CrossRef]
- Akgun, H. The Preperation and Characterization of Polyurethane-Carbon Fiber Composites. Master’s Thesis, Istanbul Teknik University, Istanbul, Turkey, 2008. [Google Scholar]
- TS EN 12390-3; Testing Hardened Concrete-Part 3: Compressive Strength of Test Specimens. TSE: Ankara, Turkey, 2010; pp. 7–9.
- TS EN 12390-5; Testing Hardened Concrete-Part 5: Flexural Strength of Test Specimens. TSE: Ankara, Turkey, 2010; pp. 12–17.
- TS 2824 EN 1338; Concrete Paving Blocks-Requirements and Test Methods. TSE: Ankara, Turkey, 2005; pp. 21–27.
- EN T 12504-4; Testing Concrete in Structures—Part 4: Determination of Ultrasonic Pulse Velocity. TSE: Ankara, Turkey, 2021.
- EN T 1542; Products and Systems for the Protection and Repair of Concrete Structures-Test Methods-Measurement of Bond Strength by Pull-Off. TSE: Ankara, Turkey, 2001.
- Jongvivatsakul, P.; Janprasit, K.; Nuaklong, P.; Pungrasmi, W.; Likitlersuang, S. Investigation of the crack healing performance in mortar using microbially induced calcium carbonate precipitation (MICP) method. Constr. Build. Mater. 2019, 212, 737–744. [Google Scholar] [CrossRef]
- Chompoorat, T.; Likitlersuang, S.; Sitthiawiruth, S.; Komolvilas, V.; Jamsawang, P.; Jongpradist, P. Mechanical properties and microstructures of stabilised dredged expansive soil from coal mine. Geomech. Eng. 2021, 25, 143–157. [Google Scholar]
- Meggabi, T.; Hareru, W.K.; Mulugeta, D. Prediction of compressive strength of normal concrete with partial replacement of sand by waste glass using fuzzy model. Int. J. Sustain. Constr. Eng. Technol. 2022, 13, 135–146. [Google Scholar] [CrossRef]
- Zebari, Z.; Bedirhanoglu, I.; Aydin, E. Prediction of compressive strength of concrete through using ultrasonic pulse velocity. DUJE 2016, 8, 43–52. [Google Scholar]
- Guyett, P.C.; Chew, D.; Azevedo, V.; Blennerhassett, L.C.; Rosca, C.; Tomlinson, E. Optimizing SEM-EDX for fast, high-quality and non-destructive elemental analysis of glass. J. Anal. At. Spectrom. 2024, 39, 2565–2579. [Google Scholar] [CrossRef]
- Zhu, J.; Wang, J.P. Virtual XRD Method in Molecular Dynamics Simulation and a Case Study for Fe16N2 and Fe8N Thin Films. In TMS Annual Meeting & Exhibition; Springer Nature: Cham, Switzerland, 2024; pp. 1693–1704. [Google Scholar]
- Kwakye-Awuah, B.; Abavare, E.K.K.; Sefa-Ntiri, B.; Nkrumah, I.; Von-Kiti, E.; Williams, C. Synthesis and characterization of geopolymer-zeolites from Ghanaian Kaolin samples by variation of two synthesis parameters. J. Therm. Anal. Calorim. 2021, 146, 1991–2003. [Google Scholar] [CrossRef]
- Kaczmarek, K.; Leniart, A.; Lapinska, B.; Skrzypek, S.; Lukomska-Szymanska, M. Selected spectroscopic techniques for surface analysis of dental materials: A narrative review. Materials 2021, 14, 2624. [Google Scholar] [CrossRef]
- Reis, E.F.D.; Campos, F.S.; Lage, A.P.; Leite, R.C.; Heneine, L.G.; Vasconcelos, W.L.; Lobato, Z.I.P.; Mansur, H.S. Synthesis and characterization of poly (vinyl alcohol) hydrogels and hybrids for rMPB70 protein adsorption. Mat. Res. 2006, 9, 185–191. [Google Scholar] [CrossRef]
- Malathy, R.; Shanmugam, R.; Chung, I.M.; Kim, S.H.; Prabakaran, M. Mechanical and microstructural properties of composite mortars with lime, silica fume and rice husk ash. Processes 2022, 10, 1424. [Google Scholar] [CrossRef]
- Choudhary, R.; Gupta, R.; Nagar, R. Impact on fresh, mechanical, and microstructural properties of high strength self-compacting concrete by marble cutting slurry waste, fly ash, and silica fume. Constr. Build. Mater. 2020, 239, 117888. [Google Scholar] [CrossRef]
- Saikia, B.J.; Parthasarathy, G.; Sarmah, N.C. Fourier transform infrared spectroscopic estimation of crystallinity in SiO2 based rocks. Bull. Mater. Sci. 2008, 31, 775–779. [Google Scholar] [CrossRef]
- Volkov, D.S.; Rogova, O.B.; Proskurnin, M.A. Organic matter and mineral composition of silicate soils: FTIR comparison study by photoacoustic, diffuse reflectance, and attenuated total reflection modalities. Agronomy 2021, 11, 1879. [Google Scholar] [CrossRef]
- Drits, V.A.; Zviagina, B.B.; Sakharov, B.A.; Dorzhieva, O.V.; Savichev, A.T. New insight into the relationships between structural and FTIR spectroscopic features of kaolinites. Clays Clay Miner. 2021, 69, 366–388. [Google Scholar] [CrossRef]
- Kloprogge, J. Thermal, Mechanical and Chemical Treatments of the Kaolin Minerals. In Spectroscopic Methods in the Study of Kaolin Minerals and Their Modifications; Springer International Publishing: Cham, Switzerland, 2018; pp. 161–241. [Google Scholar]
- Du Plessis, P.I.; Gazley, M.F.; Tay, S.L.; Trunfull, E.F.; Knorsch, M.; Branch, T.; Fourie, L.F. Quantification of kaolinite and halloysite using machine learning from FTIR, XRF, and brightness data. Minerals 2021, 11, 1350. [Google Scholar] [CrossRef]
- Tunc, A. Road Materials and Applications, 2nd ed.; Nobel Publication Distribution: Ankara, Turkey, 2007; pp. 123–131. [Google Scholar]
- Saleh, S.; Yunus, N.Z.M.; Ahmad, K.; Ali, N. Improving the strength of weak soil using polyurethane grouts: A review. Constr. Build. Mater. 2019, 202, 738–752. [Google Scholar] [CrossRef]
- Atiqah, A.; Mastura, M.T.; Ahmed Ali, B.A.; Jawaid, M.; Sapuan, S.M. A review on polyurethane and its polymer composites. Curr. Org. Synth. 2017, 14, 233–248. [Google Scholar] [CrossRef]
- Li, X.; Li, J.; Wang, J.; Yuan, J.; Jiang, F.; Yu, X.; Xiao, F. Recent applications and developments of Polyurethane materials in pavement engineering. Constr. Build. Mater. 2021, 304, 124639. [Google Scholar] [CrossRef]
- Xu, L.; Li, X.; Jiang, F.; Yu, X.; Wang, J.; Xiao, F. Thermosetting characteristics and performances of polyurethane material on airport thin-overlay. Constr. Build. Mater. 2022, 344, 128252. [Google Scholar] [CrossRef]
- Huang, S.L.; Chao, M.S.; Ruaan, R.C.; Lai, J.Y. Microphase separated structure and protein adsorption of polyurethanes with butadiene soft segment. Eur. Polym. J. 2000, 36, 285–294. [Google Scholar] [CrossRef]
- Pattanayak, A.; Jana, S.C. Thermoplastic polyurethane nanocomposites of reactive silicate clays: Effects of soft segments on properties. Polymer 2005, 46, 5183–5193. [Google Scholar] [CrossRef]
- Luo, B.; Su, Y.; Ding, X.; Chen, Y.; Liu, C. Modulation of initial CaO/Al2O3 and SiO2/Al2O3 ratios on the properties of slag/fly ash-based geopolymer stabilized clay: Synergistic effects and stabilization mechanism. Mater. Today Commun. 2025, 47, 113295. [Google Scholar] [CrossRef]
- Polipiyer. 2025. Available online: https://polipiyer.com/tr/poluretan-sagliga-zararli-midir/# (accessed on 23 August 2025).
- Chen, Y.; Sha, A.; Jiang, W.; Lu, Q.; Du, P.; Hu, K.; Li, C. Eco-friendly bismuth vanadate/iron oxide yellow composite heat-reflective coating for sustainable pavement: Urban heat island mitigation. Constr. Build. Mater. 2025, 470, 140645. [Google Scholar] [CrossRef]
- Peng, Y.; Zhao, T.; Miao, J.; Kong, L.; Li, Z.; Liu, M.; Jiang, X.; Zhang, Z.; Wang, W. Evaluation framework for bitumen-aggregate interfacial adhesion incorporating pull-off test and fluorescence tracing method. Constr. Build. Mater. 2024, 451, 138773. [Google Scholar] [CrossRef]
Disclaimer/Publisher’s Note: The statements, opinions and data contained in all publications are solely those of the individual author(s) and contributor(s) and not of MDPI and/or the editor(s). MDPI and/or the editor(s) disclaim responsibility for any injury to people or property resulting from any ideas, methods, instructions or products referred to in the content. |
© 2025 by the authors. Licensee MDPI, Basel, Switzerland. This article is an open access article distributed under the terms and conditions of the Creative Commons Attribution (CC BY) license (https://creativecommons.org/licenses/by/4.0/).