Article

A Simple Aridity Index to Monitor Vineyard Health: Evaluating the De Martonne Index in the Iberian Peninsula

by
Nazaret Crespo-Cotrina
1,2,
Luís Pádua
1,3,
André M. Claro
1,4,
André Fonseca
1,4,
Francisco J. Rebollo
5,
Francisco J. Moral
6,
Luis L. Paniagua
7,
Abelardo García-Martín
7,
João A. Santos
1,4 and
Helder Fraga
1,2,*
1
Centre for the Research and Technology of Agro-Environmental and Biological Sciences, Institute for Innovation, Capacity Building, and Sustainability of Agri-Food Production, University of Trás-os-Montes e Alto Douro, 5000-801 Vila Real, Portugal
2
Agronomy Department, School of Agrarian and Veterinary Sciences, University of Trás-os-Montes e Alto Douro, 5000-801 Vila Real, Portugal
3
Engineering Department, School of Sciences and Technology, University of Trás-os-Montes e Alto Douro, 5000-801 Vila Real, Portugal
4
Physics Department, School of Sciences and Technology, University of Trás-os-Montes e Alto Douro, 5000-801 Vila Real, Portugal
5
Departamento de Expresión Gráfica, Escuela de Ingenierías Agrarias, Universidad de Extremadura, Avda. Adolfo Suárez, s/n., 06007 Badajoz, Spain
6
Departamento de Expresión Gráfica, Escuela de Ingenierías Industriales, Universidad de Extremadura, Avda. de Elvas, s/n., 06006 Badajoz, Spain
7
Departamento de Ingeniería del Medio Agronómico y Forestal, Escuela de Ingenierías Agrarias, Universidad de Extremadura, Avda. Adolfo Suárez, s/n., 06007 Badajoz, Spain
*
Author to whom correspondence should be addressed.
Appl. Sci. 2025, 15(19), 10605; https://doi.org/10.3390/app151910605
Submission received: 3 September 2025 / Revised: 26 September 2025 / Accepted: 29 September 2025 / Published: 30 September 2025

Abstract

Viticulture in the Iberian Peninsula is increasingly threatened by climate change, particularly rising temperatures and prolonged droughts. This study evaluates the ability of the De Martonne Index (DMI), a simple climatic aridity index based solely on temperature and precipitation, to serve as a proxy for vineyard health over a 30-year period (1993–2022). Vineyard health was assessed using the Vegetation Health Index (VHI), derived from satellite remote sensing data. DMI values were computed from bias-corrected ERA5-Land data, and VHI composites were generated from NOAA satellite imagery. Vineyard-specific outputs were isolated using land cover datasets, and a contingency analysis compared drought classifications from both indices. Results show a strong spatio-temporal correspondence between low DMI values and reduced VHI, with agreement rates for severe/extreme drought conditions reaching up to 56% under the most restrictive DMI thresholds. In the analyzed period, years such as 1995, 1997, 2005, 2009, and 2012, showed over 20% of vineyard areas affected by moderate-to-severe/extreme drought. The spatial analysis revealed that northern and northwestern regions of the peninsula experienced less drought stress, while central and southern areas were more frequently affected. This approach demonstrates that the DMI alone can provide a reliable assessment of vineyard health, potentially enabling its direct use with seasonal forecasts, which are generally available for temperature and precipitation, to anticipate drought impacts and support adaptation in viticulture. The proposed methodology is scalable and transferable to other crops and regions, serving as a tool for climate adaptation strategies in viticulture.

1. Introduction

Viticulture has been a cornerstone of agricultural and cultural development for millennia [1,2]. The grapevine (Vitis vinifera L.) is one of the most economically significant fruit crops globally, with wine production playing a major role in shaping landscapes, preserving cultural heritage, and supporting tourism in many regions [3,4,5]. Beyond wine production, viticulture also includes the cultivation of table grapes, contributing to a diverse agricultural sector [6,7].
The Iberian Peninsula (IP), which comprises Spain and Portugal, is among the world’s most diverse and historically rich wine-producing regions [8,9,10,11]. It encompasses a mosaic of terroirs and wine styles, many of which are recognized under the Protected Designation of Origin (PDO) system [12]. PDO wines derive their quality or distinctive characteristics from the geographical environment, including both natural and human factors. These products must be produced, processed, and prepared in the region from which they originate, ensuring authenticity and maintaining traditional viticulture practices [13]. Spain, which has the largest vineyard area worldwide, dedicates over 1.2 million hectares to grape cultivation [14]. However, despite its extensive vineyard area, Spain ranks as the third-largest wine producer worldwide, behind Italy and France [15]. This discrepancy is partly due to the relatively low yields related to traditional cultural practices and the country’s dry and heterogeneous soils (Figure S1) [16]. Continental Spain includes 86 PDO regions, such as Rioja, Ribera del Duero, Ribera del Guadiana, and Priorat. Continental Portugal contributes with 25 PDO regions, including the Douro Valley, Alentejo, and Dão [12,13]. These designations preserve traditional practices and promote the unique qualities of each region’s wines, supporting both their market value and cultural relevance. The location of the different PDOs in the IP are shown in Figure S2.
Despite their historical and economic significance, vineyards in the IP face significant challenges. Climate change has emerged as a major threat, altering traditional phenological stages and harvest timing [17,18], as well as climates [19]. Grapevines are highly sensitive to environmental conditions, with their growth cycle closely tied to seasonal changes. The timing of bud break, flowering, veraison, and harvest is critical for wine quality and yield, making the industry particularly vulnerable to climatic variability [20]. Rising temperatures, more frequent heatwaves, and prolonged droughts pose substantial risks, requiring adaptive management strategies [21].
Drought stress is especially concerning for viticulture, as water availability directly influences grapevine physiology and fruit development [22]. Water scarcity can reduce yields, change grape composition, and affect wine quality. In this context, climatic indices play a crucial role. These range from simple indicators, such as the De Martonne Index (DMI) [23,24,25], which relies only on precipitation and temperature data, to more complex indices that integrate multiple variables [26]. One of the main advantages of the DMI is its minimal data requirement (temperature and precipitation), which makes it particularly useful in regions with limited meteorological records and for the analysis of historical climate patterns [27]. DMI can be applied at annual, seasonal, or monthly scales, providing flexibility for assessing short-term and long-term aridity [28,29], with applicability in viticulture, water resource management, as well as early warning systems [28]. The simple formulation of the DMI also facilitates its integration with seasonal forecasts [30], which increasingly offer reliable projections of temperature and precipitation at monthly to seasonal intervals. Furthermore, for grapevines in the IP, spring water availability is especially important, as it precedes the summer dry season, and seasonal forecasts for this season have shown some potential applications for viticulture [31]. Hence, the DMI is well-suited to track changes in short-term aridity and to assess potential impacts of climate change on viticultural suitability over time [32,33,34,35].
With advances in satellite-based agricultural monitoring [36], several remote sensing vegetation indices have been developed to assess crop health and environmental stress, including the Vegetation Condition Index (VCI), Temperature Condition Index (TCI), and the Vegetation Health Index (VHI) [37,38]. These indices provide an understanding into vegetation status, supporting decision-making in viticulture [39]. The VCI identifies moisture-related stress through deviations in Normalized Difference Vegetation Index (NDVI) values [40], the TCI detects thermal stress using land surface temperature data, and the VHI combines indicators to provide an integrated measure of vegetation health. Their application enables early detection of water or heat stress, guiding interventions such as irrigation scheduling, canopy management operations, and harvest planning to improve vineyard performance and grape quality [39,41,42]. In addition to viticulture, these indices have been used globally to monitor drought events [43,44], vegetation stress linked to environmental extremes [45], fire risk [46], soil moisture [47], and other natural hazards [48], highlighting their applicability in agroecological and climate impact research.
To strengthen this approach, it is relevant to consider similar applications of the DMI and vegetation indices in other regions and agricultural systems worldwide. For instance, in Central Europe, an ultra-high-resolution analysis of the DMI revealed significant bioclimatic shifts under future climate scenarios, with projections indicating increased xerothermic conditions and a growing need for supplementary irrigation in countries such as Hungary, Slovakia, and the Czech Republic [49]. These findings underscore the DMI applicability in identifying vulnerable agricultural zones and informing long-term adaptation strategies. In parallel, vegetation indices such as the VHI have been widely adopted to monitor crop stress and environmental extremes, namely, a global long-term VHI dataset integrating climate, vegetation, and soil moisture data, demonstrated its effectiveness in detecting drought conditions and vegetation stress across diverse ecosystems [50]. Furthermore, advanced forecasting models using VHI time series, such as neural networks, have shown promising results in predicting vegetation health with high accuracy, offering valuable insights for agricultural planning and climate resilience [51].
As such, by integrating the DMI with satellite-derived vegetation indices, this study contributes to a growing body of research that leverages both climatic and remote sensing data to enhance agricultural monitoring. The IP, with its rich viticultural heritage and climatic heterogeneity, offers a compelling case study for evaluating the utility of these tools in long-term vineyard health assessment and climate adaptation planning.
Therefore, the present study aims: (i) to assess the vegetation status of vineyard areas using the remote sensing VHI, and to compute climatic aridity using the DMI, over the IP for a 30-year period; (ii) to assess if the DMI is capable of evaluating vineyard health status, comparably to the VHI; (iii) to discuss if the DMI could potentially be used as in conjunction of seasonal forecasts, given its simplicity.

2. Materials and Methods

2.1. Study Area

The study area includes vineyard regions across a range of elevations and climatic zones within the IP (Figure 1a), from coastal to inland and mountainous areas, allowing for the assessment of vegetation indices under diverse environmental conditions (Figure 1b). Vineyard zones are particularly concentrated in key wine-producing regions such as La Rioja, Castilla-La Mancha, Catalonia, Extremadura, and Andalusia in Spain, as well as Alentejo, the Douro Valley, Dão, and the Lisbon region in Portugal.
Topographically, the IP shows a substantial altitudinal variation (Figure 1b), with elevations ranging from sea level along the Atlantic and Mediterranean coasts to over 1800 m in mountainous areas, such as the Pyrenees and the Central System. Several major rivers such as Douro, Tagus, Guadiana, Guadalquivir, and Ebro traverse the peninsula. These river systems influence the terrain and provide important water resources for irrigation, creating favorable conditions for viticulture establishment.
Climatically, the peninsula displays variability, as indicated by the Köppen–Geiger classification [52] (Figure 1c). The region includes several climate types, such as cold semi-arid (BSk), hot-summer Mediterranean (Csa), warm-summer Mediterranean (Csb), oceanic (Cfb), and humid subtropical (Cfa) zones. This climatic diversity reflects the complex topography and geographic position of the peninsula.
The climate frequency distribution of vineyard areas (Figure 1e) shows that nearly 50% of vineyards are located in cold semi-arid (BSk) zones, predominantly in Spain. The remaining vineyards in both Spain and Portugal are mainly located in warm-summer (Csb) and hot-summer (Csa) Mediterranean climate zones. These results are consistent with previous studies [19]. Although viticulture is practiced across a wide altitudinal range, the elevation histogram (Figure 1d) indicates that most vineyards (40%) are concentrated between 600 and 800 m above sea level.

2.2. Data Collection

2.2.1. Vineyard Area Data

Vineyard area data used in this study were obtained from the CORINE Land Cover 2018 (CLC2018) dataset [53], provided by the Copernicus Land Monitoring Service. This land cover inventory offers spatial information at a resolution of 100 m and includes classifications for permanent crops, such as vineyards. The vineyard polygons were identified based on the corresponding CLC class codes and clipped to the boundaries of the study region of the Iberian Peninsula using ArcGIS Pro 3.2 (Environmental Systems Research Institute [Esri], Redlands, CA, USA).
To enable a direct comparison with the climatic indicators (Section 2.2.2) and remote sensing vegetation indices (Section 2.2.3) used in this study, the vineyard land cover data were aggregated to a spatial resolution of 10 km. This resampling process involved rasterizing the vineyard polygons and calculating the proportion of vineyard coverage within each 10 × 10 km grid cell. The grid was generated in ArcGIS Pro 3.2 using the Create Fishnet tool. The resulting product served as a spatial mask to extract and harmonize the vegetation indices and climatic variables used in subsequent analyses.

2.2.2. De Martonne Climate Index

The DMI was used as a climatic indicator to assess aridity conditions during the spring growing season across vineyard areas in the IP. This index is well-suited to Mediterranean climates, where both temperature and precipitation influence vegetation growth and drought sensitivity [25].
Daily precipitation and 2-meter air temperature data were obtained from the ERA5-Land reanalysis dataset (1950–2022) and was bias-corrected using the Iberia01 observational gridded dataset (1971–2015) [25]. ERA5-Land provides reanalyzed land surface and near-surface atmospheric variables at approximately 9 km spatial resolution, while Iberia01 offers high-quality observation-based daily atmospheric data across the IP based on a dense network of weather stations in Spain and Portugal. A nonstationary quantile mapping method was applied to correct biases in the ERA5-Land data, improving regional accuracy.
In this study, the DMI was calculated at a seasonal temporal resolution using a modified version of the original formula [54], expressed as:
D M I = 12 d p T + 10 ,
where d is the duration of the study period in months, p is the total precipitation during the period (in mm), and T is the mean temperature during the period (in °C). The aridity classification used to characterize the climate of the IP follows the scheme proposed by Araghi et al. [54] (Table 1).
To reflect local climatic conditions relevant to viticulture, the DMI was reclassified for vineyard areas within the IP. This involved applying a spatial mask to the original climatic datasets, including only vineyard regions for analysis. The resulting vineyard-specific DMI values aim to provide a more accurate measure of water availability and drought stress in viticultural zones.
The climatic data used for DMI calculation were provided in NetCDF format at a typical spatial resolution of 10 km. The DMI was computed for vineyard areas during the meteorological spring period (March–April–May) from 1993 to 2022, in order to capture seasonal aridity relevant to grapevine development. Seasonal NetCDF files were converted to raster format using the Make NetCDF Raster Layer tool in ArcGIS Pro 3.2. The resulting annual spring DMI rasters were then spatially summarized by extracting mean values within each 10 × 10 km vineyard grid cell using the Zonal Statistics as Table tool, allowing for the assessment of interannual and spatial variability in aridity conditions across the study area.

2.2.3. Vegetation Health Index

The VHI was used to assess vegetation stress in vineyard areas of the IP during the spring growing season (March–May), a critical period for grapevine development. VHI values range from 0 to 100. Lower values indicate higher vegetation stress due to thermal and/or moisture conditions, while higher values correspond to healthier vegetation. The VHI is a composite index derived from the VCI, which reflects moisture stress, and the TCI, which indicates thermal stress. It is calculated as follows:
V H I = α × V C I + ( 1 α ) × T C I ,
where α is a weighting factor, typically set to 0.5 to assign equal importance to both indices (VCI and TCI). This choice ensures consistency with validated global VHI products and avoids introducing bias toward either moisture or thermal stress.
The VCI and TCI are defined as in (3) and (4):
V C I = N D V I N D V I m i n N D V I m a x N D V I m i n × 100 ,
where N D V I m i n and N D V I m a x are the historical minimum and maximum NDVI values recorded for the same pixel and time period, respectively.
T C I = B T m a x B T B T m a x B T m i n × 100 ,
where B T m i n and B T m a x are the historical minimum and maximum brightness temperature for the same pixel and period, and BT is the observed brightness temperature.
VHI data were obtained from the NOAA Climate Prediction Center [55] and consist of weekly raster products in GeoTIFF format with a spatial resolution of 4 km. The VHI was calculated from radiance data observed by the Advanced Very High Resolution Radiometer (AVHRR) onboard a series of afternoon polar-orbiting NOAA satellites (NOAA-7, 9, 11, 14, 16, 18, and 19), as well as the Visible Infrared Imaging Radiometer Suite (VIIRS) onboard the Suomi-NPP satellite. Weekly VHI for spring (weeks 9–21) were averaged annually to generate a single composite raster per year. This index has been widely used for drought monitoring and vegetation health assessments [37], as it can be categorized into different drought classes (Table 2).
A reclassification was developed for vineyard areas in the IP (Table 3) to better reflect the severity of drought impacts affecting grapevine health. When comparing with the original classification (Table 2), the reclassified VHI values present changes in the number of classes (from five to four) with severe and extreme drought categories being merged into a single one, resulting in three categories representing drought conditions and one no drought category (VHI > 40).
To ensure temporal consistency and reduce the influence of short-term fluctuations, weekly VHI data were aggregated into seasonal (spring) composites. For each year from 1993 to 2022, thirteen weekly rasters corresponding to weeks 9 through 21 were selected to represent spring conditions. These rasters were clipped to the vineyard areas using the Clip Raster tool in ArcGIS Pro 3.2. The Raster Calculator was then used to compute the seasonal mean VHI by averaging the 13 weekly raster products. This process produced one composite raster per year, allowing for the interannual analysis of vegetation dynamics. These composites were reclassified into four categories representing the levels of drought-induced stress (Table 3).

2.3. Data Processing and Contingency Analysis

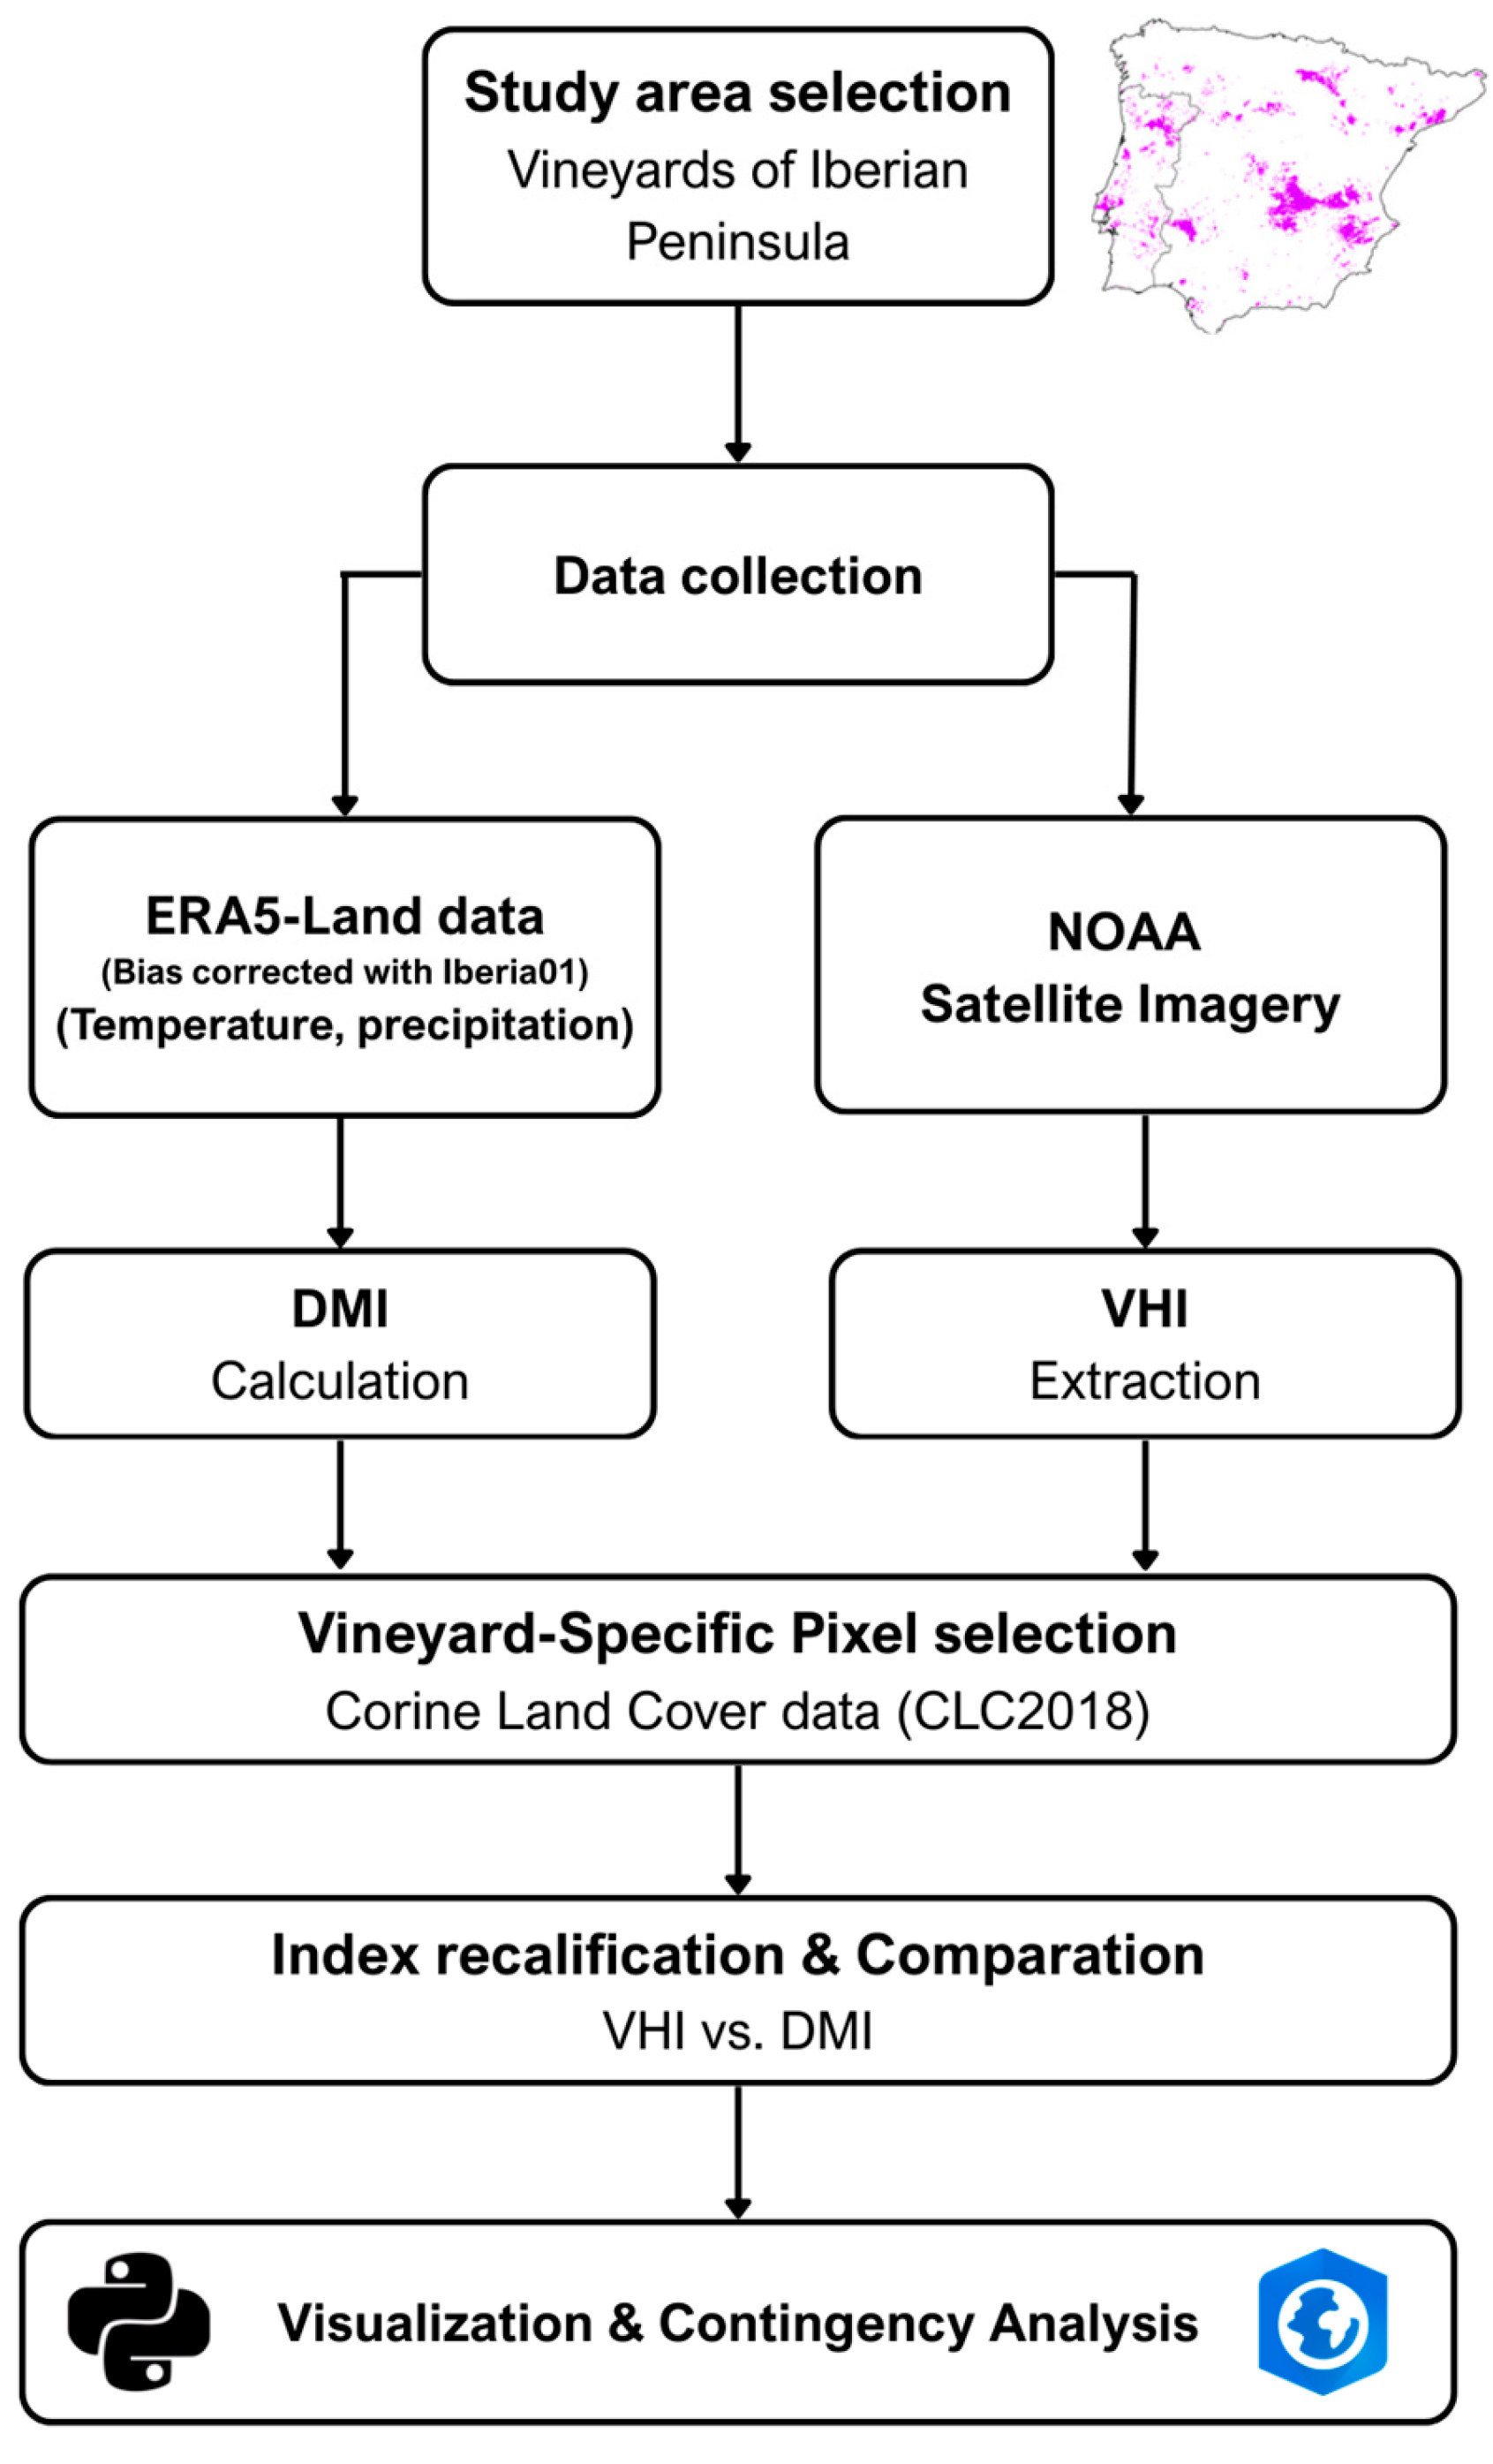
This section presents a contingency analysis that compares drought severity classifications from the DMI and the VHI (Figure 2). By evaluating the spatiotemporal agreement between these indices, the methodology aims to assess the reliability of climatic indicators in capturing vegetation stress in vineyard areas. To assess the spatial and temporal dynamics of drought and vegetation stress in vineyard areas of the IP, a multi-step geospatial analysis was performed using ArcGIS Pro 3.2, integrating both VHI and DMI data. The analysis focused on identifying patterns of climatic aridity and their correspondence with Earth observation vegetation stress data during the spring from 1993 to 2022. For each year, the percentage of vineyard area assigned to each VHI class was calculated across the IP. The resulting spatial and temporal patterns of drought stress were then visualized to identify regions and periods where vineyards experienced vegetation degradation, reflecting potential drought impacts.
To characterize aridity conditions and facilitate comparison with drought categories, continuous DMI values were reclassified into discrete drought severity classes using five threshold schemes (DMI_8, DMI_9, DMI_10, DMI_11, and DMI_12). Values above 24 mm/°C were defined as no drought or humid conditions [54]. The drought risk categories for each reclassification scheme are presented in Table 4. These reclassifications were designed to improve the interpretability of continuous DMI values in spatial analyses and to evaluate the alignment with the VHI-based stress thresholds (Table 3). The reclassified DMI raster products were intersected with the vineyard land cover mask (Section 2.2.1) to quantify the proportion of vineyard area within each drought class, allowing the evaluation of how well the schemes capture drought patterns relevant to viticulture. DMI_8 applies stricter thresholds by assigning moderate drought to values ≤ 16 mm/°C and severe or extreme drought to values ≤ 8 mm/°C, while DMI_12 uses more inclusive thresholds (≤12 mm/°C), identifying broader areas under severe/extreme drought. This gradient enables for the evaluation of threshold sensitivity and its consistency with vegetation stress indicators, with DMI_10 serving as the reference based on the literature [54]. As DMI was originally proposed for aridity monitoring, the eight classes (Table 1) were reclassified as follows: humid values as no drought, Mediterranean as mild drought, semi-arid as moderate drought, and arid and hyper-arid as severe/extreme drought. Overall, this comparative approach aims to improve the interpretation of the relationship between aridity and vegetation response for vineyard management in the IP.
To evaluate the spatial agreement between vegetation stress and climatic aridity, a contingency analysis was performed using reclassified drought categories in both indices. Each index was categorized into three drought severity classes: mild, moderate, and severe/extreme (Table 4).
For each year in the analyzed period (1993–2022), a pixel-wise comparison was conducted across vineyard areas. A contingency matrix was generated by cross-tabulating the classified VHI and DMI values. The percentage of spatial agreement was calculated for each drought class as the proportion of pixels where both indices assigned the same category. This process was repeated for each reclassification scheme, resulting in a set of agreement percentages for mild, moderate, and severe/extreme drought conditions. This contingency-based approach provides a structured framework for quantifying the consistency between climatic and vegetation-based drought indicators and for identifying how classification thresholds influence the identification of drought impacts in viticultural landscapes.
The percentage of spatial agreement between VHI and DMI for a given drought class c and year y is calculated as:
M a t c h   c , y = N   c , y m a t c h N c , y t o t a l × 100 ,
where N   c , y m a t c h is the number of pixels in vineyard areas, for which both VHI and DMI classify into the same drought category c in year y; N c , y t o t a l is the total number of pixels classified under category c by either index in year y; M a t c h   c , y is the resulting percentage of agreement for category c in year y.
To further explore the spatial dynamics of agreement between vegetation stress and climatic aridity, additional geospatial analyses were conducted using the outputs of the contingency analysis. First, pixel-wise comparisons were performed to assess how different DMI reclassification schemes influenced the spatial alignment with VHI-based drought classifications. For each scheme, the spatial agreement with VHI was calculated and compared to a reference classification, allowing the identification of areas with increased or decreased correspondence. In a complementary step, the temporal frequency of agreement between VHI and a selected DMI classification was computed by counting, for each pixel, the number of years in which both indices simultaneously identified the same drought severity class. These spatial layers were used to highlight regions with persistent or variable agreement patterns over the 30-year period, providing an understanding into the long-term coherence of drought detection across vineyard landscapes.

3. Results

3.1. Spatial Patterns of Climatic and Vegetation Conditions in Iberian Peninsula During Spring

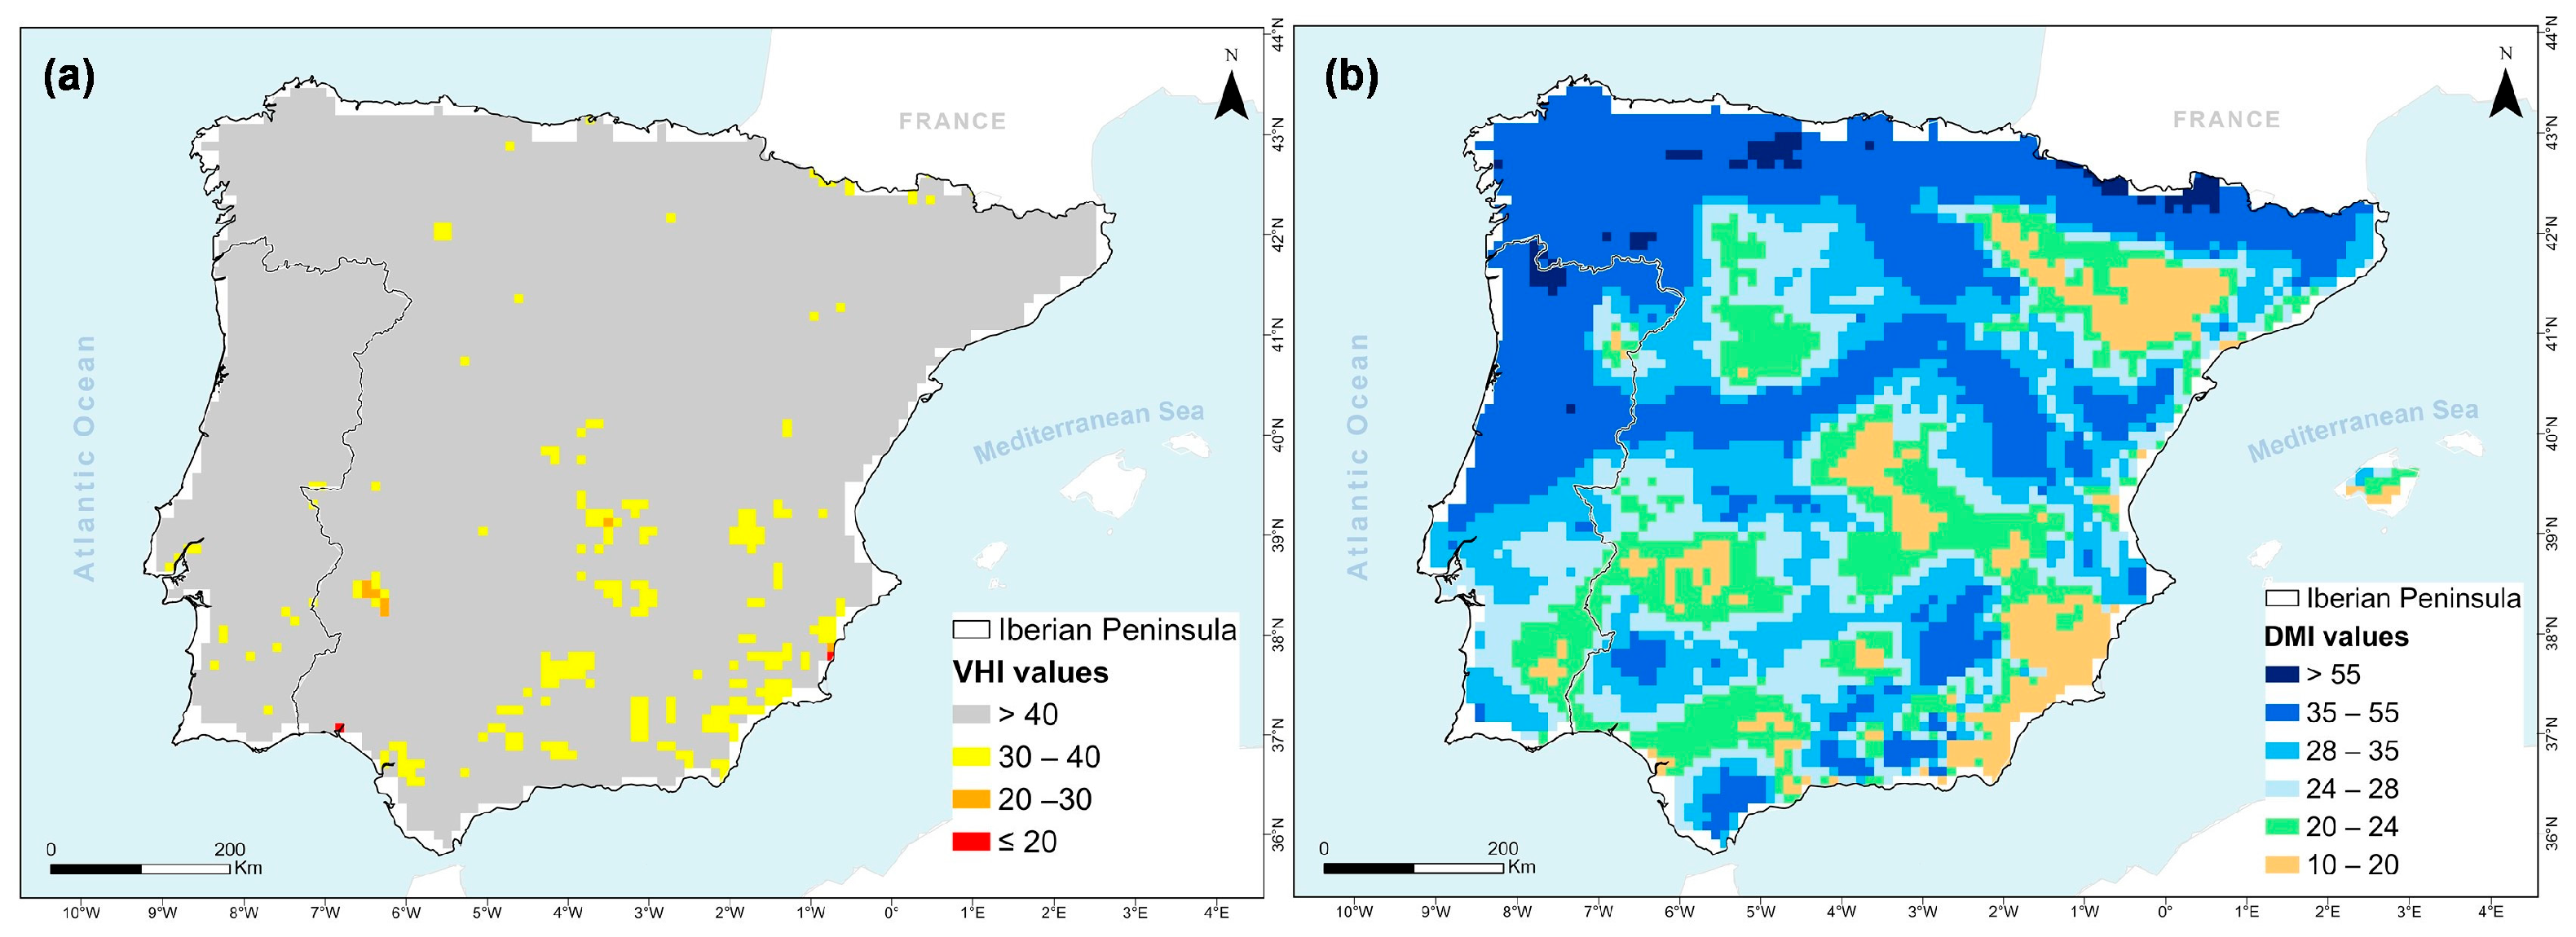
To assess the broader environmental context across the IP, spatial patterns the two indicators (VHI and DMI), were analyzed for spring over a 30-year period (1993–2022). This analysis provides an overview of the geographic variability in drought vegetation stress and climatic aridity during this timeframe (Figure 3).
The spatial distribution of mean VHI values across the IP during the spring months (March–May) averaged over the 30-year period (Figure 3a) reveals spatial heterogeneity in vegetation health. Broad areas show mean VHI values above 40 (classified as “no drought”), indicating generally favorable vegetation conditions during spring across the three decades. In contrast, some regions, particularly in the southern and southeastern parts of the peninsula, show mean VHI values between 20 and 40, indicating persistent mild to moderate spring vegetation stress.
The average spring DMI values (Figure 3b) provide a climatic gradient across the peninsula. Northern and northwestern regions show DMI values above 35, corresponding to humid or no drought conditions. In contrast, central, southern, and eastern areas mainly fall within the “low drought risk or slightly dry” or “moderate drought” categories, with DMI values between 10 and 24. These patterns reflect the well-established contrast between the humid, Atlantic-influenced north and the drier Mediterranean climates of the south and east. Together, Figure 3a,b demonstrate a consistent spatial relationship between climatic aridity and vegetation stress. Areas with lower DMI values frequently align with regions presenting reduced VHI values, supporting the influence of climatic dryness on spring vegetation dynamics in the IP.

3.2. Interpretation of Spring Drought Conditions in Iberian Vineyards Based on VHI (1993–2022)

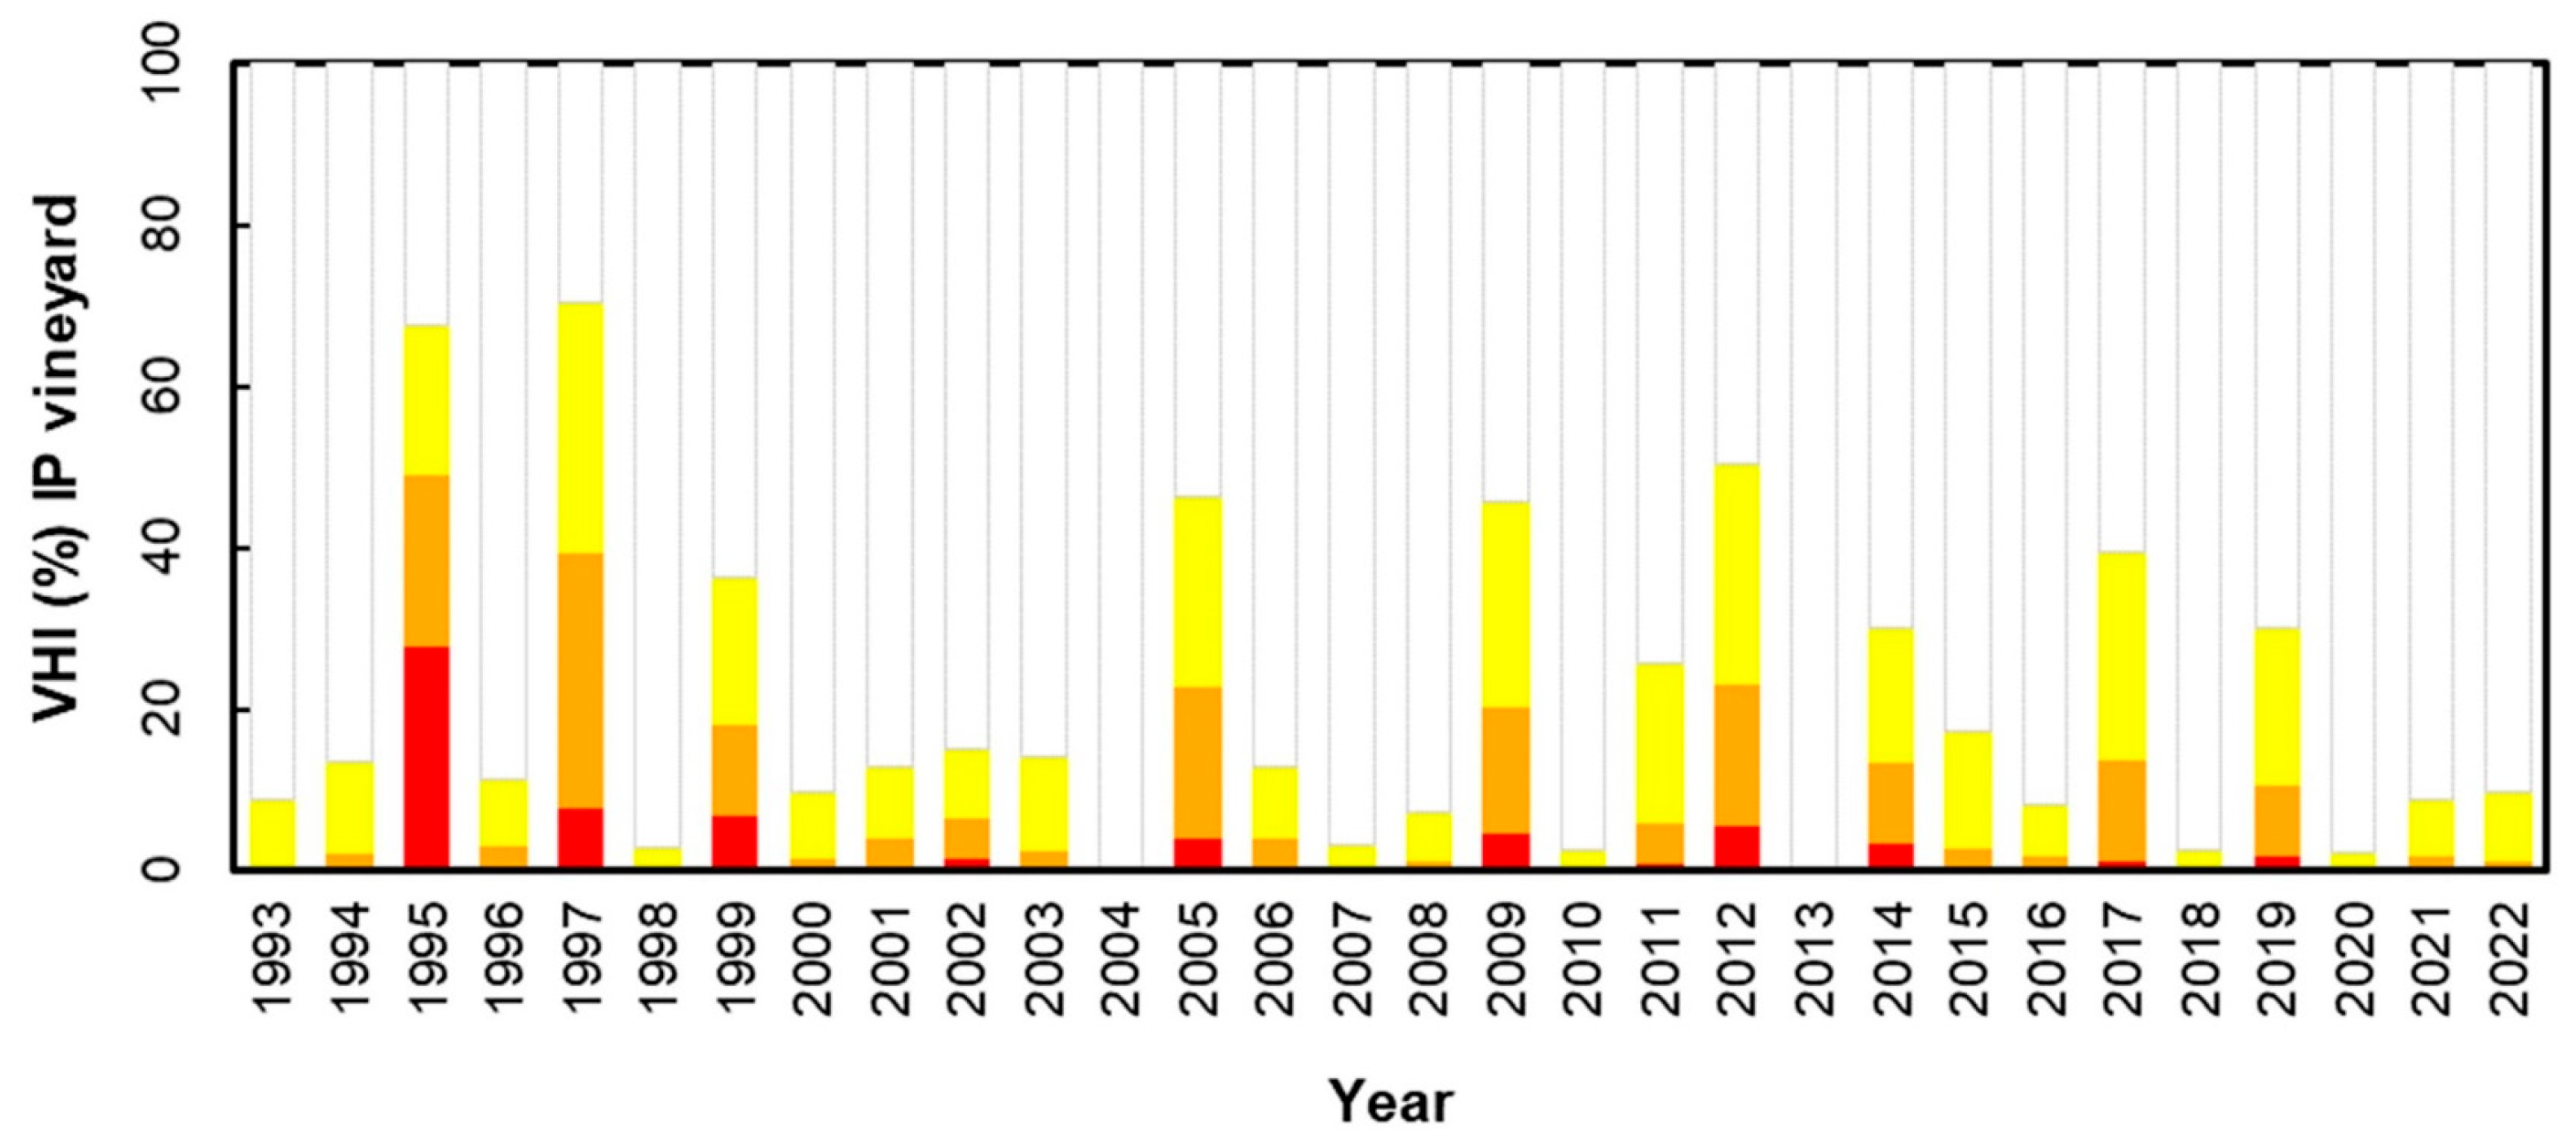
The annual distribution of drought severity in vineyard areas across the IP, based on VHI data for springs from 1993 to 2022, reveals substantial interannual variability in vegetation stress. This analysis quantifies the percentage of vineyard area affected each year by three drought categories: mild, moderate, and severe/extreme, as defined in Table 3 and presented in Figure 4.
Several years, such as 1995, 1997, 2005, 2009, and 2012, stand out for having more than 20% of vineyard areas under moderate-to-severe/extreme drought conditions. In particular, 1995 recorded more than 25% of vineyard area experiencing severe/extreme drought, marking it as the most critical year in the analyzed period. In contrast, years such as 1998, 2004, 2007, 2010, 2013, 2018, and 2020 show none or slight vineyard areas affected by drought stress, reflecting favorable spring conditions for grapevine development.
Mild drought was the most frequently observed condition throughout the study period, typically affecting between 1% and 31% of vineyard areas, except for the years 2004 and 2013, which do not indicate any type of drought. Moderate drought occurred less often but impacted between 1% and 32% of the vineyard areas in certain years, happening in 70% of the years during the period. Severe/extreme drought was relatively rare but had considerable effects when present, especially in the critical years previously identified.

3.3. Contingency Analysis of VHI–DMI Agreement During Spring Across Drought Categories

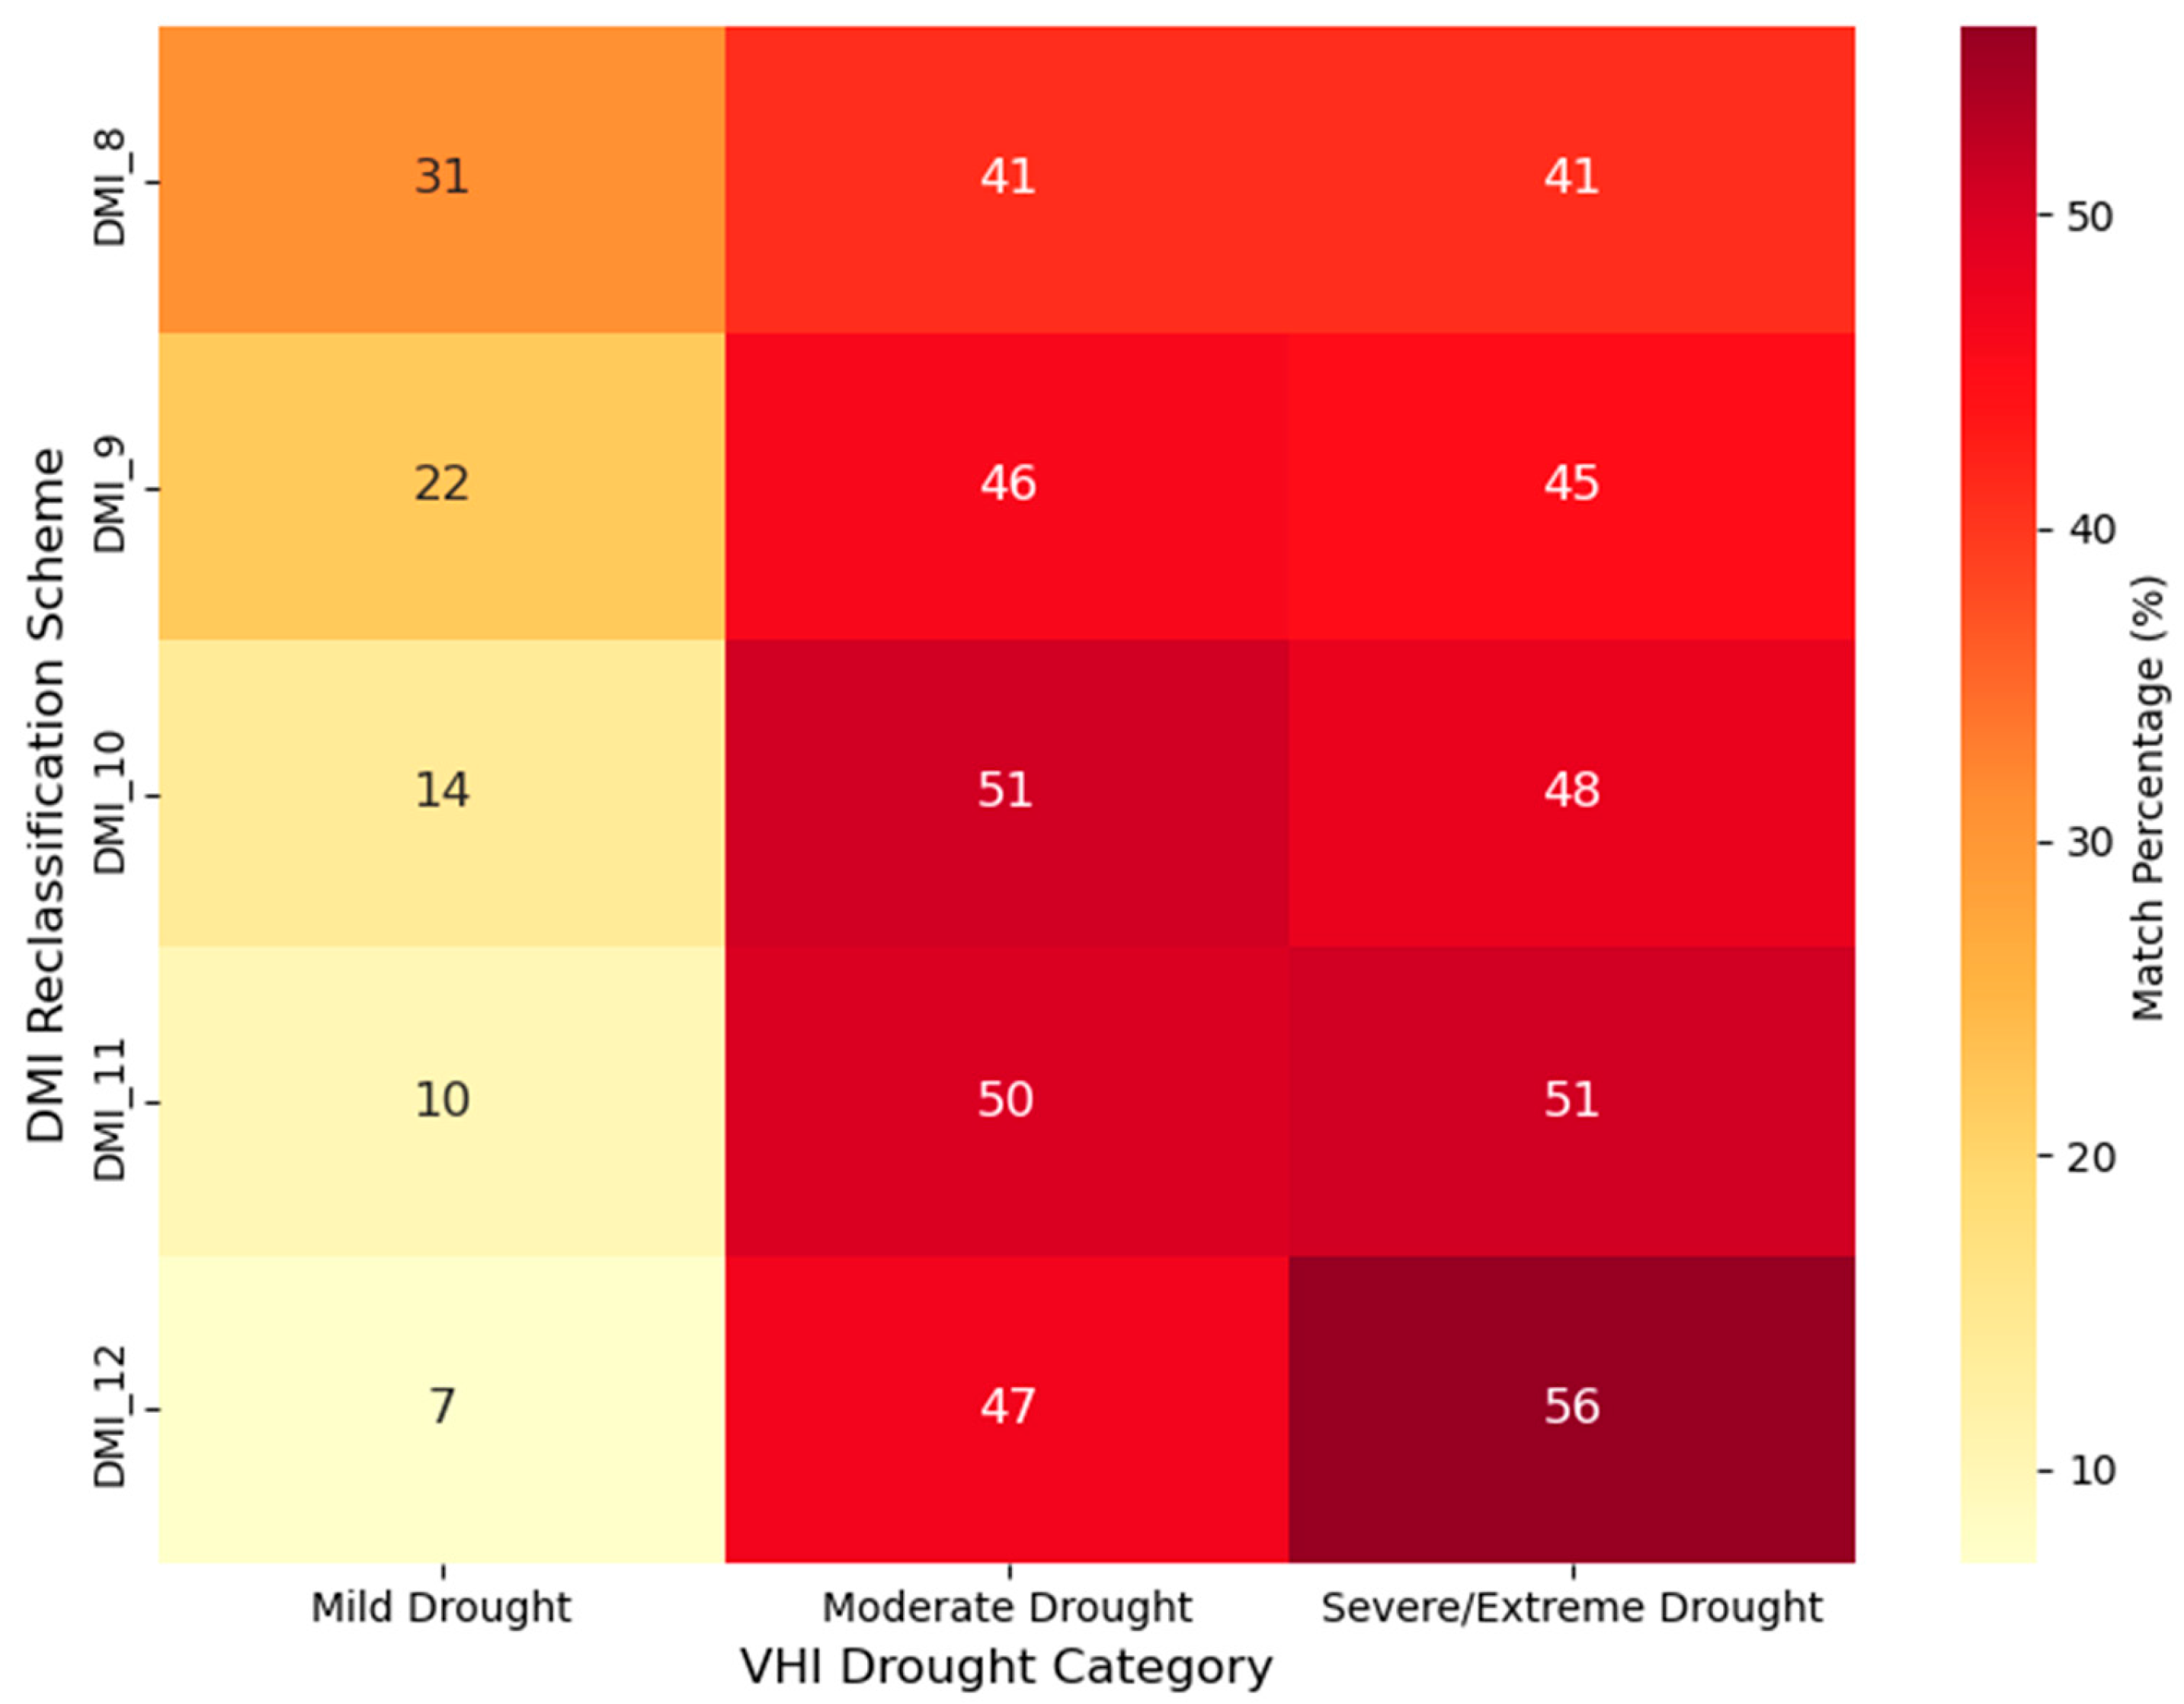
To evaluate the spatial and temporal correspondence between vegetation stress and climatic aridity a contingency analysis was conducted comparing the reclassified VHI (Table 3) and DMI (Table 4) values for the spring season across the Iberian. For each year and drought severity class (mild, moderate, and severe/extreme), the proportion of vineyard area where both indices assigned the same category was calculated. This analysis was repeated under five DMI reclassification schemes (VHI–DMI_8 to VHI–DMI_12) to assess the sensitivity to threshold selection.
The results from this analysis are presented in Figure 5. A trend emerges: as the DMI classification for severe/extreme drought becomes more inclusive (from DMI_8 to DMI_12), the spatial agreement between VHI and DMI increases for severe/extreme drought conditions, rising from 41% under DMI_8 to 56% under DMI_12. In contrast, agreement in the mild drought category decreases from 31% to 7%.
This pattern suggests that stricter DMI thresholds can capture more accurately the spatial extent of severe droughts observed in the VHI, while potentially underestimating mild drought conditions. Moderate drought shows intermediate agreement (ranging approximately from 41% to 51%), indicating a moderate alignment between the two indices for these conditions. Overall, these results highlight that the VHI may be more sensitive to moderate and severe drought events than to mild climatic anomalies. Furthermore, they underscore the impact that the choice of DMI reclassification scheme has on spatial agreement with vegetation stress indicators. This can inform the selection of the most appropriate DMI threshold for viticultural drought monitoring across the IP.
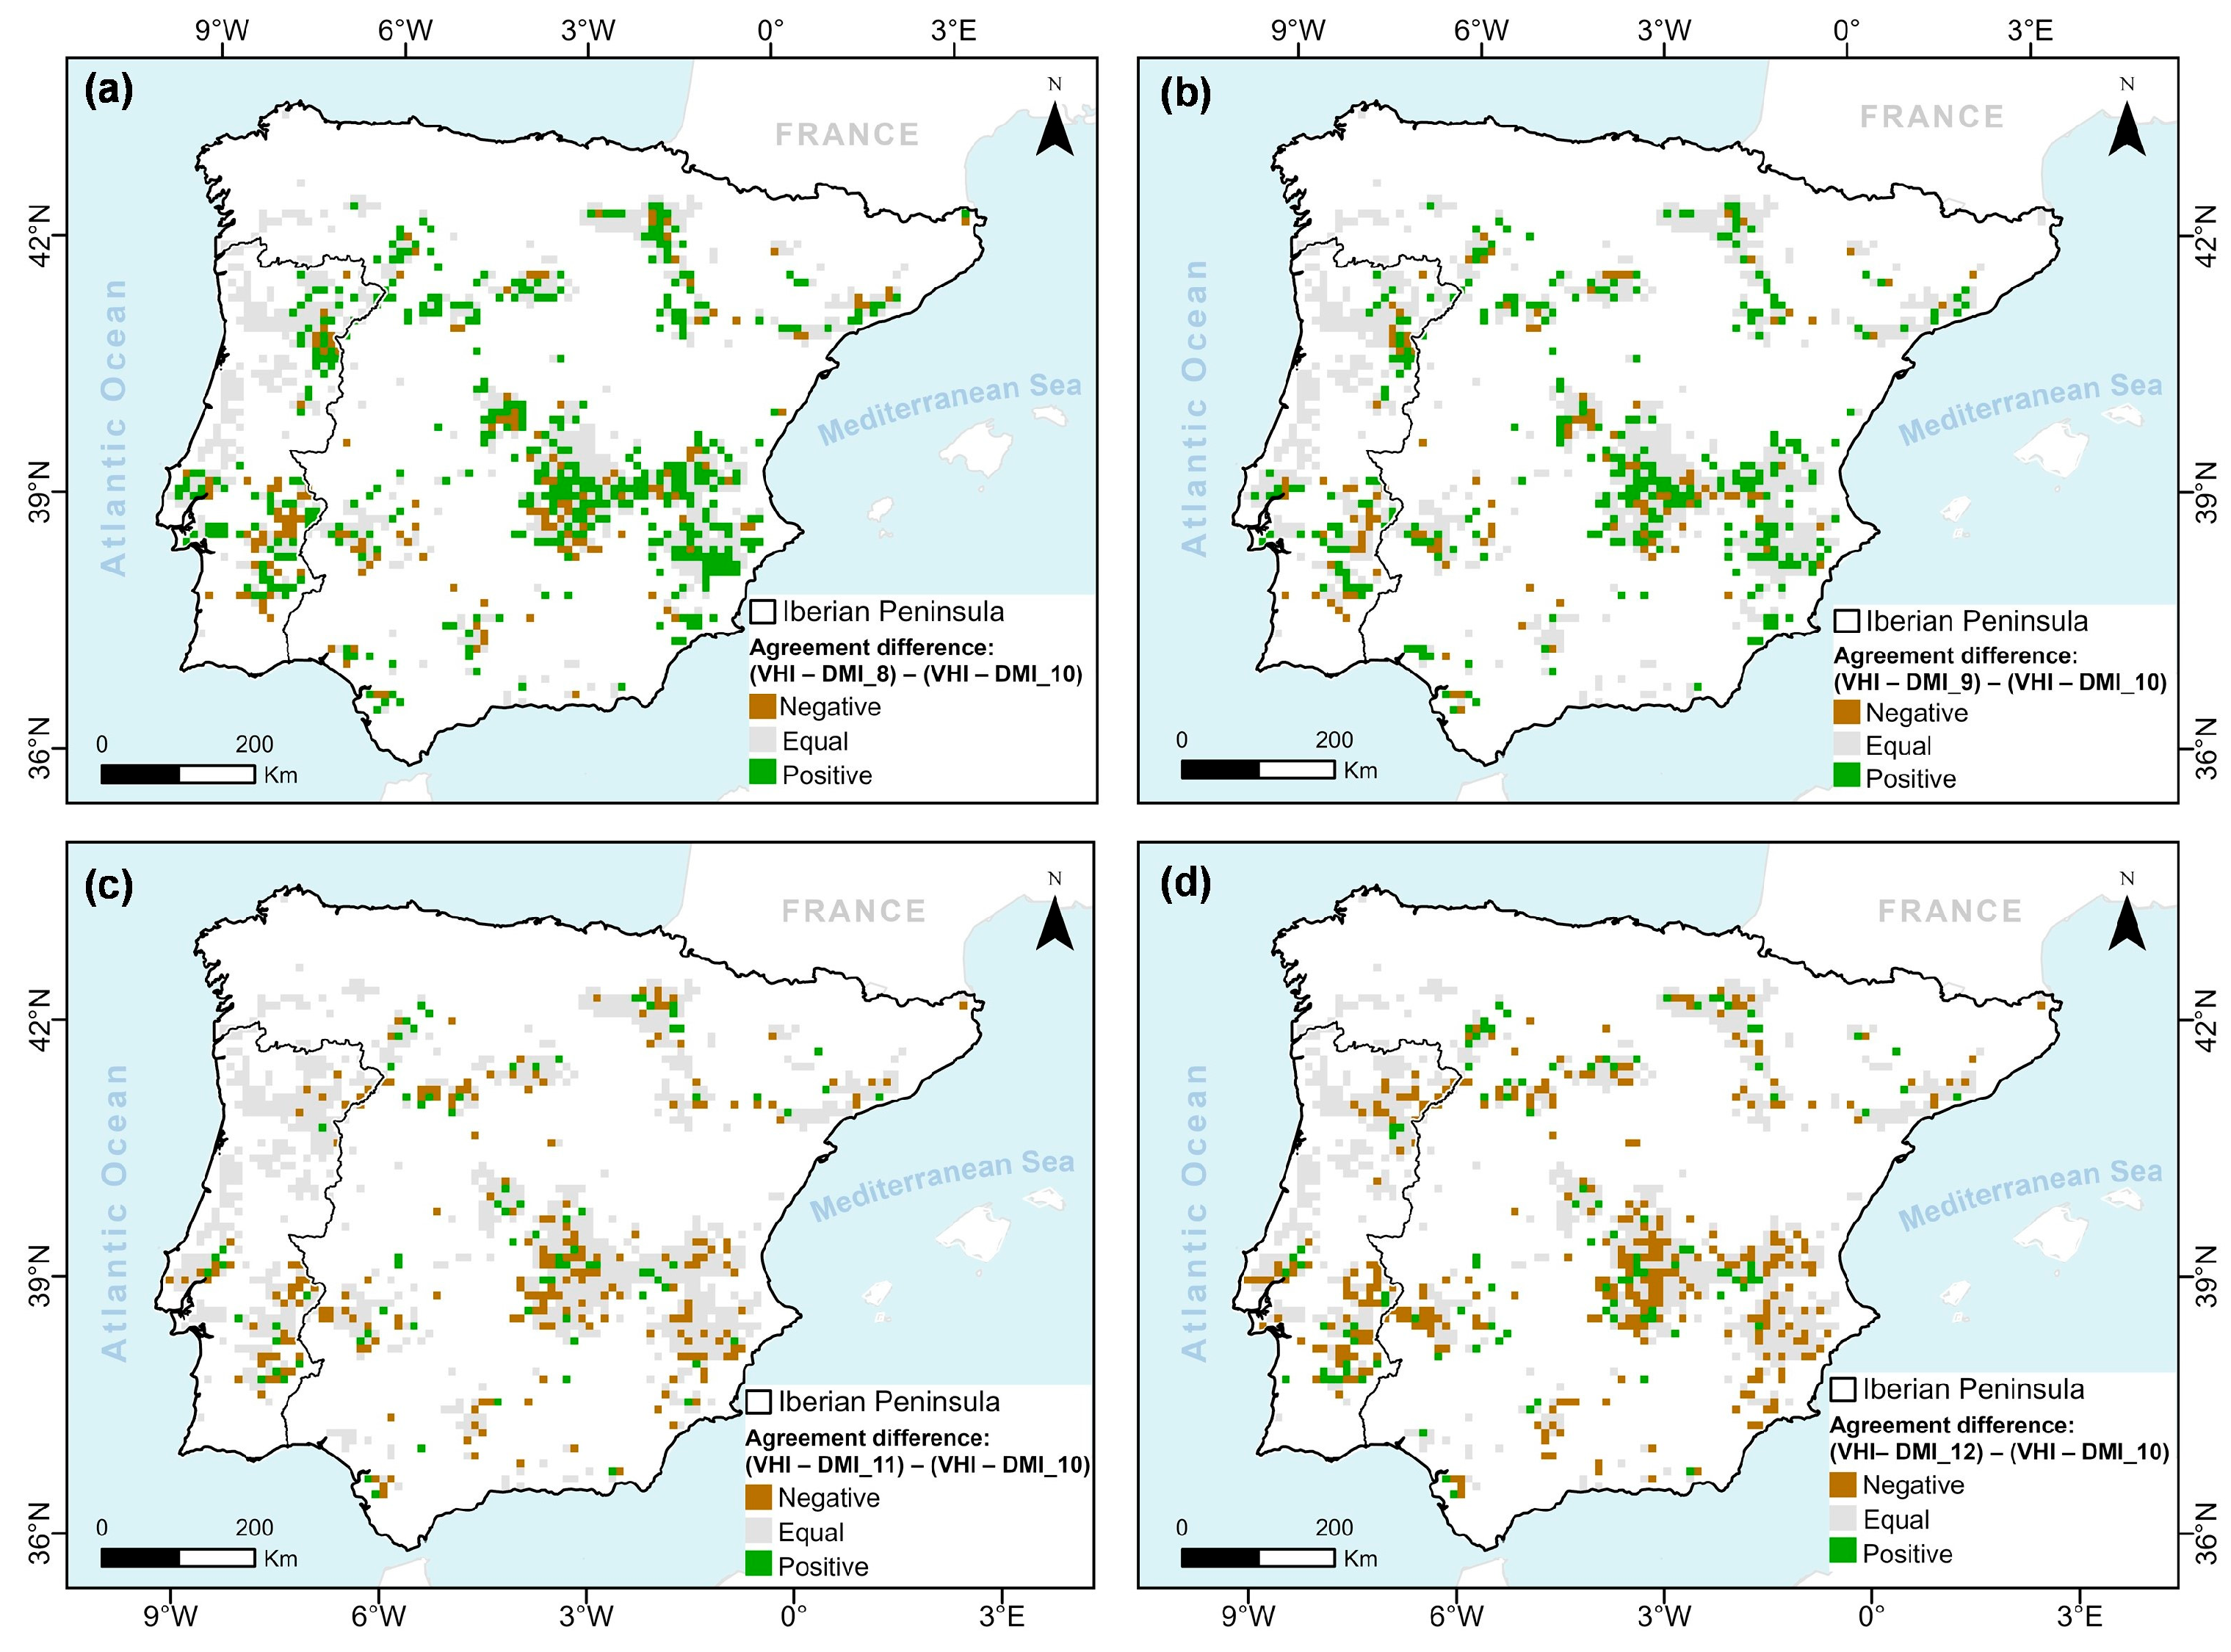
The importance of threshold selection can be determinant for drought assessment. Vegetation indices such as the VHI were more responsive to moderate and severe/extreme drought conditions than to mild events. The contingency analysis, using DMI_10 as reference is presented in Figure 6, showing the variation in the spatial correspondence between VHI and alternative DMI classifications. Relative to DMI_10, DMI_8 showed 13.7% negative, 50% equal, and 35.8% positive differences (Figure 6a). DMI_9 presented the highest agreement, with 10.7% negative, 64% equal, and 25.6% positive differences (Figure 6b). In contrast, the comparison of DMI_11 with DMI_10 (Figure 6c) resulted in 18.7% negative, 64% equal, and only 6.9% positive differences, while with DMI_12 (Figure 6d) showed the largest proportion of negative differences (28.1%), alongside 64% equal and 9.1% positive matches. The threshold values used in DMI_8 and DMI_9 (Figure 6a,b) demonstrated improvements in VHI–DMI alignment across several regions of the IP, whereas DMI_11 and DMI_12 (Figure 6c,d) present a reduced consistency, particularly in southern and central areas of the peninsula.
The spatial frequency of agreement between the VHI and DMI_10 across vineyard areas for springs from 1993 to 2022 is presented in Figure 7. Northern and central Portugal show the highest number of years with concurrent detection of extreme drought by both indices, up to 30 years in some locations, indicating persistent vulnerability to drought. In contrast, southern Portugal and parts of mainland Spain show lower agreement values (generally below 15 years), while eastern and southeastern Spain present mostly moderate to high agreement (ranging from 18 to 25 years), reflecting regional variability in drought dynamics and the sensitivity of the indices. The northwestern part of the IP shows a 100% agreement between VHI and DMI_10 during spring over the 30-year period, with both indices detecting the presence or absence of drought.

4. Discussion

The evaluation of vineyard stress across the IP is performed in this study by integrating satellite-based VHI data with the DMI, with the results demonstrating a spatio-temporal relationship between climatic aridity and vegetation stress during the spring growing season. Spring marks an important stage in the grapevine vegetative cycle, characterized by active shoot growth, leaf development, and canopy expansion [57]. During this stage, vegetation indices such as VHI are particularly sensitive to water stress, making it an optimal window for detecting early drought impacts. Additionally, water availability accumulated during winter and early spring has importance for influencing soil moisture conditions and drought severity later in the growing season. Focusing on spring therefore provides a consistent and ecologically meaningful basis for comparing drought stress across years and regions, while capturing the onset of conditions that may affect grape yield and quality [58]. Spatially, vineyards areas with lower DMI values, indicative of drier conditions, consistently coincided with areas exhibiting reduced VHI values, suggesting vegetation stress (Figure 3). This pattern aligns with previous research highlighting the sensitivity of grapevines to water availability and temperature extremes [17,34]. Temporally, the years showing increased drought severity, as indicated by VHI (Figure 4), highlight the vegetation’s response to climate-induced stress.
The reclassification of DMI to align with VHI drought categories improved the agreement between the two indices for the IP (Figure 5). The highest correspondence was observed in the severe/extreme drought category, under the effectiveness in identifying extreme drought events with pronounced impacts on vegetation health. In contrast, the agreement was lower for the mild drought category, which suggests that VHI is either less responsive to slight climatic anomalies or that grapevines maintain physiological resilience under such conditions [39,41]. This is further explained by the increasing restrictiveness of the DMI thresholds, whereby the most rigorous classifications (e.g., DMI_12) isolate only the most extreme drought conditions, which naturally present weaker associations with milder vegetation stress levels reflected by higher VHI values. Taheri Qazvini and Carrion [59] similarly find that their composite Scaled Drought Condition Index (SDCI) was suitable to identify drought events across Iran’s diverse climates, with the ability to distinguish between different drought severities and types. Their approach, however, benefits from the inclusion of precipitation anomalies (PCI), which may improve sensitivity to meteorological droughts.
The refinement reclassification of DMI—from broader (DMI_8 and DMI_9) to narrower thresholds (DMI_11 and DMI_12), allowed for a more specific comparison with VHI-based vegetation stress. This approach revealed that more restrictive DMI schemes are indeed better suited for identifying severe drought impacts, while broader schemes may overrepresent mild stress conditions. Nevertheless, the contingency-based approach demonstrated to be a suitable method to assess the consistency between climatic and vegetation-based drought indicators and underscores the importance of classification thresholds in drought analysis in Mediterranean vineyards.
The results presented in Figure 6 highlight that the choice of classification thresholds directly shapes drought detection outcomes and carries important implications for monitoring vineyards. The importance of appropriate threshold selection is important when applying the most restrictive classification (DMI_12), which highlights the role of climatic indices in agricultural drought assessment. The integration of remote sensing data with simple climatic indicators offers an applied approach for viticulture monitoring, especially in the context of increasing drought risk due to climate change, which is expected to intensify in both frequency and severity across Mediterranean regions [18,21].
The spatial frequency of agreement between the VHI and DMI_10 (Figure 7), despite showing good class agreement in most areas, there are some zones with low correspondence (southeastern and northeastern part of the IP). This may be influenced by surface characteristics and soil type [60]. Areas with shallow or rocky soils tend to support sparse vegetation cover [61], which may limit the sensitivity of vegetation indices such as VCI to climatic variability and consequently affects VHI performance [62]. In such cases, even when DMI indicates changes in moisture availability, the vegetation response may be minimal or delayed, resulting in a reduced temporal differentiation in VHI [63]. These constraints highlight the importance of considering land surface properties when interpreting drought indicators and their spatial agreement [64]. Moreover, topographic features such as slope and elevation can affect water retention and microclimatic conditions, leading to spatial discrepancies between moisture availability (as indicated by DMI) and vegetation response (as captured by VHI) [65]. Geographic variability across the IP, which includes coastal versus inland zones and regional climate gradients, also contributes to differences in index alignment [66]. These factors can help to explain zones of low VHI–DMI correspondence and underscore the importance of integrating land surface characteristics into drought assessment frameworks.
Moreover, the methodology is scalable and can be applied to other regions or crops, supporting broader agricultural monitoring and climate adaptation strategies and policies. The 10 km spatial resolution of the VHI data may limit the detection of stress in small vineyard plots, as vineyards smaller than the pixel size may be mixed with surrounding land cover. Although finer spatial resolution could provide more detailed local assessments, the spatial resolution used is sufficient to capture regional and sub-regional drought patterns affecting vineyards.
Future research could incorporate additional vegetation indices (e.g., NDVI, EVI) or machine learning approaches to improve drought monitoring, prediction and vineyard management [36,42]. The possibility to use deep learning models for VHI forecast can be considered to use in limited data availability [51], which can assist not only drought assessment but also in crop yield prediction, and noting the integration of VCI and thermal condition indices in its calculation. Integrating biophysical indicators with socio-economic data may also provide a more holistic understanding of drought impacts on viticulture and rural livelihoods [67].

5. Conclusions

This study presents a framework for assessing health and drought stress in vineyards by integrating remote sensing vegetation indices with climate-based indicators. The observed compatibility found between the VHI and the reclassified versions of the DMI demonstrates the potential of using both indices to monitor drought patterns in viticultural regions. The spatial analysis revealed an agreement between vegetation stress and climatic drought classifications, particularly under more restrictive DMI thresholds, which may suggest that this approach is capable of capturing both the intensity and geographic extent of drought impacts, offering a perspective for regional-scale monitoring.
An important advantage of DMI is its simplicity and reliance on basic meteorological variables (temperature and precipitation) which have influence on grapevine growth, yield, and quality. This makes DMI suitable for integration into seasonal forecasting and predictive modelling frameworks, similar to previous studies [30,31,68] and enabling the development of early warning systems for vineyard drought stress. While VHI provides a more direct measure of vegetation status, it can be influenced by short-term fluctuations and may be less responsive to mild drought conditions. In contrast, DMI when reclassified with more restrictive thresholds, aligns well with severe drought impacts and can be more robust for anticipating stress events that affect grape production and quality. The selection of appropriate DMI classification thresholds is therefore crucial, as it contributes to the accuracy in detecting drought severity and ensures a better alignment with vegetation-based stress responses.
The contingency-based approach serves both to quantify the agreement between climate- and vegetation-based indicators and provides a transferable methodology for other crops and regions. Its scalability and low data requirements make it relevant for areas with limited access to high-resolution environmental monitoring.
The integration of VHI with DMI is advantageous for viticulture, since it not only reflects climatic drought conditions but also captures the physiological stress experienced in vineyards. This dual perspective is directly linked to yield reduction and grape quality, providing a more accurate and viticulture-specific assessment of drought impacts than climatic indices alone. Therefore, future work should focus on operationalizing this framework in predictive applications, including the use of seasonal climate forecasts and machine learning techniques to anticipate drought impacts. Coupling these tools with vineyard management practices could improve resilience and sustainability under increasing climate variability.

Supplementary Materials

The following supporting information can be downloaded at: https://www.mdpi.com/article/10.3390/app151910605/s1, Figure S1: Soil types in the Iberian Peninsula from the European Soil Database (ESDB); Figure S2: Geographic distribution of viticultural regions across the Iberian Peninsula, indicating their respective Protected Designation of Origin (PDO) status in 2022. Table S1: Köppen-Geiger climate classification adapted from Beck et al. (2018) [52].

Author Contributions

Conceptualization, N.C.-C., L.P., J.A.S., and H.F.; methodology, N.C.-C., L.P., A.M.C., A.F., F.J.R., F.J.M., L.L.P., A.G.-M., J.A.S., and H.F.; software, N.C.-C.; validation, L.P., F.J.R., F.J.M., L.L.P., A.G.-M., J.A.S., and H.F.; formal analysis, N.C.-C., A.M.C., and A.F.; investigation, N.C.-C.; resources, J.A.S. and H.F.; data curation, N.C.-C., A.M.C. and A.F.; writing—original draft preparation, N.C.-C.; writing—review and editing, L.P., A.M.C., A.F., F.J.R., F.J.M., L.L.P., A.G.-M., J.A.S., and H.F.; visualization, N.C.-C., L.P. and H.F.; supervision, L.P., J.A.S. and H.F.; project administration, J.A.S. and H.F.; funding acquisition, J.A.S. and H.F. All authors have read and agreed to the published version of the manuscript.

Funding

This work was funded by the WaterQB “Integrated web-based platform for supporting irrigation management aiming at coping with climate variability and changes” project (2022.04553.PTDC, https://doi.org/10.54499/2022.04553.PTDC), financed by the Portuguese Foundation for Science and Technology (FCT). The authors also thank FCT for the following projects: UID/04033/2025: Centro de Investigação e de Tecnologias Agro-Ambientais e Biológicas, LA/P/0126/2020 of Associate Laboratory Inov4Agro (https://doi.org/10.54499/LA/P/0126/2020), and 2022.02317.CEECIND (https://doi.org/10.54499/2022.02317.CEECIND/CP1749/CT0002).

Data Availability Statement

The data that support the findings of this study are available from the corresponding author upon reasonable request.

Acknowledgments

This work was funded by the WaterQB “Integrated web-based platform for supporting irrigation management aiming at coping with climate variability and changes” project (2022.04553.PTDC, https://doi.org/10.54499/2022.04553.PTDC), financed by the Portuguese Foundation for Science and Technology (FCT). The authors also thank FCT for the following projects: UID/04033/2025: Centro de Investigação e de Tecnologias Agro-Ambientais e Biológicas, LA/P/0126/2020 of Associate Laboratory Inov4Agro (https://doi.org/10.54499/LA/P/0126/2020), and 2022.02317.CEECIND (https://doi.org/10.54499/2022.02317.CEECIND/CP1749/CT0002). This research activity was also supported by the Vine&Wine Portugal Project, ref. C644866286–00000011. A.C. thanks the Massachusetts Institute of Technology (MIT) and the FCT for their support through the MIT Portugal Partnership 2030 (MPP2030-FCT), grant number PRT/BD/154652/2023 (https://doi.org/10.54499/PRT/BD/154652/2023).

Conflicts of Interest

The authors declare no conflict of interest. The funders had no role in the design of the study; in the collection, analyses, or interpretation of data; in the writing of the manuscript; or in the decision to publish the results.

Abbreviations

The following abbreviations are used in this manuscript:
AVHRRAdvanced Very High Resolution Radiometer
BTBrightness temperature
CLC2018CORINE Land Cover 2018
DMIDe Martonne Index
IPIberian Peninsula
NDVINormalized Difference Vegetation Index
NOAANational Oceanic and Atmospheric Administration
PDOProtected Designation of Origin
TCITemperature Condition Index
VCIVegetation Condition Index
VHIVegetation Health Index
VIIRSVisible Infrared Imaging Radiometer Suite

References

  1. Frankel, R.; Franḳel, R. Wine and Oil Production in Antiquity in Israel and Other Mediterranean Countries; American Schools of Oriental Research: JSOT ASOR monograph series; Sheffield Academic Press: Sheffield, UK, 1999; ISBN 978-1-85075-519-7. [Google Scholar]
  2. Harutyunyan, M.; Malfeito-Ferreira, M. The Rise of Wine among Ancient Civilizations across the Mediterranean Basin. Heritage 2022, 5, 788–812. [Google Scholar] [CrossRef]
  3. Jones, G.V.; Davis, R.E. Climate Influences on Grapevine Phenology, Grape Composition, and Wine Production and Quality for Bordeaux, France. Am. J. Enol. Vitic. 2000, 51, 249–261. [Google Scholar] [CrossRef]
  4. Torregrosa, L.; Vialet, S.; Adivèze, A.; Iocco-Corena, P.; Thomas, M.R. Grapevine (Vitis Vinifera L.). In Agrobacterium Protocols; Wang, K., Ed.; Springer: New York, NY, USA, 2015; Volume 2, pp. 177–194. ISBN 978-1-4939-1658-0. [Google Scholar]
  5. Van Leeuwen, C.; Seguin, G. The Concept of Terroir in Viticulture. J. Wine Res. 2006, 17, 1–10. [Google Scholar] [CrossRef]
  6. Alston, J.; Sambucci, O. Grapes in the World Economy. In The Grape Genome; Springer International Publishing: Cham, Switzerland, 2019; pp. 1–24. ISBN 978-3-030-18600-5. [Google Scholar]
  7. Montalvo-Falcón, J.V.; Sánchez-García, E.; Marco-Lajara, B.; Martínez-Falcó, J. Sustainability Research in the Wine Industry: A Bibliometric Approach. Agronomy 2023, 13, 871. [Google Scholar] [CrossRef]
  8. Estreicher, S.K. A Brief History of Wine in Spain. Eur. Rev. 2013, 21, 209–239. [Google Scholar] [CrossRef]
  9. Iriarte-Chiapusso, M.J.; Ocete-Pérez, C.A.; Hernández-Beloqui, B.; Ocete-Rubio, R. Vitis Vinifera in the Iberian Peninsula: A Review. Plant Biosyst.—Int. J. Deal. Asp. Plant Biol. 2017, 151, 245–257. [Google Scholar] [CrossRef]
  10. Lavrador Da Silva, A.; João Fernão-Pires, M.; Bianchi-de-Aguiar, F. Portuguese Vines and Wines: Heritage, Quality Symbol, Tourism Asset. Ciênc. E Téc. Vitivinícola 2018, 33, 31–46. [Google Scholar] [CrossRef]
  11. Santos, F.A.D.N.; Vavdinos, N.; Martinez, L.F. Avances y Perspectivas Para La Investigación Del Turismo Del Vino En Portugal. PASOS Rev. Tur. Patrim. Cult. 2020, 18, 159–170. [Google Scholar] [CrossRef]
  12. Fraga, H.; Malheiro, A.C.; Moutinho-Pereira, J.; Cardoso, R.M.; Soares, P.M.M.; Cancela, J.J.; Pinto, J.G.; Santos, J.A. Integrated Analysis of Climate, Soil, Topography and Vegetative Growth in Iberian Viticultural Regions. PLoS ONE 2014, 9, e108078. [Google Scholar] [CrossRef]
  13. Candiago, S.; Tscholl, S.; Bassani, L.; Fraga, H.; Egarter Vigl, L. A Geospatial Inventory of Regulatory Information for Wine Protected Designations of Origin in Europe. Sci. Data 2022, 9, 394. [Google Scholar] [CrossRef]
  14. Smith, P.; Soussana, J.; Angers, D.; Schipper, L.; Chenu, C.; Rasse, D.P.; Batjes, N.H.; Van Egmond, F.; McNeill, S.; Kuhnert, M.; et al. How to Measure, Report and Verify Soil Carbon Change to Realize the Potential of Soil Carbon Sequestration for Atmospheric Greenhouse Gas Removal. Glob. Change Biol. 2020, 26, 219–241. [Google Scholar] [CrossRef]
  15. FAOSTAT. FAOSTAT Statistical Database. Available online: https://www.fao.org/faostat/en/#data/QCL (accessed on 28 February 2024).
  16. Panagos, P.; Van Liedekerke, M.; Borrelli, P.; Köninger, J.; Ballabio, C.; Orgiazzi, A.; Lugato, E.; Liakos, L.; Hervas, J.; Jones, A.; et al. European Soil Data Centre 2.0: Soil Data and Knowledge in Support of the EU Policies. Eur. J. Soil Sci. 2022, 73, e13315. [Google Scholar] [CrossRef]
  17. Fraga, H.; Amraoui, M.; Malheiro, A.C.; Moutinho-Pereira, J.; Eiras-Dias, J.; Silvestre, J.; Santos, J.A. Examining the Relationship between the Enhanced Vegetation Index and Grapevine Phenology. Eur. J. Remote Sens. 2014, 47, 753–771. [Google Scholar] [CrossRef]
  18. Santos, J.A.; Fraga, H.; Malheiro, A.C.; Moutinho-Pereira, J.; Dinis, L.-T.; Correia, C.; Moriondo, M.; Leolini, L.; Dibari, C.; Costafreda-Aumedes, S.; et al. A Review of the Potential Climate Change Impacts and Adaptation Options for European Viticulture. Appl. Sci. 2020, 10, 3092. [Google Scholar] [CrossRef]
  19. Andrade, C.; Fonseca, A.; Santos, J.A.; Bois, B.; Jones, G.V. Historic Changes and Future Projections in Köppen–Geiger Climate Classifications in Major Wine Regions Worldwide. Climate 2024, 12, 94. [Google Scholar] [CrossRef]
  20. Jones, G.V.; Goodrich, G.B. Influence of Climate Variability on Wine Regions in the Western USA and on Wine Quality in the Napa Valley. Clim. Res. 2008, 35, 241–254. [Google Scholar] [CrossRef]
  21. Weiskopf, S.R.; Rubenstein, M.A.; Crozier, L.G.; Gaichas, S.; Griffis, R.; Halofsky, J.E.; Hyde, K.J.W.; Morelli, T.L.; Morisette, J.T.; Muñoz, R.C.; et al. Climate Change Effects on Biodiversity, Ecosystems, Ecosystem Services, and Natural Resource Management in the United States. Sci. Total Environ. 2020, 733, 137782. [Google Scholar] [CrossRef] [PubMed]
  22. Gambetta, G.A.; Herrera, J.C.; Dayer, S.; Feng, Q.; Hochberg, U.; Castellarin, S.D. The Physiology of Drought Stress in Grapevine: Towards an Integrative Definition of Drought Tolerance. J. Exp. Bot. 2020, 71, 4658–4676. [Google Scholar] [CrossRef]
  23. De Martonne, E. L’indice d’aridité. Bull. Assoc. Géographes Fr. 1926, 3, 3–5. [Google Scholar] [CrossRef]
  24. Moral, F.J.; Rebollo, F.J.; Paniagua, L.L.; García-Martín, A.; Honorio, F. Spatial Distribution and Comparison of Aridity Indices in Extremadura, Southwestern Spain. Theor. Appl. Climatol. 2016, 126, 801–814. [Google Scholar] [CrossRef]
  25. Claro, A.M.; Fonseca, A.; Fraga, H.; Santos, J.A. Susceptibility of Iberia to Extreme Precipitation and Aridity: A New High-Resolution Analysis over an Extended Historical Period. Water 2023, 15, 3840. [Google Scholar] [CrossRef]
  26. Pellicone, G.; Caloiero, T.; Guagliardi, I. The De Martonne Aridity Index in Calabria (Southern Italy). J. Maps 2019, 15, 788–796. [Google Scholar] [CrossRef]
  27. Krivoguz, D. Analysis of Spatial and Temporal Dynamics of Climate Aridization in Rostov Oblast in 1951–2054 Using ERA5 and CMIP6 Data and the De Martonne Index. Climate 2025, 13, 151. [Google Scholar] [CrossRef]
  28. Paltineanu, C.; Tanasescu, N.; Chitu, E.; Mihailescu, I.F. Relationships between the De Martonne Aridity Index and Water Requirements of Some Representative Crops: A Case Study from Romania. Int. Agrophysics 2007, 21, 81–93. Available online: http://www.international-agrophysics.org/Relationships-between-the-De-Martonne-aridity-index-and-water-requirements-nof-some,106531,0,2.html (accessed on 28 September 2025).
  29. Milovanović, B.; Schubert, S.; Radovanović, M.; Vakanjac, V.R.; Schneider, C. Projected Changes in Air Temperature, Precipitation and Aridity in Serbia in the 21st Century. Int. J. Climatol. 2022, 42, 1985–2003. [Google Scholar] [CrossRef]
  30. Santos, J.A.; Ceglar, A.; Toreti, A.; Prodhomme, C. Performance of Seasonal Forecasts of Douro and Port Wine Production. Agric. For. Meteorol. 2020, 291, 108095. [Google Scholar] [CrossRef]
  31. Yang, C.; Ceglar, A.; Menz, C.; Martins, J.; Fraga, H.; Santos, J.A. Performance of Seasonal Forecasts for the Flowering and Veraison of Two Major Portuguese Grapevine Varieties. Agric. For. Meteorol. 2023, 331, 109342. [Google Scholar] [CrossRef]
  32. Blanco-Ward, D.; Ribeiro, A.; Barreales, D.; Castro, J.; Verdial, J.; Feliciano, M.; Viceto, C.; Rocha, A.; Carlos, C.; Silveira, C.; et al. Climate Change Potential Effects on Grapevine Bioclimatic Indices: A Case Study for the Portuguese Demarcated Douro Region (Portugal). BIO Web Conf. 2019, 12, 01013. [Google Scholar] [CrossRef]
  33. Irimia, L.M.; Patriche, C.V.; Petitjean, T.; Tissot, C.; Santesteban, L.G.; Neethling, E.; Foss, C.; Le Roux, R.; Quénol, H. Structural and Spatial Shifts in the Viticulture Potential of Main European Wine Regions as an Effect of Climate Change. Horticulturae 2024, 10, 413. [Google Scholar] [CrossRef]
  34. Jones, G.V.; Alves, F. Impacts of Climate Change on Wine Production: A Global Overview and Regional Assessment in the Douro Valley of Portugal. Int. J. Glob. Warm. 2012, 4, 383–406. [Google Scholar] [CrossRef]
  35. Moral, F.J.; Aguirado, C.; Alberdi, V.; García-Martín, A.; Paniagua, L.L.; Rebollo, F.J. Future Scenarios for Viticultural Suitability under Conditions of Global Climate Change in Extremadura, Southwestern Spain. Agriculture 2022, 12, 1865. [Google Scholar] [CrossRef]
  36. Lungu, O.N.; Chabala, L.M.; Shepande, C. Satellite-Based Crop Monitoring and Yield Estimation—A Review. J. Agric. Sci. 2020, 13, 180. [Google Scholar] [CrossRef]
  37. Kogan, F.N. Global Drought Watch from Space. Bull. Am. Meteorol. Soc. 1997, 78, 621–636. [Google Scholar] [CrossRef]
  38. Kogan, F.N. Application of Vegetation Index and Brightness Temperature for Drought Detection. Adv. Space Res. 1995, 15, 91–100. [Google Scholar] [CrossRef]
  39. Del Rio, M.S.; Cicuéndez, V.; Yagüe, C. Characterisation of Two Vineyards in Mexico Based on Sentinel-2 and Meteorological Data. Remote Sens. 2024, 16, 2538. [Google Scholar] [CrossRef]
  40. Rouse, J.W.; Haas, R.H.; Deering, D.W.; Schell, J.A.; Harlan, J.C. Monitoring the Vernal Advancement and Retrogradation (Green Wave Effect) of Natural Vegetation; Remote Sensing Center, Texas A&M University: College Station, TX, USA, 1973. [Google Scholar]
  41. Faraslis, I.; Dalezios, N.R.; Alpanakis, N.; Tziatzios, G.A.; Spiliotopoulos, M.; Sakellariou, S.; Sidiropoulos, P.; Dercas, N.; Domínguez, A.; Martínez-López, J.A.; et al. Remotely Sensed Agroclimatic Classification and Zoning in Water-Limited Mediterranean Areas towards Sustainable Agriculture. Remote Sens. 2023, 15, 5720. [Google Scholar] [CrossRef]
  42. Tao, S.; Zhang, X.; Feng, R.; Qi, W.; Wang, Y.; Shrestha, B. Retrieving Soil Moisture from Grape Growing Areas Using Multi-Feature and Stacking-Based Ensemble Learning Modeling. Comput. Electron. Agric. 2023, 204, 107537. [Google Scholar] [CrossRef]
  43. Zeng, J.; Zhang, R.; Qu, Y.; Bento, V.A.; Zhou, T.; Lin, Y.; Wu, X.; Qi, J.; Shui, W.; Wang, Q. Improving the Drought Monitoring Capability of VHI at the Global Scale via Ensemble Indices for Various Vegetation Types from 2001 to 2018. Weather Clim. Extrem. 2022, 35, 100412. [Google Scholar] [CrossRef]
  44. Shahzaman, M.; Zhu, W.; Bilal, M.; Habtemicheal, B.A.; Mustafa, F.; Arshad, M.; Ullah, I.; Ishfaq, S.; Iqbal, R. Remote Sensing Indices for Spatial Monitoring of Agricultural Drought in South Asian Countries. Remote Sens. 2021, 13, 2059. [Google Scholar] [CrossRef]
  45. Ma, P.; Peng, J.; Zheng, J.; Liu, L.; Yu, X.; Li, W. Vegetation Health in China Is Severely Compromised by Drought, Wet and Heat Stress Events. Forests 2024, 16, 38. [Google Scholar] [CrossRef]
  46. Sari Astuti, I.; Abdul Gani Alfarizi, I.; Aulia Herlambang, G.; Aulia Herlambang, G.; Hartono, R.; Rahmawati Sucahyo, H.; Setiabudi Wiwoho, B. Drought Indices to Map Forest Fire Risks in Topographically Complex Mountain Landscapes. KnE Soc. Sci. 2022, 197–209. [Google Scholar] [CrossRef]
  47. Kogan, F. New Remote Sensing Vegetation Health Technology. In Remote Sensing Land Surface Changes: The 1981-2020 Intensive Global Warming; Kogan, F., Ed.; Springer International Publishing: Cham, Swithzerland, 2022; pp. 121–148. ISBN 978-3-030-96810-6. [Google Scholar]
  48. Bugalho, L.; Camara, N.; Kogan, F.N. Monitoring of Forest Fire Risk Conditions in Portugal with NOAA/NESDIS Satellite-Based Vegetation Health Index. In Advances in Forest Fire Research 2018; Imprensa da Universidade de Coimbra: Coimbra, Portugal, 2018; pp. 110–118. ISBN 978-989-26-1650-6. [Google Scholar]
  49. Charalampopoulos, I.; Droulia, F.; Kokkoris, I.P.; Dimopoulos, P. Future Bioclimatic Change of Agricultural and Natural Areas in Central Europe: An Ultra-High Resolution Analysis of the De Martonne Index. Water 2023, 15, 2563. [Google Scholar] [CrossRef]
  50. Zeng, J.; Zhou, T.; Qu, Y.; Bento, V.A.; Qi, J.; Xu, Y.; Li, Y.; Wang, Q. An Improved Global Vegetation Health Index Dataset in Detecting Vegetation Drought. Sci. Data 2023, 10, 338. [Google Scholar] [CrossRef]
  51. Kartal, S.; Iban, M.C.; Sekertekin, A. Next-Level Vegetation Health Index Forecasting: A ConvLSTM Study Using MODIS Time Series. Environ. Sci. Pollut. Res. 2024, 31, 18932–18948. [Google Scholar] [CrossRef]
  52. Beck, H.E.; Zimmermann, N.E.; McVicar, T.R.; Vergopolan, N.; Berg, A.; Wood, E.F. Present and Future Köppen-Geiger Climate Classification Maps at 1-Km Resolution. Sci. Data 2018, 5, 180214. [Google Scholar] [CrossRef] [PubMed]
  53. European Environment Agency. Corine Land Cover 2018 (Vector), Europe, 6-Yearly—Version 2020_20u1. 2020. Available online: https://land.copernicus.eu/en/products/corine-land-cover/clc2018 (accessed on 28 November 2024).
  54. Araghi, A.; Martinez, C.J.; Adamowski, J.; Olesen, J.E. Spatiotemporal Variations of Aridity in Iran Using High-Resolution Gridded Data. Int. J. Climatol. 2018, 38, 2701–2717. [Google Scholar] [CrossRef]
  55. National Oceanic and Atmospheric Administration Blended-VHP Vegetation Health Dataset (VIIRS/AVHRR). Available online: https://www.star.nesdis.noaa.gov/smcd/emb/vci/VH/vh_ftp.php (accessed on 15 January 2025).
  56. Bhuiyan, C.; Kogan, F.N. Monsoon Variation and Vegetative Drought Patterns in the Luni Basin in the Rain-Shadow Zone. Int. J. Remote Sens. 2010, 31, 3223–3242. [Google Scholar] [CrossRef]
  57. Keller, M.; Tarara, J.M. Warm Spring Temperatures Induce Persistent Season-Long Changes in Shoot Development in Grapevines. Ann. Bot. 2010, 106, 131–141. [Google Scholar] [CrossRef]
  58. Yang, C.; Menz, C.; Fraga, H.; Costafreda-Aumedes, S.; Leolini, L.; Ramos, M.; Molitor, D.; van Leeuwen, C.; Santos, J. Assessing the Grapevine Crop Water Stress Indicator over the Flowering-Veraison Phase and the Potential Yield Lose Rate in Important European Wine Regions. Agric. Water Manag. 2021, 261, 107349. [Google Scholar] [CrossRef]
  59. Taheri Qazvini, A.; Carrion, D. A Spatiotemporal Drought Analysis Application Implemented in the Google Earth Engine and Applied to Iran as a Case Study. Remote Sens. 2023, 15, 2218. [Google Scholar] [CrossRef]
  60. Vicente-Serrano, S.M.; Gouveia, C.; Camarero, J.J.; Beguería, S.; Trigo, R.; López-Moreno, J.I.; Azorín-Molina, C.; Pasho, E.; Lorenzo-Lacruz, J.; Revuelto, J.; et al. Response of Vegetation to Drought Time-Scales across Global Land Biomes. Proc. Natl. Acad. Sci. USA 2013, 110, 52–57. [Google Scholar] [CrossRef]
  61. Martínez-Fernández, J.; Ceballos, A. Temporal Stability of Soil Moisture in a Large-Field Experiment in Spain. Soil Sci. Soc. Am. J. 2003, 67, 1647–1656. [Google Scholar] [CrossRef]
  62. Quiring, S.M.; Ganesh, S. Evaluating the Utility of the Vegetation Condition Index (VCI) for Monitoring Meteorological Drought in Texas. Agric. For. Meteorol. 2010, 150, 330–339. [Google Scholar] [CrossRef]
  63. Liu, M.; Wang, Q.; Yi, J.; Zhang, H.; Liu, J.; Hu, W. Influence of Vegetation Type and Topographic Position on Volumetric Soil Water Content Dynamics and Similarity among Surface and Deep Soil Layers. Int. Soil Water Conserv. Res. 2023, 11, 183–196. [Google Scholar] [CrossRef]
  64. Jiang, Y.; Smerdon, J.E.; Seager, R.; Wang, G.; Cook, B.I.; Zheng, C.; Mankin, J.S.; Williams, A.P. The Influence of Land-Surface Conditions on the 2020–2021 Western US Drought. Water Resour. Res. 2025, 61, e2024WR038124. [Google Scholar] [CrossRef]
  65. Almouctar, M.A.S.; Wu, Y.; Zhao, F.; Qin, C. Drought Analysis Using Normalized Difference Vegetation Index and Land Surface Temperature over Niamey Region, the Southwestern of the Niger between 2013 and 2019. J. Hydrol. Reg. Stud. 2024, 52, 101689. [Google Scholar] [CrossRef]
  66. Hiep, N.V.; Thao, N.T.T.; Viet, L.V.; Luc, H.C.; Ba, L.H. Affecting of Nature and Human Activities on the Trend of Vegetation Health Indices in Dak Nong Province, Vietnam. Sustainability 2023, 15, 5695. [Google Scholar] [CrossRef]
  67. Finco, A.; Bentivoglio, D.; Chiaraluce, G.; Alberi, M.; Chiarelli, E.; Maino, A.; Mantovani, F.; Montuschi, M.; Raptis, K.G.C.; Semenza, F.; et al. Combining Precision Viticulture Technologies and Economic Indices to Sustainable Water Use Management. Water 2022, 14, 1493. [Google Scholar] [CrossRef]
  68. Fraga, H.; Santos, J.A. Daily Prediction of Seasonal Grapevine Production in the Douro Wine Region Based on Favourable Meteorological Conditions. Aust. J. Grape Wine Res. 2017, 23, 296–304. [Google Scholar] [CrossRef]
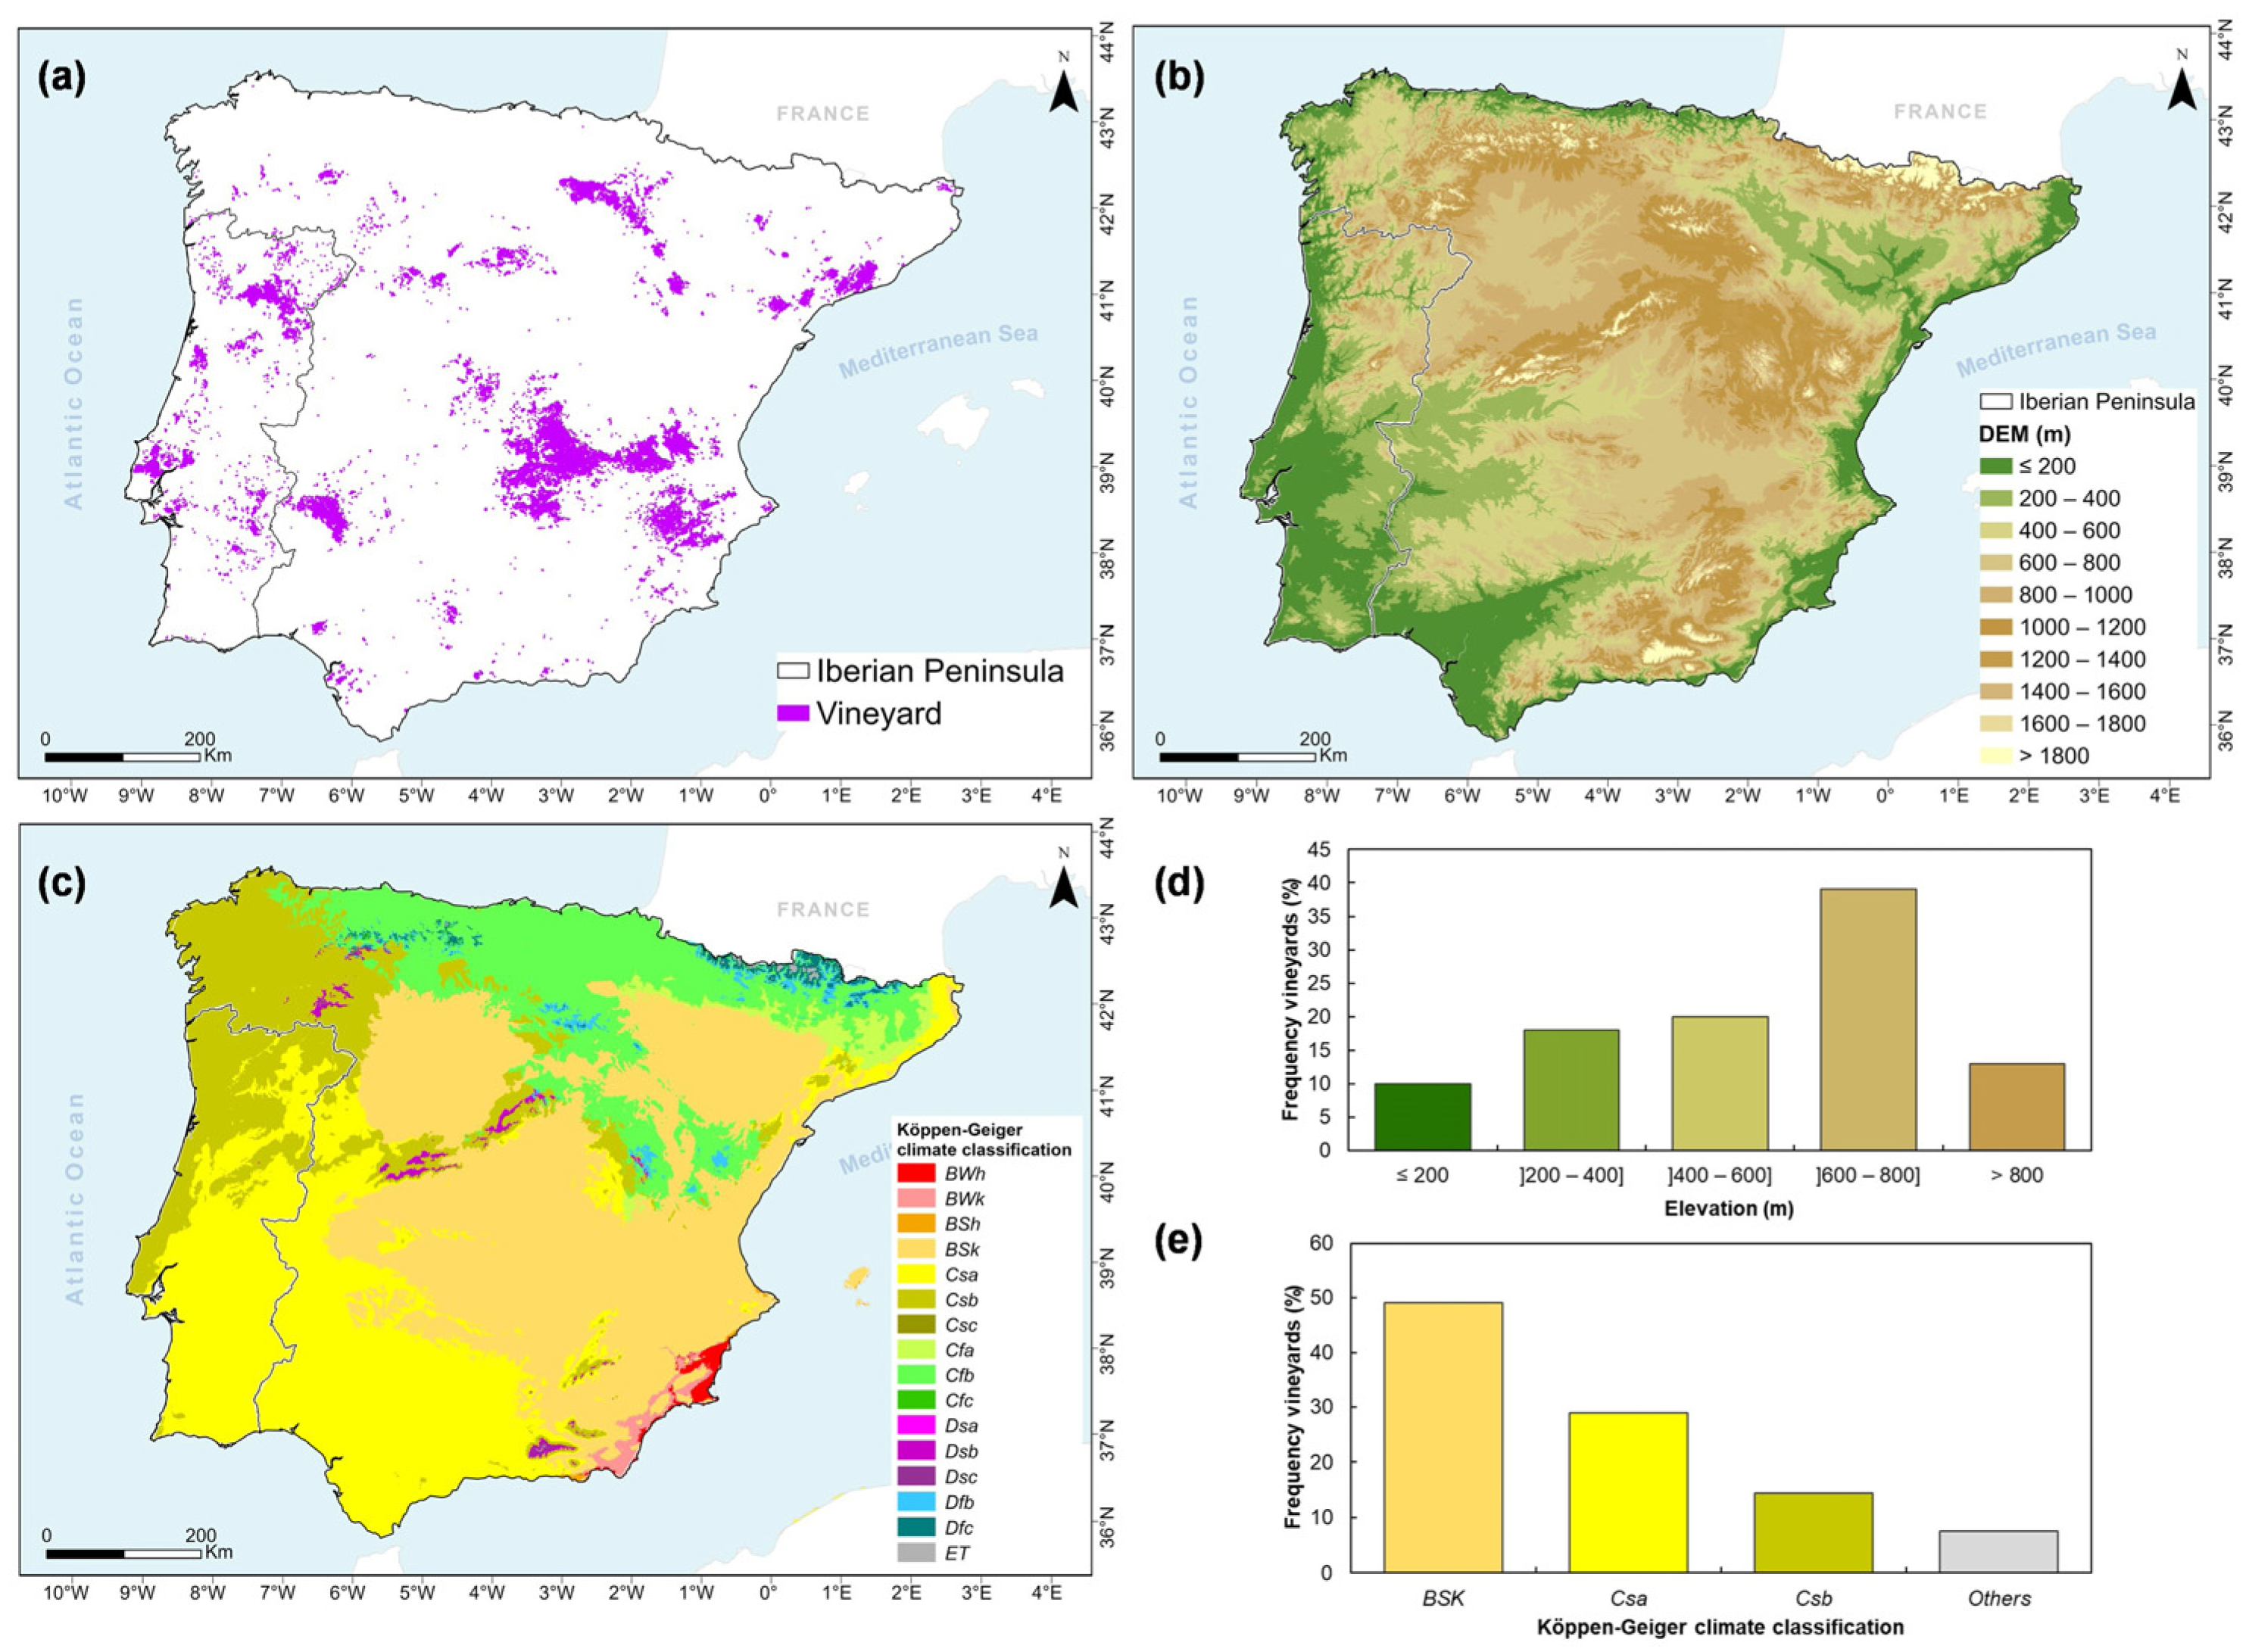
Figure 1. Study area of the Iberian Peninsula (IP): (a) Geographic location and spatial distribution of grapevine cultivation within the study region; (b) Hypsometric map of the IP showing elevation (in meters) and major rivers; (c) Köppen–Geiger climate classification of the IP (Table S1); (d) Histogram of elevation in vineyard areas across the IP; (e) Histogram of Köppen–Geiger climate types in vineyard areas across the IP. Data sources: CORINE Land Cover 2018 (for grapevine areas) and Köppen–Geiger climate classification [52].
Applsci 15 10605 g001
Figure 2. Methodological diagram of the study workflow.
Applsci 15 10605 g002
Figure 3. Mean Vegetation Health Index (VHI) (a) and mean De Martonne index (DMI) (b) for 1993–2022 springs in the Iberian Peninsula.
Applsci 15 10605 g003
Figure 4. Spring drought conditions in vineyard areas across the Iberian Peninsula (1993–2022), based on Vegetation Health Index (VHI) data. Red indicates severe to extreme drought, orange moderate drought, and yellow mild drought.
Applsci 15 10605 g004
Figure 5. Contingency matrix of percentual matches between the Vegetation Health Index (VHI) drought classes and De Martonne Index (DMI) reclassifications during spring from 1993 to 2022.
Applsci 15 10605 g005
Figure 6. Spatial differences in VHI–DMI percentage agreement across DMI reclassification schemes during spring (1993–2022), using DMI_10 as reference: (a) VHI–DMI_8; (b) VHI–DMI_9; (c) VHI–DMI_11; and (d) VHI–DMI_12.
Applsci 15 10605 g006
Figure 7. Spatial frequency of agreement between Vegetation Health Index (VHI) and De Martone Index (DMI) during springs (1993–2022) in vineyard areas of the Iberian Peninsula.
Applsci 15 10605 g007
Table 1. Range values for DMI and interpretation adapted from Araghi et al. [54].
DMI (mm/°C)CategoryInterpretationColor Code
DMI ≥ 551Extremely humid
35 ≤ DMI < 552Very humid
28 ≤ DMI < 353Humid
24 ≤ DMI < 284Semi-humid
20 ≤ DMI < 245Mediterranean
10 ≤ DMI < 206Semi-arid
5 ≤ DMI < 107Arid
DMI < 58Hyper-arid
Table 2. Classification of Vegetation Health Index (VHI) values and corresponding drought severity levels, adapted from Bhuiyan and Kogan [56].
VHI ValuesCategoryInterpretationColor Code
VHI > 401No drought
30 < VHI ≤ 40 2Mild drought
20 < VHI ≤ 303Moderate drought
10 < VHI ≤ 204Severe drought
VHI ≤ 105Extreme drought
Table 3. Reclassified Vegetation Health Index (VHI) values for vineyard areas in the Iberian Peninsula, adapted from Bhuiyan and Kogan [56].
VHI ValuesCategoryInterpretationColor Code
VHI > 401No drought
30 < VHI ≤ 402Mild drought
20 < VHI ≤ 303Moderate drought
VHI ≤ 204Severe/Extreme drought
Table 4. Reclassified De Martonne Index (DMI) values for comparison with Vegetation Health Index (VHI) in vineyard areas in the Iberian Peninsula, using reclassification schemes DMI_8 to DMI_12.
DMI_8
Value (mm/°C)No. ValuesInterpretation DMI
DMI > 241No drought/Humid conditions
16 < DMI ≤ 242Low drought risk/Slightly dry conditions
8 < DMI ≤ 163Moderate drought conditions
DMI ≤ 84Severe or extreme drought
DMI_9
Value (mm/°C)No. ValuesInterpretation DMI
DMI > 241No drought/Humid conditions
18 < DMI ≤ 242Low drought risk/Slightly dry conditions
9 < DMI ≤ 183Moderate drought conditions
DMI ≤ 94Severe or extreme drought
DMI_10
Value (mm/°C)No. ValuesInterpretation DMI
DMI > 241No drought/Humid conditions
20 < DMI ≤ 24 2Low drought risk/Slightly dry conditions
10 < DMI ≤ 203Moderate drought conditions
DMI ≤ 104Severe or extreme drought
DMI_11
Value (mm/°C)No. ValuesInterpretation DMI
DMI > 241No drought/Humid conditions
21 < DMI ≤ 24 2Low drought risk/Slightly dry conditions
11 < DMI ≤ 213Moderate drought conditions
DMI ≤ 114Severe or extreme drought
DMI_12
Value (mm/°C)No. ValuesInterpretation DMI
DMI > 241No drought/Humid conditions
22 < DMI ≤ 24 2Low drought risk/Slightly dry conditions
12 < DMI ≤ 223Moderate drought conditions
DMI ≤ 124Severe or extreme drought
Disclaimer/Publisher’s Note: The statements, opinions and data contained in all publications are solely those of the individual author(s) and contributor(s) and not of MDPI and/or the editor(s). MDPI and/or the editor(s) disclaim responsibility for any injury to people or property resulting from any ideas, methods, instructions or products referred to in the content.