1. Introduction
According to Council Directive 2024/3019 of 27 November 2024 on urban wastewater treatment, all wastewater treatment plants located in agglomerations with a population equivalent (PE) above 10,000 will be required, in addition to removing organic pollutants and suspended solids, to ensure nitrogen and phosphorus removal to levels of 10 g N·m
−3 and 0.7 g P·m
−3. This will require an increase in nutrient removal efficiency in many treatment plants. Possible solutions for upgrading facilities in this respect can be found in the literature [
1,
2,
3].
A number of factors influence the operation of small and medium-sized wastewater treatment plants. Low wastewater temperatures, caused by the inflow of rainwater or snowmelt as well as increased infiltration of cold groundwater into the sewer network, lead to reduced treatment efficiency—mainly affecting the nitrification process—as well as scum formation in tanks and secondary clarifiers and sludge bulking [
2,
3].
The inflow of incidental water through leaks in the sewer system and illegal connections of stormwater drains can result in hydraulic overloading and periodic washout of activated sludge from the biological reactor [
4].
Small and medium-sized plants often operate under challenging conditions, related both to influent wastewater characteristics and to technical constraints arising from the mechanical equipment used [
5].
The membrane bioreactor (MBR) technology is an advancement and modernization of the activated sludge process. The main difference lies in replacing secondary clarifiers, present in conventional activated sludge systems, with a system of microporous (most commonly microfiltration or ultrafiltration) membranes placed directly in the aerated activated sludge tank or in a separate filtration unit. Various configurations and modifications are used, including biofilm MBRs, hybrid MBRs with suspended and fixed biomass, anaerobic MBRs (AnMBRs), and electrochemical MBRs (eMBRs) [
6,
7,
8,
9,
10,
11,
12,
13,
14].
Biological membrane bioreactors offer several advantages over conventional activated sludge systems, the most important being [
7,
8,
15]: very high phase separation efficiency and excellent microbiological and physicochemical quality of treated effluent, the ability to remove specific micropollutants (e.g., pharmaceuticals), reduced reactor volume due to higher sludge concentrations, and lower excess sludge production. The main disadvantages of MBRs include the need for highly efficient preliminary mechanical treatment (removal of screenings, grit, and fats, as well as hair and fibers), the occurrence of membrane fouling and concentration polarization (which reduce plant throughput), and higher energy consumption [
7,
8].
Membrane bioreactor-based plants can be a viable alternative to small and medium-sized conventional activated sludge plants. These facilities are resistant to process disturbances such as sludge bulking, and MBR effluent is of consistently high quality. MBRs can also be implemented for the expansion or modernization of existing activated sludge plants where space for new treatment units is limited [
10,
15].
The novelty of this study lies in the long-term, four-year analysis of the impact of weather conditions (rainfall) on the quantity and quality of influent and treated wastewater in a treatment plant operating with microfiltration flat-sheet membranes. The research takes into account variable weather conditions, detailed rainfall data, and the classification of the impact of extraneous water depending on rainfall intensity.
The primary aim of this study was to determine the volume of incidental (stormwater) inflow into an MBR-based wastewater treatment plant and to assess its impact on the removal of organic and nutrient pollutants from wastewater.
2. Materials and Methods
The analyzed wastewater treatment plant is located in southern Poland (N: 50°1′32.92″, E: 20°10′10.21″). It was designed and constructed for:
Average daily wastewater inflow Qavg.d. = 2000 m3·d−1
Maximum daily wastewater inflow Qmax.d. = 2600 m3·d−1
Population equivalent (PE) = 16,670
The permissible effluent concentrations under the water permit are:
BOD5—15 g·m−3
COD—125 g·m−3
Total Suspended Solids—35 g·m−3
Total Nitrogen—15 g·m−3
Total Phosphorus—2 g·m−3
The plant receives municipal wastewater from residents via a combined gravity–pressure sewer network, along with wastewater from small industrial facilities. The selected parameters are characteristic of municipal wastewater, and their quality at the outlet is regulated. Wastewater from small facilities such as grocery stores, bakeries, or catering points has the nature of domestic sewage and does not contain specific pollutants.
It is a mechanical–biological treatment plant with nitrogen and phosphorus removal in multi-phase activated sludge reactors, using membrane filtration instead of secondary clarifiers (
Figure 1). The facility also includes provisions for chemical phosphorus precipitation. The dosing of PIX into the wastewater was carried out automatically and was related to the concentration of phosphorus in the incoming wastewater. Mechanical treatment consists of a compact unit equipped with a fine screen (6 mm mesh) and a horizontal grit chamber. In addition, fine sieves with a 1 mm mesh are applied.
After preliminary mechanical treatment, the wastewater is retained and then biologically treated in two parallel activated sludge lines, each comprising anaerobic, anoxic, and aerobic zones. A characteristic feature of the facility is the use of dedicated microfiltration membrane chambers for separating treated wastewater. Membrane maintenance consisted mainly of regular chemical cleaning, minimal mechanical cleaning, ongoing monitoring of parameters and proper operation of the aeration and relaxation system.
In each treatment line, nine KUBOTA SP400 plate-type membrane modules are installed, with a pore size of 0.1 μm and a total filtration surface area of 3600 m2.
The sludge generated in the facility is subjected to aerobic stabilization in a separate chamber, followed by dewatering in a centrifuge. The process flow diagram is presented in
Figure 1.
The study was conducted between 2021 and 2024 under operational conditions, with the wastewater treatment plant operating in a single technological line. During the research period, measurements of wastewater volume and analytical determinations of influent and treated wastewater quality were carried out.
Samples of raw and treated wastewater for physico-chemical analysis were collected using portable automatic samplers for continuous sampling. Sampling took place every hour, and after 24 h the samples were mixed, resulting in a composite sample. Wastewater samples were collected for testing at one-month intervals. Analytical determinations were performed in an accredited laboratory, in accordance with Polish standards. The dataset obtained from the treatment plant allowed for statistical analysis of the results (PN-EN 25663:2001, PN-EN ISO 6878) [
16,
17].
Daily precipitation values were determined based on readings from a Hellmann tipping-bucket rain gauge installed within the analyzed sewer catchment. Following the methodology of Kaczor [
18], daily wastewater inflows were classified as occurring under dry weather or wet weather conditions. A day was classified as dry if no precipitation occurred during that day or the preceding five days, or if the daily rainfall did not exceed 1 mm. The average daily inflow during dry weather conditions was used to determine the typical volume of “actual” wastewater—i.e., wastewater not containing incidental water.
As proposed by Kaczor [
18] and Jóźwiakowska et al. [
19], wet weather days (days with precipitation) were divided into four characteristic rainfall ranges:
- –
1.0–5.0 mm·d−1,
- –
5.1–10.0 mm·d−1,
- –
10.1–15.0 mm·d−1,
- –
15.0 mm·d−1.
The calculation of incidental water volume (Qdp) and its share (Uwp) in the total influent wastewater mixture was carried out in accordance with Kaczor [
18].
The first parameter, Qdp, represents the daily volume of incidental (stormwater) inflow in the total wastewater volume. For wet weather days, it was calculated using Equation (1):
where
Qdp—daily incidental water inflow to the sewer system, m3·d−1,
Qdm—daily inflow of the mixture of municipal wastewater and incidental water during wet weather, m3·d−1,
Qds—average daily inflow of municipal wastewater (without incidental water) during dry weather, m3·d−1.
The second parameter, Uwp, defines the percentage of incidental water in the total volume of wastewater mixture (municipal wastewater + incidental water) [
20]. It was calculated using Equation (2):
where
Uwp—daily share of incidental water in the wastewater discharged from the sewer system, %,
Qdp—daily incidental water inflow to the sewer system, m3·d−1,
Qdm—daily inflow of the mixture of actual wastewater and incidental water during wet weather, m3·d−1.
3. Analysis and Discussion of Results
3.1. Analysis of Influent Wastewater Volume and Incidental Water Inflow
Over the four-year study period, the average daily wastewater inflow was 1133.2 m
3·d
−1, which was 43.3% lower than the design value of 2000 m
3·d
−1. At the same time, irregularity in the influent volume was observed, confirmed by a coefficient of variation (Cv) of 29%. According to the classification by Wawrzynek [
21], this corresponds to a medium level of variability.
During the study, the highest recorded daily inflow reached 4091.9 m3·d−1, meaning that the designed average daily plant capacity was exceeded by more than twofold.
Characteristic values of daily wastewater inflow are presented in
Table 1.
The results concerning the volume and variability of wastewater inflow to the treatment plant formed the basis for the research hypothesis that the quantity and variability of influent wastewater are influenced by incidental water, i.e., precipitation entering the sewer system unintentionally. This hypothesis was supported by information obtained from the sewer system operator. Interviews indicated that many residential buildings are illegally connected to the sanitary sewer network, which, during rainfall events, increases the volume of wastewater reaching the treatment plant.
The analysis of incidental water volume and its share in the total influent wastewater was carried out for the entire four-year study period (2021–2024), assuming that—regardless of annual precipitation patterns—the volume of municipal wastewater generated during dry weather remains at the same level. To determine the volume of incidental (stormwater) inflow in the sewer system, the methodology developed by Kaczor [
18] was applied.
Following this methodology, out of 1461 daily wastewater inflow measurements taken over the four years, 274 days were classified as dry weather days. According to Kaczor [
18], a day is classified as dry if no precipitation occurs during that day and none, or less than 1 mm, occurs in the five preceding days.
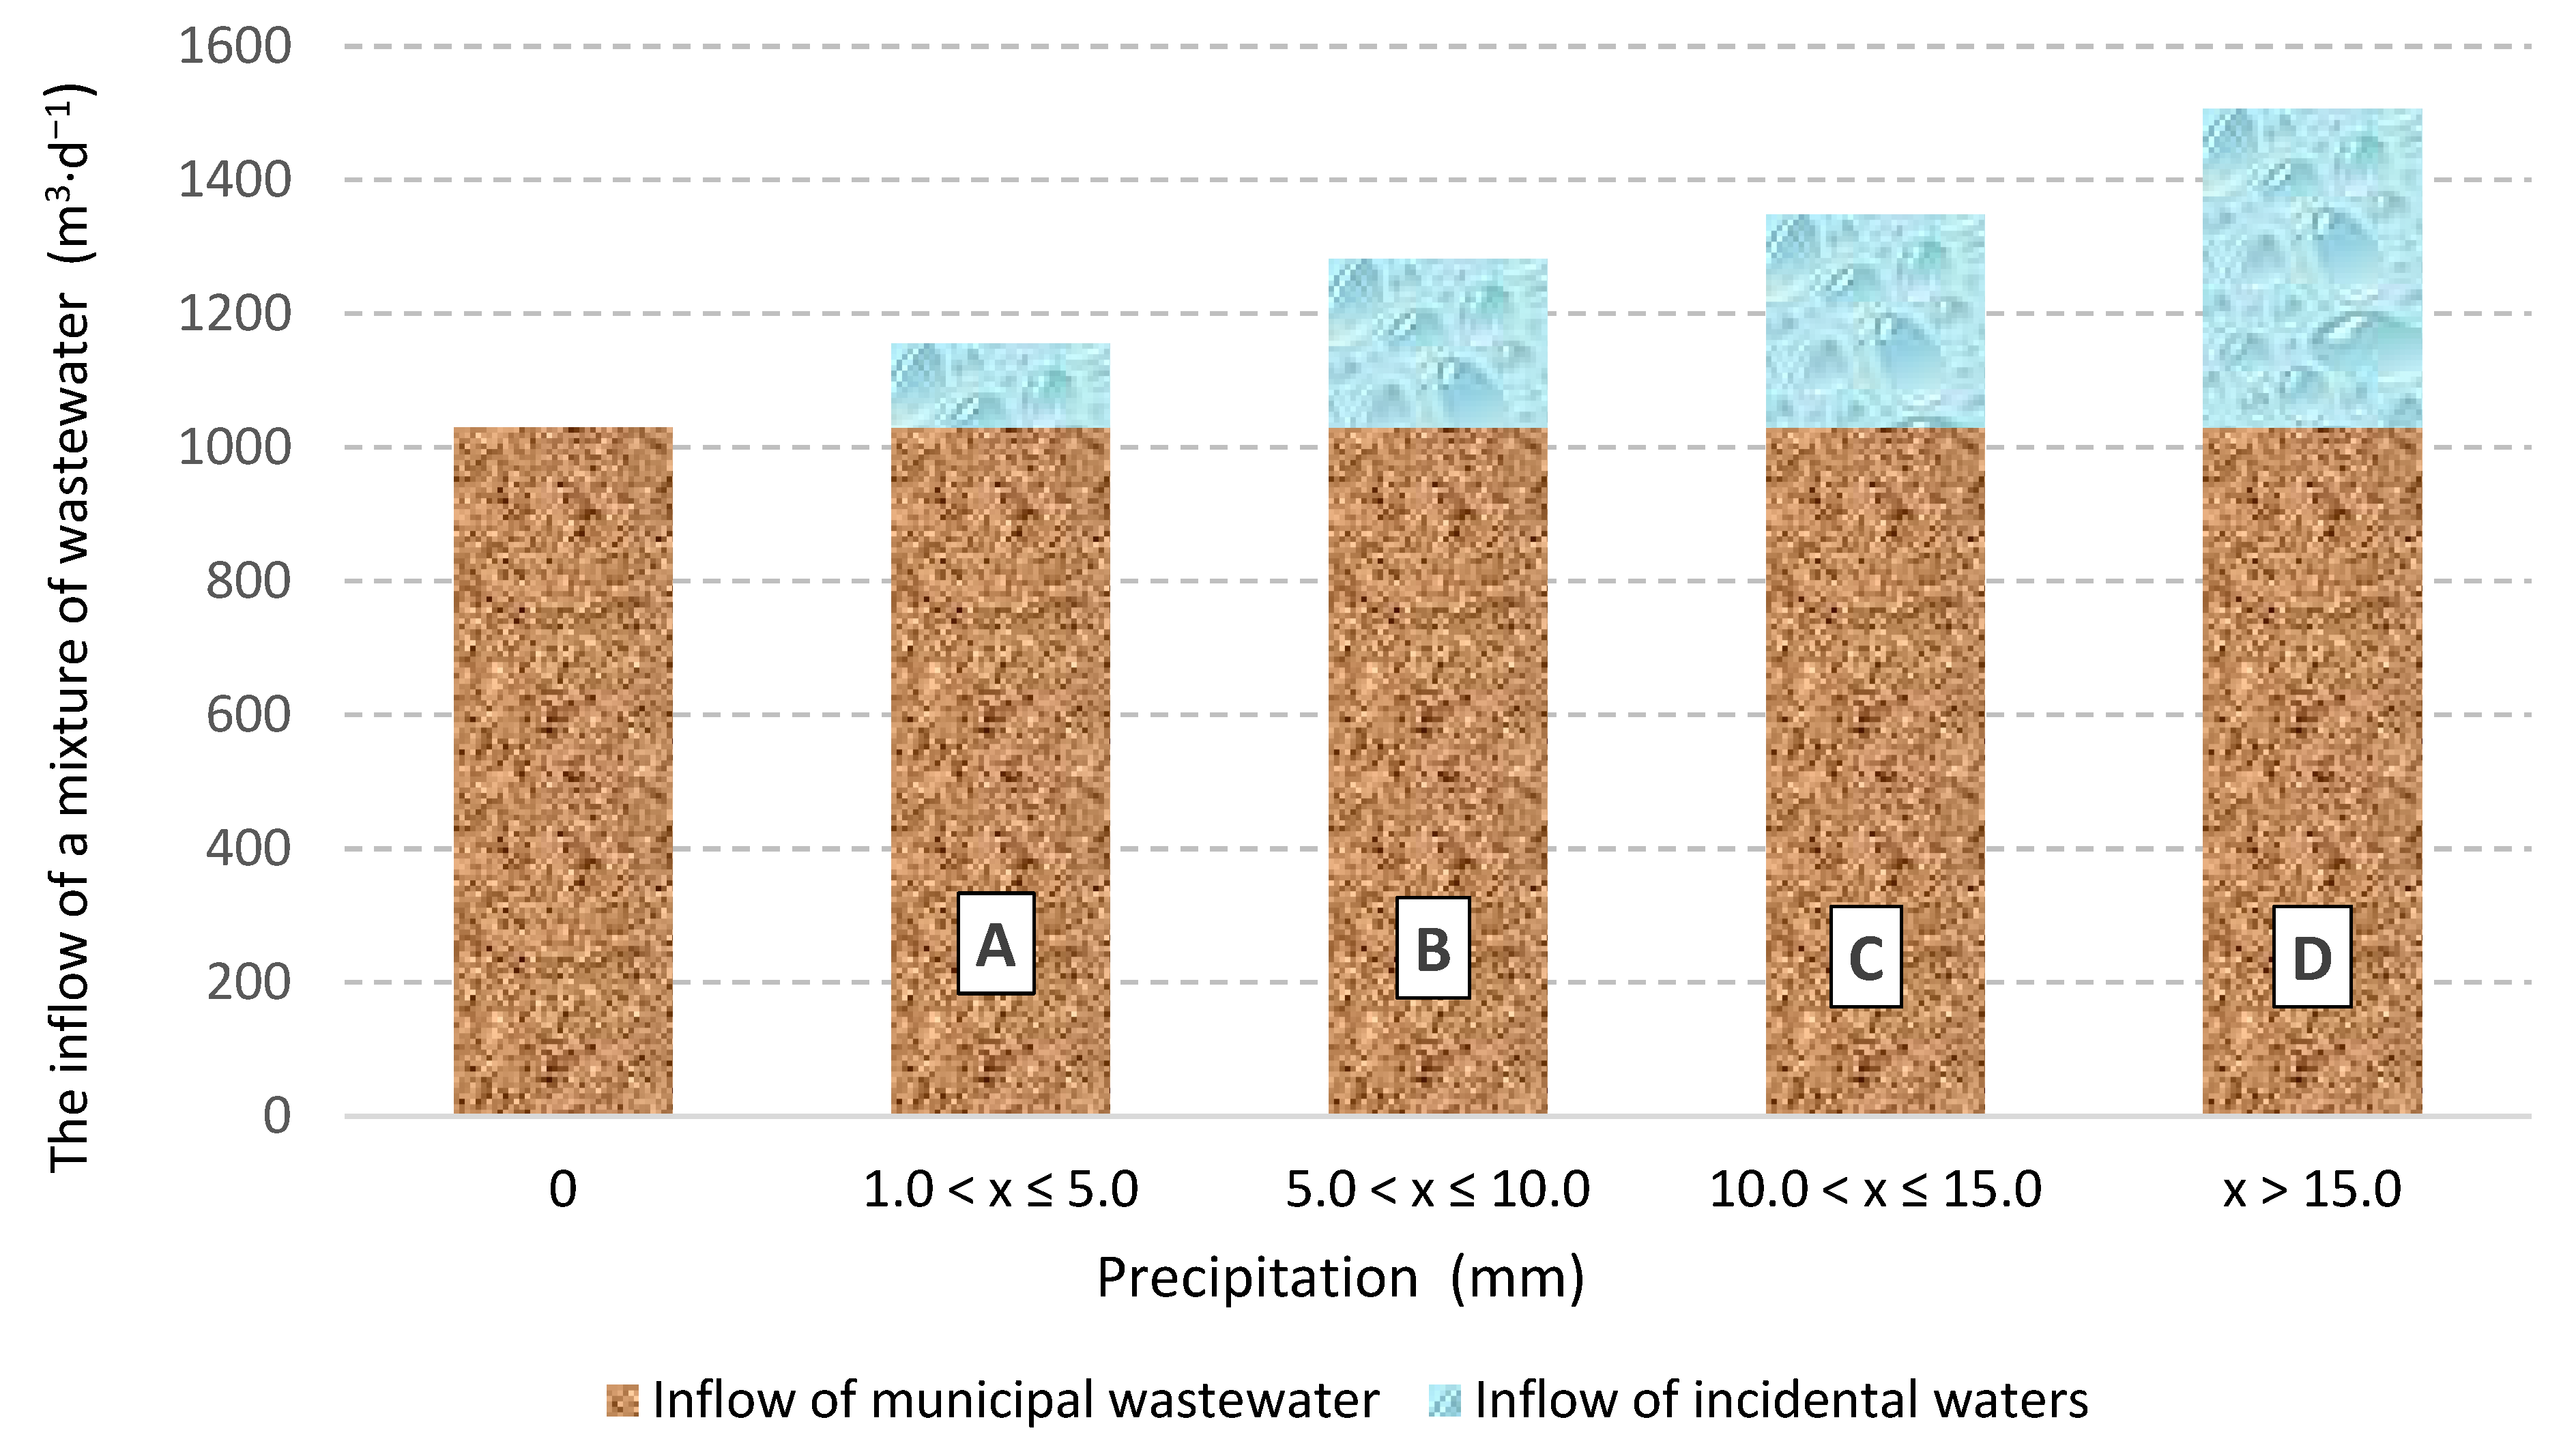
In the analyzed period, the average wastewater inflow during dry weather was 1030.2 m
3·d
−1 (
Figure 2). The variability of this inflow, expressed by the coefficient of variation, was Cv = 15%, indicating low variability according to the classification of Wawrzynek [
21]. The dry-weather inflow was 48.5% lower than the plant’s designed capacity of 2000 m
3·d
−1. Since the treatment plant operated using only one biological treatment line, it can be stated that it functioned at the full hydraulic capacity of the installed membranes.
Using the average dry-weather inflow of 1030.2 m3·d−1 and Equation (1), the average daily volume of stormwater inflow during wet weather days was calculated. Calculations were performed for each of the four rainfall groups (A–D), defined by specific precipitation ranges.
- –
Group A (1.0–5.0 mm·d−1): average daily stormwater inflow = 1155.7 m3·d−1
- –
Group B (5.1–10.0 mm·d−1): average daily stormwater inflow = 1282.1 m3·d−1
- –
Group C (10.1–15.0 mm·d−1): average daily stormwater inflow = 1348.5 m3·d−1
- –
Group D (>15.0 mm·d−1): average daily stormwater inflow = 1506.0 m3·d−1
The average daily municipal wastewater inflows and stormwater inflows for each precipitation range are shown in
Figure 2.
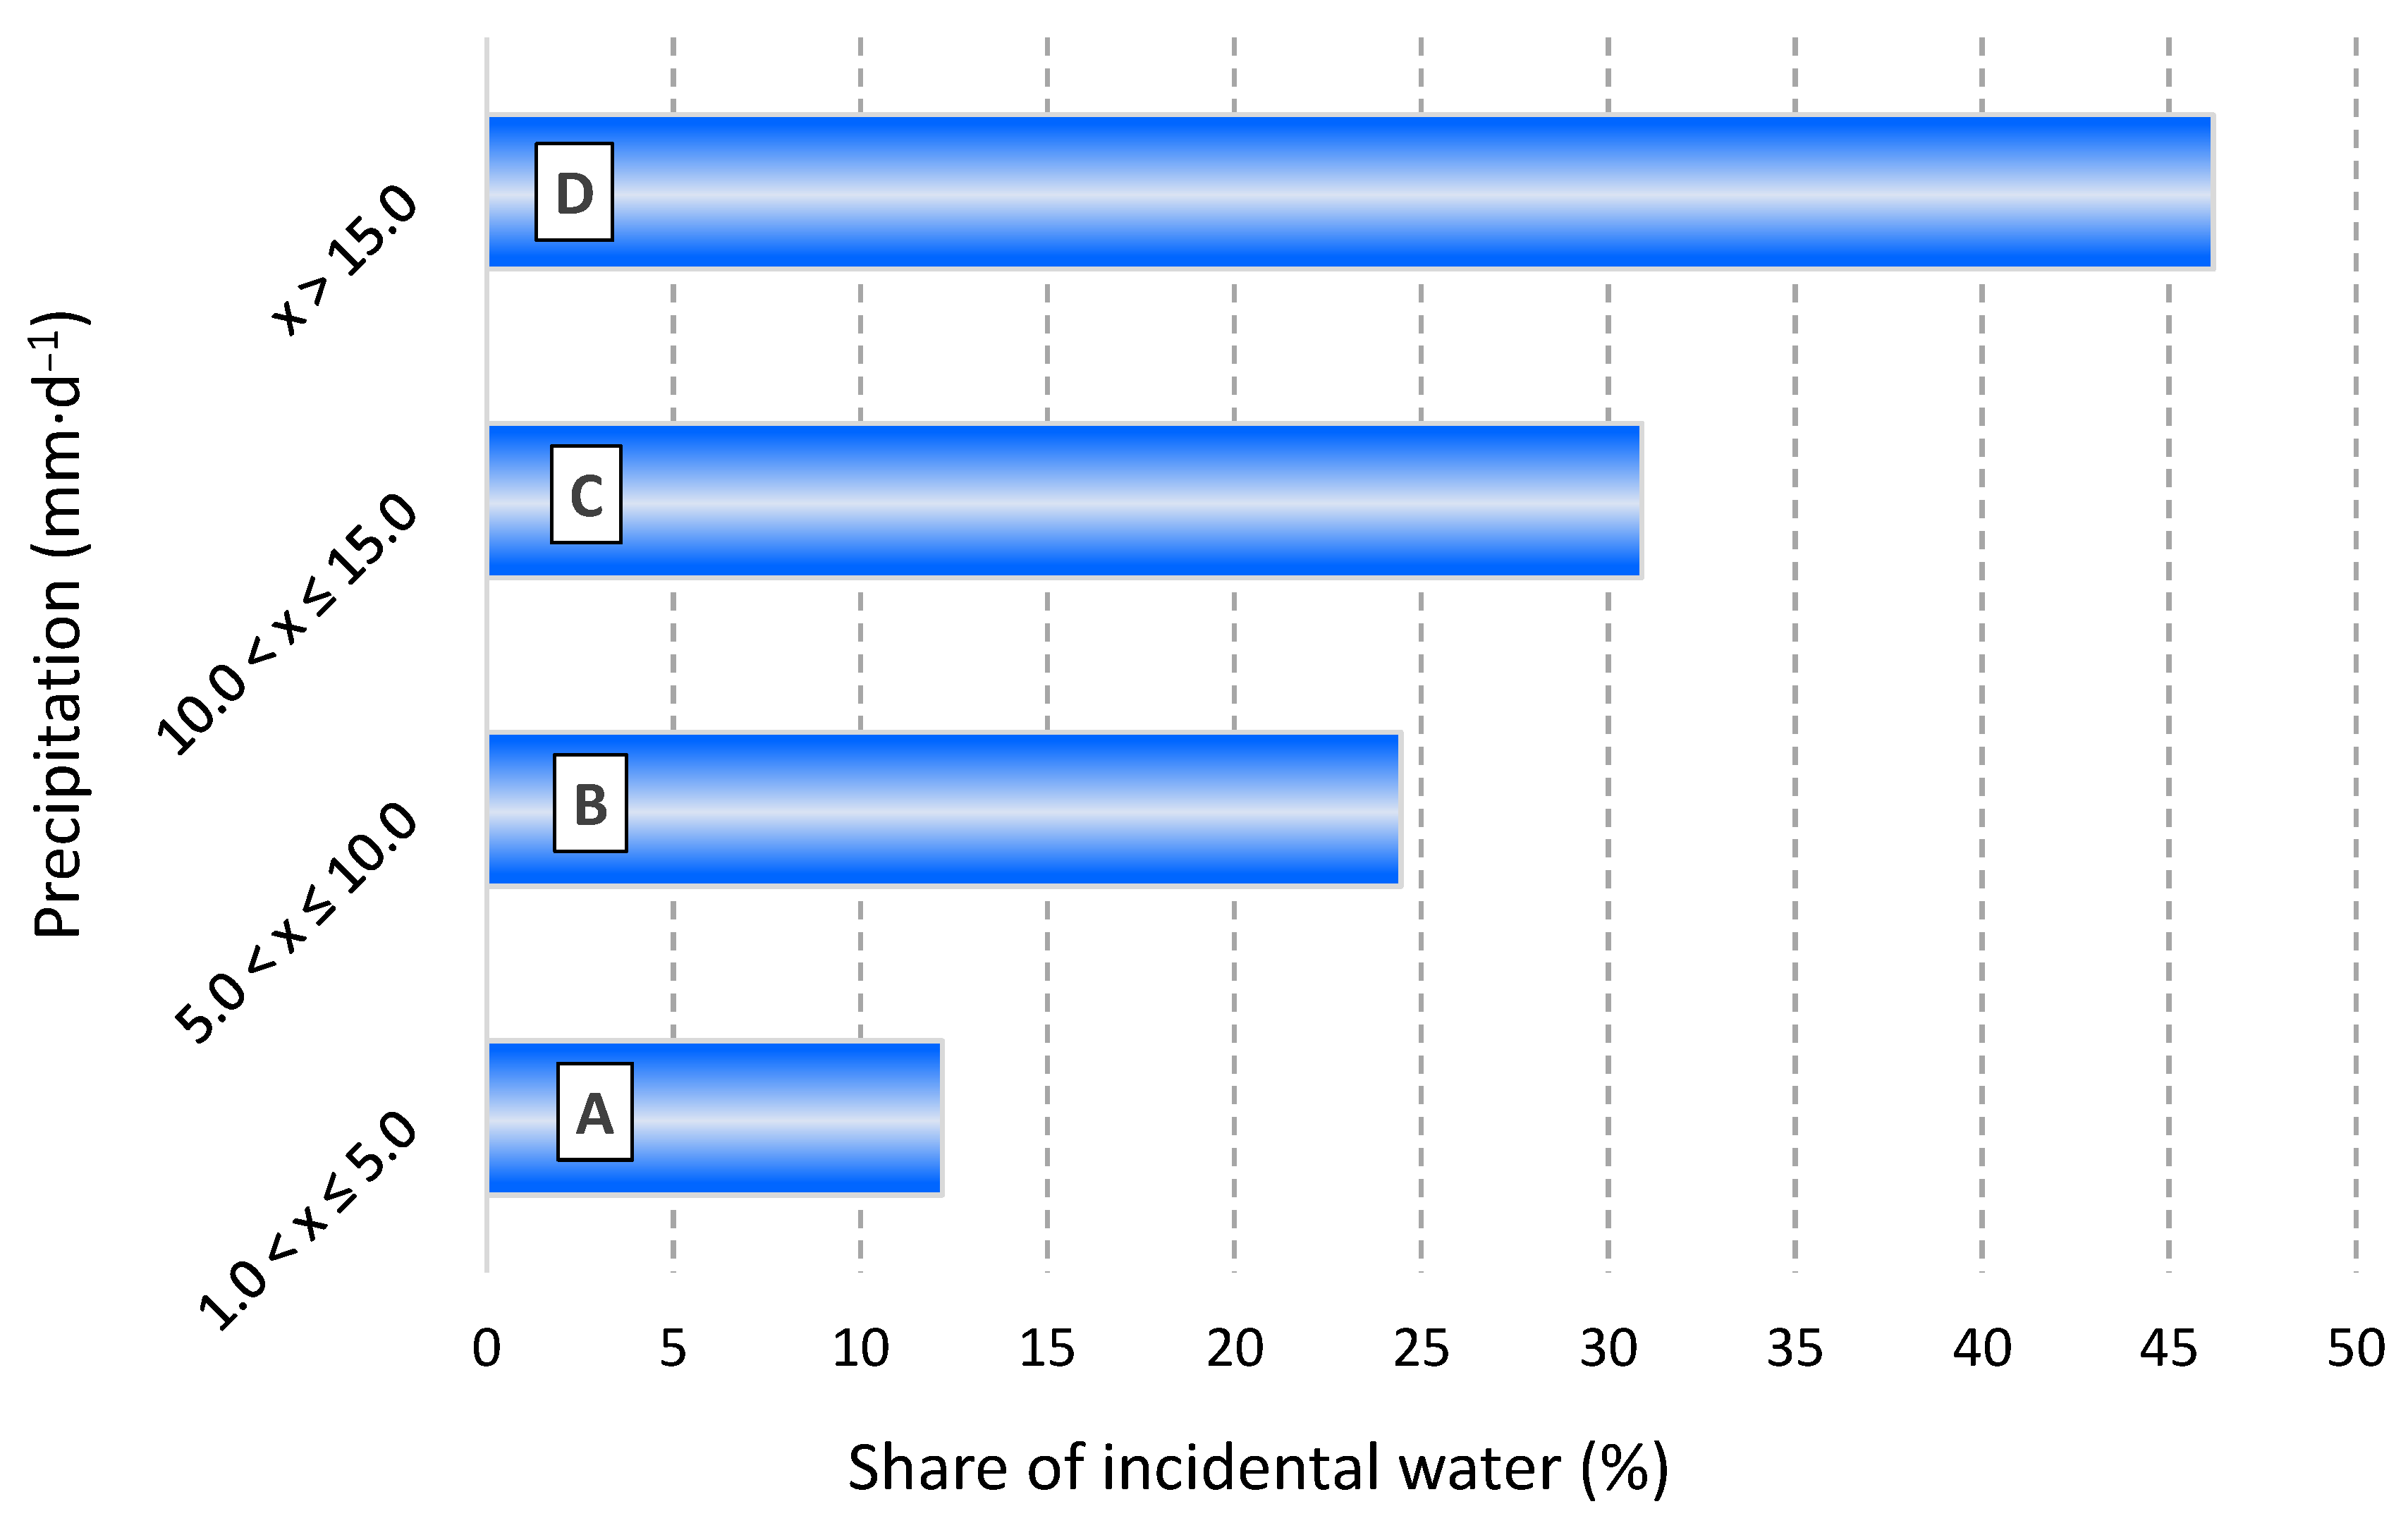
Based on Formula (2), the percentage share of incidental waters (Uwp) in the total volume of wastewater flowing into the treatment plant was determined for days with precipitation. For rainfall in the range of 1.0–5.0 mm·d
−1, the average share of incidental waters was 12.2%. For precipitation of 5.1–10.0 mm·d
−1, this value increased to 24.4%, while for the range 10.1–15.0 mm·d
−1, it reached 30.9%. On days with rainfall exceeding 15.0 mm·d
−1, the maximum share of incidental waters was recorded at 46.2% of the total wastewater inflow. The relationship between the share of incidental (stormwater) inflows and precipitation height in the analyzed sewer catchment in Niepołomice is presented in
Figure 3.
Based on the conducted analysis, it can be concluded that the volume of wastewater inflowing to the treatment plant in individual years was strongly correlated with the total annual precipitation, which clearly indicates the presence of incidental waters, i.e., stormwater entering the sewer network unintentionally [
22].
In the studied case, incidental waters, occurring mainly during heavy rainfall events, lead to a number of unfavorable operational phenomena, such as sewer overflows, overloading of pumping stations, pressurized flows in gravity sewers, and, in extreme situations, the discharge of wastewater from manholes onto the ground surface.
The most severe impacts are observed in the operation of wastewater treatment plants, particularly in facilities whose technological systems were not designed for increased hydraulic throughput. Incidental waters adversely affect the functioning of biological reactors by lowering wastewater temperature (especially during snowmelt), shortening the hydraulic retention time in reactor chambers [
23,
24], and diluting the influent, thereby reducing the concentration of organic matter necessary for the growth of activated sludge microorganisms [
25]. However, in the analyzed treatment plant, changes in wastewater temperature did not affect the efficiency of eliminating organic and nutrient pollutants. This indicates that wastewater treatment processes in MBR-based treatment plants are less sensitive compared to those in conventional flow reactor-based treatment plants [
25].
As a result, these phenomena may cause a temporary decrease in treatment efficiency and an increased risk of deterioration in the quality of the receiving water body. In the subsequent part of this study, this research aspect will be examined in detail.
3.2. Analysis of Influent Wastewater Quality
During the period of the conducted study, the concentrations of individual parameters in the influent wastewater remained at the level of medium-strength wastewater (
Table 2). A comparison of the pollution indicator values in the raw wastewater with literature data, including Henze et al. [
26] and Bugajski et al. [
27], confirms consistency with the qualitative classification according to the typology proposed by Henze et al. [
26].
At the same time, a significant variability in the concentrations of the analyzed parameters was observed. According to the Wawrzynek [
21] scale, this variability was very high for BOD
5, total Suspended Solids (TSS), and Total Phosphorus (TP), while for chemical oxygen demand (COD) and Total Nitrogen (TN), the variability level was considered moderate. The high variability of parameters in the wastewater results, among other things, from dilution by extraneous water and from the specific characteristics of inflow to small treatment plants located in rural areas.
The high degree of concentration variability indicates that not only domestic wastewater but also other types of wastewater, including stormwater referred to as incidental water, reach the treatment plant. Their presence causes dilution of the wastewater, resulting in decreased concentrations of organic and biogenic substances, which affects the efficiency of biological treatment processes.
Additionally, the variability in concentrations may be due to periodic inflows of incidental waters with different chemical compositions, which complicates the stable operation of the treatment plant and requires adjustment of technological processes to dynamic hydraulic and qualitative conditions.
These phenomena highlight the need for continuous monitoring of influent wastewater quality and the implementation of technical solutions to limit the inflow of stormwater into the sewer system, which would improve the stability of treatment processes and protect the aquatic environment.
3.3. Impact of Infiltration/Inflow Rainwater on Concentrations in Influent Wastewater
Based on data concerning the concentrations of analyzed parameters in the influent wastewater and the volume of incoming wastewater, the relationships between these variables were developed using Pearson’s linear correlation. The analysis of the impact of the volume of influent wastewater (independent variable) on BOD
5 values in the influent (dependent variable) showed a correlation coefficient of r
x,y = −0.50, which, according to the Stanisz scale [
28], indicates a strong correlation. From the regression equation describing the line presented in
Figure 4, it can be stated that with an increase in the volume of influent wastewater by 100 m
3·d
−1, the BOD
5 value decreases by 19.17 g·m
−3.
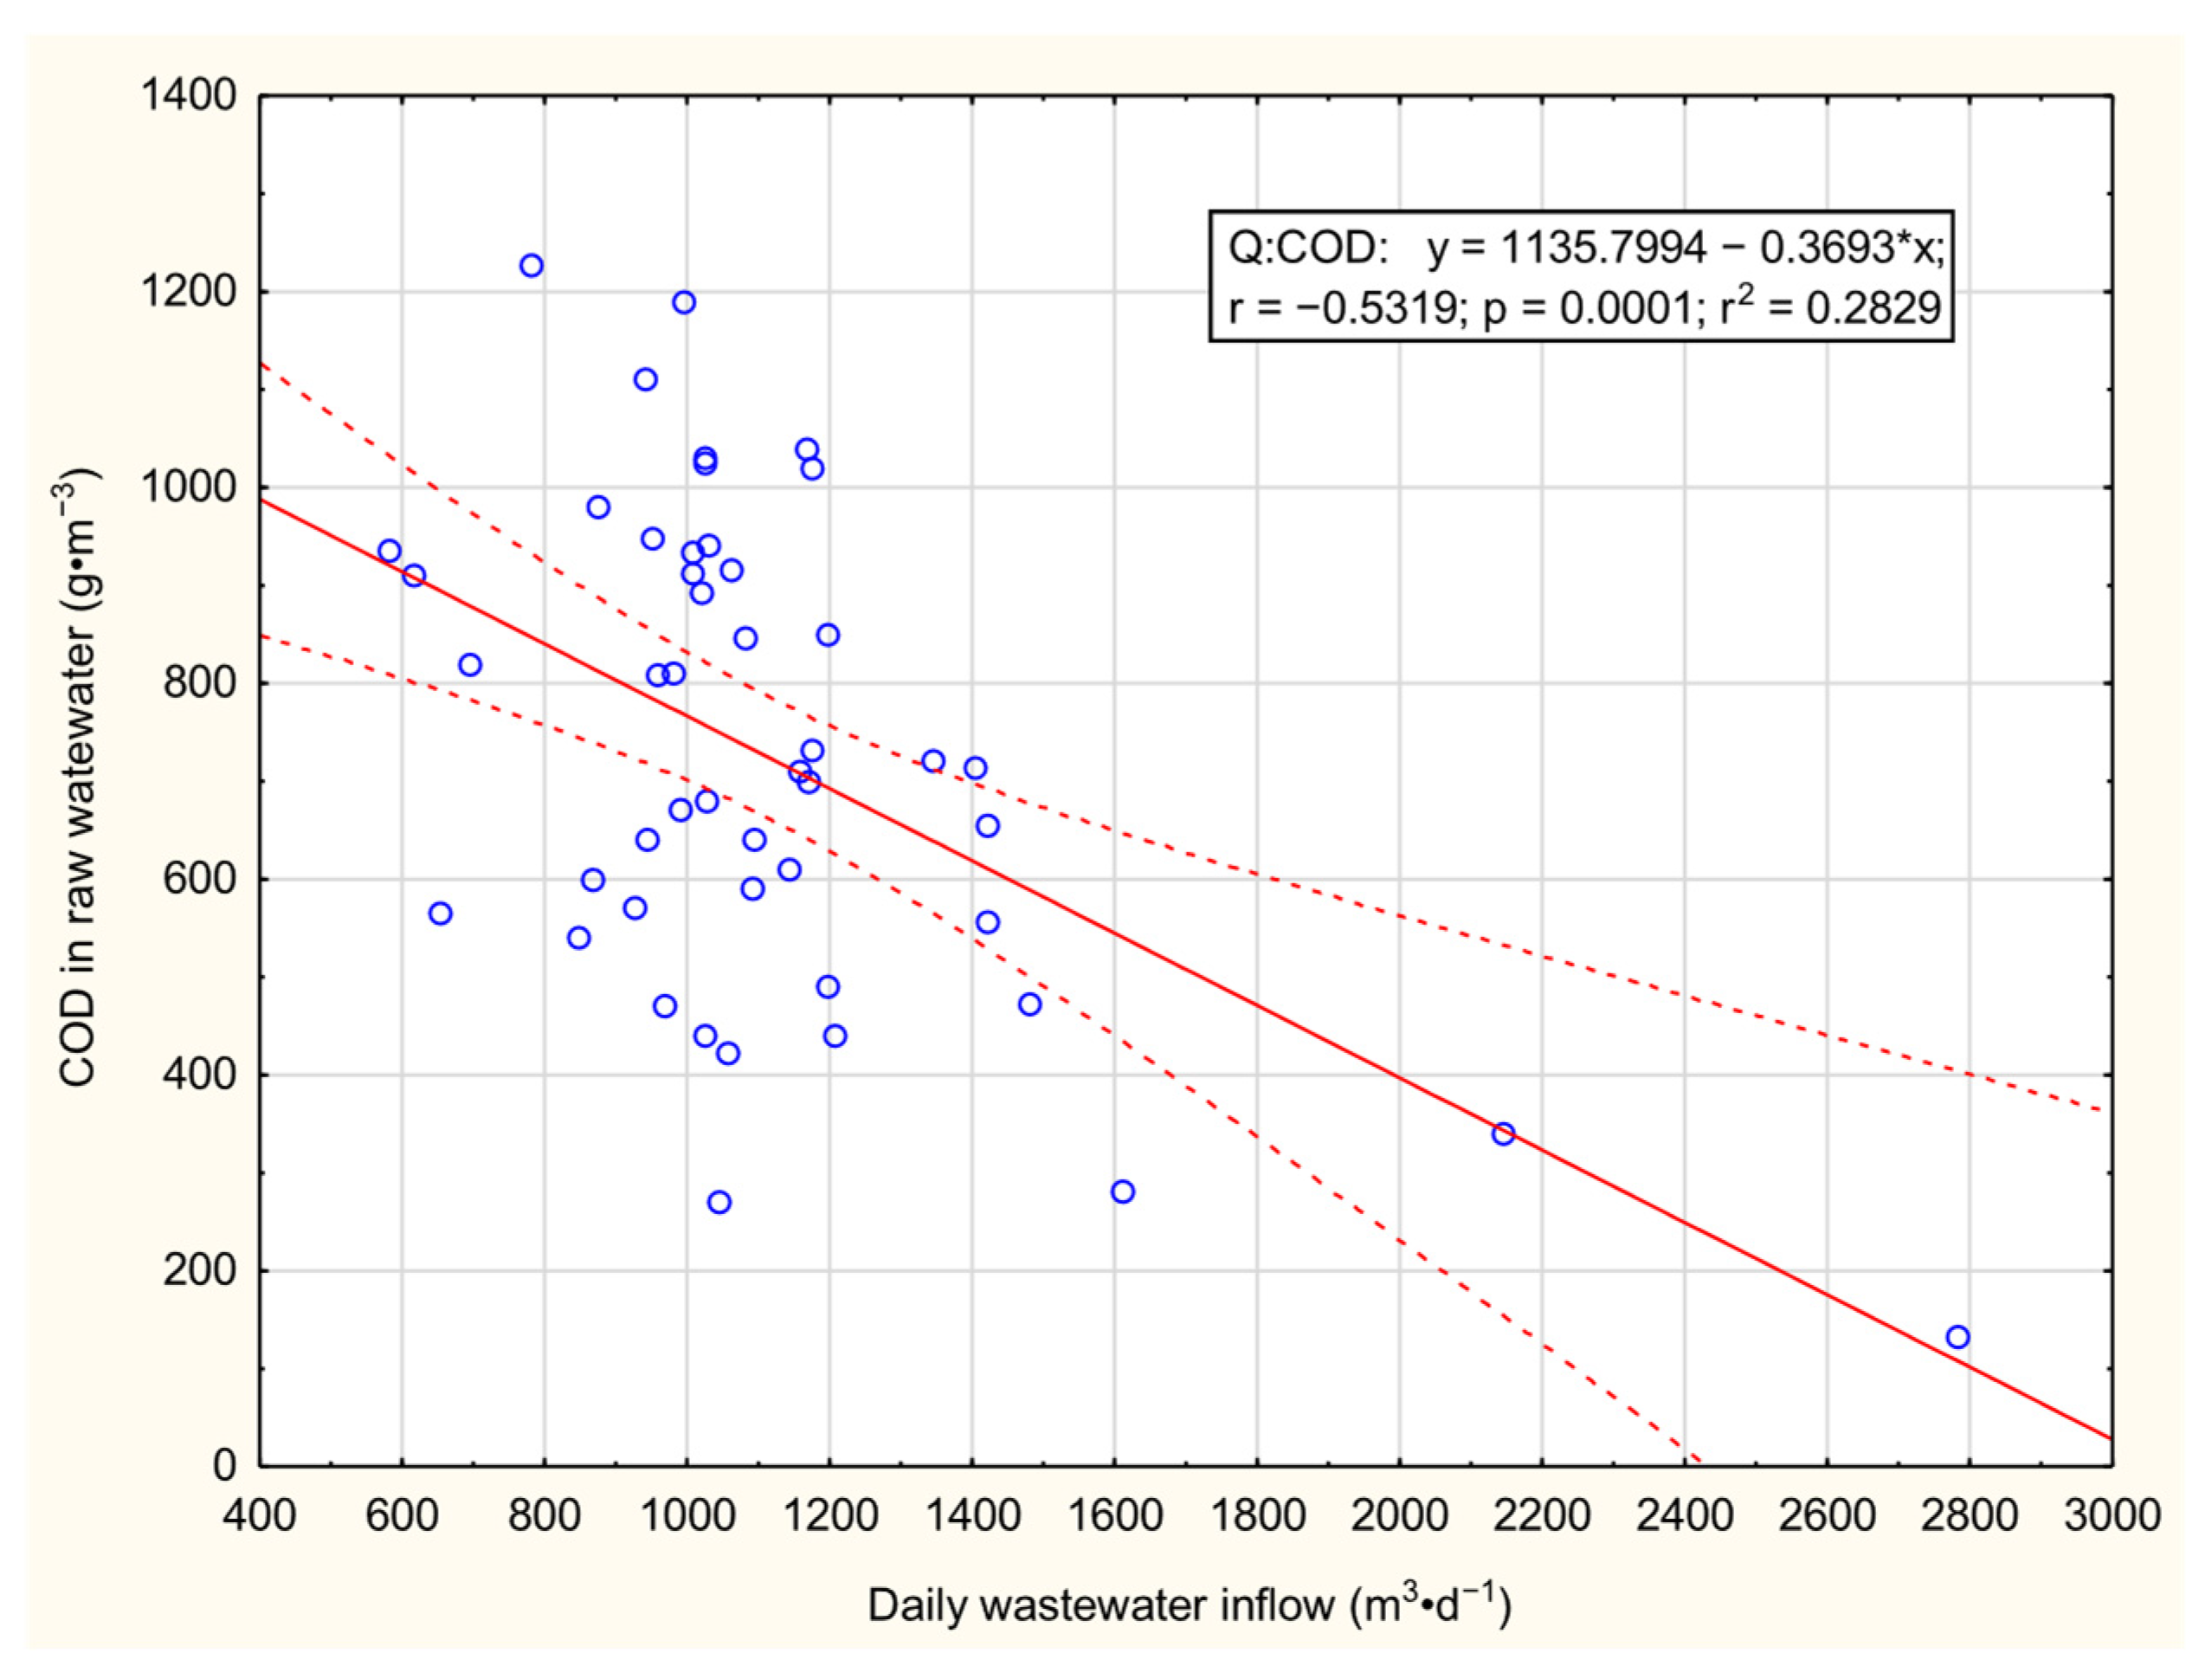
Regarding the relationship between COD values in the influent and the volume of influent wastewater, the correlation was also high, with r
x,y = −0.53. The regression equation shown in
Figure 5 indicates that an increase in influent wastewater volume by 100 m
3·d
−1 results in a decrease in COD by 36.93 g·m
−3.
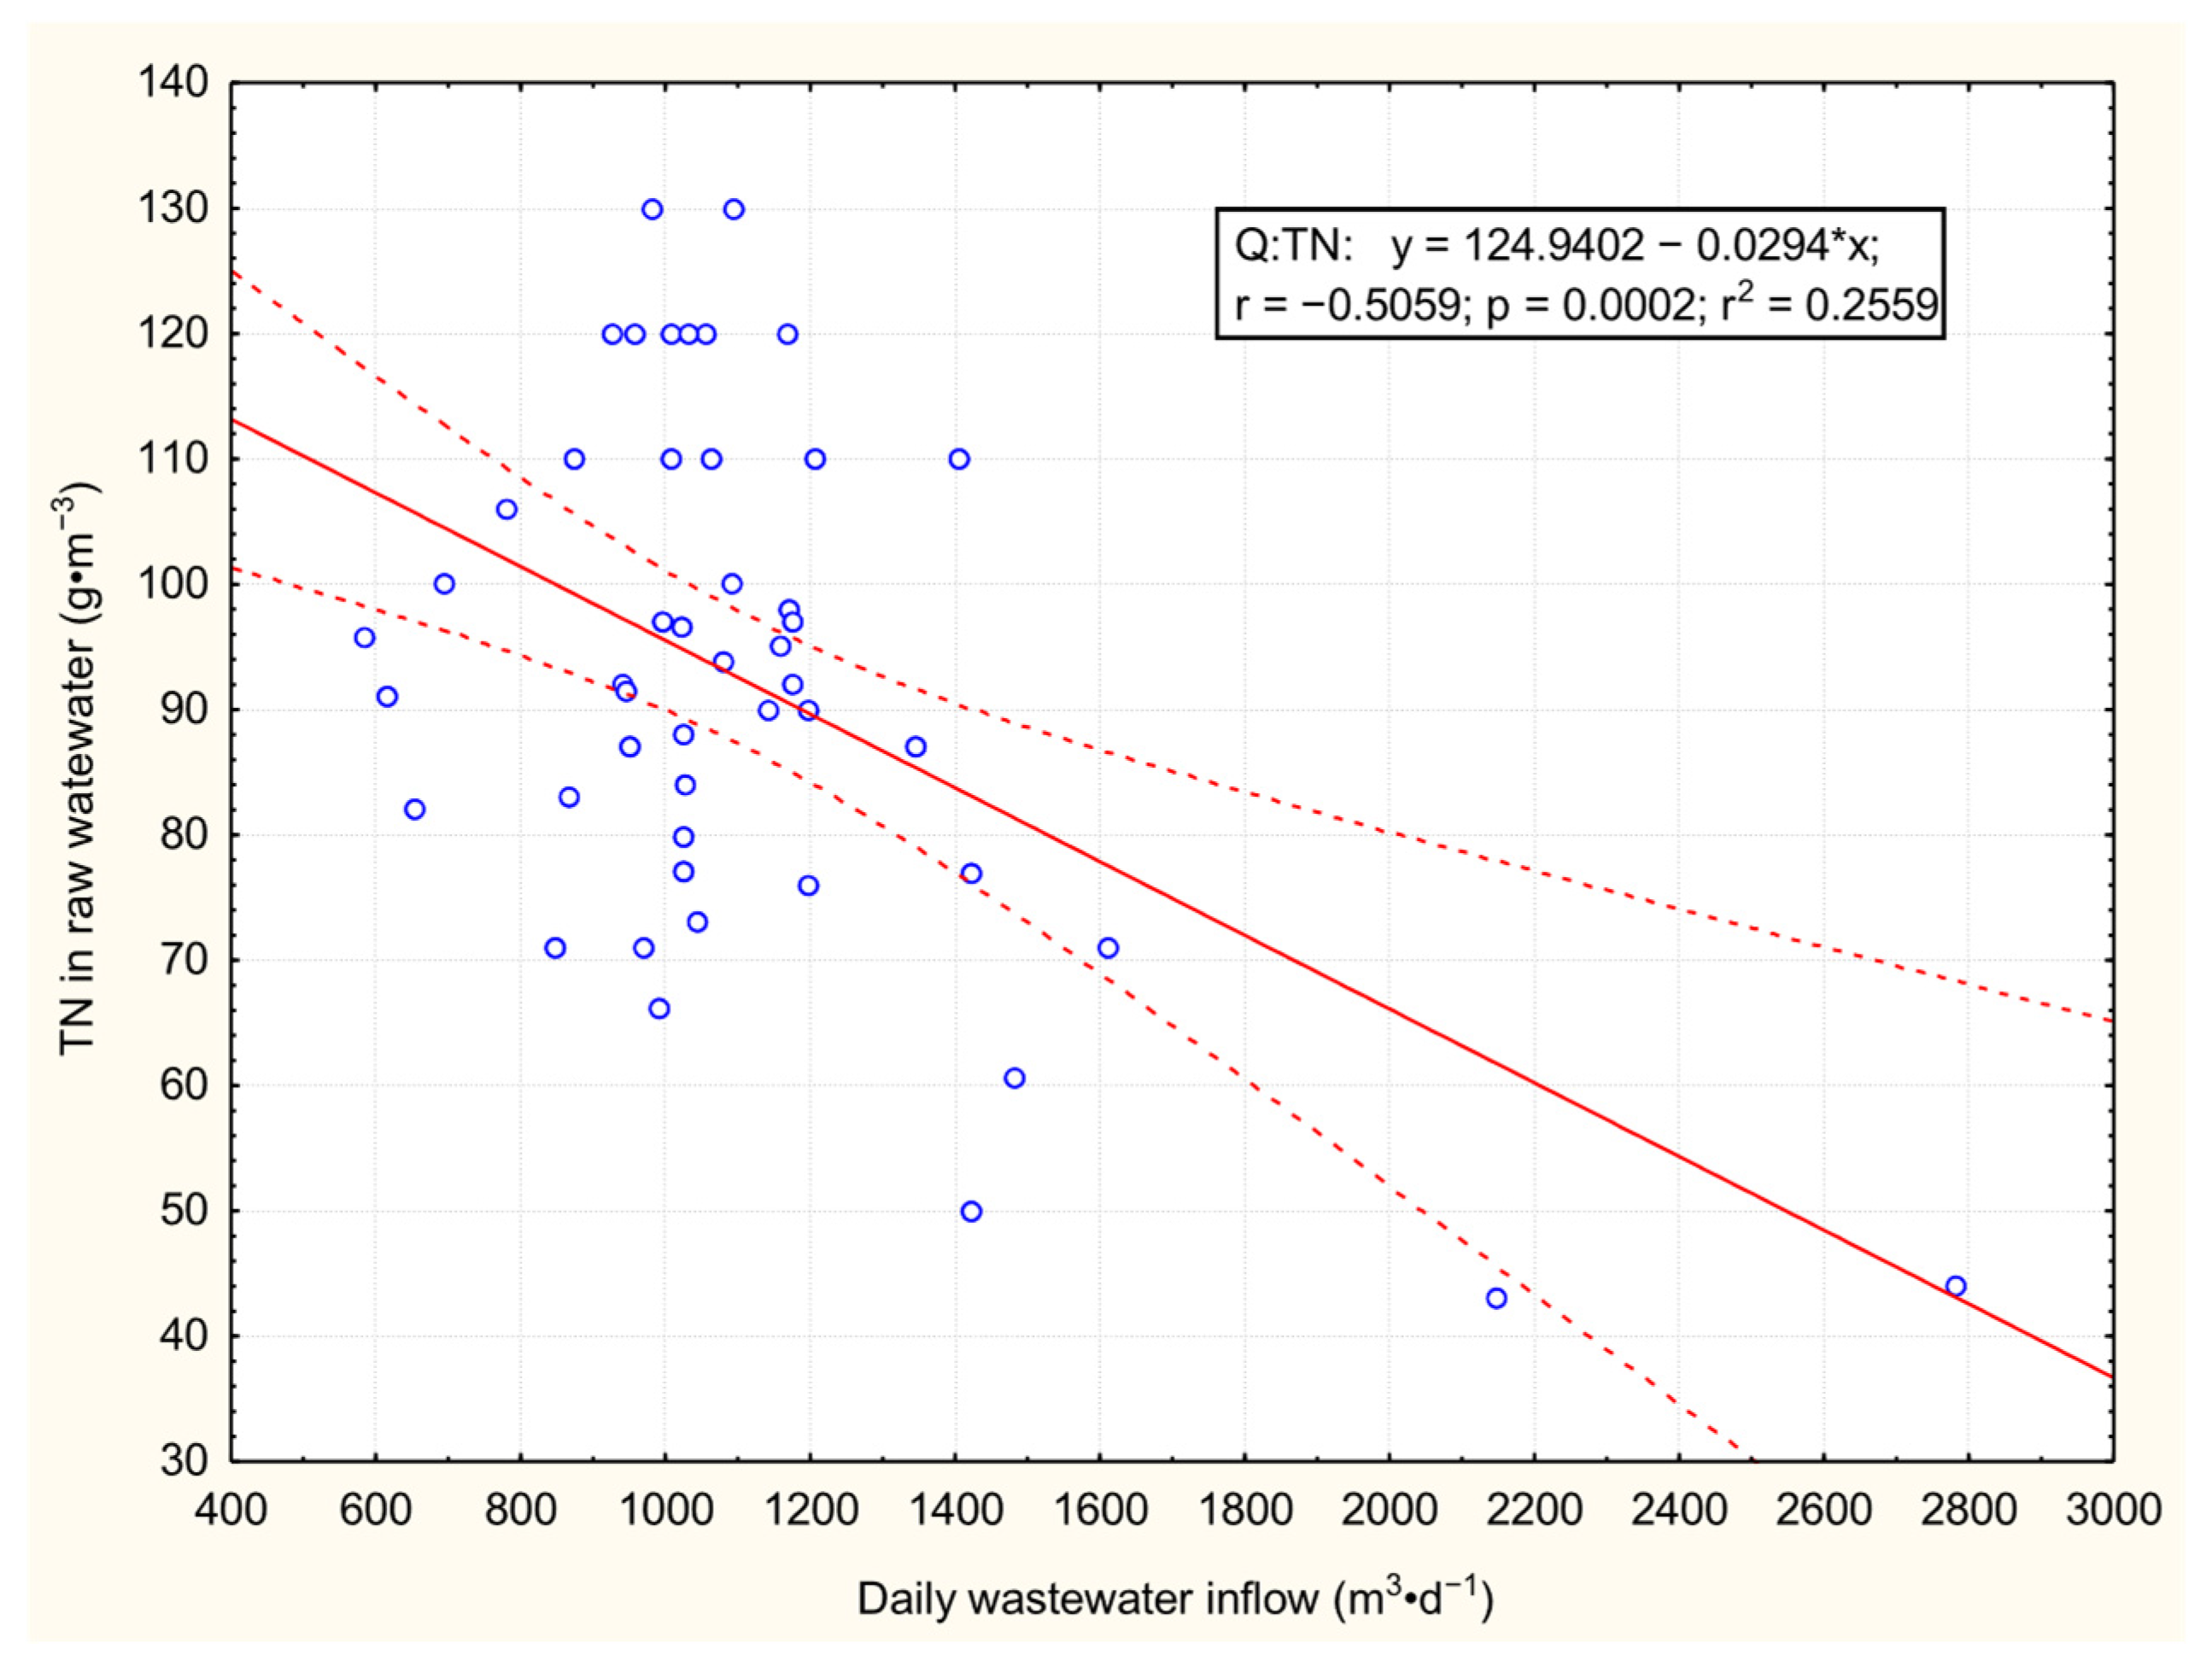
For the relationship between total nitrogen (TN) concentration in the influent and the volume of influent wastewater, the correlation was also strong with r
x,y = −0.50. The regression equation depicted in
Figure 6 shows that an increase in influent wastewater volume by 100 m
3·d
−1 causes a decrease in TN concentration by 19.17 g·m
−3.
In all the above-described relationships, the correlations were statistically significant at the α = 0.05 level.
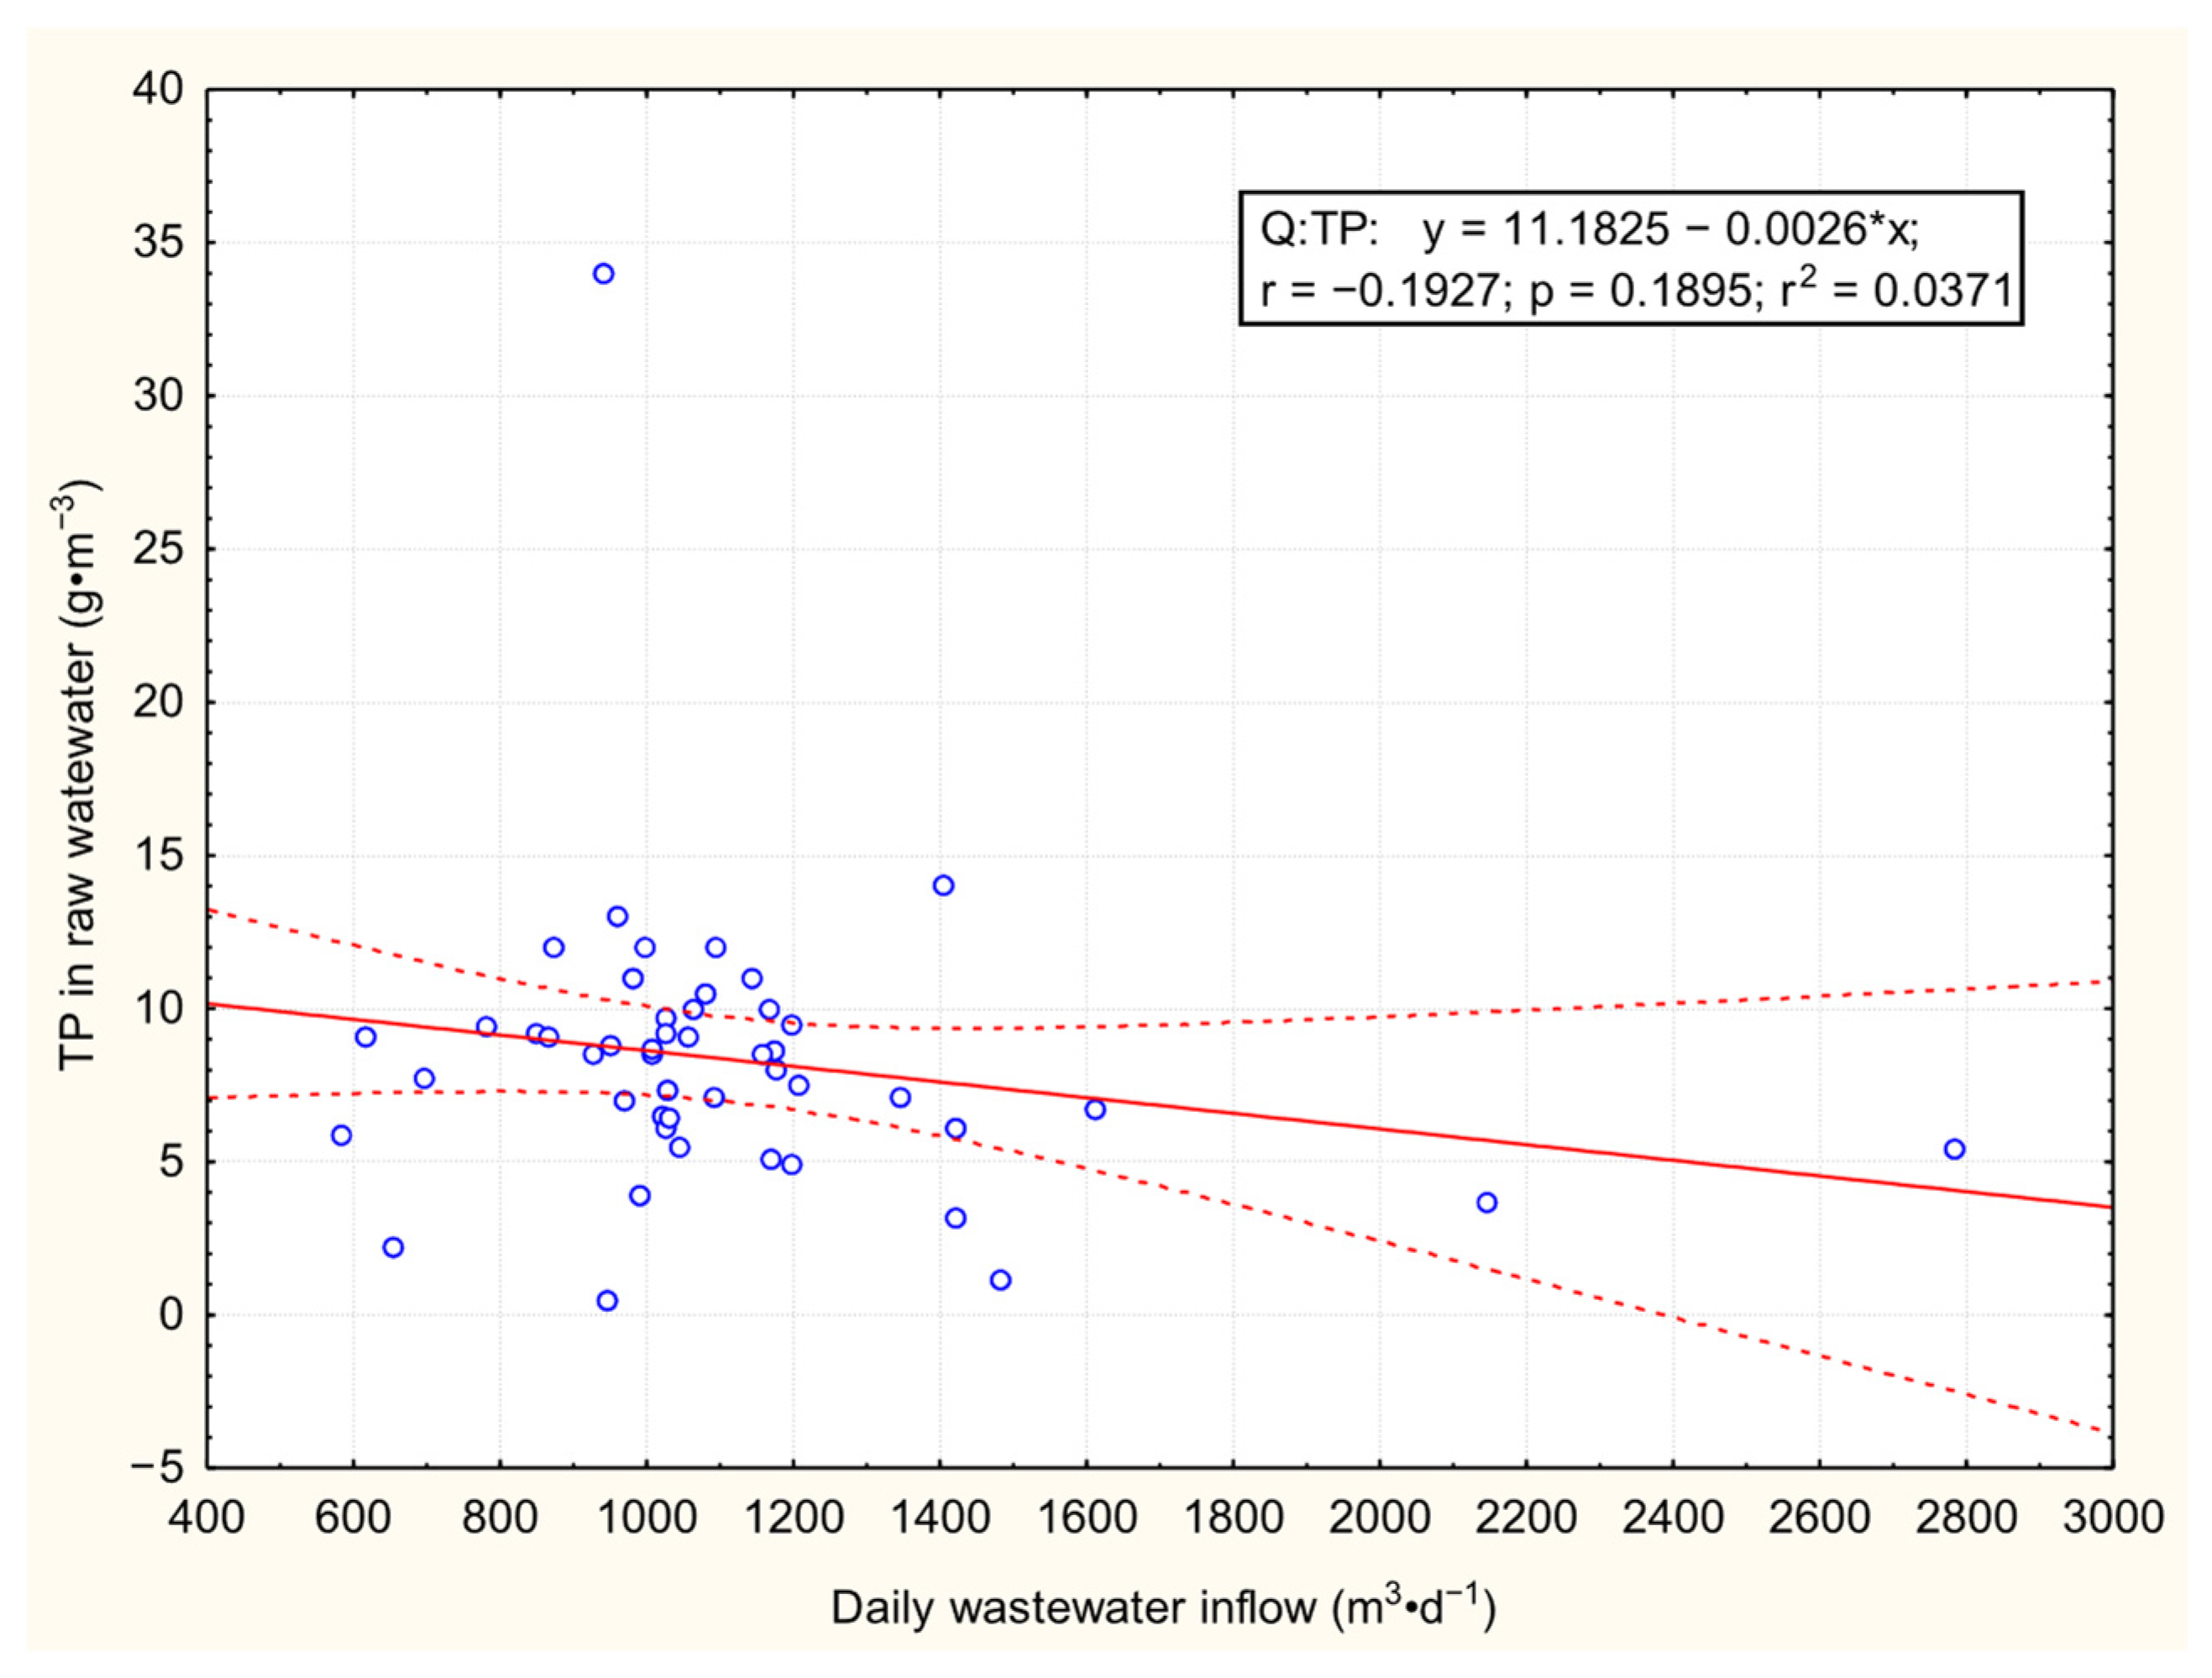
In relation to the dependence of total suspended solids (TSS) (
Figure 7) and total phosphorus (TP) (
Figure 8) concentrations on the influent wastewater volume, the correlation was weak according to the Stanisz scale [
28]. Moreover, these correlations were statistically insignificant, thus it should be concluded that there is no causal relationship between TSS and TP concentrations and the volume of wastewater influent to the treatment plant under study. Statistically significant negative correlations between the inflow volume and the concentrations of BOD
5, COD, and total nitrogen (TN) can be attributed to dilution effects caused by stormwater inflows or groundwater infiltration into the sewer system. During or immediately after rainfall events, large volumes of relatively clean water enter the sewer network and mix with municipal wastewater. This process increases the total inflow volume while simultaneously reducing pollutant concentrations in the raw sewage. Likewise, total nitrogen exhibits a proportional decrease with increasing flow, suggesting that both ammonium and organic nitrogen are subject to dilution due to stormwater inflows. In contrast, the absence of significant correlations between flow and the concentrations of total suspended solids (TSS) and total phosphorus (TP) may be explained by their differing physicochemical properties. TSS represents a partially settleable fraction, whereas TP can occur in both dissolved and particle-bound forms. High flows can induce both resuspension (leading to increased concentrations) and dilution (leading to decreased concentrations), making the variability of these parameters not strictly dependent on inflow volume.
No impact of the volume of influent wastewater to the treatment plant on the concentrations of individual parameters in the effluent wastewater was observed.
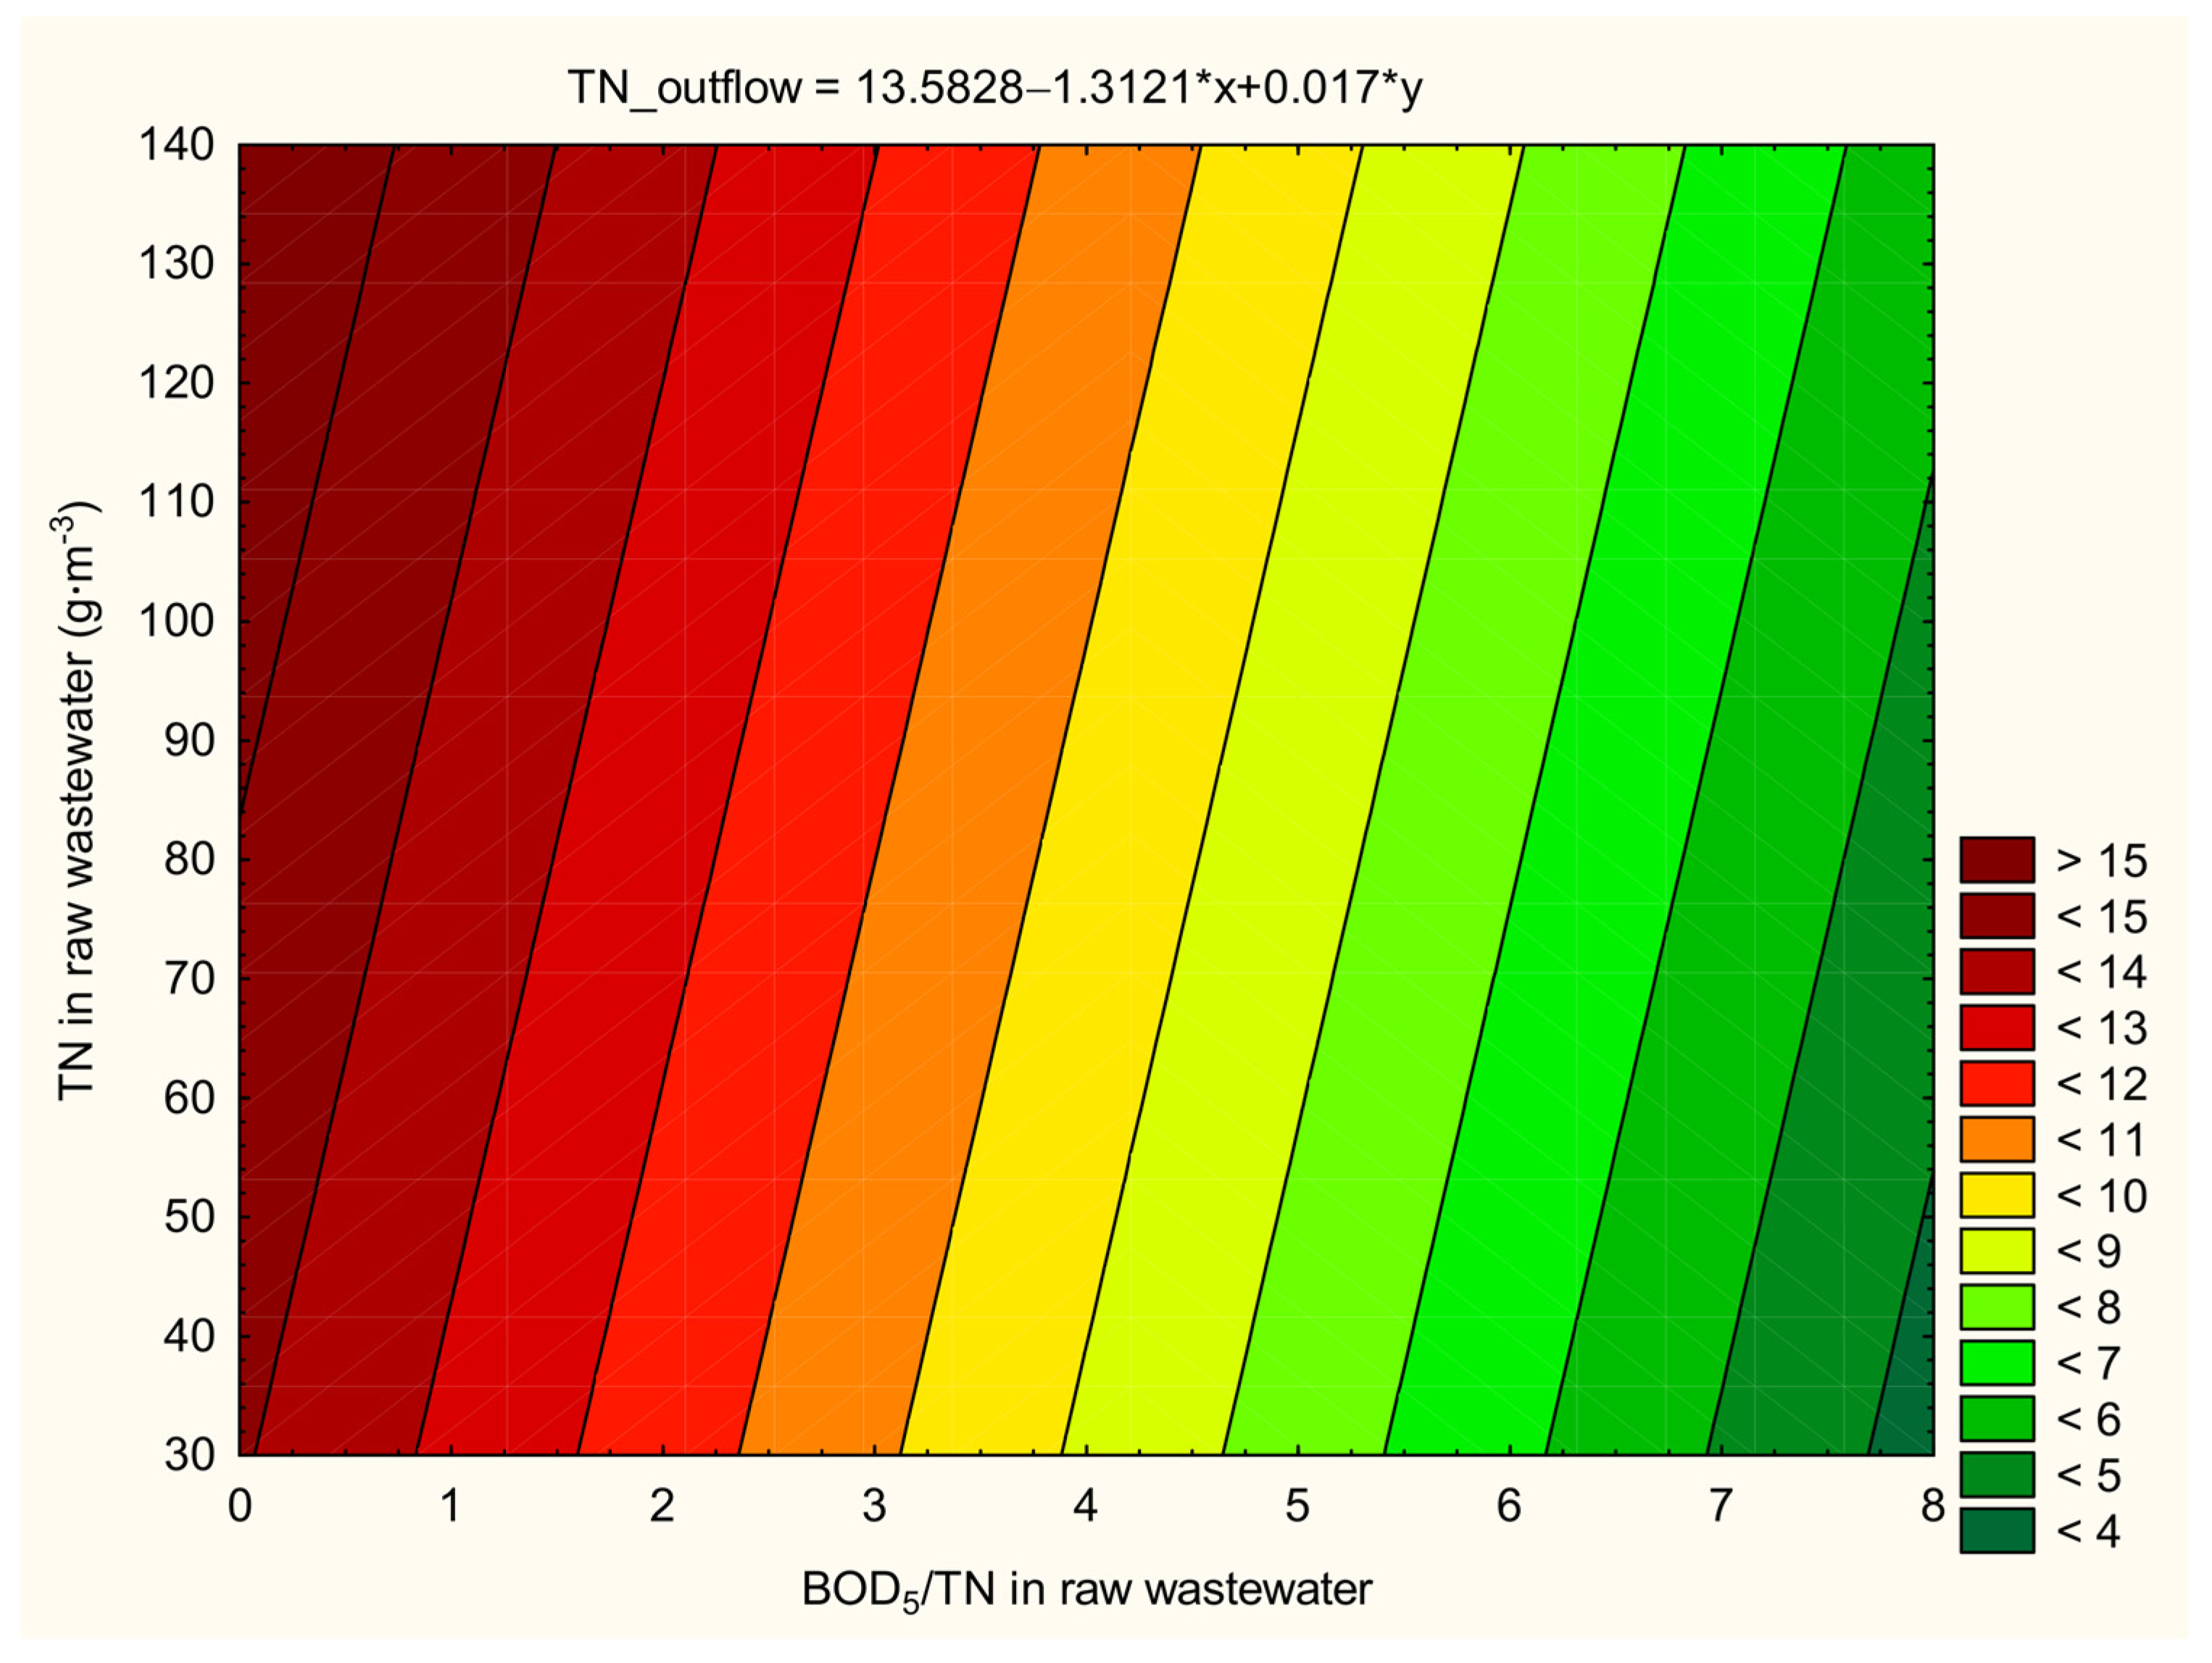
The exception was the concentration of total nitrogen (TN) in the treated wastewater, which was influenced by the ratio of BOD5/TN and the TN concentration in the influent wastewater.
In this part of the analysis, the influence of two independent variables (the BOD5/TN ratio and TN concentration in the influent wastewater) on the dependent variable, i.e., TN concentration in the treated effluent, was determined. To assess the simultaneous impact of these two independent factors on one dependent factor, a statistical partial correlation analysis of three variables was conducted.
The partial correlation analysis revealed that the TN concentration in the influent wastewater had a lower influence on TN concentration in the treated effluent (rx,y = 0.50) compared to the BOD5/TN ratio (rx,y = −0.62). In both cases, the correlations were statistically significant at the α = 0.05 level.
Based on the partial correlation results, a nomogram was developed, presented in
Figure 9. The constructed model can be described by the following equation:
TN-outflow in wastewater = 13.58 − 1.31BOD5/TN + 0.017TN in raw wastewater.
3.4. Characteristics of Effluent Quality
During the analyzed period, the concentrations of individual parameters in the effluent remained below the permissible limits specified in the water permit. Despite large and very large fluctuations in concentrations in individual samples, no exceedances of allowable values for these parameters in the treated wastewater were recorded.
Therefore, it can be concluded that despite the significant share of stormwater, and consequently the high variability of organic and nutrient pollutant concentrations in the influent wastewater, the treatment processes based on biological membrane reactors function properly.
Characteristic concentrations of the analyzed parameters in the treated wastewater are presented in
Table 3.
4. Conclusions
The conducted analysis of wastewater inflow to the treatment plant and the impact of incidental (storm) waters on its variability revealed a significant influence of atmospheric precipitation on the volume of incoming wastewater. Over the four-year study period, the average daily inflow was 1133.2 m3·d−1, representing 56.7% of the design inflow. The variability of inflow (estimated at 29%) indicates a moderate level of irregularity in wastewater inflow. The highest daily inflow reached 4091.9 m3·d−1, which more than doubled the designed capacity of the treatment plant.
Incidental waters accounted for a substantial portion of the inflowing wastewater during periods of intense rainfall, causing an increase in wastewater volume and its variability. The analysis showed that on dry days (without precipitation), the average daily inflow was 1030.2 m3·d−1, which was 48.5% lower than the designed plant capacity. On days with rainfall between 1.0 and 5.0 mm·d−1, the inflow increased to 1155.7 m3·d−1, and during more intense rainfall events (above 15 mm·d−1), it rose further to 1506.0 m3·d−1.
In terms of quality, concentrations of individual parameters in the incoming wastewater were at the level of medium-strength sewage, indicating the presence of both domestic sewage and incidental waters. BOD5, COD, and TSS concentrations exhibited strong variability, which can be attributed to the inflow of stormwater that dilutes the sewage and alters its characteristics. Moreover, a linear correlation between the volume of incoming wastewater and concentrations of BOD5, COD, and TN showed a negative relationship, meaning that as the wastewater volume increased, the concentrations of these parameters decreased.
Despite the high variability in the quality of incoming wastewater, the treatment plant operated properly, with effluent concentrations of parameters remaining below the permissible limits set in the water permit.
It is concluded that the use of membrane filtration for biomass separation at the examined treatment plant has a clearly beneficial effect on the quality of the treated wastewater and, even under adverse operating conditions—such as increased inflow of incidental waters—helps mitigate their negative impact on effluent quality. During periods of increased wastewater inflow, a rise in transmembrane pressure occurred, necessitating more frequent membrane cleaning. This observation is also supported by the findings of Yogalakshmi and Joseph [
29].

