Abstract
Grid point approaches for LEO mega-constellation coverage analysis become computationally prohibitive for constellations exceeding 103 satellites due to exponential complexity growth. This paper presents the Mercator projection superposition (MPS) approach, which transforms coverage evaluation into a two-dimensional image-processing paradigm by projecting the satellite coverage onto Mercator maps. MPS decouples computational complexity from satellite count, enabling analysis of constellations exceeding 104 satellites. Validation against grid point approaches shows ≤1.2% error with 60× speed improvement for 103-scale constellations without parallel computation. The method establishes that instantaneous coverage rates reliably approximate periodic rates within 0.04% precision for early-stage constellation design. Analysis of Starlink-based configurations identifies optimal principles governing mega-constellation coverage, with particular emphasis on configuration and orbital parameter relationships. These findings enable rapid design iteration and optimization for future mega-constellation development.
1. Introduction
The proliferation of satellite mega-constellations is ushering in a new era for global communication, navigation, and earth observation, promising global connectivity at unprecedented scales [1,2,3]. Characterized by a large number of satellites working in synergy from low Earth orbit (LEO), mega-constellations aim to provide seamless coverage and reduced latency across the globe [4,5,6]. Given the magnitude and complexity of deploying and operating such constellations, the ability to predict, optimize, and manage their coverage is of paramount importance. Consequently, the need for efficient, accurate, and dynamic coverage analysis methods has grown significantly in recent years [6,7].
However, achieving such expansive coverage is not without its challenges. The deployment and operational strategies of such constellations need careful consideration to optimize coverage and maximize system efficiencies [8]. In the realm of constellation coverage assessment, three primary analytical approaches have been developed: those rooted in satellite-Earth geometric relationships [9,10,11,12,13], those that project the coverage-to-Earth issue onto specific feature spaces [14,15], and techniques based on partitioning principles [16,17,18,19,20,21,22,23,24]. Within the first two categories, Walker [9] explored the global coverage capabilities of various ideal constellation types using the street of coverage (SOC) method and provided an estimation of the number of satellites required to achieve global coverage. Rider [11] delved into the analytic design of satellite constellations for Earth coverage from inclined circular orbits using a geometric approach. Ulybyshev [13] employed geometric methods to study continuous global coverage by circular near-polar orbit satellite constellations. In summation, while analyses based on the above provide clarity, they are often limited to specific categories or features, such as circular orbit satellite constellations. They might not be suitable for hybrid constellations or constellations influenced by perturbations.
To address these limitations, Morrison [17] introduced the grid point approach (GPA) for constellation coverage analysis. As a quintessential method inspired by the concept of partitioning, GPA has become a widely adopted methodology for constellation coverage analysis. The approach necessitates dividing a specified region into grids based on certain criteria, representing each grid by its center point. Coverage of every satellite over all grid points is computed using the central angle method, and the coverage statistics are subsequently analyzed. This technique’s applicability is not constrained by orbit or sensor types, making it particularly useful for complex constellation coverage analyses. Although refined grid segmentation promises computational accuracy, the sheer volume of these grids can lead to considerable computational demands [24], especially for constellations of the order of 1E3 or even 1E4, which are rapidly evolving and being deployed. With GPA, the computational power and efficiency demands escalate linearly. To optimize this, some researchers have proposed partitioning the bounding boxes of target areas based on area [18,20,25], distance [19,21,22], and latitude [23] metrics to augment computational efficiency. Nevertheless, given their foundational adherence to the GPA, they remain ensnared by the inherent trade-off between computational precision and satellite count, invariably necessitating substantial computational allocations. Such approaches often grapple with reconciling the dual imperatives of timeliness and computational precision in coverage analysis [26].
It is evident that traditional methods, which served well for smaller constellations, may fall short when applied to the vastness and intricacy of mega-constellations. The complexity of these expansive systems, in conjunction with the dynamic nature of their operating environment, calls for advanced analytical techniques [26,27]. The Mercator projection, a cylindrical map projection introduced by Gerardus Mercator in 1569 [28], provides a compelling method for such advanced analyses. While its historical usage primarily pertains to maritime navigation due to its capacity to delineate lines of constant course, its prospective utility in satellite coverage analysis is yet to be fully explored [28].
In this paper, we present a novel method for analyzing the coverage of mega-constellations by leveraging the Mercator projection map, termed the Mercator projection superposition (MPS) approach. This method captures the coverage of constellations over a designated celestial sphere, projecting it onto a two-dimensional Mercator map, and employs principles of parallel assignment within image element ranges and image superposition to analyze constellation coverage. Crucially, it decouples the computational demand from the number of satellites in the constellation, ensuring that the computational expenditure for analyzing constellations of the magnitude of 1E5 remains comparable to those at the 1E1 scale. The MPS approach aspires to provide a more precise, visually intuitive, and multifunctional avenue for examining and finetuning the configurations of mega-constellations. Furthermore, drawing on parameters from the Starlink constellation, we have discerned general optimal rules for mega-constellation coverage in relation to configurations and orbital parameters. Such insights are poised to play a pivotal role in guiding the future design, configuration, and operational strategies of these pioneering endeavors. The remainder of the paper is organized as follows. Section 2 covers the fundamentals of the satellite-to-Earth coverage models. Then, the proposed MPS approach is described in Section 3. Section 4 demonstrates the comparison of the time complexity with the traditional GPA by both theoretical analysis and simulation perspectives, and the comprehensive analysis based on Starlink’s coverage characteristics is completed in Section 5 to explore the coverage dynamics in response to key constellation parameters. Conclusions are presented in Section 6.
2. Preliminaries
The coverage models of satellites’ payloads are different in various missions. For instance, the unknown target is detected by the satellite with the Earth as the background when conducting the infrared detection and early warning mission at a high Earth orbit [29]. The satellite spins to keep its main axis oriented to the ground, and there exists a certain angle between the axis of the optical sensor on board and the main axis. A cone angle of view is formed as the spinning satellite scans, as shown in Figure 1.
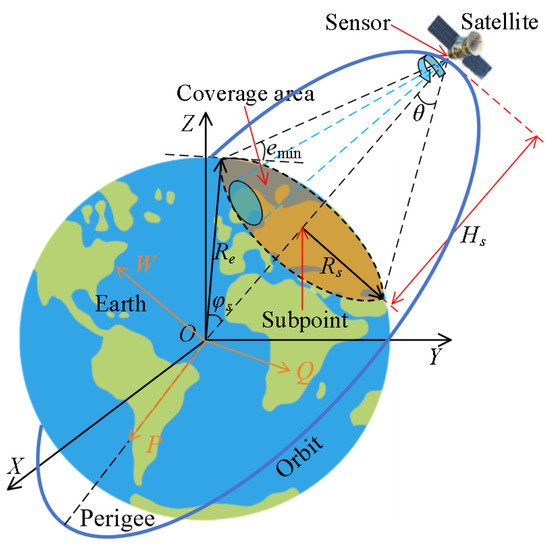
Figure 1.
Model of a single satellite-to-Earth coverage.
2.1. Orbital Model
Herein, two coordinates are defined to address the satellite’s position.
- Earth-centered inertial (ECI) coordinate system OXYZ. The origin O is located at the Earth’s center of mass. The X-axis is oriented toward the vernal equinox, while the Z-axis aligns with Earth’s rotational axis, pointing toward the North Celestial Pole. The Y-axis completes the right-handed orthogonal system.
- Orbital coordinates OPQW. The P-axis is directed towards the orbital perigee, and the W-axis is aligned with the momentum axis of the orbit. The Q-axis completes the right-handed orthogonal system.
Typically, satellites in a constellation periodically raise their orbits and adjust their inclinations to counteract the effects of atmosphere drag, Earth’s non-sphericity, and other perturbative forces that cause orbital variations. This ensures that the satellites remain efficiently positioned on their designated orbits. Therefore, when studying the coverage of the constellation, either in terms of ground or sky coverage, the two-body model is employed to describe the satellite’s motion equations [30].
where is the satellite’s position in inertial coordinate system, and is the distance between the satellite and the Earth’s center. = 398,600.5 km3/s2 is the gravitational constant of the Earth.
Based on Equation (1), the position r in the orbital coordinates OPQW can be obtained.
where a and e are the semi major axis and eccentricity, respectively. ψ is eccentric anomaly, and satisfies
where e is the orbital eccentricity. ϑ is the true anomaly.
Furthermore, the satellite’s position in the ECI frame OXYZ can be expressed as follows.
where Aio is the transformation matrix from orbital frame OPQW to ECI coordinates OXYZ, and is given by:
where Az(_) and Ax(_) stand for a transformation matrix about an axis z and x by an angle, respectively.
2.2. Sub-Satellite Point
The sub-satellite point is that point on the Earth’s surface directly below the satellite. It is expressed in terms of geographic longitude and latitude , that is . can be calculated from the inertial coordinate system for Earth-orbiting spacecraft. Assuming (X, Y, Z) is the satellite’s position in inertial coordinate system OXYZ, its right ascension α and declination δ can be obtained.
where
Similarly, based on spherical triangle, α and δ can also be obtained from orbital elements as follows.
where is the argument of the ascending node. Orbital parameters , and are the semimajor axis, eccentricity, inclination, right ascension of the ascending node (RAAN), argument of perigee, and time of perihelion passage, respectively. Then, the geographic longitude and latitude can be obtained based on their conversion formula of the right ascension and declination.
where is the Greenwich hour angle at the starting time. 7.292115 × 10⁻⁵ rad/s is the rotational angular velocity of Earth. 6378.137 km and 6356.755 km are the equatorial radius and polar radius of Earth, separately.
2.3. Map Projection
Map projection refers to the transformation of the Earth ellipsoid or sphere to a plane according to a certain mapping relationship, so that the geographic coordinates and the plane rectangular coordinates establish a functional relationship. Therefore, map projection can transform three-dimensional problems into planar problems.
The general formula of the map projection is
where the function and depend on different projection conditions and keep single value continuous and bounded in the mapping area.
Herein, three coordinate frames are defined to address the map projection.
- Web Mercator projection (WMP) coordinate system . The system defines its origin at the intersection of the equator and the prime meridian. The x-axis extends along the Equator, with positive values directed eastward, while the y-axis extends along the meridian lines, with positive values increasing northward.
- Projected pixel coordinate system . The axis and axis are located on the central axis of the image, respectively. The value range of the axis and axis is for the Mercator image with resolution of .
- Image pixel coordinate system . The upper left corner of the image is taken as the origin . The range of values on the and axes is for the Mercator image with resolution of .
The transformation from longitude and latitude to WMP coordinates is as follows.
The relationship between WMP coordinates and projected pixel coordinates is:
According to simultaneous Equations (12) and (13), the transformation from longitude and latitude to projection pixel satisfies:
The pixel coordinates take the upper left corner as the origin , so the transformation of projected pixel coordinates to requires the transformation of changing the -axis direction to reverse direction and shifting to the left. The axis is translated upward by . Therefore, the formula for converting longitude and latitude to pixel coordinates is as follows.
On the contrary, the transformation of pixel coordinates to longitude and latitude is:
2.4. Modeling of Single Satellite-to-Earth Coverage
The model of single satellite-to-Earth coverage is used to describe the instantaneous geometric coverage area of the payload in such missions as satellite imaging or Earth observation/communication with the Earth as the background. Supposing the Earth is a perfect sphere with the center , and the distance constraint is not considered in the satellite-to-Earth coverage, the coverage area of a satellite in the constellation is a spherical crown centered on the sub-satellite point on the Earth surface, as presented in Figure 1.
The semi-geocentric angle and the spherical radius satisfy Equation (17).
where is the semi-cone angle of the satellite-to-Earth communication/observation field of view. is the current orbit altitude of the satellite.
Additionally, the coverage area can be defined with the minimum angle of elevation of the ground as a constraint. To ensure reliable communication between satellites and ground stations, it is usually necessary to make the included angle between the boundary of the satellite field of view and the local tangent greater than the given . The relationship among , , and the minimum elevation of ground is as follows.
2.5. Modeling of Inter-Satellite Coverage at the Same Altitude
The occlusion effect of the Earth curvature and the atmosphere on the inter-satellite coverage is mainly considered. For satellites at the same altitude, the coverage of a single satellite is a spherical crown centered on the satellite, as depicted in Figure 2. According to the geometric relationship of the spherical surface, the semi-geocentric angle corresponding to the spherical cap and the radius of the spherical surface satisfy the following.
where is the thickness of the atmosphere.
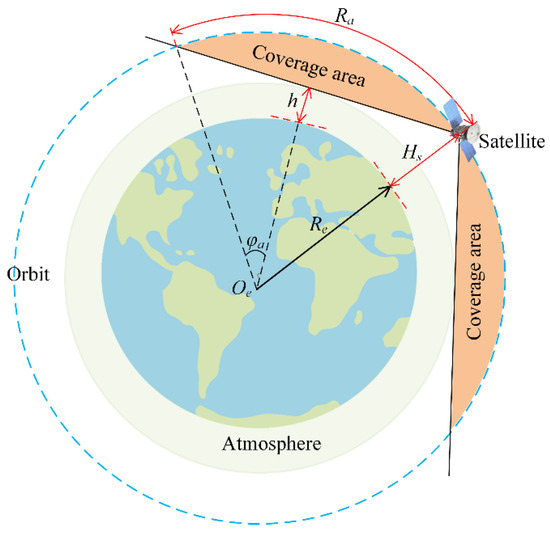
Figure 2.
Model of inter-satellite coverage at the same altitude.
3. Mercator Projection Superposition (MPS) Approach
In this paper, we introduce the Mercator Projection Superposition (MPS) technique, an innovative coverage analysis methodology. By projecting a satellite constellation’s coverage from a designated celestial sphere onto a two-dimensional Mercator map, leveraging image distortion projection techniques, we can systematically analyze the constellation’s coverage. Utilizing parallel pixel-range assignments in tandem with image overlay principles, this method promises a marked improvement in the analytical efficiency of multi-coverage evaluations for large-scale satellite constellations.
3.1. Mercator Coverage Map
Herein, the concept of a Mercator coverage map (henceforth denoted as the coverage map) is introduced as a composite representation that superimposes the Mercator projection of a given satellite’s coverage area over a Mercator-based geographical baseline map (See Figure 3 for illustrative purposes).
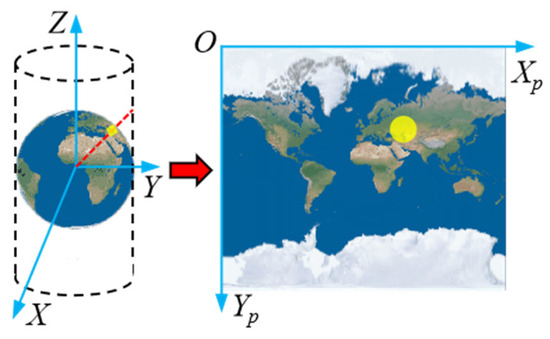
Figure 3.
Mercator coverage map of single satellite to Earth.
Equations (17) and (20) furnish us with the spherical radius of the area under consideration, as per the relevant coverage model. Utilizing a direct solution algorithm for geodetic problems [31], the spatial geometric curve of the coverage area, with respect to the sub-satellite point, is ascertained. Depending on the color model employed (e.g., RGB, CMYK) [31], and designated color values , the coverage map (), Ns is the satellite numbers) corresponding to the ith satellite is rendered. Equation (21) delineates the encoding methodology for .
where is the pixel in the coverage area.
The selected color value K0 is used to initialize the given resolution Mercator base map. The coverage maps corresponding to individual satellites are sequentially superimposed, employing a predetermined level of transparency η, as dictated by Equation (22). It elucidates the principle governing the superimposition of color values, ranging from to , ultimately yielding the composite constellation coverage map .
It is confirmed that Equation (22) establishes a one-to-one correspondence between the multiplicity of constellation coverage and the color values manifested in the coverage map. For i-fold coverage, the pertinent color value is prescribed by Equation (22). Subsequently, the i-fold coverage matrix is assigned values in accordance with and the constellation’s composite coverage map . The methodology for this assignment is delineated in Equation (23).
where and are the color value of the pixel and the element situated in mth row and nth column, respectively.
3.2. Constellation Coverage Calculation
Critical metrics such as coverage area and coverage rate are central to evaluating the efficacy of satellite constellations in providing extensive coverage. The paper proposes the MPS method to determine these coverage metrics. Accordingly, the area matrix, weight matrix of target area, coverage area, and coverage rate are rigorously defined.
The area matrix A is defined as p-dimensional, with each element representing the geographical area of the respective pixel in the constellation coverage map Gc, as determined from Mercator projection characteristics.
where is the image resolution, and is the geographic latitude of the pixel in the ith row of the constellation coverage map.
The p-dimensional W delineates the weight matrix of the target region, assigning a value of 1 for the position Wmn of the element within qg and 0 otherwise.
where is the element in mth row and nth column of W.
Bi and Ci are defined as the i-fold coverage area and coverage rate for the target area, respectively, and satisfies
where is the Hadamard product.
3.3. Indicator of Constellation Coverage Performance
3.3.1. Instantaneous (i-fold) Coverage Rate Ct (Ct_i)
On the surface of the celestial sphere, the indicator, denoted as Ct, is formulated to represent the ratio of the coverage area St to the total area S of the targeted region at one point. The metric Ct_i quantifies the area covered by i satellites of the constellation relative to S.
3.3.2. Periodic Mean (i-fold) Coverage Rate Ca (Ca_i)
This metric Ca encapsulates the average level of coverage on the celestial surface over an orbital period, while Ca_i represents the mean i-fold coverage rate within one period.
3.3.3. Periodic Maximum (i-fold) Coverage Rate Camax (Camax_i)
This parameter is designated to represent the peak level of total (i-fold) coverage across an orbital period on the celestial surface.
3.3.4. Periodic Minimum (i-fold) Coverage Rate Camin (Camin_i)
This metric quantifies the least extent of total (i-fold) coverage within the targeted area over one period on the celestial surface.
3.4. Algorithm Implementation
The pseudocode and method flow of MPS algorithm are illustrated in Figure 4 and Algorithm 1, respectively.
| Algorithm 1: MPS for coverage analysis of mega-constellation | |||
| Input: Ns, Hs, i H, h, η emin, ts T, Tstep Output: Ci, Ca | //Total numbers, orbital altitude, and inclination //Celestial sphere height, thickness of atmosphere and transparency //Minimum elevation and orbit epoch //Calculation duration and time step //i-fold and total coverage rate | ||
|
1
2 3 4 5 6 7 8 9 10 11 12 13 14 15 16 17 18 19 20 21 22 23 24 25 26 27 28 | Calculate θ as per Equation (19); N = int(1); //Generation of all single satellite-to-Earth coverage map while N < Ns P = 1; while P < N if N % P == 0 Num == int(N/P); Ts = int(T/Tstep); for k = 1, 2, …, Ts //Generation of sub-satellite point Calculate Rs as per Equation (18); Calculate (λ, φ) as per Equations (8)–(10); //Generation of single satellite coverage map Generate Gi as per Equations (12), (15) and (21); end end P = P + 1; end N = N + 1; end //Generation of coverage map and coverage rate of constellation Calculate Gc as per Equation (22); Generate Fi as per Equation (23); Generate A as per Equations (24) and (25); Generate W as per Equation (26); Generate Ci and Ca as per Equations (27) and (28); return Ci, Ca; | //Semi-cone angle //Cyclic variable of satellite count //Cyclic variable of orbital planes //Number of satellites per plane //Number of calculations //Semi-geocentric angle //Sub-satellite point //Coverage map of constellation //i-fold coverage matrix //Area matrix //Weight matrix //Coverage rate | |
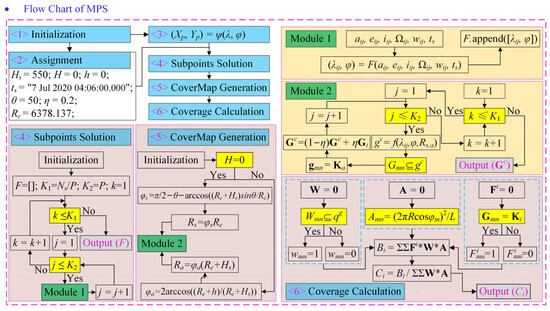
Figure 4.
Flow chart of Mercator projection superposition (MPS) method.
4. Efficiency Analysis and Performance Evaluation
To validate the computational performance of the proposed MPS algorithm, a comparison of the time complexity with the traditional GPA is conducted from both theoretical analysis and simulation perspectives.
4.1. Time Complexity of GPA
The GPA operates by discretizing the Earth’s surface into a uniform grid of points. For each grid point, the algorithm determines whether it is covered by a satellite, and subsequently, coverage performance metrics are calculated. The total computational time TGPA mainly arises from three components:
where , , and represent the running times for grid point generation, single-satellite coverage determination per grid point, and result analysis, respectively. M is the total number of grid points, and Ns is the total number of satellites.
As expressed in Equation (33), we know the time complexity of the GPA is O(M·Ns). Given the computational accuracy (determined by M), and are constants, while exhibits linear growth with Ns. For large satellite constellations, becomes the dominant factor in the algorithm’s time complexity. The multiplicative relationship between M and Ns introduces significant computational overhead when analyzing large-scale constellation systems.
4.2. Time Complexity of MPS Algorithm
The proposed MPS algorithm employs a fundamental approach by projecting the satellite constellation coverage onto a 2D Mercator base map. Through parallel assignment and image overlay techniques, the algorithm analyzes the constellation coverage efficiently. The computational cost TMPS consists of three components:
where , , and are the time consumed for the Mercator base map initialization, single-satellite coverage domain calculation, and coverage analysis, respectively. L represents the image resolution, and Ns denotes the total number of satellites.
Obviously, the time complexity of the MPS algorithm is O(Ns). A key advantage of MPS lies in its decoupling of the relationship between computational precision and constellation size, as the effects of Ns and L on the computational cost are independent. For a given analysis region, remains constant, while increases linearly with Ns. When the image size is fixed, both and remain constant.
The MPS algorithm’s transformation from the complexity O(M·Ns) of GPA (Equation (33)) to O(Ns) (Equation (34)) greatly reduces the impact of constellation size on the computational efficiency. By only computing the coverage boundary for each satellite and leveraging efficient image processing techniques, MPS demonstrates superior performance for large-scale constellation analysis, particularly in global coverage scenarios. This architectural difference represents a significant advancement over traditional methods, especially for analyzing mega-constellations.
4.3. Comparative Simulations
4.3.1. Simulation Setup
Comparative simulations of the GPA and MPS algorithms are conducted under equivalent computational precision conditions. The precision is established by determining appropriate values for the grid points (M) of GPA and the image resolution (L) of MPS. This process is based on the simulation of the global 1- to 4-fold satellite-to-Earth coverage of a Starlink constellation comprising 1584 satellites, configured with an orbital inclination of 53°, altitude of 550 km, and antenna scan semi-cone angle of 40°.
Herein, we determine the critical values Mc and Lc through a systematic approach to establish computational equivalence. For Mc, the moving variance method is employed with a 5-point window step size. Coverage rates are iteratively calculated until the variance decreased below 0.1 (Table 1), indicating region stability. The corresponding grid point value is designated as Mc. For Lc, we incrementally increase the MPS algorithm’s image resolution while comparing the 1- to 4-fold coverage results against those obtained from GPA using Mc. The Lc value is established when the relative error between the two approaches falls within 5% (Table 2), satisfying the accuracy requirements.

Table 1.
Moving Variance for grid points (Mc) of GPA.

Table 2.
Relative error between MPS and GPS (Mc) for Lc determination.
The above methodology yields final values of Mc = 17,786 (Table 1) and Lc = 16,348 × 16,348 (Table 2).
The simulations are performed on a system equipped with an inter(R) Core i7-6700K @4.00 Hz processor, 4 GB of RAM, and an NVIDIA GeForce GTX 1060 GPU with 6 GB of memory. We utilize Walker constellation configurations denoted as Ns/P/F, where Ns, P, and F represent the total number of satellites, the number of orbital planes, and the phase factor of the constellation, respectively.
4.3.2. Simulations and Discussion
Following the precision calibration, comparative analyses between the non-parallelized MPS algorithm and the GPA are conducted to evaluate computational errors and resource utilization. Two case studies are performed: Example 1 utilizing a typical constellation configuration, and Example 2 examining scaled configurations based on Starlink satellite parameters.
Example 1.

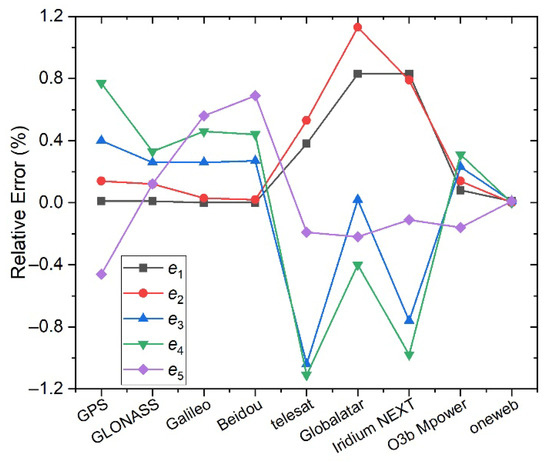
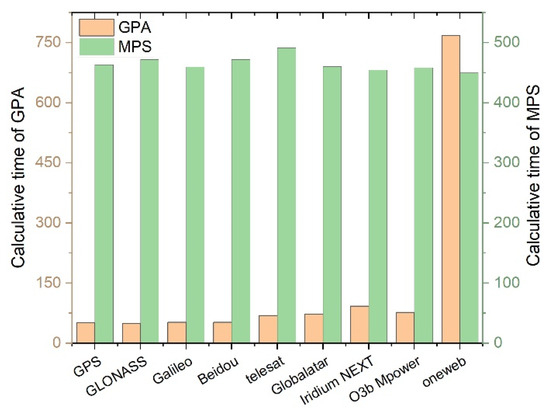
The constellation parameters are detailed in Table 3. Here we use the global GNSS constellations (e.g., GPS, GLONASS, Galileo, Beidou) as benchmarks for validation due to their well-documented parameters and global coverage focus. Global coverage is considered under physical obstruction factors, and 1- to 5-fold coverage are calculated using both algorithms. Figure 5 and Figure 6 present the computational errors and resource consumption, respectively.

Table 3.
Parameters of constellations (Example 1).

Figure 5.
Computational errors ei (i = 1, 2, …, 5, i-fold coverage) between non-parallelized MPS and GPA for different constellations (Example 1).

Figure 6.
Calculative time of non-parallelized MPS and GPA for different constellations (Example 1).
The results demonstrate that the computational errors between the non-parallelized MPS algorithm and the GPA are below 1.2% (Figure 5). As the constellation size increases from 101 to 102 satellites, the GPA algorithm’s computational time remains relatively constant at approximately 450 s (Figure 6). Under the selected resolution Lc, the MPS algorithm’s computational time is primarily determined by base map initialization and coverage statistics rather than the number of satellites. These operations are amenable to parallel computing optimization. While GPA exhibits superior performance for constellations with 101 satellites, its computational time scales linearly with larger configurations, eventually exceeding MPS performance at 102 satellites (Figure 6).
Example 2.

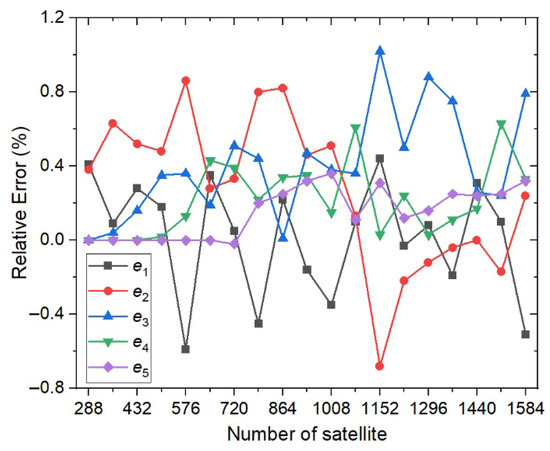
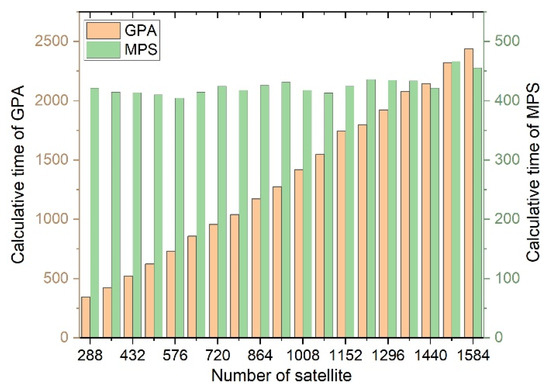
To further validate MPS efficiency with large-scale constellations, we analyze configurations utilizing 24 orbital planes, with satellite quantities increasing from 288 to 1584 in increments of 72 (Table 4). The computational errors and time for 1- to 5-fold coverage calculations are presented in Figure 7 and Figure 8.

Table 4.
Total number of satellites and constellation configuration (Example 2).

Figure 7.
Computational errors ei (i = 1, 2, …, 5, i-fold coverage) between non-parallelized MPS and GPA for constellations with different numbers of satellites (Example 2).

Figure 8.
Calculative time of non-parallelized MPS and GPA for constellations with different numbers of satellites (Example 2).
The results confirm that the computational errors between the non-parallelized MPS algorithm and the GPA are below 1.2% (Figure 7). Both algorithms exhibit linear scaling in computational time for constellations ranging from 102 to 103 satellites (Figure 8). Linear fitting analysis reveals scaling factors of 1.6434 and 0.0276 for GPA and MPS, respectively. Even without parallel computation, the MPS algorithm demonstrates approximately 60-fold greater efficiency than GPA, showing substantially reduced sensitivity to constellation size. For future analyses of mega-constellations with up to104 satellites, parallel-computed MPS implementations are projected to yield orders of magnitude improvement in computational efficiency.
5. Simulation Results and Discussion
The successful orbital deployment of the United States-based Starlink constellation signifies a pivotal milestone in the evolution of satellite networking and offers an invaluable case study for subsequent constellation designs. This paper undertakes a comprehensive analysis based on Starlink’s coverage characteristics, aiming to furnish systematic guidance for the architectural planning and deployment of LEO mega-constellations. Initially, we examine the temporal variations in coverage over a single orbital period, considering alterations in both orbital altitude and inclination. Subsequently, we delve into an exploration of coverage dynamics in response to shifts in key constellation parameters, utilizing Starlink’s operational metrics as a foundational benchmark.
5.1. Fluctuations in Constellation Coverage over One Orbital Period
5.1.1. Altitude-Dependent Coverage Fluctuation
Simulation experiments are conducted to scrutinize the Earth coverage variations during a single orbital period for Walker constellations comprised 72 orbital planes with 22 satellites in each. The orbital inclination was fixed at 53°, a temporal resolution of one minute was adopted for coverage time step, and a minimum elevation angle of 35° was considered for ground reception. Figure 9 delineates the Earth coverage fluctuations for a Walker constellation at an orbital altitude of 550 km. Table 5 enumerates both the mean and extremal values of the i-fold coverage rate (Ci) and the aggregate coverage rate (Ca) for each satellite during an orbital cycle. Both Ci and Ca manifested fluctuations within constrained bounds, with maximal discrepancies being 0.028% and 0.0027%, respectively.
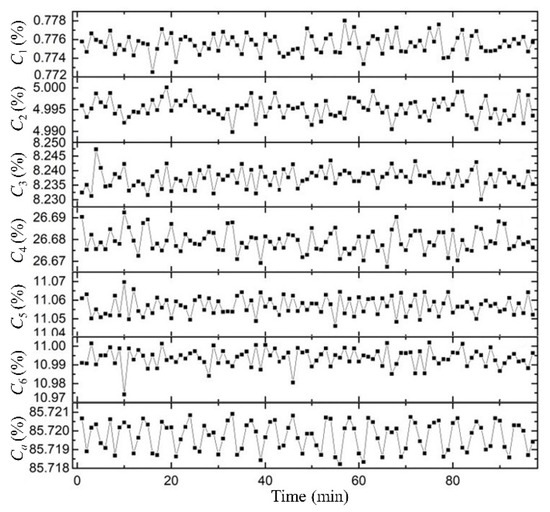
Figure 9.
Fluctuations of Ci and Ca for the Walker constellation at 550 km within an orbital period.

Table 5.
Average and extreme values of Ci and Ca for the Walker constellation at 550 km over one orbital period.
Figure 10 and Figure 11 extend the analysis to orbital altitudes spanning from 400 km to 1700 km, revealing that the extent of fluctuations for both Ci and Ca remains on the order of 0.01%, with no observed value surpassing 0.04%. Where the values of Ci_R and Ca_R represent the range Ci and Ca over one orbital period, respectively.
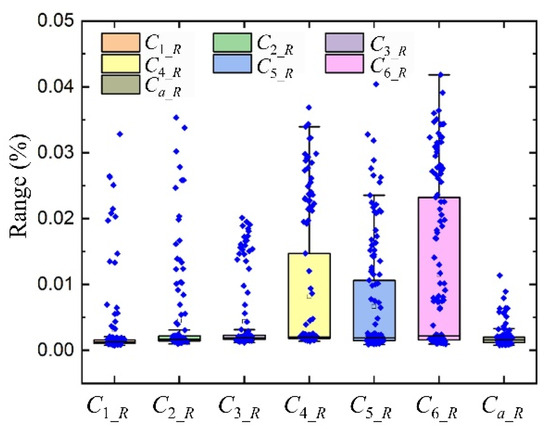
Figure 10.
Box diagram of Ci and Ca for Walker constellation ranging from 400 km to 1700 km within an orbital period.
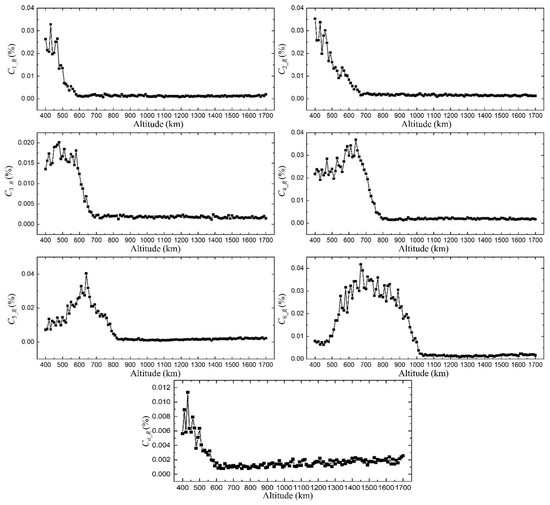
Figure 11.
Fluctuations of and for Walker constellation ranging from 400 km to 1700 km over one period.
5.1.2. Inclination-Dependent Coverage Fluctuation
Further simulations are performed to investigate Earth coverage variations corresponding to distinct orbital inclinations. An orbital altitude of 550 km was employed, along with a one-minute temporal resolution and a 35° minimum elevation angle for ground reception. Figure 12 depicts the Earth coverage fluctuations for a Walker constellation at an inclination of 47°. Table 6 compiles the mean and extremal values for Ci and Ca, which, akin to the prior scenario, fluctuated within constrained boundaries, having maximal variations of 0.025% and 0.0014%, respectively.
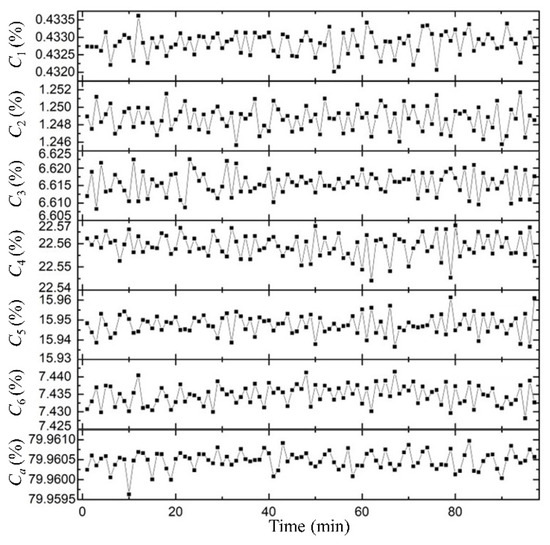
Figure 12.
Fluctuations of and for Walker constellation at 47° within an orbital period.

Table 6.
Mean and extremal values of and for Walker constellation at 47° within an orbital period.
Figure 13 and Figure 14 expand upon this, illustrating the coverage fluctuations for orbital inclinations varying from 0° to 90°. The data corroborates that both Ci_R and Ca_R fluctuate within an order of magnitude of 0.01%, never exceeding a 0.04% deviation.
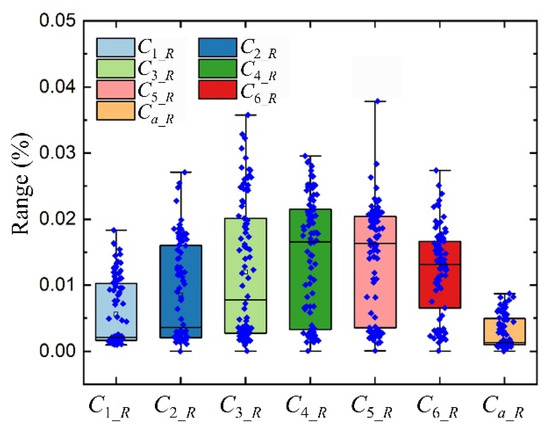
Figure 13.
Fluctuations of Ci and Ca for Walker constellation with inclinations ranging from 0° to 90° within one period.
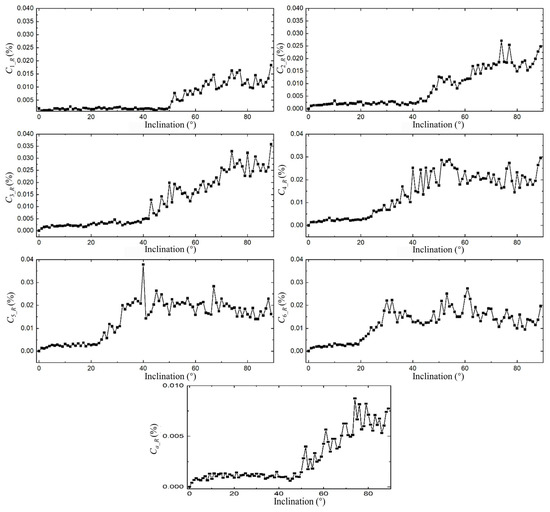
Figure 14.
Box diagram of Ci and Ca for Walker constellation with inclinations ranging from 0° to 90° within an orbital period.
Based on the foregoing analyses, it is manifest that during the preliminary design phases of LEO constellations—where the precision stipulation for coverage falls below 0.04%—the instantaneous coverage rate can serve as an expedient approximation of the periodic coverage rate, thereby facilitating computational efficiency.
5.2. Influence of Orbital Element on Constellation Coverage to Earth
Coverage analysis constitutes a crucial element in the architectural design of communication satellite constellations, serving as a linchpin for the assurance of reliable service delivery. In the present section, we undertake a meticulous examination of variations in Earth coverage afforded by the Starlink system. This inquiry encompasses a range of parameters, including orbital altitude, inclination angle, constellation configuration, and the aggregate number of satellites deployed within the constellation.
5.2.1. Influence of Altitude on Earth Coverage
As per Equation (18), the semi-geocentric angle corresponding to the satellite’s coverage footprint on Earth exhibits a positive correlation with orbital altitude. Figure 15 displays the modulations in the semi-geocentric angle as a function of varying orbital altitudes, operating under the constraint of a minimum ground elevation angle of 35°. The results elucidate that the semi-geocentric angle escalates incrementally from an approximate value of 5° to 15° as altitude ascends within the range of 400 km to 1700 km.
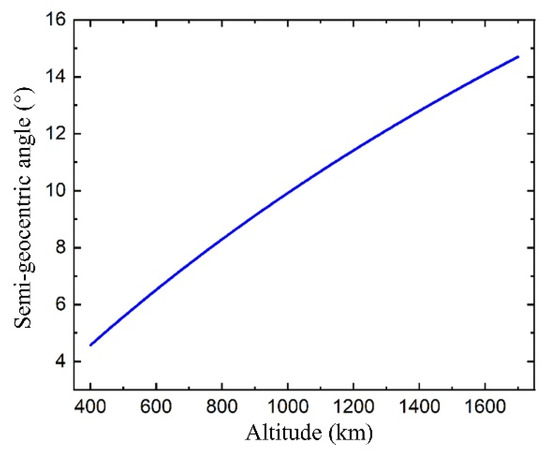
Figure 15.
Semi-geocentric angle of coverage area with varying orbital altitudes.
Figure 16 illuminates the impact of altitude fluctuations (from 400 km to 850 km in 10 km increments) on i-fold and aggregate coverage rates. The constellation under scrutiny here follows a Walker configuration with a fixed inclination of 53°, encompassing 72 orbital planes and 22 satellites per plane, while maintaining a minimum ground elevation angle of 35°. It is observed that as altitude increases, the 1- and 2-fold coverage indices exhibit a discernible decrement, whereas the 3- to 6-fold coverage rates initially experience an elevation prior to diminishing. This observed phenomenon can be attributed to the expansion of individual satellite coverage footprints at higher altitudes, culminating in more frequent overlaps and thereby transmuting i-fold to (i + 1)-fold coverage scenarios. Subsequently, as altitude elevates, coverage rates sequentially attain their respective zeniths, commencing from 1-fold and extending up to 6-fold, before registering a decline. Moreover, the analysis unveils that the 4-fold coverage rate achieves its apogee within the altitude bracket of 500 km to 550 km. This empirical insight aligns closely with Starlink’s stated objective of maximizing 4-fold coverage rate, as articulated in their application to the Federal Communications Commission (FCC) for constellation deployment.
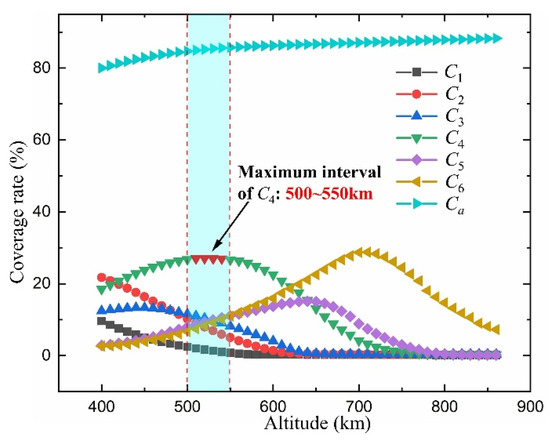
Figure 16.
Ci and Ca for the Walker constellation with altitudes ranging from 400 km to 850 km.
5.2.2. Influence of Inclination on Earth Coverage
As delineated in Figure 17, this study examines the variation in the i-fold (i = 1, 2, …, 6) and aggregate coverage rate for a Walker constellation with increasing inclination, ranging from 0° to 90° in 1° increments. The constellation under consideration operates at an orbital altitude of 550 km, comprises 72 orbital planes, and deploys 22 satellites per plane. The minimum elevation angle is set at 35°.
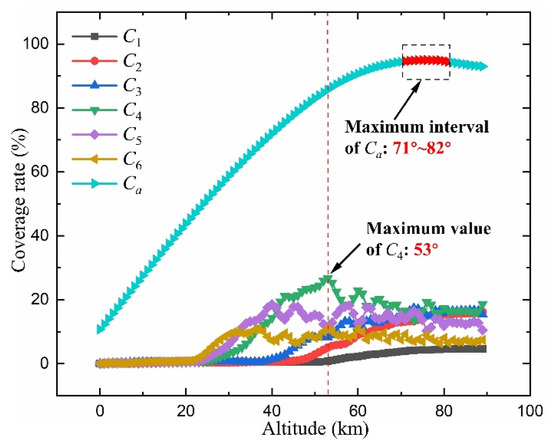
Figure 17.
Ci and Ca for Walker constellation with inclinations ranging from 0° to 90°.
It is evident that Ci (i = 1, 2, …, 6) exhibit sequential peaks, ascending in order from 6- to 1-fold, as inclination increases, as detailed in Table 7. C4 to C6 manifest a decline subsequent to reaching their peak, although all coverage rates eventually stabilize. This pattern of stabilization is attributable to the concentration of satellite coverage zones near the equatorial region at lower inclinations, resulting in a high-coverage belt. Initially, the lower Ci are zero, as indicated in Figure 18a. As inclination expands, the orbital planes disperse, converting zones of exceptionally high coverage into areas with reduced overlap. Concurrently, higher-latitude regions begin to receive coverage (Figure 18b). Consequently, the coverage rates associated with lower Ci values exhibit a sequentially increasing trend. However, upon reaching a critical inclination, orbital sparsity leads to the emergence of coverage gaps (Figure 18c), which in turn induces a decrease in coverage rates.

Table 7.
Maximum of Ci and Ca for Walker constellation.
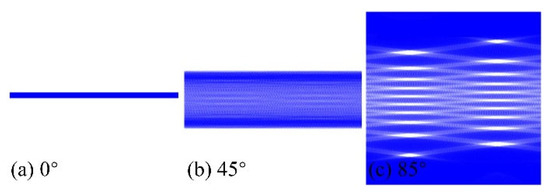
Figure 18.
Mercator coverage map at different inclination.
Remarkably, C4 peaks at an inclination of 53°, aligning with the first deployment phase of Starlink. Our analysis indicates that Starlink’s aggregate coverage Ca is suboptimal at this inclination; the maximal coverage is actually achieved between inclinations of 71° and 82°. This observation elucidates the rationale of Starlink’s partial inclination of 74°/70° deployed in the second phase.
5.2.3. Influence of Constellation Configuration on Earth Coverage
In this section, we scrutinize the coverage metrics of Walker constellations under diverse configuration settings. In a Walker constellation consisting of P orbital planes, each satellite shares the same inclination. The RAAN is uniformly distributed by , and the S satellites on each orbital plane are likewise uniformly positioned by . Walker constellations are typically characterized by a T/P/F parameter set, where denotes the total number of satellites, and F serves as a dimensionless factor describing the relative positions of satellites in varying orbital planes. F can adopt any integer value in the range .
Figure 19 illustrates variations in Ci (i = 1, 2, …, 6) and Ca for a constellation comprising 1584 satellites, assessed under diverse Walker constellation configurations (refer to Table 8). These satellites operate at an altitude of 550 km and maintain an inclination of 53° and a minimum elevation angle of 35° from the Earth’s surface.
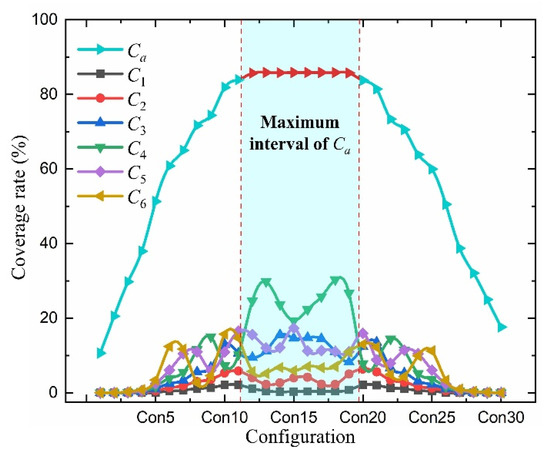
Figure 19.
Ci and Ca for 1584 satellites under different Walker constellation configurations.

Table 8.
Walker constellation configurations of 1584 satellites.
The data presented in Figure 19 indicates that, for a fixed total satellite count, both Ci and Ca metrics exhibit a certain symmetry as the number of orbital planes increases. For example, under identical altitude and inclination parameters, the coverage metrics for a Walker constellation of 72 orbital planes with 22 satellites each approximate that of a constellation with 22 orbital planes, each housing 72 satellites. The symmetry suggests that optimal coverage is achieved when the number of orbital planes is closely aligned with the number of satellites per orbital plane. For Ci, multiple peak values usually appear symmetrically under different configurations.
During the deployment phases of the Starlink project, several adjustments have been made to the initial constellation parameters. For example, the first deployment phase involving 1600 satellites has undergone two revisions, resulting in three distinct sets of constellation parameters (refer to Table 9). The second phase, involving 2824 satellites, has seen one adjustment, as depicted in Table 10. Based on our findings related to coverage variability as a function of configuration, SpaceX’s initial proposal was suboptimal, due to an excessively proximate number of orbital planes and satellites per plane, as illustrated in Figure 20. However, the second proposal, featuring 24 orbital planes and 66 satellites per plane, perfectly aligns with the peak for global 4-fold coverage, thus fulfilling Starlink’s objective of maximizing this metric. On the other hand, the third proposal, consisting of 72 orbital planes with 22 satellites each, experiences a slight dip in the 4-fold coverage rate but sees improvements in both 2-fold and 6-fold coverage rates. The larger number of orbital planes in this configuration affords a deployment advantage, expediting the realization of Starlink’s intended coverage capabilities.

Table 9.
Starlink parameters of 1600 satellites deployed in the first phase.

Table 10.
Changes in Starlink parameters of 2824 satellites in the second phase in April 2020.
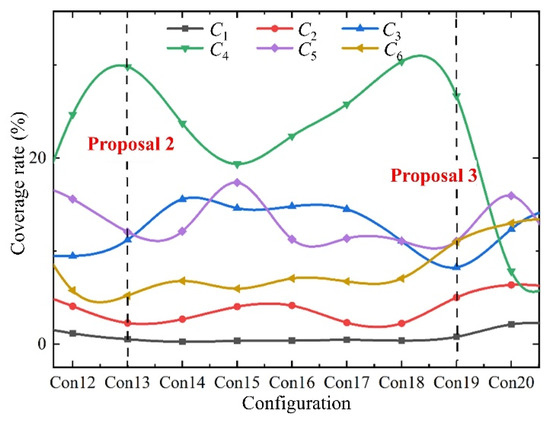
Figure 20.
Ci and Ca for 1584 satellites under Walker constellation configurations from Con 12 to Con 20 (Table 8).
5.2.4. Influence of Satellite Population Size on Earth Coverage
In this section, we investigate the fluctuations in the coverage on Earth of Ci and Ca of Walker constellations in response to varying total number of satellites T. It should be noted that alterations in T inherently induce variations in the feasible constellation configuration parameters. Specifically, for a given total of T satellites, the permissible number P of orbital planes can be any integer divisor of T. For the scope of the ensuing analyses, all satellites are assumed to operate at an altitude of 550 km, with an inclination of 53° and a minimum ground elevation angle of 35°.
Figure 21 shows the i-fold coverage rate Ci across a range of Walker constellations as T ascends from an initial count of 100 to an upper limit of 3200 satellites. Distinct colorations of the data points are employed to signify disparate constellation configurations. An examination of the trend line demarcating maximum Ci values in Figure 21 reveals a phenomenon: as T burgeons, the apex Ci across all configuration possibilities initially experiences an ascent to a peak, subsequently followed by a descent. Optimal coverage is notably attained at specific satellite counts approximating 500, 800, 1200, 1500, 2000, and 2500, as elaborated in Table 11. As the number T continues to swell, the scatter plot of Ci conspicuously unveils multiple stable evolutionary trends. It is noteworthy that constellations represented by points residing on an identical trend line either share an equivalent number of orbital planes or maintain a uniform number of satellites within each orbital plane.
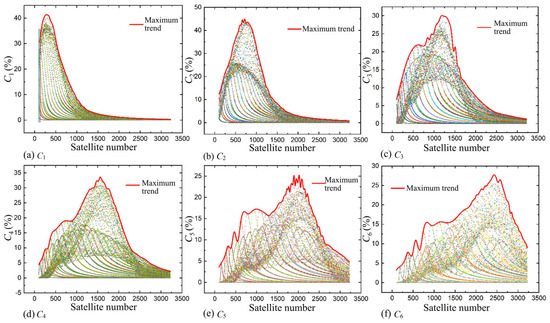
Figure 21.
Ci of all Walker constellations with different T ranging from 300 to 3000.

Table 11.
Total number of Satellites under the peak of Ci and Ca for Walker constellation.
Figure 22 delineates the corresponding Ca associated with various constellation configurations. Points with the same color are characterized by either an identical number of orbital planes or an equivalent count of satellites per orbital plane, as shown in Figure 22a and Figure 22b, respectively. Notably, the escalation in coverage performance does not exhibit a linear relationship with the incremental increase in the total satellite count of the constellation. This is predominantly due to the limited variety of available constellation configurations at certain satellite counts, which consequently hampers the optimization of coverage performance. When the total satellite count approaches approximately 800, the overall coverage rate plateaus, reaching its peak. This saturation point suggests the formation of inter-satellite bands, confirming that the constellation has attained at least a single-fold coverage across each orbital band.
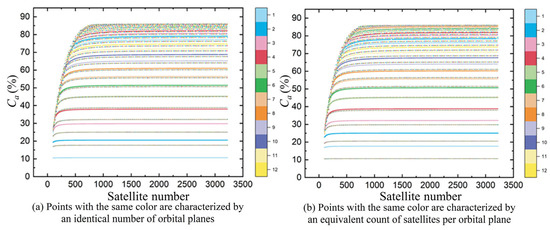
Figure 22.
Ca of all Walker constellations with different T ranging from 300 to 3000.
Moreover, in a Walker constellation consisting of T satellites, the Earth coverage rate for a configuration with P orbital planes, each containing S satellites, closely aligns with that of a configuration having S orbital planes, each with P satellites. Generally speaking, for a Walker constellation with T satellites, if the configuration parameter P is fewer than 5, the overall Earth coverage rate for a setup with P orbital planes falls short of the coverage rate achieved when arranging P satellites in each orbital plane. Conversely, when the parameter P exceeds 5, the Earth coverage rate for a constellation with P orbital planes surpasses that of a configuration that positions P satellites on each orbital plane. As the number of orbital planes increases, the Earth coverage rate for a constellation with P orbital planes progressively converges with that of a constellation that distributes P satellites across each orbital plane.
In conclusion, the design parameters for a LEO satellite constellation—including satellite altitude, orbital inclination, and the aggregate number of satellites—can be strategically chosen based on the criteria where both the Ci and Ca achieve their maximal values. Concurrently, constellation configurations that are optimal in terms of coverage attributes across a variety of settings can be selected, aligning closely with specific technical requisites. This encapsulates a comprehensive framework for the key considerations essential in the engineering of a LEO satellite constellation.
6. Conclusions
This paper presents an innovative coverage analysis methodology called the MPS approach. The method projects satellite constellation coverage from the celestial sphere onto a two-dimensional Mercator map while employing image distortion projection techniques. This transformation significantly enhances analytical efficiency for multi-coverage evaluations, particularly for LEO mega-constellations. We present a comprehensive algorithm for implementing the MPS approach, illustrated through both pseudocode and a detailed flowchart. Our analysis demonstrates that MPS achieves computational complexity of O(Ns), which represents a substantial improvement over the traditional Grid Point Analysis (GPA) method’s O(M·Ns) scaling, while maintaining error margins below 1.2%.
By comprehensive simulations, the method enables detailed scrutiny of instantaneous and periodic coverage rates. Based on the parameters of the Starlink constellation, this research delves into the nuanced interplay of the LEO Walker constellation’s coverage concerning variations in orbital altitude, inclination, configuration, and satellite quantity. The findings delineate an optimal nexus between constellation parameters and geometric coverage. Illustratively, a Walker constellation situated at a 550 km altitude with a 53° inclination and approximately 1600 satellites is optimized for both the 4-fold coverage rate and aggregate coverage when aligned with configurations of 1584/24/1 or 1584/72/1. This suggests that within a predetermined design orbit, alterations in constellation configurations have a symmetrical bearing on the variances in i-fold coverage, revealing multiple potential optima. Inversely, for a fixed constellation configuration, specific orbital altitudes and inclinations emerge as ideal for i-fold terrestrial coverage. For a designated orbit and a given count of orbital planes, the i-fold coverage rate manifests a singular peak as the satellite count ascends. Hence, during constellation design, satellite counts can be judiciously selected to resonate with coverage prerequisites aligned with these peak values. The insights are indispensable during the formative stages of designing mega-constellations. For future analyses, we propose extending the MPS framework to incorporate real-time atmospheric effects for enhanced accuracy and to adapt its methodology to non-LEO orbits such as very low Earth orbit (VLEO) to broaden its applicability.
Author Contributions
Conceptualization, W.L. and G.F.; methodology, L.L.; software, L.L.; validation, G.F. and L.L.; formal analysis, L.L.; investigation, L.L. and G.F.; resources, G.F.; data curation, L.L.; writing—original draft preparation, G.F.; writing—review and editing, G.F.; visualization, L.L.; supervision, W.L.; project administration, W.L.; funding acquisition, G.F. and W.L. All authors have read and agreed to the published version of the manuscript.
Funding
This work was supported by the Strategic Priority Research Program of the Chinese Academy of Sciences (Grant No. XDA0470103), the Key Scientific Research Program of the Chinese Academy of Sciences (Grant No. KGFZD-145-23-08), the Program (Grant No. 1816318TS00100501, 18JSLL0100000505), and the Joint Fund of the Chinese Academy of Sciences (Grant No. 8091A01).
Data Availability Statement
Dataset available on request from the authors.
Conflicts of Interest
The authors declare no conflict of interest.
References
- Ye, N.; Hou, C.; Ouyang, Q.; Kang, B.; Shin, H.; Mumtaz, S. Techno-economic assessment of LEO mega-constellation with multi-satellite collaboration. IEEE Commun. Mag. 2024, 62, 36–42. [Google Scholar] [CrossRef]
- Cao, X.; Li, N.; Qiu, S.; Li, C. Research on the method of searching and tracking of the time-sensitive target through the mega-constellation. Aerosp. Sci. Technol. 2023, 137, 108299. [Google Scholar] [CrossRef]
- Lu, Y.; Zhao, Y.; Sun, F.; Yang, F.; Liang, R.; Shen, J.; Zuo, Z. Enhancing transmission efficiency of mega-constellation LEO satellite networks. IEEE Trans. Veh. Technol. 2022, 71, 13210–13225. [Google Scholar] [CrossRef]
- Dicandia, F.A.; Fonseca, N.J.; Bacco, M.; Mugnaini, S.; Genovesi, S. Space-air-ground integrated 6G wireless communication networks: A review of antenna technologies and application scenarios. Sensors 2022, 22, 3136. [Google Scholar] [CrossRef] [PubMed]
- Lin, X.; Cioni, S.; Charbit, G.; Chuberre, N.; Hellsten, S.; Boutillon, J.-F. On the path to 6G: Embracing the next wave of low earth orbit satellite access. IEEE Commun. Mag. 2021, 59, 36–42. [Google Scholar] [CrossRef]
- Xu, Y.; Zhang, Y.; Fan, L. Autonomous semi-major axis adjustment for mega constellation continuous coverage. Adv. Space Res. 2024, 73, 5582–5594. [Google Scholar] [CrossRef]
- Huang, Y.; Shufan, W.; Zeyu, K.; Zhongcheng, M.U.; Huang, H.; Xiaofeng, W.U.; Cheng, X. Reinforcement learning based dynamic distributed routing scheme for mega LEO satellite networks. Chin. J. Aeronaut. 2023, 36, 284–291. [Google Scholar] [CrossRef]
- Sung, T.; Ahn, J. Optimal deployment of satellite megaconstellation. Acta Astronaut. 2023, 202, 653–669. [Google Scholar] [CrossRef]
- Lang, T.J.; Adams, W.S. A Comparison of Satellite Constellations for Continuous Global Coverage. In Mission Design & Implementation of Satellite Constellations, Proceedings of the an International Workshop, Toulouse, France, 19–21 November 1997; Springer: Berlin/Heidelberg, Germany, 1998; pp. 51–62. [Google Scholar]
- Lüders, R.; Ginsberg, L. Continuous Zonal Coverage-A Generalized Analysis. In Proceedings of the Mechanics and Control of Flight Conference, Anaheim, CA, USA, 5–9 August 1974; p. 842. [Google Scholar]
- Walker, J.G. Continuous Whole-Earth Coverage by Circular-Orbit Satellite Patterns; Ministry of Defence, Procurement Executive: London, UK, 1977. [Google Scholar]
- Rider, L. Optimized polar orbit constellations for redundant earth coverage. J. Astronaut. Sci. 1985, 33, 147–161. [Google Scholar]
- Ulybyshev, Y. Near-polar satellite constellations for continuous global coverage. J. Spacecr Rocket. 1999, 36, 92–99. [Google Scholar] [CrossRef]
- Zhong, Y.; Wu, X.Y.; Huang, S.C.; Li, C.J.; Wu, J.F. Approximate computing model for ground coverage region of infrared early warning satellites. Syst. Eng. Electron. 2014, 36, 2133–2137. [Google Scholar]
- Ulybyshev, Y. Satellite constellation design for complex coverage. J. Spacecr. Rocket. 2008, 45, 843–849. [Google Scholar] [CrossRef]
- Song, Z.; Hu, X.; Wang, M.; Dai, G. Judgement theorems and an approach for solving the constellation-to-ground coverage problem. Math. Probl. Eng. 2018, 2018, 1–10. [Google Scholar] [CrossRef]
- Morrison, J.J. A System of Sixteen Synchronous Satellites For Worldwide Navigation And Surveillance; United States Federal Aviation Administration: Washington, DC, USA, 1973.
- Ballard, A.H. Rosette constellations of earth satellites. IEEE Trans. Aerosp. Electron. Syst. 1980, AES-16, 656–673. [Google Scholar] [CrossRef]
- Rider, L. Analytic design of satellite constellations for zonal earth coverage using inclined circular orbits. J. Astronaut. Sci. 1986, 34, 31–64. [Google Scholar]
- Mortari, D.; De Sanctis, M.; Lucente, M. Design of flower constellations for telecommunication services. Proc. IEEE 2011, 99, 2008–2019. [Google Scholar] [CrossRef]
- Ulybyshev, Y. Geometric analysis and design method for discontinuous coverage satellite constellations. J. Guid. Control Dyn. 2014, 37, 549–557. [Google Scholar] [CrossRef]
- Ulybyshev, Y. General analysis method for discontinuous coverage satellite constellations. J. Guid. Control Dyn. 2015, 38, 2475–2483. [Google Scholar] [CrossRef]
- Wang, M.; Luo, X.; Dai, G.; Chen, X. Application of latitude stripe division in satellite constellation coverage to ground. Int. J. Aerosp. Eng. 2016, 2016, 1–10. [Google Scholar] [CrossRef]
- Song, Z.; Dai, G.; Wang, M.; Chen, X. A novel grid point approach for efficiently solving the constellation-to-ground regional coverage problem. IEEE Access 2018, 6, 44445–44458. [Google Scholar] [CrossRef]
- Okati, N.; Riihonen, T.; Korpi, D.; Angervuori, I.; Wichman, R. Downlink coverage and rate analysis of low earth orbit satellite constellations using stochastic geometry. IEEE Trans. Commun. 2020, 68, 5120–5134. [Google Scholar] [CrossRef]
- Lv, L.; Xiao, X.; Feng, G.; Li, W. Efficient algorithm for calculating coverage of mega-constellation. Acta Aeronaut. Astronaut. Sin. 2022, 43, 325173. (In Chinese) [Google Scholar]
- Dai, G.; Song, Z.; Wang, M.; Chen, X.; Peng, L. Theory of Earth Coverage of Satellite Constellations; Science Press: Beijing, China, 2021. [Google Scholar]
- Vis, M. History of the Mercator Projection. Bachelor’s Thesis, Central Michigan University, Mount Pleasant, MI, USA, 2018. [Google Scholar]
- Tao, J. Platforms of Optical Remote Sensing. In Space Optical Remote Sensing: Fundamentals and System Design; Li, J., Ed.; Springer: Singapore, 2023; pp. 351–389. [Google Scholar]
- Sidi, M.J. Spacecraft Dynamics and Control: A Practical Engineering Approach, 1st ed.; Cambridge University Press: Cambridge, UK, 1997. [Google Scholar]
- Zhou, Z.Y.; Guo, G.L.; Jia, X.G. A review on solution of geodetic problem. Sci. Surv. Mapp. 2007, 32, 190–192. (In Chinese) [Google Scholar]
Disclaimer/Publisher’s Note: The statements, opinions and data contained in all publications are solely those of the individual author(s) and contributor(s) and not of MDPI and/or the editor(s). MDPI and/or the editor(s) disclaim responsibility for any injury to people or property resulting from any ideas, methods, instructions or products referred to in the content. |
© 2025 by the authors. Licensee MDPI, Basel, Switzerland. This article is an open access article distributed under the terms and conditions of the Creative Commons Attribution (CC BY) license (https://creativecommons.org/licenses/by/4.0/).