Article

Energy-Efficient Coaxial Electrocoagulation for Integrated Treatment of Urban Wastewater and Acid Mine Drainage: A Response-Surface Approach

by
Katherin Quispe-Ramos
1,
Edilberto Melgar-Izaguirre
1,
José Rivera-Rodríguez
1,
César Gutiérrez-Cuba
2,
Luis Carrasco-Venegas
2,
Cesar Rodriguez-Aburto
3,
Yone Ramos-Balcázar
4 and
Alex Pilco-Nuñez
4,*
1
Faculty of Environmental Engineering and Natural Resources, Universidad Nacional Del Callao, Callao 07011, Peru
2
Centro De Investigación En Bioenergía, Universidad Nacional Del Callao, Callao 07001, Peru
3
Faculty of Electrical and Electronic Engineering, Universidad Nacional Del Callao, Callao 07011, Peru
4
Faculty of Chemical and Textile Engineering, Universidad Nacional De Ingeniería, Túpac Amaru 210 Avenue, Lima 15333, Peru
*
Author to whom correspondence should be addressed.
Appl. Sci. 2025, 15(19), 10452; https://doi.org/10.3390/app151910452
Submission received: 4 August 2025 / Revised: 5 September 2025 / Accepted: 16 September 2025 / Published: 26 September 2025
(This article belongs to the Special Issue Environmental Pollution and Wastewater Treatment Strategies)

Abstract

This study determined the influence of experimental factors such as current density, surface-to-volume ratio (S/V), and contact time on the removal of Chemical Oxygen Demand (COD) and energy consumption during electrocoagulation, aiming to optimize the efficiency of a coaxial electrocoagulator for the co-treatment of municipal wastewater and acid mine drainage. After identifying the optimal volumetric ratio between both types of effluents, a Box–Behnken design and response-surface methodology were employed to identify the conditions that maximize COD removal while minimizing energy consumption. Under optimal conditions (current density of 2.42 A·m−2, S/V = 300 m2·m−3, 60 min), a COD removal of 91.13% was achieved with a specific energy of =2.59 kWh·kgCOD−1. The statistical model for COD removal demonstrated a good fit (R2 = 0.87), though its predictive power was limited (predicted R2 = 0.53). In contrast, the model for energy consumption exhibited an outstanding fit (R2 = 0.99) and high predictive consistency (predicted R2 = 0.98), confirming the decisive influence of current density on energy demand. Additionally, the S/V ratio emerged as the most impactful factor in COD removal variability. Overall, the findings highlight the importance of balancing removal efficiency with the economic feasibility of the process, contributing to the design of more sustainable and effective strategies for integrated wastewater treatment.

1. Introduction

Acid mine drainage (AMD) is one of the most significant environmental issues resulting from mining activities. This drainage threatens surrounding aquatic ecosystems and infrastructure. AMD arises from the oxidation of sulfide minerals in the presence of water, oxygen, and bacteria [1]. It is characterized by very low pH (1.5–3.5) and high concentrations of toxic ions, which cause severe impacts when contacting surface waters, groundwater, or soils [2]; in addition, elevated sulfate levels promote corrosion of steel and concrete [3].
A wide range of AMD treatment methods has been investigated, including ion exchange [4], adsorption with high-molecular-weight compounds [5], adsorption with natural minerals [6], adsorption with nanomaterials [7], nanofiltration [8], reverse osmosis [9], forward osmosis [10], electrodialysis [11], constructed wetlands [12], bioremediation [13], and electrocoagulation [14]. In parallel, municipal wastewater (MWW) remains a critical environmental challenge: conventional treatment relies on combinations of physical, chemical, and biological processes—commonly centralized biological treatment with chemical coagulation [15]—to address high Chemical Oxygen Demand (COD), phosphate (PO43−), ammonia (NH3), metals, and microbiological contaminants [16].
In the last decade, the co-treatment of AMD and MWW has attracted growing interest as a way to exploit compositional complementarities between streams. Studies have explored microbial fuel cells [17], and co-treatment with activated sludge as a substitute for AMD reagents [18], passive co-treatment of Zn-rich acid waters and raw MWW [19], and anaerobic options [20]; overall activity on AMD–domestic wastewater co-treatment has increased in recent years [21]. Specific investigations report, for example, that a 1:3 volumetric ratio (AMD–MWW) achieved simultaneous removal of Fe, PO4, and COD [22], that mixing AMD and MWW can efficiently remove phosphate [23], and that the iron salts intrinsic to AMD (FeSO4 and Fe2(SO4)3) act as effective coagulants, outperforming conventional FeSO4 across pH 5–9 for total phosphorus removal [24]. Nevertheless, co-treatment effluents often retain problematic constituents—sulfates, residual iron and phosphorus, and low pH—requiring polishing steps before discharge [25].
Electrocoagulation (EC) is a promising polishing technology in which cationic metal flocculants are generated by anodic dissolution; these species promote contaminant separation via coagulation, flotation, reduction, and oxidative decomposition [26,27]. During EC, Fe2+/Al3+ undergo hydrolysis to monomeric, polymeric, and particulate (oxy)hydroxides with high adsorption capacity, enabling the removal of suspended solids, heavy metals, and dissolved organics [28]. EC is often efficient and cost-effective due to low sludge production and rapid operation, though its performance can be constrained by electrode passivation, parasitic reactions, and high energy consumption under certain conditions [29].
A coaxial cylindrical electrolyzer can mitigate several limitations of planar EC reactors. In a coaxial geometry, the enlarged active area and improved mass transport may allow higher usable current densities and more uniform charge distribution [30]. Coaxial electrodes have demonstrated versatility across electrochemical applications—energy storage [31], biofuel cells [32], contaminant removal [33], graphite electrosynthesis [34], microbial electrolysis cells coupled to anaerobic digestion [35], and biohydrogen production [36]—with the simplest implementation based on two concentric cylinders [37]. At the laboratory scale, EC performance depends on electrode material/arrangement [38], initial pH [39], current density [40], and contact time [41]. Yet, despite decades of work, reactor advancement still frequently relies on trial-and-error engineering, especially when extrapolating from small batch systems to continuous reactors [42].
For AMD–MWW co-treatment, three shortcomings persist in the literature: (i) most co-treatment studies are passive or biological and do not provide a dedicated, energy-aware polishing step to address the residual sulfate/iron/phosphorus and acidity documented after mixing; (ii) the coaxial EC configuration, while promising for mass transfer and ohmic advantages, has not been systematically evaluated for AMD–MWW matrices with explicit control of current density (J), anode surface-to-volume ratio (S/V), and electrolysis (contact) time; and (iii) EC optimization studies often emphasize %COD only, report energy per volume rather than per unit COD removed, or vary factors one-at-a-time instead of applying response-surface methodology (RSM) with multi-objective criteria—issues that hinder energy-efficient scaling.
This work addresses these gaps by studying an upflow EC reactor with coaxial electrodes as a polishing step for AMD–MWW co-treatment, and by jointly optimizing removal and energy use. Specifically, we (i) develop RSM models to quantify the main and interaction effects of J (1–3 A·m−2), S/V (180–300 m2·m−3), and electrolysis time (60–90 min) on COD removal (%) and specific energy consumption per unit COD removed (kWh·kgCOD−1); and (ii) apply a desirability-based multi-response optimization to maximize COD removal while minimizing energy demand.
We hypothesize that process performance in a coaxial electrocoagulation (EC) reactor for AMD–MWW co-treatment is governed by a balance between current density, anode surface-to-volume ratio (S/V), and electrolysis time. From Faraday’s law, energy demand per unit COD removed is expected to be primarily driven by current density, because higher currents increase both faradaic dissolution and electrical requirements. In turn, COD removal should benefit from larger S/V due to enhanced coagulant generation and mass transfer, with plausible synergy between current density and S/V as greater production of iron species coincides with more available active area. Electrolysis time is anticipated to display a non-linear effect, reflecting floc formation, growth, and separation kinetics: there should be a practical time window that maximizes removal without incurring unnecessary energy use or promoting re-dissolution/destabilization. Within a feasible operating envelope, the coaxial geometry—by distributing current more uniformly and reducing ohmic limitations—should enable high removals at practical energy levels suitable for polishing. These propositions are tested with response-surface methodology, quantifying main effects and interactions and using multi-response desirability to locate compromise conditions that maximize COD removal while minimizing energy (kWh·kgCOD−1). By articulating the gap and framing measurable, testable objectives, this study contributes an energy-conscious optimization of a coaxial EC reactor for integrated AMD–MWW treatment, helping bridge the scale-up divide between bench-scale demonstrations and deployable continuous systems [38,39,40,41,42].

2. Materials and Methods

2.1. Sampling of MWW and AMD

MWW was collected from the Valle Las Higueras Wastewater Treatment Plant (WWTP), located in the district of Pachacamac, province of Lima, which receives domestic wastewater. Figure 1 shows the location map of the WWTP, with coordinates 293,344 E and 8,647,030 S. The WWTP comprises a collection system, grit chamber, equalization tank, aerobic reactor, and a chlorination disinfection unit. The sample was collected at the outlet of the equalization tank.
The collection of AMD was carried out at Quiulacocha Lagoon, located in Pasco, Peru. This lagoon is contaminated with AMD. Figure 2 presents a panoramic view of Quiulacocha Lagoon, with coordinates 359,530.00 E and 8,816,864.00 S, along with a top-down view of the site.

2.2. Characterization of Municipal Wastewater and Acid Water

MWW (Table 1) samples were collected at the outlet of the equalization tank of the Valle Las Higueras WWTP (Pachacámac, Lima, Peru), and AMD samples were collected from Quiulacocha Lagoon (Pasco, Peru) as described in Section 2.1 [43]. Samples were taken in acid-washed polyethylene bottles, preserved and transported at 4 ± 2 °C, and analyzed within 24 h of collection. Field measurements included pH and conductivity. Laboratory analyses followed Standard Methods for the Examination of Water and Wastewater (APHA/AWWA/WEF) unless stated otherwise, specifically, COD by closed-reflux dichromate method (5220B), BOD5 (5210B), turbidity by nephelometry (2130B), conductivity (2510B), sulfates (4500-SO42− E), total phosphorus (4500-P E). Dissolved metals (Sb, As, Ba, Cd, Cr, Fe, Ni, Pb, Se, Tl, Zn) (Table 2) were quantified by ICP-OES/ICP-MS (SM 3120B/3125; instrument and model specified in SI), after filtration (0.45 µm) and preservation with HNO3 to pH < 2.
The composition of AMD can vary substantially across sites and seasons (pH, dissolved metals, sulfate, and conductivity). In this study, the AMD originated from Quiulacocha Lagoon and the MWW from Valle Las Higueras WWTP (Table 1 and Table 2). Importantly, the stream feeding the electrocoagulation (EC) unit is the clarified supernatant from the upstream mixing–settling step), i.e., low-turbidity/low-solids liquor that still contains sulfate, residual iron, and trace constituents. Prior co-treatment work at the same AMD source documented a highly acidic matrix with high Fe and sulfate, and identified Fe–P stoichiometry and rapid mixing as key levers to buffer feed variability before polishing steps. This historical envelope supports the design space used here and constrains the applicability domain of our EC models.

2.3. Design of Coaxial Electrode

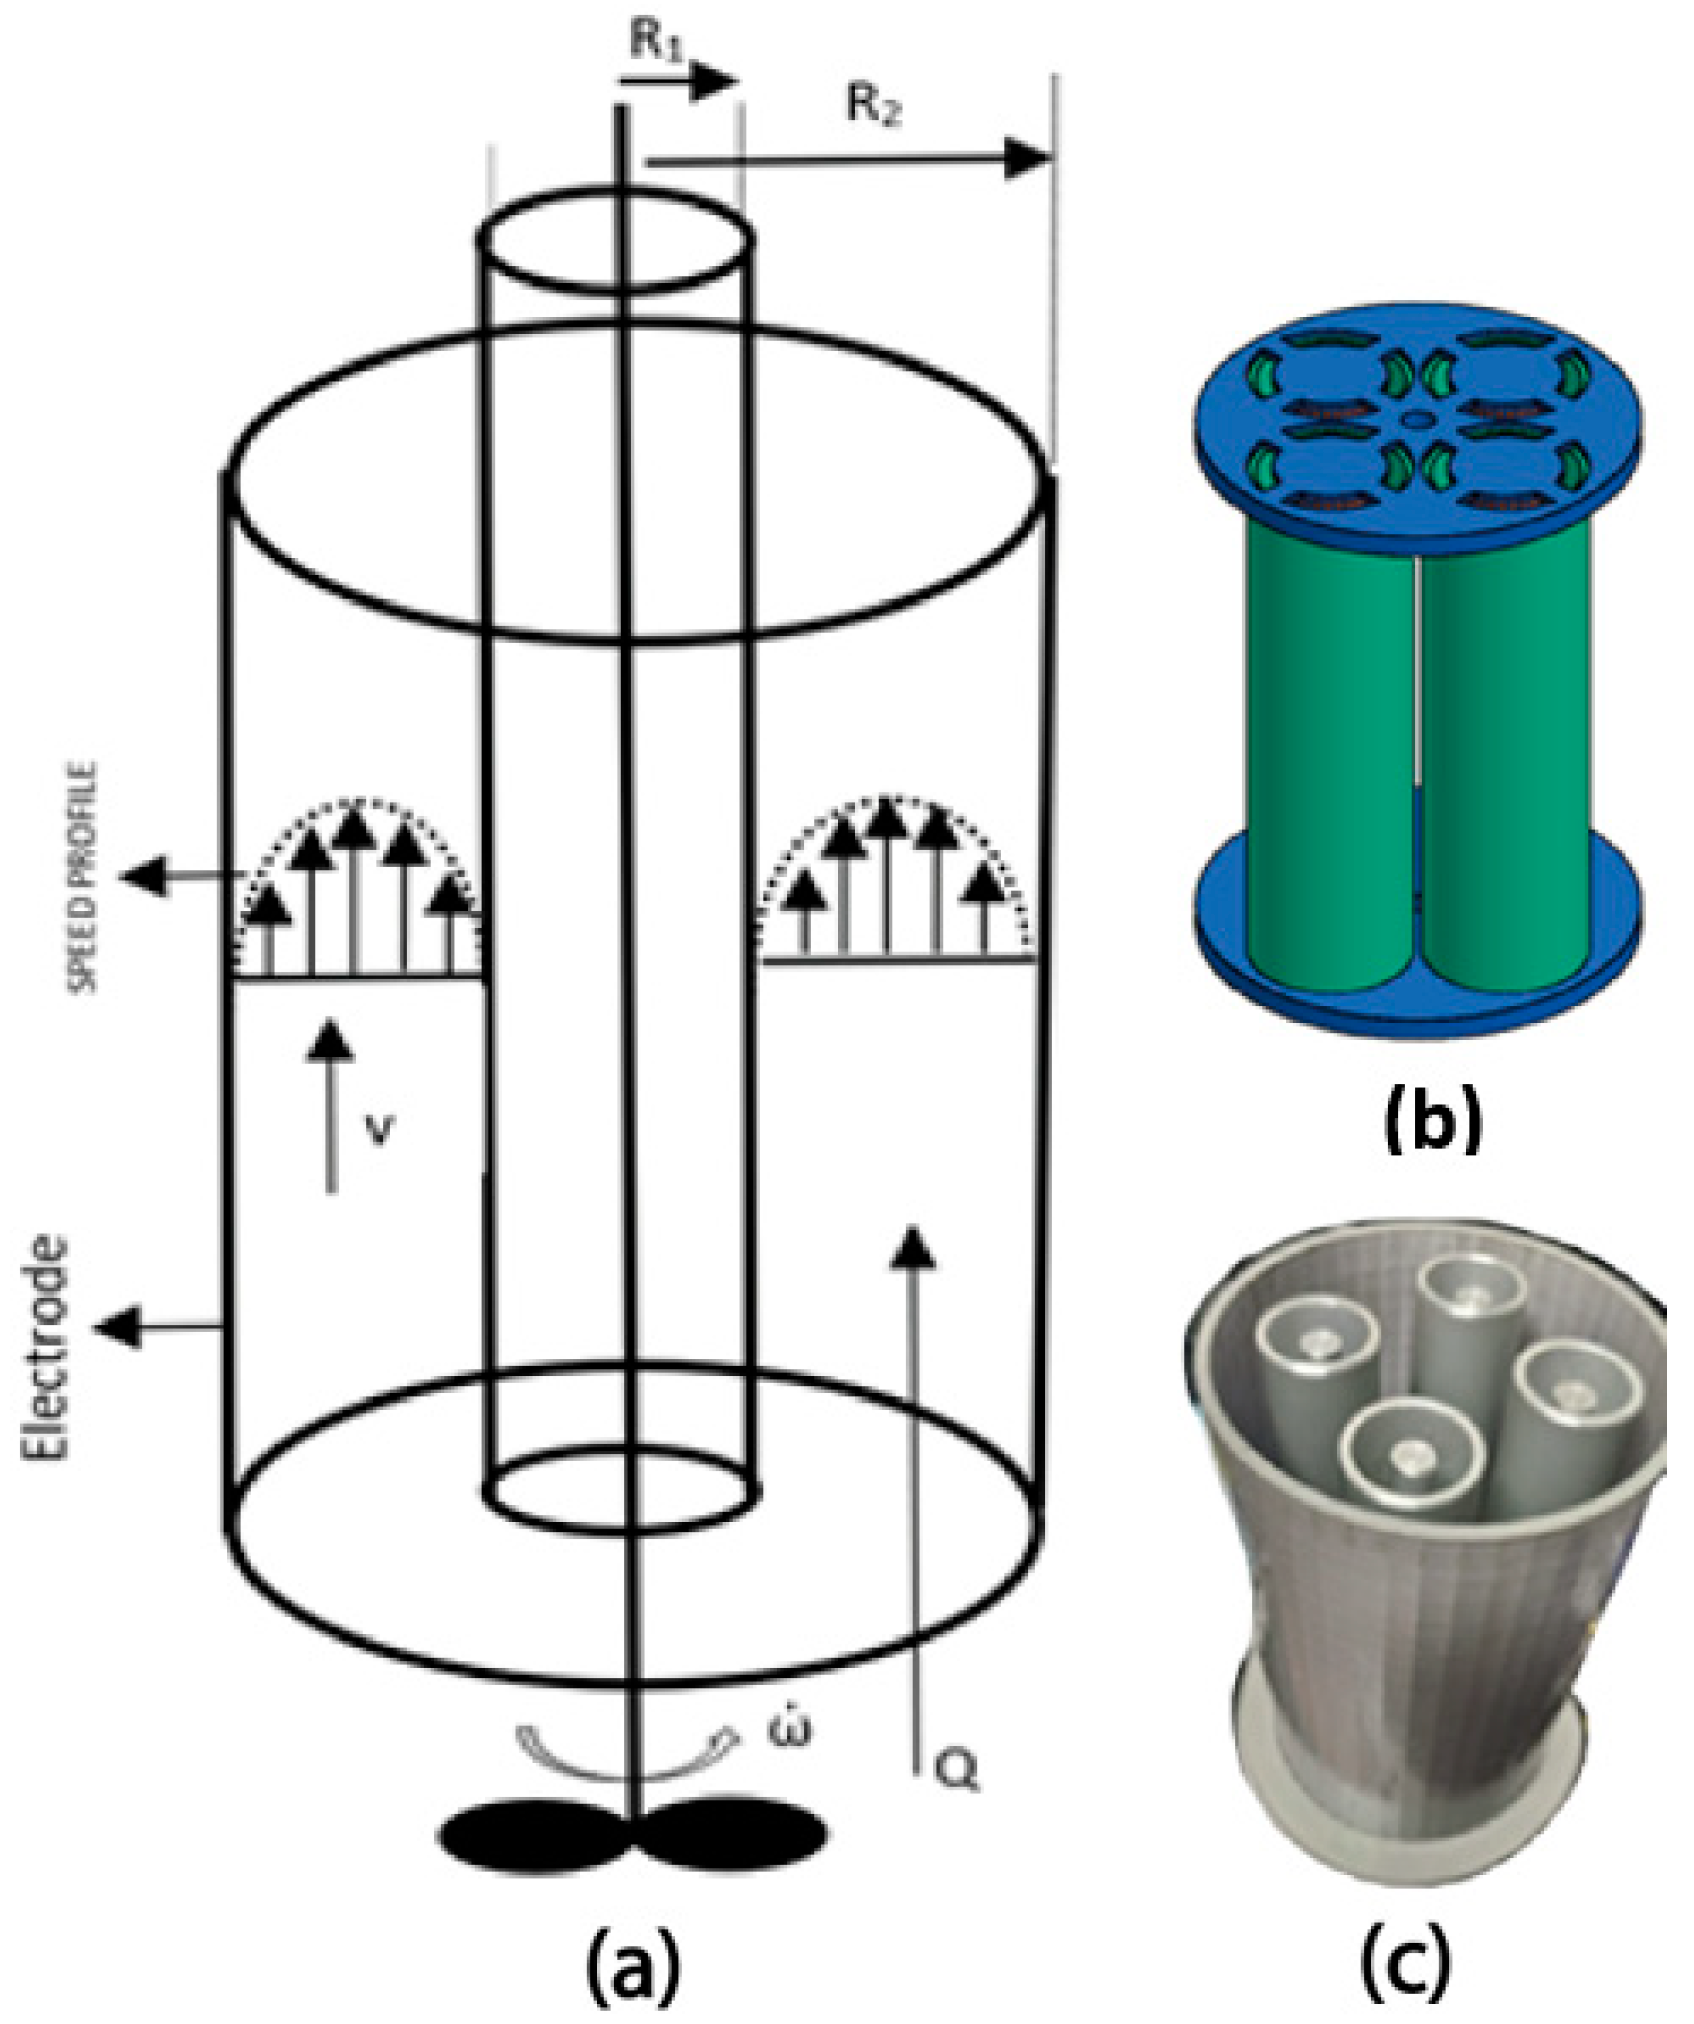
The design of the electrodes follows these criteria: (1) wastewater with a flow rate (Q) enters the space between two concentric cylinders with radii R1 and R2, resulting in a velocity profile ( v ) (Figure 3a); (2) both cylinders remain stationary (no rotation), and fluid agitation ( ω ˙ ) is achieved by means of a butterfly-type stirrer, which induces impeller-driven recirculations in the annulus; Couette–Taylor vortices are not expected because both cylinders are stationary [44]; (3) the axial flow design interacts with the rotational flow, integrating the combined effects of rotation and axial flow on the characteristics of the system; and (4) the electrocoagulator included four internal cathodes (cylindrical rods) and four external anodes (hollow cylinders) (Figure 3b,c), with a separator between each internal cathode and the dual anode.
This design maximized the surface area of the cathode to enhance contaminant removal while maintaining a compact form. The coaxial assembly employed aluminum electrodes (commercial purity): hollow external anodes and solid internal cathodes, each with a wetted height of 200 mm and 5 mm wall thickness (Figure 3). Both cylinders remained stationary (no rotation), and the reactor operated in upflow without external recirculation. The electrode material and the coaxial layout were selected to balance electrochemical performance, durability in acidic and high-ionic-strength matrices, availability/cost, and compactness.
The coaxial arrangement increases the effective surface-to-volume ratio and shortens ionic paths, improving current distribution, mass transport, and gas disengagement, which are central to electro-generated (oxy)hydroxide floc formation and stable polishing operation. These criteria are consistent with the reactor design considerations and the role of in situ coagulants discussed in the background of this work.

2.4. Coaxial Electrocoagulation Reactor

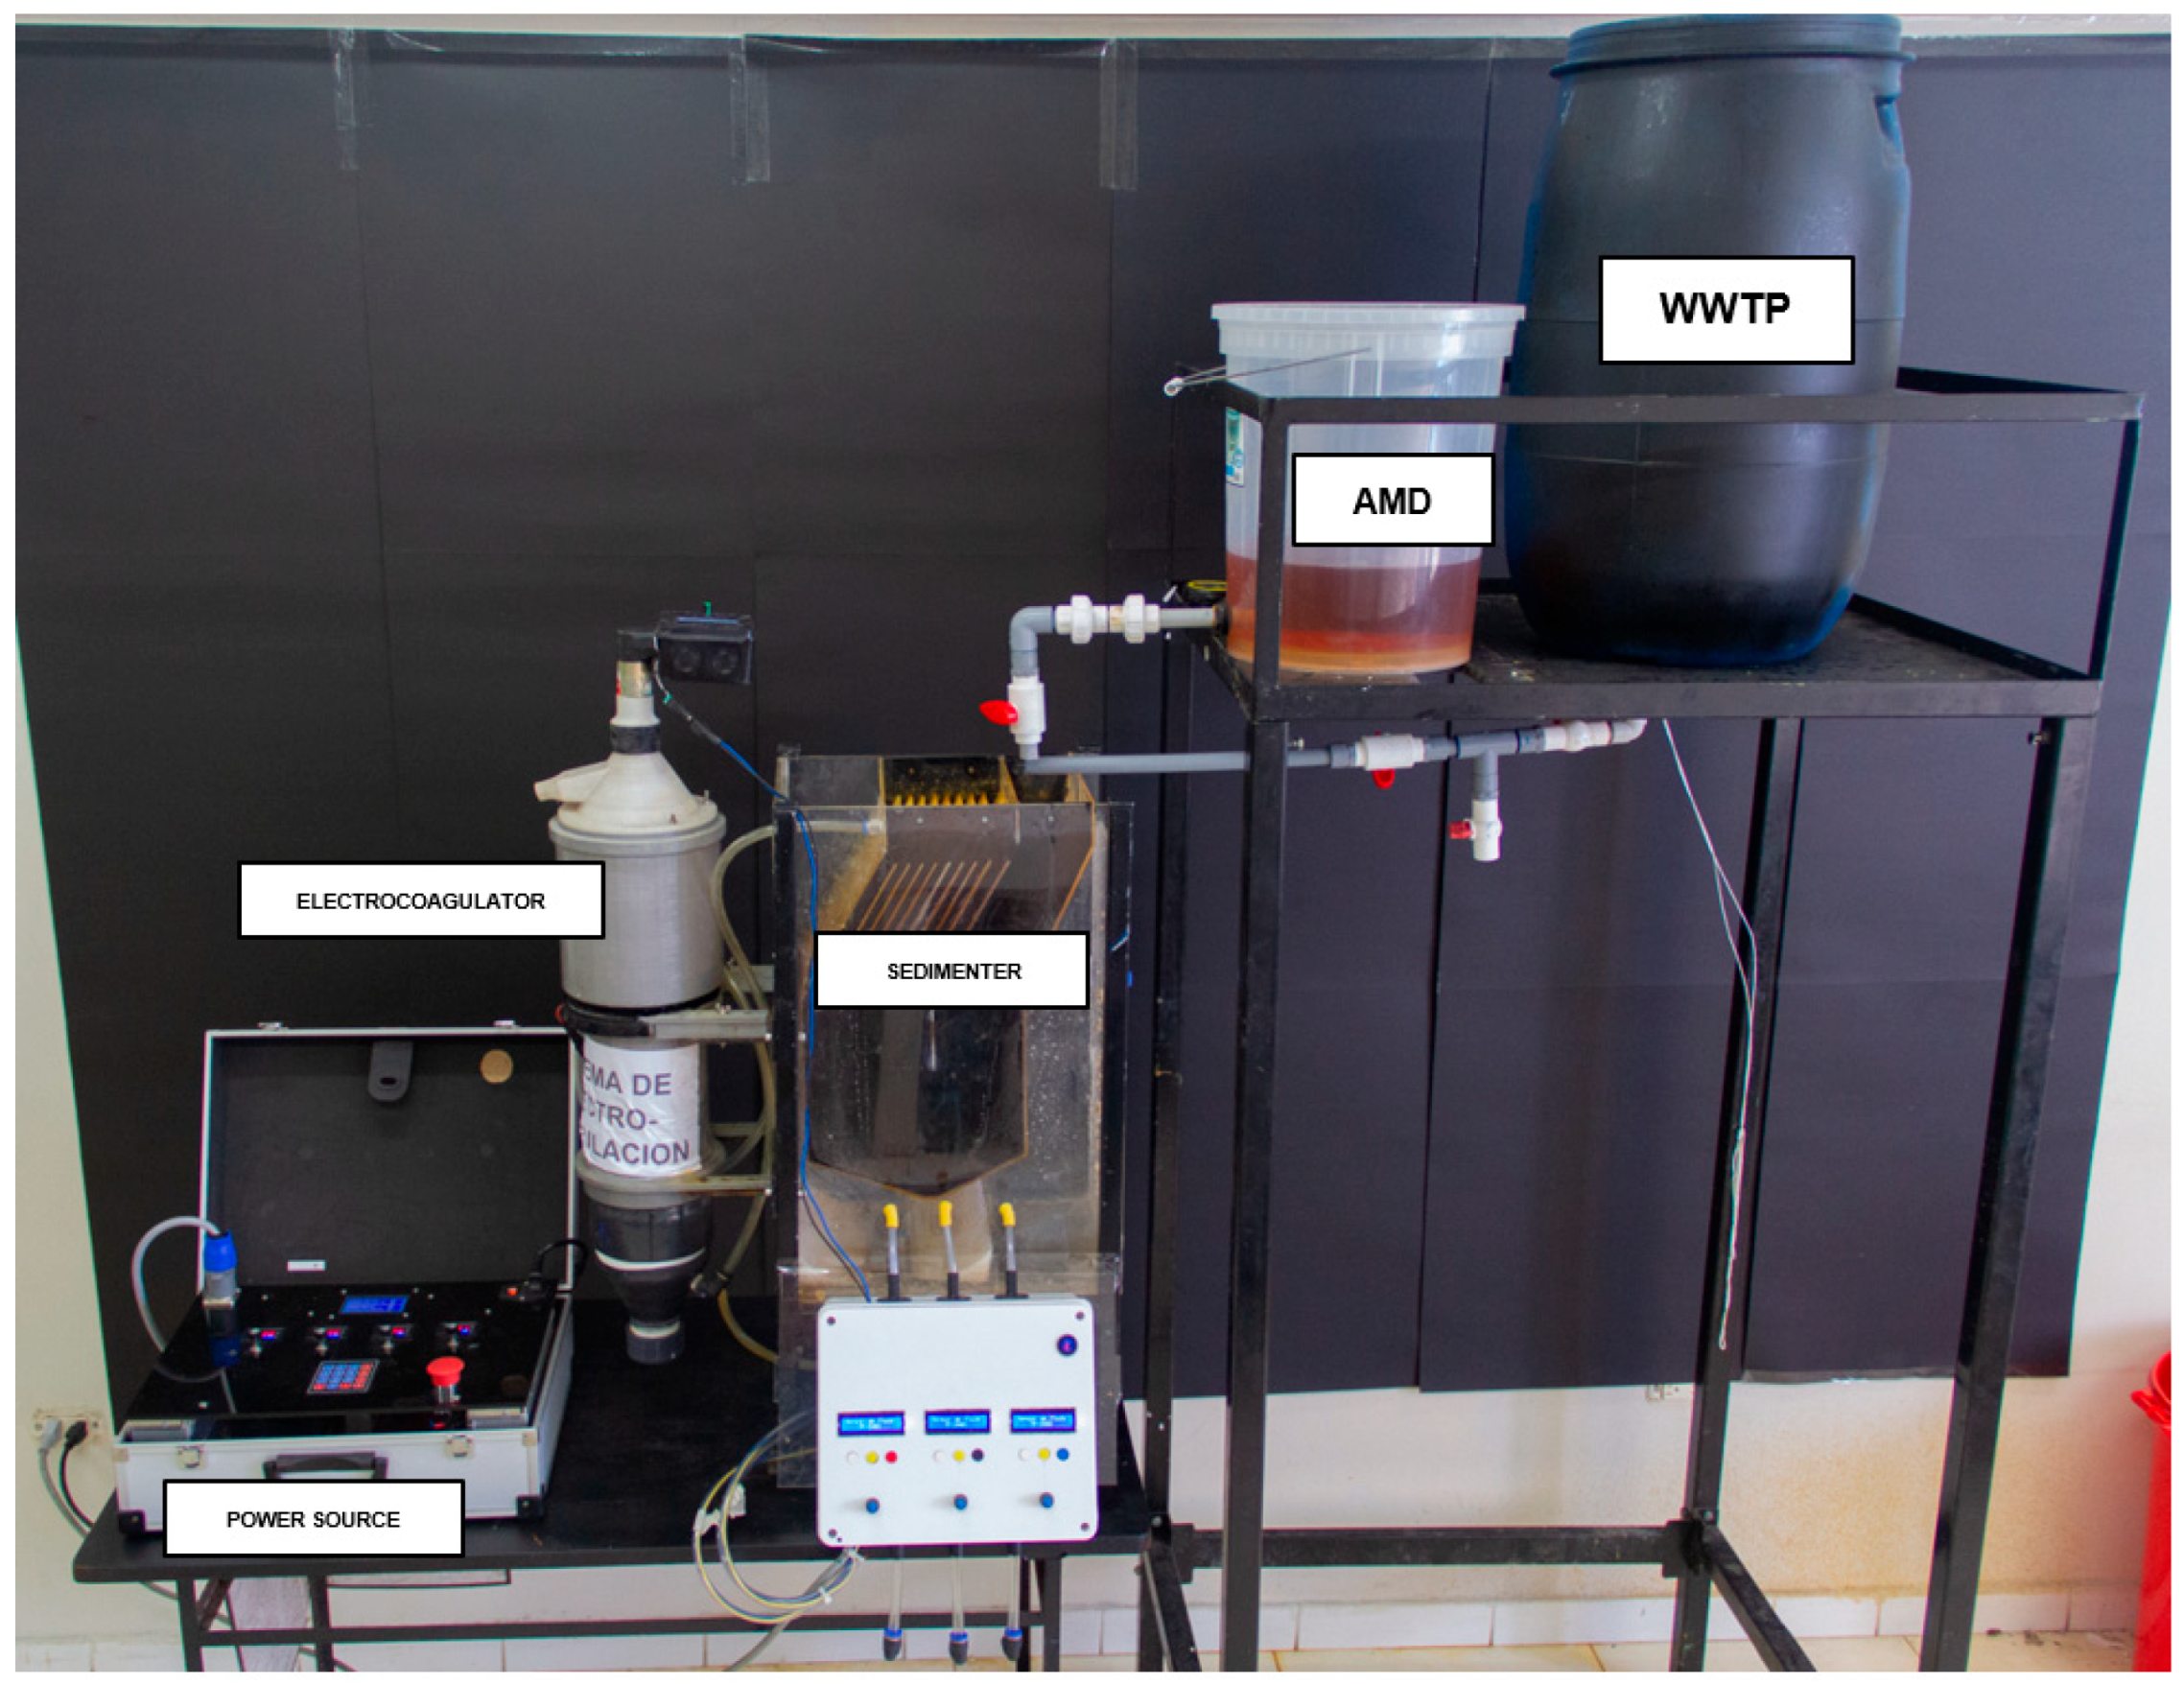
As shown in Figure 4, the electrocoagulation system consists of two containers holding WWTP effluent and AMD. Both wastewater streams are mixed in a specific ratio upon entering the settling unit, where a reaction occurs between iron and phosphorus compounds [21], forming a new compound with flocculant properties [45], which then precipitates. This process removes the majority of contaminants [46].
The effluent generated from the sedimentation process enters the electrocoagulation system, where the flow enters from the bottom of the electrocoagulator in a continuous manner. The electrocoagulator features a butterfly-type agitator at the bottom, which enables axial agitation of the incoming flow. After a contact time and exposure to a specific current density, the electrocoagulation system is turned off and left undisturbed for five minutes to allow phase separation between the clarified liquid and the compounds formed during redox reactions. The system is then restarted, repeating this process three times per treatment before collecting a sample of the clarified effluent.

2.4.1. Electrode Maintenance and Cleaning

No online regeneration (e.g., polarity reversal, pulsed-DC) was applied; the reactor was run at constant DC during the on/off cycles described in Section 2.4, and no external recirculation was used. Electrodes were inspected between experimental days. If the cell voltage at constant current increased by >10–15% or if visible deposits accumulated, we performed an offline cleaning: (i) drain and rinse; (ii) light mechanical brushing to remove loose Al(OH)3; (iii) short mild-acid wash with 2–5% citric acid for 2–3 min to clear oxide/hydroxide films (preferred for Al to minimize chloride-induced pitting); and (iv) thorough rinse to neutral pH and resume operation. This condition-based protocol mitigates passivation without altering the chemistry during runs; waveform-based mitigation strategies are identified as future work [27].

2.4.2. Pre-EC Clarification and Feed Quality

As schematized in Figure 4, the two waste streams are first dosed and mixed in the settling unit, where iron–phosphate co-precipitation and metal (oxy)hydroxide formation occur; the resulting sludge is primarily Fe- and P-rich, as reported in our previous co-treatment study [45]. The clarified supernatant from this unit—low in suspended solids and turbidity but still containing sulfate, residual iron, and trace elements—is what feeds the coaxial EC, which thus operates as a polishing step rather than a primary solids-forming stage.

2.4.3. EC Operation

During EC operation we monitored settleable solids and visual scum/foam at the reactor outlet and after the 5 min quiescent period. No measurable EC sludge (i.e., no separate solids withdrawal from the EC unit) was required across the runs; the only observable by-product was a thin, transient foam layer caused by cathodic/anodic gas evolution (H2/O2). Because the EC feed is the clarified supernatant of the upstream mixing–sedimentation step, the residual sulfate remains in the aqueous phase and enriches the liquid lamellae of the foam rather than forming solids. Foam was skimmed and returned to the equalization/settling unit; the only solids stream in the train is the Fe–P sludge purged from the settling unit and handled per site regulations.
In the present work, the coaxial EC unit operated as a polishing step downstream of the mixing–settling stage (Figure 4), which already removes the bulk of suspended solids and Fe–P particulates as sludge. Accordingly, the EC stage was monitored for COD removal and specific energy consumption as the main performance indicators of this polishing step. Dissolved metals and sulfate compliance at the EC outlet were not quantified in this study, and the post-EC effluent was not discharged but collected for analysis. This framing is consistent with prior co-treatment results at the same site, where post-treatments were still required to comply with certain regulations or enable reuse. The EC unit was operated in intermittent on/off cycles: after energization at a set current density and contact time, the power was switched off and the reactor was left quiescent for 5 min to allow phase separation; this cycle was repeated three times prior to sampling the clarified supernatant.
This operating mode is typical of polishing EC systems and supports floc consolidation without continuous power input. All electrocoagulation runs were performed at near-ambient laboratory conditions and at atmospheric pressure; temperature was not monitored or controlled. This choice reflects the intended polishing role of the EC unit downstream of mixing–settling, and mirrors the practical operation of compact EC modules that are typically run without thermal management.
No chemical reagents were dosed in the EC unit. The process train first combines the two streams in a mixing–settling step, where Fe–P precipitation/co-precipitation occurs and most suspended solids are removed; the EC therefore treats the clarified supernatant as a polishing stage. This strategy minimizes the chemical footprint and follows our prior co-treatment work at the same source, where upstream Fe–P interactions supply coagulant species to the train. Runs were conducted under near-ambient, atmospheric conditions; temperature was neither monitored nor controlled and lay outside the scope of this study.
Figure 4. Electrocoagulation system.
Applsci 15 10452 g004

2.5. Experimental Procedure

2.5.1. Preliminary Experiments for the Volumetric Ratio of AMD and MWW

To obtain the volumetric ratio (AMD–MWW) between the wastewater streams, preliminary co-treatment tests were conducted using a Jar Test. The Jar Test equipment was provided by the Chemical Analysis Laboratory of the Faculty of Environmental Engineering and Natural Resources at the National University of Callao. Experiments were conducted with different dosages, ranging from a 1:1 to a 1:10 volumetric ratio (AMD–WWTP), respectively. The tests were performed in 1 L beakers, with agitation set at 200 rpm for 10 min. After agitation, the samples were left to settle, and the clarified supernatant was collected from the top of the beaker for COD analysis.
The selected AMD–MWW volumetric ratio was guided by the Fe–P stoichiometric window highlighted in our previous co-treatment optimization, which mitigates upstream variability and delivers a clarified supernatant of consistent quality to the EC stage. The AMD–MWW volumetric ratio was fixed based on Jar-Test screening to reach a Fe–P stoichiometric window previously identified for the same AMD source using response-surface optimization. This upstream setting stabilizes pH and residual Fe and delivers a low-turbidity clarified supernatant to the EC stage, improving the representativeness of the polishing experiments.

2.5.2. Operation of the Coaxial Electrocoagulation System

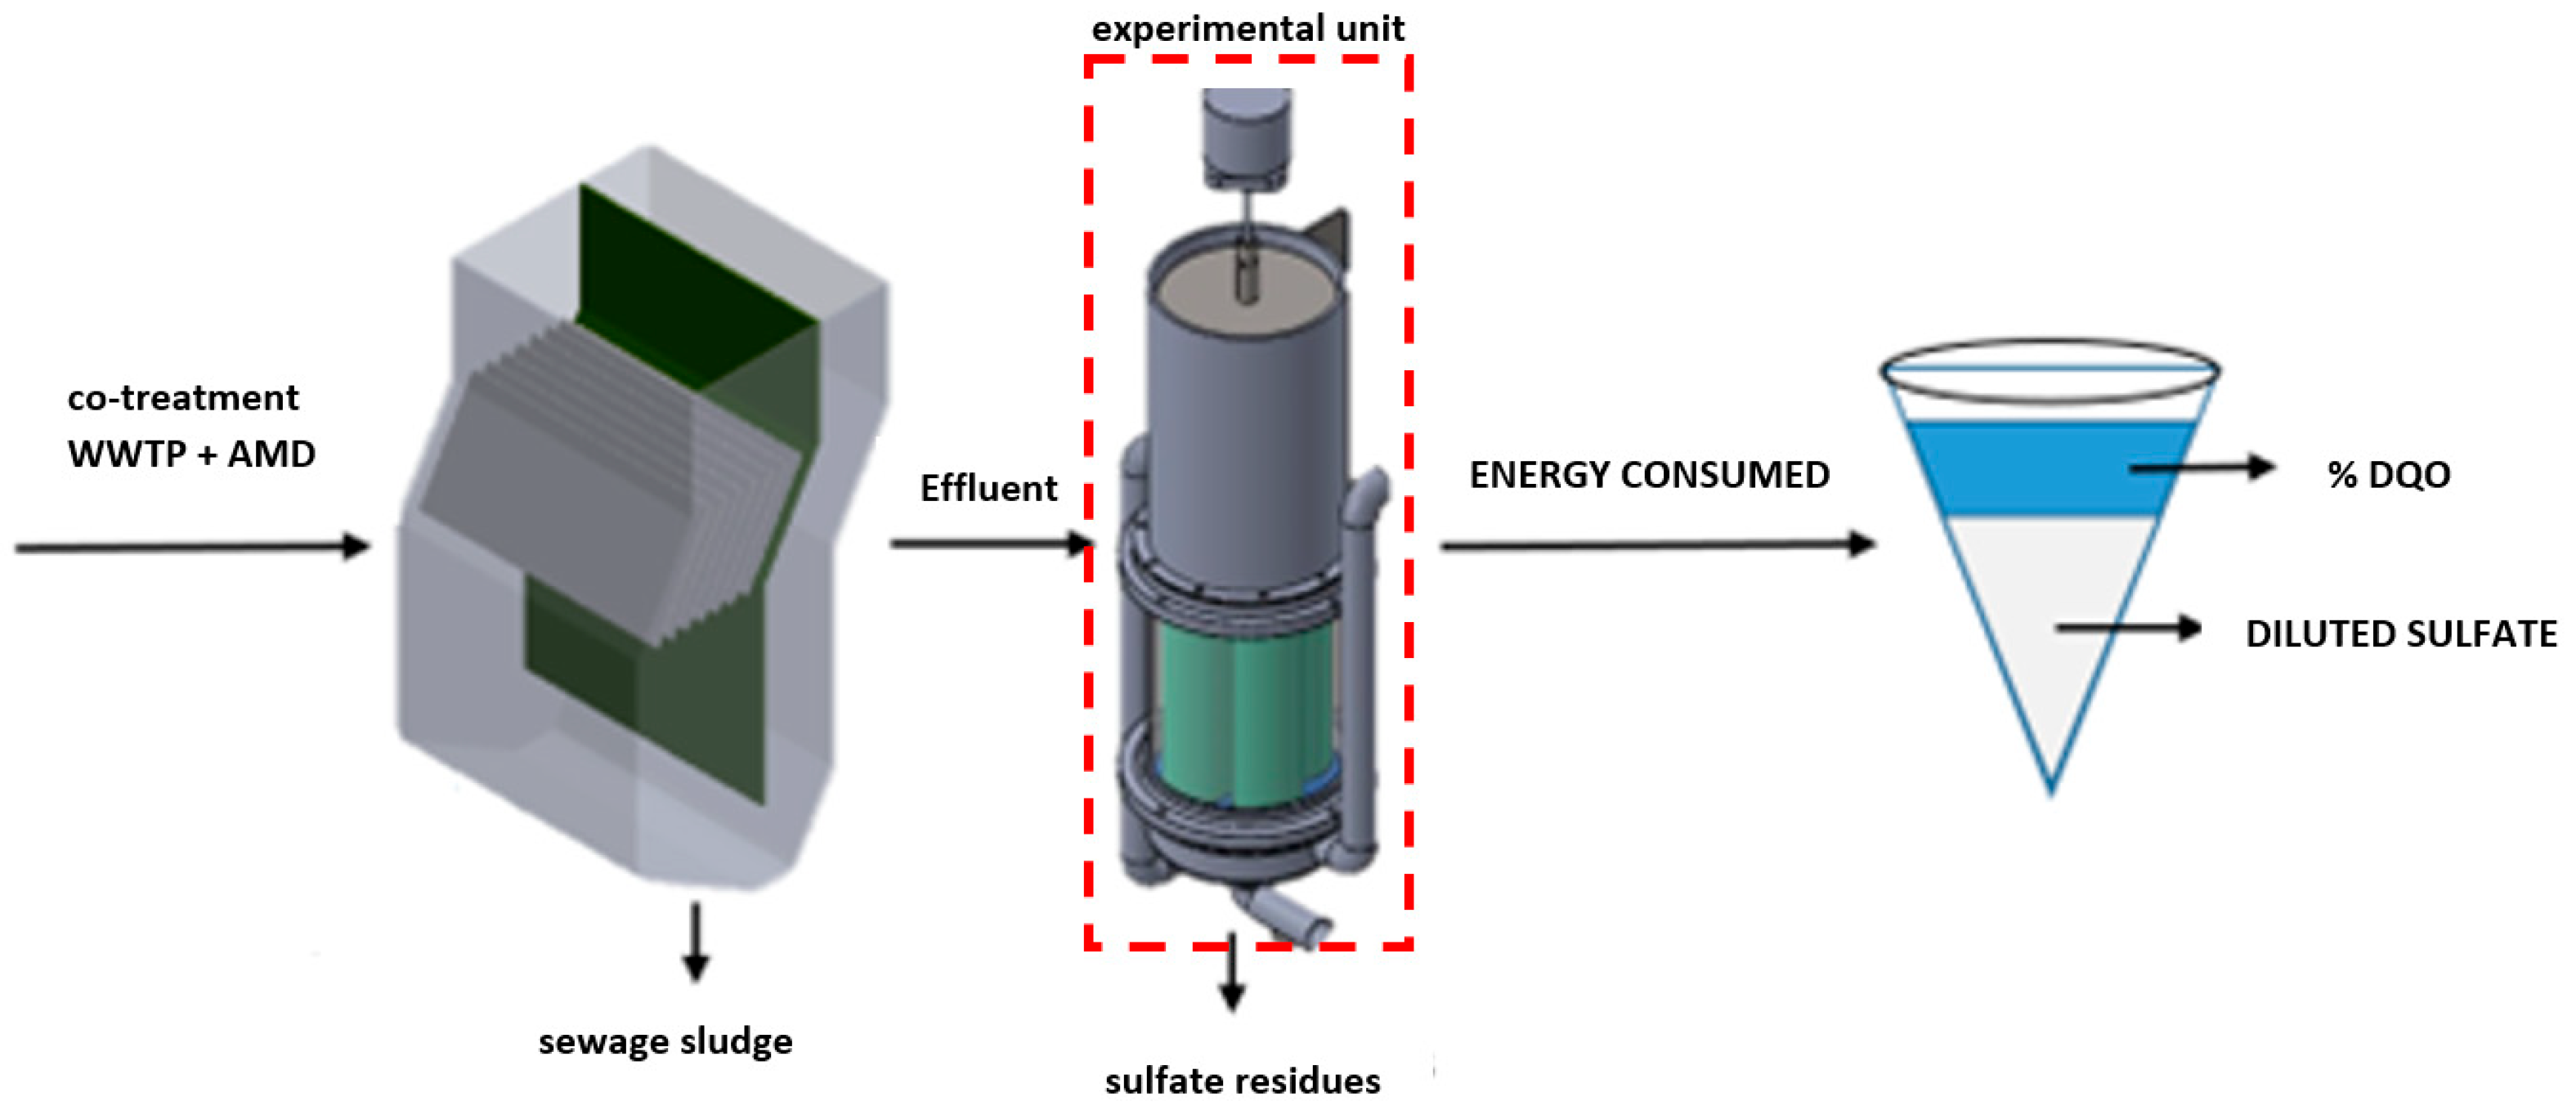
From the preliminary Jar Test experiment, the most effective dosage for COD reduction was found to be a 1:8 volumetric ratio (AMD–WWTP). This volumetric ratio was applied to the total influent flow rate (Q) of 2.5 L/min upon entering the settling unit, where co-treatment occurs, leading to a greater reduction in contaminants. Subsequently, the effluent passed into the electrocoagulation system with a total volume (V) of 13 L, as shown in Figure 5. This system served as the experimental unit for evaluating energy consumption per unit of COD removed.

2.5.3. Experimental Design

In this research, the response-surface methodology (RSM) was used, consisting of a collection of mathematical and statistical techniques implemented to establish relationships between independent and dependent variables [47]. A Box–Behnken design (BBD) was chosen as one of the standard and effective RSM approaches, as it allows the construction of quadratic models for the response without requiring a full three-level factorial experiment. As shown in Table 3, the Box–Behnken design included three factors at three levels (−1, 0, +1). The key practical indicators considered were electric current density (A/m2) (A), the anode surface-area-to-volume ratio (S/V) (B), and contact time (C).
Box–Behnken factor levels were selected to reflect realistic operating envelopes for a coaxial EC polishing unit treating the clarified supernatant of AMD–MWW mixing–settling: current density J = 1–3 A·m−2 brackets the range where energy remains manageable while avoiding severe passivation, surface-to-volume ratio S/V = 180–300 m2·m−3 corresponds to feasible electrode packings in the tested coaxial module, and contact time t = 60–90 min matches practical HRTs that allow floc growth and phase separation without continuous power input. No temperature or pressure control was applied; assays were conducted under ambient, atmospheric conditions to emulate routine field operation of compact EC reactors.
A Box–Behnken response-surface design was adopted to capture main effects, curvature and two-factor interactions among current density, surface-to-volume ratio, and contact time while keeping the number of runs practical for a polishing reactor. This approach is standard for EC optimization and aligns with the experimental design framework used in our previous co-treatment work. The Box–Behnken design included replicated center points to estimate pure error. Experimental runs were randomized to mitigate biases due to temporal drift or ordering effects. Analytical QA/QC followed Standard Methods and comprised routine duplicates, method blanks, and instrument verification/calibration for COD and ancillary measurements.

2.5.4. Control Samples and Validation

We employed no-current (sham) electrocoagulation as process controls. The AMD–MWW mixture, prepared at the same volumetric ratio derived from the Jar-Test screening, was subjected to the identical hydraulic sequence and contact time used in the coaxial reactor (inflow, axial agitation, and settling), while the power supply remained off. This operational baseline mirrors the quality of the post-sedimentation effluent that routinely feeds the EC unit in our treatment scheme.
Control and treatment samples were collected and analyzed under the same Standard Methods outlined in Section 2.2. Reproducibility and model adequacy were assessed through replicate runs embedded in the Box–Behnken design, residual diagnostics (normal probability plots), and lack-of-fit testing within the ANOVA framework. Controls were accepted when their variation remained within analytical uncertainty and when EC runs exhibited statistically discernible effects relative to the baseline. These checks ensured that the observed improvements in COD removal stem from electrocoagulation rather than from the upstream mixing/settling step.

2.6. COD Removal Efficiency

The removal efficiency was evaluated based on the COD parameter, as shown in the following equation:
%   C O D = C O D 0 C O D f C O D 0   ×   100
C O D 0 and C O D f are the influent and final COD concentrations of the EC stage, respectively.

2.7. COD Determination

Chemical Oxygen Demand (COD) is one of the key parameters used to determine the efficiency of wastewater treatment systems, as it quantifies the concentration of organic matter that can be chemically oxidized. For the determination of this parameter, the closed-reflux method with potassium dichromate was used, as described in the Standard Methods for the Examination of Water and Wastewater (method 5220). This is the most widely accepted standard for COD determination due to its high reproducibility, allowing for the quantification of organic load removal at each stage of a water treatment process, from the influent intake to the final effluent. To assess analytical variability, routine laboratory duplicates, method blanks, and periodic instrument checks were performed according to Standard Methods. Acceptance criteria and corrective actions are summarized in the Supporting Information.

2.8. Energy Consumption

Equation (2) shows the calculation used for energy consumption, denoted by Cenergy:
C e n e r g y = U × I × t ν
where C e n e r g y represents the energy consumption value of the unit for the electrocoagulation system (kWh/m3) over a period ( t ), U is the cell potential, I is the current, t is the electrocoagulation time (h), and ν is the volume of the treated sample (m3).
Throughout this study, the specific energy consumption (kWh·kg−1 COD) was normalized by the energized time of each run and the treated volume, consistently with the intermittent EC operation described in Section 2.4. This convention isolates the electrochemical contribution to energy demand and allows fair comparison across factor combinations.
Specific energy was normalized per unit COD removed to enable fair comparison across conditions with variable influent quality and to directly reflect treatment effectiveness versus energy input. Other normalizations (per treated volume, charge-based indices) are valid for different objectives but were not evaluated here.

2.9. Statistical Analysis

2.9.1. Effects Analysis and Model Generation

For statistical analysis using the Box–Behnken design, Equation (3) was used to encode the predetermined independent variables:
X i = X I X 0 X
where X i represents the dimensionless coded value of variable I, X 0 corresponds to the variable of the center value, and ΔX denotes the step change. The model terms were generated, and experimental data were fitted using Equation (4). This model is based on empirical data and uses a second-order polynomial equation [47].
Y = b 0 + b i X i + b i i X i 2 + b i j X i X j
where Y represents the response variable, which includes COD removal and energy consumption. The constant coefficients b 0 present the intercept, while b i , b i i , and b i j correspond to the linear, quadratic, and interaction terms, respectively. The three independent variables (current density, S/V ratio, and contact time) are represented by X i and X j .

2.9.2. Model Adjustment

In a Box–Behnken design, the coefficients R2, adjusted R2, and predicted R2 reflect the explanatory capacity of the model regarding the variance of the response and its predictive performance on new data, considering the number of factors and observations. An Adeq Precision value greater than 4 indicates a good signal-to-noise ratio, suggesting that the model can adequately discriminate the effects of the factors. The standard deviation (Std. Dev.) and mean provide information on data dispersion and central tendency, respectively. The Coefficient of Variation (C.V.%) contextualizes the magnitude of the standard deviation relative to the mean, where lower values indicate higher experimental precision. Collectively, high R2 (close to 1), Adeq Precision greater than 4, low C.V.%, and a small Std. Dev. support the robustness and reliability of the adjusted model.
All data were pre-processed and analyzed in Design-Expert (v13). Factors were coded to dimensionless units, and a second-order polynomial (RSM/Box–Behnken) was fitted by least squares. Term significance was assessed by ANOVA at α = 0.05, preserving model hierarchy. Lack of fit was tested against replicated center points. Predictive performance was evaluated via the PRESS statistic to compute predicted R2. Model adequacy was examined with normal probability plots of residuals and residuals-versus-fits to check normality and homoscedasticity. Potential transformations were screened using Box–Cox; none were required. Influential observations were checked with Cook’s distance and DFFITS (no influential points were retained). Collinearity was screened with VIF. When alternative models were considered, parsimony and information criteria (AICc/BIC) guided selection.

2.9.3. Model Optimization

The desirability optimization method is a widely used strategy for simultaneously adjusting multiple response variables, integrating objectives and constraints into a single composite function. Below are the typical formulas used in the desirability optimization method proposed by Derringer and Suich [48]. These formulas define the individual desirability function d i ( y i ) for each response y i based on its goal (minimization, maximization, or achieving a specific target value). and then combine all individual desirabilities into a global desirability D . An acceptable range is established between L (minimum acceptable value) and U (ideal or upper target value). If the response y falls below L, it is unacceptable (desirability = 0), while values above U s are optimal (desirability = 1). In the intermediate region, the function increases smoothly according to a power s , following Equation (5).
d y = 0                     i f   y < L y L U L S     i f   L y U 1                 i f   y > U
Similarly, limits L (target or lower value) and U (maximum acceptable value) are defined. If the response y exceeds U , the desirability is 0; if it is below L , it reaches a desirability of 1. In the intermediate range, a decreasing function determined by an exponent r is used, followed by Equation (6).
d y = 1                     i f   y < L U y U L r     i f   L y U 0                 i f   y > U
For responses whose objective is to approach a specific value T , an acceptable range is defined between L and U , with L < T < U . If y is outside [ L , U ], the desirability is 0. Within the range, exponents t and u are used to control the growth as y approaches the target, followed by Equation (7).
d y = 0                     i f   y < L y L T L t     i f   L y U U y U T u       i f   T y U
If there are m responses, each with its individual desirability function d i ( y i ), the overall desirability D is obtained as the geometric mean of all of them:
D = ( d 1 ( y 1 ) × d 2 ( y 2 ) × × d m ( y m ) ) 1 m

2.9.4. Cross-Validation and Influence Diagnostics

In addition to R2 and adjusted R2, we quantified predictive ability using the predicted R2 computed from the PRESS statistic under leave-one-out cross-validation (LOOCV):
R p r e d 2 = 1 P R E S S i ( y i y ¯ ) 2
P R E S S = i ( e i 1 h i i ) 2
where ei is the ordinary residual and hii the leverage for observation i. We screened outliers and influential runs using externally studentized residuals, Cook’s distance (reference threshold = 1), and DFFITS (software threshold lines at ±2.121), and examined distributional assumptions by normal probability plots. Box–Cox power transforms were assessed; the COD response indicated no transform (λ = 1; see Figure S1 and Figure 3). Throughout, factor C is consistently defined as electrolysis (contact) time. In this research, the Design Expert v.13 software was used for effect analysis, variance analysis, and model optimization.

3. Results

3.1. Descriptive Results

The results presented in Table 4 demonstrate that, although all the evaluated operating conditions achieved a high COD removal efficiency (ranging from 81.16% to 91.97%), significant differences were observed in energy consumption, which varied from 0.54 to 2.73 kWh/kg COD. This highlights the need to simultaneously optimize both removal effectiveness and process energy efficiency. For instance, the highest removal efficiency (91.97%) was obtained under the treatment with the highest current density (3 A/m2), the highest S/V ratio (300 m2/m3), and a settling time of 75 min; however, this condition also exhibited the highest energy consumption (2.73 kWh/kg COD). In contrast, the treatment with the lowest energy demand (0.54 kWh/kg COD) achieved a removal efficiency of 82.69%, which, although still high, underscores the trade-off between removal efficiency and energy consumption.
Similarly, the equivalent volumetric specific energy consumption (kWh·m−3) of the coaxial electrocoagulator for the 14 Box–Behnken runs covering current density A (1–3 A·m−2), surface-to-volume ratio B (180–300 m2·m−3), and electrolysis/contact time C (60–90 min). Energy consumption ranged from 0.13 to 0.76 kWh·m−3 with a mean of 0.38 kWh·m−3 (SD = 0.19). The minimum energy per volume (0.13 kWh·m−3) occurred at A = 1, B = 180, and C = 75, while the maximum (0.76 kWh·m−3) was observed at A = 3, B = 300, and C = 75.

3.2. Effect of Experimental Factors

3.2.1. Effect of COD Removal

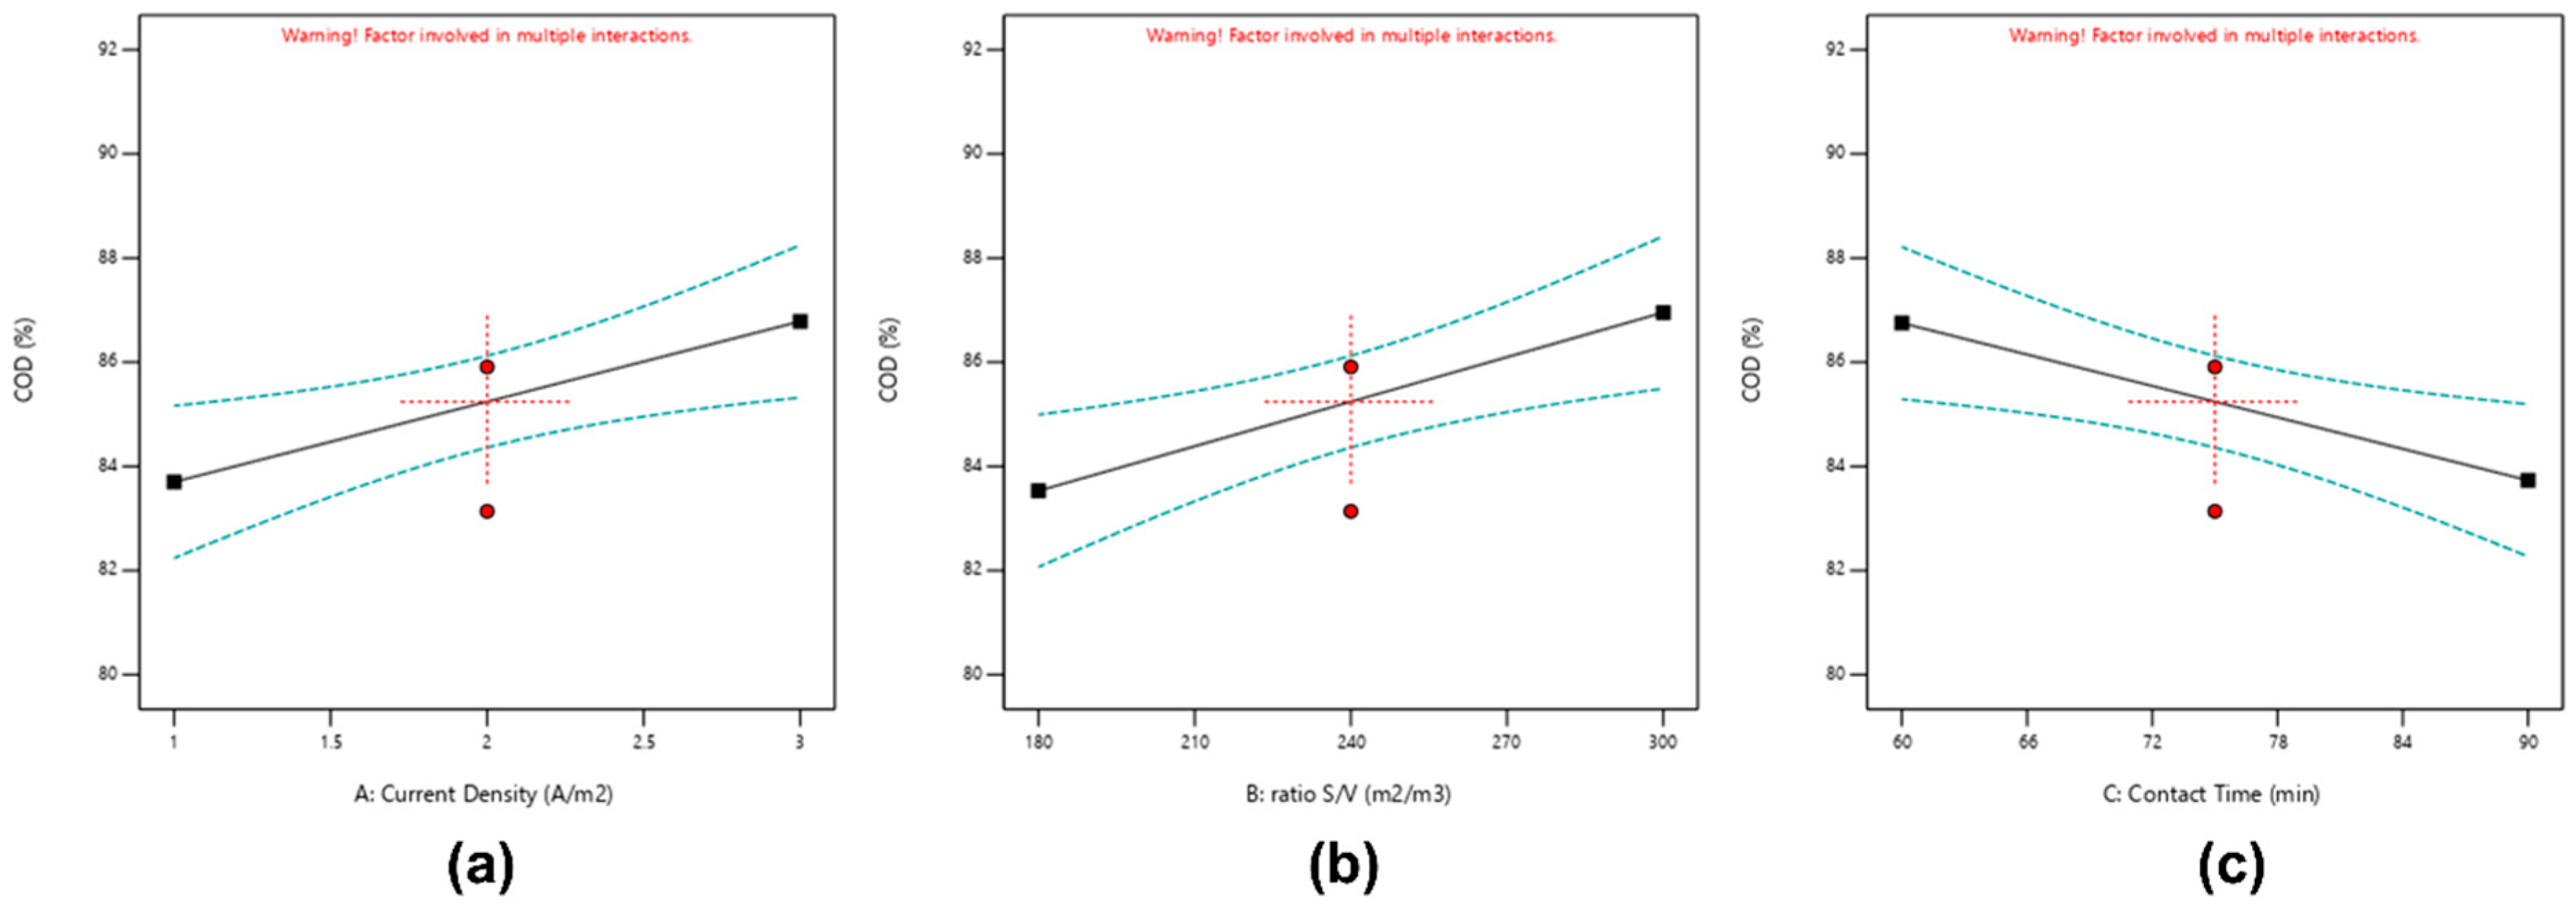
Figure 6 illustrates how each of the evaluated factors (current density, surface-to-volume ratio, and settling time) influences COD removal (%) in a distinct manner. Firstly, increasing the current density (from 1 to 3 A/m2) promotes a slight improvement in removal efficiency, which can be attributed to the greater generation of electrochemical coagulants that enhance the aggregation of contaminant particles. Similarly, a higher surface-to-volume (S/V) ratio, increasing from 180 to 300 m2/m3, positively impacts process efficiency, as a larger contact surface enhances the interaction between coagulants and suspended matter. In contrast, extending the settling time from 60 to 90 min tends to reduce COD removal, which could be explained by the possible re-dissolution or destabilization of the formed flocs after a prolonged sedimentation period. Furthermore, the confidence lines illustrated in the figure confirm that the observed trends remain within a statistically significant margin, reinforcing the validity of the results and highlighting the need to establish an appropriate balance among operational variables to simultaneously maximize removal efficiency and system stability.
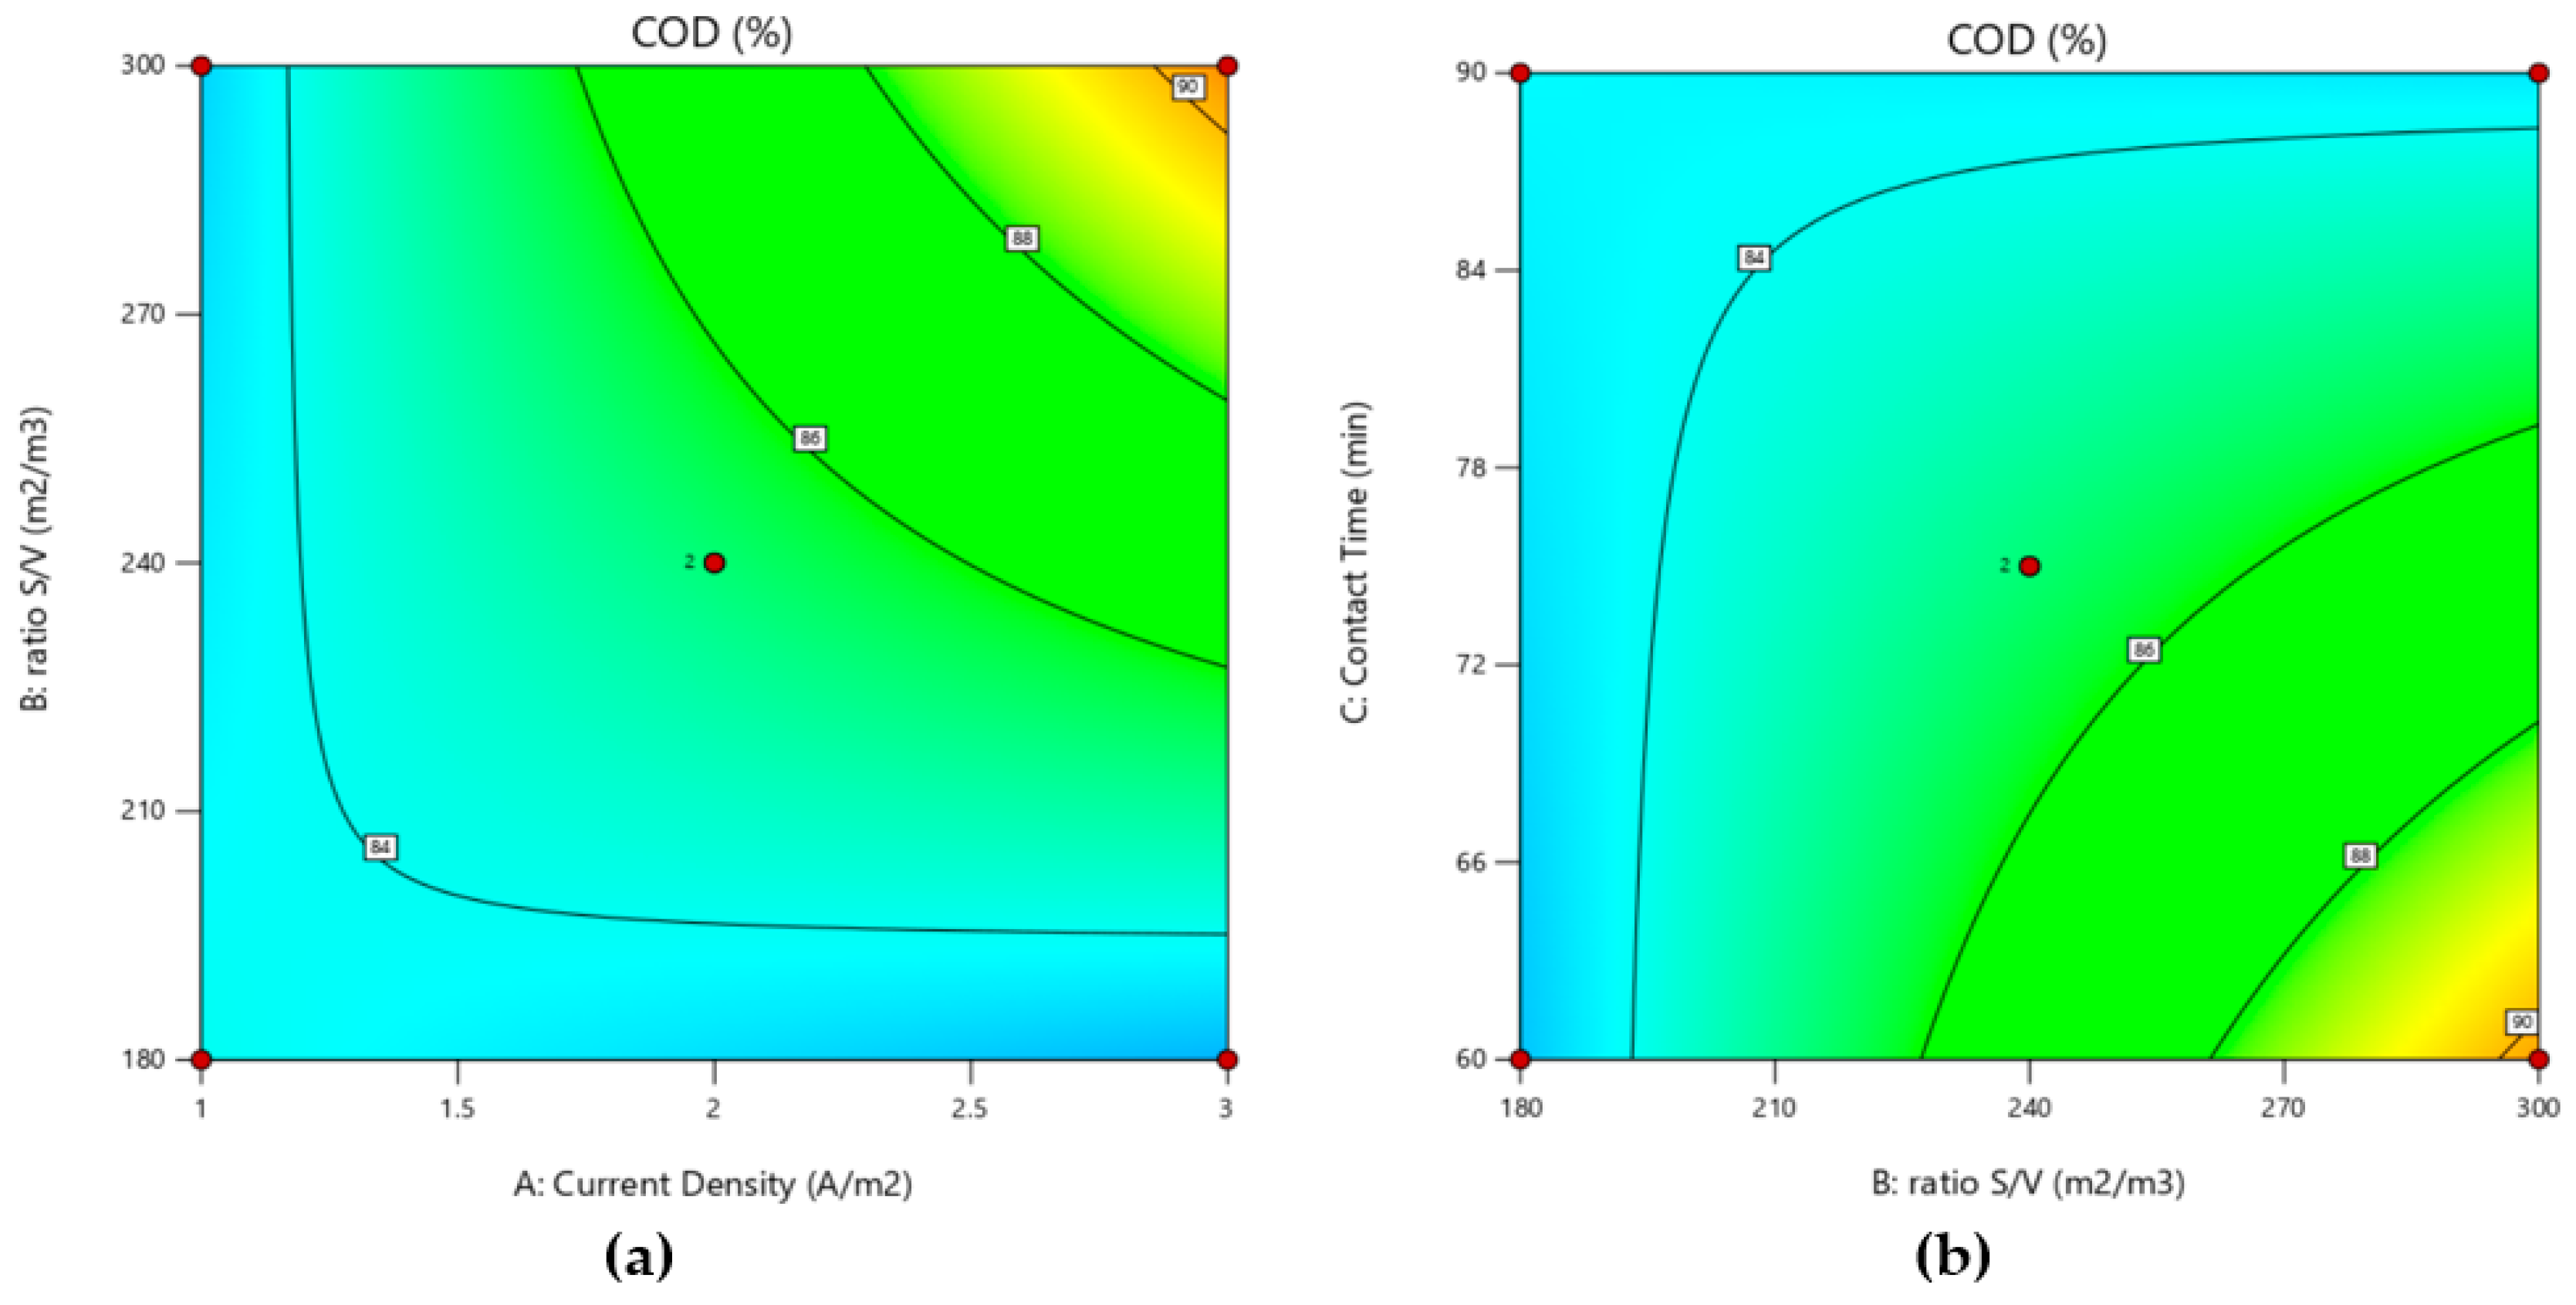
Figure 6 presents contour plots depicting the combined influence of current density, surface-to-volume ratio (S/V), and contact time on the electrocoagulation process for COD removal. In Figure 6a, which illustrates the relationship between current density and S/V, a significant increase in removal efficiency is observed when the current density approaches 3 A/m2 and the S/V ratio reaches approximately 300 m2/m3. This suggests that the generation of larger amounts of electrochemical coagulants and the expansion of the contact surface facilitate more efficient contaminant aggregation. Conversely, lower current densities (<1.5 A/m2) and S/V ratios below 210 m2/m3 result in reduced removal efficiencies (blue areas), indicating less favorable conditions for the process.
In Figure 6b, consistent with the main-effect plot, COD removal decreases with longer electrolysis time; within the tested window, the highest removals occur at high S/V and the shortest contact time (60 min). The apparent “shoulder” around 60–70 min in the surface plot is shallow and not indicative of a distinct optimum. At fixed S/V, the current density–time surface shows modest gains with increasing current density at short times and diminishing returns at long times, consistent with the negative main effect of time and the small main effect of current density on COD removal.

3.2.2. Effect of Energy Consumed

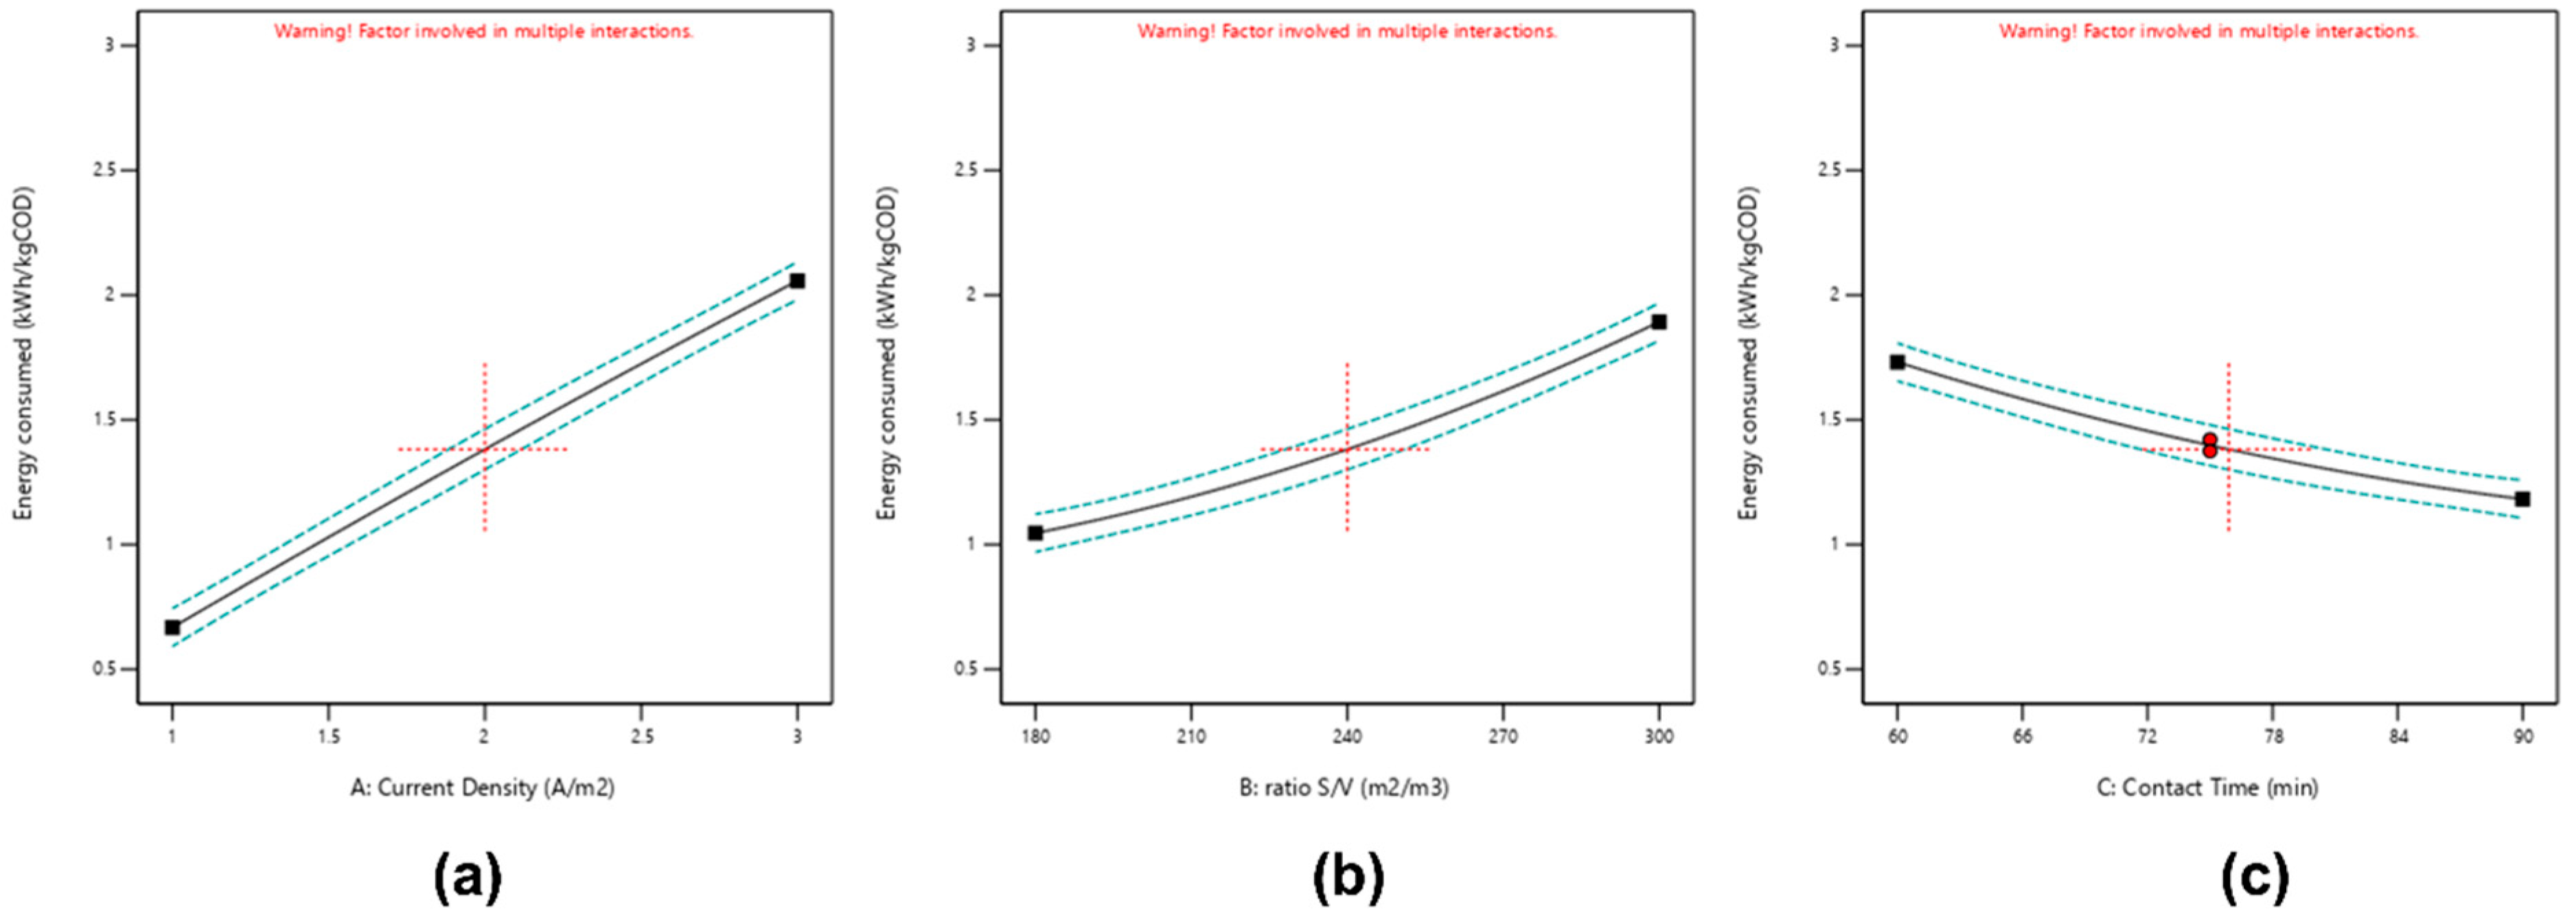
Figure 7 illustrates energy consumption (kWh/kg COD) as a function of current density (A/m2), surface-to-volume ratio (S/V, m2/m3), and electrolysis time (min), highlighting the importance of balancing COD removal efficiency with the economic feasibility of the process. An increase in current density from 1 to 3 A/m2 results in a positive linear relationship with energy consumption, as the higher electron flow raises energy demand despite enhancing COD removal.
The increase in the S/V ratio from 180 to 300 m2/m3 leads to a moderate rise in energy consumption (Figure 8), likely due to the need to sustain an effective electrical flow over a larger surface; however, this effect is less pronounced compared to current density. Additionally, an inverse trend is observed between settling time (60 to 90 min) and energy consumption, which is associated with a reduced demand following floc formation and sedimentation. However, prolonged settling periods may compromise COD removal efficiency, emphasizing the need to find an optimal balance among these operational factors to maximize system performance.
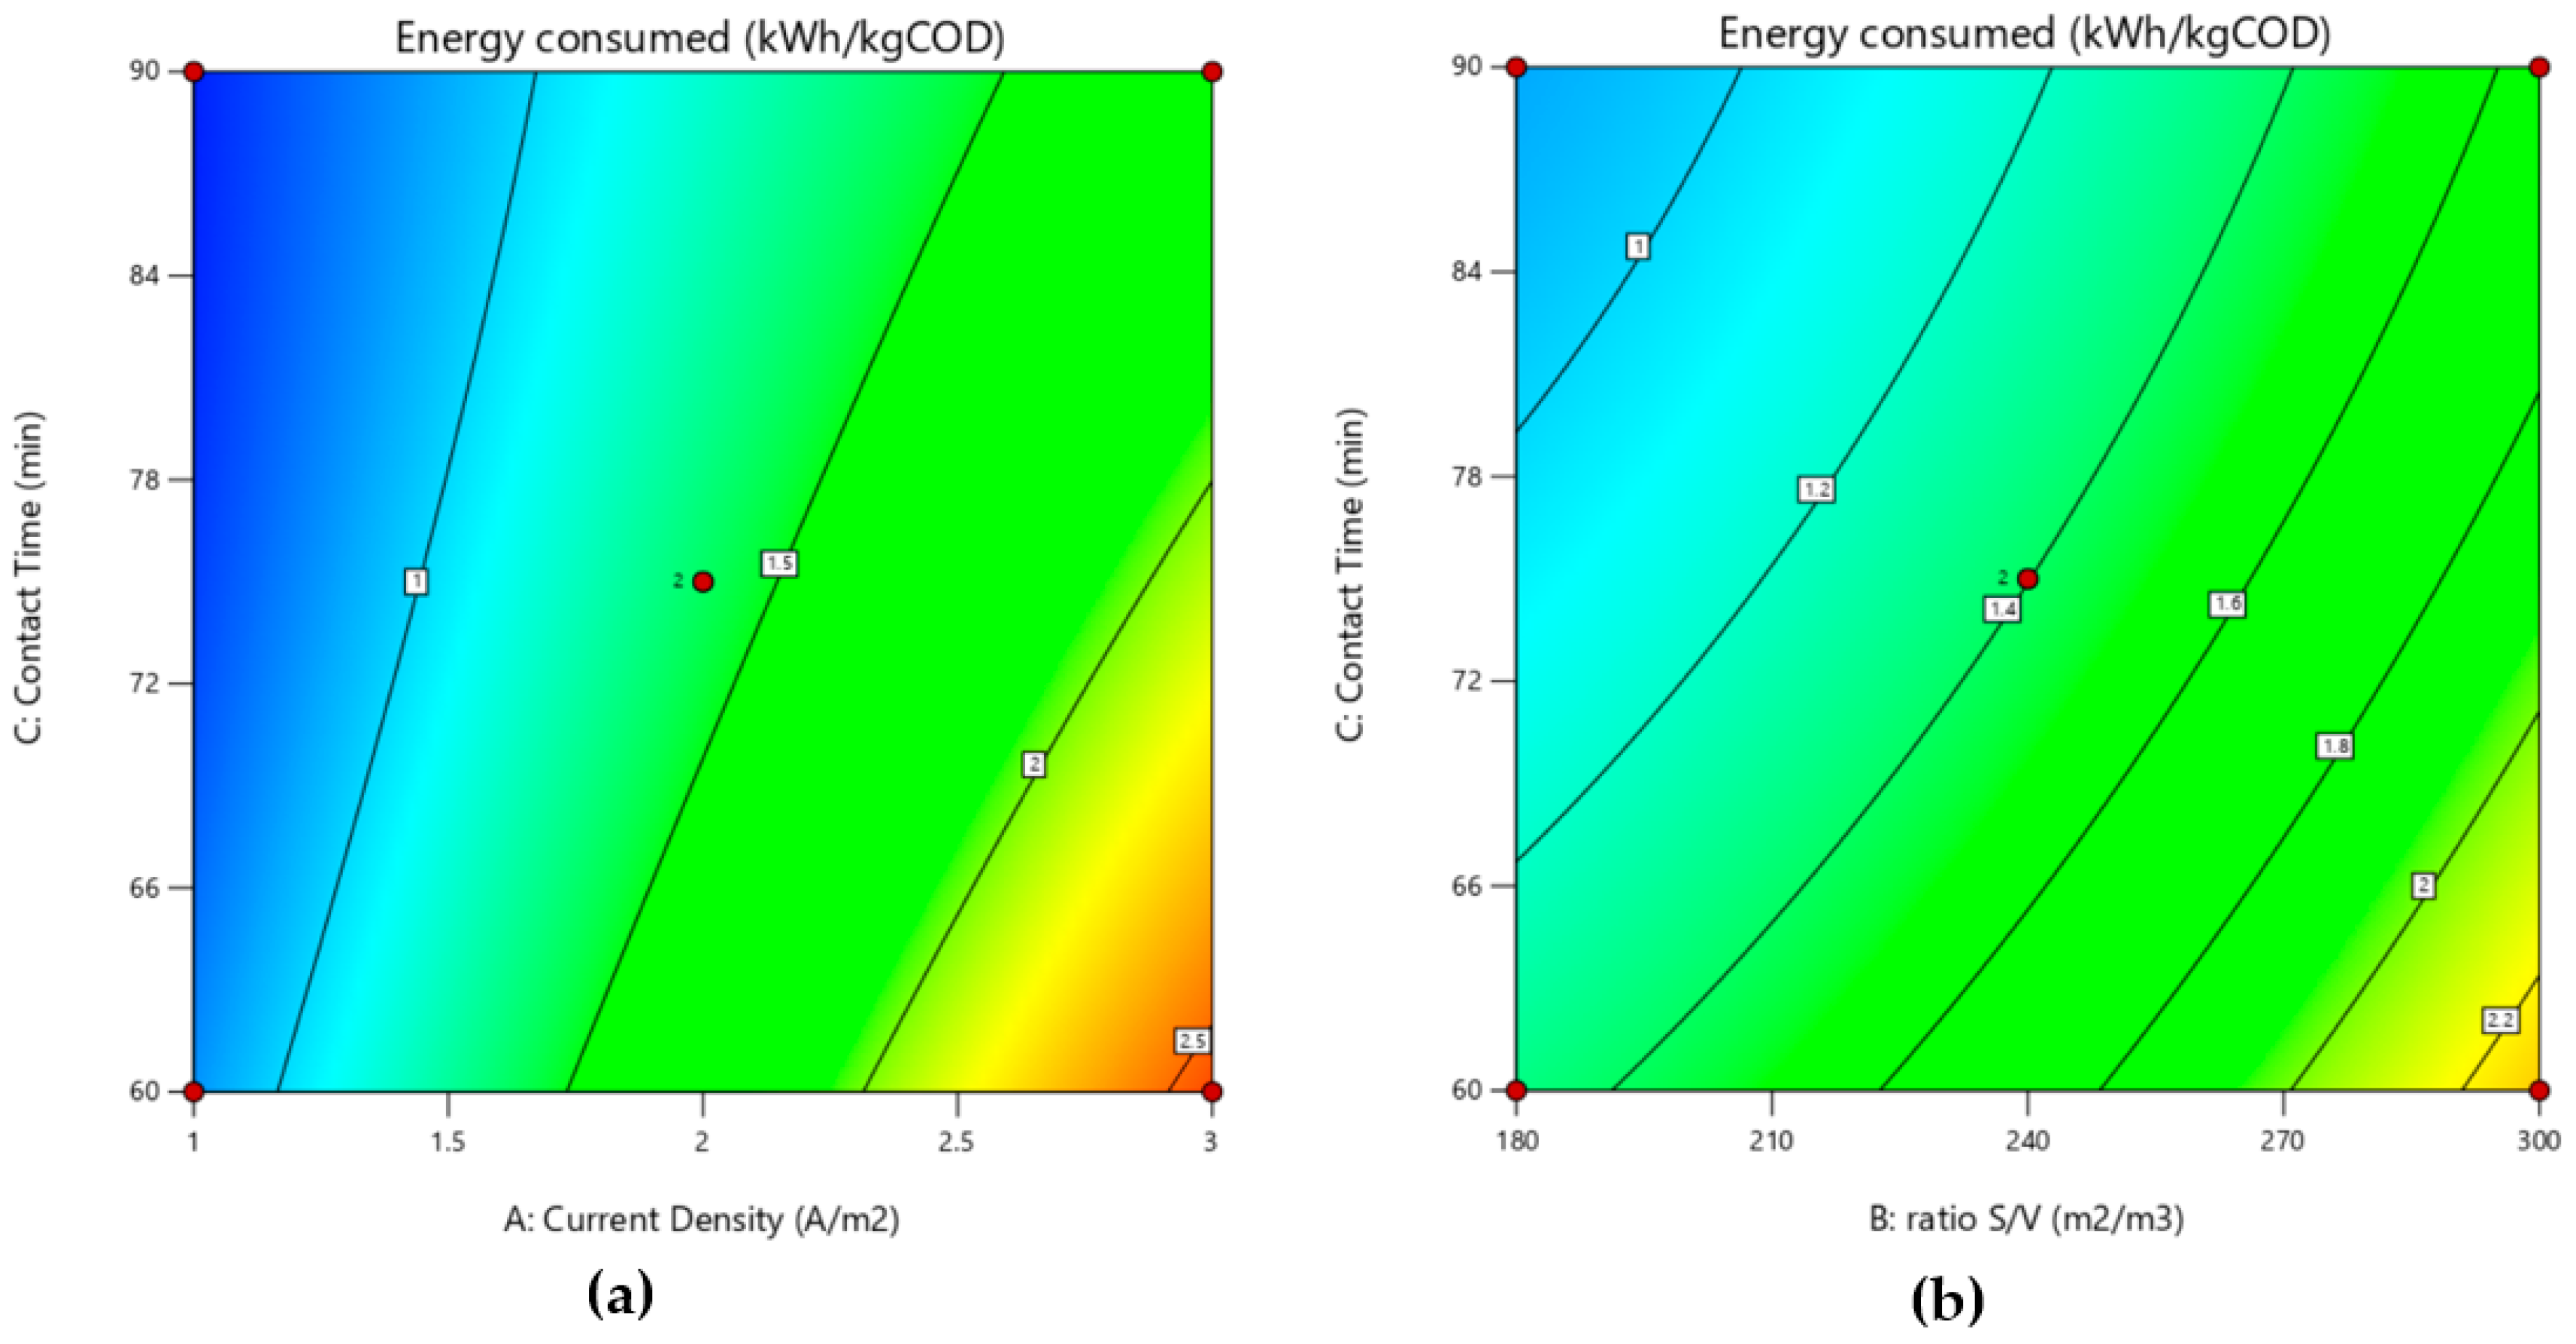
Figure 9 illustrates, through 2D contour plots, the combined influence of current density, surface-to-volume ratio (S/V), and contact time on energy consumption (kWh/kg COD) in the coaxial electrocoagulator. In Figure 9a (current density vs. contact time), the lowest consumption values (blue regions) correspond to relatively low current densities (≤1.5 A/m2) combined with longer contact times (≥78 min), suggesting that a reduced electron input, along with sufficient reaction time, optimizes energy usage.
Conversely, Figure 9b (S/V vs. contact time) shows a moderate increase in consumption as the S/V ratio rises, likely due to the need to maintain electrochemical efficiency over a larger reaction surface. However, as contact time increases, the aggregation and separation of contaminants are enhanced, leading to an overall reduction in energy consumption (green-blue regions). This highlights the necessity of balancing energy requirements with contaminant removal effectiveness in the system’s design conditions.

3.3. Analysis of Variance (ANOVA) and Fitting of the RSM-BBD Model

Table 5 presents the ANOVA results for the response variables: COD removal efficiency (%COD) and energy consumption (kWh/kg COD). Firstly, the model for %COD is statistically significant (p = 0.0061), with notable main effects from current density (A), surface-to-volume ratio (B), and settling time (C), where the S/V ratio (B) has the highest contribution (Sum of Squares = 23.44). Additionally, the interactions AB (p = 0.0234) and BC (p = 0.0354) are significant, highlighting the combined influence of current density with S/V ratio and S/V ratio with settling time, while the AC interaction (p = 0.0609) is close to the significance threshold. The non-significant “Lack of Fit” (p = 0.8246) confirms the model’s suitability for describing COD removal.
Regarding energy consumption, the ANOVA reveals a highly significant model (p < 0.0001), with current density (A) exerting the greatest impact (F = 2307.09), followed by the S/V ratio (B) and electrolysis (contact) time (C), all with p < 0.0001. Additionally, the interactions AB (p = 0.0013) and AC (p = 0.0017) indicate that the effect of current density on energy consumption varies depending on the S/V ratio and settling time, while BC (p = 0.0662) remains close to significance. Among the quadratic terms, B2 (p = 0.0195) exhibits a non-linear effect, whereas A2 and C2 do not reach statistical relevance. Once again, the non-significant “Lack of Fit” (p = 0.485) confirms the model’s adequacy, reinforcing the necessity of jointly optimizing the three factors (A, B, and C) to maximize COD removal while minimizing energy consumption.
Table 6 presents the statistical fit indicators for COD removal and energy consumption (kWh/kg COD). For COD removal, the coefficient of determination (R2 = 0.8798) and adjusted R2 (0.7768) indicate a reasonable fit; however, the gap between these values and the predicted R2 (0.5301) suggests limited predictive capability beyond the experimental range. In contrast, the model for energy consumption exhibits outstanding performance, with R2 (0.9989), adjusted R2 (0.9964), and predicted R2 (0.9845) values that are closely aligned, demonstrating remarkable consistency in both fit and validation. Additionally, the Adeq Precision (64.52) far exceeds the recommended minimum threshold (4), reinforcing the model’s reliability. The low data dispersion (Std. Dev. = 0.0415, C.V. = 2.82%) around the mean (1.47 kWh/kg COD) further confirms its high precision. These results indicate that, while the COD removal model should be interpreted cautiously for strictly predictive purposes, the energy consumption model serves as a robust and reliable tool for describing and forecasting the system’s energy demand.
The COD model is significant (p = 0.0061) with R2 = 0.8798 and adjusted R2 = 0.7768; however, predicted R2 = 0.5301, yielding a difference >0.2 as flagged by Design-Expert (Adeq Precision = 10.01; PRESS = 53.29). Two factors drive this gap. First, the Box–Behnken geometry with only two center-point replicates (pure error df = 1) gives high leverage to most design points; consequently, LOOCV deletions inflate PRESS. Second, the response range is narrow 81–92% COD), so small absolute deviations generate a comparatively large predicted-error fraction. Diagnostics indicate no outliers: Cook’s D values were all <1 (maximum = 0.49), and DFFITS remained below the software’s reference lines (DFFITSmax = 2.0 < ±2.121). The implied LOOCV error was RMSE = √(PRESS/n) = 1.951%COD (n = 14). Box–Cox analysis recommended no transformation (λ = 1). Taken together, the model provides a reliable local description of COD removal within the tested region while being conservative in cross-validated prediction, a known behavior for sparse-replicate BBDs with bounded responses.
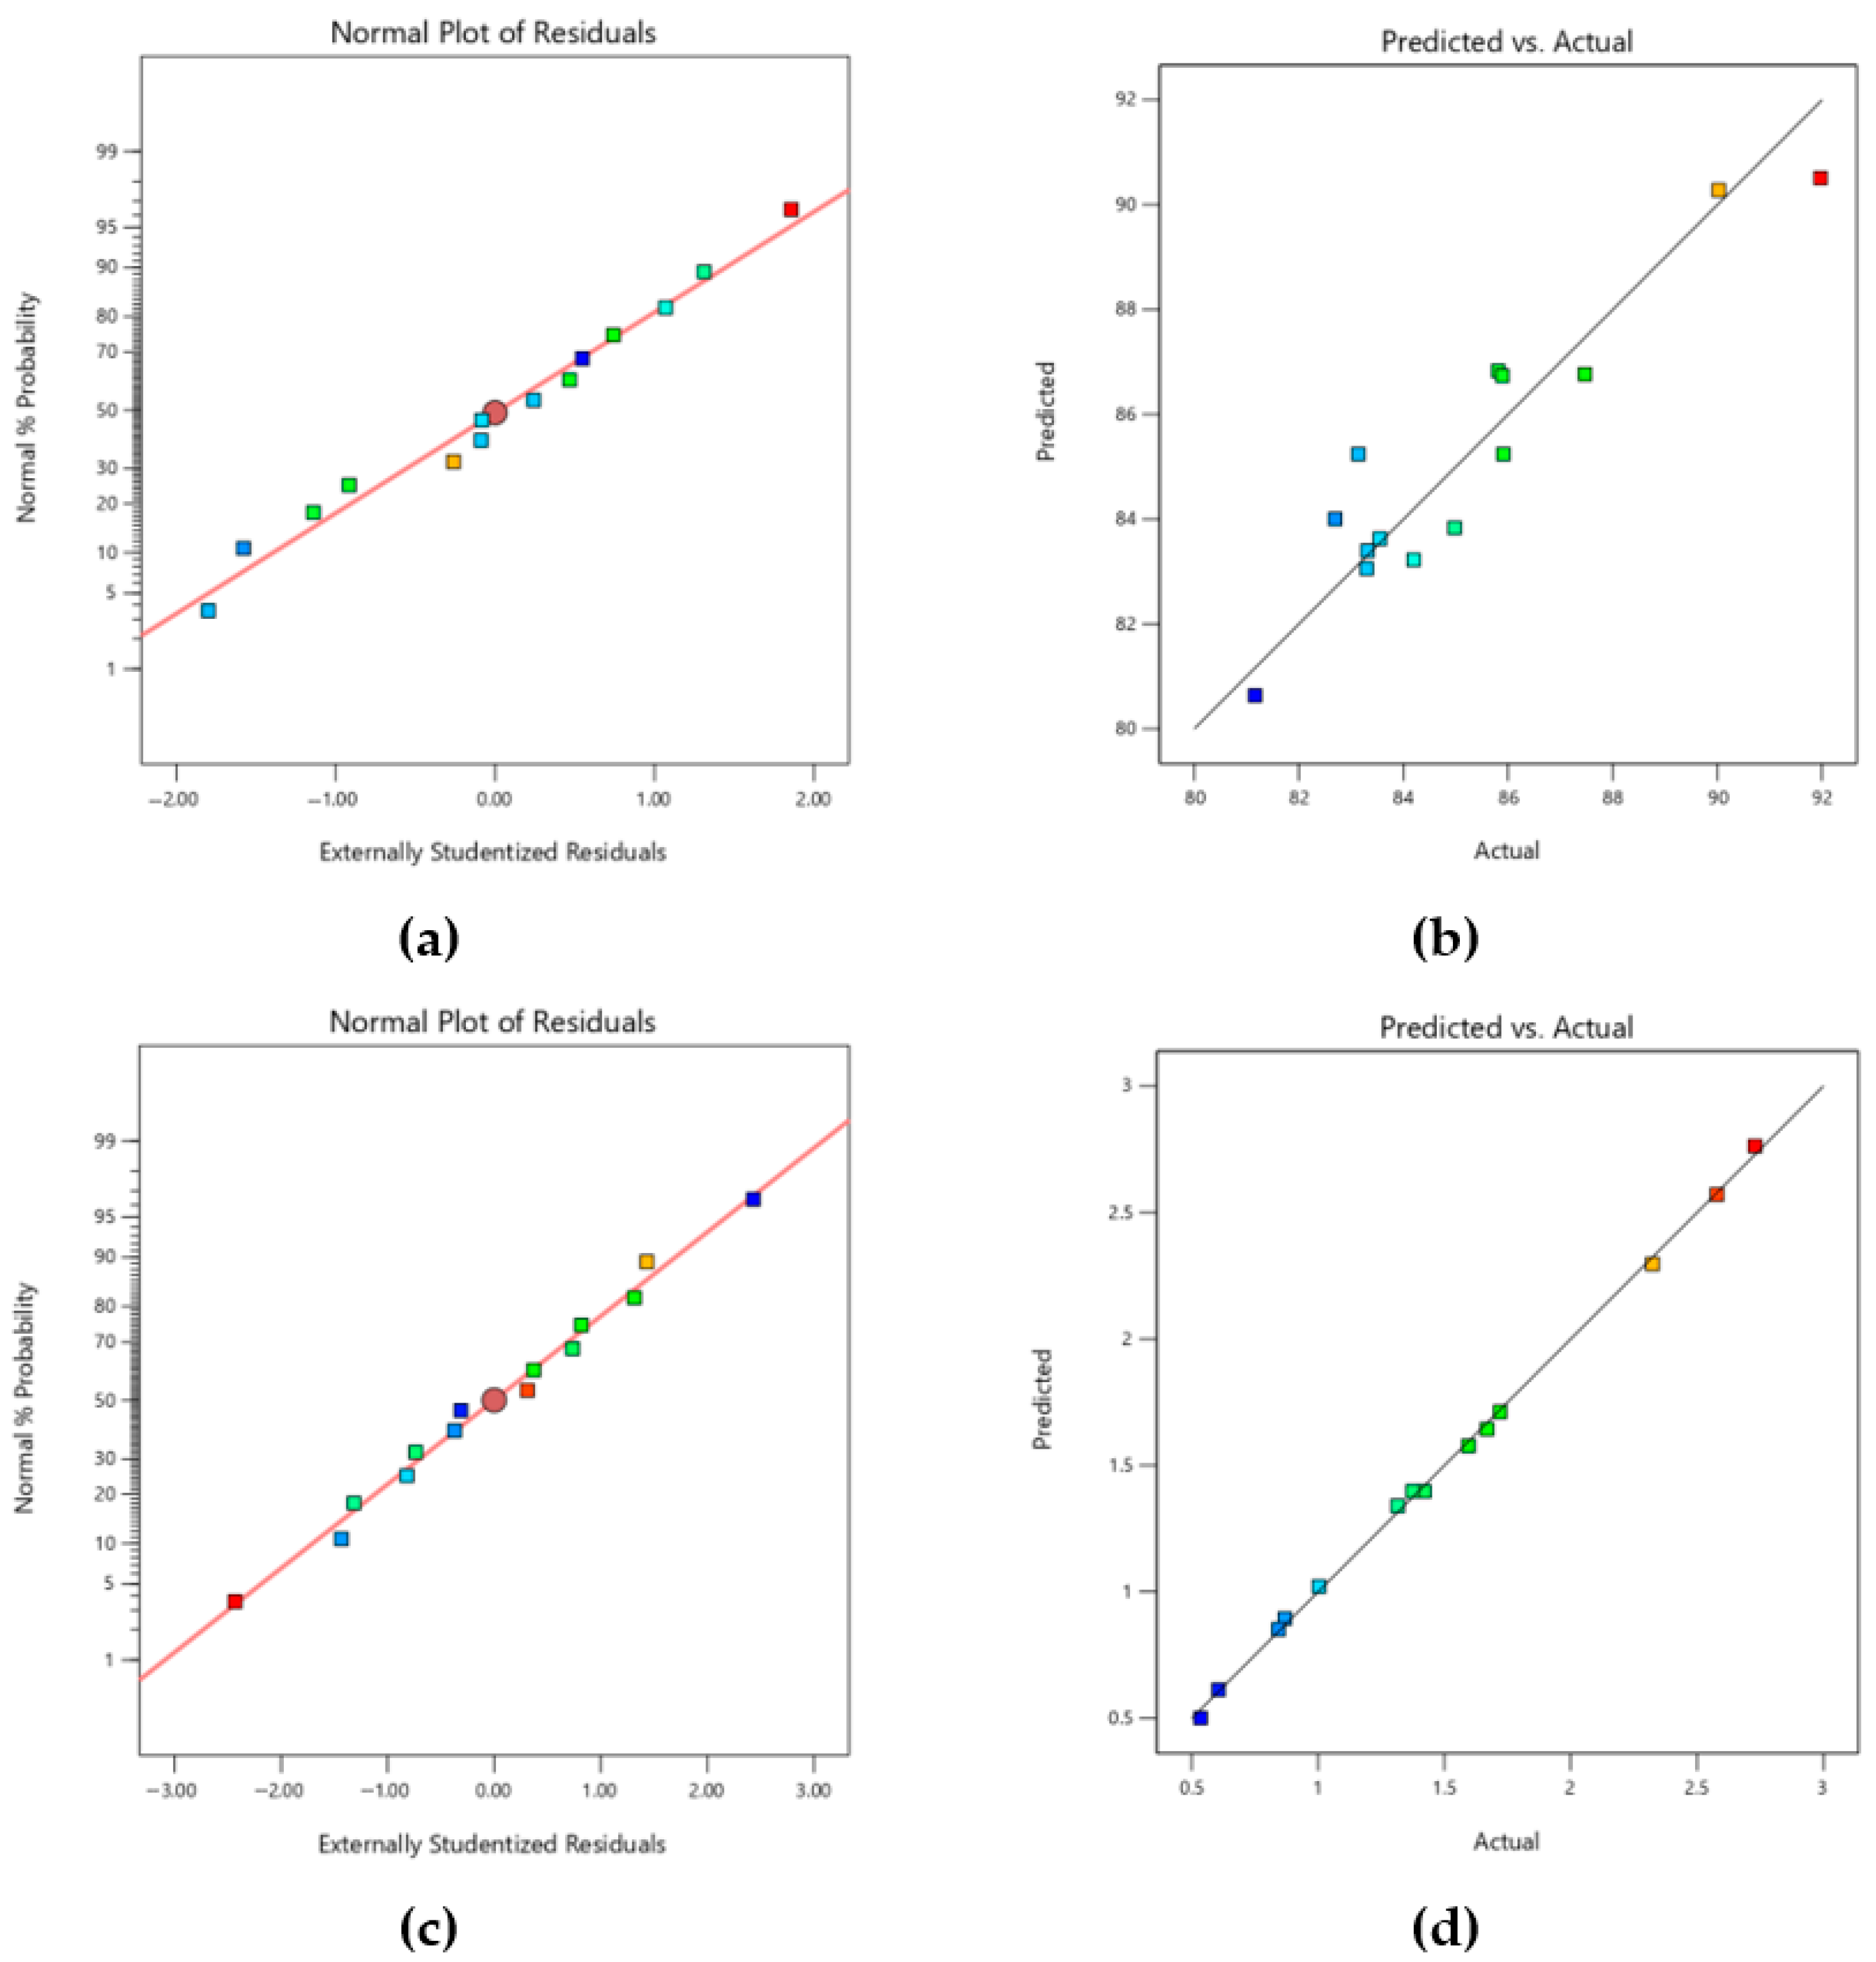
Figure 10 presents the normality plots of residuals and the predicted vs. observed graphs for the two analyzed variables (%COD removal and energy consumption). In both cases, most data points closely align with the theoretical normality line (Figure 10a,b, indicating an approximately normal distribution of errors and the absence of systematic patterns. For COD removal, this is illustrated by the dispersion observed in the predicted vs. actual plot, consistent with the previously reported R2, adjusted R2, and predicted R2 values. Conversely, for energy consumption (Figure 10c,d), the points show an almost perfect alignment with the normal distribution and a nearly exact correspondence between experimental and model-predicted values. This aligns with the model’s high fitting accuracy (R2, adjusted R2, and predicted R2) and the non-significant “Lack of Fit.”
These results confirm the statistical validity of the proposed models and support their reliability in both describing and predicting the system’s behavior regarding COD removal and energy consumption.

3.4. Optimization of Process Parameters

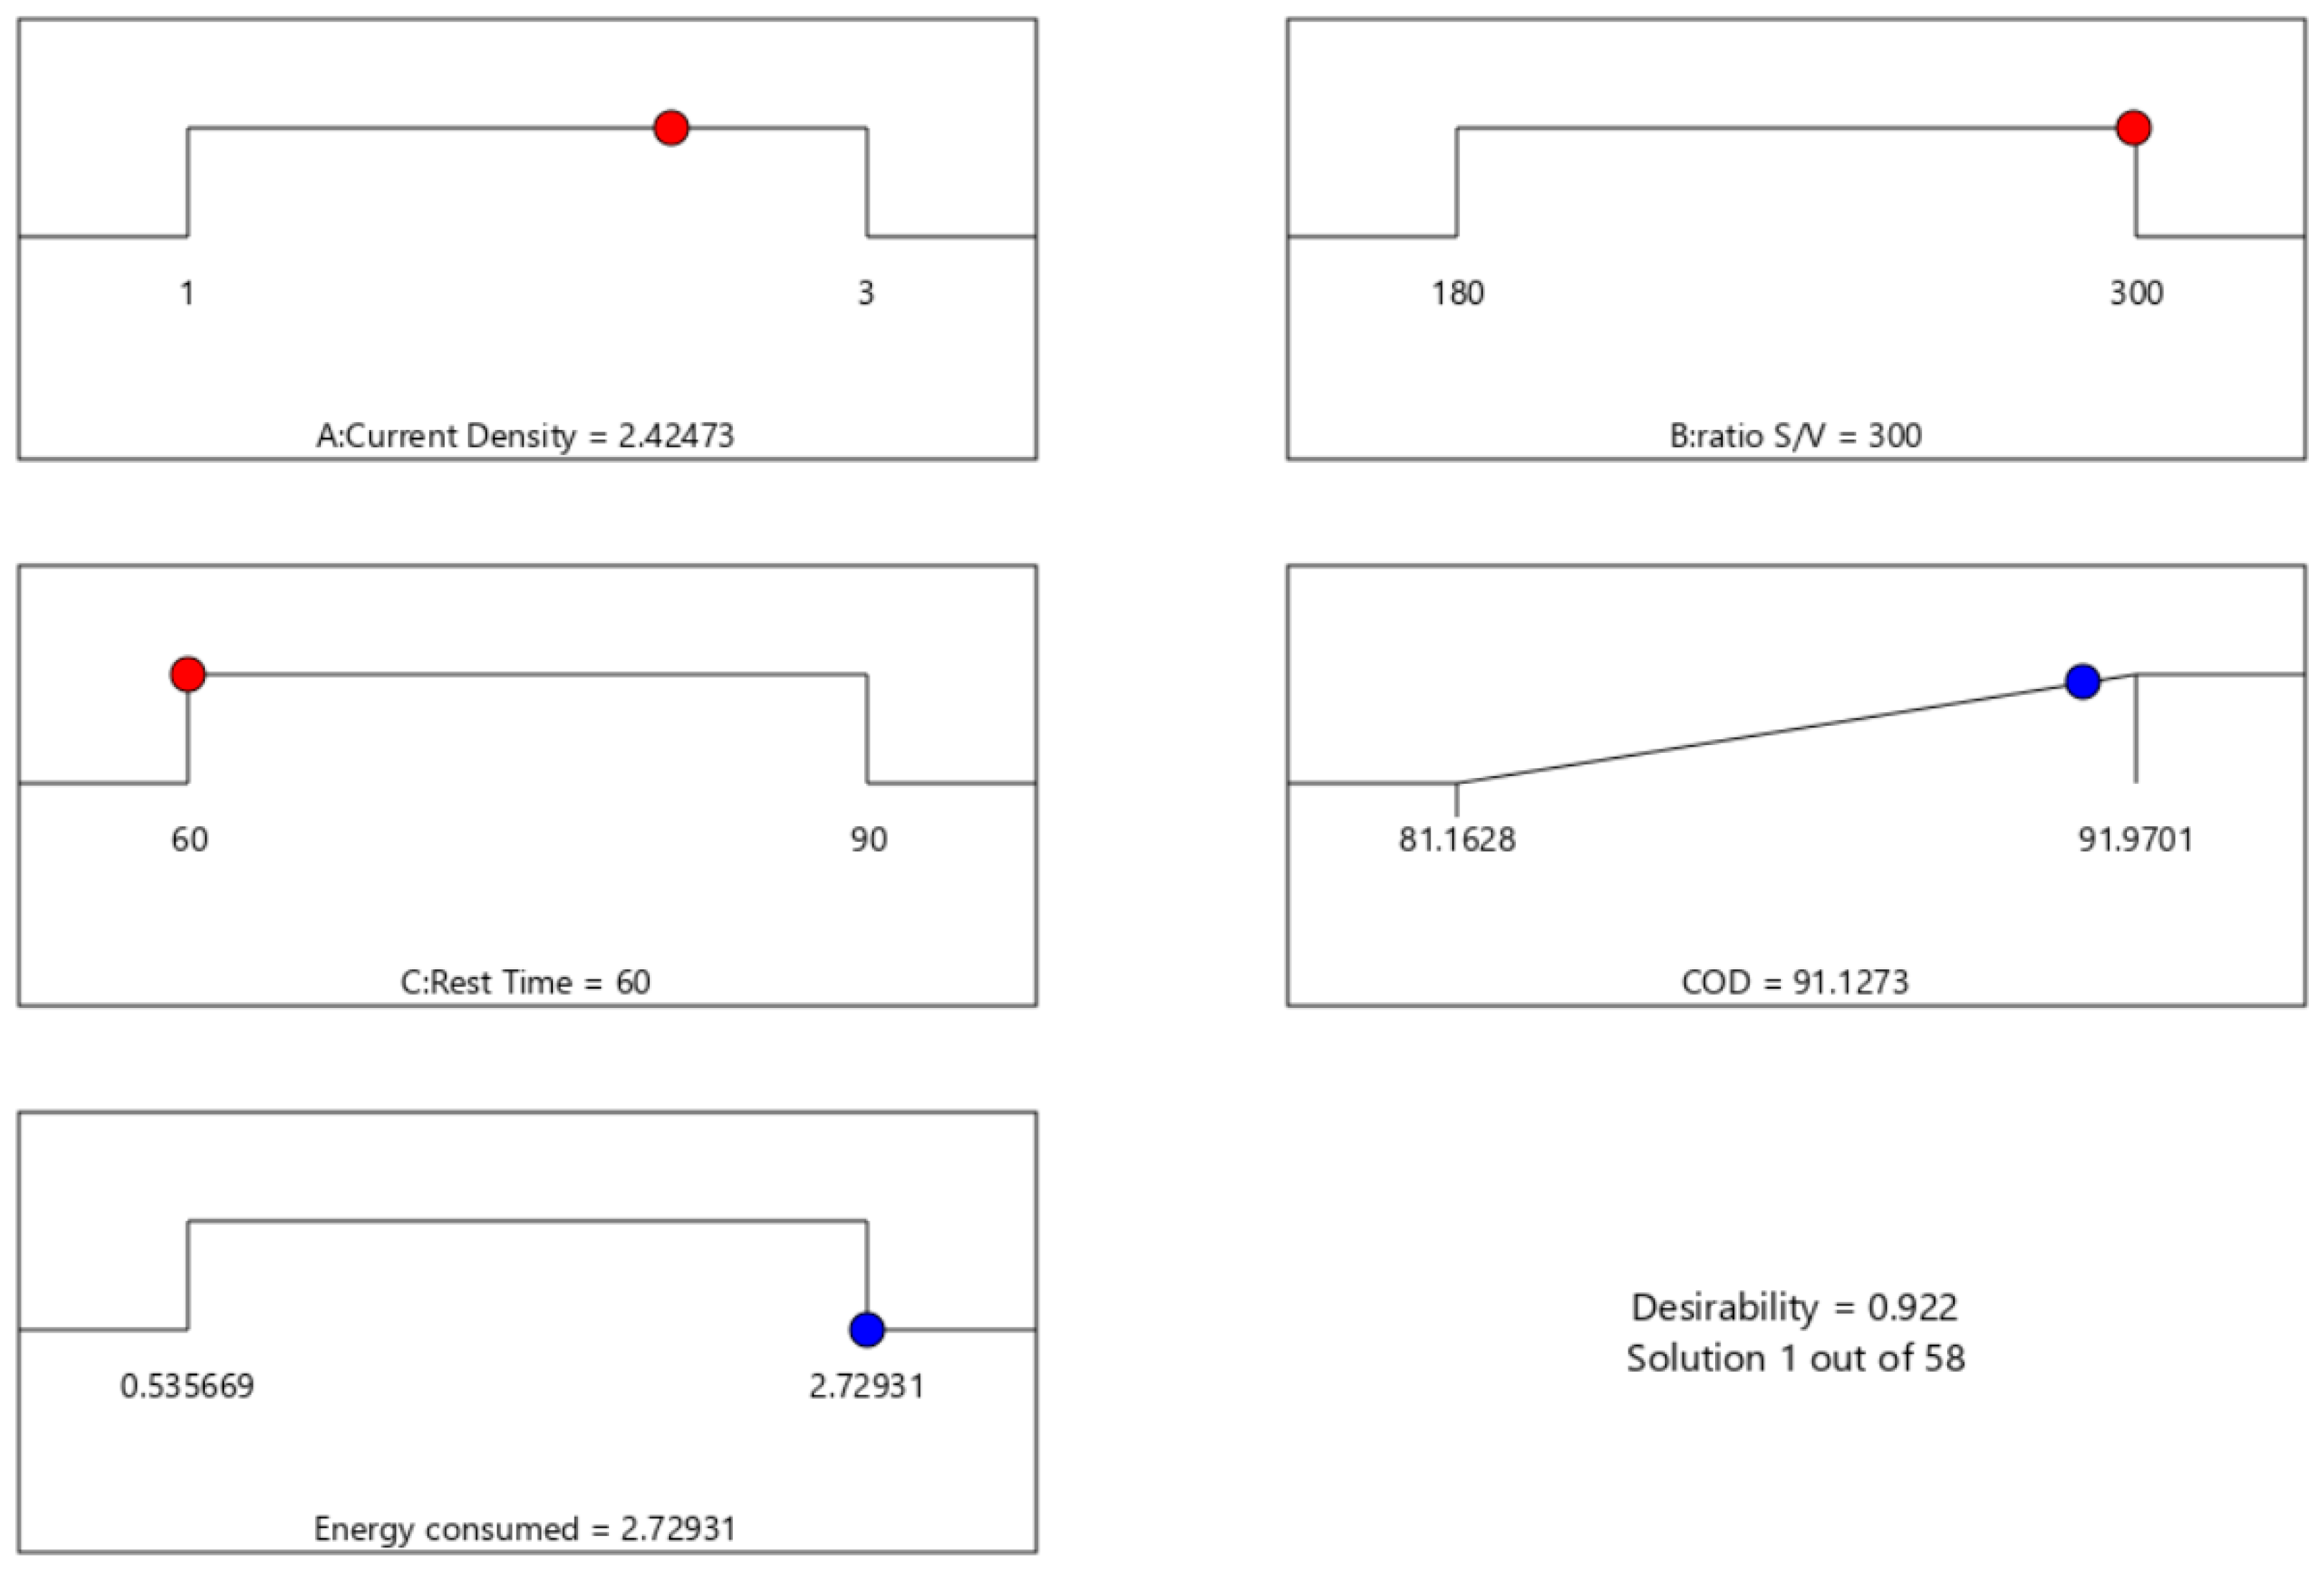
Multi-response desirability (Derringer–Suich, Figure 11) was used with equal importance for both responses: COD removal (maximize; L = 80%, T = 92%; s = 1) and specific energy (minimize; L = 0.50 kWh·kgCOD−1, U = 3.00 kWh·kgCOD−1; s = 1). The best compromise (D = 0.922) occurs at J = 2.42 A·m−2, S/V = 300 m2·m−3, t = 60 min, with COD = 91.12% and energy ≈ 2.59 kWh·kgCOD−1. For comparison, a COD-only optimization from the fitted models would shift to J = 3.0 A·m−2, S/V = 300 m2·m−3, t = 60 min.

3.5. Sludge Generation and Post-EC Effluent Quality

Consistent with the process layout, the EC reactor did not produce a separable sludge stream under any of the tested conditions. Instead, we observed a light foam at the liquid surface during/after energization; this foam collapsed within minutes and, upon collapse, returned to the bulk liquor, indicating that sulfate remained dissolved and was merely entrained in the foam films. By contrast, the only tangible solids in the overall system were retained in the upstream sedimentation step, where Fe–P flocs form during AMD–MWW mixing (EREM, 2023), in agreement with the process sequence in Figure 4.
Under all tested conditions, the EC supernatant was clear and low-solids, and no separable EC sludge stream was withdrawn; instead, a thin, transient foam developed and collapsed within minutes, attributable to gas evolution (H2/O2). This observation is consistent with the fact that the EC feed is the clarified supernatant from the upstream mixing–settling unit. While COD removal was high and is reported throughout Section 3, we did not quantify dissolved metals or sulfate at the EC outlet; therefore, regulatory compliance for heavy metals or sulfate cannot be claimed based on the present dataset. As documented in the co-treatment optimization at the same AMD source, the mixing–settling step partitions Fe and P into sludge, yet residual sulfate and traces of iron can persist in the clarified phase, and post-treatments are required to meet discharge or reuse criteria.

3.6. Energy–Removal Trade-Off and Diminishing Returns

The results in Table 4 show a clear Pareto-like frontier between %COD and specific energy (kWh·kg−1 COD). At moderate current densities and high S/V, COD removals remain high while energy remains comparatively low; however, beyond the upper removal band, marginal removal improvements come at a disproportionate energy cost, evidencing a diminishing-returns threshold. This observation is coherent with our ANOVA hierarchy (energy dominated by current density; removal sensitive to S/V) and supports selecting an operating envelope that favors moderate J, high S/V and intermediate contact times.

3.7. Reproducibility and Scope

The experimental design and QA/QC protocol ensured repeatability at the design-point level and provided a transparent account of variability through residuals, lack-of-fit testing, and influence diagnostics. We reiterate that experiments were performed under ambient, atmospheric conditions; temperature was not monitored or controlled and, therefore, was not incorporated as a blocking or model factor. As such, the energy model shows robust reproducibility across the tested envelope, whereas COD removal predictions should be interpreted within the local matrix and operating context.

4. Discussion

The results of this study, with COD removal exceeding 90% and energy consumption ranging from 0.54 to 2.73 kWh/kg COD, fall within the values reported in the literature for various wastewater types and electrocoagulation configurations. Model diagnostics (normality, Cook’s D, DFFITS) evidenced no outliers and no undue influence; the largest Cook’s distance (0.49) and DFFITS (2.0) remained below reference thresholds. The Box–Cox plot recommended no power transform (λ = 1), and lack-of-fit tests were non-significant. The lower predicted R2 for COD thus stems primarily from the high-leverage structure of the BBD with few center replicates and the narrow dynamic range of %COD. We therefore use the COD model for local optimization inside the design space and refrain from extrapolation. Future work will increase center-point replication and/or add fold-over runs to reduce leverage and enhance predictive precision.
In the context of literature benchmarks expressed per volume, our 0.13–0.76 kWh·m−3 envelope sits at the low-to-moderate end. For oil-in-water emulsions, Tir and Moulai-Mostefa [49] reported 25 kWh·m−3, markedly higher than our figures—differences consistent with matrix complexity and reactor configuration. For restaurant wastewater, Chen et al. [50] obtained 0.25–1.07 kWh·m−3 with >94% oil and grease removal, overlapping the upper half of our volumetric band and supporting the benefit of optimizing current density and contact time under moderate-conductivity feeds.
When comparisons are reported per mass of COD removed, pharmaceutical effluents treated by Ren et al. [51] required 0.73–8.2 kWh·kgCOD−1, reflecting matrix-dependent sensitivity to current density, electrode type, and electrolyte addition; our 0.54–2.73 kWh·kgCOD−1 falls in the lower segment of that span. On a volumetric basis, Dalvand et al. [52] reported 1.30–3.21 kWh·m−3 for reactive dye effluents—above our band—underlining that careful balancing of current intensity and treatment time is essential to avoid excessive energy demand. Likewise, Akkaya [53] found 31.2 kWh·m−3 for petroleum wastewater with >90% phenol removal, and Ye et al. [54] reported 6.28 kWh·m−3 for Ni-EDTA wastewater—both substantially above our values and indicative of recalcitrant-matrix penalties. For highly loaded textile wastewater, Un and Aytac [55] observed energy up to 63.9 kWh·kgCOD−1, an order of magnitude above our upper bound, again consistent with severe organic/color loads and stringent treatment targets.
Mechanistically, the coaxial configuration and the concurrent control of current density (1–3 A·m−2) and S/V (180–300 m2·m−3) likely promote efficient coagulant generation and contact, providing an electrochemical environment that sustains high removals at practical energy demand—an outcome aligned with prior analyses emphasizing the importance of electrode configuration and scale-appropriate hydrodynamics [56,57]. As theory and prior reports caution, current density drives energy upward faster than removal improves, and excessive contact times can foster re-dissolution or floc destabilization [58,59]. Our data mirror these trends: extreme settings (current density ≳ 2.5 A·m−2 at high S/V) exceed 90% COD removal but coincide with energy peaks of 2.73 kWh·kgCOD−1 (0.76 kWh·m−3), whereas moderate current density at high S/V delivers removals ≥80–86% with 0.54–1.00 kWh·kgCOD−1 (0.13–0.36 kWh·m−3). The desirability-based compromise (J = 2.42 A·m−2, S/V = 300 m2·m−3, t = 60 min; desirability = 0.922) follows the multi-objective optimization rationale proposed by Naje et al. [60] to reconcile performance and energy for sustainable EC operation.
Finally, because our EC stage treats the clarified supernatant downstream of mixing–settling, short-term AMD variability is buffered upstream by Fe-driven precipitation/co-precipitation. Consistently, the energy model—dominated by current density (and cell voltage)—exhibited tight goodness-of-fit and cross-validation, suggesting robust transferability across AMD sources with comparable conductivity and reactor geometry. By contrast, %COD removal is inherently site-specific, as it depends on the residual organic load and coagulant demand after pre-treatment (AMD pH and Fe load, Fe–P ratio, quality of clarified liquor). Thus, while the factor hierarchy reported here (S/V for removal; current density for energy) is general, numerical optima should not be presumed universal. For other AMD sources, we recommend a two-step protocol: (i) tune the AMD–MWW ratio to hit the Fe–P window used in co-treatment—ensuring a low-turbidity EC feed—and (ii) re-calibrate the BBD locally over the same current density–S/V–time space to capture matrix-dependent shifts in removal while keeping the energy-model structure unchanged. This approach balances robustness (energy) with caution in generalization (removal).
Tir and Moulai-Mostefa [49] analyzed an oil–water emulsion (using Al–SS electrodes in a batch reactor) and achieved up to 89% COD removal with an energy consumption of 25 kWh/m3. Although expressed per volume rather than per mass of contaminant removed, this figure is comparable to our study when considering the different nature of the effluent and the higher organic complexity inherent to the mixture of municipal wastewater and acid waters addressed in this research. Similarly, Chen et al. [50] reported energy consumption ranging from 0.25 to 1.07 kWh/m3 and oil and grease removal above 94% for restaurant wastewater, demonstrating that proper optimization of current density and contact time can maintain energy consumption at moderate levels, consistent with the medium current density conditions (1–2 A/m2) observed in our study.
In more complex treatments, such as pharmaceutical effluents, the energy consumption values ranging from 0.73 to 8.2 kWh/kg COD, reported by Ren et al. [51], highlight the high sensitivity of process parameters such as current density, electrode type, and electrolyte salt addition. In our case, the strategy of combining moderate current densities with a high surface-to-volume ratio (300 m2/m3) allowed most experiments to remain in the lower consumption range (approximately 0.54–1 kWh/kg COD) while maintaining removals above 80%. This performance aligns with the findings of Dalvand et al. [52], who reported COD removal above 80% with energy consumption ranging from 1.30 to 3.21 kWh/m3 for reactive dye effluent treatment, emphasizing the need for a careful balance between current intensity and treatment time to avoid excessive energy consumption. Similarly, Akkaya [53] found an energy consumption of 31.2 kWh/m3 for petroleum wastewater, with phenol removal exceeding 90%, demonstrating that for effluents containing recalcitrant compounds, parameter adjustment must be even stricter to prevent excessive energy demand.
Studies focused on heavy metal removal or specific contaminants report significantly higher energy consumption. Ye et al. [54] (for Ni-EDTA wastewater) and Un and Aytac [55] (for textile wastewater with very high organic loads) reported values of 6.28 kWh/m3 and up to 63.9 kWh/kg COD, respectively, reflecting the inherent complexity of contaminants and the potential need for higher current densities or longer treatment times. In this regard, our results remain within the most favorable range of energy consumption, while maintaining high COD removal efficiency. This suggests that the coaxial configuration and simultaneous control of current density (1–3 A/m2) and surface-to-volume ratio (180–300 m2/m3) provide an efficient electrochemical environment, as proposed by references who emphasize the importance of proper electrode configuration and scaling to maximize the formation of electrochemical coagulants and contact with contaminants.
Theoretically, current density can lead to a rapid increase in consumption without proportional improvements in removal, while excessive contact times may induce re-dissolution phenomena or floc destabilization. Our findings are consistent with these trends—higher current densities increase energy faster than removal, and extended times can reduce removal—although the underlying mechanisms were not directly probed, showing that although extreme conditions (current densities ≥2.5 A/m2 and high S/V ratios) achieve removals above 90%, they also result in energy peaks of up to 2.73 kWh/kg COD. Therefore, the optimal solution (desirability 0.922), with a current density of 2.42 A/m2, S/V ratio of 300 m2/m3, and contact time of 60 min, aligns with the strategy described by Naje et al. [60] for multi-objective optimization approaches to implement sustainable and economically viable electrocoagulation processes for various types of wastewaters.
Because the EC unit in our train treats the clarified supernatant of a mixing–settling step, short-term variations in raw AMD are partly absorbed upstream by Fe-driven precipitation and co-precipitation. Consistent with this layout, the energy model proved highly robust: energy demand was dominated by current density (and cell voltage), yielding tight goodness-of-fit and cross-validation, which is expected to hold across AMD sources with comparable conductivity ranges and reactor geometry. By contrast, the COD removal model is inherently site-specific: removal reflects the residual organic load and coagulant demand after pre-treatment, which depend on AMD pH and Fe load, Fe–P ratio, and the quality of the clarified liquor. Therefore, while the factor hierarchy we report (S/V for removal; current densities for energy) is mechanistically general, the numerical optima should not be assumed universal. For other AMD sources we recommend a two-step transfer protocol: (i) tune the AMD–MWW ratio to hit the Fe–P window identified during co-treatment (to stabilize pH and residual Fe in the supernatant), verify that the EC feed remains low-turbidity; and (ii) re-calibrate the BBD locally over the same design space (current densities, S/V, time) to capture matrix-dependent shifts in removal while keeping the energy-model structure unchanged. This approach balances robustness (energy) with caution in generalization (removal).

5. Conclusions

The present study demonstrates the high efficiency of electrocoagulation for the removal of Chemical Oxygen Demand (COD) in wastewater, achieving up to 91.13% elimination with an energy consumption of 2.73 kWh/kg COD. This result confirms the effectiveness of the process but also highlights the need to carefully balance removal efficiency and energy consumption. Analysis of variance (ANOVA) emphasizes the significance of current density and the surface-to-volume ratio (S/V) in both responses, with S/V being the most influential factor in COD removal variability, while current density has a greater impact on energy consumption. Additionally, significant interactions were observed (current density, S/V, and current density–contact time), demonstrating the impossibility of optimizing each parameter in isolation.
Regarding the prediction models, the energy consumption model exhibited outstanding fit and predictive capability (R2 = 0.9989), in contrast to the COD removal model, which, although acceptable in fit (R2 = 0.8798), showed lower generalization ability (predicted R2 = 0.53). Overall, these findings underscore the importance of establishing a trade-off between removal efficiency and energy consumption, making it essential to identify optimal operating conditions that ensure the economic and environmental feasibility of electrocoagulation for wastewater treatment.

Supplementary Materials

The following supporting information can be downloaded at https://www.mdpi.com/article/10.3390/app151910452/s1, Figure S1: Diagnostic charts, Figure S2: Diagnostic charts.

Author Contributions

Conceptualization, K.Q.-R. and E.M.-I.; methodology, A.P.-N.; software, K.Q.-R. and E.M.-I.; investigation, C.G.-C., L.C.-V., and C.R.-A.; writing—original draft preparation, J.R.-R.; writing—review and editing, Y.R.-B.; visualization, A.P.-N.; supervision, A.P.-N. All authors have read and agreed to the published version of the manuscript.

Funding

This research received no external funding.

Data Availability Statement

The original contributions presented in the study are included in the article; further inquiries can be directed to the author.

Acknowledgments

We sincerely thank Alberto Morales Vargas, Ricardo Gutiérrez Tirado, and Roberto Solís Farfán for their valuable contributions and support throughout the development of this research. The authors express their gratitude to Carmen Barreto Pio for the facility to coaxial electrocoagulation equipment funded by CONCYTEC-PROCIENCIA, in the framework of the call E041-01 with Award Contract No. 178-2018-FONDECYT-BM-IADT-AV and to the laboratory of the Faculty of Environmental Engineering and Natural Resources of the Universidad Nacional del Callao.

Conflicts of Interest

The authors declare no conflicts of interest.

References

  1. Khosa, M.K.; Jamal, M.A.; Hussain, A.; Muneer, M.; Zia, K.M.; Hafeez, S. Efficiency of aluminum and iron electrodes for the removal of heavy metals [(Ni (II), Pb (II), Cd (II)] by electrocoagulation method. J. Korean Chem. Soc. 2013, 57, 316–321. [Google Scholar] [CrossRef]
  2. Stylianou, M.; Montel, E.; Zissimos, A.; Christoforou, I.; Dermentzis, K.; Agapiou, A. Removal of toxic metals and anions from acid mine drainage (AMD) by electrocoagulation: The case of North Mathiatis open cast mine. Sustain. Chem. Pharm. 2022, 29, 100737. [Google Scholar] [CrossRef]
  3. Mamelkina, M.A.; Cotillas, S.; Lacasa, E.; Sáez, C.; Tuunila, R.; Sillanpää, M.; Häkkinen, A.; Rodrigo, M.A. Removal of sulfate from mining waters by electrocoagulation. Sep. Purif. Technol. 2017, 182, 87–93. [Google Scholar] [CrossRef]
  4. Felipe, E.C.B.; Batista, K.A.; Ladeira, A.C.Q. Recovery of rare earth elements from acid mine drainage by ion exchange. Environ. Technol. 2021, 42, 2721–2732. [Google Scholar] [CrossRef] [PubMed]
  5. Nkuna, C.N.; Sadiku, E.R.; Perry, G.; Oboirien, B.; Dludlu, M.K.; Thompson, C. Treatment of acid mine drainage and chromium (VI) removal using synthesised chitosan composites blended with kenaf fibre and γ-Fe2O3 nanoparticles. Int. J. Environ. Sci. Technol. 2023, 20, 3599–3612. [Google Scholar] [CrossRef]
  6. Zendelska, A.; Golomeova, M.; Golomeov, B.; Krstev, B. Removal of zinc ions from acid aqueous solutions and acid mine drainage using zeolite-bearing tuff. Mine Water Environ. 2019, 38, 187–196. [Google Scholar] [CrossRef]
  7. Gugushe, A.S.; Nqombolo, A.; Nomngongo, P.N. Application of response surface methodology and desirability function in the optimization of adsorptive remediation of arsenic from acid mine drainage using magnetic nanocomposite: Equilibrium studies and application to real samples. Molecules 2019, 24, 1792. [Google Scholar] [CrossRef]
  8. Pino, L.; Vargas, C.; Schwarz, A.; Borquez, R. Influence of operating conditions on the removal of metals and sulfate from copper acid mine drainage by nanofiltration. Chem. Eng. J. 2018, 345, 114–125. [Google Scholar] [CrossRef]
  9. Ambiado, K.; Bustos, C.; Schwarz, A.; Bórquez, R. Membrane technology applied to acid mine drainage from copper mining. Water Sci. Technol. 2017, 75, 705–715. [Google Scholar] [CrossRef]
  10. Pramanik, B.K.; Shu, L.; Jegatheesan, J.; Shah, K.; Haque, N.; Bhuiyan, M.A. Rejection of rare earth elements from a simulated acid mine drainage using forward osmosis: The role of membrane orientation, solution pH, and temperature variation. Process Saf. Environ. Prot. 2019, 126, 53–59. [Google Scholar] [CrossRef]
  11. Buzzi, D.C.; Viegas, L.S.; Rodrigues, M.A.S.; Bernardes, A.M.; Tenório, J.A.S. Water recovery from acid mine drainage by electrodialysis. Miner. Eng. 2013, 40, 82–89. [Google Scholar] [CrossRef]
  12. Gao, H.; Wang, S.; Xu, D.; Wang, X.; Zhong, Q.; Zhong, Y.; Li, J.; Cao, W. Study of DC magnetron sputtered Nb films. Crystals 2021, 12, 31. [Google Scholar] [CrossRef]
  13. Bwapwa, J.K.; Jaiyeola, A.T.; Chetty, R. Bioremediation of acid mine drainage using algae strains: A review. S. Afr. J. Chem. Eng. 2017, 24, 62–70. [Google Scholar] [CrossRef]
  14. Oncel, M.S.; Muhcu, A.; Demirbas, E.; Kobya, M. A comparative study of chemical precipitation and electrocoagulation for treatment of coal acid drainage wastewater. J. Environ. Chem. Eng. 2013, 1, 989–995. [Google Scholar] [CrossRef]
  15. Roccaro, P. Treatment processes for municipal wastewater reclamation: The challenges of emerging contaminants and direct potable reuse. Curr. Opin. Environ. Sci. Health 2018, 2, 46–54. [Google Scholar] [CrossRef]
  16. Petrie, B.; Barden, R.; Kasprzyk-Hordern, B. A review on emerging contaminants in wastewaters and the environment: Current knowledge, understudied areas and recommendations for future monitoring. Water Res. 2015, 72, 3–27. [Google Scholar] [CrossRef] [PubMed]
  17. Vélez-Pérez, L.S.; Ramirez-Nava, J.; Hernández-Flores, G.; Talavera-Mendoza, O.; Escamilla-Alvarado, C.; Poggi-Varaldo, H.M.; Solorza-Feria, O.; López-Díaz, J.A. Industrial acid mine drainage and municipal wastewater co-treatment by dual-chamber microbial fuel cells. Int. J. Hydrogen Energy 2020, 45, 13757–13766. [Google Scholar] [CrossRef]
  18. Hughes, T.A.; Gray, N.F.; Sánchez Guillamón, O. Removal of Metals and Acidity from Acid Mine Drainage Using Liquid and Dried Digested Sewage Sludge and Cattle Slurry. Mine Water Environ. 2013, 32, 108–120. [Google Scholar] [CrossRef]
  19. Strosnider, W.H.; Nairn, R.W.; Peer, R.A.M.; Winfrey, B.K. Passive co-treatment of Zn-rich acid mine drainage and raw municipal wastewater. J. Geochem. Explor. 2013, 125, 110–116. [Google Scholar] [CrossRef]
  20. Smyntek, P.M.; Chastel, J.; Peer, R.A.M.; Anthony, E.; McCloskey, J.; Bach, E.; Wagner, R.C.; Bandstra, J.Z.; Strosnider, W.H.J. Assessment of sulphate and iron reduction rates during reactor start-up for passive anaerobic co-treatment of acid mine drainage and sewage. Geochem. Explor. Environ. Anal. 2018, 18, 76–84. [Google Scholar] [CrossRef]
  21. Masindi, V.; Foteinis, S.; Chatzisymeon, E. Co-treatment of acid mine drainage and municipal wastewater effluents: Emphasis on the fate and partitioning of chemical contaminants. J. Hazard. Mater. 2022, 421, 126677. [Google Scholar] [CrossRef]
  22. Johnson, K.L.; Younger, P.L. The co-treatment of sewage and mine waters in aerobic wetlands. Eng. Geol. 2006, 85, 53–61. [Google Scholar] [CrossRef]
  23. Deng, D.; Lin, L.S. Two-stage combined treatment of acid mine drainage and municipal wastewater. Water Sci. Technol. 2013, 67, 1000–1007. [Google Scholar] [CrossRef] [PubMed]
  24. Ruihua, L.; Lin, Z.; Tao, T.; Bo, L. Phosphorus removal performance of acid mine drainage from wastewater. J. Hazard. Mater. 2011, 190, 669–676. [Google Scholar] [CrossRef]
  25. Sánchez-Andrea, I.; Triana, D.; Sanz, J.L. Bioremediation of acid mine drainage coupled with domestic wastewater treatment. Water Sci. Technol. 2012, 66, 2425–2431. [Google Scholar] [CrossRef] [PubMed]
  26. Yang, Q.; Wang, X.; Luo, W.; Sun, J.; Xu, Q.; Chen, F.; Zhao, J.; Wang, S.; Yao, F.; Wang, D. Effectiveness and mechanisms of phosphate adsorption on iron-modified biochars derived from waste activated sludge. Bioresour. Technol. 2018, 247, 537–544. [Google Scholar] [CrossRef]
  27. Abdollahi, J.; Moghaddam, M.R.A.; Habibzadeh, S. The role of the current waveform in mitigating passivation and enhancing electrocoagulation performance: A critical review. Chemosphere 2023, 312, 137212. [Google Scholar] [CrossRef]
  28. Tegladza, I.D.; Xu, Q.; Xu, K.; Lv, G.; Lu, J. Electrocoagulation processes: A general review about role of electro-generated flocs in pollutant removal. Process Saf. Environ. Prot. 2021, 146, 169–189. [Google Scholar] [CrossRef]
  29. Lu, J.; Zhang, P.; Li, J. Electrocoagulation technology for water purification: An update review on reactor design and some newly concerned pollutants removal. J. Environ. Manag. 2021, 296, 113259. [Google Scholar] [CrossRef]
  30. Ismail, M.M.; Erdemir, D.; Dincer, I. Hydrogen production with a novel coaxial cylindrical electrolyser: A CFD study. Int. J. Thermofluids 2024, 24, 100850. [Google Scholar] [CrossRef]
  31. Wang, J.-G.; Yang, Y.; Huang, Z.-H.; Kang, F. Coaxial carbon nanofibers/MnO2 nanocomposites as freestanding electrodes for high-performance electrochemical capacitors. Electrochim. Acta 2011, 56, 9240–9247. [Google Scholar] [CrossRef]
  32. Karajic, A.; Reculusa, S.; Heim, M.; Garrigue, P.; Ravaine, S.; Mano, N.; Kuhn, A. Bottom-up generation of miniaturized coaxial double electrodes with tunable porosity. Adv. Mater. Interfaces 2015, 2, 1–5. [Google Scholar] [CrossRef]
  33. Shemer, H.; Semiat, R. Comparing the effects of Cu-Ti/RuO2-IrO2 electrode configuration on the electro-reduction of nitrate. Water Sci. Technol. 2022, 86, 1642–1652. [Google Scholar] [CrossRef]
  34. Kupriashov, A.V.; Shestakov, I.Y. Influence of electrode arrangement method on specific energy consumption and productivity in electrosynthesis of fine graphite powder. Int. J. Adv. Manuf. Technol. 2022, 119, 7615–7628. [Google Scholar] [CrossRef]
  35. Li, Y.; Wang, S.; Dong, R.; Li, X. A large cathode surface area promotes electromethanogenesis at a proper external voltage in a single coaxial microbial electrolysis cell. Sci. Total Environ. 2023, 868, 161721. [Google Scholar] [CrossRef] [PubMed]
  36. Muddasar, M.; Liaquat, R.; Rahman, M.Z.U.; Khoja, A.H.; Aslam, A.; Basit, A. Coaxial microbial electrolysis cell for cost-effective bioenergy production and wastewater treatment of potato industry effluent. J. Chem. Technol. Biotechnol. 2023, 98, 2203–2213. [Google Scholar] [CrossRef]
  37. Wang, S.; Geng, Z.; Bi, S.; Wang, Y.; Gao, Z.; Jin, L.; Zhang, C. Recent advances and future prospects on Ni3S2-Based electrocatalysts for efficient alkaline water electrolysis. Green. Energy Environ. 2024, 9, 659–683. [Google Scholar] [CrossRef]
  38. Moussa, D.T.; El-Naas, M.H.; Nasser, M.; Al-Marri, M.J. A comprehensive review of electrocoagulation for water treatment: Potentials and challenges. J. Environ. Manag. 2017, 186, 24–41. [Google Scholar] [CrossRef]
  39. Hu, C.; Sun, J.; Wang, S.; Liu, R.; Liu, H.; Qu, J. Enhanced efficiency in HA removal by electrocoagulation through optimizing flocs properties: Role of current density and pH. Sep. Purif. Technol. 2017, 175, 248–254. [Google Scholar] [CrossRef]
  40. Deghles, A.; Kurt, U. Treatment of tannery wastewater by a hybrid electrocoagulation/electrodialysis process. Chem. Eng. Process Process Intensif. 2016, 104, 43–50. [Google Scholar] [CrossRef]
  41. Ji, M.; Jiang, X.; Wang, F. A mechanistic approach and response surface optimization of the removal of oil and grease from restaurant wastewater by electrocoagulation and electroflotation. Desalin Water Treat. 2015, 55, 2044–2052. [Google Scholar] [CrossRef]
  42. Holt, P.K.; Barton, G.W.; Mitchell, C.A. The future for electrocoagulation as a localised water treatment technology. Chemosphere 2005, 59, 355–367. [Google Scholar] [CrossRef] [PubMed]
  43. Bravo-Toledo, L.; Virú-Vásquez, P.; Rodriguez-Flores, R.; Sierra-Flores, L.; Flores-Salinas, J.; Tineo-Cordova, F.; Palomino-Vildoso, R.; Madueño-Sulca, C.; Rios-Varillas de Oscanoa, C.; Pilco-Nuñez, A. Sustainability Prediction by Evaluating the Emergy of a Co-Treatment System for Municipal Wastewater and Acidic Water Using Intermittent Electrocoagulation. Water 2024, 16, 3081. [Google Scholar] [CrossRef]
  44. Coeuret, F. Introduccion a la Ingenieria Electroquimica; Editorial Reverte S.A: Ciudad de México, Mexico, 1992. [Google Scholar]
  45. Barreto-Pio, C.; Bravo-Toledo, L.; Virú-Vásquez, P.; Borda-Contreras, A.; Zarate-Sarapura, E.; Pilco, A. Optimization Applying Response Surface Methodology in the Co-treatment of Urban and Acid Wastewater from the Quiulacocha Lagoon, Pasco (Peru). Environ. Res. Eng. Manag. 2023, 79, 90–109. [Google Scholar] [CrossRef]
  46. Masindi, V.; Gitari, M.W.; Tutu, H.; De Beer, M.; Nekhwevha, N. Neutralization and attenuation of metal species in acid mine drainage and mine leachates using magnesite: A batch experimental approach. In Proceedings of the An Interdisciplinary Response to Mine Water Challenges—The Proceedings of the 12th IMWA Congress, Xuzhou, China, 18–22 August 2014; pp. 640–644. [Google Scholar]
  47. Montgomery, D.C. Design and Analysis of Experiments; John Wiley & Sons: Hoboken, NJ, USA, 2017. [Google Scholar]
  48. Derringer, G.; Suich, R. Simultaneous optimization of several response variables. J. Qual. Technol. 1980, 12, 214–219. [Google Scholar] [CrossRef]
  49. Tir, M.; Moulai-Mostefa, N. Optimization of oil removal from oily wastewater by electrocoagulation using response surface method. J. Hazard. Mater. 2008, 158, 107–115. [Google Scholar] [CrossRef]
  50. Chen, X.; Chen, G.; Yue, P.L. Separation of pollutants from restaurant wastewater by electrocoagulation. Sep. Purif. Technol. 2000, 19, 65–76. [Google Scholar] [CrossRef]
  51. Ren, M.; Song, Y.; Xiao, S.; Zeng, P.; Peng, J. Treatment of berberine hydrochloride wastewater by using pulse electro-coagulation process with Fe electrode. Chem. Eng. J. 2011, 169, 84–90. [Google Scholar] [CrossRef]
  52. Dalvand, A.; Gholami, M.; Joneidi, A.; Mahmoodi, N.M. Dye removal, energy consumption and operating cost of electrocoagulation of textile wastewater as a clean process. Clean–Soil Air Water 2011, 39, 665–672. [Google Scholar] [CrossRef]
  53. Akkaya, G.K. Treatment of petroleum wastewater by electrocoagulation using scrap perforated (Fe-anode) and plate (Al and Fe-cathode) metals: Optimization of operating parameters by RSM. Chem. Eng. Res. Des. 2022, 187, 261–275. [Google Scholar] [CrossRef]
  54. Ye, X.; Zhang, J.; Zhang, Y.; Lv, Y.; Dou, R.; Wen, S.; Li, L.; Chen, Y.; Hu, Y. Treatment of Ni-EDTA containing wastewater by electrocoagulation using iron scraps packed-bed anode. Chemosphere 2016, 164, 304–313. [Google Scholar] [CrossRef] [PubMed]
  55. Un, U.T.; Aytac, E. Electrocoagulation in a packed bed reactor-complete treatment of color and cod from real textile wastewater. J. Environ. Manag. 2013, 123, 113–119. [Google Scholar] [CrossRef] [PubMed]
  56. Hashim, K.S.; Shaw, A.; Al Khaddar, R.; Pedrola, M.O.; Phipps, D. Iron removal, energy consumption and operating cost of electrocoagulation of drinking water using a new flow column reactor. J. Environ. Manag. 2017, 189, 98–108. [Google Scholar] [CrossRef]
  57. Kambuyi, T.N.; Bejjany, B.; Lekhlif, B.; Mellouk, H.; Digua, K.; Dani, A. Design of a continuous-flow single-channel reactor using optimal experimental data from batch reactor for turbidity removal by electrocoagulation. J. Environ. Chem. Eng. 2021, 9, 104651. [Google Scholar] [CrossRef]
  58. Cheballah, K.; Sahmoune, A.; Messaoudi, K.; Drouiche, N.; Lounici, H. Simultaneous removal of hexavalent chromium and COD from industrial wastewater by bipolar electrocoagulation. Chem. Eng. Process Process Intensif. 2015, 96, 94–99. [Google Scholar] [CrossRef]
  59. Naje, A.S.; Chelliapan, S.; Zakaria, Z.; Abbas, S.A. Electrocoagulation using a rotated anode: A novel reactor design for textile wastewater treatment. J. Environ. Manag. 2016, 176, 34–44. [Google Scholar] [CrossRef]
  60. Naje, A.S.; Ajeel, M.A.; Alaba, P.A.; Chelliapan, S. Treatment of textile wastewater using a novel electrocoagulation reactor design. Wastewater Water Qual. 2018, 111–123. [Google Scholar]
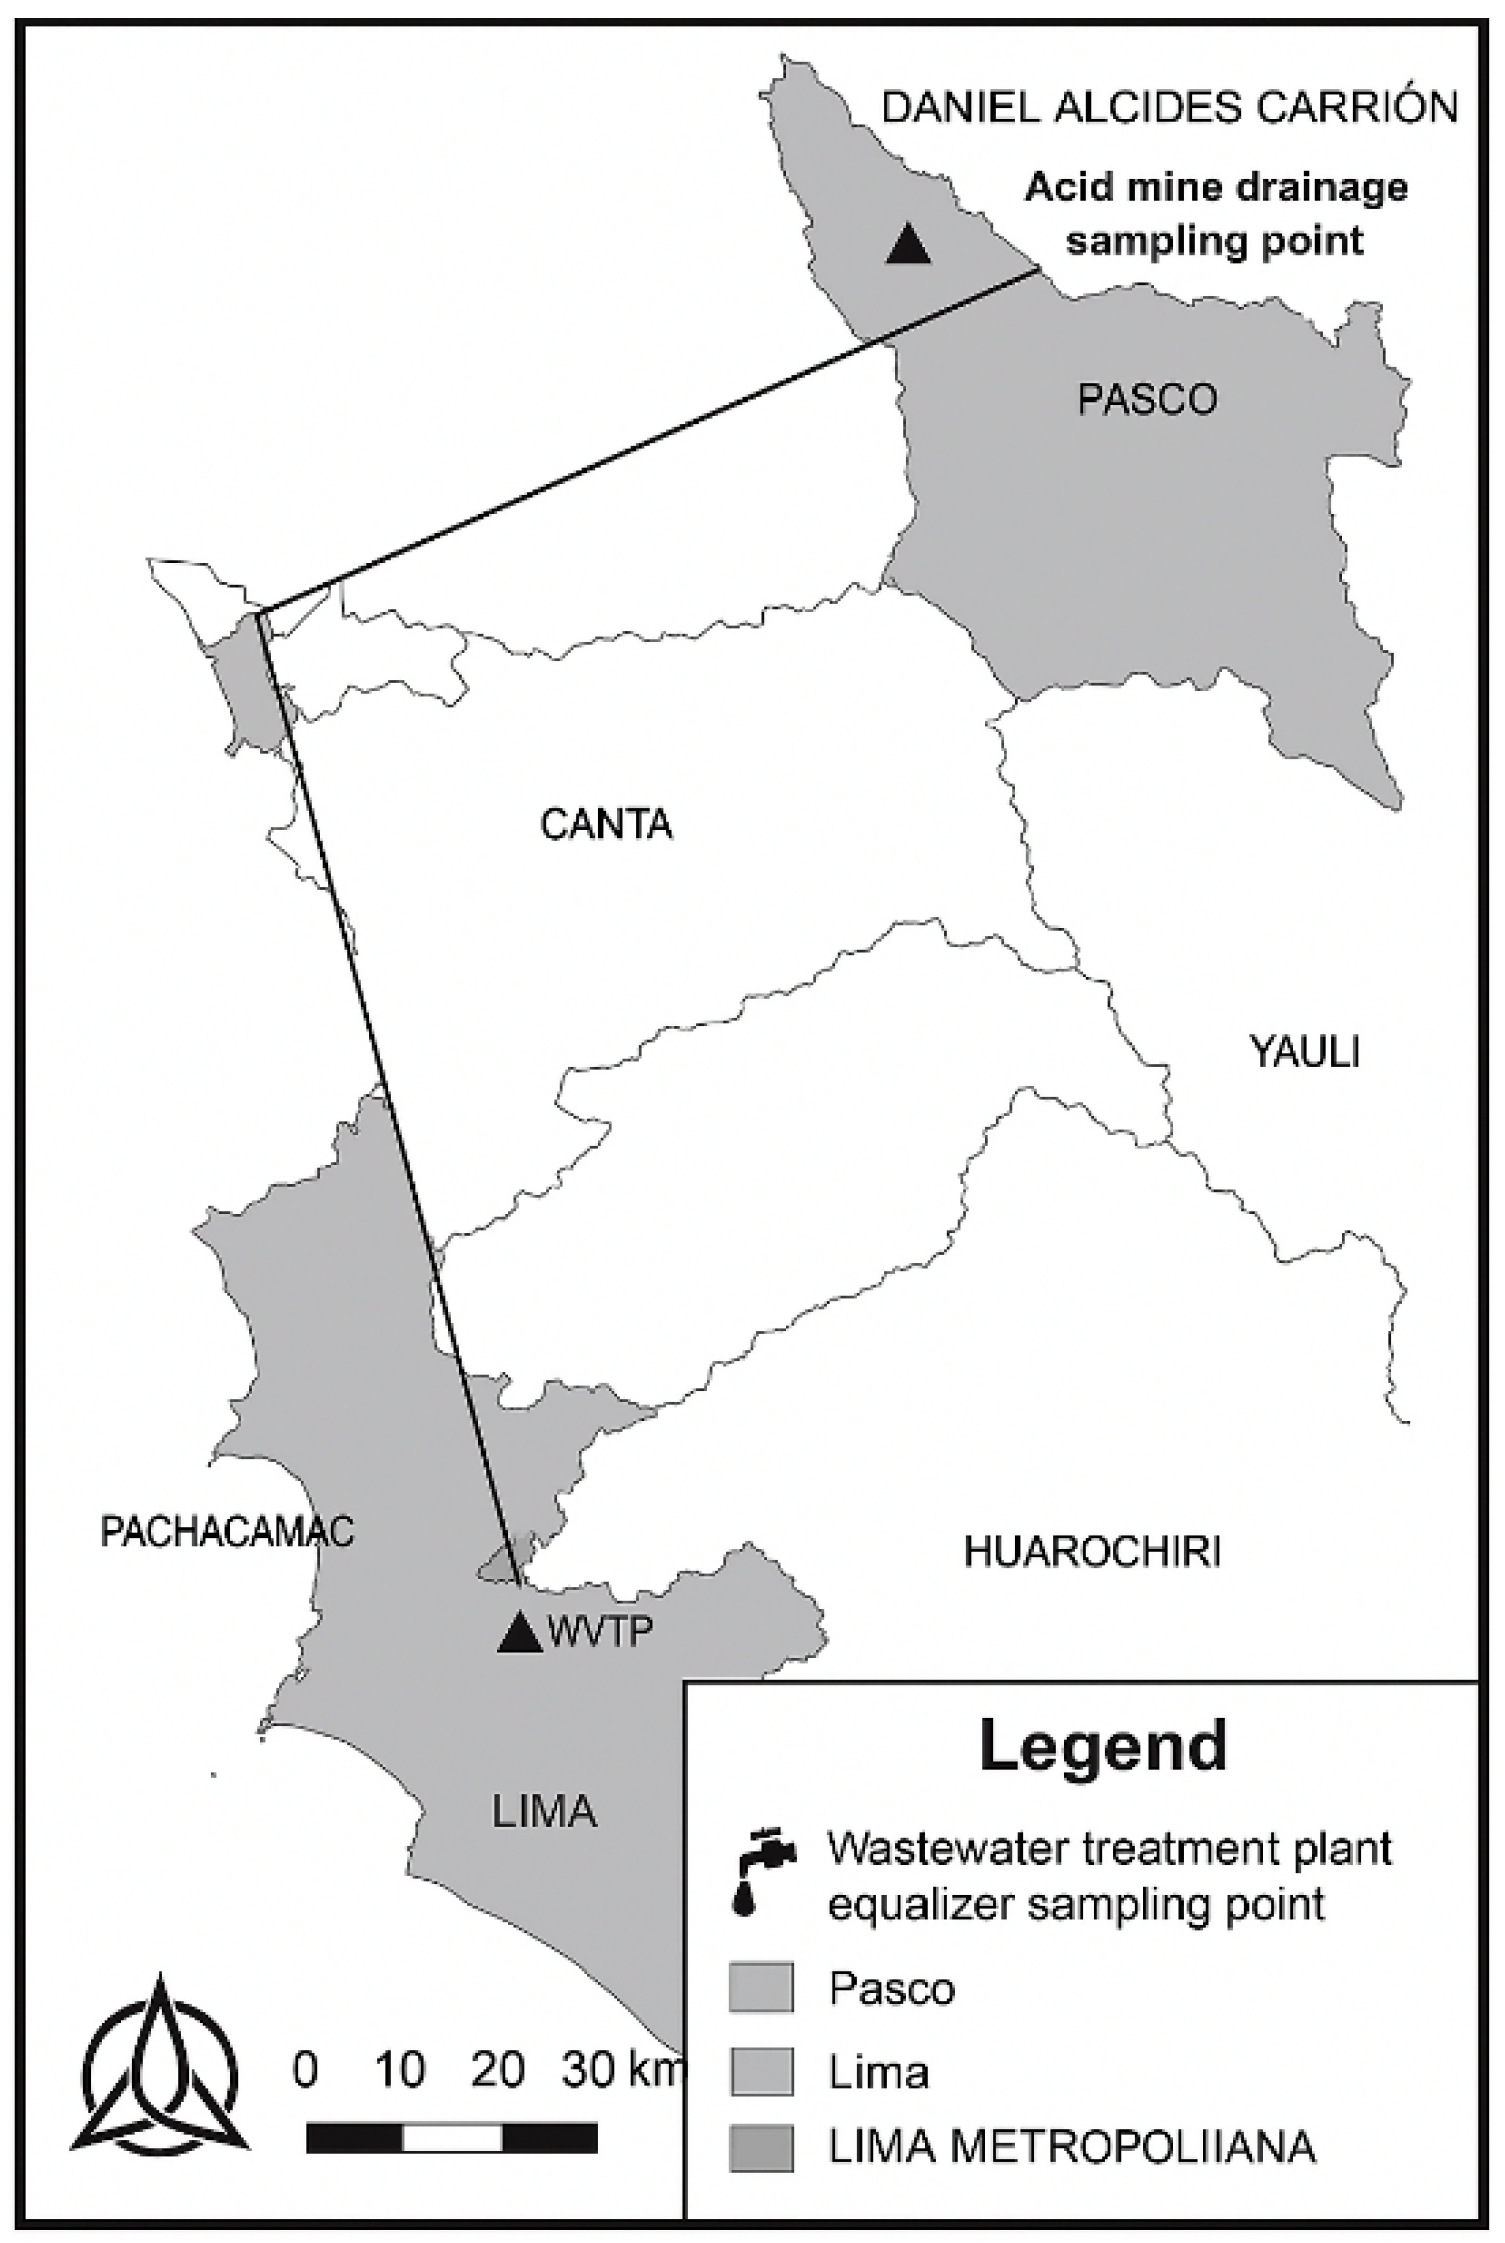
Figure 1. Location map of the WWTP and AMD.
Applsci 15 10452 g001
Figure 2. Location map of Lake Quiulacocha.
Applsci 15 10452 g002
Figure 3. Coaxial electrodes. (a) General diagram of material transfer correlations between the walls of coaxial cylinders; (b) 3D design of the electrodes and (c) Image of the electrodes in experimental tests.
Applsci 15 10452 g003
Figure 5. Experimental sequence and the electrocoagulation system as experimental unit.
Applsci 15 10452 g005
Figure 6. Effect of each study factor on %COD (ac). The black solid line represents the mean prediction of the model for COD removal (%). The blue dashed lines indicate the confidence intervals (95%). Black squares (■) denote the extreme factor levels tested in the design, while brown/red circles (●) represent the experimental data points obtained. The red dashed lines mark the central point of the design, used to compare predicted and experimental values.
Applsci 15 10452 g006
Figure 7. Contour plots of study factors and %COD. (a) Effect of current density (A/m2) and surface-to-volume ratio (S/V, m2/m3) on COD removal; (b) Effect of surface-to-volume ratio (S/V, m2/m3) and contact time (min) on COD removal. The color scale (from blue to yellow) indicates the predicted level of COD removal, with blue representing lower values and yellow higher values. Red circles on the axes represent the experimental design points, while the central red dot denotes the center point of the design. Black contour lines show the predicted response surfaces. The main driver of energy demand is current density, with a steep rise at higher levels. When these settings are combined with the largest S/V, energy consumption increases disproportionately relative to the incremental removal observed in Section 3.2.1. Together with Table 4, this indicates a “knee” in the energy–removal space beyond which additional energy input yields diminishing returns in %COD.
Applsci 15 10452 g007
Figure 8. Effect of the study factors on the energy consumed (ac). The solid black line shows the model-predicted mean trend, while the blue dashed lines indicate the 95% confidence intervals. Black squares (■) correspond to the extreme levels of each factor tested, red circles (●) represent experimental data points, and the red dashed line indicates the design center point.
Applsci 15 10452 g008
Figure 9. Two-dimensional contour plots of the study factors on energy consumption. (a) Effect of current density (A/m2) and contact time (min) on energy consumption; (b) Effect of surface-to-volume ratio (S/V, m2/m3) and contact time (min) on energy consumption. He color gradient (from blue to orange) represents the predicted energy consumption, with blue indicating lower values and orange higher values. Red circles on the axes correspond to experimental design points, while the central red dot denotes the center point of the design. Black contour lines represent the response surface prediction.
Applsci 15 10452 g009
Figure 10. Plots of residuals and predicted vs. observed values for COD removal (a,b) and energy consumption (c,d), where the clustering of colored symbols along the diagonal line indicates good agreement between experimental and predicted values.
Applsci 15 10452 g010
Figure 11. Multi-objective optimization (desirability) diagram for COD removal and energy consumption of the electrocoagulation process. Red circles indicate the factor levels selected in the optimal solution (current density, S/V ratio, and contact time). Blue circles represent the corresponding predicted responses: COD removal (%) and energy consumption (kWh/kg COD).
Applsci 15 10452 g011
Table 1. Characterization of MWW.
ParameterUnitValue
pHpH unit5.70
TurbidezNTU3.60
ConductivityμS/cm2730.0
BOD5mg/L151.20
CODmg/L255.50
Sulfatesmg/L1542.8
Total Phosphorusmg/L8.50
Table 2. Characterization of AMD.
ParameterUnitValue
pHpH unit1.74
Turbidity NTU23.07
Conductivity μS/cm1625.00
Antimonymg/L0.0050
Arsenic mg/L0.004
Bariummg/L0.0008
Cadmiummg/L0.28450
Chromiummg/L0.0040
Total Ironmg/L984.8
Nickelmg/L0.2075
Leadmg/L0.0010
Seleniummg/L0.004
Thalliummg/L0.0006
Zincmg/L195.8
Table 3. Factors and levels of the Box–Behnken design.
FactorsUnitsMinimum (−1)Medium (0)Maximum (+1)
Current densityA/m2123
Ratio S/Vm2/m3180240300
Contact time min607590
Table 4. Operating conditions and results of the designed experiments.
RunA: Current Density (A/m2)B: Ratio S/V
(m2/m3)
C: Electrolysis (Contact) Time (min)COD Removal Efficiency %Energy Consumption Efficiency (kWh/kg COD)
121806084.191.32
222407585.911.37
311807582.690.54
423006090.022.32
532409085.811.72
632406085.892.58
723009083.551.67
822407583.141.42
933007591.972.73
1012406087.470.84
1121809084.980.87
1212409081.160.61
1313007583.311.00
1431807583.301.60
Table 5. ANOVA for %COD and energy models.
SourceSum of SquaresdfMean SquareF-Valuep-Value
%COD = 85.242 + 1.541 A + 1.712 B − 1.509 C + 2.01 AB + 1.556 AC − 1.815 BC
Model99.76616.638.540.0061
A—current density191199.760.0168
B—ratio S/V23.44123.4412.040.0104
C—electrolysis time18.23118.239.360.0183
AB16.23116.238.330.0234
AC9.6919.694.980.0609
BC13.17113.176.770.0354
Residual13.6371.95
Lack of fit9.7861.630.42370.8246
Pure error3.8513.85
Cor total113.3913
E (kWh/kg COD) = 1.39 + 0.70 A + 0.43 B − 0.275 C + 0.166 AB + 0.155 AC − 0.052 BC − 0.019 A2 + 0.088 B2 + 0.059 C2
Model6.2890.6977405.73<0.0001
A—current density3.9713.972307.09<0.0001
B—ratio S/V1.4511.45845.83<0.0001
C—electrolysis time0.603110.6031350.74<0.0001
AB0.110610.110664.340.0013
AC0.096210.096255.940.0017
BC0.010810.01086.290.0662
A20.001210.00120.68950.453
B20.024510.024514.250.0195
C20.011110.01116.430.0642
Residual0.006940.0017
Lack of fit0.005830.00191.850.485
Pure error0.001110.0011
Cor total6.2913
Table 6. Fit statistics and performance parameters of the model for the responses %COD and energy consumption (E).
Adjustment Statistics%CODE (kWh/kg COD)
R20.87980.9989
Adjusted R20.77680.9964
Predicted R20.53010.9845
Adeq Precision10.0164.52
Std. Dev.1.40.0415
Mean85.241.47
C.V.%1.642.82
Disclaimer/Publisher’s Note: The statements, opinions and data contained in all publications are solely those of the individual author(s) and contributor(s) and not of MDPI and/or the editor(s). MDPI and/or the editor(s) disclaim responsibility for any injury to people or property resulting from any ideas, methods, instructions or products referred to in the content.