Linear Optimization Model with Nonlinear Constraints to Maximize Biogas Production from Organic Waste: A Practical Approach

Abstract
1. Introduction
2. Materials and Methods
2.1. Biogas Production from Organic Waste: An Overview
2.2. Data Collection
2.3. Input Parameters
- % Moisture: This is the percentage of water present in the residue. This parameter influences the fluidity of the substrate and its ability to mix properly within the digester. Ideally, it should be maintained between 50% and 60% to ensure an efficient process. Manures with a high moisture content (such as pig manure) may require the addition of dry material to balance the mixture and optimize biogas production.
- % Total Solids (TS): TS corresponds to the amount of residue that is not water (100%–% moisture). Higher TS values, such as those found in chicken manure, indicate that water or dilution may be required to facilitate anaerobic digestion.
- C/N (Carbon/Nitrogen) Ratio: The C/N ratio is a critical factor for the activity of anaerobic bacteria. An optimal ratio typically ranges between 20:1 and 30:1, ensuring microbial balance and efficient biogas production.
- % Organic Matter (OM): OM refers to the proportion of organic matter within the total solids that can be decomposed by anaerobic bacteria. A higher organic matter content enhances the efficiency of biogas production.
- % Volatile Solids (VS): VS represents the fraction of organic matter that can be converted into biogas during anaerobic digestion. This is an important parameter for estimating the potential biogas yield from each type of waste. Higher VS values indicate greater biogas production potential.
- Biogas Produced (BP): BP represents the total amount of biogas generated from organic solid waste, expressed in . It is calculated as the product of the amount of VS [kg] and the biogas production potential (PP) specific to each type of waste [/kg].

| Species | Density (kg/L) | pH | Buffering Capacity (High, Medium, Low) | % Moisture | % Total Solids | C/N Ratio | % Organic Matter | % Volatile Solids (VS) | Other Important Aspects |
|---|---|---|---|---|---|---|---|---|---|
| Bovine | 0.65–0.75 | 6.5–7.5 | High | 85–88% | 12–15% | 18–25:1 | 75–80% | 70–75% | Contains high fiber, slow decomposition. Ideal for continuous flow biodigesters. |
| Pig | 0.60–0.70 | 6.0–7.0 | Average | 88–92% | 8–10% | 10–14:1 | 85–90% | 80–85% | High concentration of nutrients and liquids, excellent for biogas production due to its rapid decomposition. |
| Hen/chicken | 0.50–0.60 | 6.2–7.4 | Average | 70–75% | 25–30% | 6–10:1 | 60–65% | 55–60% | High nitrogen content, requires mixing with other waste to improve the C/N ratio. |
| Horse | 0.70–0.80 | 6.5–7.5 | High | 75–80% | 20–25% | 20–30:1 | 60–65% | 55–60% | Manure with a high fiber content and low liquid content, useful as a complement in biodigesters. |
| Sheep | 0.65–0.75 | 6.8–7.6 | High | 65–70% | 30–35% | 16–18:1 | 55–60% | 50–55% | Rapid decomposition, good option for mixtures with drier waste. |
| Rabbit | 0.55–0.65 | 6.3–7.3 | Average | 65–70% | 30–35% | 10–12:1 | 50–55% | 45–50% | Small manure with high nitrogen content, excellent for biogas but requires dilution. |
| Goat | 0.60–0.70 | 6.8–7.6 | High | 70–75% | 25–30% | 14–16:1 | 50–55% | 50–55% | Similar to sheep manure, but with a lower liquid content. |
| Duck/goose | 0.55–0.65 | 6.0–7.0 | Average | 80–85% | 15–20% | 8–12:1 | 60–65% | 55–60% | Contains high moisture and nitrogen, requires adjustment of the pH and C/N ratio. |
| Fruit remains (peels) | 0.40–0.60 | 4.0–5.5 | Low | 80–90% | 10–20% | 35:1–40:1 | 90–95% | 85–90% | High sugar content, rapid degradation. High carbon content, excellent for mixing with nitrogen-rich manure. Provides stability in anaerobic digestion. |
| Vegetable waste | 0.50–0.80 | 5.5–7.0 | Average | 80–90% | 10–20% | 12:1–20:1 | 85–90% | 80–85% | High moisture, good nitrogen supply. Good carbon source, ideal for adjusting the C/N ratio in combination with these animals. |
| Cereal crop residues (straw) | 0.12–0.15 | 6.0–7.0 | Average | 50–70% | 30–50% | 60:1–80:1 | 70–80% | 60–70% | High proportion of cellulose and lignin, slow degradation. Very high in carbon, requires combination with nitrogen-rich residues to avoid inhibiting digestion. |
| Potato peels | 0.55–0.65 | 6.0–7.0 | Average | 75–85% | 15–25% | 20:1–25:1 | 80–85% | 75–80% | Rich in starches, moderately high in carbon, good for adjusting the C/N ratio when combined with more nitrogen-rich residues. |
| Egg shells | 0.60–0.70 | 7.0–8.0 | High | 5–10% | 90–95% | 2:1–5:1 | 30–40% | 10–20% | Rich in calcium, low anaerobic digestibility. |
| Coffee grounds (coffee residue) | 0.55–0.65 | 4.5–6.0 | Low | 50–60% | 40–50% | 20:1–25:1 | 80–85% | 75–80% | Contains lignin, a potential inhibitor in high quantities. C/N ratio close to ideal, favors biogas production but requires adjustment with other waste to avoid acidification. |
| Corn residues (leaves, stalks) | 0.12–0.25 | 6.0–7.5 | Average | 50–70% | 30–50% | 40:1–60:1 | 65–75% | 60–70% | High cellulose content, slow degradation. High carbon content, needs to be mixed with nitrogen-rich waste to balance methane production. |
| Old bread/bread scraps | 0.35–0.45 | 5.0–6.5 | Low | 30–40% | 60–70% | 20:1–30:1 | 85–90% | 80–85% | High carbohydrate content, rapid degradation. Good C/N ratio, provides sufficient carbon to stabilize anaerobic digestion. |
| Nut and seed shells | 0.25–0.35 | 5.5–6.5 | Low | 5–10% | 90–95% | 80:1–100:1 | 40–50% | 30–40% | Contains lignin and fats, which are slow to degrade. High levels of carbon, and must be combined with nitrogen-rich waste to obtain an adequate balance. |
| Leftover cooked rice | 0.75–0.85 | 6.0–7.0 | Average | 50–60% | 40–50% | 15:1–20:1 | 85–90% | 80–85% | High carbohydrate content, good degradation. Low carbon ratio, excellent for improving anaerobic digestion efficiency when mixed with more fibrous materials. |
| Leftover cooked vegetables | 0.60–0.75 | 6.0–7.5 | Average | 75–85% | 15–25% | 10:1–15:1 | 85–90% | 80–85% | High nitrogen content, good degradation. Low carbon content, needs to be mixed with carbon-rich materials to avoid acidification of the biodigester. |
| Vegetable oils and fats | 0.80–0.90 | 6.0–6.5 | Low | 0–2% | 98–100% | 20–30:1 | 95–99% | 95–99% | High energy concentration improves biogas production. Its low moisture content requires mixing with wetter waste. |
| Pasta (cooked) | 0.65–0.75 | 5.5–6.5 | Average | 50–55% | 45–50% | 15–20:1 | 85–90% | 80–85% | Rapid degradation, ideal for co-digestion to balance acidity. Can generate volatile fatty acids if not well controlled. |
| Leaves and plant remains | 0.10–0.20 | 6.5–7.0 | High | 60–75% | 25–40% | 30–60:1 | 75–85% | 65–75% | They contain cellulose and lignin, which can slow down digestion. They provide structure to the mixture. Pretreatment recommended to improve biodegradation. |
2.3.1. Critical Parameter Control
2.3.2. Proposed Methodology for Estimating pH in a Mixture of Organic Waste
- pH of residue i;
- buffering capacity of the residue i.
- 20 kg of bovine manure;
- 10 kg of pig manure;
- 5 kg of fruit peels;
- 8 kg of vegetable waste;
- 5 kg of eggshells;
- 2 kg of coffee grounds.
2.4. Definition of the Model to Estimate Biogas Production
2.4.1. Biogas Production Calculation
- biogas production potential of component i [m3/kg].
- weight of volatile solids (VS) component i in the mixture, expressed in [kg].
- total solid fraction of waste i.
- organic matter fraction of the residue i.
- volatile solids fraction of the waste i.
- : weight in kg of the residue i [kg].
2.4.2. Proposed Optimization Model
- represents the maximum amount of biogas that is desired to be obtained, expressed in [m3].
- is the contribution in of biogas produced by the amount of of waste i, where .
- corresponds to the coefficients related to the volatile solids (VS) component in the mixture and the biogas production potential for waste i. The value of the coefficients can be calculated from the following mathematical expression:
- refers the weight in [kg] of each type of waste i required in the mixture to maximize biogas production in the proposed model. Additionally, represents the decision variables that must be optimized in the proposed model.
- is the number of residues in the mixture.
- a.
- Control restrictions based on the C/N ratio for waste mixing: For the proposed model, calculating the carbon/nitrogen (C/N) ratio in the total mixture is an essential factor to ensure that the biodigester operates efficiently and maximizes biogas production. To estimate the resulting C/N value in the mixture, the carbon (C) and nitrogen (N) contents of each biomass component (organic waste, animal waste, etc.) and their proportions in the mixture must be known. The mathematical expression that allows us to calculate the C/N ratio of the mixture is as follows:
- b.
- Control restrictions based on the average pH of the mixture: Starting from the expression for the average pH, we obtain that
- c.
- Control restrictions based on the average moisture content of the mixture: Moisture in the biodigester is essential for the microorganisms that decompose organic matter to function properly. Considering that the ideal range of moisture percentage for efficient anaerobic digestion should be between 50 and 60, then the following restrictions are defined:
2.4.3. Computational Implementation and Optimization Algorithm for Maximizing Biogas Production
- pH Restrictions: Maintain the average pH of the substrate between 6.5 and 7.5, the ideal range for microbiological activity.
- C/N Ratio: Establish a carbon/nitrogen ratio between 20 and 30, in order to maximize biogas production and minimize the formation of inhibitory compounds.
- Moisture: Control the moisture percentage so that it remains within the optimal range between 50% and 60%.
- Substrate Volume Restriction: Limit the volume of the substrate to 70% of the total capacity of the biodigester, ensuring sufficient space for the biogas generated.
| Algorithm 1. Optimization algorithm for maximizing biogas production |
|
2.5. Monte Carlo Analysis
3. Results
3.1. Proposed Scenarios
| Binary Availability Vector (1 If The Residue Is Available, 0 If Not) | Optimization Result Obtained |
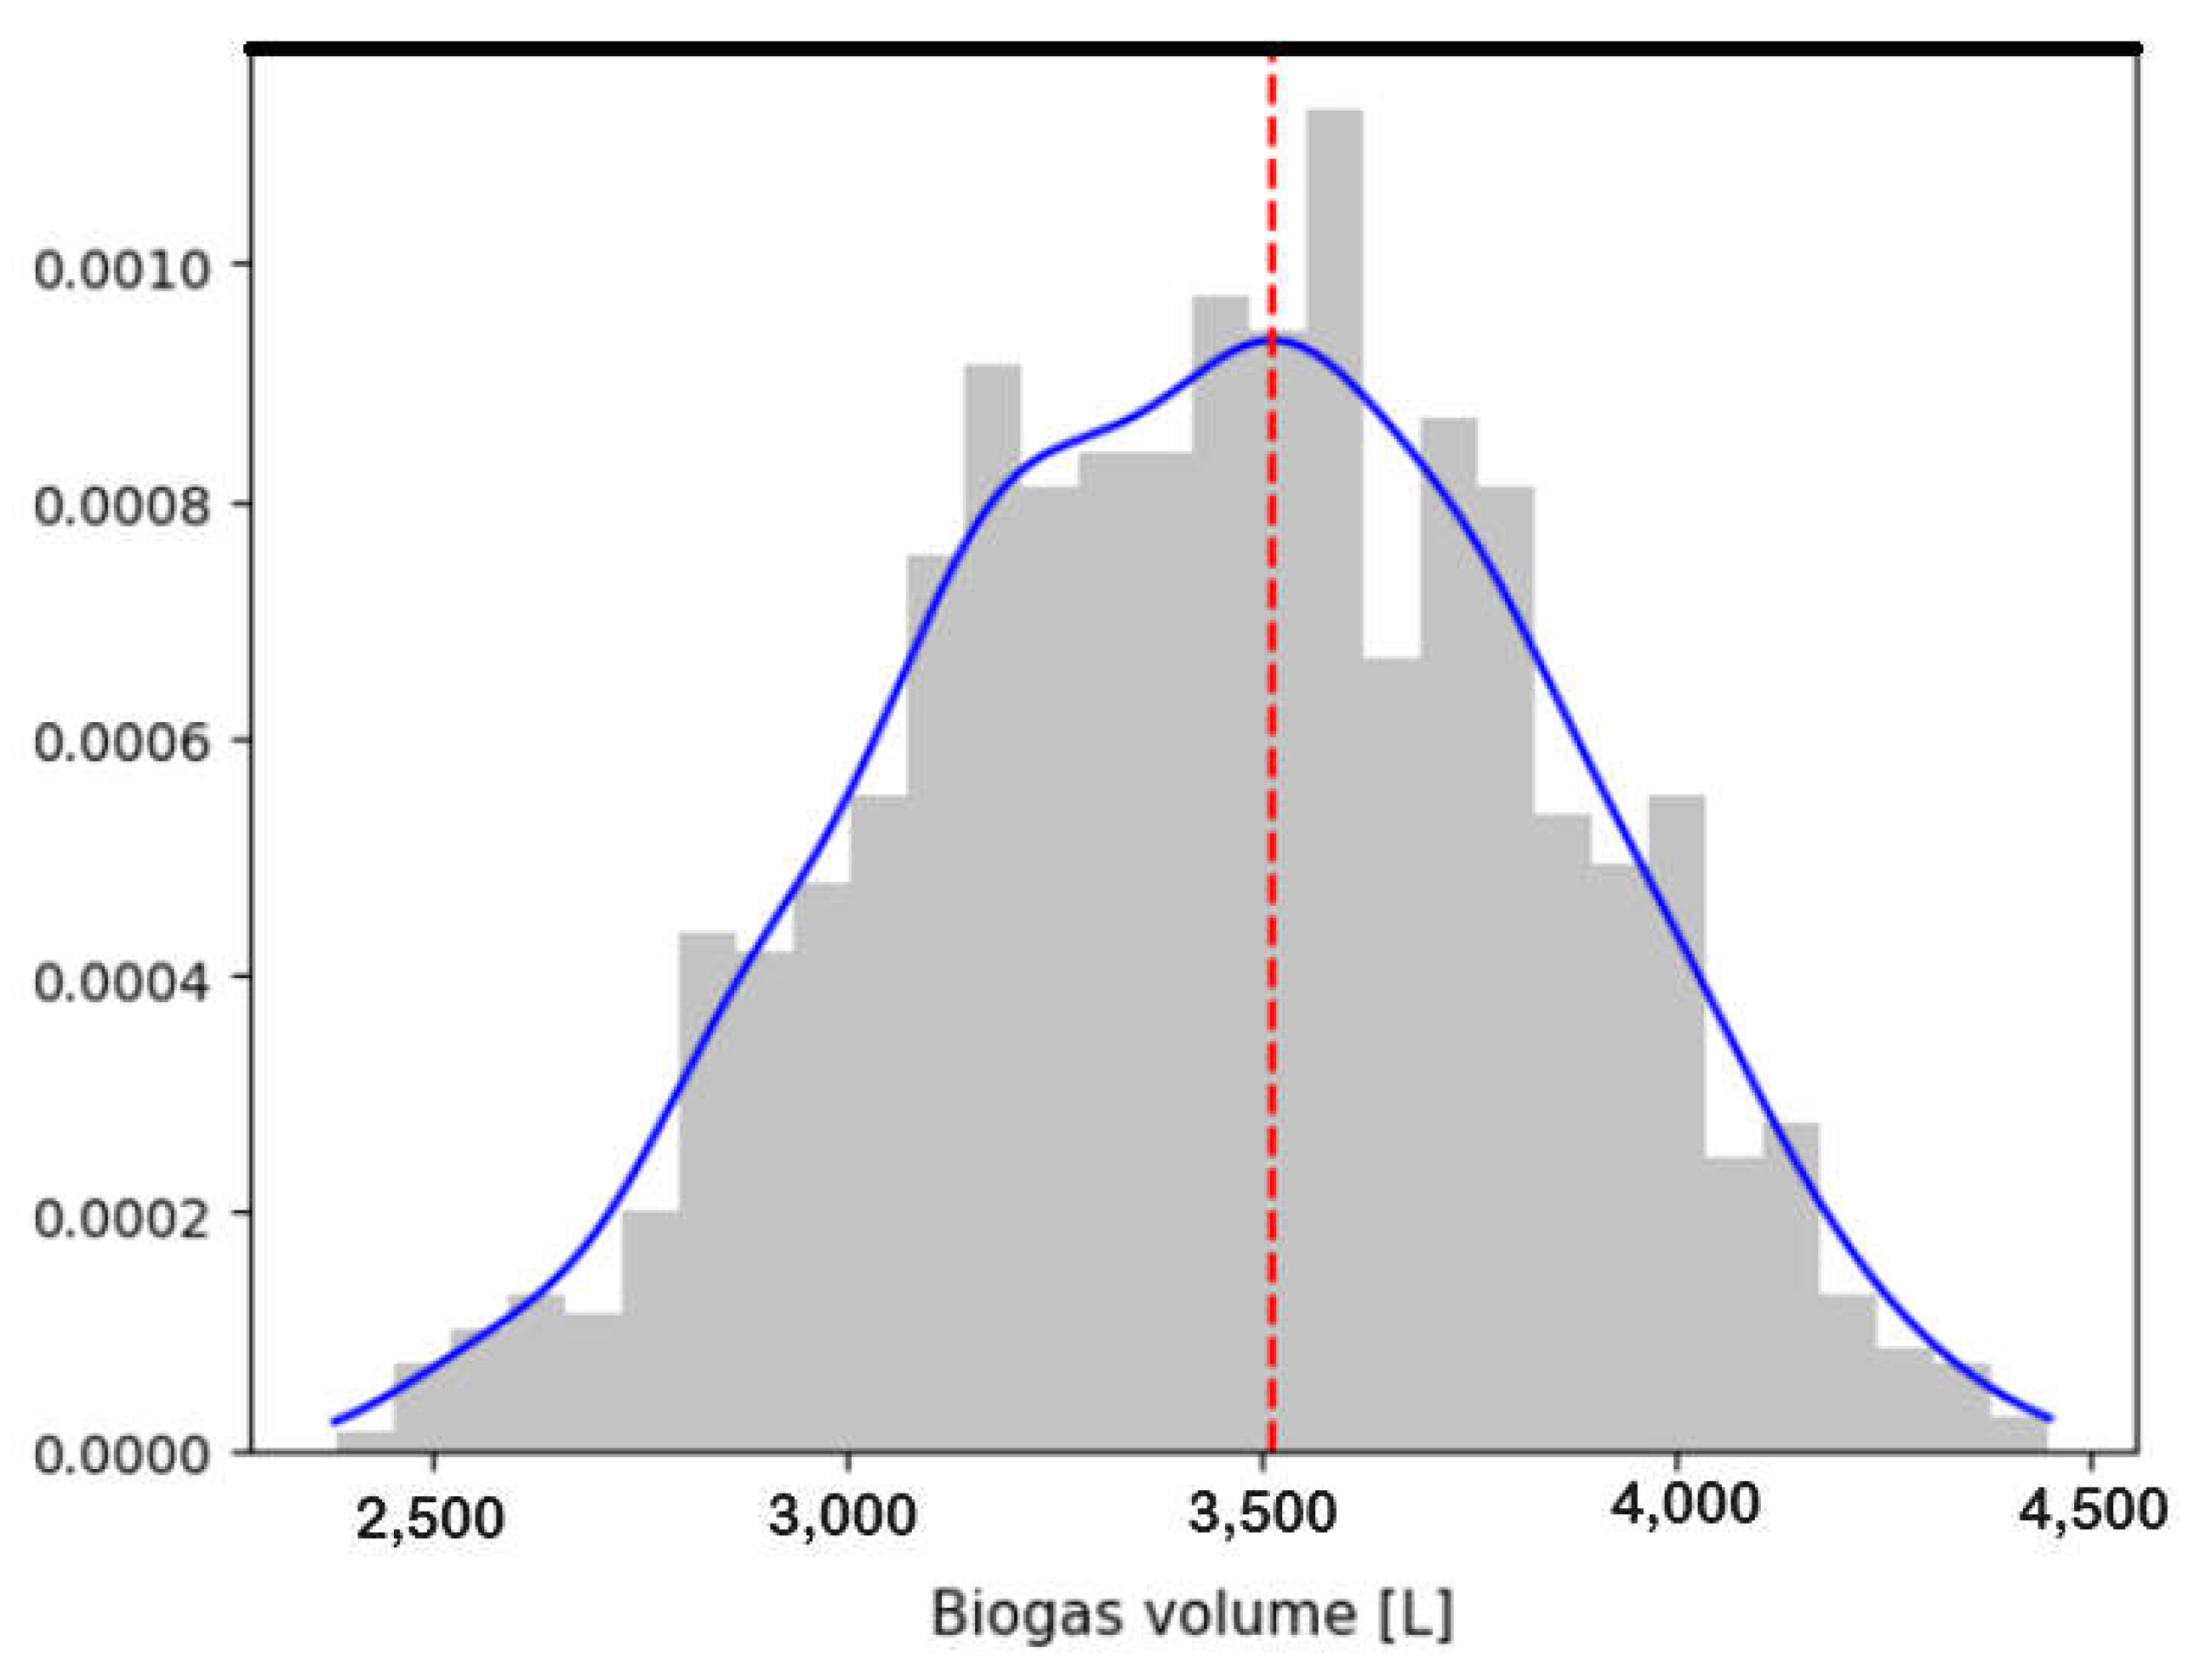
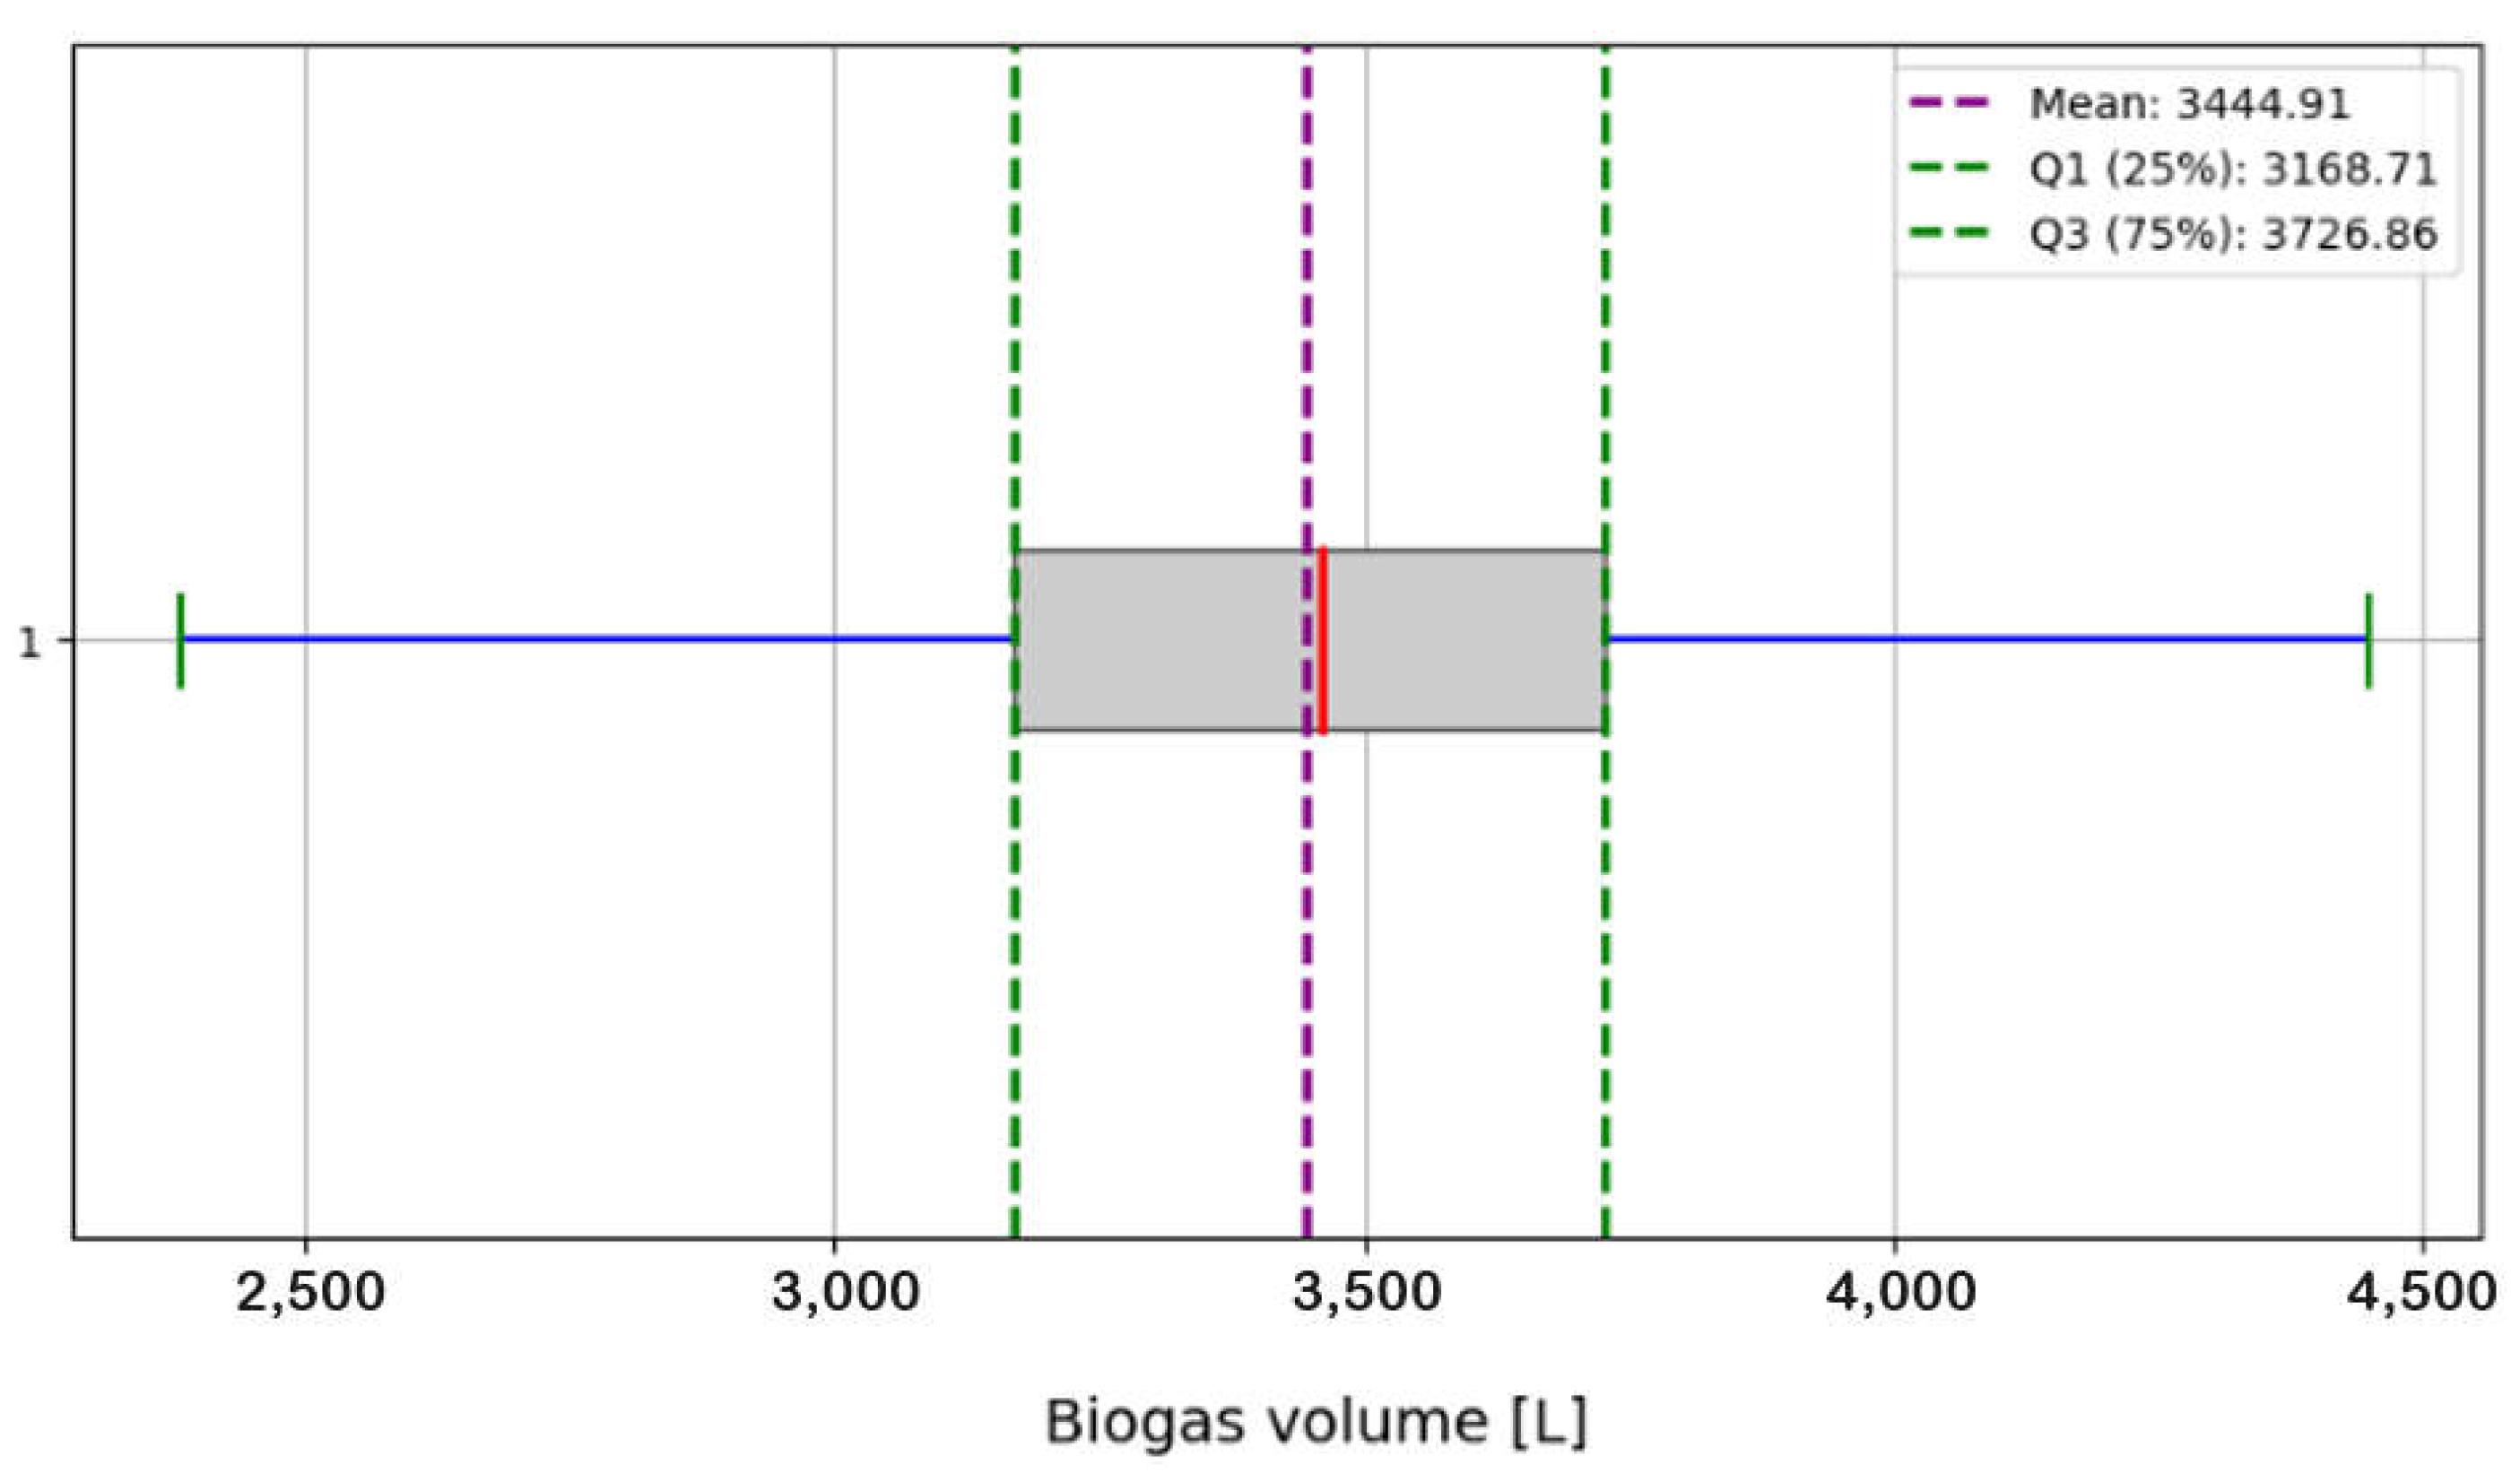
| availability = { ‘Bovine’: 0, ‘Pig’: 1, ‘Hen/chicken’: 0, ‘Horse’: 0, ‘Sheep’: 0, ‘Rabbit’: 0, ‘Goat’: 0, ‘Duck/goose’: 0, ‘Fruit remains (peels)’: 1, ‘Vegetable waste’: 1, ‘Cereal crop residues (straw)’: 0, ‘Potato peels’: 1, ‘Eggshells’: 1, ‘Coffee residue’: 0, ‘Corn residues (leaves, stalks)’: 0, ‘Stale bread/bread scraps’: 1, ‘Nut and seed shells’: 0, ‘Leftover cooked rice’: 1, ‘Cooked vegetable leftovers’: 1, ‘Vegetable oils and fats’: 0, ‘Pasta’: 0, ‘Leaves and plant remains’: 1 } | Bovine: 0.00 kg Pork: 14.56 kg Chicken: 0.00 kg Horse: 0.00 kg Sheep: 0.00 kg Rabbit: 0.00 kg Goat: 0.00 kg Duck/goose: 0.00 kg Fruit remains (peels): 0.00 kg Vegetable waste: 0.00 kg Cereal crop residues (straw): 0.00 kg Potato peels: 0.00 kg Eggshells: 5.38 kg Coffee grounds: 0.00 kg Corn residues (leaves, stalks): 0.00 kg Stale bread/bread scraps: 6.56 kg Nut and seed shells: 0.00 kg Leftover cooked rice: 9.88 kg Cooked vegetable scraps: 0.00 kg Vegetable oils and fats: 0.00 kg Pasta: 0.00 kg Leaves and plant remains: 7.89 kg Average pH: 6.5 C/N ratio avg: 20.00 Average moisture: 60.00 Maximum substrate volume in [L]: 112.0 Estimated substrate volume in [L]: 112.00 Value of the objective function in [L]: 3418.67 Value of the objective function in [m3]: 3.42 |
| Binary Availability Vector (1 If The Residue Is Available, 0 If Not) | Optimization Result Obtained |
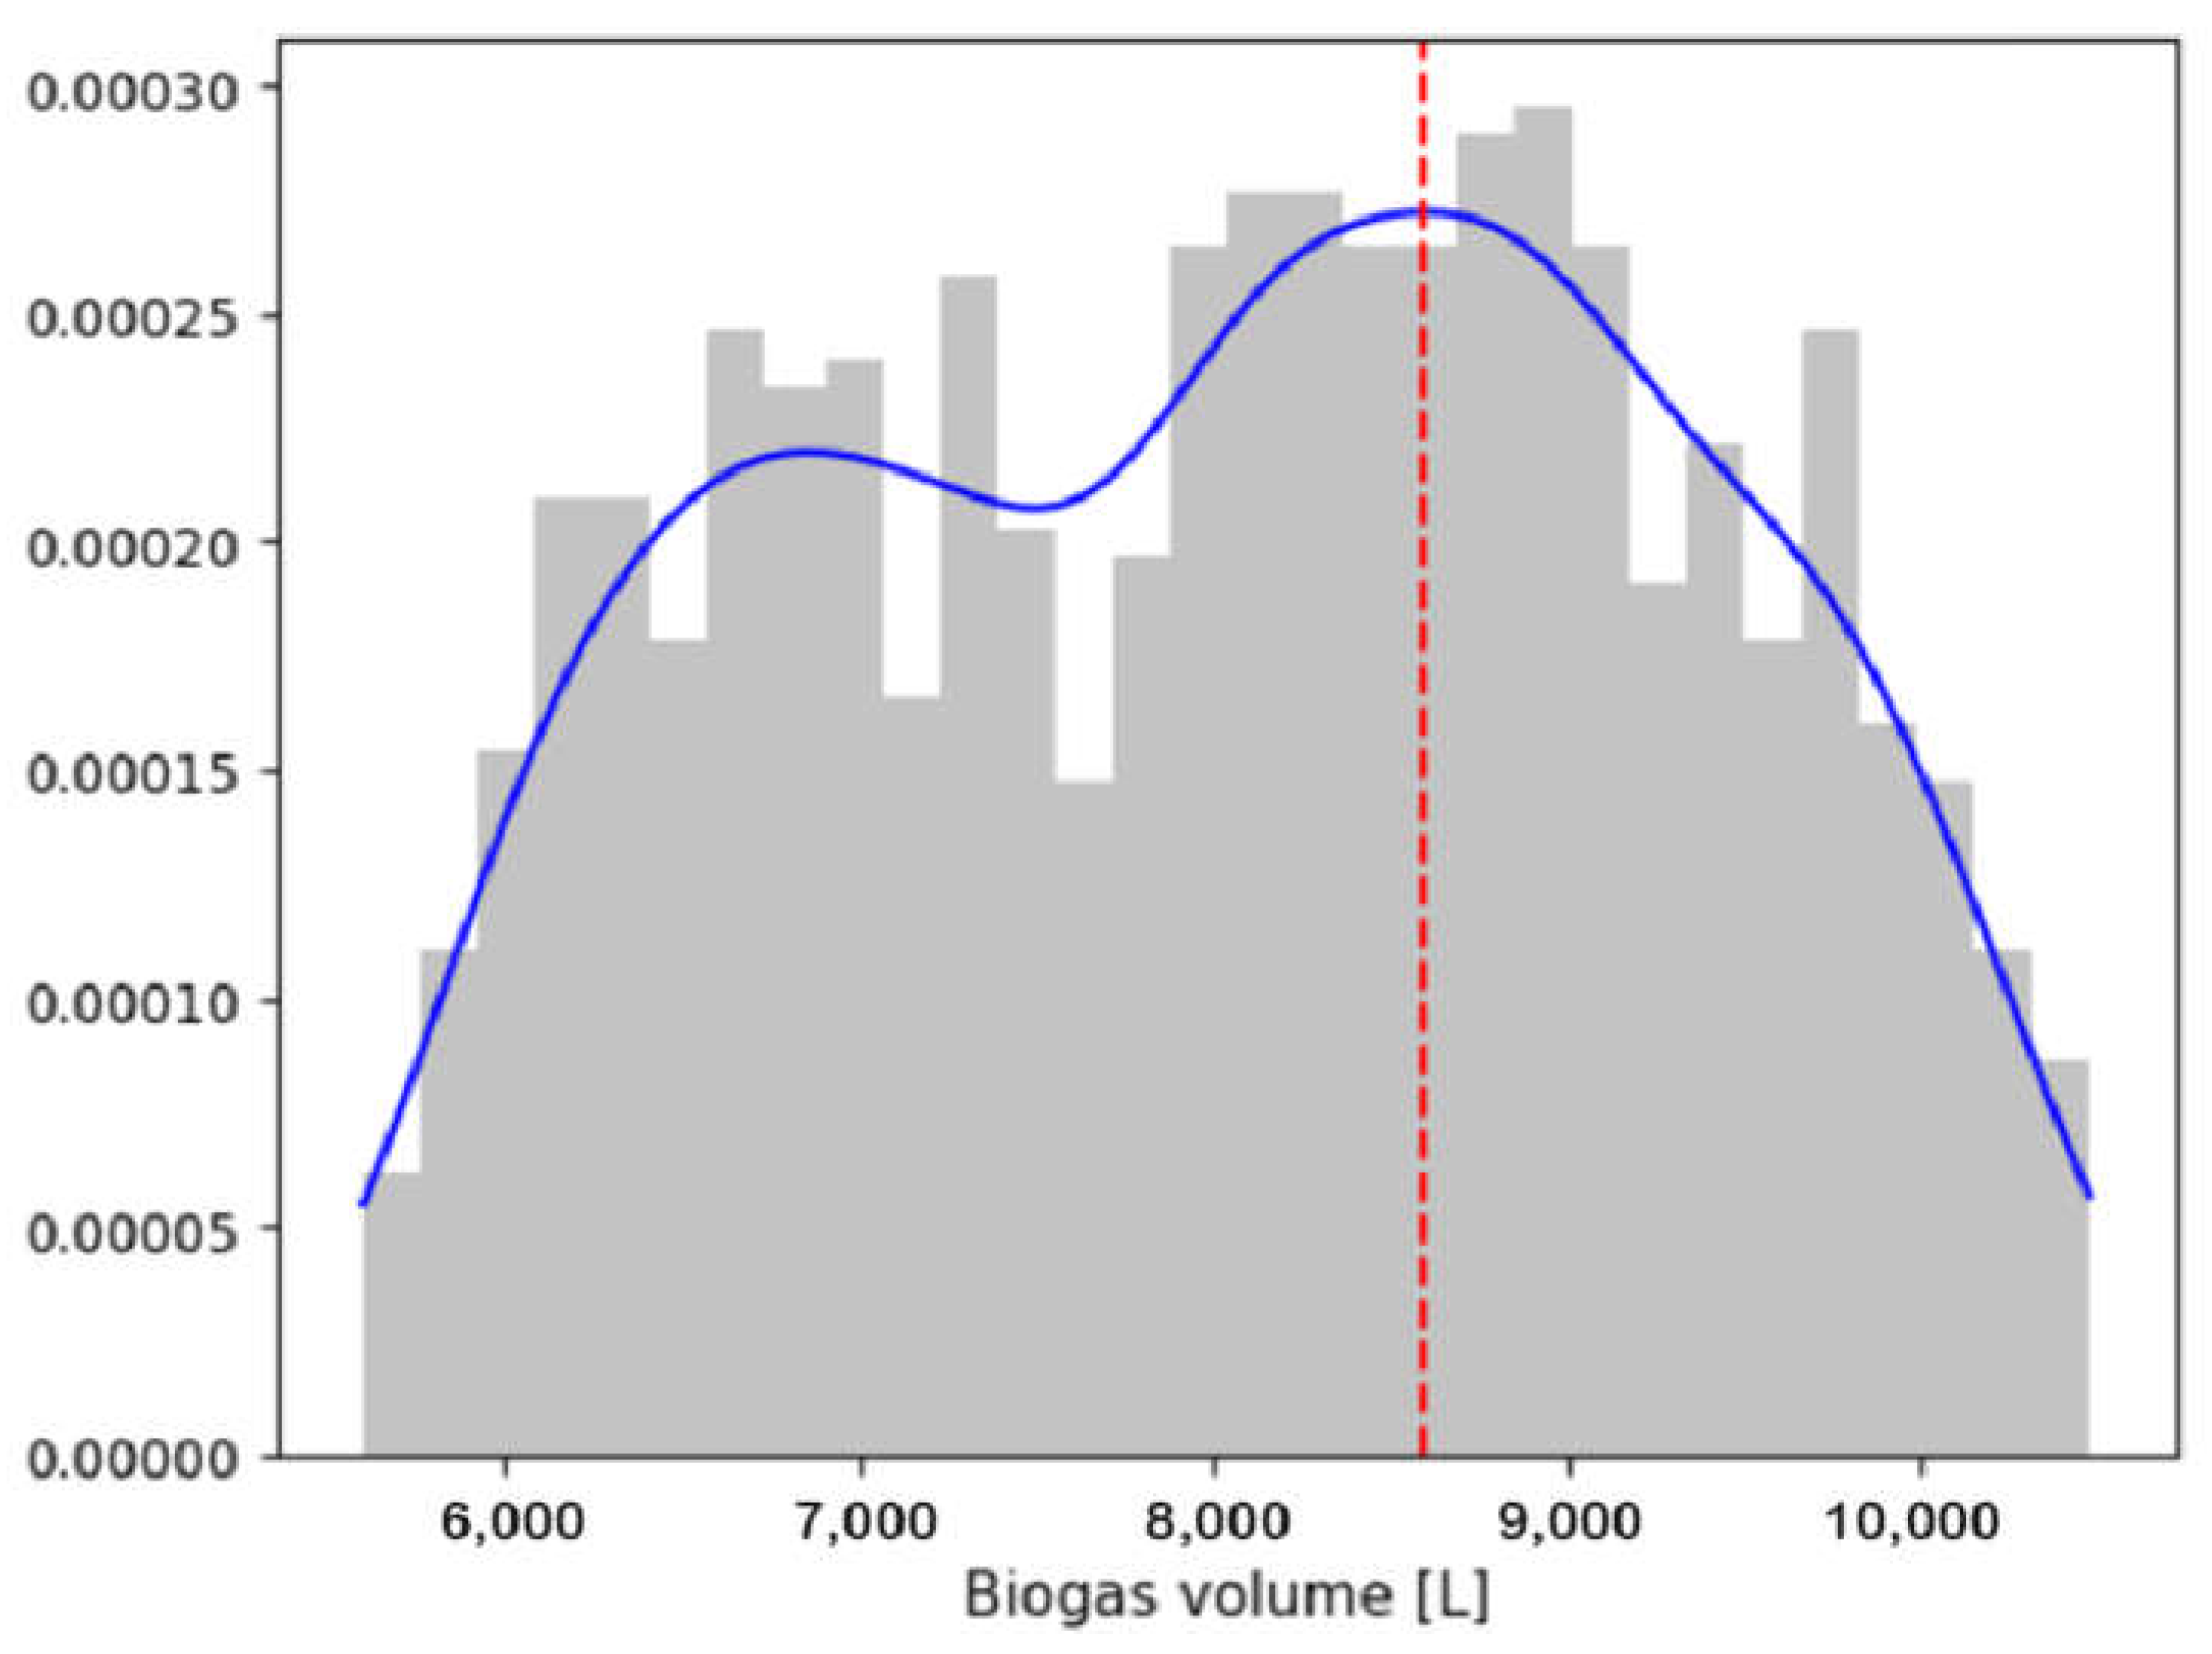
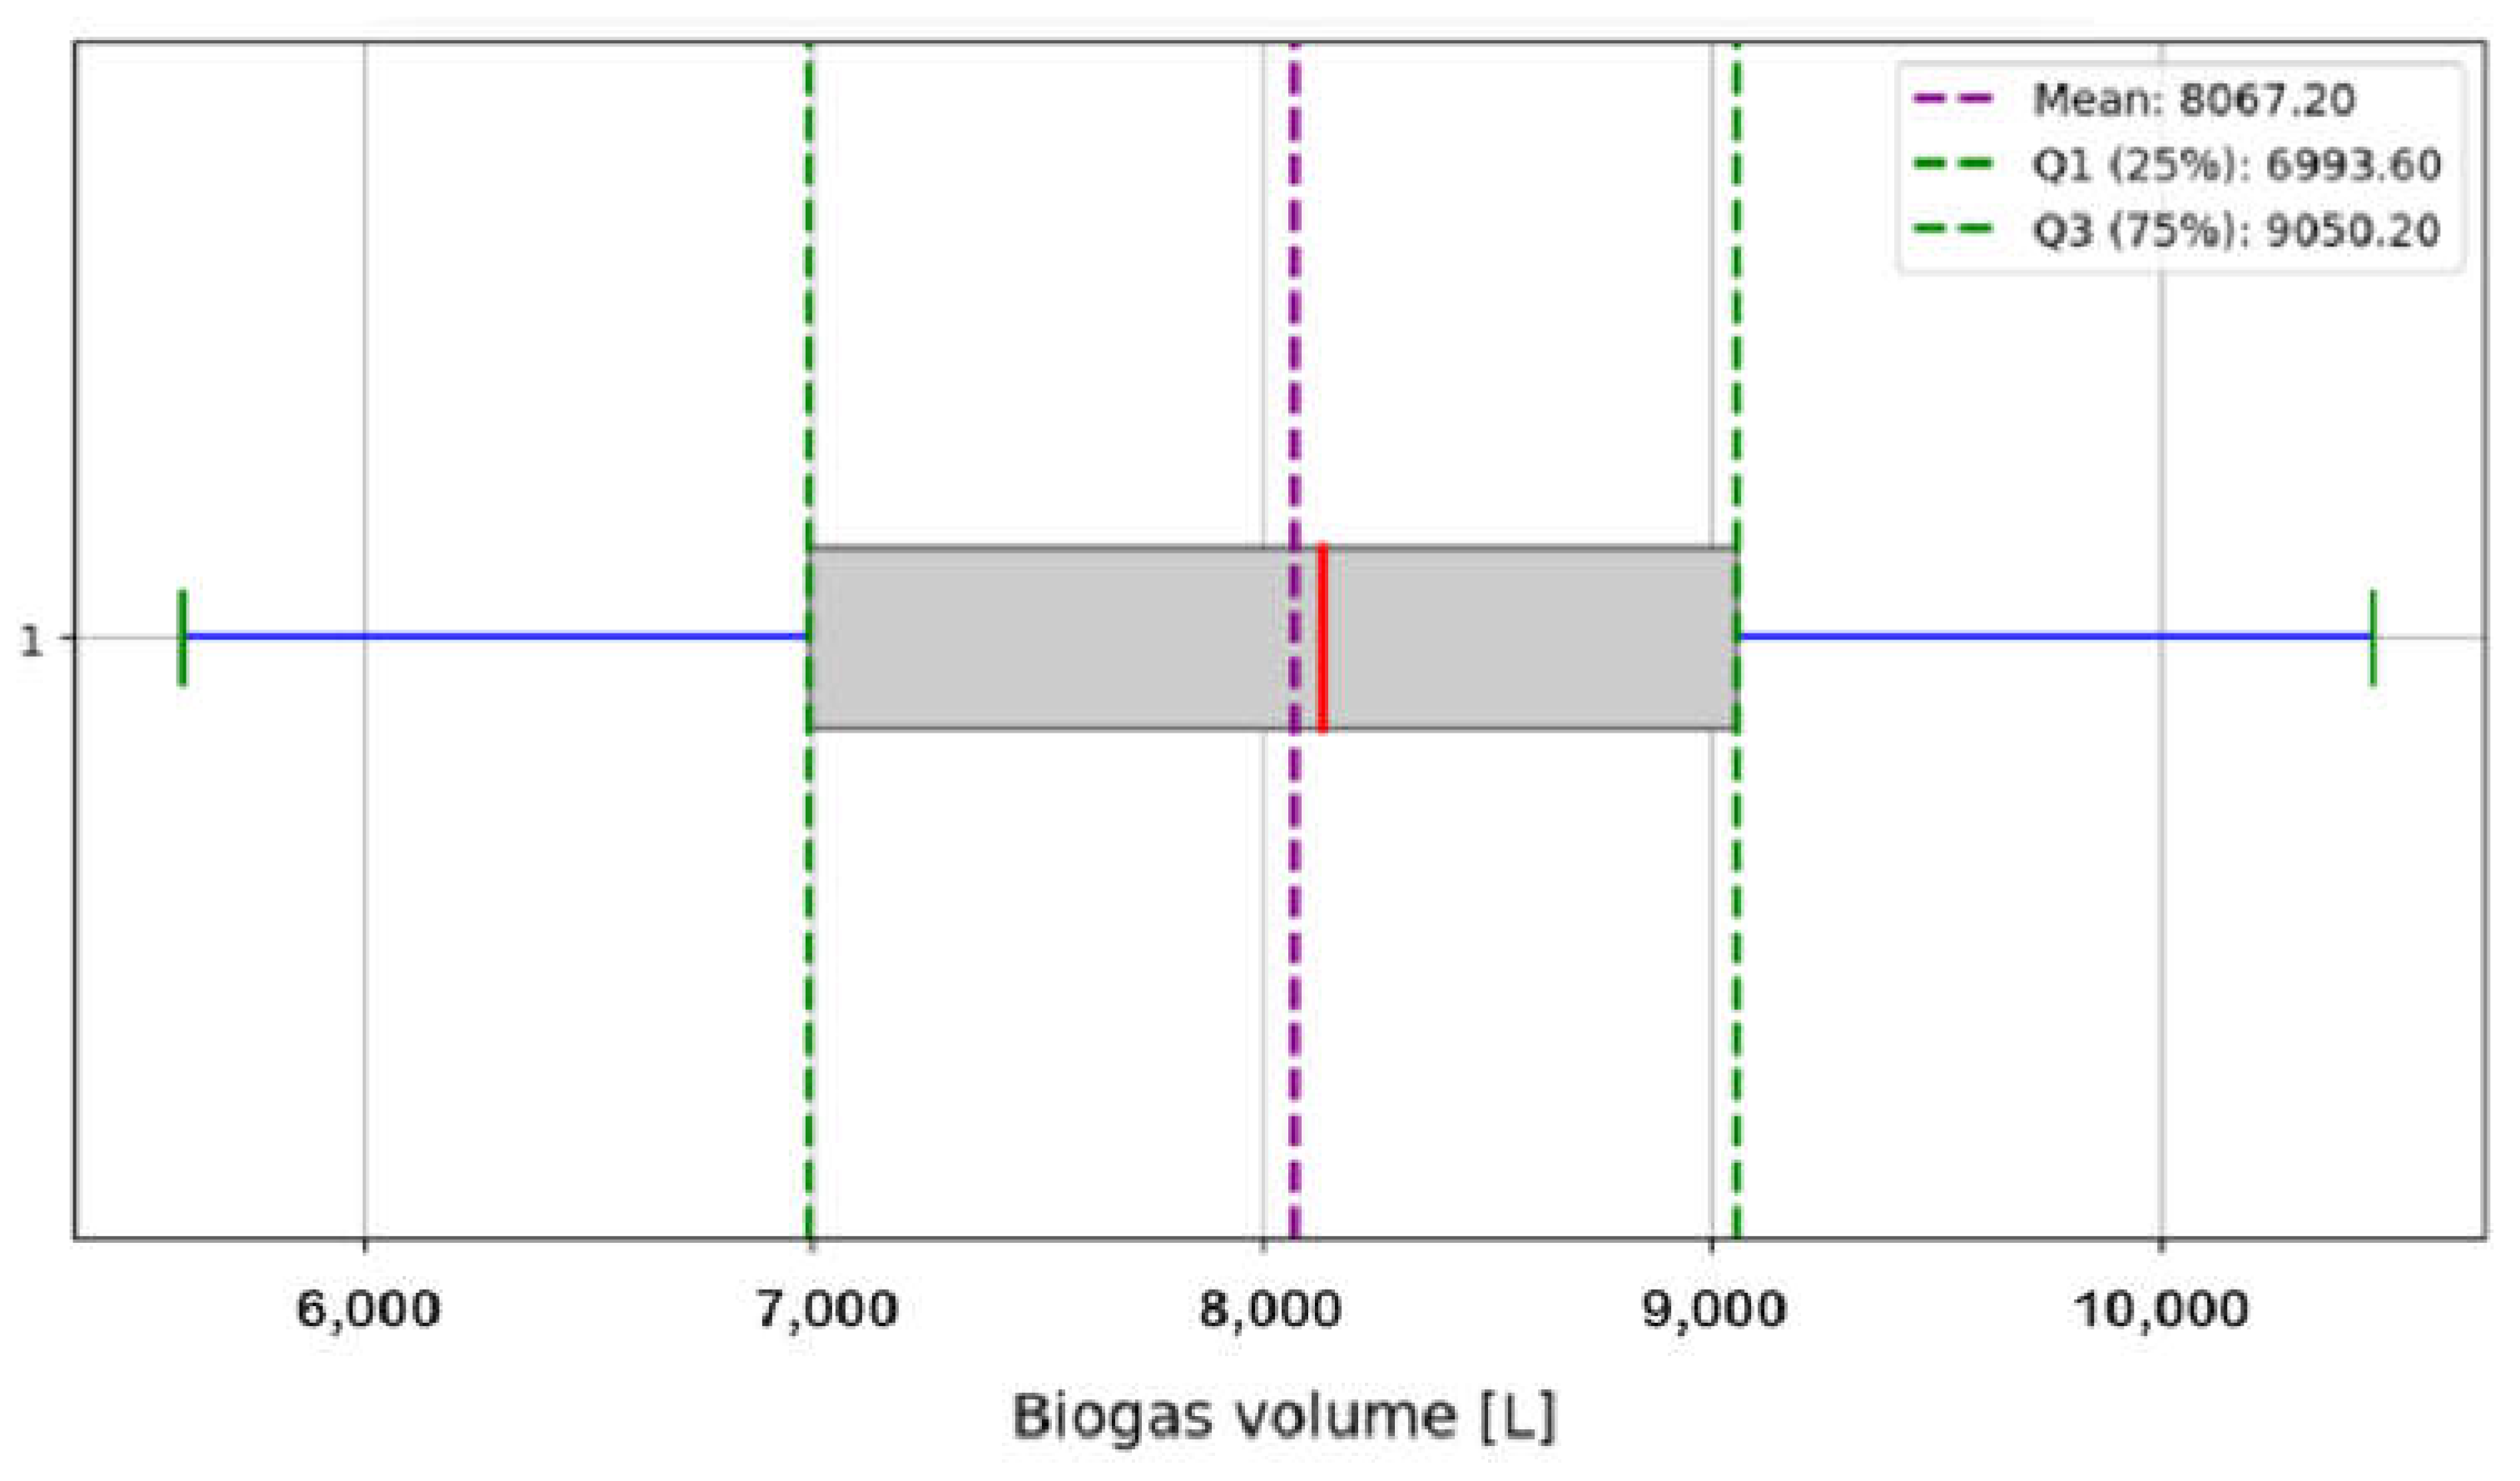
| availability = { ‘Bovine’: 1, ‘Pig’: 0, ‘Hen/Chicken’: 0, ‘Horse’: 0, ‘Sheep’: 0, ‘Rabbit’: 0, ‘Goat’: 0, ‘Duck/goose’: 0, ‘Fruit remains (peels)’: 1, ‘Vegetable waste’: 1, ‘Cereal crop residues (straw)’: 1, ‘Potato peels’: 1, ‘Eggshells’: 0, ‘Coffee waste’: 1, ‘Corn residues (leaves, stalks)’: 0, ‘Stale bread/bread scraps’: 0, ‘Nut and seed shells’: 0, ‘Leftover cooked rice’: 1, ‘Cooked vegetable leftovers’: 1, ‘Vegetable oils and fats’: 0, ‘Pasta’: 1, ‘Leaves and plant remains’: 0 } | Bovine: 15.68 kg Pork: 0.00 kg Chicken: 0.00 kg Horse: 0.00 kg Sheep: 0.00 kg Rabbit: 0.00 kg Goat: 0.00 kg Duck/goose: 0.00 kg Fruit remains (peels): 0.00 kg Vegetable waste: 0.00 kg Cereal crop residues (straw): 2.36 kg Potato peels: 0.00 kg Eggshells: 0.00 kg Coffee grounds: 0.00 kg Corn residues (leaves, stalks): 0.00 kg Stale bread/bread scraps: 0.00 kg Nut and seed shells: 0.00 kg Leftover cooked rice: 48.30 kg Cooked vegetable scraps: 0.00 kg Vegetable oils and fats: 0.00 kg Pasta: 8.24 kg Leaves and plant remains: 0.00 kg Average pH: 6.49 C/N ratio avg: 20.00 Average moisture: 60.95 Maximum substrate volume: 112.0 Estimated substrate volume: 112.00 Value of the objective function in [L]: 8061.43 Value of the objective function in [m3]: 8.06 |
3.2. Sensitivity Analysis for the Proposed Scenarios
4. Discussion
5. Conclusions
Author Contributions
Funding
Institutional Review Board Statement
Informed Consent Statement
Data Availability Statement
Conflicts of Interest
References
- Kokoulin, A.N.; Uzhakov, A.A.; Tur, A.I. The Automated Sorting Methods Modernization of Municipal Solid Waste Processing System. In Proceedings of the 2020 International Russian Automation Conference, RusAutoCon 2020, Sochi, Russia, 6–12 September 2020; Institute of Electrical and Electronics Engineers Inc.: Piscataway, NJ, USA, 2020; pp. 1074–1078. [Google Scholar] [CrossRef] [Scilit]
- Vesga Ferreira, J.C.; Perez, H.E.; Vesga Barrera, J.A. Design of a Waste Classification System Using a Low Experimental Cost Capacitive Sensor and Machine Learning Algorithms. Appl. Sci. 2025, 15, 1565. [Google Scholar] [CrossRef] [Scilit]
- Hodson de Jaramillo, E. Bioeconomía: El futuro sostenible. Rev. Acad. Colomb. Cienc. Exactas Físicas Nat. 2018, 42, 188. [Google Scholar] [CrossRef] [Scilit]
- Lewandowski, I.; Bahrs, E.; Dahmen, N.; Hirth, T.; Rausch, T.; Weidtmann, A. Biobased value chains for a growing bioeconomy. GCB Bioenergy 2019, 11, 4–8. [Google Scholar] [CrossRef] [Scilit]
- Bahrs, E.; Angenendt, E. Status quo and perspectives of biogas production for energy and material utilization. GCB Bioenergy 2019, 11, 9–20. [Google Scholar] [CrossRef] [Scilit]
- Joshi, A.; Jose, J.; Bansiwal, N.; Soni, N. Study on Electricity Generation through biogas on small scale. Int. J. Innov. Res. Sci. Eng. Technol. 2017, 6, 6662–6669. [Google Scholar] [CrossRef]
- Giubi, J.; Bernal, M.; Cañete, F. Biogas production from organic waste generated at the Hospital of Clinics: A preliminary study. An. Fac. Cienc. Médicas 2020, 52, 53–58. [Google Scholar] [CrossRef] [Scilit]
- Sen, G.P.; Saxena, B.K.; Mishra, S. Feasibility Analysis of Community Level Biogas Based Power Plant in a Village of Rajasthan. In Proceedings of the 2020 International Conference on Advances in Computing, Communication and Materials, ICACCM 2020, Dehradun, India, 21–22 August 2020; Institute of Electrical and Electronics Engineers Inc.: Piscataway, NJ, USA, 2020; pp. 385–389. [Google Scholar] [CrossRef] [Scilit]
- Vesga Ferreira, J.C.; Sepulveda, F.A.A.; Perez Waltero, H.E. Smart Ecological Points, a Strategy to Face the New Challenges in Solid Waste Management in Colombia. Sustainability 2024, 16, 5300. [Google Scholar] [CrossRef] [Scilit]
- Pérez Pérez, N. Aprovechamiento de la Cascarilla de Café para Generar Energía Eléctrica en la Planta Procesadora Representaciones Mego SRL en Jaén; Universidad César Vallejo: Chiclayo, Peru, 2019; Available online: https://hdl.handle.net/20.500.12692/39688 (accessed on 5 May 2021).
- Tenzin, T. Optimization of biogas production from kitchen waste installed at college of science and technology. In Proceedings of the 2018 International Conference on Computing, Power and Communication Technologies (GUCON), Greater Noida, India, 28–29 September 2018; pp. 956–960. [Google Scholar] [CrossRef] [Scilit]
- Li, X.; Wang, Y. Prediction model of biogas production for anaerobic digestion process of food waste based on LM-BP neural network and particle swarm algorithm optimization. In Proceedings of the 2017 Chinese Automation Congress (CAC), Jinan, China, 20–22 October 2017; Volume 2017, pp. 7629–7633. [Google Scholar] [CrossRef] [Scilit]
- Menaka, D.; Nandhakumar, S.; Abishek, R.; Raghavendran, M.R.; Vishnu Hariharan, A.S. Smart Optimization of Biogas Production for Enhanced Gas Yield. In Proceedings of the 2023 International Conference on Data Science, Agents & Artificial Intelligence (ICDSAAI), Chennai, India, 21–23 December 2023. [Google Scholar] [CrossRef] [Scilit]
- Wei, H.; Wang, Z.; Li, H. Sustainable biomass hydrodeoxygenation in biphasic systems. Green Chem. 2022, 24, 1930–1950. [Google Scholar] [CrossRef] [Scilit]
- Behera, S.K.; Meher, S.K.; Park, H.S. Artificial neural network model for predicting methane percentage in biogas recovered from a landfill upon injection of liquid organic waste. Clean Technol. Environ. Policy 2015, 17, 443–453. [Google Scholar] [CrossRef] [Scilit]
- Singh, D.; Tembhare, M.; Pundalik, K.; Dikshit, A.K.; Kumar, S. Machine learning based prediction of biogas generation from municipal solid waste: A data-driven approach. Process Saf. Environ. Prot. 2024, 192, 93–103. [Google Scholar] [CrossRef] [Scilit]
- Rutland, H.; You, J.; Liu, H.; Bull, L.; Reynolds, D. A Systematic Review of Machine-Learning Solutions in Anaerobic Digestion. Bioengineering 2023, 10, 1410. [Google Scholar] [CrossRef] [Scilit]
- Abdurrahman, A.H.; Kirom, M.R.; Suhendi, A. Biogas Production Volume Measurement and Internet of Things based Monitoring System. In Proceedings of the 2020 IEEE International Conference on Communication, Networks and Satellite, Comnetsat 2020, Batam, Indonesia, 17–18 December 2020; Institute of Electrical and Electronics Engineers Inc.: Piscataway, NJ, USA, 2020; pp. 213–217. [Google Scholar] [CrossRef] [Scilit]
- Acharya, V.; Hegde, V.V.; Anjan, K.; Manoj Kumar, M. IoT (Internet of Things) Based Efficiency Monitoring System for Bio-Gas Plants. In Proceedings of the 2017 2nd International Conference on Computational Systems and Information Technology for Sustainable Solution (CSITSS), Bengaluru, India, 21–23 December 2017. [Google Scholar] [CrossRef] [Scilit]
- Agajie, T.F.; Fopah-Lele, A.; Amoussou, I.; Ali, A.; Khan, B.; Tanyi, E. Optimal Design and Mathematical Modeling of Hybrid Solar PV–Biogas Generator with Energy Storage Power Generation System in Multi-Objective Function Cases. Sustainability 2023, 15, 8264. [Google Scholar] [CrossRef] [Scilit]
- Zhang, Y. Plant-scale biogas production prediction based on multiple hybrid machine learning technique. Bioresour. Technol. 2022, 363, 127899. [Google Scholar] [CrossRef] [Scilit]
- Golberg, A. Energy-efficient biomass processing with pulsed electric fields for bioeconomy and sustainable development. Biotechnol. Biofuels 2016, 9, 1–22. [Google Scholar] [CrossRef] [Scilit]
- Srivastava, S.K. Advancement in biogas production from the solid waste by optimizing the anaerobic digestion. Waste Dispos. Sustain. Energy 2020, 2, 85–103. [Google Scholar] [CrossRef] [Scilit]
- Dalpaz, R.; Konrad, O.; Cândido da Silva, C.; Panis Barzotto, H.; Hasan, C.; Guerini Filho, M. Using biogas for energy cogeneration: An analysis of electric and thermal energy generation from agro-industrial waste. Sustain. Energy Technol. Assess. 2020, 40, 100774. [Google Scholar] [CrossRef] [Scilit]
- Fígoli, I.; Perna, V.; Horta, G.; Perco, L.; Reyes, A.; Sierra, W. The role of biomass in Uruguay’s energy transformation. In Proceedings of the 2018 IEEE 9th Power, Instrumentation and Measurement Meeting, EPIM 2018, Salto, Uruguay, 14–16 November 2018; Institute of Electrical and Electronics Engineers Inc.: Piscataway, NJ, USA, 2018; pp. 1–6. [Google Scholar] [CrossRef] [Scilit]
- Thoben, K.-D.; Wiesner, S.; Wuest, T. ‘Industrie 4.0’ and Smart Manufacturing—A Review of Research Issues and Application Examples. Int. J. Autom. Technol. 2017, 11, 4–16. [Google Scholar] [CrossRef] [Scilit]
- Blumberga, D.; Ozarska, A.; Indzere, Z.; Chen, B.; Lauka, D. Energy, Bioeconomy. Clim. Changes Environ. Nexus 2019, 23, 370–392. [Google Scholar] [CrossRef] [Scilit]
- Muthu, D.; Venkatasubramanian, C.; Ramakrishnan, K.; Sasidhar, J. Production of Biogas from wastes Blended with CowDung for Electricity generation—A Case study. In IOP Conference Series: Earth and Environmental Science; Institute of Physics Publishing: Bristol, UK, 2017; p. 12055. [Google Scholar] [CrossRef] [Scilit]
- Wang, X.; Lu, X.; Li, F.; Yang, G. Effects of temperature and carbon-nitrogen (C/N) ratio on the performance of anaerobic co-digestion of dairy manure, chicken manure and rice straw: Focusing on ammonia inhibition. PLoS ONE 2014, 9, 1–7. [Google Scholar] [CrossRef] [Scilit] [PubMed]
- Wang, J.; Ma, D.; Lou, Y.; Ma, J.; Xing, D. Optimization of biogas production from straw wastes by different pretreatments: Progress, challenges, and prospects. Sci. Total Environ. 2023, 905, 166992. [Google Scholar] [CrossRef] [Scilit] [PubMed]
- Kabaivanova, L.; Hubenov, V.; Dimitrov, N.; Petrova, P. Anaerobic Two-Phase Co-Digestion for Renewable Energy Production: Estimating the Effect of Substrate Pretreatment, Hydraulic Retention Time and Participating Microbial Consortia. Appl. Sci. 2024, 14, 5311. [Google Scholar] [CrossRef] [Scilit]
- Muha, I.; Linke, B.; Wittum, G. A dynamic model for calculating methane emissions from digestate based on co-digestion of animal manure and biogas crops in full scale German biogas plants. Bioresour. Technol. 2015, 178, 350–358. [Google Scholar] [CrossRef] [Scilit] [PubMed]
- Nahar, G.; Koley, A.; Garai, S.; Balachandran, S.; Ross, A.B. Enhancing Biogas Production Through the Co-Digestion of Fish Waste (FW) and Water Hyacinth (WH) Using Cow Dung as an Inoculum: Effect of FW/WH Ratio. Appl. Sci. 2024, 14, 9880. [Google Scholar] [CrossRef] [Scilit]
- Sudha, S.; Vidhyalakshmi, M.; Pavithra, K.; Sangeetha, K.; Swaathi, V. An automatic classification method for environment: Friendly waste segregation using deep learning. In Proceedings of the 2016 IEEE International Conference on Technological Innovations in ICT for Agriculture and Rural Development, TIAR 2016, Chennai, India, 15–16 July 2016; Institute of Electrical and Electronics Engineers Inc.: Piscataway, NJ, USA, 2016; pp. 65–70. [Google Scholar] [CrossRef] [Scilit]
- Mota-Panizio, R.; Hermoso-Orzáez, M.J.; Carmo-Calado, L.; Lourinho, G.; De Brito, P.S.D. Biochemical Methane Potential of Cork Boiling Wastewater at Different Inoculum to Substrate Ratios. Appl. Sci. 2021, 11, 3064. [Google Scholar] [CrossRef] [Scilit]
- Aworanti, O.A.; Agarry, S.E.; Ogunleye, O.O. Biomethanization of cattle manure, pig manure and poultry manure mixture in co-digestion with waste of pineapple fruit and content of chicken-gizzard- Part I: Kinetic and thermodynamic modelling studies. Open Biotechnol. J. 2017, 11, 36–53. [Google Scholar] [CrossRef] [Scilit]
- Neshat, S.A.; Mohammadi, M.; Najafpour, G.D.; Lahijani, P. Anaerobic co-digestion of animal manures and lignocellulosic residues as a potent approach for sustainable biogas production. Renew. Sustain. Energy Rev. 2017, 79, 308–322. [Google Scholar] [CrossRef] [Scilit]
- Dadic, B.; Ivankovic, T.; Spelic, K.; Hrenovic, J.; Jurisic, V. Natural Materials as Carriers of Microbial Consortium for Bioaugmentation of Anaerobic Digesters. Appl. Sci. 2024, 14, 6883. [Google Scholar] [CrossRef] [Scilit]
- Surendra, K.C. Anaerobic digestion of high-yielding tropical energy crops for biomethane production: Effects of crop types, locations and plant parts. Bioresour. Technol. 2018, 262, 194–202. [Google Scholar] [CrossRef] [Scilit]
- Peng, S.; Guo, L.; Li, Y.; Huang, H.; Peng, J.; Liu, X. Biogas Production Prediction Based on Feature Selection and Ensemble Learning. Appl. Sci. 2024, 14, 901. [Google Scholar] [CrossRef] [Scilit]
- Odejobi, O.J.; Ajala, O.O.; Osuolale, F.N. Anaerobic co-digestion of kitchen waste and animal manure: A review of operating parameters, inhibiting factors, and pretreatment with their impact on process performance. Biomass Convers. Biorefinery 2023, 13, 5515–5531. [Google Scholar] [CrossRef] [Scilit]
- Zareei, S.; Khodaei, J. Modeling and optimization of biogas production from cow manure and maize straw using an adaptive neuro-fuzzy inference system. Renew. Energy 2017, 114, 423–427. [Google Scholar] [CrossRef] [Scilit]
- Bernal, M.P.; Alburquerque, J.A.; Moral, R. Composting of animal manures and chemical criteria for compost maturity assessment. A review. Bioresour. Technol. 2009, 100, 5444–5453. [Google Scholar] [CrossRef] [Scilit] [PubMed]
- Wang, K. Transformation of organic matters in animal wastes during composting. J. Hazard. Mater. 2015, 300, 745–753. [Google Scholar] [CrossRef] [Scilit] [PubMed]
- Pardo LA, Á. Experiencias en la Generación de Energía a Partir de Biogás. 2014. Available online: https://publicaciones.fedepalma.org/index.php/palmas/article/view/11041 (accessed on 4 May 2021).
- Mao, C.; Feng, Y.; Wang, X.; Ren, G. Review on research achievements of biogas from anaerobic digestion. Renew. Sustain. Energy Rev. 2015, 45, 540–555. [Google Scholar] [CrossRef] [Scilit]
- Guo, R. Effect of aeration rate, C/N ratio and moisture content on the stability and maturity of compost. Bioresour. Technol. 2012, 112, 171–178. [Google Scholar] [CrossRef] [Scilit] [PubMed]
- Onwosi, C.O. Composting technology in waste stabilization: On the methods, challenges and future prospects. J. Environ. Manag. 2017, 190, 140–157. [Google Scholar] [CrossRef] [Scilit] [PubMed]
- Mandal, S.; Yasmin, H.; Sarker, M.R.I.; Beg, M.R.A. Prospect of solar-PV/biogas/diesel generator hybrid energy system of an off-grid area in Bangladesh. In AIP Conference Proceedings; American Institute of Physics Inc.: College Park, MD, USA, 2017; p. 20020. [Google Scholar] [CrossRef] [Scilit]
- Oguntoke, O.; Amaefuna, B.A.; Nwosisi, M.C.; Oyedepo, S.A.; Oyatogun, M.O. Quantification of biodegradable household solid waste for biogas production and the challenges of waste sorting in Abeokuta Metropolis, Nigeria. Int. J. Energy Water Resour. 2019, 3, 253–261. [Google Scholar] [CrossRef] [Scilit]
- Pan, Z. Anaerobic Co-Digestion of Food Waste and Microalgae at Variable Mixing Ratios: Enhanced Performance, Kinetic Analysis, and Microbial Community Dynamics Investigation. Appl. Sci. 2024, 14, 4387. [Google Scholar] [CrossRef] [Scilit]
- Yang, Q. Biogas production from anaerobic co-digestion of waste activated sludge: Co-substrates and influencing parameters. Rev. Environ. Sci. Biotechnol. 2019, 18, 771–793. [Google Scholar] [CrossRef] [Scilit]
- Sánchez Sánchez, M. Análisis de Sensibilidad Bayesiana a Través de Clases de Distribuciones a Priori: Teoría y Aplicaciones. Ph.D. Thesis, Universidad de Cádiz, Cádiz, Spain, 2019. [Google Scholar]
- Appala, V.N.S.G.; Pandhare, N.N.; Bajpai, S. Mathematical Models for Optimization of Anaerobic Digestion and Biogas Production. In Zero Waste Biorefinery; Springer Nature: Singapore, 2022; pp. 575–591. [Google Scholar] [CrossRef] [Scilit]
- Haddon, A. Mathematical Modeling and Optimization for Biogas Production. 2019. Available online: https://theses.hal.science/tel-02478779 (accessed on 8 October 2024).
- Diniz, P.; da Costa, L.; da Silveira, J.; Barroso, G.; Barcellos, W. Performance evaluation of controllers applied to power generator set operating with wastewater biogas. Electr. Eng. 2021, 103, 753–768. [Google Scholar] [CrossRef] [Scilit]
- Mutaqin, M.I. Biogas Consumption Pattern in Indonesia: (A Case Study of Sumedang Community Biogas Plant, Indonesia). In Proceeding of the 2019 International Conference on Sustainable Energy Engineering and Application: Innovative Technology Toward Energy Resilience, ICSEEA 2019, Tangerang, Indonesia, 23–24 October 2019; Institute of Electrical and Electronics Engineers Inc.: Piscataway, NJ, USA, 2019; pp. 113–118. [Google Scholar] [CrossRef] [Scilit]
- Wang, Z. Impact of total solids content on anaerobic co-digestion of pig manure and food waste: Insights into shifting of the methanogenic pathway. Waste Manag. 2020, 114, 96–106. [Google Scholar] [CrossRef] [Scilit]
- Saghouri, M.; Abdi, R.; Ebrahimi-Nik, M.; Rohani, A.; Maysami, M. Modeling and optimization of biomethane production from solid-state anaerobic co-digestion of organic fraction municipal solid waste and other co-substrates. Energy Sources Part A Recover. Util. Environ. Eff. 2024, 46, 8564–8580. [Google Scholar] [CrossRef] [Scilit]

| Critical Parameters | Description | Recommendations for Its Control |
|---|---|---|
| C/N ratio (carbon/nitrogen) | The ideal C/N ratio for efficient anaerobic digestion is between 20:1 and 30:1. It is essential to mix low C/N (high nitrogen) waste with high C/N (high carbon) materials to maintain a healthy bacterial environment. | High C/N Ratio (35:1 or more): High-carbon waste, such as fruit peels, crop straw, or corn husks, is essential to stabilize the anaerobic digestion process, but it must be mixed with nitrogen-rich materials to prevent the process from becoming inefficient and slow. Moderate C/N Ratio (20–30:1): These residues, such as vegetable waste or cow manure, offer a good ratio of carbon to nitrogen. They are ideal for maintaining a stable balance in anaerobic digestion, favoring continuous and efficient biogas production. Low C/N Ratio (6–18:1): Nitrogen-rich wastes, such as chicken, pig, or rabbit manure, have a low C/N ratio, which facilitates rapid decomposition and intense biogas production. However, excess nitrogen can cause acidification and reduce the efficiency of the biodigester, so they must be mixed with carbon-rich materials to optimize production. |
| pH | Waste with a low C/N can reduce the pH of the biodigester, so it is important to monitor and adjust the pH to keep it between 6.5 and 7.5, the range in which methanogenic bacteria are most efficient. | The addition of waste such as eggshells or livestock manure helps to maintain pH stability. |
| Moisture | Moisture should be maintained between 50% and 60% in order to maximize biogas production and ensure the efficiency of the biodigester. If Moisture > 60% (High): Biogas production decreases due to nutrient dilution and possible stratification, affecting process efficiency. If Moisture < 50% (Low): Biogas production is reduced because anaerobic bacteria cannot efficiently decompose biomass in a dry environment, which inhibits the digestion process. | The addition of organic waste with different moisture levels can also influence the balance of the biodigester, since moisture being too high or too low can affect the activity of anaerobic bacteria. If moisture is high, dry materials such as dry leaves, plant residues, or sawdust can be added, which help to maintain the structure of the biomass. If the moisture is low, water or waste with a high water content, such as fruit and vegetable scraps, can be added to increase the moisture content. |
| Temperature | Temperature is one of the most important factors affecting microbial activity during the anaerobic digestion process. There are three thermal ranges where microorganisms work efficiently:
The mesophilic range is the most commonly used due to its stability and efficiency under standard conditions. The thermophilic range, although faster, requires greater control and energy to maintain high temperatures. | Maintaining a constant temperature within the optimal range for the type of microorganisms present (mesophilic or thermophilic) is crucial for the efficiency of the process. To do this, the following is recommended:
|
| Odor control | During the biogas production process, bad odors come mainly from the anaerobic decomposition of organic matter, such as animal feces and kitchen waste. The responsible compounds include hydrogen sulfide (H2S), as well as volatile fatty acids, ammonia (NH₃), and volatile organic compounds (VOCs). These gases are generated by the activity of microorganisms breaking down proteins, fats, and carbohydrates under anaerobic conditions. | Odors can be minimized by adding residues rich in cellulose and lignin (plant remains) and avoiding excessive greasy or oily residues. |
| Damping Capacity | Weighting Factor (WF) |
|---|---|
| High | 3 |
| Average | 2 |
| Low | 1 |
| Residue | [kg] | Damping Capacity | ||||
|---|---|---|---|---|---|---|
| Bovine manure | 20 | 7.0 | High | 3 | 60 | 6.00 × 10⁻⁶ |
| Pig manure | 10 | 6.5 | Average | 2 | 20 | 6.32 × 10⁻⁶ |
| Fruit peels | 5 | 4.8 | Low | 1 | 5 | 7.92 × 10⁻⁵ |
| Vegetable waste | 8 | 6.3 | Average | 2 | 16 | 8.02 × 10⁻⁶ |
| Egg shells | 5 | 7.5 | High | 3 | 15 | 4.74 × 10⁻⁷ |
| Coffee grounds | 2 | 5.3 | Low | 1 | 2 | 1.00 × 10⁻⁵ |
| Total | 118 | 1.10 × 10⁻⁴ | ||||
| 9.33 × 10⁻⁷ | ||||||
| 6.030 | ||||||
| Type of Waste | Biogas Production Potential [m3/kg VS] | Relevant Comment |
|---|---|---|
| Bovine | 0.20–0.30 | It depends on the fiber content |
| Pig | 0.35–0.50 | High protein and fat content |
| Hen/chicken | 0.40–0.55 | Generally high in nutrients |
| Horse | 0.18–0.28 | High fiber content, lower efficiency |
| Sheep | 0.22–0.32 | Contains more fiber, similar to bovine |
| Rabbit | 0.25–0.35 | Better results in mixed digestion systems |
| Goat | 0.22–0.33 | Fiber similar to sheep and cattle |
| Duck/goose | 0.40–0.50 | Similar to chicken waste in efficiency |
| Fruit remains (peels) | 0.30–0.45 | High in sugars, good efficiency |
| Vegetable waste | 0.20–0.35 | Variable water and fiber content |
| Cereal crop residues (straw) | 0.18–0.25 | Low in protein and fat, high in cellulose |
| Potato peels | 0.25–0.35 | Good conversion due to starch content |
| Egg shells | 0.00–0.02 | The contribution of eggshell to biogas production is negligible because eggshell matter is mainly inorganic and does not contribute significantly to biogas production, but it does provide nutrients to the mix |
| Coffee grounds | 0.25–0.35 | Moderate fat content, antioxidants |
| Corn residues (leaves, stalks) | 0.20–0.30 | Fibrous, similar to cereal straw |
| Stale bread/bread scraps | 0.35–0.50 | High in carbohydrates, good performance |
| Nut and seed shells | 0.15–0.25 | High hardness, low biogas potential |
| Leftover cooked rice | 0.30–0.45 | High in starch, similar to potatoes |
| Leftover cooked vegetables | 0.25–0.40 | Varies depending on the plant, high efficiency |
| Vegetable oils and fats | 0.80–1.00 | High biogas production due to their high lipid content makes them an excellent source of energy for anaerobic digestion; can cause fatty acid overload; ideal for co-digestion |
| Pasta | 0.45–0.60 | Produces a moderate level of biogas due to its carbohydrate and protein content; generates volatile fatty acids (VFA), which can acidify the biodigester if the pH is not monitored |
| Leaves and plant remains | 0.20–0.30 | Low biogas production; contain a high proportion of lignin and cellulose, which slows down digestion; pretreatment is recommended (pre-shredding or composting) to improve its biodegradability |
| Species | Moisture | Total Solids Fraction | Organic Matter Fraction | Volatile Solids Fraction [kg] | Biogas Production Potential [m3/kg] | = TS × MO × VS × PP [m3/kg] | |||||||
|---|---|---|---|---|---|---|---|---|---|---|---|---|---|
| Min. | Max. | Min. | Max. | Min. | Max. | Min. | Max. | Min. | Max. | Min. | Avg. | Max. | |
| Bovine | 0.85 | 0.88 | 0.12 | 0.15 | 0.75 | 0.80 | 0.70 | 0.75 | 0.20 | 0.30 | 0.0126 | 0.0198 | 0.0270 |
| Pig | 0.88 | 0.92 | 0.08 | 0.10 | 0.85 | 0.90 | 0.80 | 0.85 | 0.35 | 0.50 | 0.0190 | 0.0286 | 0.0383 |
| Hen/chicken | 0.70 | 0.75 | 0.25 | 0.30 | 0.60 | 0.65 | 0.55 | 0.60 | 0.40 | 0.55 | 0.0330 | 0.0487 | 0.0644 |
| Horse | 0.75 | 0.80 | 0.20 | 0.25 | 0.60 | 0.65 | 0.55 | 0.60 | 0.18 | 0.28 | 0.0119 | 0.0196 | 0.0273 |
| Sheep | 0.65 | 0.70 | 0.30 | 0.35 | 0.55 | 0.60 | 0.50 | 0.55 | 0.22 | 0.32 | 0.0182 | 0.0276 | 0.0370 |
| Rabbit | 0.65 | 0.70 | 0.30 | 0.35 | 0.50 | 0.55 | 0.45 | 0.50 | 0.25 | 0.35 | 0.0169 | 0.0253 | 0.0337 |
| Goat | 0.70 | 0.75 | 0.25 | 0.30 | 0.50 | 0.55 | 0.50 | 0.55 | 0.22 | 0.33 | 0.0138 | 0.0218 | 0.0299 |
| Duck/goose | 0.80 | 0.85 | 0.15 | 0.20 | 0.60 | 0.65 | 0.55 | 0.60 | 0.40 | 0.50 | 0.0198 | 0.0294 | 0.0390 |
| Fruit remains (peels) | 0.80 | 0.90 | 0.10 | 0.20 | 0.90 | 0.95 | 0.85 | 0.90 | 0.30 | 0.45 | 0.0230 | 0.0500 | 0.0770 |
| Vegetable waste | 0.80 | 0.90 | 0.10 | 0.20 | 0.85 | 0.90 | 0.80 | 0.85 | 0.20 | 0.35 | 0.0136 | 0.0336 | 0.0536 |
| Cereal crop residues (straw) | 0.50 | 0.70 | 0.30 | 0.50 | 0.70 | 0.80 | 0.60 | 0.70 | 0.18 | 0.25 | 0.0227 | 0.0463 | 0.0700 |
| Potato peels | 0.75 | 0.85 | 0.15 | 0.25 | 0.80 | 0.85 | 0.75 | 0.80 | 0.25 | 0.35 | 0.0225 | 0.0410 | 0.0595 |
| Egg shells | 0.05 | 0.10 | 0.90 | 0.95 | 0.30 | 0.40 | 0.10 | 0.20 | 0.00 | 0.02 | 0.0000 | 0.0008 | 0.0015 |
| Coffee grounds | 0.50 | 0.60 | 0.40 | 0.50 | 0.80 | 0.85 | 0.75 | 0.80 | 0.25 | 0.35 | 0.0600 | 0.0895 | 0.1190 |
| Corn residues (leaves, stalks) | 0.50 | 0.70 | 0.30 | 0.50 | 0.65 | 0.75 | 0.60 | 0.70 | 0.20 | 0.30 | 0.0234 | 0.0511 | 0.0788 |
| Stale bread/bread scraps | 0.30 | 0.40 | 0.60 | 0.70 | 0.85 | 0.90 | 0.80 | 0.85 | 0.35 | 0.50 | 0.1428 | 0.2053 | 0.2678 |
| Nut and seed shells | 0.05 | 0.10 | 0.90 | 0.95 | 0.40 | 0.50 | 0.30 | 0.40 | 0.15 | 0.25 | 0.0162 | 0.0319 | 0.0475 |
| Leftover cooked rice | 0.50 | 0.60 | 0.40 | 0.50 | 0.85 | 0.90 | 0.80 | 0.85 | 0.30 | 0.45 | 0.0816 | 0.1269 | 0.1721 |
| Leftover cooked vegetables | 0.75 | 0.85 | 0.15 | 0.25 | 0.85 | 0.90 | 0.80 | 0.85 | 0.25 | 0.40 | 0.0255 | 0.0510 | 0.0765 |
| Vegetable oils and fats | 0.00 | 0.02 | 0.98 | 1.00 | 0.95 | 0.99 | 0.95 | 0.99 | 0.80 | 1.00 | 0.7076 | 0.8438 | 0.9801 |
| Pasta | 0.50 | 0.55 | 0.45 | 0.50 | 0.85 | 0.90 | 0.80 | 0.85 | 0.45 | 0.60 | 0.1377 | 0.1836 | 0.2295 |
| Leaves and plant remains | 0.60 | 0.75 | 0.25 | 0.40 | 0.75 | 0.85 | 0.65 | 0.75 | 0.20 | 0.30 | 0.0244 | 0.0504 | 0.0765 |
| Residue | Density Avg [kg/L] | %Avg. Moisture | pH | C/N Avg. | Avg. | ||
|---|---|---|---|---|---|---|---|
| Avg | AC | CA Factor | |||||
| Bovine | 0.70 | 86.50 | 7.00 | High | 3 | 21.50 | 0.0198 |
| Pig | 0.65 | 90.00 | 6.50 | Average | 2 | 12.00 | 0.0286 |
| Hen/chicken | 0.55 | 72.50 | 6.80 | Average | 2 | 8.00 | 0.0487 |
| Horse | 0.75 | 77.50 | 7.00 | High | 3 | 25.00 | 0.0196 |
| Sheep | 0.70 | 67.50 | 7.20 | High | 3 | 17.00 | 0.0276 |
| Rabbit | 0.60 | 67.50 | 6.80 | Average | 2 | 11.00 | 0.0253 |
| Goat | 0.65 | 72.50 | 7.20 | High | 3 | 15.00 | 0.0218 |
| Duck/goose | 0.60 | 82.50 | 6.50 | Average | 2 | 10.00 | 0.0294 |
| Fruit remains (peels) | 0.50 | 85.00 | 4.75 | Low | 1 | 37.50 | 0.0500 |
| Vegetable waste | 0.65 | 85.00 | 6.25 | Average | 2 | 16.00 | 0.0336 |
| Cereal crop residues (straw) | 0.14 | 60.00 | 6.50 | Average | 2 | 70.00 | 0.0463 |
| Potato peels | 0.60 | 80.00 | 6.50 | Average | 2 | 22.50 | 0.0410 |
| Egg shells | 0.65 | 7.50 | 7.50 | High | 3 | 3.50 | 0.0008 |
| Coffee grounds | 0.60 | 55.00 | 5.25 | Low | 1 | 22.50 | 0.0895 |
| Corn residues (leaves, stalks) | 0.19 | 60.00 | 6.75 | Average | 2 | 50.00 | 0.0511 |
| Stale bread/bread scraps | 0.40 | 35.00 | 5.75 | Low | 1 | 25.00 | 0.2053 |
| Nut and seed shells | 0.30 | 7.50 | 6.00 | Low | 1 | 90.00 | 0.0319 |
| Leftover cooked rice | 0.80 | 55.00 | 6.50 | Average | 2 | 17.50 | 0.1269 |
| Leftover cooked vegetables | 0.68 | 80.00 | 6.75 | Average | 2 | 12.50 | 0.0510 |
| Vegetable oils and fats | 0.85 | 1.00 | 6.25 | Low | 1 | 25.00 | 0.8438 |
| Pasta | 0.70 | 47.50 | 6.00 | Average | 2 | 17.50 | 0.1836 |
| Leaves and plant remains | 0.15 | 67.50 | 6.75 | High | 3 | 45.00 | 0.0504 |
| Parameter | Most Probable Value | Q1 | Median (Q2) | Q3 | IQR (Q3–Q1) | Mean | Standard Deviation | Confidence Interval (95%) |
|---|---|---|---|---|---|---|---|---|
| Biogas Volume [L] | 3514.65 | 3168.71 | 3460.83 | 3726.85 | 558.14 | 3444.91 | 387.14 | (3420.89, 3468.94) |
| pH | 6.63 | 6.59 | 6.67 | 6.76 | 0.18 | 6.68 | 0.12 | (6.67, 6.68) |
| Moisture (%) | 59.79 | 59.07 | 59.93 | 60.86 | 1.79 | 59.97 | 1.21 | (59.89, 60.05) |
| C/N | 20.97 | 18.79 | 20.03 | 21.27 | 2.48 | 20.01 | 1.65 | (19.91, 20.11) |
| Vol. Substrate | 104.36 | 104.45 | 111.26 | 121.75 | 17.29 | 113.74 | 11.09 | (113.06, 114.43) |
| Parameter | Most Probable Value | Q1 | Median (Q2) | Q3 | IQR (Q3–Q1) | Mean | Standard Deviation | Confidence Interval (95%) |
|---|---|---|---|---|---|---|---|---|
| Biogas Volume [L] | 8587.05 | 6993.6 | 8134.86 | 9050.2 | 2056.59 | 8067.2 | 1246.66 | (7989.84, 8144.56) |
| pH | 6.65 | 6.44 | 6.60 | 6.74 | 0.29 | 6.59 | 0.19 | (6.58, 6.60) |
| Moisture (%) | 58.82 | 59.18 | 60.80 | 62.42 | 2.24 | 60.84 | 1.89 | (60.72, 60.96) |
| C/N | 19.63 | 19.23 | 19.94 | 20.79 | 1.56 | 19.98 | 1.04 | (19.91, 20.04) |
| Vol. Substrate | 110.49 | 110.17 | 112.28 | 114.3 | 4.13 | 112.29 | 2.73 | (112.12, 112.46) |
| Model | Methodology | Considered Variables | Limitations |
|---|---|---|---|
| Empirical Regression Model | Based on experimental data on biogas production | Substrate composition, temperature, retention time | Does not consider variability or nonlinear constraints |
| Artificial Neural Networks (ANN) | Learning algorithm based on historical data | Operational factors and substrate composition | Dependence on large volumes of training data |
| Proposed Model (Optimization with Nonlinear Constraints and Monte Carlo) | Mathematical optimization with physicochemical constraints and probabilistic sensitivity analysis | C/N ratio, pH, humidity, volatile solids, waste density | May require higher computational demand compared to deterministic models |
Disclaimer/Publisher’s Note: The statements, opinions and data contained in all publications are solely those of the individual author(s) and contributor(s) and not of MDPI and/or the editor(s). MDPI and/or the editor(s) disclaim responsibility for any injury to people or property resulting from any ideas, methods, instructions or products referred to in the content. |
© 2025 by the authors. Licensee MDPI, Basel, Switzerland. This article is an open access article distributed under the terms and conditions of the Creative Commons Attribution (CC BY) license (https://creativecommons.org/licenses/by/4.0/).
Share and Cite
Vesga Ferreira, J.C.; Florez Martinez, A.; Barbosa Jaimes, J.E. Linear Optimization Model with Nonlinear Constraints to Maximize Biogas Production from Organic Waste: A Practical Approach. Appl. Sci. 2025, 15, 10453. https://doi.org/10.3390/app151910453
Vesga Ferreira JC, Florez Martinez A, Barbosa Jaimes JE. Linear Optimization Model with Nonlinear Constraints to Maximize Biogas Production from Organic Waste: A Practical Approach. Applied Sciences. 2025; 15(19):10453. https://doi.org/10.3390/app151910453
Chicago/Turabian StyleVesga Ferreira, Juan Carlos, Alexander Florez Martinez, and Jhon Erickson Barbosa Jaimes. 2025. "Linear Optimization Model with Nonlinear Constraints to Maximize Biogas Production from Organic Waste: A Practical Approach" Applied Sciences 15, no. 19: 10453. https://doi.org/10.3390/app151910453
APA StyleVesga Ferreira, J. C., Florez Martinez, A., & Barbosa Jaimes, J. E. (2025). Linear Optimization Model with Nonlinear Constraints to Maximize Biogas Production from Organic Waste: A Practical Approach. Applied Sciences, 15(19), 10453. https://doi.org/10.3390/app151910453