Article

An Open-Source Virtual Reality Traffic Co-Simulation for Enhanced Traffic Safety Assessment

by
Ahmad Mohammadi
1,*,
Muhammed Shijas Babu Cherakkatil
1,
Peter Y. Park
2,
Mehdi Nourinejad
1 and
Ali Asgary
3
1
Department of Civil Engineering, Lassonde School of Engineering, York University, Toronto, ON M3J 1P3, Canada
2
Research, Innovation, Enterprise & Partnerships, Lassonde School of Engineering, York University, Toronto, ON M3J 1P3, Canada
3
School of Administrative Studies, Faculty of Liberal Arts and Professional Studies, York University, Toronto, ON M3J 1P3, Canada
*
Author to whom correspondence should be addressed.
Appl. Sci. 2025, 15(17), 9351; https://doi.org/10.3390/app15179351
Submission received: 9 June 2025 / Revised: 1 August 2025 / Accepted: 12 August 2025 / Published: 26 August 2025
(This article belongs to the Special Issue Road Safety in Sustainable Urban Transport)

Abstract

Transportation safety studies identify and analyze different contributing factors affecting the safety of road users using virtual reality (VR) traffic simulations in game engines (e.g., Unity). They often either use simplified VR traffic simulation or develop a more advanced simulation requiring substantial technical expertise and resources. The Simulation of Urban Mobility (SUMO) software is widely employed in the field, offering extensive traffic simulation rules such as car-following models, lane changing models, and right-of-way rules. In this study, we develop an open-source virtual reality traffic co-simulation by integrating two different simulation software, SUMO and Unity, and developing a virtual reality traffic simulation where a VR user in Unity interacts with traffic generated by SUMO. In our methodology, we first explain the process of creating road networks. Next, we programmatically integrate SUMO and Unity. Finally, we measure how well this system works using two indicators: the real-time factor (RTF) and frames per second (FPS). RTF compares SUMO’s simulation time to Unity’s simulation time each second, while FPS counts how many images Unity draws each second. Our results showed that our proposed VR traffic simulation can create a realistic traffic environment generated by SUMO under various traffic densities. This work offers a new platform for driver-behavior research and digital-twin applications.

1. Introduction

1.1. VR Traffic Simulation to Analyze Road User Behavior

Virtual Reality (VR) traffic simulation creates immersive three-dimensional environments where a human wears head-mounted glasses and interacts with virtual traffic objects and scenarios. Another way of creating an immersive three-dimensional environment is through traffic simulators (using three flat monitors in front of a user without head-mounted glasses).
Traffic safety studies from different backgrounds, such as transportation engineering, psychology, education, and health, use VR traffic simulation or simulators to investigate road user behavior across various scenarios including in-vehicle systems, infrastructure designs, or environmental conditions. Recent studies, including Pasetto and Barbati [1], Wulf et al. [2], Shi and Liu [3], DeGuzman and Donmez [4], and Krasniuk et al. [5], have typically followed six main steps to investigate road user behavior using VR:
  • Study Goal Definition: Define clear objectives, such as improving in-vehicle systems or infrastructure designs.
  • Scenario Development: Create multiple scenarios (for example, different in-vehicle systems).
  • Measures of Effectiveness (MOEs) Development: Compare scenario outcomes using measures such as reaction time, collision rates, eye movements, simulation sickness, and questionnaires.
  • VR Traffic Simulation Design: Build a VR environment where participants interact with various traffic objects.
  • Inviting Participants for Data Collection: Invite participants to provide study data such as vehicle trajectory (x, y, z coordinates).
  • Best Scenario Identification: Select the best scenario based on the MOEs.
For example, one group of researchers focuses on improving in-vehicle systems, particularly advanced driver assistance systems such as adaptive cruise control and lane-keeping assistance (Wulf et al. [2]; DeGuzman and Donmez [4]). For example, DeGuzman and Donmez [4] evaluated three different driver training approaches (no training, training with images, and training with videos) for advanced driver assistance systems. The study aimed to compare the effectiveness of different training methods through eight hazardous scenarios. They employed three MOEs, including eye-tracking metrics, reaction times, and questionnaires. Their methodology involved assessing 47 participants’ responses through these MOEs. The results revealed that training with videos proved most effective, demonstrating improved situational awareness and faster response times. However, their traffic simulation was in a free-flow traffic density and simplified, using vehicles moving at constant speeds (50 km/h) with predetermined behaviors.
Another group of researchers focuses on improving infrastructure designs (Pasetto and Barbati [1]; Shi and Liu [3]). For example, Shi and Liu [3] investigated how different speed limits per lane affect lane-changing behavior and driver workload in a VR-simulated environment. The study had 36 participants. The researchers compared multiple scenarios, including a scenario with uniform speed limits (60 km/h minimum and 120 km/h maximum) and a scenario with the same maximum speed (120 km/h) but different minimum speeds (60 km/h and 90 km/h). The MOEs included lane-changing duration, lateral acceleration, average speed, lane-changing frequency, and driver workload. The results showed that different speed limits per lane led to higher driver workload, shorter lane change duration, and slower speeds during lane changes. Unfortunately, as the traffic simulation in the Shi and Liu study [3] was also simplified with free flow conditions and few surrounding vehicles moving on predefined paths, the study may not have captured the complexity of real-world traffic.
Another group of researchers focuses on analyzing driver safety under changing environmental conditions (Gilandeh et al. [6]). For example, Gilandeh et al. [6] investigated the effects of lighting conditions (daytime vs. nighttime) on driver behavior. They examined multiple scenarios, including different roadway segments (e.g., straight segments and segments with shallow/steep curves) in daytime and nighttime lighting conditions. Their MOEs were average driving speed and average lateral distance. The study included 40 participants. The results showed that average driving speed decreased in nighttime scenarios compared to daytime on each type of roadway segment. While the simulation included some random traffic in the opposite lane to prevent drivers from entering that lane, the traffic was simplified with free-flow conditions and limited interaction between vehicles.

1.2. Problem Statement

It is clear that existing studies suffer from two notable shortcomings. The first shortcoming is the studies’ reliance on simplified traffic simulations (limited vehicle-to-vehicle interactions and predefined behaviors) which may reduce how closely their findings match real-world traffic conditions. According to the fundamentals of traffic simulation design (Dowling [7]; Barcelo [8]), two key concepts provide realistic vehicle-to-vehicle interactions: car-following models (for longitudinal movements) and lane-changing models (for lateral movements). Car-following models describe how drivers maintain distance and adjust their speed in response to the lead vehicle (Brackstone and McDonald [9]). Lane-changing models account for factors such as vehicle speeds, traffic density, and individual driver preferences by focusing on how and when drivers decide to switch lanes (Toledo et al. [10]).
The second shortcoming is that traffic simulations focused on road safety typically model free-flow traffic conditions (Level of Service A). Level of Service (LOS) is a concept widely used in traffic engineering to describe how well a transportation facility is operating under certain traffic densities. The Highway Capacity Manual (Transportation Research Board [11]) classifies traffic density into six categories ranging from A (best) to F (worst). For example, if the traffic density is lower than 11 vehicles per mile per lane, the LOS is A (free flow), and if traffic density is between 11 and 18 vehicles per mile per lane, the LOS is B (reasonably free flow). Entering a specific number of vehicles in the simulation does not guarantee a target traffic density (LOS) during the simulation period (Dowling [7]; Barcelo [8]). This is because traffic jams form and clear differently in various parts of a road network depending on bottlenecks, merging lanes, and busy intersections. To address this issue, Dowling [7] and Barcelo [8] suggested employing detection points (known as vehicle detectors) at various road sections to monitor and verify actual vehicle counts during the simulation run.
Some researchers, such as Farooq et al. [12], have attempted to address the studies’ shortcomings by developing more sophisticated VR traffic simulations. This demands not only a deep theoretical understanding of the fundamentals of traffic simulation design (e.g., car-following and lane-changing models for realistic vehicle-to-vehicle interactions) and vehicle detectors (to count the number of vehicles for different traffic densities) but also substantial technical expertise and resources. These challenges indicate that there is still a significant gap between current VR traffic safety research practices and more realistic VR traffic simulations.
Traffic simulation software, such as Simulation of Urban Mobility (SUMO), already provides a comprehensive traffic system that offers realistic vehicle-to-vehicle interactions based on car-following and lane-changing models. The software can add vehicle detectors to measure traffic density, and contains additional capabilities including posted speed limit compliance, turning movement behaviors, right-of-way rules, and intersection controls (both signalized and unsignalized).
A potential solution to the shortcomings and challenges outlined here lies in creating an integrated system in which a human participant in a game engine (e.g., Unity) can interact with traffic objects generated by SUMO micro-simulation (known as traffic-co-simulation). This integration requires bi-directional communication: SUMO must send vehicle trajectory data to the Unity environment for 3D visualization, while the Unity environment must send back the trajectory data of the VR simulator vehicle to SUMO. SUMO is written in Python (version 3.12.10) programming language, and Unity is written in C# programming language. Integration requires the main integration script (the server script) to be either in Python (inside SUMO) or in C# (inside Unity). SUMO provides extensive accessibility for controlling the simulation (methods and functions) in Python programming language and limited accessibility in C# programming language.
Several related works established an integration between SUMO and Unity (See Table 1). For example, Olaverri-Monreal et al. [13] developed a SUMO–Unity integration to evaluate vehicle-to-everything (V2X) in the autonomous-vehicle domain. The study area is flat and does not include elevation data for road-surface infrastructure—specifically, highway on/off ramps and interchanges. It does not handle the addition of vehicle detectors to control traffic densities (for different LOS), and the tool provides no performance measures to evaluate the integration. Mohammadi et al. [14] developed an integration between SUMO and Unity, but the implementation had three major limitations. Firstly, the study provided a fixed static flat environment with a signalized intersection, but it did not provide a framework to explain how to develop a road network that would include, for example, several lanes and interchanges. Secondly, the tool does not handle adding vehicle detectors to control traffic densities (for different LOS). Thirdly, the tool does not provide a performance measure to evaluate the integration performance. Pechinger and Lindner [15] developed an integration of SUMO and Unity; however, SUMO still controls all the traffic decisions—where each car goes, how fast they drive, and when they change lanes—thus a VR user cannot yet take control of a car and drive freely. The paper does not state whether elevated road networks (e.g., hills) are supported, nor does it show how to add traffic detectors that would let researchers adjust congestion levels. They selected a vehicle, compared the trajectory of the vehicle in SUMO and Unity, and concluded that the vehicle stays within half a meter of their planned path; however, it does not offer quantitative performance measures that show the integration performance for all vehicles movements. Liao et al. [16] integrated SUMO and Unity to study connected and autonomous vehicles on a small on-ramp/main-line segment in Riverside, CA. Elevation support is unclear, traffic detectors are not considered, and the reported metrics focus only on average speed and MOVES fuel savings; there is no information on computational performance, network delay, or Unity–SUMO tracking accuracy, making it difficult to judge real-time suitability. Nagy et al. [17] integrates SUMO into Unity to evaluate traffic emission. The study area is small and flat and does not include elevated road networks. Traffic detectors are absent; thus, traffic density cannot be varied or verified at LOS targets. A VR vehicle can be controlled with a steering wheel and pedals, but the authors do not report a performance measure to evaluate the integration performance (e.g., latency) between the two simulations.
In this study, we use Python programming language to develop the integration, provide extensive accessibility for controlling the simulation (methods and functions), and overcome the limitations of existing studies.

1.3. Study Goal and Objectives

The goal of this study was to develop a novel VR traffic simulation designed to enhance the VR traffic simulation used in existing traffic safety studies. The study objectives were:
  • Road network creation process that can be used in both SUMO and Unity to develop a road network that includes several lanes and interchanges.
  • SUMO and Unity Integration to enable realistic vehicle-to-vehicle interactions and the inclusion of different traffic densities (different levels of service).
  • Performance functions development to evaluate the performance of the integration.

1.4. The VR Traffic Simulation Development

We developed our VR Traffic Simulation based on the study objectives. Each of the three study objectives became a phase in the development. Figure 1 provides a graphic representation of the three phases. In the first phase, we developed a process to create a road network for both SUMO and Unity. In the second phase, we developed the integration of SUMO and Unity to provide realistic vehicle-to-vehicle interactions and to capture different traffic densities. In the third phase, we developed two performance functions to evaluate the performance of the SUMO and Unity integration.

2. Literature Review

2.1. SUMO

SUMO is an open-source microscopic traffic simulation developed by the German Aerospace Center in 2001 (Krajzewicz et al. [18]). It was designed to model and simulate the behavior of road users across various road networks ranging from an urban intersection to large-scale regional networks. While SUMO stores road network coordinates in three dimensions (x, y, z), its graphical interface only displays a two-dimensional view. SUMO operates on the basis of a discrete simulation step rather than wall clock time to advance its simulation time. In other words, the simulation advances in fixed increments (e.g., 0.10 s per simulation step), and each step updates vehicle positions, speeds, and interactions according to underlying car-following and lane-changing models. This approach allows researchers to pause and accelerate the simulation, and to incorporate custom control logic at each step (for example, the approach allows researchers to take control of one car in the simulation). SUMO allows vehicle detectors to be added to the road networks to count the number of vehicles during the simulation period.

2.2. Unity

Unity is a game engine initially released by Unity Technologies in 2005, and is widely used for creating VR environments (Yu [19]). It naturally supports three-dimensional (x, y, z) road networks and can visually render the networks in full three-dimensions. Unlike SUMO, Unity relies on continuous wall clock time to advance its simulation time. Each frame (image) corresponds to a fraction of a second, and object movements, animations, and physics calculations are updated continuously based on wall clock time.

2.3. Integration Challenges of SUMO and Unity

Examination of the SUMO and Unity indicated three challenges for integration.
The first challenge was that the three-dimensional (x, y, z) coordinates for the SUMO and Unity road networks had to match precisely. Any misalignment could cause vehicles to deviate from the intended surface and appear above, below, or off the road. Achieving precise alignment required a carefully designed road network to ensure that both simulations shared the same (x, y, z) coordinates for the road networks.
The second challenge was that SUMO advances its simulation time in fixed time steps to accurately model traffic dynamics whereas Unity continuously updates object positions and graphics based on continuous wall clock time. Achieving precise integration required carefully designed communication and timing control to ensure that both simulations progressed consistently.
The third challenge was that developing performance measures that can quantitatively illustrate the performance of the entire integration of two different software programs was a difficult task. As the integration contains programming both to exchange data and 3D visualizations and to show 3D objects, two different performance measures (one for programming and one for 3D visualizations) seemed necessary.

3. Methodology

3.1. Road Network Creation Process

We focused on a 12 km stretch of Ontario’s Highway 401 that includes seven lanes in each direction (14 lanes total) and includes five interchanges. To streamline production, the corridor was split into nine smaller segments, each about 1.3 km long. We started by selecting the last section (which contained one interchange) as a representative section and processed it through the four-step process shown in Figure 2. Each of the remaining sections was then processed using the same four-step process. The four steps in the road network creation process were:
(a)
GIS Maps: We georeferenced each map to real-world coordinates which aligns a map to its correct position and scale in the real world. We exported the aerial imagery as a PNG file and the elevation map as a TIF file. This step ensures accurate terrain representation (see Figure 2a).
(b)
Road Network in RoadRunner: We imported the maps into MathWorks RoadRunner as reference layers. This powerful road-network-generation tool, owned by Matlab, contains tools that allow users to create a detailed road network capturing highway geometry, on/off-ramps, and elevation changes (see Figure 2b). First, we drew lanes (3.75 m) and shoulders (3.0 m) that exactly matched the road’s horizontal geometry. Then, RoadRunner’s Project Roads tool automatically fitted the roadway surface to the terrain with an accuracy of about 2 m. After creating the road surface, we manually added road markings based on the aerial imagery reference.
(c)
Road Network in Unity and SUMO: RoadRunner can correlate the 2-D road network in SUMO with the 3-D road network in Unity by exporting through the OpenDRIVE format. OpenDRIVE, introduced by VIRES Simulationstechnologie GmbH in the mid-2000s, is a standard that describes road geometry and lane counts in a machine-readable form for different software (Dupuis et al. [20]). In practice, RoadRunner converts the 3-D road network to a 2-D OpenDRIVE file that SUMO can read (see Figure 2c); and
(d)
Buildings, road signs, and trees (see Figure 2d): We created buildings with SketchUp software (https://sketchup.trimble.com). We used real-world images for creating 38 buildings near the highway. There are several residential areas that contain many buildings in the study area. We created 12 generic residential buildings randomly and placed them in residential areas. For road signs, we firstly observe the real-world sign in the location (we use Google Street View or real-world images from dashboard camera) to locate the sign. Then, we added road signs in MathWorks RoadRunner, which includes a wider range of existing Canadian road signs. If an Ontario-specific sign is absent from RoadRunner (e.g., signs with local place names), we created it manually using sign tool in RoadRunner.
For trees, we used a mobile application “Picture This”, which identifies tree species from real-world photos. We took random images from the study area that helped us identify common trees such as maple and spruce. We then obtained the 3D models of those trees in Unity and placed them throughout the environment. In SUMO, these extra 3D assets are ignored, whereas in Unity they enhance driver immersion in VR. These elements make the scene resemble the real world.
While SUMO can import OpenDRIVE files from MathWork RoadRunner, the integration process requires careful attention to four technical challenges: junctions, geometry, connections, and elevations.
(1)
Junctions: A junction is where two or more roads meet, usually as an intersection or by merging. Importing OpenDrive junctions into SUMO may initially produce simplified junctions. Figure 3a shows an example of a simplified junction. The problem can be avoided by intervening manually to create improved alignment and smoother transitions, and to ensure that vehicles can navigate junctions and merging lanes as intended (see Figure 3e).
(2)
Geometry: Geometric alignment refers to the precise layout, orientation, and continuity of road segments. In OpenDrive, roads can include complex curves with varying widths. When imported into SUMO, these roads may initially appear misaligned (see Figure 3b). By refining the import process, adjusting lane definitions, or revising geometry parameters, Figure 3f presents a smoother, more coherent roadway.
(3)
Connections: SUMO may create incorrect lane connections when lanes merge or diverge, especially on-ramps and off-ramps. For example, Figure 3c shows an off-ramp where the rightmost lane should be split into two. Manual editing is used to correct such problems. See Figure 3g.
(4)
Elevations: SUMO may import incorrect elevation data from OpenDrive, causing vehicles to appear above or below the road surface as shown in Figure 3d. After manual adjustments, roads and vehicles line up correctly in 3D, creating a more realistic view of slopes and changes in height. See Figure 3h.

3.2. SUMO and Unity Integration

The integration of SUMO and Unity was divided into three primary tasks. The first task was determining the cycle time, i.e., the total amount of time required for data exchange between SUMO and Unity. To measure the cycle time, the procedure was broken down into several smaller tasks, and the duration of each task was analyzed. The second task was realistic vehicle-to-vehicle interactions. These interactions determine the car following and lane changing models. The third task was handling traffic density.

3.2.1. Cycle Time

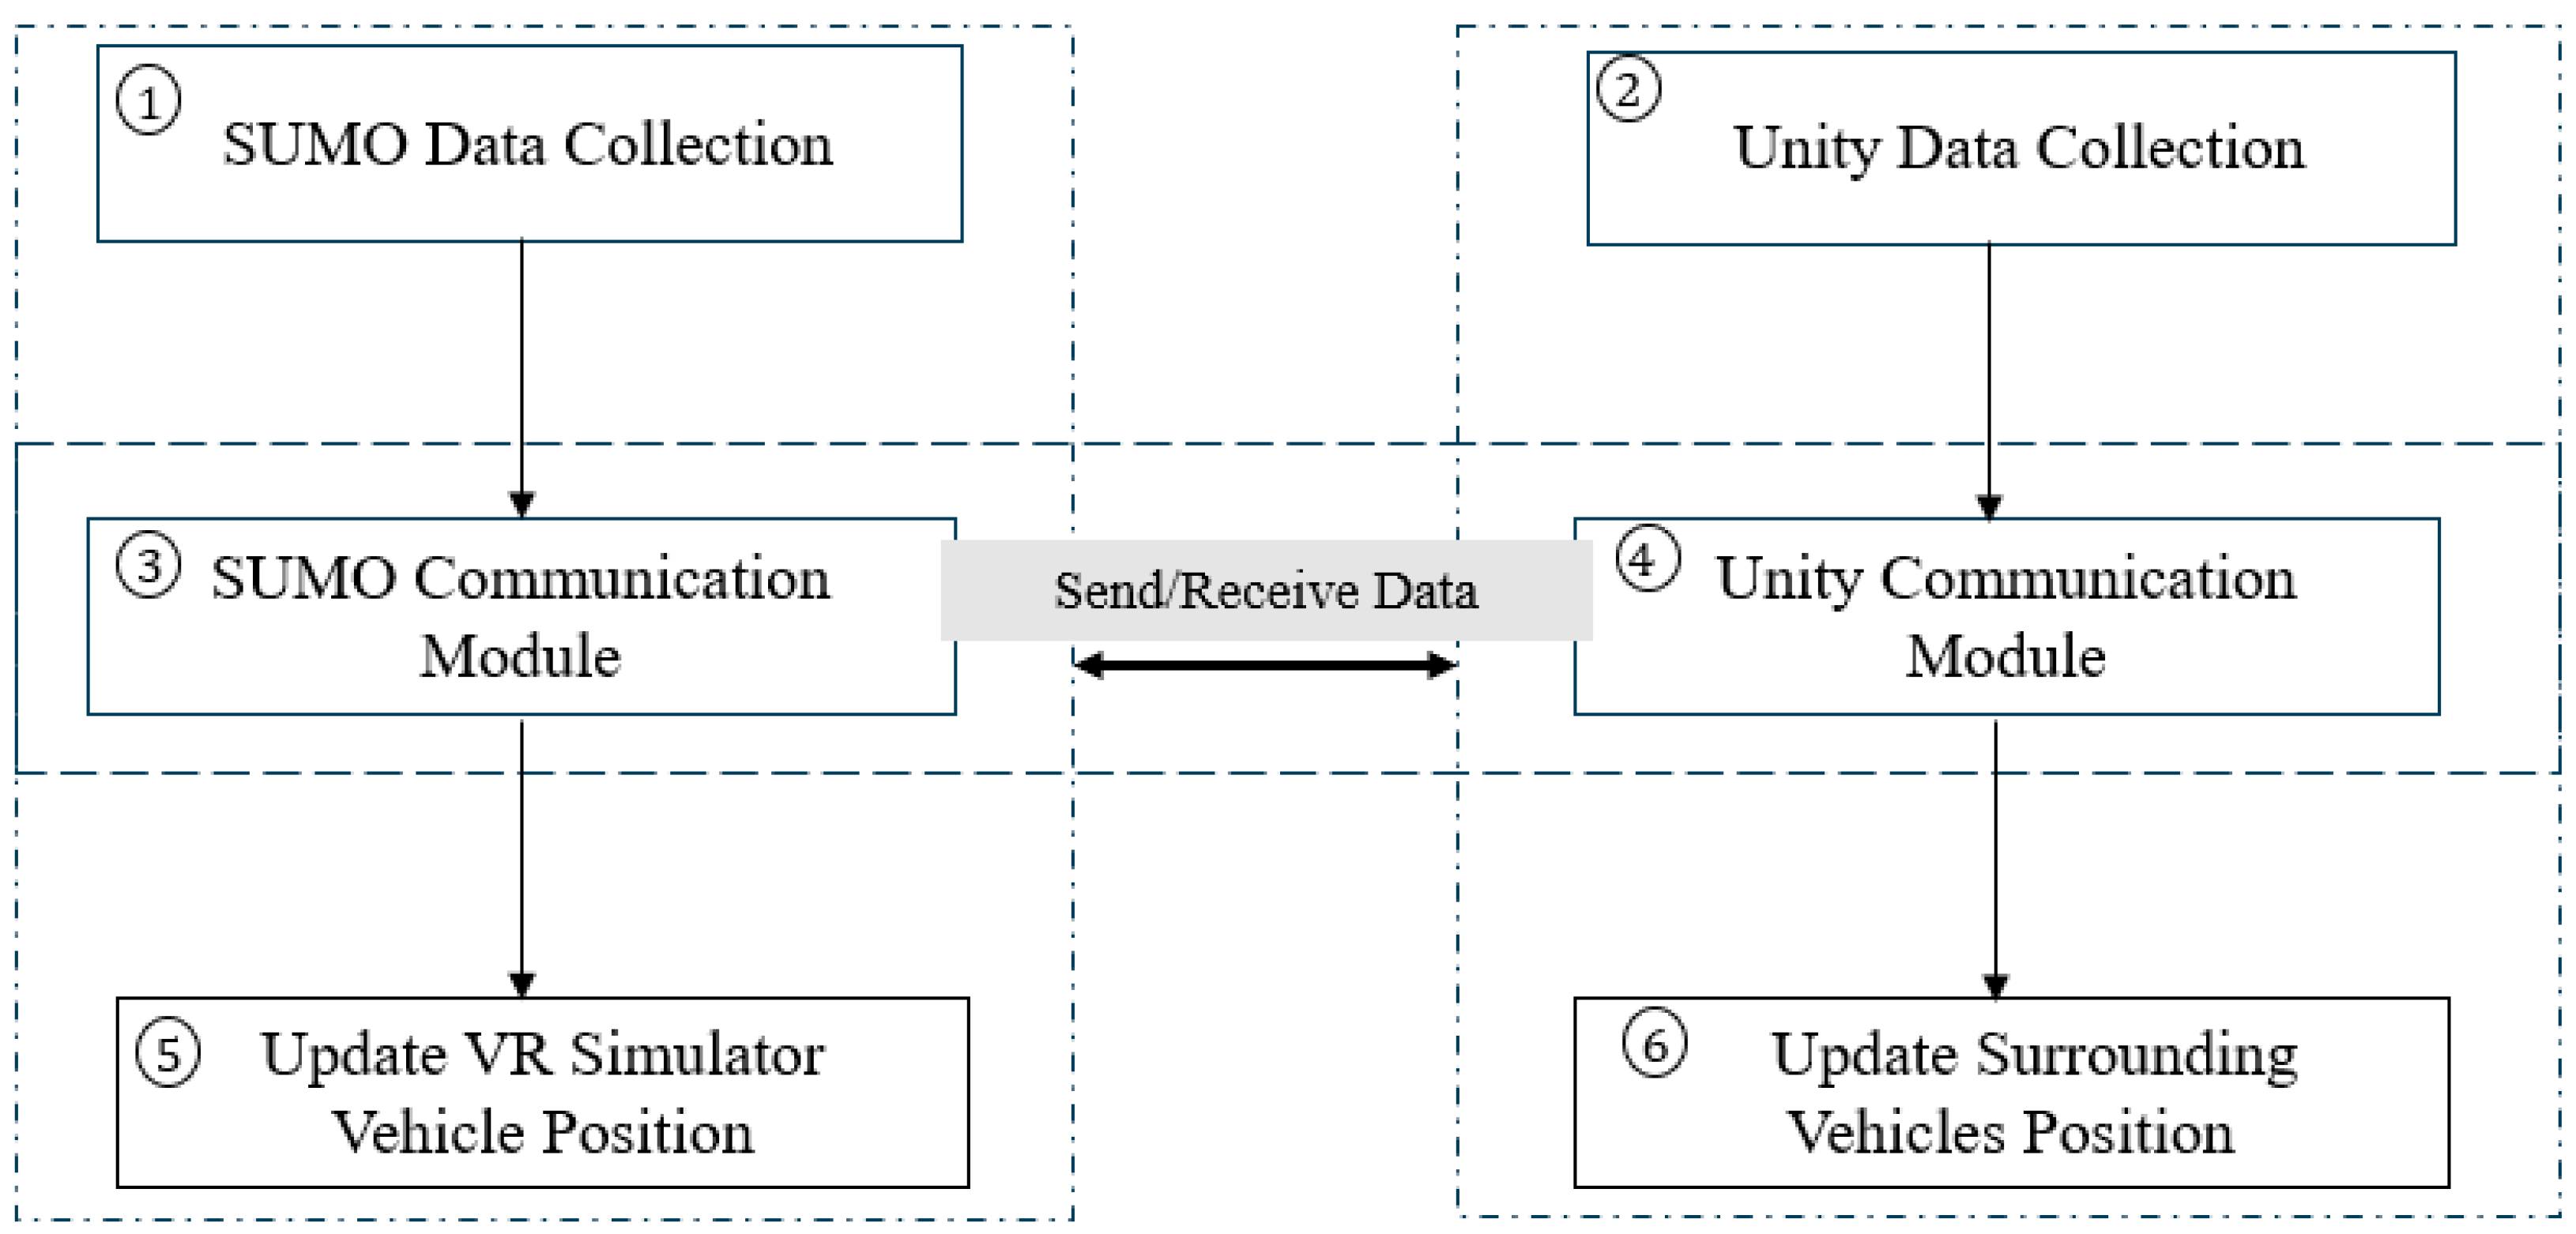
The procedure required for the cycle time task involved six steps. See Figure 4.
(a)
Step 1 (SUMO Data Collection): To collect data from SUMO, the SUMO communication module retrieves data from the SUMO traffic simulation. These data include trajectory data of vehicles (e.g., positions and orientation). Gathering the data requires calling proper methods from the SUMO application programming interface (known as the TraCI interface). The time taken in this step depends on factors like the complexity of the network and the number of vehicles. During step 1, the script must wait for SUMO to provide all the information needed for an accurate reflection of the current state of the simulated traffic.
(b)
Step 2 (Unity Data Collection): After collecting the data from SUMO, the Unity communication module retrieves the trajectory data of the VR simulator vehicle from Unity. Unity provides the vehicle’s current position and orientation. This step ensures that the module is aware of the VR simulator vehicle’s latest state, allowing Unity to integrate the information back into SUMO. The time required here is related to the data collection from Unity.
(c)
Step 3 (SUMO Communication Module): In step 3, the integration uses the SUMO communication module to handle two primary data-exchange tasks. Firstly, the SUMO Communication Module receives traffic state data, such as vehicle positions, speeds, and traffic light states, from SUMO. These data are then prepared and sent over to the Unity communication module so that Unity can accurately represent the current simulation scenario in its VR environment. Secondly, the SUMO Communication Module also receives updated VR simulator vehicle trajectory data from the Unity. The updated VR simulator vehicle trajectory data are passed forward to Step 5 where SUMO incorporates the VR simulator vehicle’s position and behavior into its traffic environment. The time taken for this step depends on the size of the data exchange.
(d)
Step 4 (Unity Communication Module): In step 4, the integration code interacts with Unity through a dedicated communication link that handles two main data exchange tasks. The first exchange involves sending the processed SUMO traffic state data (vehicle positions, speeds, etc.) to Unity to enable Unity to update its virtual environment and ensure that what the user sees in the VR headset mirrors the current simulation state. In the second exchange, the script receives the VR simulator vehicle’s latest trajectory from Unity. The updated trajectory data reflect the human participant’s real-time inputs (e.g., steering and acceleration) and will be used in subsequent steps to inform SUMO’s traffic model and maintain continuous integration and realism between the user’s actions and the evolving traffic scenario. The time taken here depends on the size of the data exchange.
(e)
Step 5 (Update VR Simulator Vehicle Position in SUMO): After the VR simulator vehicle’s new position has been sent to SUMO and processed, SUMO integrates the VR simulator vehicle’s state into the network. This step involves applying SUMO’s car-following and lane-changing models to adjust traffic conditions accordingly. The time this step takes depends largely on the complexity of the simulation and the number of vehicles. It is a computational step executed by SUMO to ensure the simulation reflects the VR simulator vehicle’s influence on other vehicles and traffic elements.
(f)
Step 6 (Update Surrounding Vehicles Positions in Unity): Finally, Unity processes the incoming data about surrounding vehicles, and updates their positions, movements, and states in the VR environment. This step involves rendering the updated scenario so that the participant sees a realistic and synchronized traffic environment. The time for this step depends on Unity’s rendering speed and scene complexity.
The cycle time is the sum of the durations of these six steps. Ideally, the cycle time should match the SUMO simulation step for perfect integration. If the cycle time is less than the SUMO simulation step, the system will finish processing the new data and updates before SUMO is ready to advance to the next time step. In this case, the system can remain idle or “sleep” until the SUMO simulation time catches up, ensuring that both SUMO and Unity progress in the same time. If the cycle time is greater than the SUMO simulation step, the simulation lags behind the real-time updates and SUMO might have already moved on to the next simulation step by the time Unity receives and displays the new positions. This discrepancy can cause delays and integration issues between the VR visualization and the traffic movements.
Other researchers have solved similar integration problems in different simulation domains by using methods that adjust timing or introduce controlled delays. For example, in robotic domains, frameworks based on two separate simulation tools, each running on its own simulation time, work together smoothly. An example is the Functional Mock-up Interface proposed by Blochwitz et al. [21]. The two tools work together smoothly by adding an adjustable delay parameter that can keep the cycle time of each tool (in our case SUMO and Unity) aligned with the simulation step, ensuring a stable and realistic environment between the two tools. In our case, an extra time parameter (a form of adjustable delay) can be introduced. After completing all six steps, if the total cycle time is shorter than the SUMO simulation step, the code can wait the remaining time until the next SUMO step is due. If the cycle time runs longer than anticipated, this parameter can be adjusted in subsequent cycles to ensure that over time the average loop duration aligns closely with the SUMO step. By dynamically adjusting this delay parameter, one can achieve a stable, good integration between the SUMO simulation time and Unity simulation time.

3.2.2. Vehicle-to-Vehicle Interactions

We used SUMO’s default models in the vehicle-to-vehicle interactions task. In the default car following model, the Krauss model, each driver seeks to maintain the minimum distance required from the vehicle ahead to ensure that no collisions occur, while simultaneously trying to travel at the desired speed. The model calculates acceleration or deceleration based on factors such as relative speed, spacing, and maximum possible deceleration. The default lane-changing model is the LC2013 model. This model is designed to align with real-world driving patterns. It uses a rule-based approach that considers factors such as the current and target lane speeds, available gaps, and urgency regarding the need to keep right or move toward a certain route. LC2013 provides a foundational yet adjustable framework for lane-changing simulations.

3.2.3. Handling Traffic Densities (Different LOS)

The handling traffic densities task involved two tasks: adding detectors, and limiting the data exchange to vehicles close to the VR simulator vehicle.
(A)
Adding Detectors
We needed to add detectors to count the number of vehicles to determine traffic density in our proposed simulation. We located vehicle detectors on each lane at the beginning of the highway section. Figure 5 shows the placement of detectors. The detectors provided traffic density information for the entire simulation period. By comparing the traffic density with fixed thresholds, we could determine the different LOS.
(B)
Limiting the data exchange to nearby vehicles to the VR simulator vehicle
In reality, a driver’s behavior and interactions with traffic objects such as vehicles, pedestrians and other dynamic objects are limited by the driver’s range of perception, and virtual environments attempt to replicate this reality as accurately as possible. A driver’s interaction with traffic elements rarely extends beyond a certain spatial radius. According to the American Association of State Highway and Transportation Officials’ transportation engineering guideline (AASHTO [22]), the maximum decision sight distance for drivers is 555 m, indicating that objects beyond this range are less likely to have an immediate impact a driver’s decision-making.
Macedonia et al. [23] and Singhal and Zyda [24] introduced the notion of “areas of interest” in large-scale virtual simulations. The main idea behind “areas of interest” is to improve virtual simulations by tracking only the entities (e.g., vehicles) that are within a certain distance of a reference point, such as VR simulator vehicle in a traffic simulation. By restricting the data exchange to objects within a defined spatial radius, unnecessary trajectory communications from distant entities are eliminated. This selective dissemination of data reduces the size of the data exchange enabling smoother performance. The approach maintains realism within the user’s field of interaction while efficiently managing large-scale simulation environments. We use the “areas of interest” technique by limiting the exchange of data to vehicles within a certain distance of the VR simulator vehicle.

3.3. Develop Performance Functions

The development of the performance functions involved consideration of the real-time factor (RTF) and the frame rate per second (FPS).
(A)
Real-Time Factor
The RTF is a performance metric widely used in simulation tools, including Gazebo, V-REP and Webots, to indicate how quickly a simulation is running relative to wall-clock time (Koenig and Howard [25]).
If the RTF is greater than 1, the simulation is running faster than wall-clock time. If the RTF is less than 1, the simulation is running slower than wall-clock time. The indicator shows the performance of the integration design and should maintain a value of 1 over the course of the simulation.
In our case, the RTF was the ratio of the SUMO simulation time to the Unity simulation time, and served as a way to measure the performance of the integration.
(B)
Frame Rate Per Second
The frame rate per second (FPS) is the number of images that Unity can display each second which is important because research shows that when the FPS is lower than 90, the VR display becomes laggy which can lead to dizziness (often called simulation sickness) and make users uncomfortable (Mirauda et al. [26]; Pense et al. [27]).
Industry standards recommend at least 90 FPS to minimize these issues (Oculus VR, [28]). When the VR scene is updated quickly and consistently, ideally at or above 90 FPS, users perceive smoother motion and a more realistic presence within the simulated environment.
In our case, we clearly had to maintain a high and stable FPS over the course of the VR simulation in Unity to ensure user comfort and immersion. The FPS provided a measure of our performance.

4. Analysis of Results

We conducted a sensitivity analysis based on two important parameters, traffic density and SUMO simulation time (i.e., SUMO step length), and were able to demonstrate the performance of the integration using two performance measures.

4.1. Traffic Density

As earlier studies have been limited by simplified traffic simulation, for example, simulations based on free-flow traffic density, vehicles moving at constant speeds (e.g., 50 km/h), it was important for this study to show that we can generate and investigate different traffic densities and vehicle speeds. In this study, we successfully generated LOS A-F to show that VR traffic simulation is based on different traffic densities. We were also able to successfully simulate various vehicle speeds. We defined the maximum speed of vehicles in the SUMO traffic simulation to be the posted speed limit in the study area (100 km/h). This did not mean that the vehicles were all traveling at 100 km/h as the simulation reflected vehicle interactions and resulting changes in speed due, for example, to vehicles needing to brake (e.g., when merging and diverging) or accelerate (e.g., when vehicles try to change lane).

4.2. SUMO Simulation Time

As discussed in Section 2.1, SUMO simulation time progresses using a specified step length. A smaller step length time increases the accuracy of the simulation, but increases the computational resources required. As a smaller step length also increases the data exchange between SUMO and Unity, a smaller step length affects the RTF and FPS.
We used the simulator and drove the first 5 km of the study’s highway segment with a maximum speed of 100 km/h. The detectors provided the traffic density for the entire simulation period.
We ran 18 experiments (3 different step lengths (0.1 s, 0.2 s, 0.3 s) for each LOS). The simulation period took an average of 150 s over the 18 experiments. All the experiments were conducted on a Lenovo ThinkPad P15 Gen 2i laptop running Microsoft Windows 10 Pro (Version 10.0.19045). The system was equipped with an 11th Generation Intel® Core™ i7-11800H processor operating at 2.30 GHz across 8 cores with an NVIDIA RTX A4000 (8 GB) graphic card and 32 GB of RAM.
Table 2 shows the RTF and FPS by step length and traffic density for LOSs A-F for each of the three step lengths tested. We considered the traffic density, the RTF and the FPS in detail.
In LOS A, the traffic density was 9.00 vehicle/mile/lane which is lower than the LOS A threshold of 11 vehicles/mile/lane. In other LOSs, the traffic density varied slightly but maintained a value between LOS thresholds (LOS B: 11–18 vehicle/mile/lane; LOS C:18–26 vehicle/mile/lane; LOS D: 26–35 vehicle/mile/lane; LOS E: 35–45 vehicle/mile/lane; LOS F: 45 and greater).
For all step lengths in LOS A, the RTF was 1.00. For all step lengths in LOS F, the RTF decreased from 1 to 0.52 as the step length decreased. An RTF value equal to 1 means a perfect match between SUMO and Unity. This was achieved in LOS A with a step length of 0.1 s, in LOSs B-E with a step length 0.2 s, and in LOS F with a step length 0.3 s. This shows as there is more traffic density, the frequency of exchanging data between SUMO and Unity should decrease to maintain a perfect match.
For all step lengths in LOSs A–F, FPS was higher than 90, which shows that Unity performed smoothly with no lag. The correlation between traffic density and FPS was −0.61, indicating a moderate negative relationship. This relationship shows that the increase in traffic density decreases FPS. To ensure FPS remains at or above 90, we deployed the technique described in Section 3.2.3 Handling Traffic Densities (Different LOS) where we restrict the data exchange within a defined spatial radius (e.g., 555 m) to the simulator vehicle which ensures thatunnecessary trajectory communications from distant surrounding vehicles to the simulator vehicle are eliminated in Unity (A driver’s interaction with traffic elements rarely extends beyond a certain spatial radius). Table 2 demonstrates that this approach successfully prevents FPS from dropping below 90.
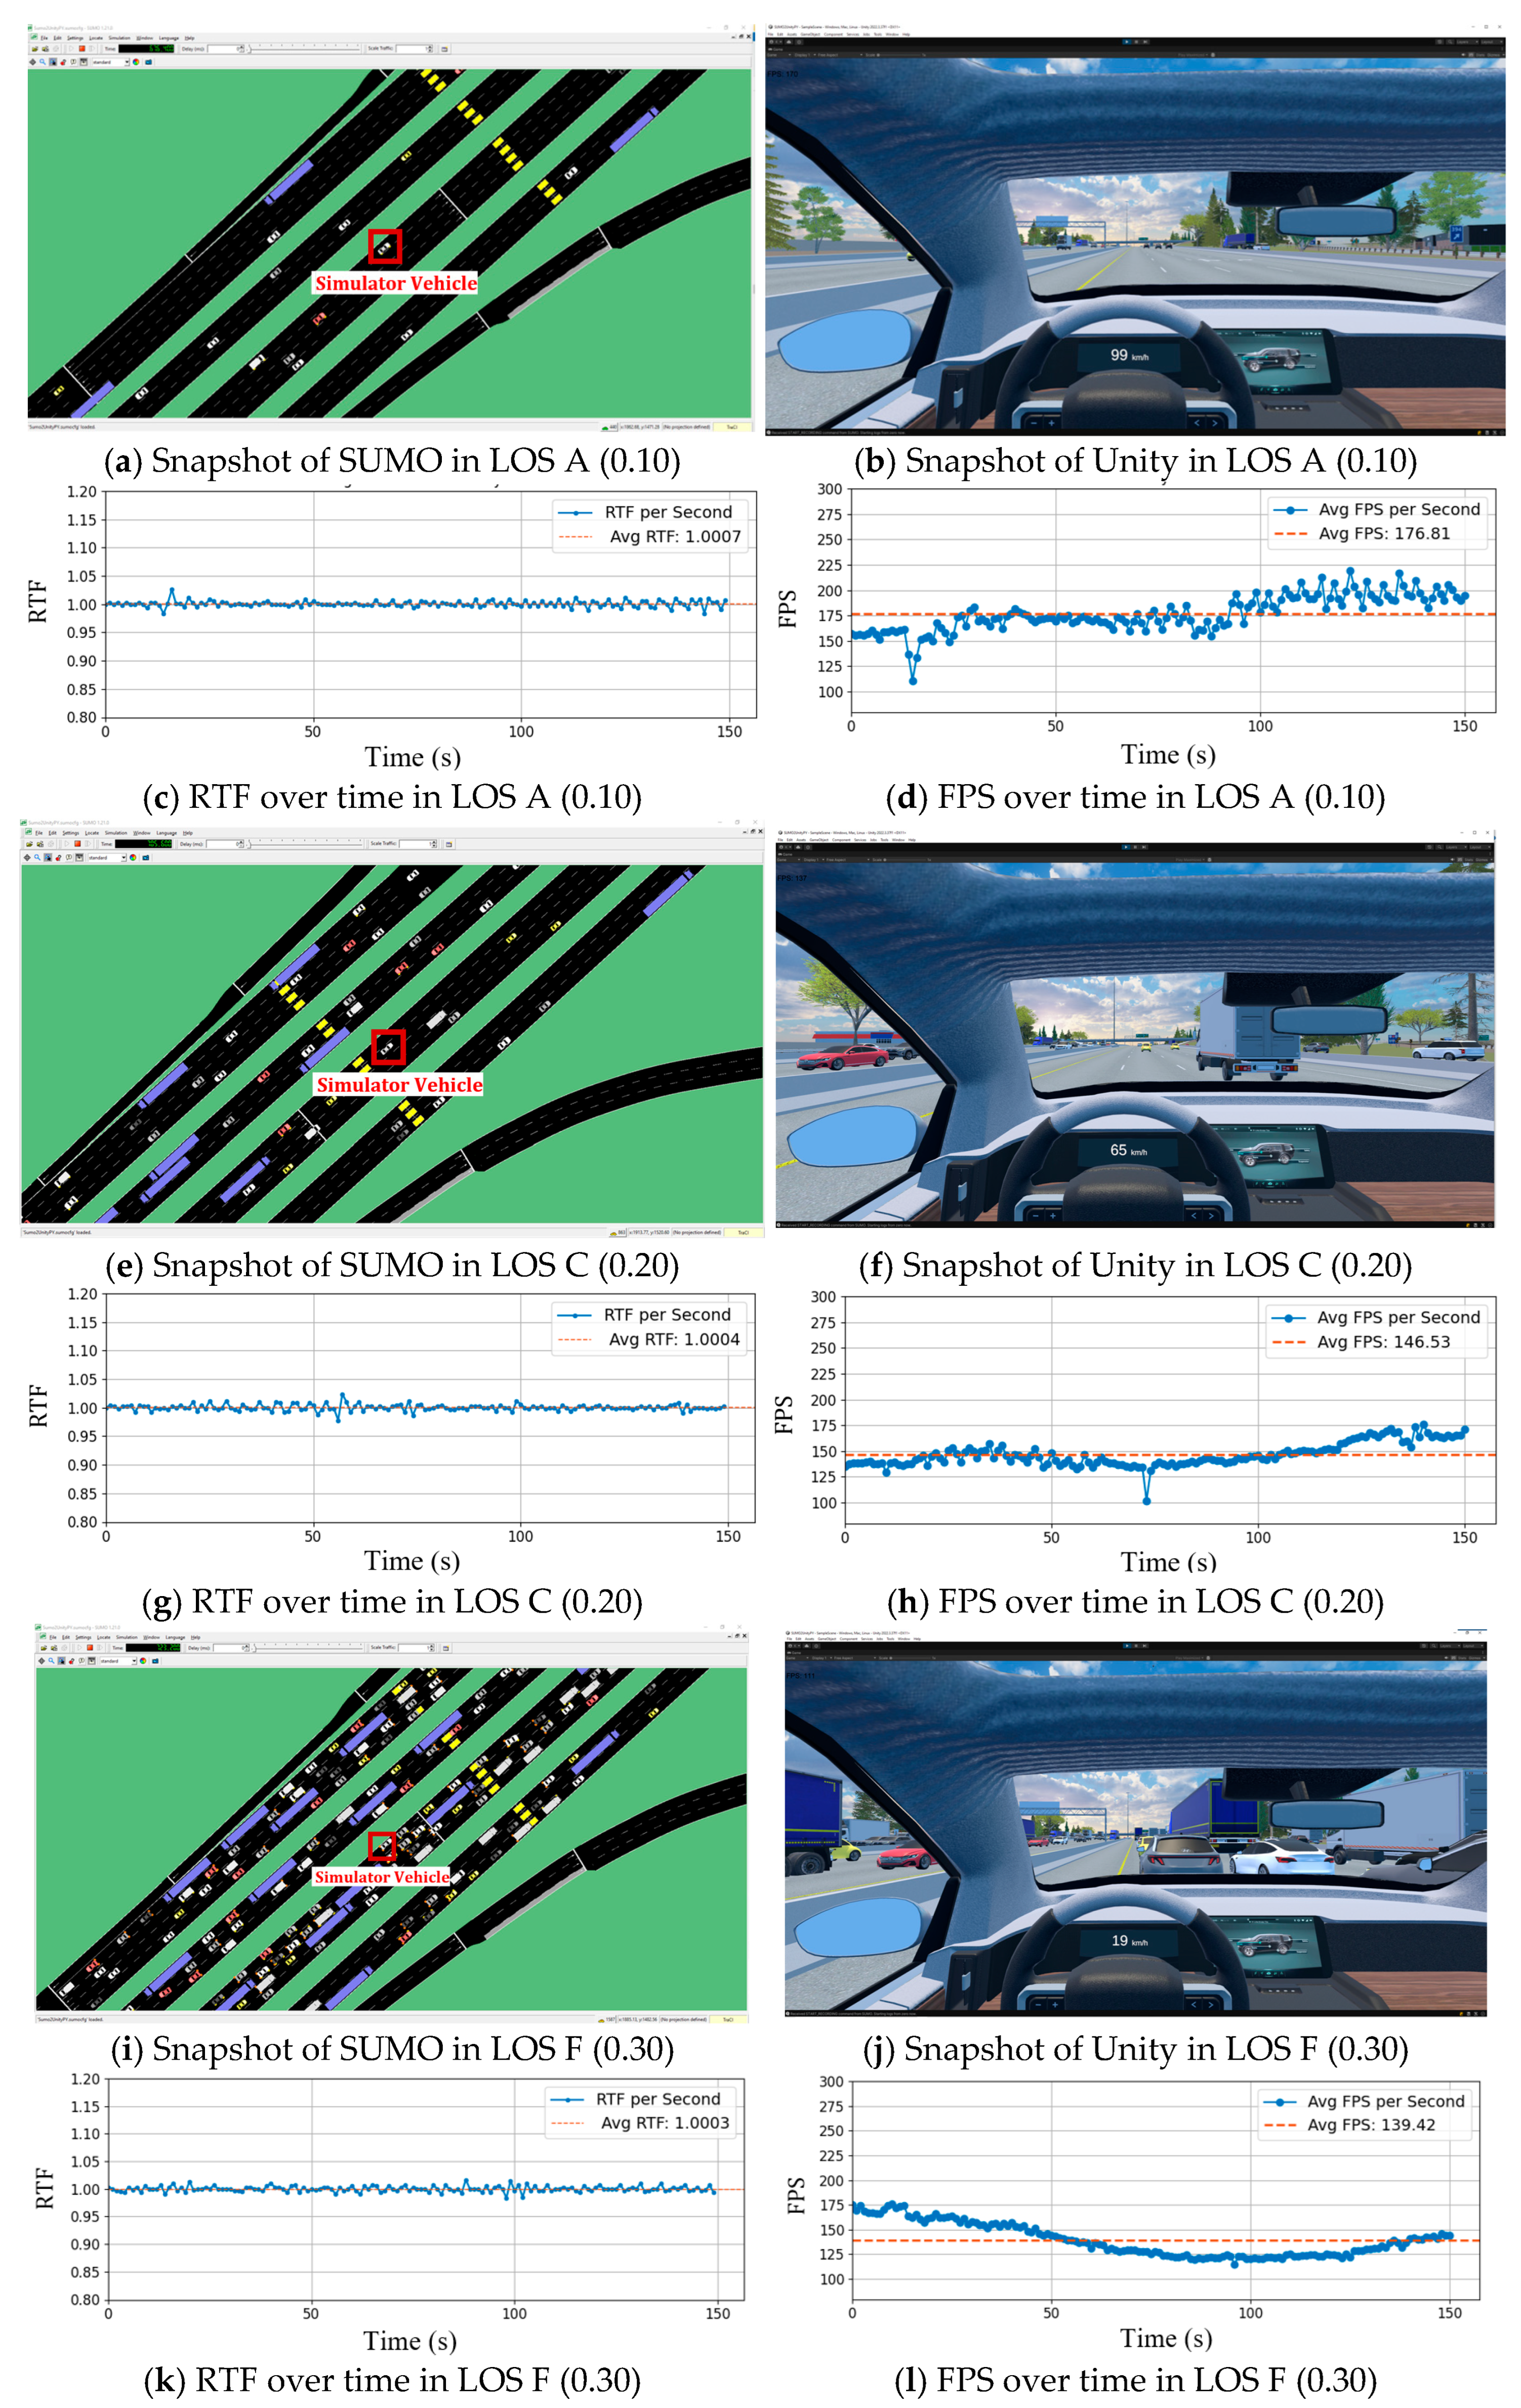
The integration script automatically provides a detailed time series chart for RTF and FPS for the entire period of simulation. Figure 6a,b provides a snapshot of SUMO and a snapshot of Unity near the detectors (shown as yellow rectangles) for the selected case of LOS A (i.e., for step length of 0.10 s). Figure 6c shows the RTF over time for the entire simulation period. Figure 6d shows the FPS over time for the entire simulation period.
The same information for LOS C (step length of 0.20 s) is shown in Figure 6e–h and for LOS F (step length of 0.30 s) is shown in Figure 6i–l. When we compare the traffic density in LOS A (Figure 6a) with the traffic density in LOS C and F (Figure 6e), we can identify the increase in traffic density in LOS F more than LOS C and LOS C more than LOS A.
The RTF charts for LOS A (Figure 6c) and for LOS C (Figure 6g) and for LOS F (Figure 6k) show a stable connection for each LOS. Each blue data point in the chart represents RTF at one second intervals, and the red dashed line indicates the average RTF over the entire simulation period. The RTF was 1.00 (see Table 2) suggesting that, on average, the SUMO simulation progressed at nearly the same time as the Unity simulation time. The small fluctuations around 1.00 are normal and likely reflect minor variations in computations in the laptop. The variations were relatively small, implying a stable and well-balanced simulation performance.
The FPS charts for LOS A (Figure 6d) and LOS C show an increasing trend in FPS as Unity starts loading at the beginning of the simulation and takes time to become stable. However, the FPS chart for LOS F (Figure 6l) shows a decreasing trend in FPS as the simulator vehicle reaches dense traffic, including a lot of meshes (digital lines that represent vehicles) and textures (images on top of digital lines that show colors of vehicles all at once).
Although we report RTF and FPS side-by-side, the two performance functions monitor different stages of the integration. RTF expresses how closely the SUMO simulation time keeps pace with Unity’s simulation time. In Computers, the Central Processing Unit (CPU) is responsible for RTF computation [29]. FPS indicates how many frames (images) Unity’s graphics engine can display per second. In Computers, the Graphics Processing Unit (GPU) is responsible for FPS computation [29]. The two performance functions are largely independent, and thus a change in one number does not automatically cause a change in the other. The correlation between RTF and FPS is 0.56 in Table 2 which shows there is not a significant relationship between these two performance functions. The simulation tool developed also provides a trajectory file containing the simulation second, vehicle ID, and x, y, z coordinates of each vehicle. The data can be used for further analysis including conflict analysis, emissions analysis, etc. Please watch Video Demonstration S1 in the Supplementary Materials to see the process in action. Please refer to the GitHub repository (https://github.com/SimuTraffX-Lab/SUMO2Unity, version 2.0.0, accessed on 12 August 2025), also listed in the supplementary materials, to see the implementation code.

4.3. Typical Traffic Scenarioes

After demonstrating the proper integration using two performance functions, we illustrate three typical scenarios including an intersection, an off-ramp interchange, and an on-ramp interchange. Figure 7a shows the simulator vehicle at an intersection in SUMO, corresponding to the same situation in Unity in Figure 7b, where the vehicle is stopped at a red light. Figure 7c shows that the simulator vehicle exits the highway via an off-ramp in SUMO, while Figure 7d presents the same moment from the driver’s view in Unity. Figure 7e depicts the simulator vehicle entering an on-ramp interchange to merge onto the highway in SUMO, and Figure 7f shows the corresponding view from the driver’s perspective in Unity.

4.4. Capturing Car-Following and Lane-Changing Dynamic

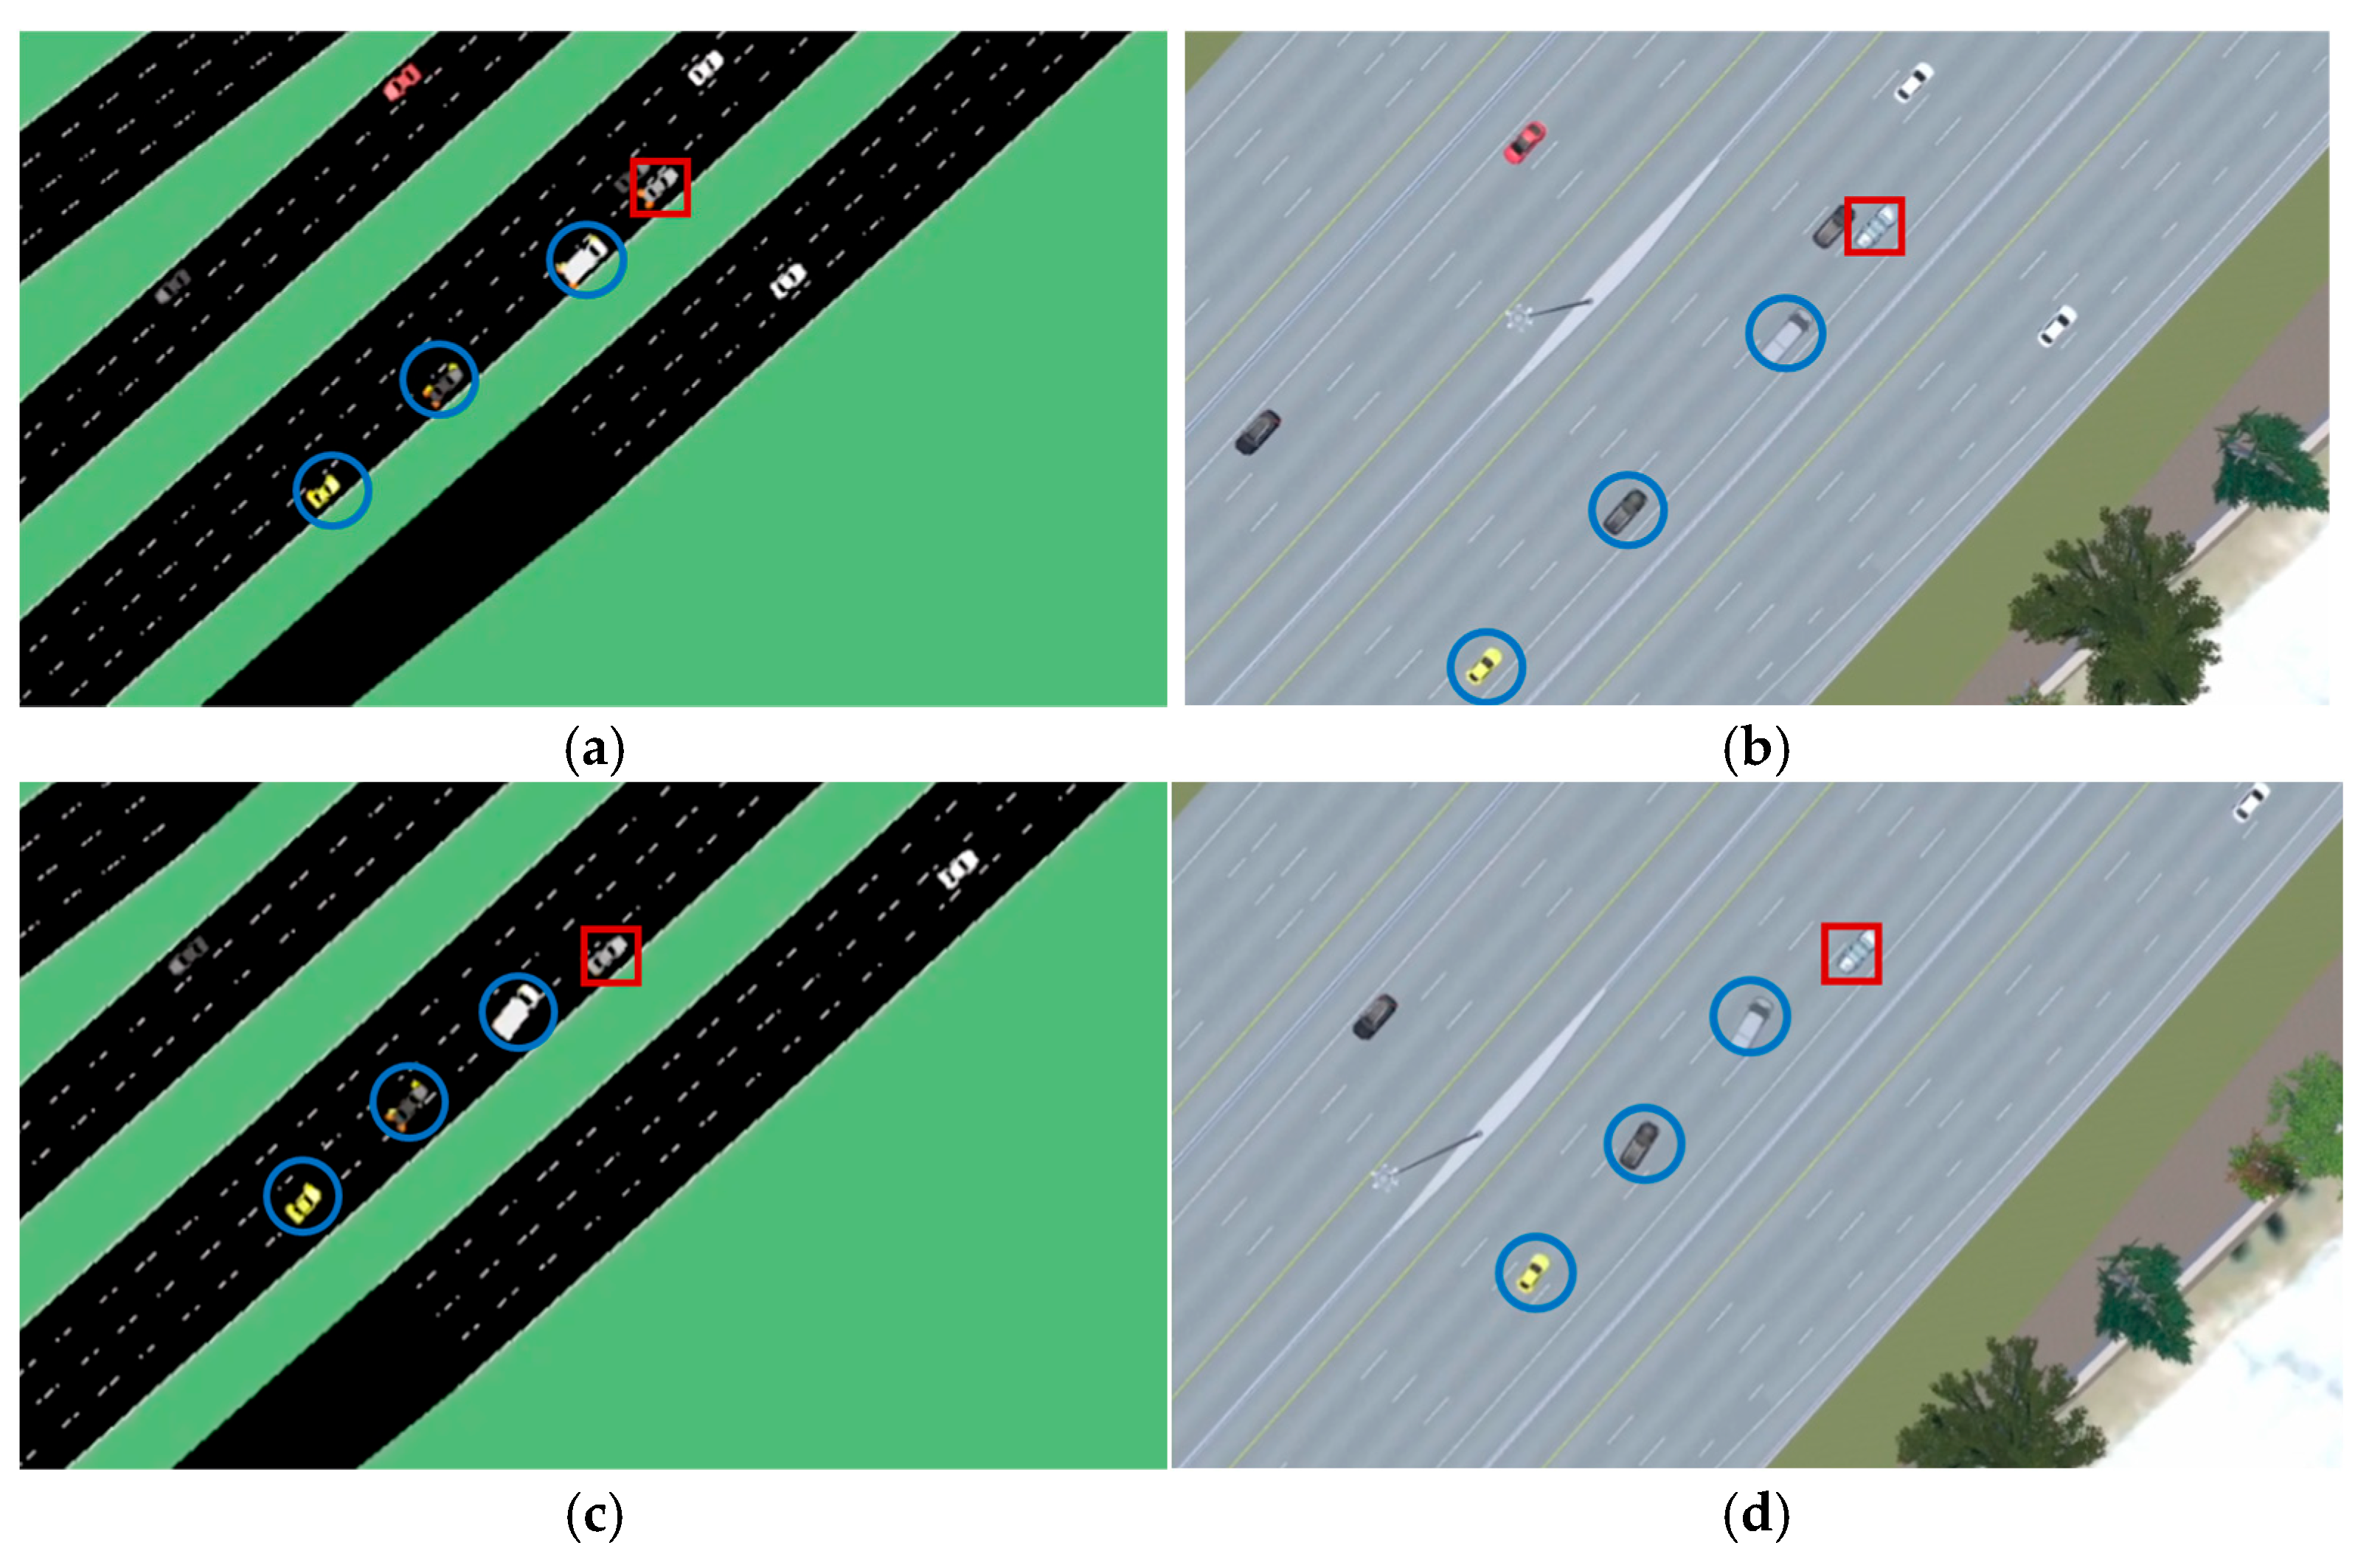
This section shows how the proposed VR traffic simulation captures both the car-following and the lane-changing models even when the driver interacts with the vehicle in VR. We conducted an experiment where the simulator vehicle slowed down and attempted to come to a complete stop in the rightmost lane. Figure 8 presents bird’s-eye-view snapshots of the SUMO and Unity simulations over two consecutive seconds. The VR simulator vehicle is indicated by a red rectangle, and the three cars following the VR simulator vehicle are shown in blue circles.
Figure 8a,b show that the three following cars maintained a safe distance behind the VR simulator vehicle (the car-following model). During the next second, shown in Figure 8c,d, the VR simulator vehicle suddenly brakes, preparing to stop completely. At this point, the cars following perform a lane change.
The driver’s acceleration, brake, and steering wheel inputs in Unity override SUMO for the simulator vehicle only. Each 0.1 s, Unity transfers the new position and heading to SUMO. SUMO receives the data from Unity and moves the simulator vehicle accordingly, while all surrounding traffic remains controlled by SUMO and responds with its car-following and lane-changing models. The simulator vehicle is controlled directly by Unity and SUMO’s decision logic for all surrounding vehicles remain unchanged.

5. Conclusions and Recommendations

Current VR transportation safety researchers face two important shortcomings in past studies. The first shortcoming is the studies’ reliance on simplified traffic simulations that include limited vehicle-to-vehicle interactions and predefined driver behaviors. The second shortcoming is that the studies’ traffic simulations have usually been characterized by free-flow traffic density. These shortcomings appear to limit how closely the studies’ findings match real-world traffic conditions.
In our study, we developed an enhanced VR traffic simulation by integrating SUMO micro-simulation software with the Unity game engine to create realistic traffic simulations with different traffic densities. Our results demonstrate several significant achievements that advance the state of VR traffic simulation.
First, we successfully developed and implemented a comprehensive road network creation process for a complex highway environment. Our approach handled a 12 km highway section with 7 lanes in each direction and 5 interchanges, demonstrating the ability to accurately represent substantial road infrastructure. The four-step process we developed ensured precise coordinate matching between SUMO and Unity while effectively managing complex road features including junctions, geometry, connections, and elevations.
Second, our technical integration achieved stable performance across different traffic conditions. With appropriate step lengths, we achieved Real-Time Factor (RTF) values of 1.00 for both LOS A-F conditions, indicating perfect synchronization between SUMO and Unity simulations. The system consistently maintained frame rates above 90 FPS, ensuring comfortable VR experiences for users. This performance stability was maintained even while handling bi-directional communication between SUMO and Unity, allowing real-time updates of vehicle positions and interactions.
Third, our system successfully implemented realistic traffic behaviors and density variations. Through SUMO’s car-following and lane-changing models, we captured complex driving behaviors including lane changing and car following behavior. The implementation of vehicle detectors allowed us to monitor and maintain desired traffic density levels throughout the simulation, successfully demonstrating different levels of service. This achievement directly addresses one of the main limitations of previous studies by moving beyond simple free-flow traffic conditions.
Fourth, we achieved significant performance optimization through several technical innovations. Our implementation of the “areas of interest” approach successfully limited data exchange to relevant nearby vehicles, reducing computational load while maintaining simulation quality. Through careful testing of different step lengths (0.10 to 0.30 s), we identified optimal settings that balanced accuracy with performance. The system maintained stable performance even with increased traffic density in LOS F conditions, demonstrating its robustness.
Finally, our integration provides comprehensive data collection capabilities that support detailed analysis. The system generates complete trajectory data for all vehicles and continuously monitors real-time performance metrics (RTF and FPS). This data collection enables various types of analysis including conflict analysis and emissions studies, supporting broader research applications.
These achievements represent a significant advance in VR traffic simulation by addressing the key shortcomings identified in previous studies. By providing both realistic traffic interactions and varied traffic densities, our integration creates a more authentic driving environment that better reflects real-world conditions. This enhancement in simulation realism has the potential to lead to more reliable research outcomes in transportation safety studies.

Recommendations

As SUMO already supports a broad range of safety-related applications, including traffic signal scheduling, automated vehicle studies, active transportation (pedestrians and bicycles), and micromobility (e-scooters and e-bikes), we encourage future research to explore the integration of these additional domains into VR simulations.
Our study used MathWorks RoadRunner to create road networks, but we believe that the road network creation process could be further automated. Specifically, a workflow could be established in which road networks are created in SUMO and then automatically generated in Unity along with their surrounding environments. We recommend that future studies pursue this approach to streamline the network creation process.

Supplementary Materials

Video Demonstration S1: https://youtu.be/VfZXi24fTXA (accessed on 12 August 2025). GitHub Repository: https://github.com/SimuTraffX-Lab/SUMO2Unity (accessed on 12 August 2025).

Author Contributions

A.M.: Conceptualization, Data curation, Formal analysis, Methodology, Writing—original draft, Project administration. M.S.B.C.: Data curation, Methodology. P.Y.P.: Conceptualization, Formal analysis, Methodology, Writing—review & editing, Funding acquisition, Project administration, Resources. M.N.: Methodology, Supervision, Writing—review & editing. A.A.: Methodology, Supervision, Writing—review & editing. All authors have read and agreed to the published version of the manuscript.

Funding

The authors would like to acknowledge that funding for this initiative was provided by Transport Canada’s Enhanced Road Safety Transfer Payment Program (ERSTPP) (grant number: 165236). We also extend our sincere thanks to the Natural Sciences and Engineering Research Council of Canada (NSERC) for their financial support of this research through the Alliance Advantage program (grant number: ALLRP 597528-24). All individuals and organizations acknowledged have provided their consent to be mentioned in this section.

Institutional Review Board Statement

Not applicable.

Informed Consent Statement

Not applicable.

Data Availability Statement

The datasets presented in this article are not readily available because they are proprietary to our funding agency and require their permission for any sharing. Requests to access the datasets should be directed to the corresponding author.

Conflicts of Interest

The authors declare no conflicts of interest.

References

  1. Pasetto, M.; Barbati, S.D. How the interpretation of drivers’ behavior in virtual environment can become a road design tool: A case study. Adv. Hum.-Comput. Interact. 2011, 2011, 673585. [Google Scholar] [CrossRef]
  2. Wulf, F.; Rimini-Döring, M.; Arnon, M.; Gauterin, F. Recommendations supporting situation awareness in partially automated driver assistance systems. IEEE Trans. Intell. Transp. Syst. 2015, 16, 2290–2296. [Google Scholar] [CrossRef]
  3. Shi, J.; Liu, M. Impacts of differentiated per-lane speed limit on lane changing behaviour: A driving simulator-based study. Transp. Res. Part F Traffic Psychol. Behav. 2019, 60, 93–104. [Google Scholar] [CrossRef]
  4. DeGuzman, C.A.; Donmez, B. Training benefits driver behaviour while using automation with an attention monitoring system. Transp. Res. Part C Emerg. Technol. 2024, 165, 104752. [Google Scholar] [CrossRef]
  5. Krasniuk, S.; Toxopeus, R.; Knott, M.; McKeown, M.; Crizzle, A.M. The effectiveness of driving simulator training on driving skills and safety in young novice drivers: A systematic review of interventions. J. Saf. Res. 2024, 91, 20–37. [Google Scholar] [CrossRef] [PubMed]
  6. Gilandeh, S.S.; Hosseinlou, M.H.; Anarkooli, A.J. Examining bus driver behavior as a function of roadway features under daytime and nighttime lighting conditions: Driving simulator study. Saf. Sci. 2018, 110, 142–151. [Google Scholar] [CrossRef]
  7. Dowling, R.; Skabardonis, A.; Alexiadis, V. Traffic Analysis Toolbox, Volume III: Guidelines for Applying Traffic Microsimulation Modeling Software (No. FHWA-HRT-04-040); United States. Federal Highway Administration. Office of Operations: Washington, DC, USA, 2004.
  8. Barcelo, J. Fundamentals of Traffic Simulation; Springer: New York, NY, USA, 2010; Volume 145, p. 439. [Google Scholar]
  9. Brackstone, M.; McDonald, M. Car-following: A historical review. Transp. Res. Part F Traffic Psychol. Behav. 1999, 2, 181–196. [Google Scholar] [CrossRef]
  10. Toledo, T.; Koutsopoulos, H.N.; Ben-Akiva, M. Integrated driving behavior modeling. Transp. Res. Part C Emerg. Technol. 2007, 15, 96–112. [Google Scholar] [CrossRef]
  11. Transportation Research Board. Highway Capacity Manual, 7th ed.; The National Academies Press: Washington, DC, USA, 2022. [Google Scholar]
  12. Farooq, B.; Cherchi, E.; Sobhani, A. Virtual immersive reality for stated preference travel behavior experiments: A case study of autonomous vehicles on urban roads. Transp. Res. Rec. 2018, 2672, 35–45. [Google Scholar] [CrossRef]
  13. Olaverri-Monreal, C.; Errea-Moreno, J.; Díaz-Álvarez, A.; Biurrun-Quel, C.; Serrano-Arriezu, L.; Kuba, M. Connection of the SUMO microscopic traffic simulator and the unity 3D game engine to evaluate V2X communication-based systems. Sensors 2018, 18, 4399. [Google Scholar] [CrossRef] [PubMed]
  14. Mohammadi, A.; Park, P.Y.; Nourinejad, M.; Cherakkatil, M.S.B.; Park, H.S. SUMO2Unity: An Open-Source Traffic Co-Simulation Tool to Improve Road Safety. In Proceedings of the 2024 IEEE Intelligent Vehicles Symposium (IV), Jeju, Republic of Korea, 2–5 June 2024; IEEE: Piscataway, NJ, USA, 2024; pp. 2523–2528. [Google Scholar]
  15. Pechinger, M.; Lindner, J. Sumonity: Bridging SUMO and Unity for Enhanced Traffic Simulation Experiences. In Proceedings of the SUMO Conference Proceedings, Berlin-Adlershof, Germany, 13–15 May 2024; Volume 5, pp. 163–177. [Google Scholar]
  16. Liao, X.; Zhao, X.; Wu, G.; Barth, M.; Wang, Z.; Han, K.; Tiwari, P. A game theory based ramp merging strategy for connected and automated vehicles in the mixed traffic: A unity-sumo integrated platform. arXiv 2021, arXiv:2101.11237. [Google Scholar] [CrossRef]
  17. Nagy, V.; Májer, C.J.; Lepold, S. Eclipse SUMO and Unity 3D integration for emission studies based on driving behaviour in virtual reality environment. Procedia Comput. Sci. 2025, 257, 396–403. [Google Scholar] [CrossRef]
  18. Krajzewicz, D.; Erdmann, J.; Behrisch, M.; Bieker, L. Recent development and applications of SUMO—Simulation of Urban MObility. Int. J. Adv. Syst. Meas. 2012, 5, 128–138. [Google Scholar]
  19. Yu, Y. Use Inspired Research in Using Virtual Reality for Safe Operation of Exemplar Critical Infrastructure Systems. Doctoral Dissertation, Rutgers The State University of New Jersey, School of Graduate Studies, New Brunswick, NJ, USA, 2022. [Google Scholar]
  20. Dupuis, M.; Strobl, M.; Grezlikowski, H. Opendrive 2010 and beyond–status and future of the de facto standard for the description of road networks. In Proceedings of the Driving Simulation Conference Europe, Paris, France, 9–10 September 2010; pp. 231–242. [Google Scholar]
  21. Blochwitz, T.; Otter, M.; Arnold, M.; Bausch-Gall, I.; Elmqvist, H.; Junghanns, A. The Functional Mockup Interface for Tool independent Exchange of Simulation Models. In Proceedings of the 8th International Modelica Conference, Dresden, Germany, 20–22 March 2011. [Google Scholar] [CrossRef]
  22. AASHTO (American Association of State Highway and Transportation Officials). A Policy on Geometric Design of Highways and Streets; American Association of State Highway and Transportation Officials: Washington, DC, USA, 2011. [Google Scholar]
  23. Macedonia, M.R.; Zyda, M.J.; Pratt, D.R.; Brutzman, D.P.; Barham, P.T. Exploiting reality with multicast groups: A network architecture for large-scale virtual environments. IEEE Comput. Graph. Appl. 1995, 9, 10–1109. [Google Scholar]
  24. Singhal, S.; Zyda, M. Networked Virtual Environments: Design and Implementation; ACM Press: New York, NY, USA; Addison-Wesley Publishing Co.: Boston, MA, USA, 1999. [Google Scholar]
  25. Koenig, N.; Howard, A. Design and use paradigms for gazebo, an open-source multi-robot simulator. In Proceedings of the 2004 IEEE/RSJ International Conference on Intelligent Robots and Systems (IROS), Sendai, Japan, 28 September–2 October 2004; IEEE: Piscataway, NJ, USA, 2004; Volume 3, pp. 2149–2154. [Google Scholar]
  26. Mirauda, D.; Capece, N.; Erra, U. Sustainable water management: Virtual reality training for open-channel flow monitoring. Sustainability 2020, 12, 757. [Google Scholar] [CrossRef]
  27. Pense, C.; Tektaş, M.; Kanj, H.; Ali, N. The use of virtual reality technology in intelligent transportation systems education. Sustainability 2022, 15, 300. [Google Scholar] [CrossRef]
  28. Oculus VR. Oculus Best Practices. 2022. Available online: https://developer.oculus.com/ (accessed on 12 August 2025).
  29. Gazebo Classic. Performance Metrics [Tutorial]. Gazebo Classic Documentation. 2025. Available online: https://classic.gazebosim.org/tutorials?cat=tools_utilities&tut=performance_metrics (accessed on 25 June 2025).
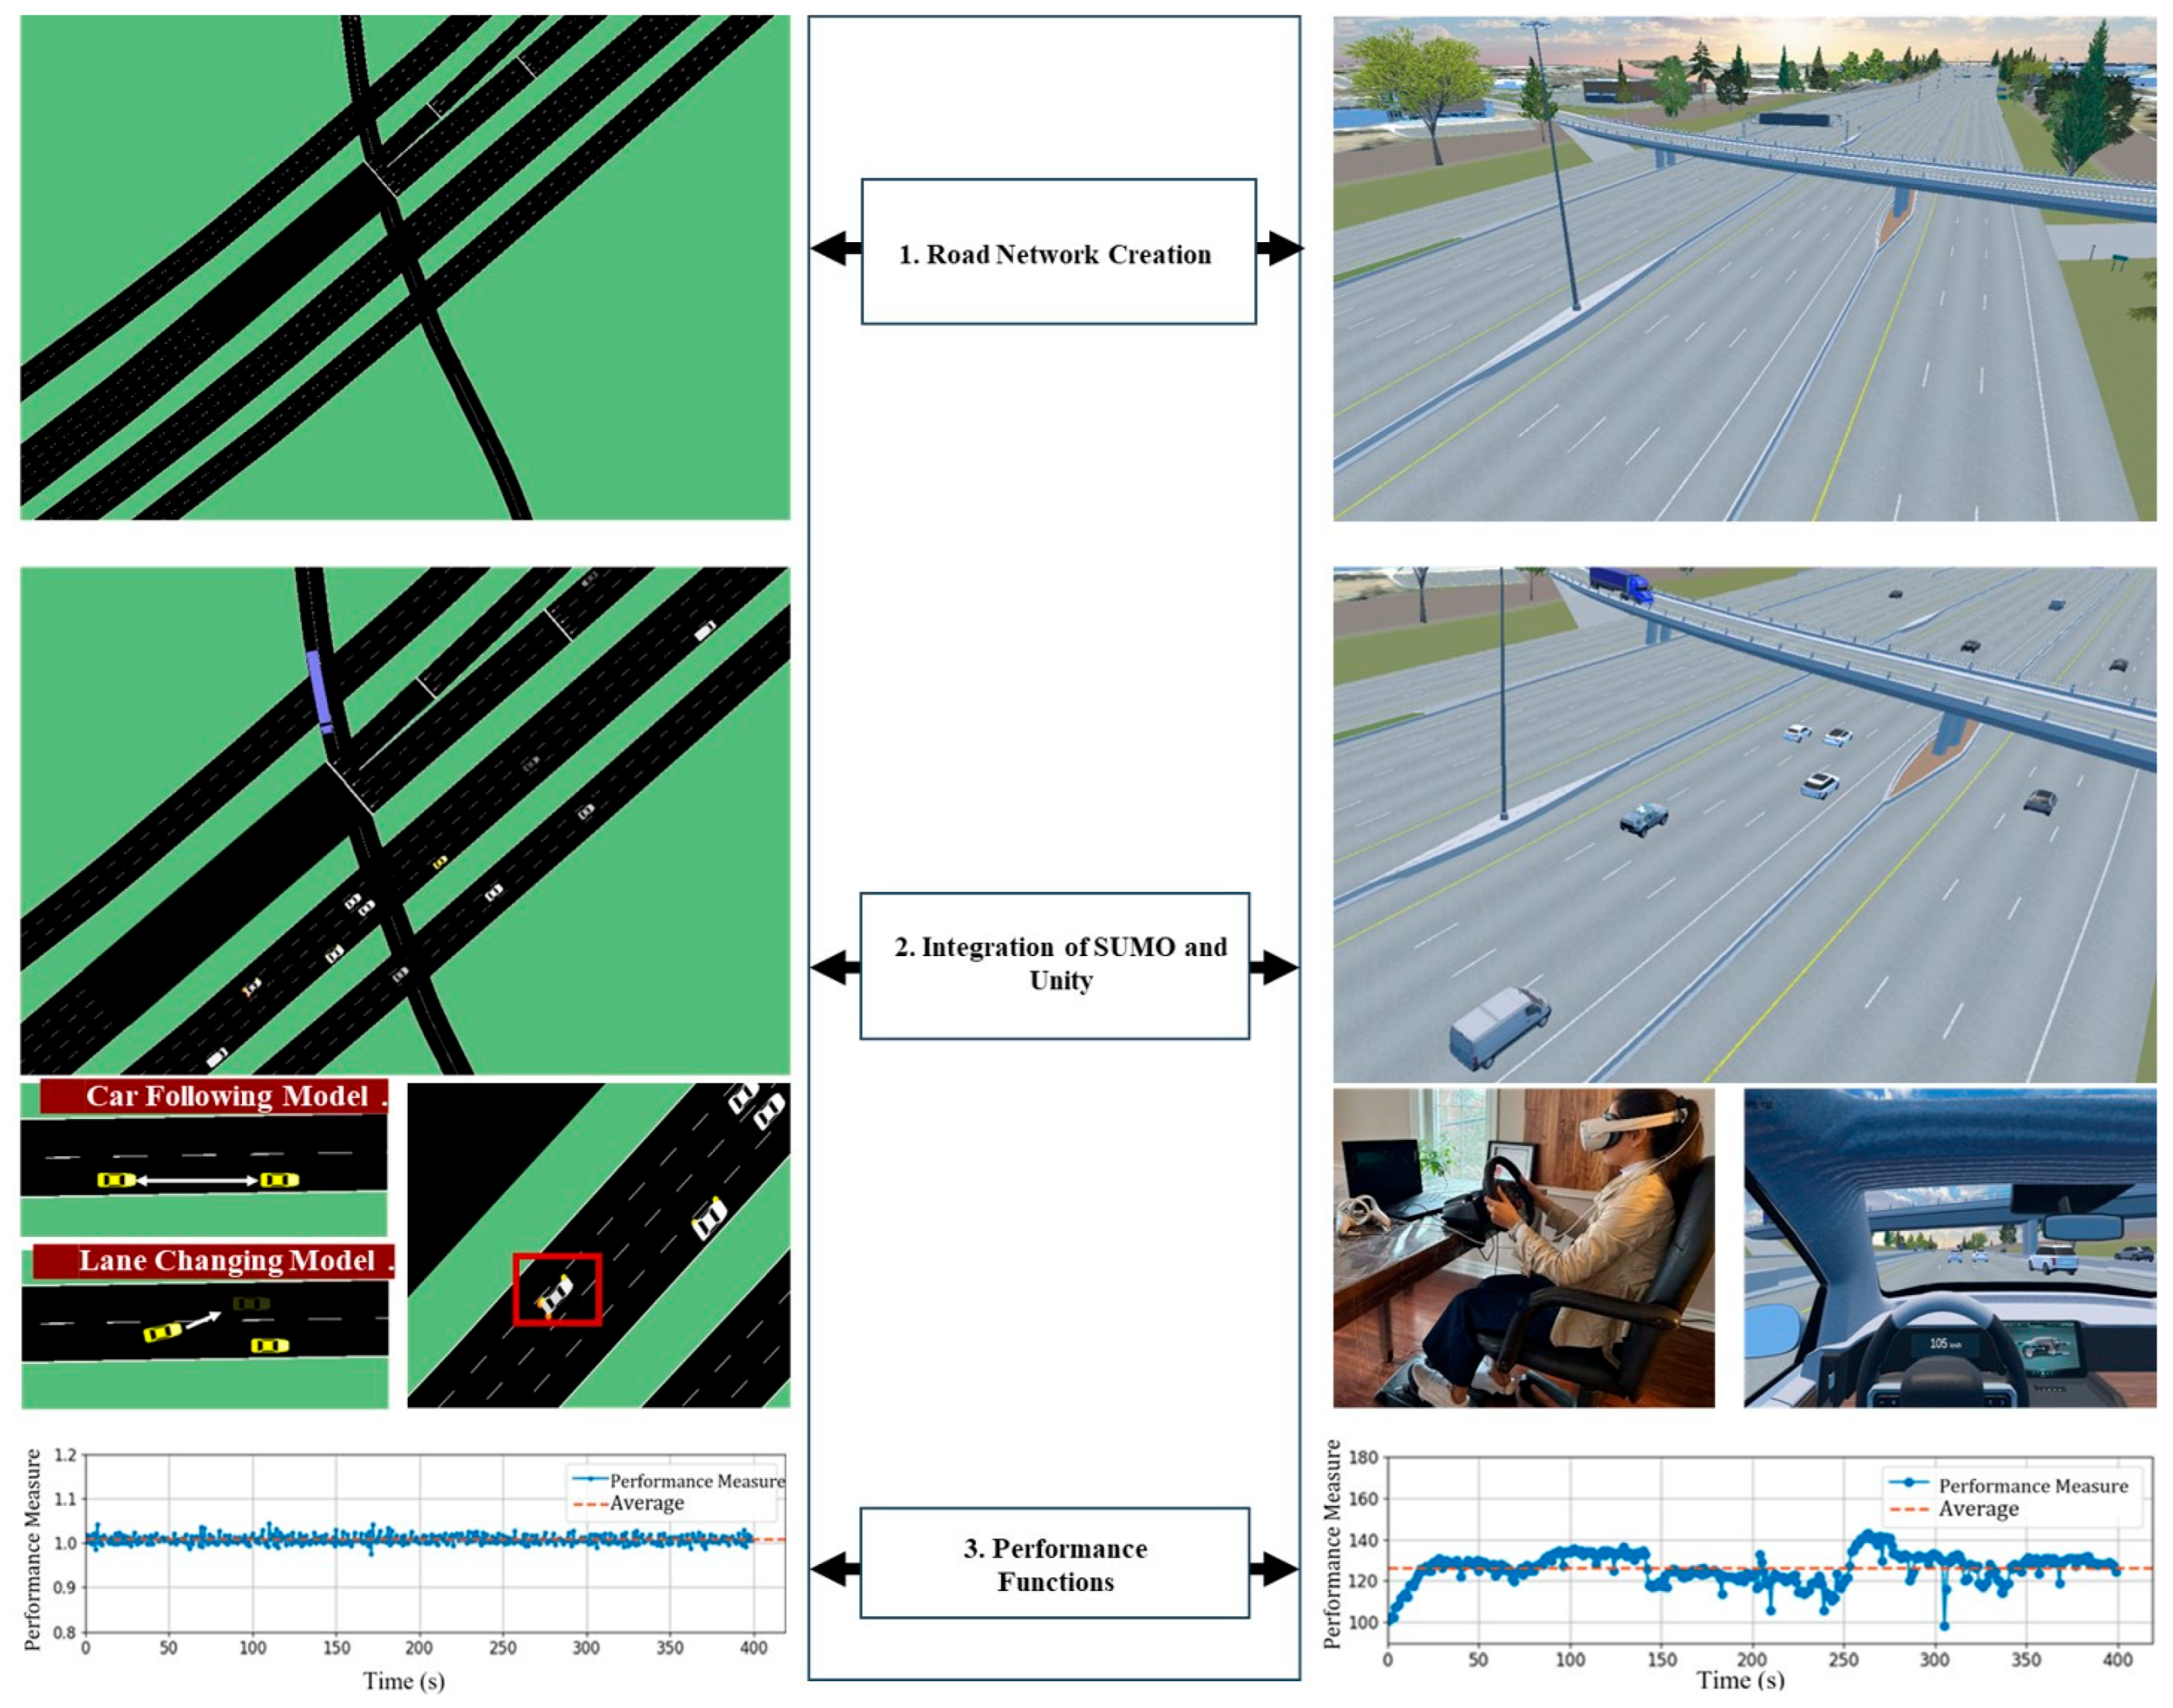
Figure 1. The three phases of the VR traffic simulation developed. The red frame highlights the ego vehicle controlled in the simulation environment.
Applsci 15 09351 g001
Figure 2. Four-step process used in the road network creation. (a) GIS Maps. (b) Road Network in RoadRunner. (c) Road Network in Unity and SUMO. (d) Buildings, Road Signs, and Trees.
Applsci 15 09351 g002
Figure 3. Four key considerations when importing OpenDRIVE into SUMO. Red segments indicate junctions. Black areas represent the main road surface, and white dashed lines denote lane markings. Pink nodes mark connection points between road segments.
Applsci 15 09351 g003aApplsci 15 09351 g003b
Figure 4. The six steps involved in determining cycle time.
Applsci 15 09351 g004
Figure 5. The Placement of Detectors in SUMO for Determining Traffic Density.
Applsci 15 09351 g005
Figure 6. Comparison of traffic density, RTF and FPS near the entrance detectors.
Applsci 15 09351 g006
Figure 7. Typical traffic scenarios shown in SUMO (left column) and the corresponding driver’s-eye views in Unity (right column). The red box labeled “Simulator Vehicle” indicates the ego vehicle controlled in the simulation.
Applsci 15 09351 g007
Figure 8. Bird eye’s view snapshots of SUMO and Unity over two consecutive seconds. (a) A SUMO snapshot illustrating the car-following model in the previous second. (b) A Unity snapshot illustrating the car-following model in the previous second. (c) A SUMO snapshot illustrating the lane-changing model in the following second. (d) A Unity snapshot illustrating the lane-changing model in the following second. The red box indicates the simulator (ego) vehicle, while the blue circles highlight surrounding vehicles involved in the interaction.
Applsci 15 09351 g008
Table 1. Comparison of capabilities reported in SUMO–Unity integration (co-simulation) studies.
StudyElevated Road NetworkVehicle-Detector LOS ControlManual VR Vehicle ControlQuantified Integration Performance
Olaverri-Monreal et al. [13]
Mohammadi et al. [14]
Pechinger and Lindner [15]
Liao et al. [16]
Nagy et al. [17]
This Study
Note: ✓ indicates that the capability is present or implemented in the study; ✗ indicates that the capability is absent or not implemented.
Table 2. RTF and FPS by Step Length and Traffic Density.
LOS
(A–F)
Step Length
(s)
Traffic Density
(veh/mile/lane)
RTF
(No Unit)
FPS
(Integer)
A0.309.141.00206
0.209.051.00187
0.109.031.00177
B0.3013.171.00166
0.2013.461.00150
0.1014.370.84142
C0.3025.341.00158
0.2025.251.00146
0.1022.980.63137
D0.3028.861.00158
0.2027.001.00152
0.1028.010.63143
E0.3044.571.00153
0.2043.911.00155
0.1040.710.87145
F0.3077.091.00139
0.2084.100.96141
0.1080.240.52123
Disclaimer/Publisher’s Note: The statements, opinions and data contained in all publications are solely those of the individual author(s) and contributor(s) and not of MDPI and/or the editor(s). MDPI and/or the editor(s) disclaim responsibility for any injury to people or property resulting from any ideas, methods, instructions or products referred to in the content.