Article

Intrinsic Temperature and Pressure Compensation of Thin-Film Acoustic Resonators

Horia Hulubei National Institute for Physics and Nuclear Engineering, 077125 Magurele, Romania
Appl. Sci. 2025, 15(17), 9349; https://doi.org/10.3390/app15179349
Submission received: 29 July 2025 / Revised: 17 August 2025 / Accepted: 23 August 2025 / Published: 26 August 2025

Abstract

Stabilization of the resonance frequency in thin-film acoustic devices to variations in environmental conditions is commonly reduced to the passive or active compensation of a single factor (usually temperature) and the isolation or addition of a separate correction circuit for every other factor (e.g., pressure and mass loading). In this work, the possibility of dual-factor compensation is proposed, where the response of a multi-layered thin structure to both temperature and ambient pressure variation vanishes due to the choice of intrinsic parameters (materials and thickness ratios). The response functions are derived for the S 0 Lamb mode at long wavelengths in an explicit analytical form in terms of bulk material characteristics. It is demonstrated that the dual-factor intrinsic stabilization requires at least a three-layered structure and can be achieved for materials commonly used in temperature-compensated devices (aluminum nitride, fused silica, and aluminum). Identification of the key material characteristics governing the existence of a stability solution can serve for a targeted search of such composites and implementation of new thin-film dual devices.

1. Introduction

Stabilizing acoustic resonance is critical in applications where consistent performance is required despite environmental variations influencing the intrinsic properties of the device (e.g., sound velocity, elastic constant, density, and size) and causing variation in the observed phase velocity ( δ C ) and resonant angular frequency δ ω . For instance, precision frequency generation and filtering require stability of the reference value to such external factors as the ambient pressure P (e.g., hydrostatic or gas), temperature T, or mass loading M due to absorption or deposition of material. Alternatively, measuring the frequency change in response to a particular factor requires prevention or compensation of the contribution by the others. For example, a mass sensor should not be affected by variations in temperature and pressure, or it should differentiate the effects induced by different physical factors. In structural health monitoring systems, the effect of temperature and pressure variation on the sensor response is often more prominent than the effect of the damage under consideration, causing a false positive situation or even the danger of not detecting the damaged structure [1]. Such multi-parametric frequency stabilization is also of interest in medical ultrasound diagnostics, biological and chemical sensing, non-destructive testing, precision instruments like acoustic thermometers or pressure calibrators, frequency filtering, communication, etc. In most active and passive stabilization approaches, to avoid mutual interference, a separate device or recalibration scheme is dedicated to accounting for the effect of a single specific factor [2]. In the present work, a new possibility is explored, namely when dual-factor ( T , P ) intrinsic compensation of the acoustic response is determined by the structure and constituent materials such that the frequency is stabilized in terms of both temperature and pressure.
The intrinsic properties are defined by the bulk parameters and their T and P derivatives at some reference point, e.g., room temperature or atmospheric pressure. The relative variations, δ ω / ω or δ C / C , are determined by the corresponding linear response functions (coefficients of frequency or velocity, e.g., T C F or T C V , respectively):
δ ω ω = ln ω T δ T + ln ω P δ P + ln ω M δ M + = T C F × δ T + P C F × δ P + M C F × δ M
Stability in the variation of a given physical factor means that the respective partial derivative vanishes, which requires a certain combination of values for the intrinsic parameters. For some materials, the assumed linear ω T , P behavior is not sufficiently accurate for a given T , P interval, and then compensation for the frequency variation becomes more complex. Quartz, a S i O 2 crystal, is one such example of having nonlinear frequency-temperature-pressure curves, which conveniently realizes the condition T C F = 0 at room temperature due to a natural change in sign of the temperature response. It can be sufficiently well compensated for pressures up to 1 Mpa or for temperatures between 40 and 80 °C with an additional correction and recalibration circuit [3]. However, quartz’s characteristics strongly deteriorate at higher T and P values. On the other hand, the amorphous S i O 2 (fused silicate glass) shows a linear temperature increase in its elastic moduli and sound velocities for hundreds of degrees up to 600–700 °C [4,5,6]. Due to these “anomalous” (strictly positive) temperature coefficients of elasticity, the fused silica is used for temperature compensation in combination with “standard” materials to offset their negative T coefficients. Indeed, in contrast to gases, the dependence of acoustic velocities on the temperature in solids is dominated not by the mass density ρ but by the stiffness of the inter-atomic potential. This causes a softening of the elastic moduli and a decrease in the acoustic velocities with T. Moreover, negative values of T C V and T C F do not just differ in sign with the thermal expansion coefficients α but are also much larger in magnitude.
Piezoelectric materials like AlN, ScAlN, and GaN are commonly used for sensing applications, exploiting surface acoustic waves ( S A W ) and Lamb waves ( L W ) in layered composites. They can function in harsh environments, show linear behavior with negative TCV values on sufficiently large intervals for both the pressure and temperature [7,8,9], and are therefore well suited for compensated composites. In particular, the combination of such materials with silicate glasses has been employed for temperature stabilization of L W resonance [10,11,12,13,14,15,16,17,18]. Lamb waves have a mixed (shear vertical + longitudinal) polarization and propagate in thin films (e.g., MEMS) with a wavelength λ comparable to the thickness h ( h / λ < 1 ) such that particle motion involves the whole volume of the sample, in contrast to surface acoustic waves (SAW) with h / λ 1 [19]. L W resonators have gained significant attention due to device miniaturization, reduction in h, low losses, fast response times, and favorable frequency-temperature characteristics, making them suitable for applications ranging from RF front-end filters to various sensing applications, including pressure, temperature, mass, and biochemical sensing, working in harsh environments [10,11]. Temperature-compensated operation of L W devices has been demonstrated with material combinations that balance the T C F of the S 0 (symmetric) mode [11,12,13,14] in a three-layered structure, represented in Figure 1. This mode is often preferred for its lower phase velocity dispersion, which contributes to more stable performance across a wider frequency range achieving near-zero T C F values for the frequencies over an order of magnitude difference from MHz to several GHz [12,15,20,21].
However, as shown in the present work, in addition to the anomalous temperature behavior, there is another less-explored anomaly of glasses that may have useful applications for stabilizing the acoustic frequency to the variation in environmental conditions. Thus, the “standard” behavior of solids under ambient pressure is to increase the acoustic velocities, since shorter inter-atomic distances cause an increase in elastic moduli. As this effect is much stronger than the one related to the increase in density, the values of P C V are positive and much larger than the compressibility ( κ = ln ρ / P ). Nevertheless, glasses like S i O 2 , B e F O 2 , T i O 2 , and G e O 2 are known to exhibit an anomalous (decreasing) pressure dependence for their elastic moduli and sound velocities until some threshold “intermediate” pressure. These values correspond to a minimum and are actually rather high (e.g., around 2.5 GPa for S i O 2 at room temperature). The strength of this anomaly is in a direct correlation with the Poisson’s ratio of the glass; smaller ν values are associated with a more negative slope of the pressure dependence below the threshold [5,22,23]. Above the threshold, one observes such irreversibility phenomena as densification and hysteresis upon temperature-dependent compression-decompression cycles [24,25,26]. In numerous studies, it has been shown that the elasticity anomaly of amorphous solids can be manipulated both by hot and cold densification regimes at higher pressures and doping with other materials [27]. In particular, mixing of the silicate glass with other oxides (e.g., N a O 2 O, A l O 2 O 3 , and T i O 2 ) decreases the anomaly until it disappears [28]. In [25], it was demonstrated that a silica glass can have a fully reversible behavior (no compression-decompression hysteresis) for a permanently densified sample with a reduced magnitude for the anomaly. In [29], pressure stabilization was realized in precision temperature monitoring for an optical glass fiber sensor composed of a S i O 2 - G e O 2 mixture by reaching a complete flattening of the pressure dependence. Here, we explore the anomalous decrease in sound velocity ability of glasses with hydrostatic pressure to compensate for the regular behavior of common materials in a composite structure. We consider the effect of pressure neglecting the influence of coupling to a liquid or gas environment on the dispersion of the S 0 mode, which is known to be weak at long wavelengths of k h < 0.3 (where k = 2 π / λ is the wavenumber) [30] such that pressure affects the free plate dispersion only via the values of the parameters, moduli, and density, and the effect is due to modification of the material parameters.

2. Temperature- and Pressure-Compensated Structure

In light of the similarity between the two anomalous features of glasses, we can investigate the possibility of the combined, dual-factor stabilization of the S 0   L W mode by generalizing the approach in [31]. It has been shown that at long wavelengths, the phase velocity C in an N layered film has the property of additive separability. Namely, the value of C 2 reduces to an additive contribution of the masses and velocities of separate layers indexed by γ :
γ = 1 N M γ C 2 = γ = 1 N M γ V γ 2 ,
where
V γ = s γ 2 / 1 ν γ ,
is the known long wavelength asymptotic expression for the phase velocity of the S 0 mode of a free plate [32], s γ is the shear velocity, and ν γ is the Poisson’s ratio of the corresponding material. Masses are defined by the density, thickness, and in-plane surface area, where M γ = ρ γ h γ A for the layer. In particular, it has been shown that frequency stability for a change in mass requires at least three layers of sufficiently different materials. In Equation (2), each layer is represented by only two experimentally measurable parameters, instead of more than twice that number of the full set required for general numerical modeling or deemed relevant for an experimental study. The dimension of the complete parametric space is even larger (elastic moduli, mass densities, layer thicknesses, and their T and P derivatives) because it includes the variation rates of every bulk parameter, which makes the solution of the stability problem extremely complex. On the other hand, according to Equation (2), one only needs to know the velocities V γ and their variation rates, which are also experimentally measurable quantities.
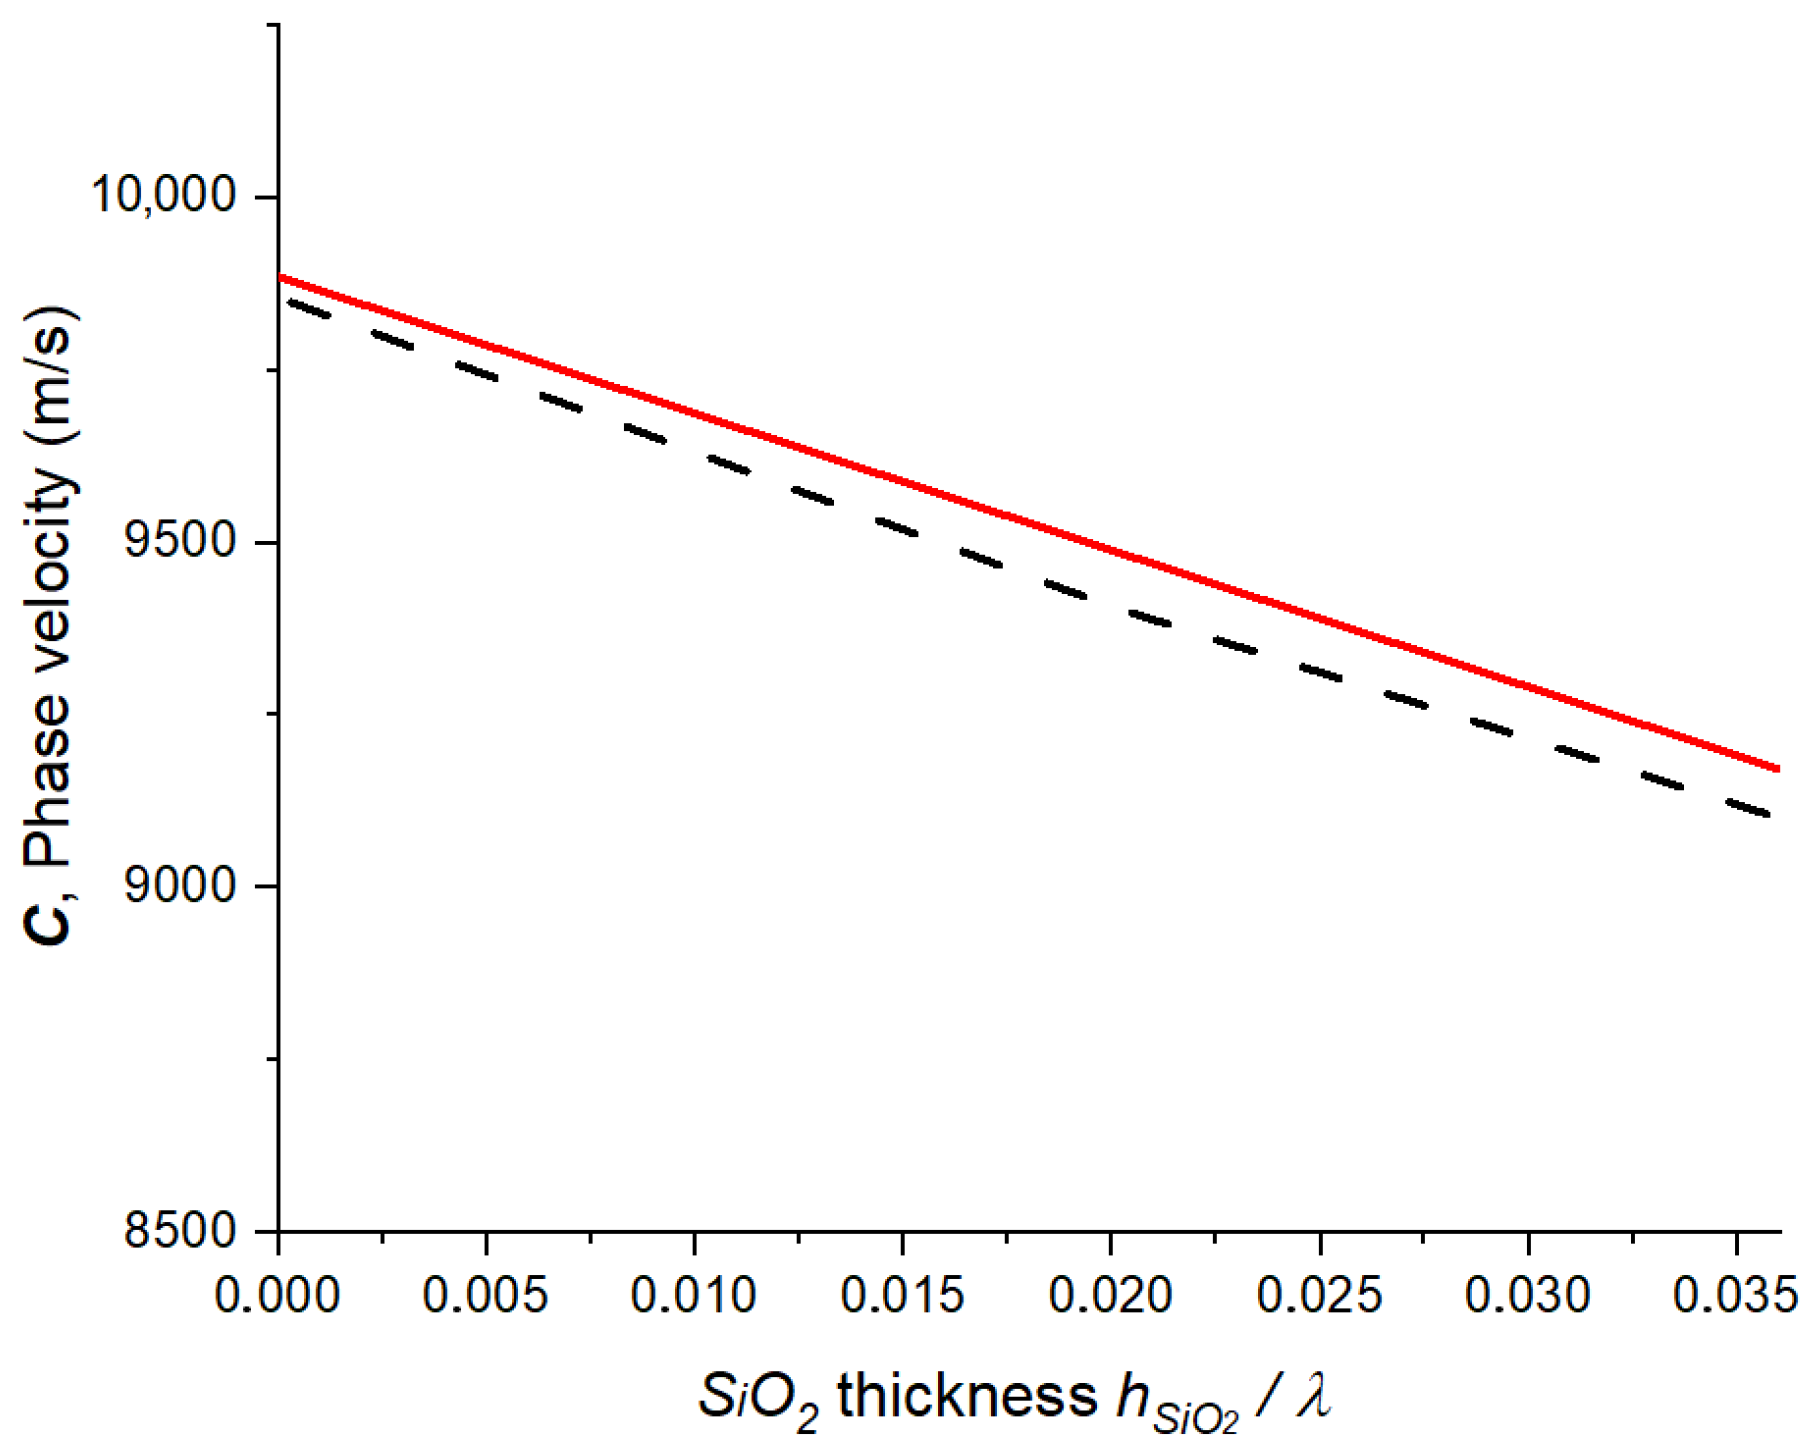
To validate the present theory, we use data on the bulk material parameters related to the temperature-compensated resonators used in previous works [4,11,12,13,33,34,35]. Thus, for comparison with the numerical solution for the Lamb waves propagating in the plane normal to the c axis of the A l N thin film, we used in Equation (2) the values of the moduli from [12,13]. As will be seen from the results below, this long-wavelength analytic expression reproduces the phase velocity of nearly 10,000 m/s of the S 0 Lamb mode of the anisotropic piezoelectric crystal plate in [11,12,13] well. Thus, in Figure 2, we show the phase velocity for the structure in Figure 1, neglecting the aluminum layer but including the IDT electrodes which were calculated in full detail in previous works [12,13] for a fixed value h A l N / λ = 0.09 . This was compared to the present long-wavelength expression which neglects the IDT electrodes. For a simple numerical estimate of the error, we took h S i O 2 = 0 to find from Equation (2) that C = 9891 m/s, while the full calculation gives 9850 m/s, i.e., an error of 0.5 %.
Moreover, in our linear approach, we also found the value V / T = 0.7 m/s/K for the temperature sensitivity of the aluminum alloy plate experimentally studied in [34], which is sufficiently close to the numerical solution of the temperature-dependent governing equations in [35] ( 0.875 m/s/K), including nonlinear terms for T. Comparisons with some other works are also discussed further. It should also be mentioned that the bulk parameters are functions of both physical factors, and the data on the variation rate constants provided in the literature refer to a sufficiently large region of linearity around the specified values of ( T , P ) (usually room temperature and P = 0 ). This corresponds to the linearity assumption adopted in the present study. Nevertheless, a generalization similar to that in [35], including nonlinear T , P dependence, is also possible whenever such bulk material data become available from experimental studies.
As the masses M γ do not depend on T or P, the velocity response functions, where T C V = ln C / T and P C V = ln C / P , are obtained from Equation (2) in the form of linear superposition of the partial response functions of the layers τ γ and π γ :
T C V = γ W γ × τ γ ,     P C V   = γ W γ × π γ ,
where
τ γ = ln V γ / T , π γ = ln V γ / P .
In Equation (4), the partial weight of the layer W γ is determined by the single quantity M γ V γ 2 :
W γ = M γ V γ 2 γ = 1 N M γ V γ 2 ,
The quantities V γ , τ γ , π γ are independent of the thicknesses h γ and can be measured and tabulated for each material. We can see that the property discussed above leads to the separability of response functions of a composite structure and opens the possibility of stabilizing the resonance to variation of not just one but multiple physical factors simultaneously, e.g., T , P , M . Relations between the velocity and frequency coefficients in a multilayer set-up can be treated in terms of the effective linear thermal expansion α and compressibility κ [12,13]:
T C F = T C V α e f f , P C F = P C V + κ e f f / 3 ,
where
α e f f = γ E γ α γ h γ γ E γ h γ , κ e f f = γ E γ κ γ h γ γ E γ h γ ,
and E γ is the Young’s modulus. Then, a direct solution for the frequency stability equations T C F = P C F = 0 becomes nonlinear in its thickness ratios, as can be seen from Equation (8). However, for most solids, in contrast to gases, variation in velocities with T and P is dominated by the stiffness constants, rather than a change in volume or mass density. Estimation for the considered materials gives α 10 6 / K and κ / 3 10 3 / G P a , which should be compared to τ γ 10 5 ÷ 10 4 / K and π γ 10 2 / G P a . Thus, the last terms in the parentheses of Equation (7) are significantly smaller than the first ones and can be considered a linear correction of the main approximation T C F T C V .
From Equations (4) and (7), we obtain the required dual-factor stability condition
γ M γ V γ 2 τ γ α e f f = 0 ,       γ M γ V γ 2 π γ + κ e f f / 3 = 0 ,
where γ = A l N , S i O 2 , A l , as considered in [12,13,14] for the temperature compensated compound, and where the pertinent data on the bulk properties can be found. Data related to pressure dependence were obtained from [36,37] (fused silica), [38,39,40] (aluminum nitride), and [33,41] (aluminum), and they are partially summarized in Table 1. The parameters related to the ( T , P ) variation rates are discussed below, and the obtained input data are summarized in Table 2. Since direct experimental studies of the required τ and π rates for a single specimen are not available in the current literature, in Appendix A, we outline the way these parameters were obtained from the data provided in the cited references.
Depending on the available data, the Poisson’s ratio is calculated from
ν T = 1 / 2 s / 2 1 s / 2 ,
or similar relations. Thus, experimental data on the bulk S i O 2 [4,12,13,36,37] are described well by the linear temperature dependence in a large interval (e.g., Figures 27–30 in [4]), and the derivatives correspond to a finite difference. We then have from [4] that s T = 80 = 3735   m / s ,       s T = 35 = 3766   m / s ,   T = 80 = 5896   m / s , and T = 35 = 5965   m / s . The corresponding phase velocities of the S 0 mode are V T = 80 = 5780   m / s and     V T = 35 = 5841   m / s , and we finally obtain the required temperature response for the S i O 2 :
Δ ln V Δ T ln V T = 9.14 × 10 5
The pressure dependence of the bulk velocities on the interval ( 0 < P < 1.7 GPa) (tables in the Supplemental Section of [37]) corresponds to the linear negative slope below the elastic anomaly minimum at P = 2.5 GPa. The Appendix section contains more details on the way the required quantities for each material were obtained from the mentioned references following the example described above.
As already mentioned, due to the pressure anomaly of fused silica in Equation (9), the terms alternating in sign may appear not only in the first equation but in the second one as well. This is, however, not sufficient for the existence of a physical solution when all the resulting masses are positive. This restriction means that not just any combination of materials, other than S i O 2 , would satisfy the frequency stability requirement. Our choice of materials gives the possibility of comparing the analytic solution with the results of experimental and theoretical studies on temperature-compensated structures [12,13,14]. This corresponds to the case where the second equation in Equation (9) is dropped, and as can be easily seen, this guarantees the existence of a temperature-compensated solution for any combination of materials if the mass or thickness ratios are adjusted accordingly.
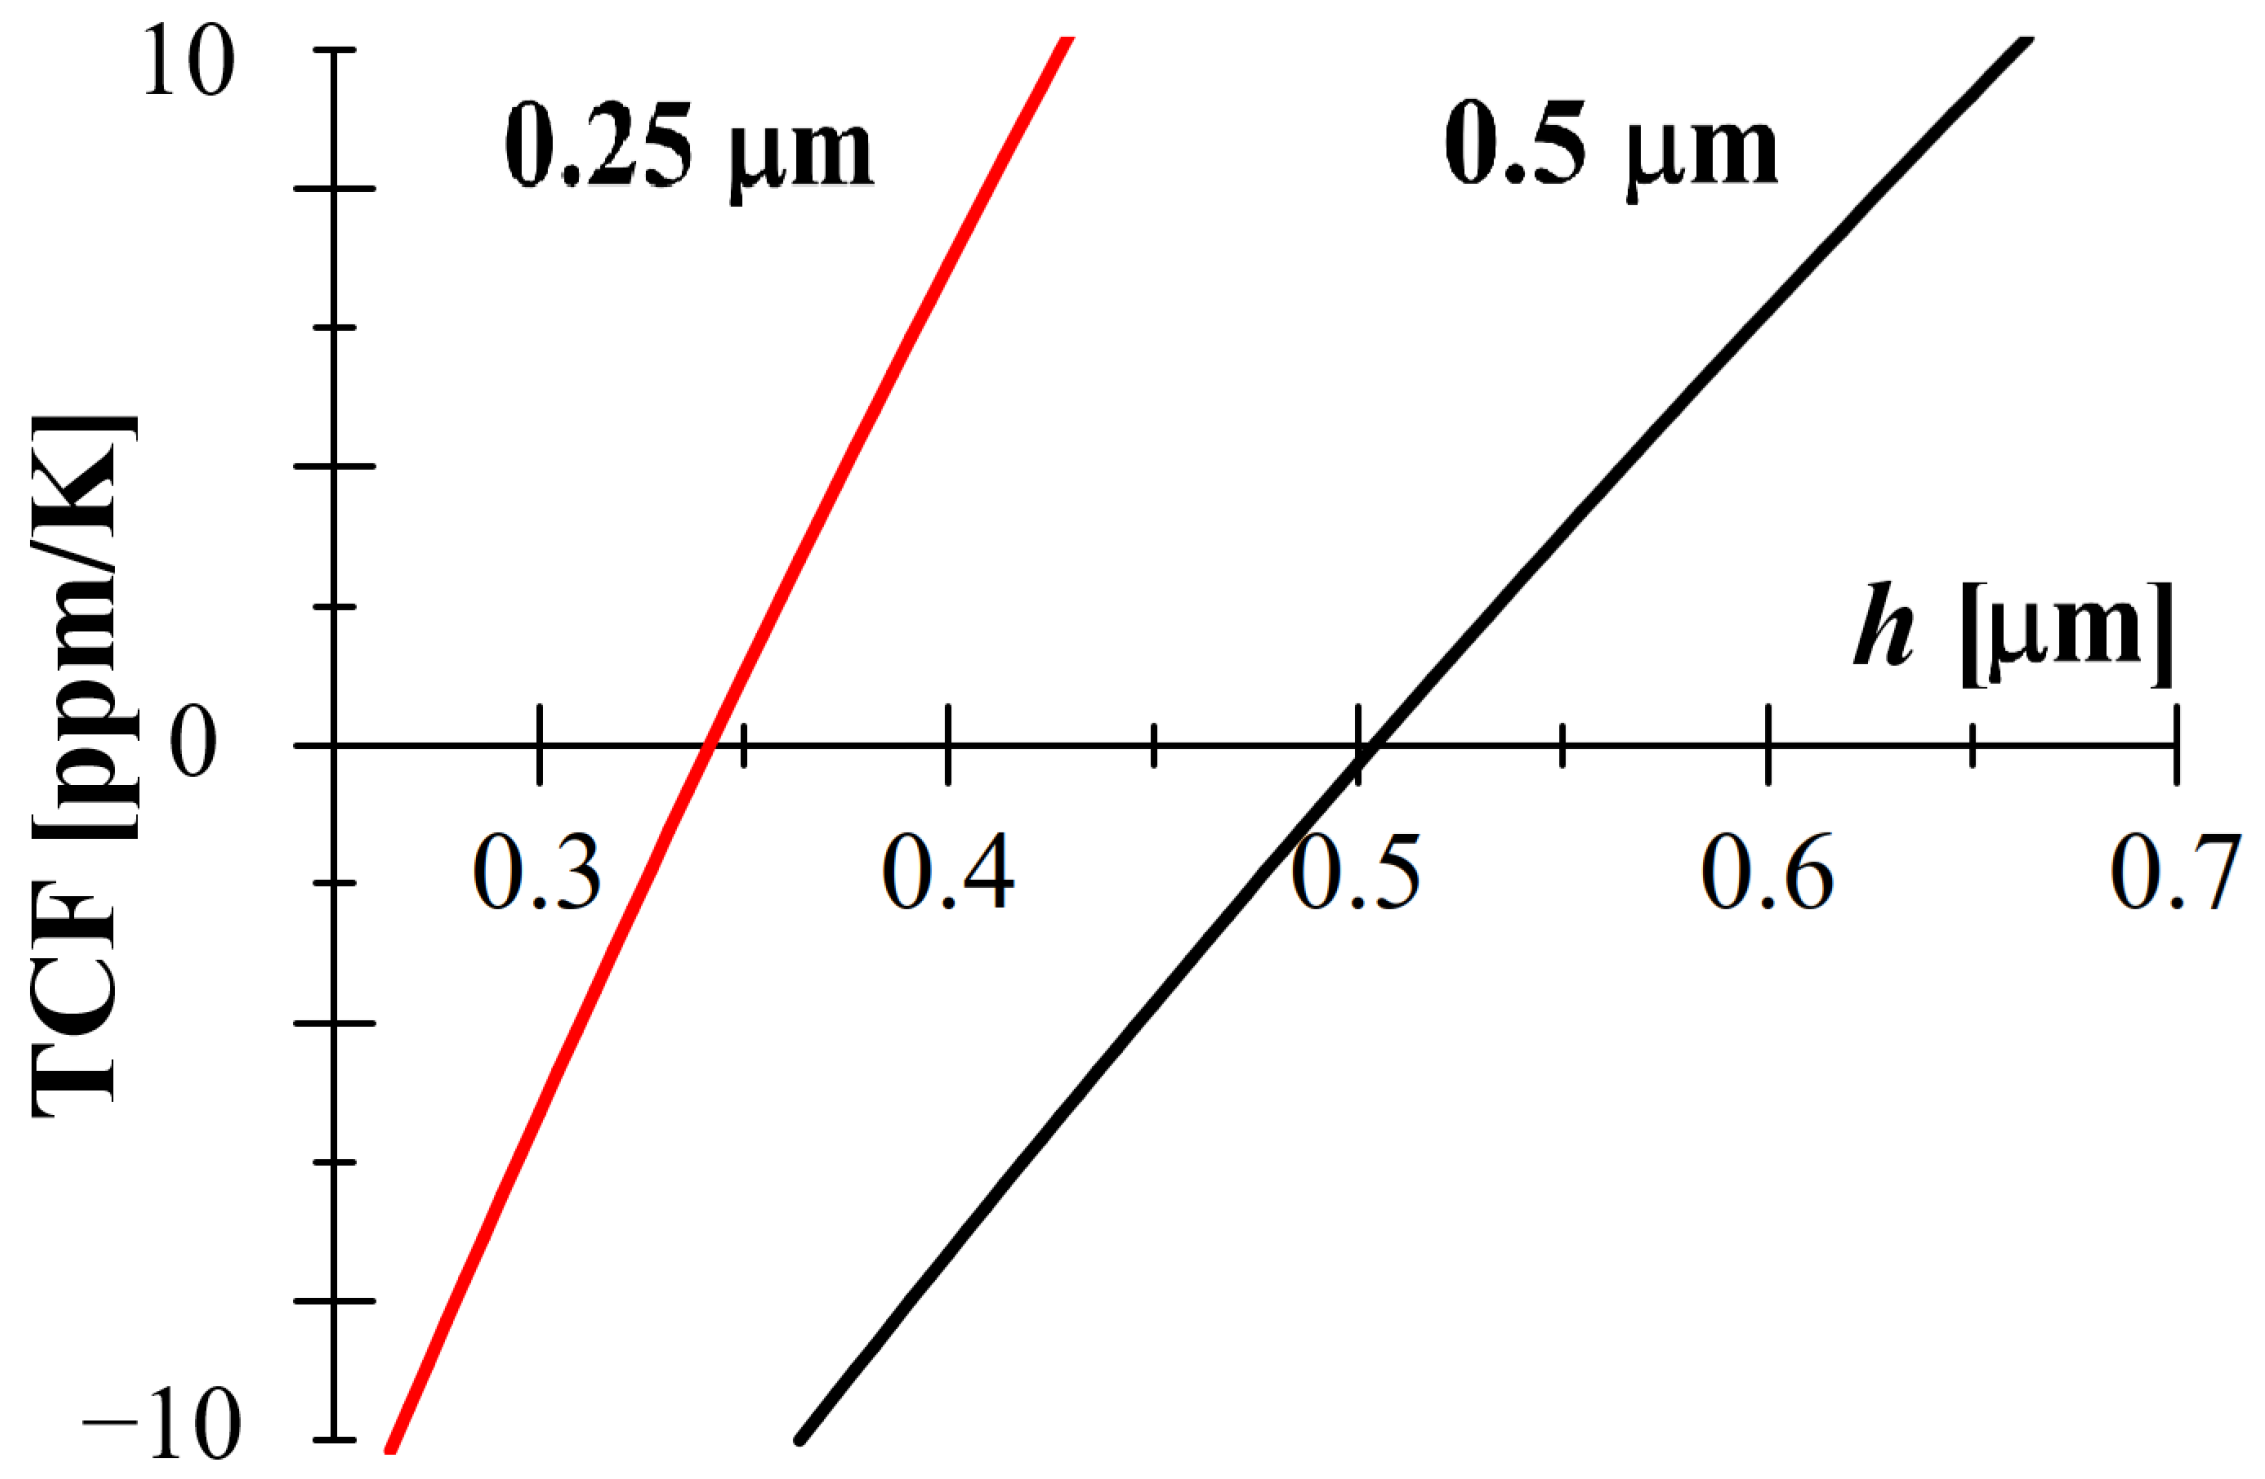
In the present work, data on the bulk properties of A l have been taken into account in the assumption that h A l N h S i O 2 > > h A l , which is confirmed a posteriori. This leads to the following estimation of α 4.6 × 10 6 / K ,   κ / 3 3.7 × 10 3 /GPa, which allows one to consider the approximation T C V = T C F = 0 (i.e., neglecting α in Equation (9)). We then find the solution with h S i O 2 / h A l N = 0.64 . By taking α e f f into account, we obtain h S i O 2 / h A l N = 0.86 for the solution of T C F = 0 . These results are close to the optimal value h S i O 2 / h A l N = 0.83 found in [12,13] ( h A l N = 1   μ m was considered in the calculations) and are well within the experimental range of values (0.6–1.2) found for different thicknesses of the A l N layer [12,14]. If we assume that h A l N h S i O 2 = 1   μ m, then we obtain the estimate for the thickness of the A l layer in the approximation T C V T C F = 0 from Equation (9), which is h A l = 157 nm, comparable to the thickness of the A l electrode used in the experiments (150 nm). A more detailed comparison for other ratios is given in Figure 3, which shows the frequency stabilization near the thickness ratios corresponding to the temperature compensation for the parameters considered in earlier works, namely for a varying thickness ratio between the AlN and fused silica while keeping a fixed ratio between the AlN and Al. The latter ratio was first taken at the optimal point and then shifted away from the optimal value to compare our results with the T- stabilization studied in other works (i.e., without P compensation). We again found good agreement with the numerical simulation studies (e.g., Figures 13 and 14 in [12], Figure 5 in [13]) and experimental measurements (Figure 2 in [13]). This gives sufficient ground to the present approach.
Such a close agreement with earlier studies is an important verification of the present theory. In the following, we neglect the correction due to α and κ in Equation (9) in order to evaluate the possibility of the two-factor compensation and single out the effect of the main parameters collected in Table 2.
The solution of Equation (9) is
M A l N M A l = V A l V A l N 2 R 1 D ;     h A l N h A l = ρ A l ρ A l N M A l N M A l ;
M S i O 2 M A l = V A l V S i O 2 2 R 2 D ;     h S i O 2 h A l = ρ A l ρ S i O 2 M S i O 2 M A l .
Here, we have
D = π A l N × τ S i O 2 π S i O 2 × τ A l N ,
R 1 = π S i O 2 × τ A l π A l × τ S i O 2 ,
R 2 = π A l N × τ A l π A l × τ A l N .
The meaning of the parentheses is to collect the products of the positive quantities in Equation (11) so that grouping of the terms shows the competing contributions to the balancing of the temperature and pressure responses of the three materials and emphasizes the anomalous sign of the τ > 0 and π < 0 functions of the fused silica.
The physical solution of the stability condition in Equation (9) is given by Equations (10) and (11) when all the mass/thickness ratios are positive, i.e., when D , R 1 , R 2 are of the same sign. By substituting the values of the parameters in Table 2, we obtain the following result:
M A l N M A l = 8.1 ;   M S i O 2 M A l = 5.5 ;  
h S i O 2 h A l = 6.84 ;     h S i O 2 h A l N 1 .
This proves the possibility of realizing a dual-factor T , P stabilization. It turns out that the fully compensated structure corresponds to aluminum nitride and glass layers of nearly the same thickness and a much thinner aluminum layer. In contrast to the single-factor stabilization, it is crucial that all the ratios are fixed at specific values. Indeed, following the example in Figure 3, we consider in Figure 4 the behavior in the vicinity of the optimal configuration (Equation (12)). For the thickness h A l N = 0.5 μ m, we fixed one of the ratios, h A l N / h A l , according to configuration in Equation (12). We can see that the two curves P C F ( h ) and T C F ( h ) crossed zero at the same value of h (thickness of the silicate layer), which corresponds to the other ratio in the optimal configuration, where h A l N = h S i O 2 = h = 0.5 μ m. However, when we took h A l N = 0.25 μ m and kept the same thickness of the aluminum layer, the pressure compensation occurred at a lower h than the temperature compensation.

3. Conclusions

Thus, it has been demonstrated that due to the anomalous elastic properties of silicate glasses, it is possible to implement a fully T , P -compensated thin-layer acoustic resonator. For a particular choice of materials in current use, it has been found that its structure is comparable in terms of both the composition and thickness ratios with the S 0 LW mode temperature-compensated resonators. However, in contrast to the latter, the two-factor stabilization problem imposes special restrictions on materials’ characteristics, which have not been systematically studied before (e.g., the T , P variation rates of the phase velocity V γ for the same material γ ). In particular, it is clarified why the required minimal number of layers (three) is larger than the one sufficient for temperature compensation (two) whenever the “backbone” anomalous glass component is included. This rules out the possibility of a multiple-factor intrinsic stabilization in a SAW resonator, where the penetration depth of the wave amplitude is limited to a couple of layers due to exponential decay. Moreover, the analytic expressions evoke the competing character of the contributions by the key parameters (variation rates τ and π ), which impose even stronger restrictions on a possible combination of materials for an LW resonator. It has been shown that the values of these parameters depend on the bulk material properties and therefore could be a subject of a systematic experimental study in order to identify the prospective materials for multiple-factor compensated structures. The obtained results can stimulate further theoretical and experimental research in exploring the possibility of multiple-factor frequency-stabilized acoustic devices.

Funding

This work was financially supported by ANCS Romania (project no. PN 23 21 01 01/2023).

Institutional Review Board Statement

Not applicable.

Informed Consent Statement

Not applicable.

Data Availability Statement

The original contributions presented in this study are included in the article. Further inquiries can be directed to the corresponding author.

Conflicts of Interest

The author declares no conflicts of interest.

Abbreviations

The following abbreviations are used in this manuscript:
TCF and TCVTemperature coefficients of frequency and velocity, respectively
PCF and PCVPressure coefficients of frequency and velocity, respectively
MCFMass coefficient of frequency
LW and SAWLamb and surface acoustic wave, respectively
MEMSMicroelectromechanical systems
γ , V γ Material index and phase velocity of the S 0 mode in a free plate γ , respectively
CPhase velocity of the S 0 mode of a composite structure
τ γ and π γ Temperature and pressure partial response functions, respectively
ρ γ , M γ , and h γ Density, mass, and thickness of the layer, respectively
ν γ Poisson’s ratio
α γ and κ γ Coefficient of linear thermal expansion and compressibility, respectively
s γ and γ Shear and longitudinal velocities, respectively
G γ and E γ Shear modulus and Young’s modulus, respectively
T and PTemperature and pressure, respectively

Appendix A

The calculation of the partial response functions τ γ and π γ (Equation (5)) from the parameters provided in the mentioned references is shown, following the example explained in the text after Equation (9). The γ index has been dropped, and the corresponding units (not shown for brevity) are as follows: [velocity] = m/s, [temperature] = °C, and [pressure] = GPa:
A l N : ln G / T = 0.5 10 4 ,   ln ρ / T = 1.47 × 10 5 , ln s / T = 1.766 × 10 5 , ln 1 ν / T = 6.76 × 10 6 ,   ln G / P = 1.53 × 10 2 , ln ρ / P = 6.25 × 10 3 , ln s / P = 4.5 × 10 3 , ln 1 ν / P = 4.85 × 10 3 , V = 9891 ,   τ = 1.4 × 10 5 ,   π = 6.9 × 10 3 .
SiO 2 : P = 1.02 : s = 3500 , ν = 0.186 , V = 5486.2 , P = 1.72 : s = 3470 , ν = 0.196 , V = 5472.9 , T = 80 : s = 3735 , ν = 0.16486 , V = 5780 , T = 35 : s = 3766 , ν = 0.1686 , V = 5841 , V = 5833 ,     τ = 9.14 × 10 5 ,   π = 3.6 × 10 3 .
A l : s / T = 0.745 ,   ν / T = 0.465 × 10 4 , s / P = 171.1 ,   ν / P   = 1.46 × 10 2 , V = 5492 ,     τ   = 2.03 × 10 4 ,     π = 4.36 × 10 2 .

References

  1. Lee, B.C.; Manson, G.; Staszewski, W.J. Environmental Effects on Lamb Wave Responses from Piezoceramic Sensors. Mater. Sci. Forum 2003, 440–441, 195–202. [Google Scholar] [CrossRef]
  2. Zhang, Y.; Tan, Q.; Zhang, L.; Zhang, W.; Xiong, J. A Novel SAW Temperature-Humidity-Pressure (THP) Sensor Based on LiNbO3 for Environment Monitoring. J. Phys. D Appl. Phys. 2020, 53, 375401. [Google Scholar] [CrossRef]
  3. Available online: https://www.jauch.com/blog/en/tcxo-design-and-functionality/ (accessed on 22 August 2025).
  4. McSkimin, H.J. Measurement of Elastic Constants at Low Temperatures by Means of Ultrasonic Waves–Data for Silicon and Germanium Single Crystals, and for Fused Silica. J. Appl. Phys. 1953, 24, 988–997. [Google Scholar] [CrossRef]
  5. Rouxel, T. Elastic Properties and Short-to Medium-Range Order in Glasses. J. Am. Ceram. Soc. 2007, 90, 3019–3039. [Google Scholar] [CrossRef]
  6. Le Parc, R.; Levelut, C.; Pelous, J.; Martinez, V.; Champagnon, B. Influence of Fictive Temperature and Composition of Silica Glass on Anomalous Elastic Behaviour. J. Phys. Condens. Matter 2006, 18, 7507. [Google Scholar] [CrossRef] [PubMed]
  7. Nicoloiu, A.; Boldeiu, G.; Nastase, C.; Nedelcu, M.; Ciornei, C.; Zdru, I.; Stavrinidis, G.; Vasilache, D.; Stavrinidis, A.; Dinescu, A.; et al. Temperature Behaviour of Rayleigh, Sezawa and Lamb Mode Resonance Frequencies of 30 % ScAlN/Si Saw Devices. In Proceedings of the 22nd International Conference on Solid-State Sensors, Actuators and Microsystems (Transducers), Kyoto, Japan, 25–29 June 2023; pp. 1608–1611. [Google Scholar]
  8. Pan, S.; Memon, M.M.; Wan, J.; Wang, T.; Zhang, W. The Influence of Pressure on the TCF of AlN-Based SAW Pressure Sensor. IEEE Sens. J. 2022, 22, 3097–3104. [Google Scholar] [CrossRef]
  9. Zagorac, D.; Zagorac, J.; Djukic, M.B.; Jordanov, D.; Matović, B. Theoretical Study of AlN Mechanical Behaviour under High Pressure Regime. Theor. Appl. Fract. Mech. 2019, 103, 102289. [Google Scholar] [CrossRef]
  10. Yu, Z.; Yue, Y.; Liang, Z.; Zhao, X.; Li, F.; Peng, W.; Zhu, Q.; He, Y. Physical Sensors Based on Lamb Wave Resonators. Micromachines 2024, 15, 1243. [Google Scholar] [CrossRef]
  11. Yantchev, V.; Katardjiev, I. Thin Film Lamb Wave Resonators in Frequency Control and Sensing Applications: A Review. J. Micromech. Microeng. 2013, 23, 043001. [Google Scholar] [CrossRef]
  12. Kuypers, J.H.; Lin, C.-M.; Vigevani, G.; Pisano, A.P. Intrinsic Temperature Compensation o f Aluminum Nitride Lamb Wave Resonators for Multiple-Frequency References. In Proceedings of the 2008 IEEE International Frequency Control Symposium, Honolulu, HI, USA, 19–21 May 2008; pp. 240–249. [Google Scholar]
  13. Lin, C.-M.; Yen, T.-T.; Lai, Y.-J.; Felmetsger, V.V.; Hopcroft, M.A.; Kuypers, J.H.; Pisano, A.P. Experimental Study of Temperature-Compensated Aluminum Nitride Lamb Wave Resonators. In Proceedings of the 2009 IEEE International Frequency Control Symposium Joint with the 22nd European Frequency and Time Forum, Besancon, France, 20–24 April 2009; pp. 5–9. [Google Scholar]
  14. Lin, C.-M.; Yen, T.-T.; Felmetsger, V.V.; Hopcroft, M.A.; Kuypers, J.H.; Pisano, A.P. Thermally Compensated Aluminum Nitride Lamb Wave Resonators for High Temperature Applications. Appl. Phys. Lett. 2010, 97, 083501. [Google Scholar] [CrossRef]
  15. Lu, X.; Ren, H. Micromachined Piezoelectric Lamb Wave Resonators: A Review. J. Micromech. Microeng. 2023, 33, 113001. [Google Scholar] [CrossRef]
  16. Zou, J.; Pisano, A.P. Temperature Compensation of the AlN Lamb Wave Resonators Utilizing the S1 Mode. In Proceedings of the 2015 IEEE International Ultrasonics Symposium (IUS), Taipei, Taiwan, 21–24 October 2015; pp. 1–4. [Google Scholar]
  17. Zou, J.; Lin, C.-M.; Senesky, D.G.; Pisano, A.P. Thermally Stable SiO2/AlN/SiO2 Lamb Wave Resonators Utilizing the Lowest-Order Symmetric Mode at High Temperatures. In Proceedings of the 2013 IEEE International Ultrasonics Symposium (IUS), Prague, Czech Republic, 21–25 July 2013; pp. 1077–1080. [Google Scholar]
  18. Caliendo, C.; D’Amico, A.; Lo Castro, F. Lamb Waves Propagation along 3C-SiC/AlN Membranes for Application in Temperature-Compensated, High-Sensitivity Gravimetric Sensors. Sensors 2013, 13, 550–564. [Google Scholar] [CrossRef]
  19. Rose, J.L. Ultrasonic Guided Waves in Solid Media; Cambridge University Press: Cambridge, UK, 2014. [Google Scholar]
  20. Fainozzi, D.; Caporaletti, F.; Capotondi, F.; De Angelis, D.; Duncan, R.A.; Foglia, L.; Martinelli, A.; Mincigrucci, R.; Nelson, K.A.; Pedersoli, E.; et al. Temperature Effects on the Nanoscale Thermoelastic Response of a SiO2 Membrane. APL Mater. 2024, 12, 051122. [Google Scholar] [CrossRef]
  21. Li, H.; Zhou, J.; Xu, Q.; Liu, Z.; Ren, Y.; Liu, Y.; Guo, S.; Cai, Y.; Sun, C. Low Temperature Coefficient of Frequency AlN Lamb Wave Resonator Using Groove Structure between Interdigital Transducers. J. Appl. Phys. 2024, 136, 025702. [Google Scholar] [CrossRef]
  22. Zha, C.; Hemley, R.J.; Mao, H.; Duffy, T.S.; Meade, C. Acoustic Velocities and Refractive Index of SiO2 Glass to 57.5 GPa by Brillouin Scattering. Phys. Rev. B 1994, 50, 13105–13112. [Google Scholar] [CrossRef] [PubMed]
  23. Manghnani, M.H.; Williams, Q.; Matsui, T.; Schultz, P.C.; Kurkjian, C.R. Effects of Composition, Pressure, and Temperature on the Elastic Properties of SiO2–TiO2 Glasses: An Integrated Ultrasonic and Brillouin Study. Minerals 2020, 10, 481. [Google Scholar] [CrossRef]
  24. Deschamps, T.; Margueritat, J.; Martinet, C.; Mermet, A.; Champagnon, B. Elastic Moduli of Permanently Densified Silica Glasses. Sci. Rep. 2014, 4, 7193. [Google Scholar] [CrossRef]
  25. Guerette, M.; Ackerson, M.R.; Thomas, J.; Yuan, F.; Bruce Watson, E.; Walker, D.; Huang, L. Structure and Properties of Silica Glass Densified in Cold Compression and Hot Compression. Sci. Rep. 2015, 5, 15343. [Google Scholar] [CrossRef]
  26. Courtois, M.; Berthelot, A.; Cornet, A.; Le Floch, S.; Martinet, C.; Deschamps, T. Pressure-Induced Amorphous-Amorphous Transition in Pre-Densified Silica Glass: An Experimental Exploration of the Potential Energy Landscape. Sci. Rep. 2025, 15, 6719. [Google Scholar] [CrossRef]
  27. Takahashi, N.; Sakamaki, T.; Ikeda, O.; Kakizawa, S.; Higo, Y.; Suzuki, A. Elastic Wave Velocity Measurements of Sodium Aluminosilicate Glass and Melt at High Pressure and Temperature. Phys. Earth Planet. Inter. 2024, 350, 107167. [Google Scholar] [CrossRef]
  28. Sonneville, C.; De Ligny, D.; Mermet, A.; Champagnon, B.; Martinet, C.; Henderson, G.H.; Deschamps, T.; Margueritat, J.; Barthel, E. In Situ Brillouin Study of Sodium Alumino Silicate Glasses under Pressure. J. Chem. Phys. 2013, 139, 074501. [Google Scholar] [CrossRef]
  29. Sonneville, C.; Degioanni, S.; Martinet, C.; de Ligny, D.; Martinez, V.; Jurdyc, A.-M.; Braunn, A.; Raffaelly, L.; Champagnon, B.; Vouagner, D. Pressure-Independent Brillouin Fiber Optic Sensors for Temperature Measurements. J.-Non Solids 2014, 401, 36–39. [Google Scholar] [CrossRef]
  30. Kiefer, D.A.; Ponschab, M.; Rupitsch, S.J.; Mayle, M. Calculating the Full Leaky Lamb Wave Spectrum with Exact Fluid Interaction. J. Acoust. Soc. Am. 2019, 145, 3341–3350. [Google Scholar] [CrossRef]
  31. Cojocaru, S. Non-Monotonic Variation of Acoustic Spectrum with the Mass or Thickness of a Layered Structure. Acoustics 2024, 6, 805–817. [Google Scholar] [CrossRef]
  32. Cojocaru, S.; Anghel, D.V. Low-Temperature Electron-Phonon Heat Transfer in Metal Films. Phys. Rev. B 2016, 93, 115405. [Google Scholar] [CrossRef]
  33. Simmons, G.; Wang, H. Single Crystal Elastic Constants and Calculated Aggregate Properties: A Handbook; MIT Press: Cambridge, MA, USA, 1971. [Google Scholar]
  34. Augereau, F.; Laux, D.; Allais, L.; Mottot, M.; Caes, C. Ultrasonic Measurement of Anisotropy and Temperature Dependence of Elastic Parameters by a Dry Coupling Method Applied to a 6061-T6 Alloy. Ultrasonics 2007, 46, 34–41. [Google Scholar] [CrossRef]
  35. Dodson, J.C.; Inman, D.J. Thermal Sensitivity of Lamb Waves for Structural Health Monitoring Applications. Ultrasonics 2013, 53, 677–685. [Google Scholar] [CrossRef]
  36. Gerlich, D.; Slack, G.A. Pressure Dependence of the Thermal Conductivity of Glasses. J. Phys. Chem. Solids 1985, 46, 433–436. [Google Scholar] [CrossRef]
  37. Sun, N.; Mao, Z.; Zhang, X.; Tkachev, S.N.; Lin, J.-F. Hot Dense Silica Glass with Ultrahigh Elastic Moduli. Sci. Rep. 2022, 12, 13946. [Google Scholar] [CrossRef] [PubMed]
  38. Gerlich, D.; Dole, S.L.; Slack, G.A. Elastic Properties of Aluminum Nitride. J. Phys. Chem. Solids 1986, 47, 437–441. [Google Scholar] [CrossRef]
  39. Dandekar, D.P.; Abbate, A.; Frankel, J. Equation of State of Aluminum Nitride and Its Shock Response. J. Appl. Phys. 1994, 76, 4077–4085. [Google Scholar] [CrossRef]
  40. Available online: https://www.ioffe.ru/SVA/NSM/Semicond/AlN/mechanic.html (accessed on 22 August 2025).
  41. Song, W.; Tang, Q.; Su, C.; Chen, X.; Liu, Y. Ultrasonic Experimental Study on the Elasticity of Aluminum to 4.1 GPa in Multi-Anvil Apparatus. Phys. B 2021, 609, 412891. [Google Scholar] [CrossRef]
Figure 1. We considered a three-layered structure composed of A l N , S i O 2 , A l , which has been extensively studied in earlier works demonstrating the intrinsic temperature compensation of the L W resonance frequency (see [12] and the references in the text). The IDT electrodes are at the top of the A l N layer, the A l electrode is the interface with the glass layer, and the arrow shows the in-plane direction of the propagation wave vector k .
Applsci 15 09349 g001
Figure 2. Phase velocity of the S 0 mode versus the thickness of the oxide layer and h A l N / λ = 0.09 for the structure in Figure 1. The red dashed line corresponds to the long-wavelength phase velocity in Equation (2) (where the IDT contribution is neglected). The continuous line represents the full calculation including the IDT (Figures 3 and 4 in [12] and Figure 3 in [13]).
Applsci 15 09349 g002
Figure 3. Plots of the S i O 2 thickness (h) dependence of the TCF (Equation (7)) for the two A l N plate thicknesses ( 0.5 μ m and 0.25 μ m) and a fixed thickness for the A l electrode. We took h A l = 73 nm, corresponding to h A l N = 0.5 μ m when the ratio corresponded to the one discussed above.
Applsci 15 09349 g003
Figure 4. Plot that combines the P C F ( h ) (dashed) and T C F ( h ) (continuous) response functions similar to the one in Figure 3. For the A l N plate thickness 0.5 μ m, all the thickness ratios correspond to the dual-factor stability solution in Equation (12), and the two curves cross at the same value of the S i O 2 thickness (h). For the same thickness of the A l layer, and when changing the A l N plate thickness to 0.25 μ m, it was not possible to simultaneously stabilize the structure in terms of temperature and pressure for any h.
Applsci 15 09349 g004
Table 1. Values of the bulk parameters obtained from the cited references and used in calculating the response functions for the corresponding materials as detailed in the text. The results are summarized in Table 2. Data refer to room temperature and zero pressure (see Abbreviations for the meanings of the symbols).
Quantity AlN SiO 2 Al
ρ   [ kg / m 3 ] 326022102702
α   [ 10 6 /K] 5.27 0.55 18
κ   [ 10 3 /GPa] 6.25 27 1.4
ν 0.18 0.17 0.35
s   [m/s]633037573131
  [m/s]10,12759546518
G   [GPa] 130.6 31 26.5
E   [GPa]3087269
Table 2. Values of the phase velocities V γ in Equation (2) and the corresponding partial T and P response functions (Equation (5)) obtained from the cited references, as explained in the text following Equation (9).
QuantityAlN SiO 2 Al
τ   [ × 10 5 / K ] 1.4 9.14 20.3
π   [ × 10 3 / GPa ] 6.9 36 43.6
V [m/s]989158335492
Disclaimer/Publisher’s Note: The statements, opinions and data contained in all publications are solely those of the individual author(s) and contributor(s) and not of MDPI and/or the editor(s). MDPI and/or the editor(s) disclaim responsibility for any injury to people or property resulting from any ideas, methods, instructions or products referred to in the content.