Article

Simulation-Based Optimization of Material Supply in Automotive Production Using RTLS Data

1
Faculty of Mechanical Engineering, Department of Industrial and Digital Engineering, Technical University of Košice, Park Komenského 9, 042 00 Košice, Slovakia
2
Faculty of Mechanical Engineering, Department of Applied Mathematics and Informatics, Technical University of Košice, Letná 9, 042 00 Košice, Slovakia
*
Author to whom correspondence should be addressed.
Appl. Sci. 2025, 15(16), 9102; https://doi.org/10.3390/app15169102
Submission received: 2 July 2025 / Revised: 13 August 2025 / Accepted: 14 August 2025 / Published: 19 August 2025
(This article belongs to the Special Issue Machine Tools, Advanced Manufacturing and Precision Manufacturing)

Abstract

This study presents a comprehensive simulation-driven approach to identify and mitigate bottlenecks in the supply flows of an automotive manufacturing system. The supply process relies on a Kanban-based assembly line replenishment, supported by multiple material transports per shift using tugger trains. To analyze flow constraints, the research combines time–motion studies with data from a Real-Time Locating System (RTLS), enabling spatial-temporal mapping of material movements. Based on this data, digital-twin simulation models of the supply process were developed and validated. These models allowed testing of improvements aimed at increasing throughput and efficiency. The proposed methodology demonstrates effective bottleneck resolution and provides a structured framework for data collection and simulation integration. Unlike traditional observation-based approaches, the use of RTLS enables precise detection of routing deviations and operator behaviors. The simulation model was tested under real operating conditions and validated against ground-truth data. Results showed a reduction in collisions and delivery delays, as well as measurable productivity and financial gains. This approach offers a practical and transferable method for optimizing intralogistics in modern production environments.

1. Introduction

Efficient material supply is a critical factor in maintaining continuous production and minimizing operational disruptions in manufacturing systems [1,2]. In automotive environments, the timely replenishment of production lines using tugger trains is especially prone to delays and collisions due to space constraints, human error, and inadequate route planning [3,4]. If these inefficiencies are not addressed they can lead to frequent production stoppages, increased operational costs, and reduced competitiveness.
This challenge becomes increasingly relevant in the context of Industry 4.0 and 5.0, where expectations for lean, responsive, and data-driven logistics systems are growing. In this light, advanced monitoring and modeling tools are needed to address these inefficiencies in real time and to support agile decision-making.
Bottleneck detection and mitigation have been the subject of various studies across manufacturing and logistics. For example, Zhang et al. [5] developed a dynamic bottleneck prediction model based on throughput delays, while Kasemset and Kachitvichyanukul [6] applied simulation methods for bottleneck mapping. Thürer and Stevenson [7] also explored simulation-based flow improvements. This paper builds upon and expands on several previously published studies. In 2023, a case study presented in [8] used simulation to optimize a blood plasma processing line. Similarly, Pekarčíková et al. [9] applied simulation tools to eliminate bottlenecks within logistics chains using Tecnomatix Plant Simulation. While these works demonstrated the potential of simulation, they typically relied on static or pre-processed data and did not integrate continuous real-time inputs into the optimization loop.
Recent advancements have focused on real-time and data-driven approaches to bottleneck analysis. West et al. [10] proposed a diagnostic method that dynamically identifies bottlenecks using live operational data, enabling rapid decision-making in serial manufacturing systems. Zhang et al. [11] introduced a cloud-based simulation approach employing Object-Oriented Colored Petri Nets to model and resolve flow constraints in discrete production environments. Marschall et al. [12] addressed the deployment of mobile robotic systems in reconfigurable production, using simulation to optimize layout and logistics flexibility. These studies illustrate the ongoing trend toward integrating simulation with real-time data to improve adaptability; however, most focus on either the data acquisition or the simulation phase, rather than their seamless integration.
While the above studies contributed valuable insights, many of them rely on simplified models or do not integrate real-time operational data. To address this gap, this paper proposes an integrated methodology that combines RTLS-based monitoring with digital simulation modeling to detect supply bottlenecks and test logistics improvements in a realistic, data-rich environment. This paper presents a case study on the supply process for production using tugger trains, which consist of a tractor and several wagons, depending on the volume of supply items. These trains are operated by workers who unload the necessary material items at designated stations for final product assembly and return empty containers to the warehouse [13,14].
In the studied system, frequent route deviations and tugger train collisions were observed, indicating critical weaknesses in logistics route planning and control [15]. These inefficiencies were quantified through combined observation and RTLS tracking methods [16,17]. The supply process uses the Kanban system, based on which production lines request the required material items from the warehouse according to consumption [18,19,20]. These materials are then loaded onto the two tugger train sets [21].
The key contribution of this paper is the integration of RTLS-based monitoring with digital simulation modeling, enabling the detection of supply bottlenecks and testing of logistics improvements in a realistic environment [22,23,24]. This combined approach supports the digital transformation of internal logistics in accordance with Industry 4.0 and 5.0 principles [25].

2. Materials and Methods

This section details the production and supply systems, the real-time monitoring technology based on RTLS, and the simulation methodology applied to logistics processes. The objective is to provide a comprehensive description of the methods, tools, and input data employed for the analysis and optimization of material flows within the examined production environment.

2.1. RTLS Monitoring Technology

The implementation of RTLS has become a pivotal technology for monitoring and improving internal logistics processes by providing accurate location data and movement tracking of material handling equipment and goods [26,27,28]. RTLS enables the identification of critical delays, route deviations, and collisions, thus supporting data-driven decisions to optimize supply flows [29]. In the studied supply system, RTLS tracking combined with observational methods allowed the quantification of inefficiencies and bottlenecks in tugger train logistics, providing a solid data basis for simulation-based optimization.
Unloading time, loading time, scanning time, transport time, and the weight of individual deliveries served as input data for our study and implementation. Through measurement and observation methods, we regularly collected input data, where the average values showed minimal differences. These values were then used in both the analytical and design phases.
The RTLS UWB Wi-Fi Kit by Sewio Networks s.r.o. is an advanced real-time locating system that uses ultra-wideband (UWB) technology and the Time Difference of Arrival (TDoA) method to precisely determine the position of objects. This type of RTLS is designed primarily for industrial environments, where high accuracy, reliability, and scalability are essential. The kit consists of five Vista Omni anchors that provide the localization infrastructure, four tracking tags—two Leonardo Personal tags and two Leonardo Asset tags—and the RTLS Studio software version 3.5.
As illustrated in Figure 1, the layout of the production hall incorporates a monitoring method called the spaghetti spot. A spaghetti diagram is a visual representation that uses a continuous line to depict the movement of an item or activity through a process. This tool helps identify bottlenecks and critical points in the workflow, as well as opportunities to streamline the process. The spaghetti diagram highlights overlapping areas where multiple pathways intersect, causing delays. It is particularly useful in streamlining the movement of people, products, and tugger trains within the production unit.
The spaghetti diagram is one of the outputs of the RTLS monitoring technology. The layout in Figure 1 shows the arrangement of the four production lines, labeled as CSD (CSD—Customer-Specific Demand) Line A, B, C, and D.
The orange color represents the supplier operating the tugger (designated as JFG 77381), which is supposed to serve as the main supplier for CSD Line A and CSD Line B in terms of the logistics route. However, during the measurement and data collection period we observed multiple instances of this supplier being present in locations where they were not supposed to be, such as CSD Line C and CSD Line D.
The blue color represents the supplier and tugger 2 (designated as JFG 77382), responsible for supplying CSD Line C and CSD Line D. However, the measured operational behavior deviated significantly from the predefined logistics plan. The tugger train did not adhere to its designated route and made unauthorized stops in areas outside its intended operation zones. This deviation was primarily caused by incorrect scanning performed by production workers handling Kanban cards. As a result, essential materials were not delivered on time, leading to material shortages and disruptions in the production cycle.
Due to these shortcomings, it was observed that input materials were at times retrieved manually by production line workers, bypassing standard logistics procedures. This practice subsequently led to another issue: incorrect scanning of materials. Under optimal conditions, material scanning should be performed exclusively by tugger train operators, while production line workers should interact only with designated storage bins rather than scanning materials directly from warehouse areas.
During data collection, several instances were recorded where the tugger train operator entered the production line area with full or empty material containers, disrupting the flow of operations and contributing to collisions and timing inconsistencies in material supply.
A critical issue identified was the occurrence of collisions between tugger trains, largely attributed to the absence of clearly defined routes and delivery paths in high-traffic areas. Inadequate logistics planning triggered cascading disruptions, negatively affecting not only the involved production lines but also downstream processes reliant on timely material deliveries.
The consequences of these inefficiencies manifested as production downtime, material shortages, time constraints, production stoppages, disruptions in meeting daily production plans, failure to fulfill customer orders, low machine efficiency, process blockages, increased movement between production lines, and other operational inefficiencies.
To validate these observations, a detailed quantitative analysis was conducted over a one-month period, during which the following irregularities were recorded:
These statistics demonstrate in Table 1. systemic process inconsistencies. For instance, 17 incidents were documented in which employees bypassed standard procedures and manually retrieved components—typically in response to delayed deliveries or miscommunication. Additionally, 11 instances of incorrect barcode scanning caused tugger trains to be misrouted, resulting in materials being delivered to incorrect locations or failing to reach critical unloading stations.
Although the recorded 9 collisions per month are not catastrophic, they highlight persistent weaknesses in logistics routing and coordination. These findings emphasize the necessity of implementing real-time tracking systems and well-defined logistics planning, supported by RTLS data, to enhance supply chain performance and reliability.

2.2. Simulation

The data collected through time studies and RTLS monitoring methods were analyzed and compared. Based on this data, we developed a simulation model of the supply chain within production. This simulation first confirmed the presence of bottlenecks and subsequently enabled us to explore various process improvement strategies in a digital environment.
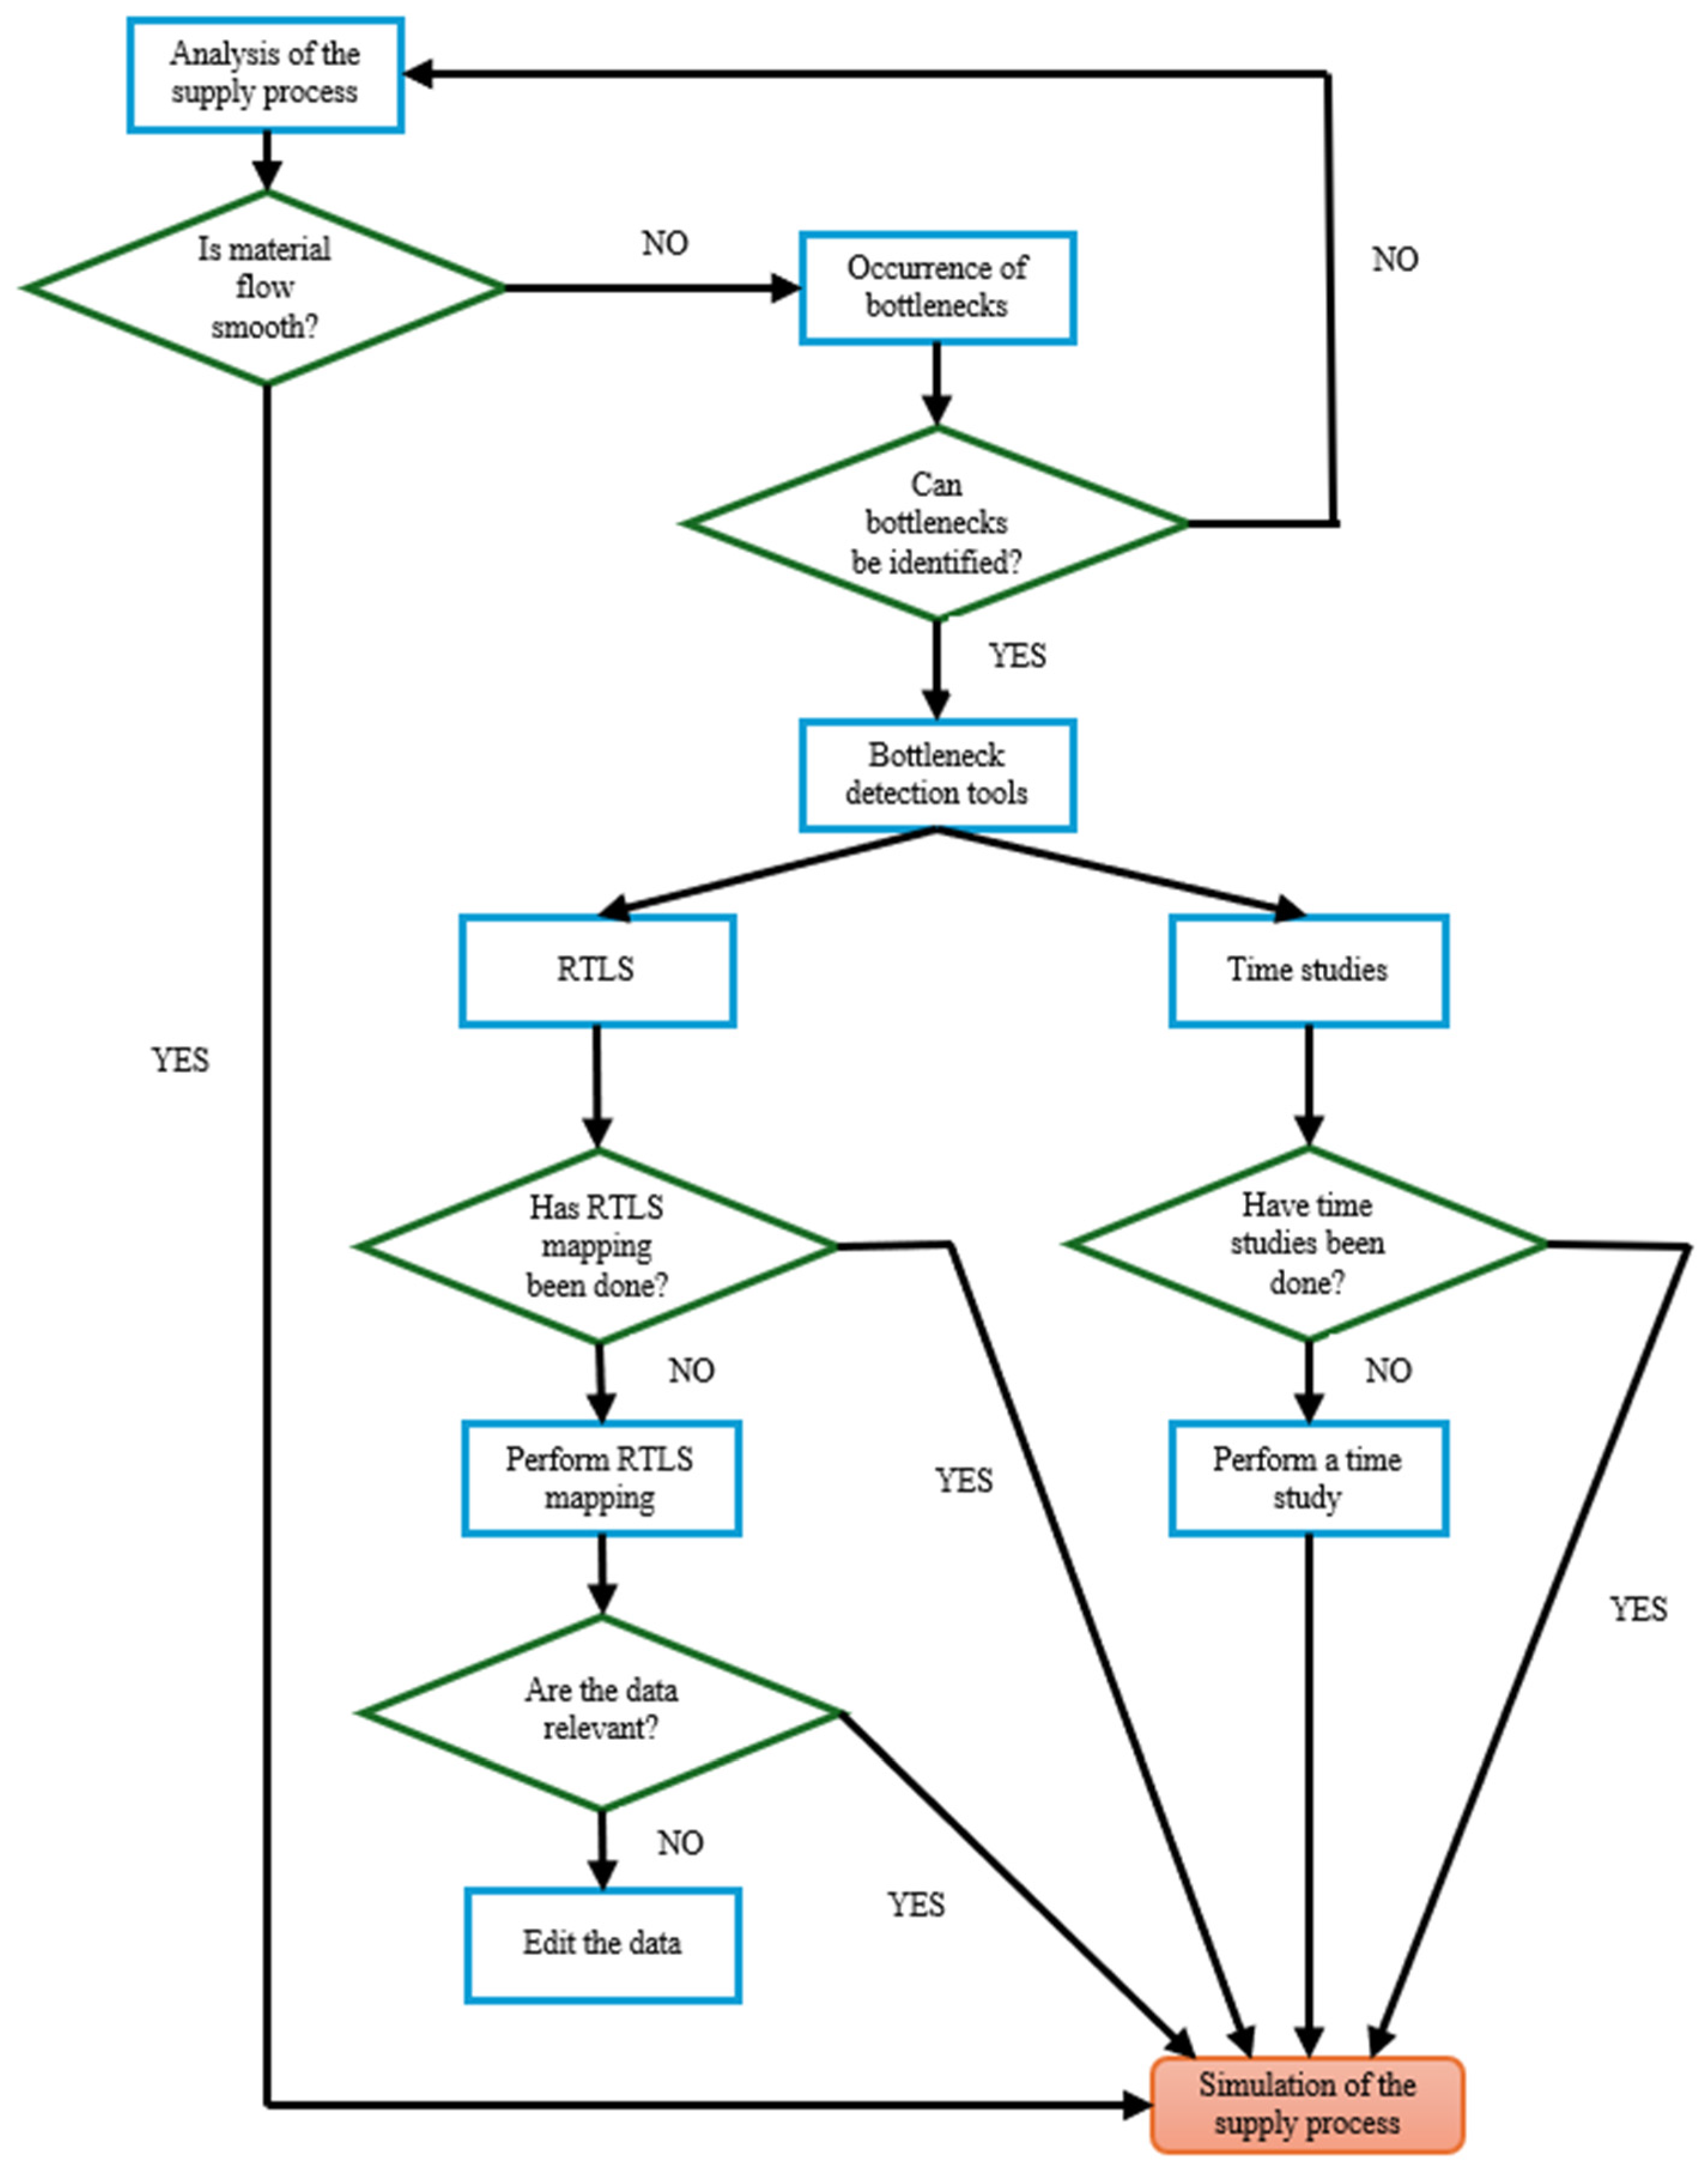
The methodology for analyzing the supply process is illustrated in Figure 2.
This methodology is universal and can be applied to any operation—not only within the supply process, but generally to any production process regardless of the industrial sector or type of manufacturing.
According to the proposed methodology, data was collected using both observational and detection-based methods. The observational techniques were implemented over several daily shifts within the operation, during which the RTLS detection method was also active. The results obtained from time studies were compared with the output of the detection technology, which operated continuously over several days, including during shifts where no observational time–motion measurements were performed.
Based on the comparison of the datasets obtained through both methods, the results derived solely from the detection technology can be considered reliable. Therefore, these results were also used as input for the simulation model.
The significance of these data can be immediately observed in Figure 1, where the routes of two tugger train operators are visualized—Operator 1 in blue and Operator 2 in orange. The figure clearly illustrates multiple overlapping paths between the two operators, which ideally should not occur. Although both operators start from the same point, they are expected to follow predefined routes; however, our investigation revealed that no such predefined routes were established by the company.
Thus, the figure also highlights the different paths taken and identifies bottlenecks within the supply workstation. These bottlenecks are defined as areas where a given operator must pass at least twice. Since the tugger train requires a minimum turning radius of three meters, it is not capable of turning on the spot. In the event of incomplete or delayed unloading of material at the designated location, the tugger is required to repeat the route to ensure proper delivery.
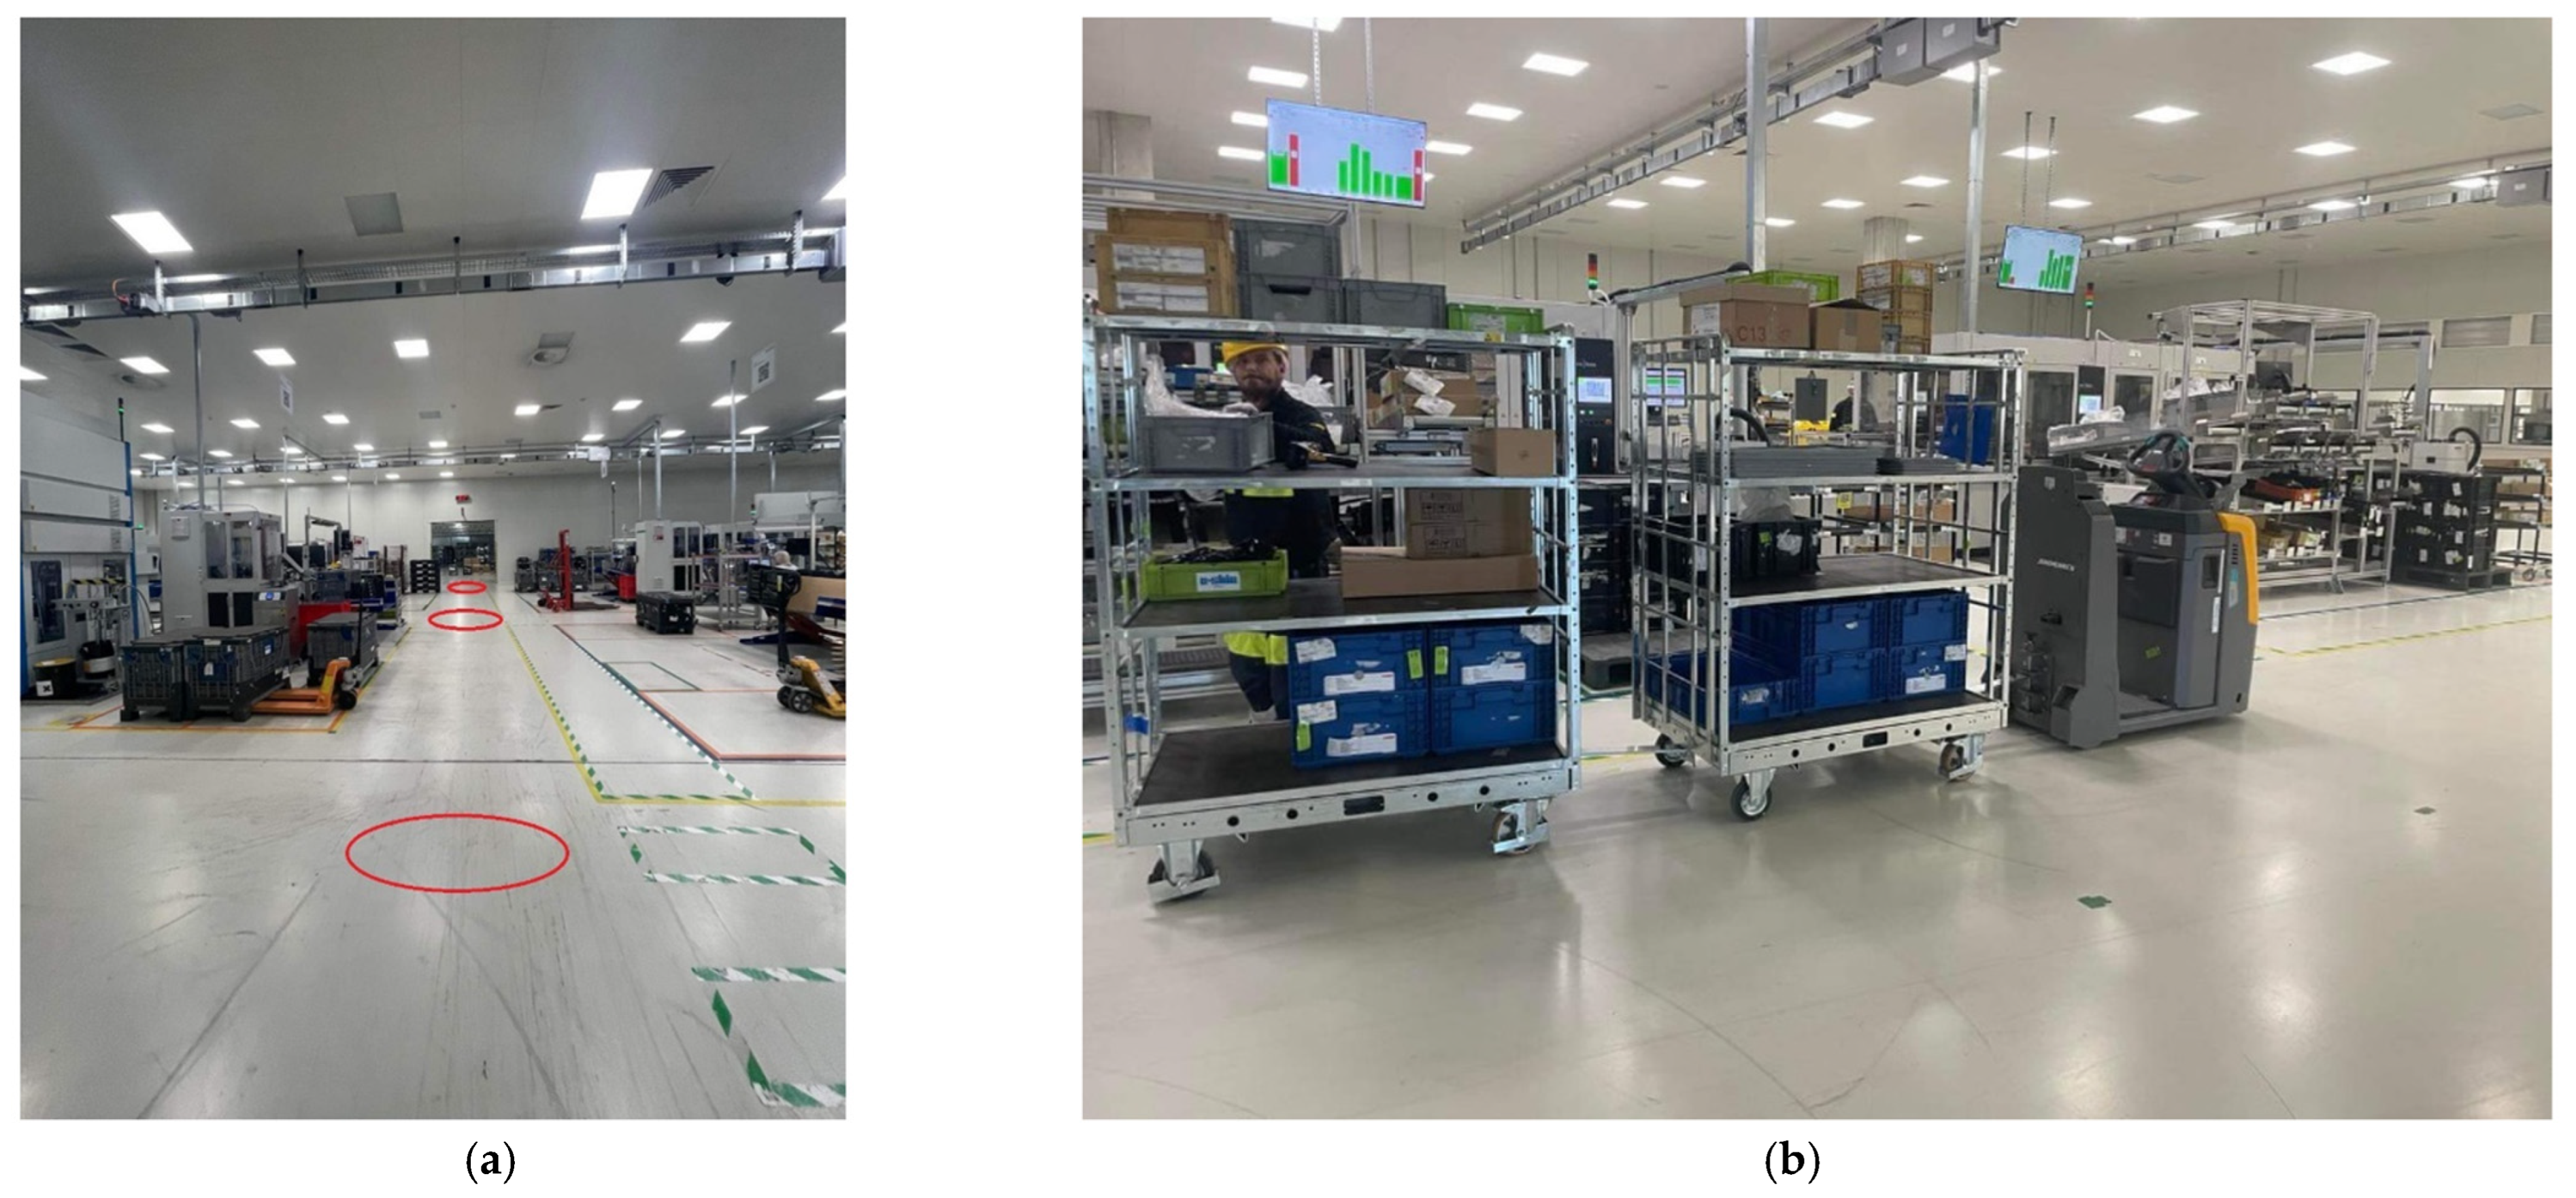
In Figure 3a, we can observe a photograph taken within the company’s production hall, illustrating the actual locations where collisions occur during the material supply process. These are points where the routes of two tuggers undesirably overlap, which may lead to collisions or disruptions in the continuity of the supply process. This issue must be addressed in order to improve both the efficiency of the material supply process and the overall flow of all production lines being supplied.
Figure 3b depicts the specific tugger train system responsible for performing the supply operations. Depending on the volume of material being transported, the train consists of two or three trailer cages. As can be seen in Figure 3a, the available space for tugger movement, in relation to the system’s dimensions, is sufficient for the passage of only one such train—and only in a single direction. The area does not allow for bidirectional movement, nor does it provide space for two supply tugger trains to bypass or avoid each other.
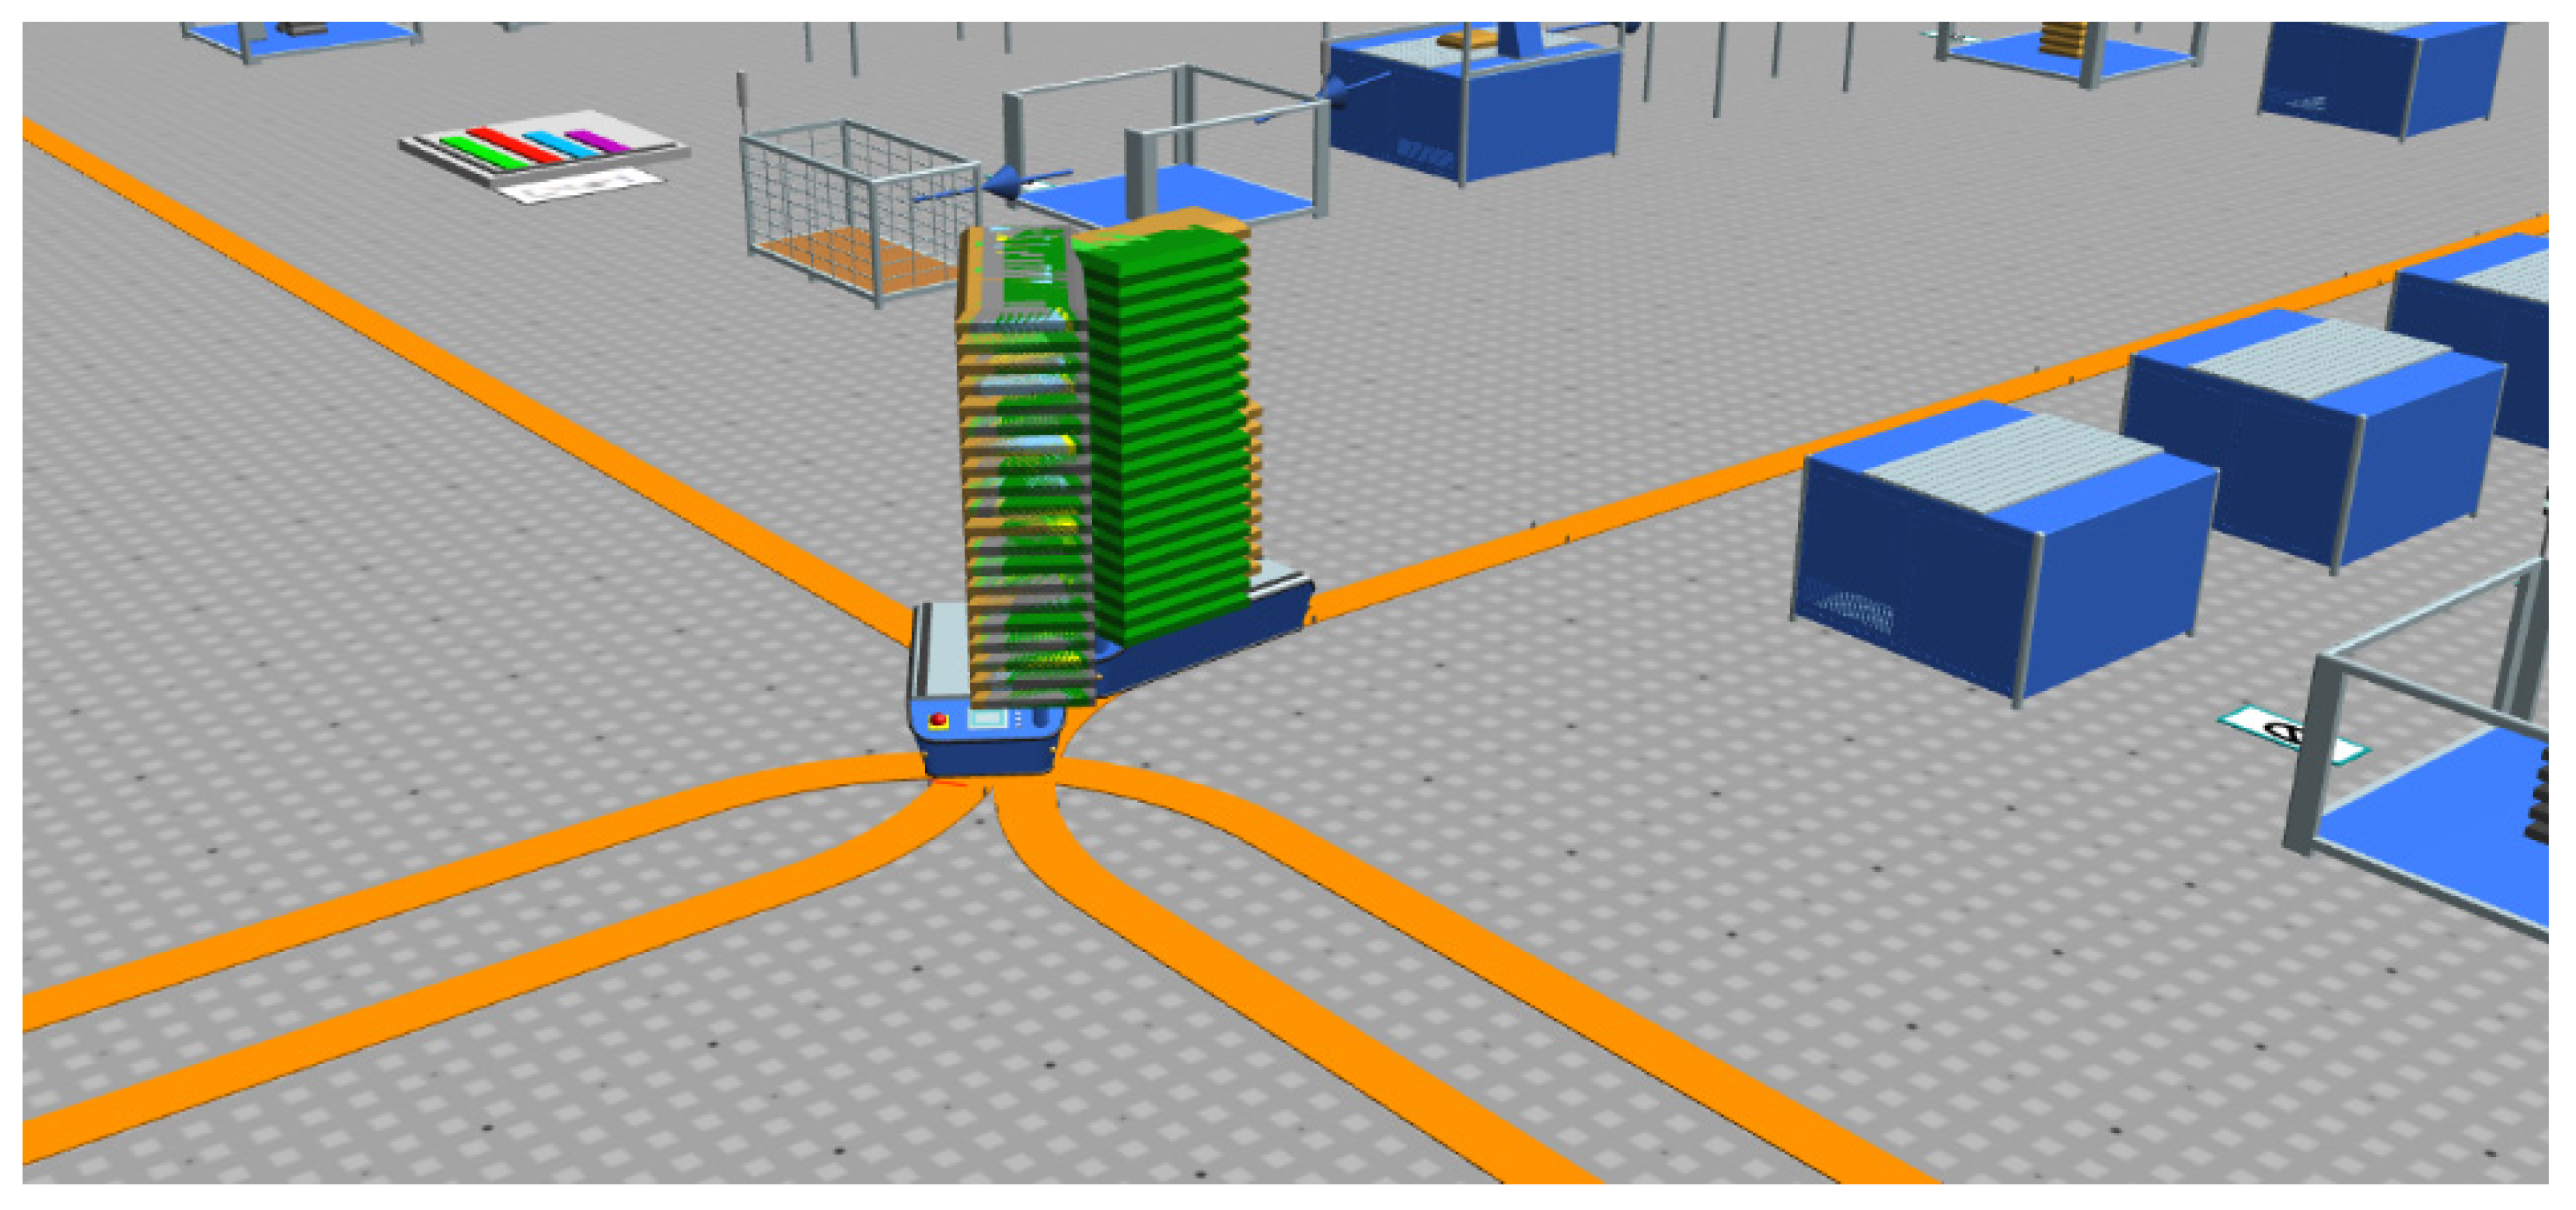
A simulation of the original supply process was developed based on data collected during the production process analysis. Even within the simulation, collisions between tugger trains occurred, as illustrated in Figure 4.
Within the digital production model, various proposals were implemented and tested with the aim of minimizing the occurrence of potential collisions between the identified tugger trains. This approach focused on eliminating as many bottlenecks as possible in order to enhance the efficiency of both the supply process and the overall production workflow within the manufacturing hall.
Although simplified tugger train models are used in the simulation, the operational conditions are accurately defined based on real-world parameters. The model attributes include realistic travel speeds and actual capacity, even though the digital representation does not visually display the cages for transporting components. The simulation portrays an ideal environment in which workers do not obstruct the tugger paths; however, a collision still occurs in one of the hall’s predefined bottleneck areas. Therefore, it is necessary to propose corrective measures, including the design of optimized logistical routes for each tugger train, in order to avoid such undesired events.
The entire process—from the initiation of material supply to a potential collision—can be visualized using a flowchart of the current state in the enterprise. Figure 5 presents this flowchart, illustrating the sequence of events. The process begins with initiation and is monitored using selected observation methods. Special attention is paid to worker communication as well as their field of vision at pathway intersections.
The next step involves evaluating the potential for a collision, which is most likely to occur in the previously identified bottleneck zones. If no collision occurs, this represents the ideal scenario. In the event of a collision, a warning and response protocol is triggered. An acoustic signal indicates the collision, prompting immediate stoppage of the vehicles to ensure safety in the surrounding area.
Following this, a decision is made regarding whether a rescue operation is required, after which the process transitions into an investigation phase. Corrective measures are then proposed and implemented to improve both the production and supply processes.
Figure 5 schematically illustrates a simplified supply process using tugger train sets within the production unit. This basic methodology depicts the material flow and highlights the occurrence and resolution of collisions between two tugger trains within the supply chain. The primary causes of such collisions often include insufficient communication, deviations from planned routes, or unplanned delays at specific stops. To ensure uninterrupted production flow, immediate measures must be implemented to resolve collisions and enable continuous supply. Data on collision frequency and localization of critical zones are collected using two approaches: manual process mapping and digital localization via RTLS technology. However, merely identifying bottlenecks does not guarantee problem elimination; therefore, either prompt process interventions at collision points or route adjustments of tugger trains are necessary to prevent recurring collisions.

3. Results and Discussion

This chapter presents the case study, data acquisition, and simulation results aimed at optimizing material supply within the production process. It provides a comparative analysis between simulation outputs and empirical data, followed by a discussion on the implications for process efficiency improvement and bottleneck elimination.

3.1. Case Study Description

To implement changes to the current state, it was necessary to gather all relevant input data from the individual CSD lines, including the capacities of the Kanban storage bins, the capacities of the tugger trains, as well as the time required for the trains to be ready to deliver material to the Kanban containers. It was also essential to identify unloading times and locations that represent a high risk of negatively impacting the overall process.
For the development of simulation models, the software module Tecnomatix Plant Simulation was utilized. This tool enables the gradual design of the complete simulation environment, including the positioning of individual machines according to the real-world layout. The model can then be adjusted and optimized to ensure that the final configuration eliminates tugger train collisions within the production hall and improves overall operational efficiency.
The production process in this case study consists of four lines and focuses on manufacturing auxiliary dampers with electronic control. These parts are produced in multiple variants for different models of passenger and commercial vehicles. The production lines include Kanban storage bins, pressing machines, compression machines, milling machines, calibration machines, and inspection machines.
Each production line contains four high-capacity storage bins utilizing the Kanban method, which is one of the most widely used supply methods in the engineering industry. The applied Kanban method is supplied by two tugger train sets responsible for regularly delivering the necessary materials to individual Kanban storage bins. Each tugger train pulls 2–3 cages containing all required materials. The regularity of the delivery cycle is crucial, and the company aims to increase efficiency and design an optimized logistics route for individual high-capacity storage bins to ensure the continuity of the production process and eliminate downtime.
The primary goal of the simulation is to resolve the supply chain issue by ensuring uninterrupted material delivery to each production line without collisions. The proposed approach is illustrated in the flowchart in Figure 6.
Following this activity, a simplified schematic representation is provided in Figure 6, which focuses on the monitoring of the production and supply processes and the interventions to resolve collisions. It is essential to recognize that the production process is continuous; therefore, achieving at least a portion of the planned performance always requires making process decisions to mitigate the issue in some way. In this context, the human factor and the decision-making capacity of the workers at the given moment and location often play a critical role. The objective of this case study is to completely eliminate the human factor and fully eradicate the occurrence of the problem. To this end, monitoring is conducted at multiple levels of precision and relevance of the collected data. These data are then transferred into the simulation, which compares potential solutions to the problem. Consequently, the simulation provides recommendations that, once implemented, should relieve employees from the necessity of making interventions during supply collisions. Both schematics—Figure 5 and Figure 6—represent the culmination of the methodology outlined and described in Figure 2, building upon it.
Based on the collected data, it was necessary to gradually model the production unit, which—besides the pathways used by the tugger trains that represent the main focus of this case study—also includes the individual production and assembly workstations. Furthermore, the simulation must account for the staff operating each workstation.
The company operates a continuous two-shift system, which means production runs 24 h a day, 7 days a week. During each 12 h shift, the following personnel are present:
  • Tugger train operators—2 employees;
  • Production operators—20 employees;
  • Line supervisors—4 employees;
  • Maintenance service—2 employees;
  • Security personnel—1 employee;
  • Production and technical staff—3 employees;
  • Data analysts—2 employees;
  • Process engineers—3 employees;
  • Shift supervisor—1 employee.
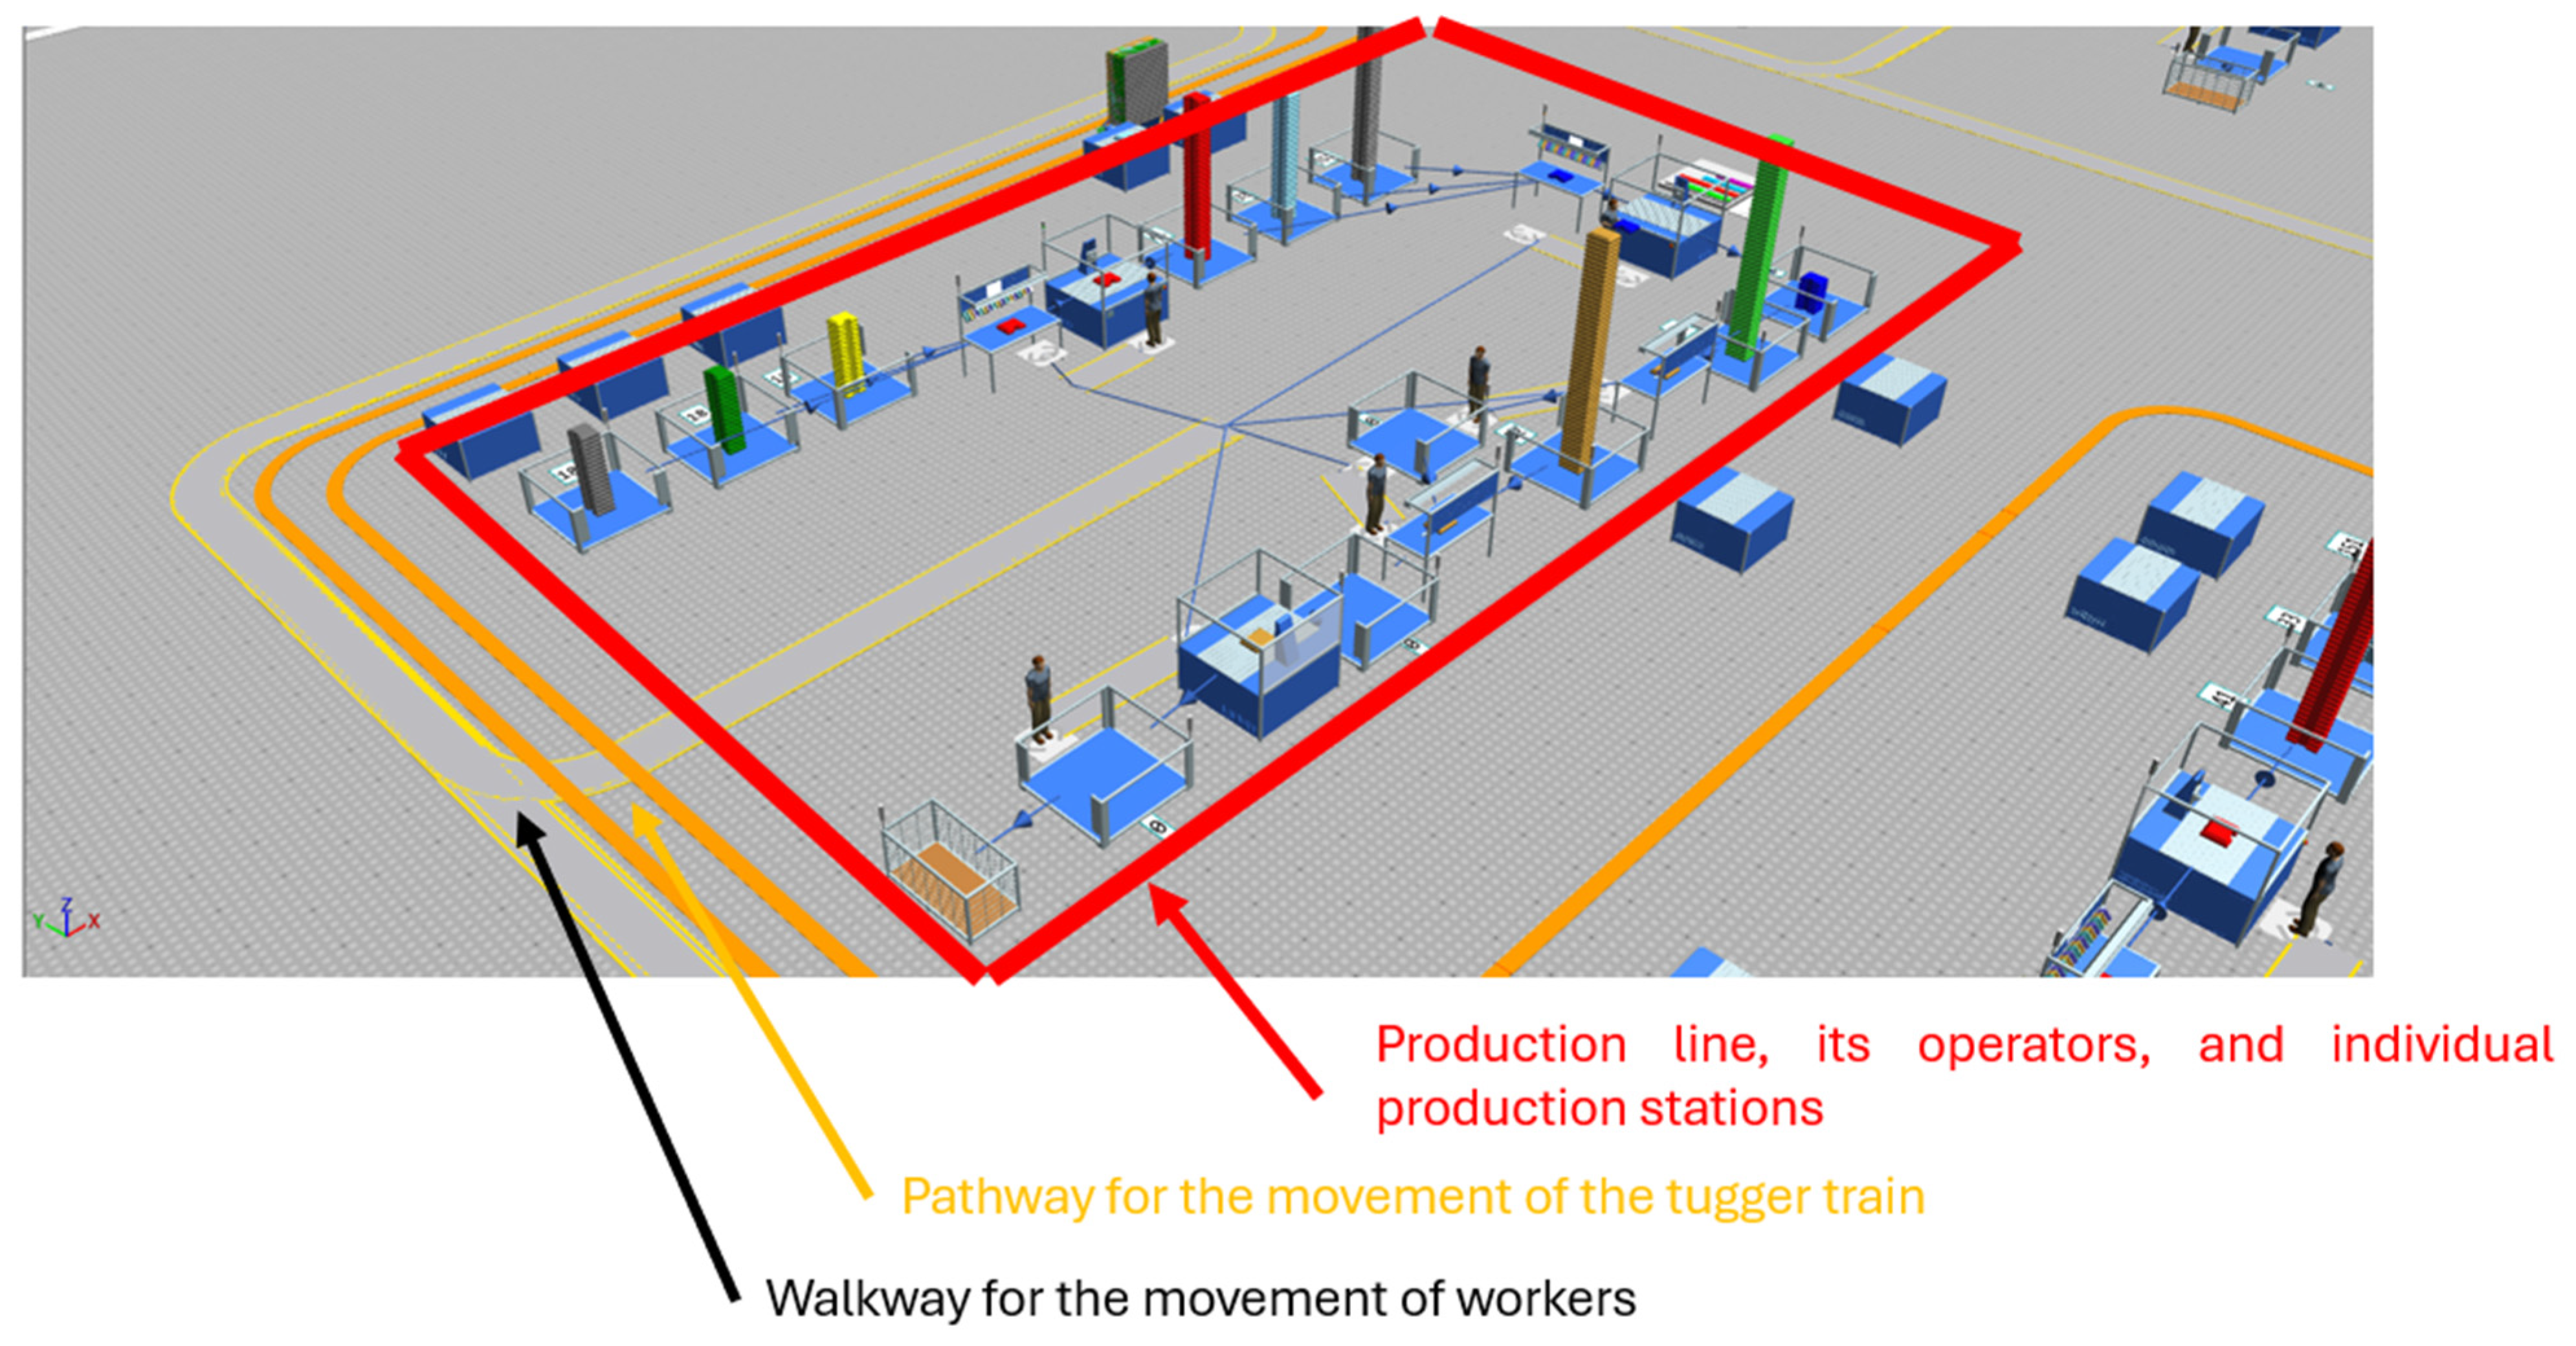
In total, 38 employees are involved in ensuring the smooth operation of production. For the purpose of our simulation, the focus is placed on the tugger train operators and the production operators. Figure 7 illustrates a simulation of the production line with workers, using Siemens Tecnomatix Plant Simulation software version 11.0.0.
Figure 7 depicts the various components of the simulation and the described production unit using color coding. It represents one of the four production lines included in the case study. The red zone indicates the individual workstations of the production line responsible for manufacturing the products. The orange color highlights the routes used by the material supply tugger trains. The yellow–gray areas represent sections of walkways utilized by employees when arriving at and leaving their workplaces.
As previously mentioned, the production unit in question includes four production lines which are very similar—or in some cases identical—in their operation, depending on the type of product that constitutes their final output. Within the simulation module, the entire production unit was gradually modeled, including both the production lines and the newly proposed routes for the movement of the material supply tugger trains.
The pathways for the tugger trains were designed in such a way that, in the event both tugger trains are operating in the production hall at the same time, the likelihood of their paths overlapping—particularly in areas previously identified as collision zones—would be minimized as much as possible.
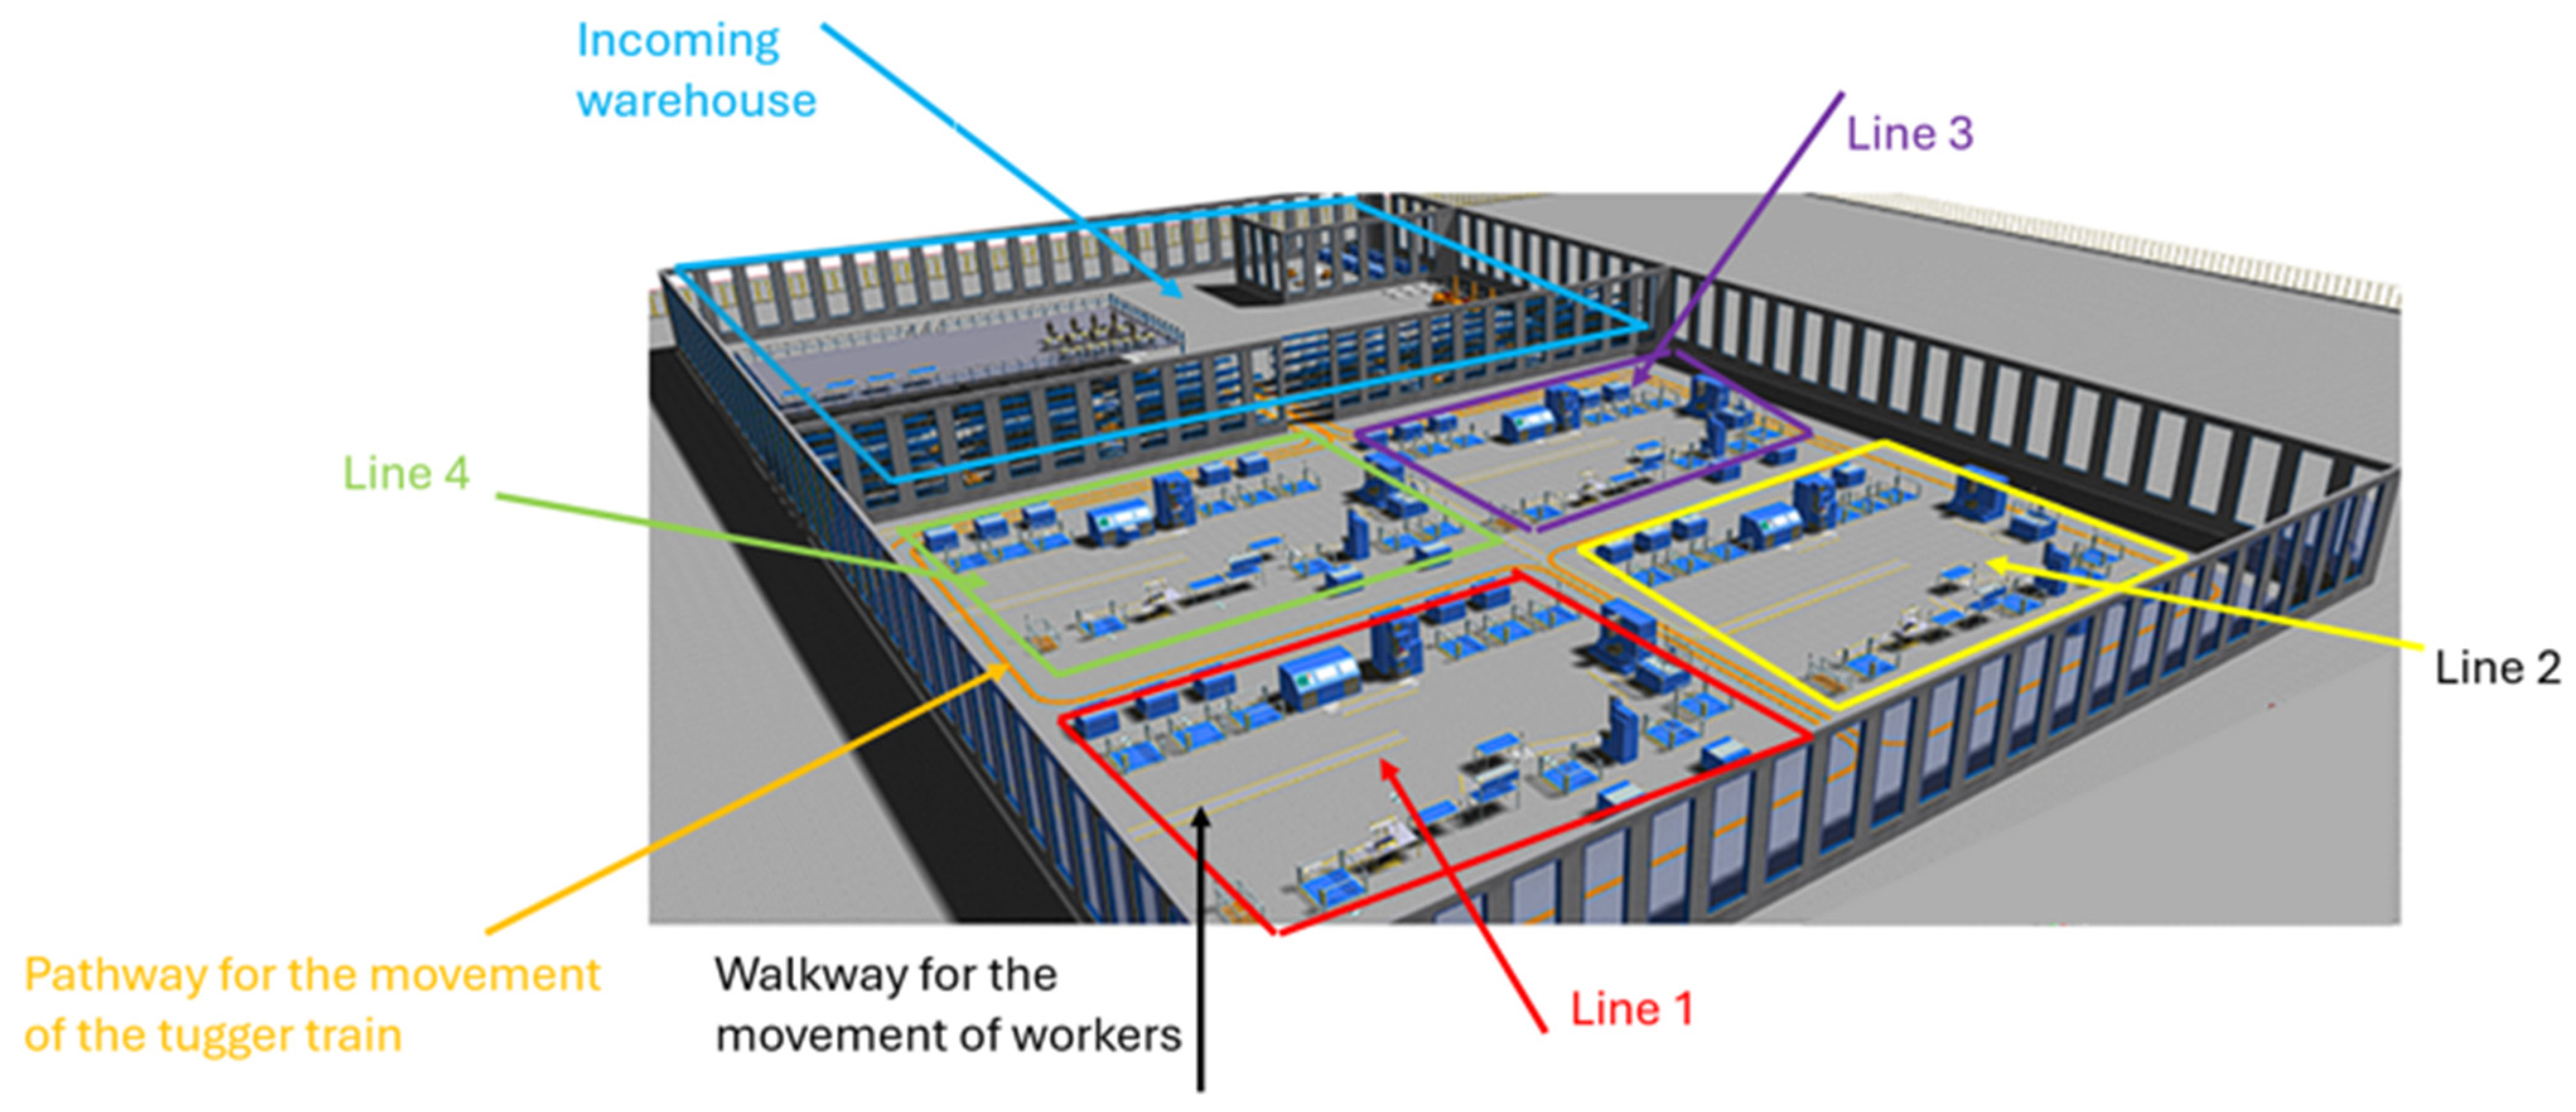
The proposed routing of the material handling tugger trains can be seen in Figure 8, shown in 3D simulation models.
Figure 8 presents a 3D simulation of the entire production process within the Tecnomatix Plant Simulation software environment. This figure highlights the key components of the production hall: the four production lines, the input warehouse from which the supply tugger trains originate, the proposed routes for the tugger trains, as well as the pathways designated for employee movement.

3.2. Data Collection and Input Parameters

With the proposed method of tugger train operation and its strict adherence, it is not possible to bypass any production line multiple times. It is essential to eliminate errors during the unloading of delivered materials, as well as the loading of empty containers after the consumed materials. When unloading and loading the delivered materials it is crucial that the barcode readers signal to the operator the exact number of containers to be unloaded at a given location to avoid the risk of a container being unloaded in the wrong place, which would result in the need to repeat the movement around the line. A similar process is necessary for the collection of empty containers after the consumed material.
A future vision for the optimal operation of such a system is the implementation of localization systems that would be integrated and networked with smart barcode readers. Operators would use these readers during loading and unloading processes. In this manner, the localization system would monitor the movement not only of operators and tugger trains but also of the containers holding the material. By tracking their precise locations, the barcode reader would automatically signal and validate the correct volume and location of the goods for the operator. By preventing errors during the loading and unloading processes, time losses on the production lines caused by supply errors would be significantly reduced.
The data acquired via the RTLS were processed and formatted into tables compatible with the Tecnomatix Plant Simulation software module. These tables were subsequently integrated into the simulation environment through programming methods implemented in the Simtalk language. Based on the programming commands within the simulation methods, the data were further edited and refined to ensure an accurate representation of the movements tracked by the RTLS devices within the digital simulation model. This authentic digital portrayal of real-world material and personnel flows formed the basis for conducting experiments aimed at resolving the identified production issues.
Another proposal for maximizing the elimination of collisions between supply units in the production process is to ensure different initial material quantities for each production line, depending on which tugger train is assigned to supply them. This means the sizes of the Kanban bins would vary based on the route of the supplying tugger train. This approach would result in the tugger trains arriving at the production site at different times, further reducing the likelihood of collisions between them.
Both of these alternatives support the necessity of permanently implementing a localization system. This system would, in addition to continuous localization, enable the monitoring of material flows, workers, and logistical resources throughout the process. With ongoing data collection it would be possible to conduct retrospective validations of certain processes when necessary, and the collected data could be used for implementing innovations or for building new production units, whether of a similar or different nature.
Our expectation is summarized in the following table, see Table 2.

3.3. Results and Comparison

We compare two methods of testing our suggested model, which are the simulation and classical approach, by collecting data. For normality testing we use the Shapiro–Wilk test, which says if p > 0.05 then our collected data confirms the normal distribution.
We start with a simulation where 950 scenarios occurred. When testing loading time, we obtain by the Shapiro–Wilk test that p = 0.3571 while the average is 102.44 min with a standard deviation of 6.73. For tugger train time, the Shapiro–Wilk test gives p = 0.4436 while the average is 17.54 min with a standard deviation of 4.12. The Shapiro–Wilk test takes a p-value of 0.4179 for the time of replenishment of Kanban, whereas the average is 1.74 min with a standard deviation of 0.581. It is worth mentioning that no collision occurs.
By classical data collecting we obtain 825 observed items. For the loading time, the p value of the Shapiro–Wilk test is equal to 0.2147 while the average is 118.54 min with a standard deviation of 11.38. For tugger train time, the Shapiro–Wilk test provides p = 0.1723 while the average is 42.17 min with a standard deviation of 4.72. Finally, the p-value for Kanban replenishment time is 0.2314 given by the Shapiro–Wilk test while the average is 1.31 with a standard deviation of 0.91.
Table 3 compares the planned ideal state, the state proposed and validated through simulation, and the actual state observed during data collection.
From a time perspective, every minute holds significant value for the company, with each minute of downtime associated with costs amounting to EUR 48. This estimate includes machine inactivity, labor idling, and other associated incidents. Based on our measurements, findings, and average data derived from Table 1, it is evident that collisions of tugger train sets result in an average downtime of 25 min. This, over the course of a month with 9 collisions, results in an average cost of EUR 10,800 per month.
As shown in Table 3, the implementation of the proposed solution increases the number of products produced at the output by 125 units. The average price of products produced at this particular production unit, as established by the company, is EUR 67.55. This is an average value, as multiple types of finished products are produced on the individual lines. Through basic multiplication, the financial gain in output value of the production unit can be estimated at EUR 8443.75.
By eliminating downtime in the identified bottlenecks, with an average value of EUR 10,800, and with an average increase in the financial evaluation of production by EUR 8443.75, the benefits of this proposal can be quantified at nearly EUR 20,000 per month.

3.4. Discussion and Implications

With the implementation of a continuous improvement system based on further analyses, it is possible to shift the output parameters to the planned value, or even higher. As evident from the table, when addressing the specific problem some planned values have significantly improved compared to the original plan. The planned Kanban replenishment time has improved by an average of 1 min, and the planned time for the movement of tugger trains within the production hall has been reduced by an average of 10 min based on the proposed solution.
The primary objective of this study is the development and validation of an integrated approach combining data collection via RTLS with simulation-driven optimization. This approach captures the current state of the supply system while providing a predictive model for process planning and improvement.
The main contributions of this research include the design of a structured and repeatable methodology applicable across diverse industrial environments facing logistics and material flow challenges. Additionally, this work demonstrates that real-time data integration enhances simulation-based decision-making, enabling insights that cannot be obtained solely through observation or static simulation models.
The proposed methodology offers a framework for the digital transformation of logistics processes and holds significant potential for enterprises aiming to adopt Industry 4.0 and 5.0 principles.

4. Conclusions

Based on the analysis results using simulation, which were carried out and created based on data collected through observation and detection methods, possible improvement proposals for the efficiency and streamlining of the process have been developed and verified. The proposed improvements demonstrate clear enhancements in supply and logistics performance metrics, which are also reflected in the increase in final output. Based on the described methodologies, or their slight modification depending on the type of process in which we would like to apply them, it can be stated that they are universally applicable regardless of the type of process or industry sector. The results of such analyses can be compared in both homogeneous and heterogeneous processes.
Based on the statistical comparison of the results of the implemented proposals, the combination of multiple methods during data collection and their subsequent use demonstrates significant research potential, which should be further deepened. The proper combination of technologies in synergy with suitable industrial engineering methods needs to be utilized. Subsequently, it is crucial to correctly integrate the collected data in order to achieve the desired goals.
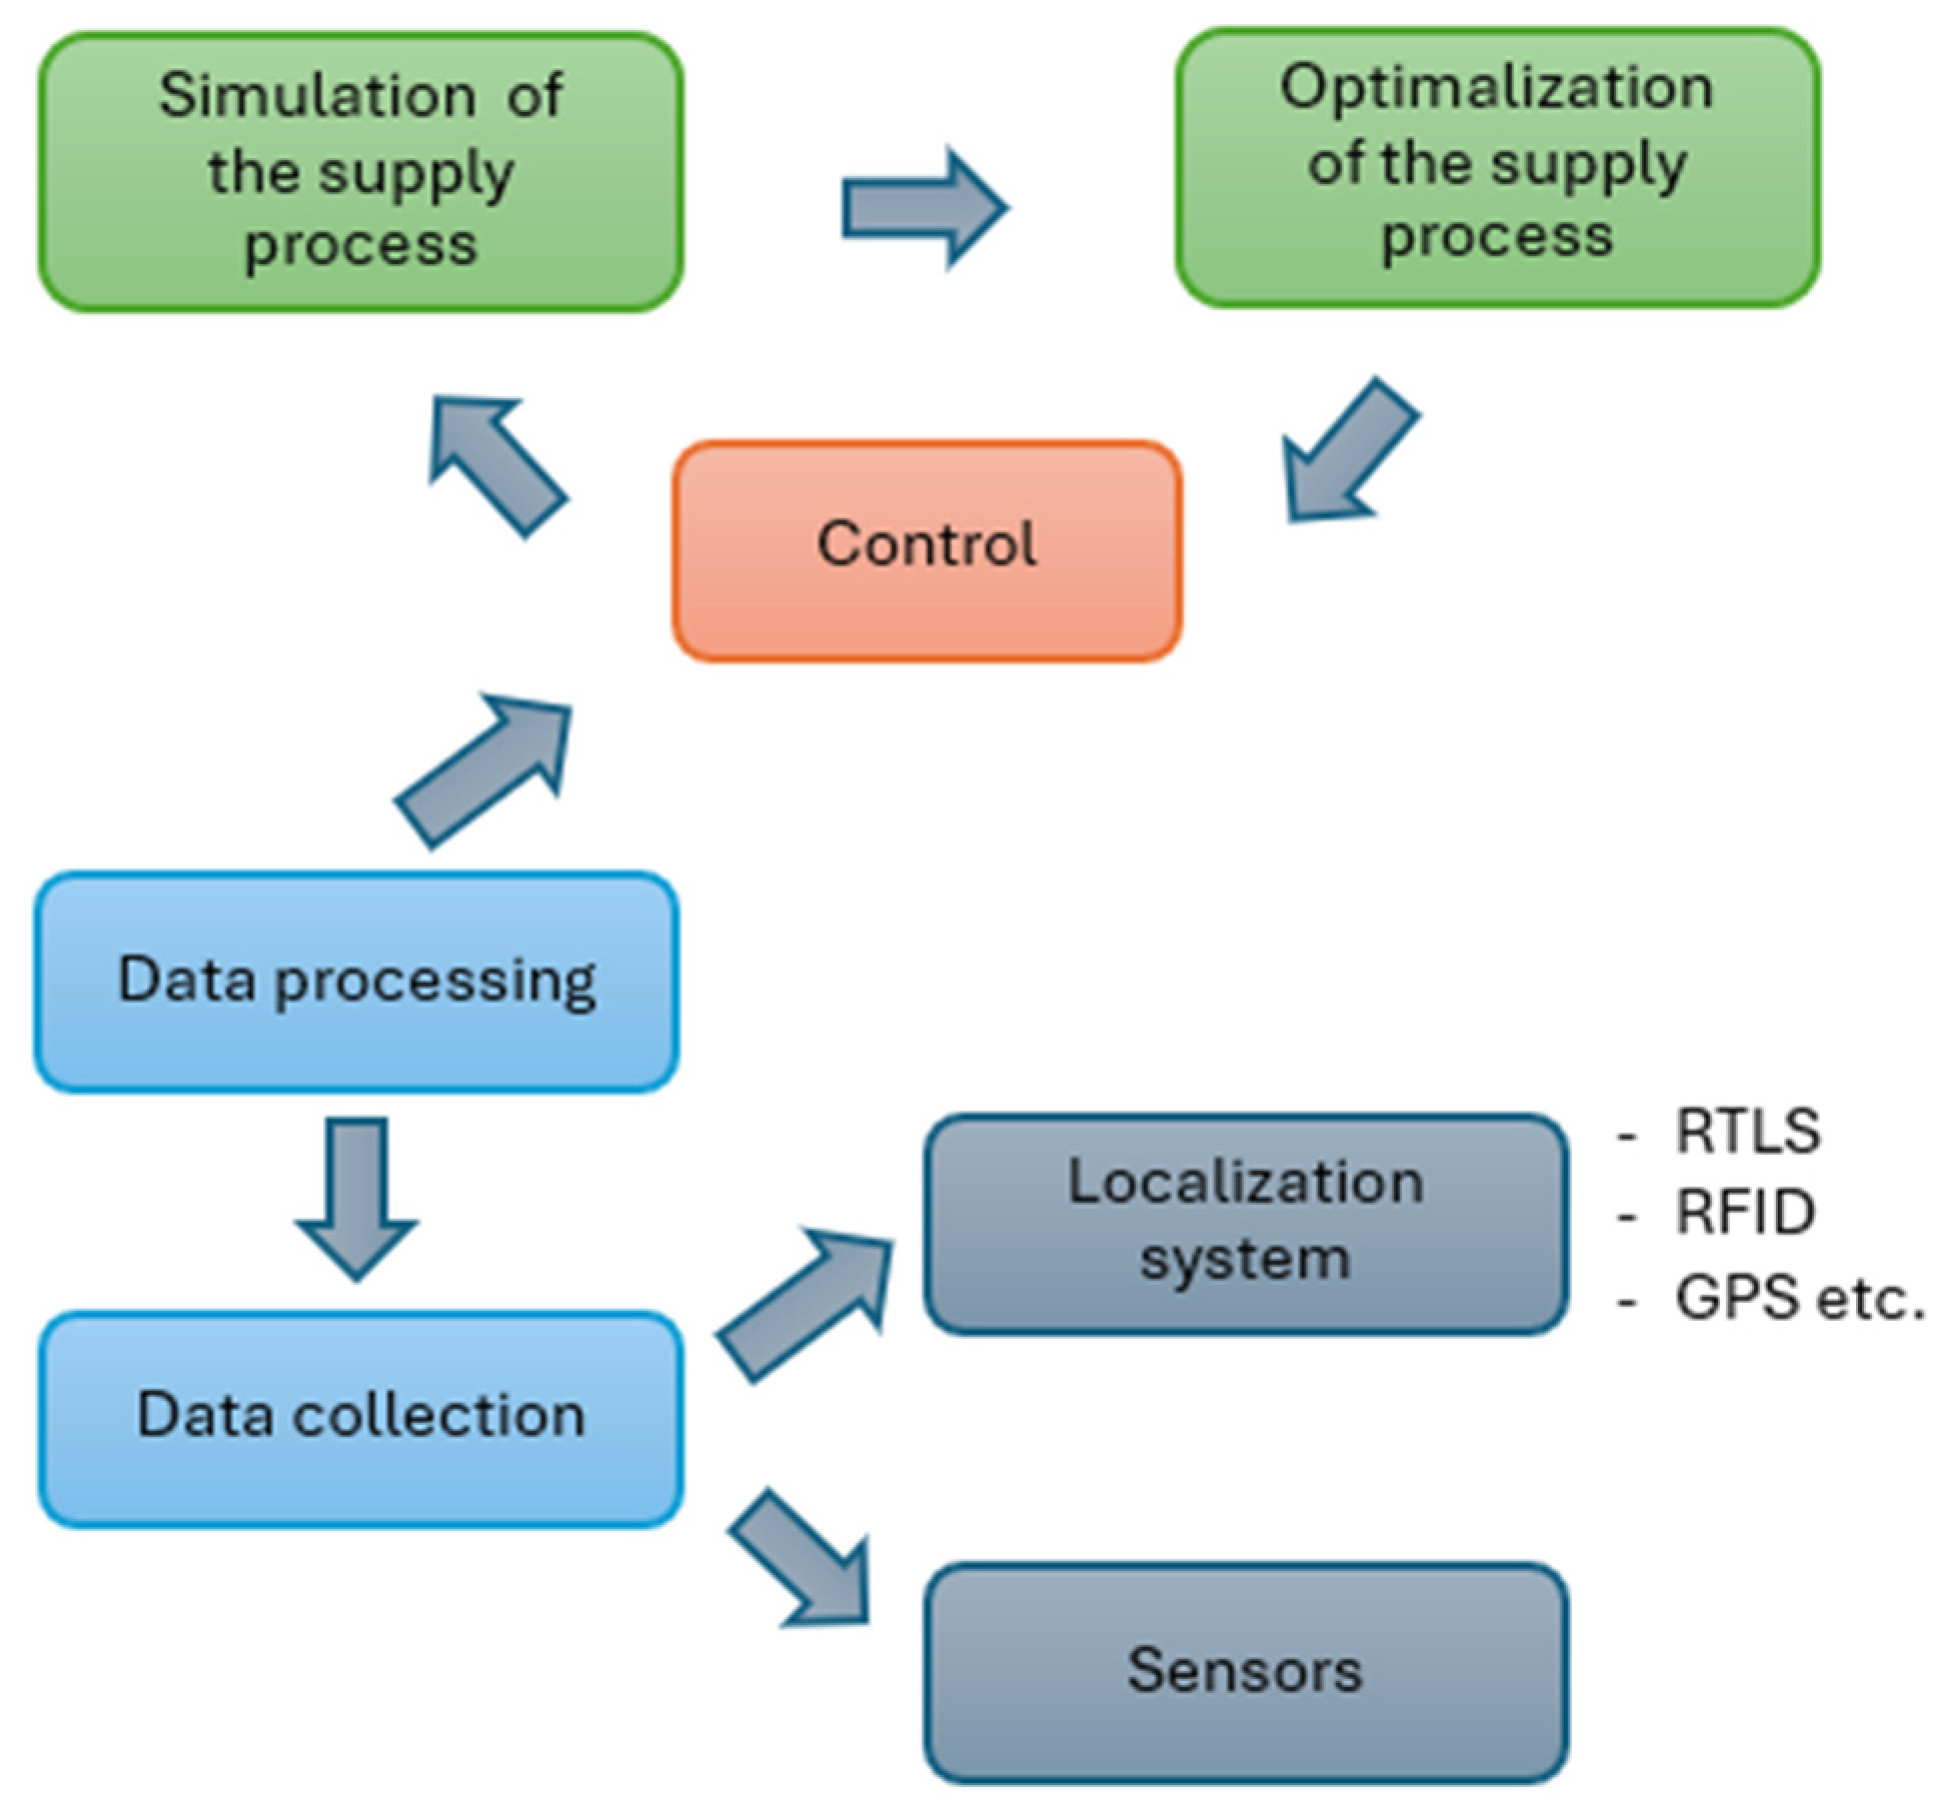
In relation to the focus of this paper and the results of the case study presented, the author collective sees several visions that could be supported through deepening technological advancements and research in this field. These visions are schematically illustrated in Figure 9. These future directions are illustrated schematically in Figure 9, using an example of the potential future functioning of the process presented in this paper. The integration and networking of certain technologies and research in this area could have the following impact, demonstrated through the example of the operational facility:
The localization system would primarily track the location of the material stored on a specific supply unit. When the supply unit halts near the location where the material should be properly unloaded, the scanner used by the operator during material loading would dynamically process data about the material already in the correct location and that which is still in the tugger. If the operator fails to unload a container and tries to proceed to the next workstation, the scanner would alert the operator about the mistake. The system could be further improved; in the event of an error during loading or unloading, the tugger train, which would also be systemically recognized as a mobile entity within the process, could potentially be halted automatically until the operator completes the task correctly. The movement of the train would be unblocked only after each material container is properly localized.
Through the localization of materials, tugger trains, and possibly even operators, a multi-stage system control would ensure the accuracy of the supply process. This system would need to be wirelessly networked and operate smoothly in real time. Such a system would require wireless integration and seamless real-time operation as it would need to receive and send signals regarding the correctness of the location, notify the operator about the task’s completion status, and inform the tugger train when it can proceed to the next station.
Such a system would implement not only the principles of Industry 4.0 but also, considering the preservation of operator positions, it would align with the principles of Industry 5.0, which integrates the human factor into the manufacturing process while minimizing both physical and cognitive workload wherever feasible. In case the elimination of the human factor is required, AGV (Automated Guided Vehicle) technology could be integrated into the process, utilizing machine learning techniques to autonomously perform certain operations. However, the goal of improving and implementing technological advancements should not be to eliminate human resources from manufacturing processes at all costs.
The implementation of digital-twin technology into this data-processing process would allow real-time verification of improvement possibilities for different states that may arise in the process, based on simulation procedures. Using a digital framework and the results of these simulations, continuous measures could be taken to improve the efficiency of the manufacturing process, maintaining it at an optimal level. The sensor technology within the context of the digital-twin would be complemented by localization devices, which would smoothly send collected data in real time for editing into a format suitable for simulation software. This editing could be performed with the help of artificial intelligence. The implementation of multi-stage analyses would accelerate continuous process improvement, as well as planning and modeling new processes based on data from existing operations.

Author Contributions

Conceptualization, M.K., J.K., M.P., P.T. and A.H.; methodology, M.K., J.K., M.P., P.T. and A.H.; software, M.K.; validation, M.K., J.K., M.P., P.T. and A.H.; formal analysis, J.K. and M.K.; investigation, M.K., J.K., M.P., P.T. and A.H.; resources, M.P. and J.K.; data curation, M.K., J.K., M.P., P.T. and A.H.; writing—original draft preparation, M.K., J.K., M.P., P.T. and A.H.; writing—review and editing, M.K., J.K., and A.H.; project administration, M.K. All authors have read and agreed to the published version of the manuscript.

Funding

This research received no external funding.

Data Availability Statement

No applicable.

Acknowledgments

This article was created by the implementation of the grant project APVV-17-0258: Digital engineering elements application in innovation and optimization of production flows, APVV-19-0418: Intelligent solutions to enhance business innovation capability in the process of transforming them into smart businesses, KEGA 020TUKE-4/2023: Systematic development of the competence profile of students of industrial and digital engineering in the process of higher education, VEGA 1/0508/22: Innovative and digital technologies in manufacturing and logistics processes and system, and VEGA 1/0383/25: Optimizing the activities of manufacturing enterprises and their digitization using advanced virtual means and tools.

Conflicts of Interest

The authors declare no conflicts of interest.

References

  1. Ojstersek, R.; Javernik, A.; Buchmeister, B. The impact of the collaborative workplace on the production system capacity: Simulation modelling vs. real-world application approach. Adv. Prod. Eng. Manag. 2021, 16, 431–442. [Google Scholar] [CrossRef]
  2. Glova, J.; Sabol, T.; Vajda, V. Business Models for the Internet of Things Environment. Emerg. Mark. Queries Financ. Bus. 2013, 15, 1122–1129. [Google Scholar] [CrossRef]
  3. Krajcovic, M.; Gabajová, G.; Matys, M.; Grznár, P.; Dulina, L.; Kohár, R. 3D Interactive Learning Environment as a Tool for Knowledge Transfer and Retention. Sustainability 2021, 13, 7916. [Google Scholar] [CrossRef]
  4. Marschall, M.; Gregor, M.; Durica, L.; Vavrík, V.; Bielik, T.; Grznár, P.; Mozol, Š. Defining the Number of Mobile Robotic Systems Needed for Reconfiguration of Modular Manufacturing Systems via Simulation. Machines 2022, 10, 316. [Google Scholar] [CrossRef]
  5. Gola, A.; Plinta, D.; Grznar, P. Modelling and simulation of reconfigurable manufacturing system for machining of casing-class parts. In Proceedings of the 20th International Scientific Conference Engineering for Rural Development, Jelgava, Latvia, 26–28 May 2021; pp. 1563–1568. [Google Scholar] [CrossRef]
  6. Wicher, P.; Stas, D.; Karkula, M.; Lenort, R.; Besta, P. A Computer Simulation-Based Analysis of Supply Chains Resilience in Industrial Environment. Metalurgija 2015, 54, 703–706, ISSN 0543-5846, eISSN 1334-2576. [Google Scholar]
  7. Tsai, J.F.; Wang, P.C.; Tsai, W.L. Competence Set Expansion for Production Process Planning. NTU Manag. Rev. 2013, 23, 263–296. [Google Scholar] [CrossRef]
  8. Holtewert, P.; Bauernhansl, T. Interchangeable Product Designs for the Increase of Capacity Flexibility in Production Systems. 26th Cirp Des. Conf. 2016, 50, 252–257. [Google Scholar] [CrossRef]
  9. Sarjono, H.; Kusuma, V.; Hamali, S.; Mulyono. Planning Production Capacity Optimisation with Rough Cut Capacity Planning. Pertanika J. Soc. Sci. Humanit. 2016, 24, 33–45, ISSN 0128-7702, eISSN 2231-8534. [Google Scholar]
  10. Huang, D.; Lin, Z.K.; Wei, W. Optimal production planning with capacity reservation and convex capacity costs. Adv. Prod. Eng. Manag. 2018, 13, 31–43. [Google Scholar] [CrossRef]
  11. Schwarz, J.A.; Tan, B. Optimal sales and production rollover strategies under capacity constraints. Eur. J. Oper. Res. 2021, 294, 507–524. [Google Scholar] [CrossRef]
  12. Creutznacher, T.; Berger, U.; Lepratti, R.; Lamparter, S. The Transformable Factory: Adapting Automotive Production Capacities, Research and Innovation in Manufacturing: Key Enabling Technologies for the Factories of the Future. In Proceedings of the 48th Cirp Conference on Manufacturing Systems, Ischia, Italy, 24–26 June 2015; Volume 41, pp. 171–176. [Google Scholar] [CrossRef]
  13. Saderova, J.; Poplawski, L.M.B., Jr.; Michalkova, S.; Cvoliga, M. Layout Design Options for Warehouse Management. Pol. J. Manag. Stud. 2020, 22, 443–455. [Google Scholar] [CrossRef]
  14. Paska, M.; Malkus, T.; Rosova, A.; Trebuna, P.; Kacmary, P.; Behun, M. International Commercial Terms and Their Necessity for the Logistics. In Proceedings of the 8th Carpathian Logistics Congress 2018, Prague, Czech Republic, 3–5 December 2018; pp. 688–696, ISBN 978-80-87294-88-8. [Google Scholar]
  15. Balzer, R.; Užík, M.; Glova, J. Managing Growth Opportunities in The Digital Era—An Empiric Perspective of Value Creation. Pol. J. Manag. Stud. 2020, 21, 87–100. [Google Scholar] [CrossRef]
  16. Saniuk, S.; Grabowska, S.; Straka, M. Identification of Social and Economic Expectations: Contextual Reasons for the Transformation Process of Industry 4.0 into the Industry 5.0 Concept. Sustainability 2022, 14, 1391. [Google Scholar] [CrossRef]
  17. Matisková, D.; Balog, M.; Husár, J. Criteria for the Optimization of Production Processes in Machining of Metallic Materials. Manag. Syst. Prod. Eng. 2018, 26, 227–230. [Google Scholar] [CrossRef]
  18. Sujova, A.; Marcinekova, K.; Hittmar, S. Sustainable Optimization of Manufacturing Process Effectiveness in Furniture Production. Sustainability 2017, 9, 923. [Google Scholar] [CrossRef]
  19. Laciak, M.; Raskayova, D.; Flegner, P.; Kacur, J.; Durdan, M. Automated system for optimizing input parameters of the UCG process. In Proceedings of the 20th International Carpathian Control Conference, Krakow-Wieliczka, Poland, 26–29 May 2019; pp. 311–315. [Google Scholar] [CrossRef]
  20. Chu, J.F.; Xu, F.; Zhu, Q.Y.; Fukuyama, H. Production scale expansion and congestion in two-stage network systems. Comput. Ind. Eng. 2024, 193, 110317. [Google Scholar] [CrossRef]
  21. Lin, M.H.; Tsai, J.F.; Wang, P.C.; Ho, Y.T. A coordinated production planning model with capacity expansion for supply chain networks. Eur. J. Ind. Eng. 2019, 13, 435–460. [Google Scholar] [CrossRef]
  22. Min, Z.; Nie, G.H.; Ming, Z.; Lihm, H. Capacity improvement of an LCM production line. In Proceedings of the 3rd International Conference on Innovation & Management, Vols 1 and 2, Wuhan, China, 2–3 December 2006; pp. 1028–1031, ISBN 978-7-5629-2471-5. [Google Scholar]
  23. Radatz, H.; Kühne, K.; Bramsiepe, C.; Schembecker, G. Comparison of capacity expansion strategies for chemical production plants. Chem. Eng. Res. Des. 2019, 143, 56–78. [Google Scholar] [CrossRef]
  24. West, N.; Schwenken, J.; Deuse, J. Data-Driven Approach for Diagnostic Analysis of Dynamic Bottlenecks in Serial Manufacturing Systems. arXiv 2023, arXiv:2306.16120. [Google Scholar] [CrossRef]
  25. Zhang, Y.; Peng, E.; Luo, Z. Bottleneck Detection for Discrete Manufacturing System Based on Object-Oriented Colored Petri Nets and Cloud Simulation. ITM Web Conf. 2022, 45, 01015. [Google Scholar] [CrossRef]
  26. Pekarciková, M.; Trebuna, P.; Kliment, M.; Edl, M.; Rosocha, L. Transformation the Logistics to Digital Logistics: Theoretical Approach. Acta Logist. 2020, 7, 217–223. [Google Scholar] [CrossRef]
  27. Kábele, P.; Edl, M. Increasing the Efficiency of the Production Process Due to Using Methods of Industrial Engineering. In Advances in Design, Simulation and Manufacturing II, Proceedings of the 2nd International Conference on Design, Simulation, Manufacturing II 2019, Lutsk, Ukraine, 11–14 June 2019; Springer: Berlin/Heidelberg, Germany, 2019; pp. 126–137. [Google Scholar] [CrossRef]
  28. Sasiadek, M.; Kielec, R.; Wozniak, W. The Application of the Dependency Structure Matrix in the Planning of Production Processes, Vision 2025: Education Excellence and Management of Innovations Through Sustainable Economic Competitive Advantage. In Proceedings of the 36th IBIMA Conference, Madrid, Spain, 13–14 November 2019; pp. 6148–6155, ISBN 978-0-9998551-3-3. [Google Scholar]
  29. Manlig, F.; Slaichova, E.; Koblasa, F.; Vavruska, J. Innovation of business processes by means of computer-aided simulation. Nov. Trends Prod. Devices Syst. 2014, 474, 67–72. [Google Scholar] [CrossRef]
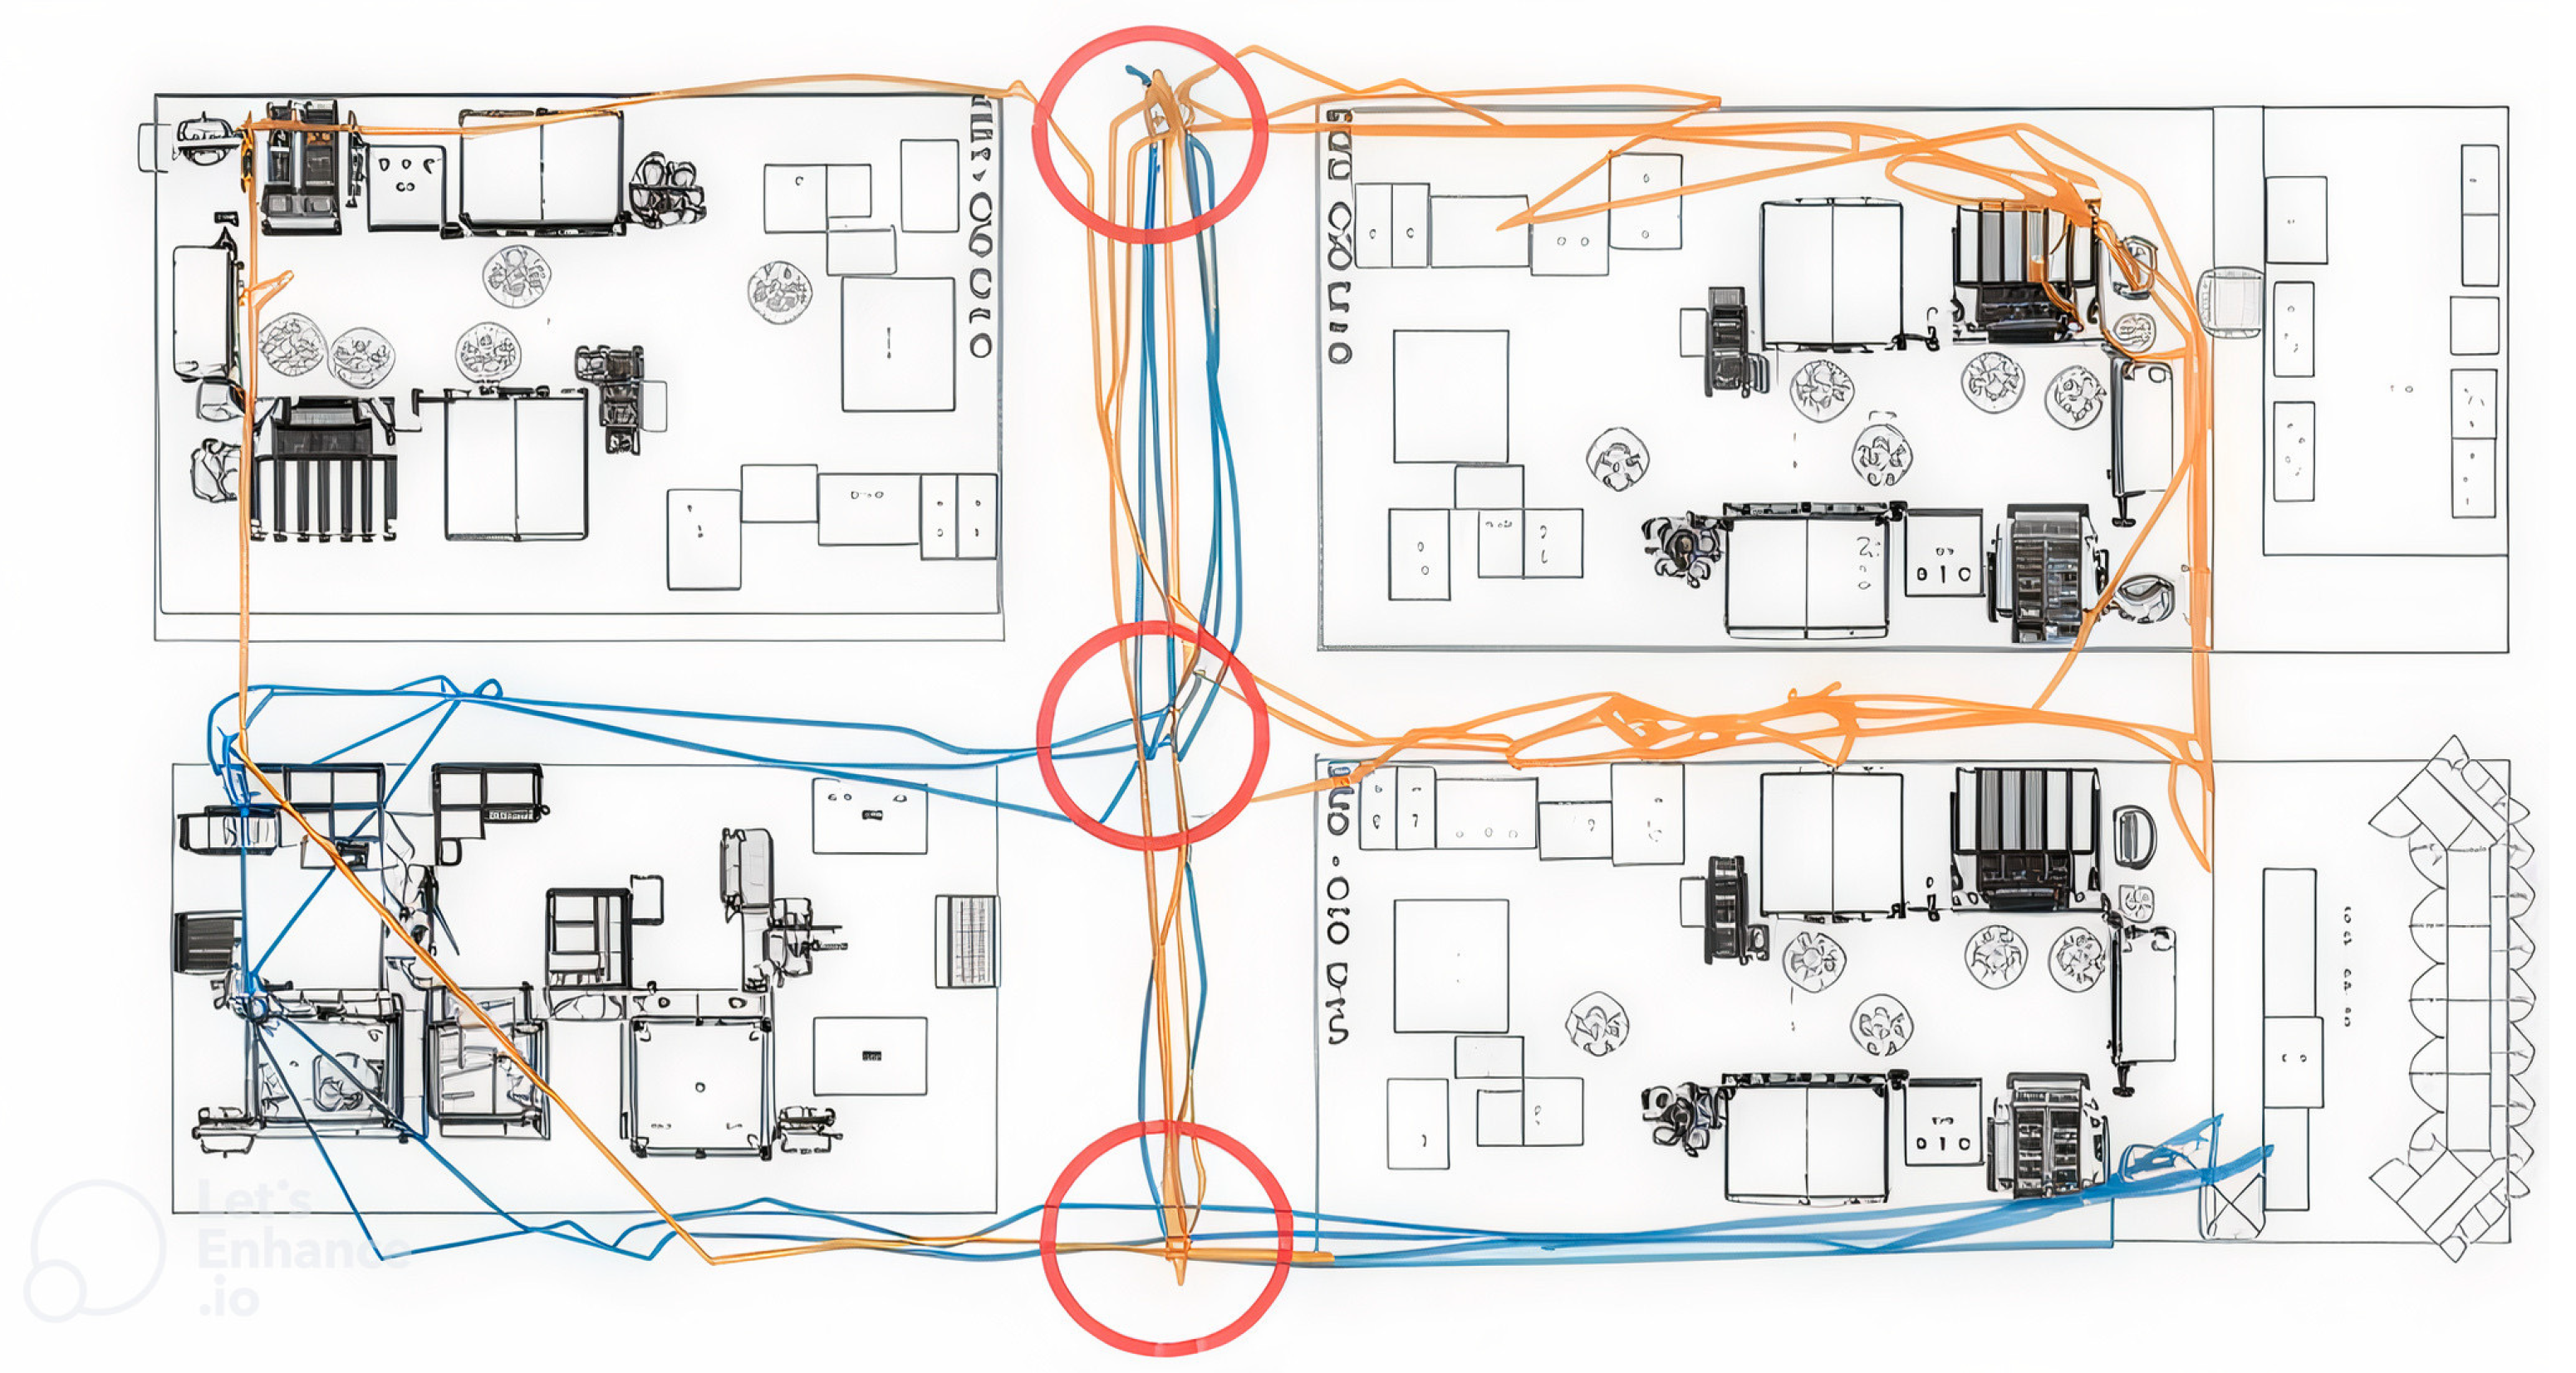
Figure 1. Spaghetti diagram with factory layout and bottleneck highlights.
Applsci 15 09102 g001
Figure 2. Algorithm for supply process simulation using tools for identifying bottlenecks.
Applsci 15 09102 g002
Figure 3. Real operation of the production hall (a) indication of areas where tugger train collisions occur and (b) supply tugger train system.
Applsci 15 09102 g003
Figure 4. Simulation of tugger collision.
Applsci 15 09102 g004
Figure 5. Flowchart of the material supply workflow and monitoring steps.
Applsci 15 09102 g005
Figure 6. Flowchart of the simulation method to optimize material flow and avoid collisions.
Applsci 15 09102 g006
Figure 7. Simulation of production line.
Applsci 15 09102 g007
Figure 8. Model of the production unit with a tugger train sets.
Applsci 15 09102 g008
Figure 9. Cycle of utilizing simulations and data collection for streamlining the supply process.
Applsci 15 09102 g009
Table 1. Summary of observed process irregularities.
Observed IssueFrequency (Per Month)
Collisions of tugger trains9
Unauthorized employee interventions17
Incorrect barcode scanning by operators11
Table 2. Expected values.
Planned Ideal State
Number of collisions per month0
Production capacity (units/production line)1200
Loading time of the tugger trains90 min
Tugger train time in the production hall<30 min
Kanban replenishment time<3 min
Table 3. Comparison of processes.
State Proposed and Verified Through SimulationActual State During Data Collection
Number of collisions per month09
Production capacity (units/production line)950825
Loading time of the tugger trains<105 min<120 min
Tugger train time in the production hall<20 min<44 min
Kanban replenishment time<2 min<1.32 min
Disclaimer/Publisher’s Note: The statements, opinions and data contained in all publications are solely those of the individual author(s) and contributor(s) and not of MDPI and/or the editor(s). MDPI and/or the editor(s) disclaim responsibility for any injury to people or property resulting from any ideas, methods, instructions or products referred to in the content.