Article

Insights into Native Fermentation Process of Apples (Malus domestica) in Low Sodium Conditions

by
Daniela Constandache (Lungeanu)
,
Doina-Georgeta Andronoiu
,
Oana Viorela Nistor
,
Dana Iulia Moraru
,
Ira-Adeline Simionov
,
Elisabeta Botez
and
Gabriel-Dănuț Mocanu
*
Faculty of Food Science and Engineering, Dunărea de Jos University of Galați, 111 Domnească Street, 800201 Galati, Romania
*
Author to whom correspondence should be addressed.
Appl. Sci. 2025, 15(14), 7799; https://doi.org/10.3390/app15147799
Submission received: 10 June 2025 / Revised: 10 July 2025 / Accepted: 10 July 2025 / Published: 11 July 2025

Abstract

Although it is one of the most important methods of fruit and vegetable preservation, pickling provides multiple interesting vistas for study, from the variety of the raw vegetal material and the composition of pickling media to the diversity of the microorganisms involved in the process or the quality of the final product. The purpose of this study is to investigate the effects of sodium chloride substitution with potassium or magnesium chloride on the pickling process of apples. Physical (mass, color, texture), chemical (dry matter, acidity, salinity, reducing sugars) and phytochemical parameters of the apples were analyzed during 35 days of fermentation, with a frequency of 7 days. The results show a decrease in dry matter from 14.94 ± 0.25% for all the samples and a continuous increase of lactic acid concentration to a maximum of 0.248 ± 0.032 g lactic acid/100 g product for the magnesium samples. At the same time, the phytochemical profile is enhanced, while the texture becomes softer (a decrease in firmness from 2.53 ± 0.08 N to 0.72 ± 0.02 N was registered for potassium samples). The main conclusion of the study is that sodium chloride could be successfully replaced by potassium or magnesium chloride in the fermentation process of apples.

1. Introduction

Pickling is one of the oldest methods of food preservation. It could be achieved by direct acidification, introducing the material to be preserved into an acid solution, or by fermentation in brine, leading to the production of lactic acid. Even if it requires a long time, the second method is preferred by consumers due to the benefits provided by lactic bacteria and by the functional compounds developed during the fermentation process.
Traditionally, sodium chloride (NaCl) solution is used to obtain pickles. In concentrations between 3 and 8% in brine, differing by type of the fermented vegetal material, by product or by country, NaCl has an important role in enzyme and microorganism control during fermentation, as well as in sensorial property development [1]. On the other hand, NaCl is accountable for several health issues like hypertension, cardiovascular diseases or kidney damage [2]. One of the strategies of NaCl reduction in processed foods is the use of alternative chloride salts like potassium (KCl) or magnesium (MgCl2), to mention just two of them. However, this replacement has numerous implications in the management of safety risks, as well as in the processing technology, solid scientific investigations being needed to validate its feasibility to be used at industrial level [3].
Several studies regarding the influence of NaCl substitution with KCl and MgCl2 on vegetal material fermentation are available in the literature. Many of them are focused on local materials like olives [4,5,6], cucumbers [1,7] or sauerkraut [8,9]. These studies are focused mainly on the microbiological issues, and their conclusions highlight the high potential of the NaCl substitution to be used in industry.
In Romania, pickles are included in the national culinary heritage [10], the most popular vegetal materials being cucumbers, immature tomatoes or cabbage. In some regions fruits like apples, plums or grapes are added to improve the sensorial characteristics of the pickles.
Apples are among the most produced, exported and consumed fruits in the world. They are well known as health promoters due to their high content of bioactive compounds, like phenols, which could directly influence the natural antioxidant activity [11]; flavonoids, isoflavonoids, and phenolic acids, which could dramatically decrease the risks of obesity, chronic diseases and other types of cellular oxidation [12]. Other important compounds that induce the antioxidant activity of apples and could influence different biological and chemical processes are chlorophylls [13] and carotenoids [14]. Many phytochemicals from raw apples have been widely studied, and many potential health benefits have been attributed to these specific phytochemicals, but only a few to pickled apples.
Considering the above-mentioned importance of the fermented plant materials, the necessity of sodium chloride reduction in food, and the health benefits of apples, the aim of this study is to investigate the apples’ fermentation process in low sodium conditions achieved by totally replacing NaCl with KCl or MgCl2. The main physico–chemical and phytochemical parameters were evaluated during the fermentation process and the impact of salts upon them was assessed, to the aim of proving the feasibility of obtaining low sodium fermented apples.

2. Materials and Methods

2.1. Reagents and Chemicals

Food grade NaCl (minimum 97% purity) and all salt replacers (KCl—minimum 99% purity; MgCl2—100% purity) were purchased from a local market in Galați, Romania.
The chemical reagents used in the present study NaOH 0.1 N, 3,5-dinitrosalicylic acid (DNSA), sodium-potassium tartaric acid, sodium hydroxide solution (0.5 N), D-(+)-glucose standard, carbazole, D-galacturonic acid, concentrated sulfuric acid, trisodium borate decahydrate (Borax), potassium ferrocyanide, zinc sulfate, HCl, NaCl solution, multi-element standard solution IV 23 elements, nitric acid (65% Suprapur, Merck KGaA, Darmstadt, Germany), hydrogen peroxide (30% Emsure, Merck KGaA, Darmstadt, Germany), Folin-Ciocalteu reagent, Na2CO3, gallic acid, NaNO2, AlCl3, NaOH 1 M, catechin, hexane, acetone were obtained from Sigma-Aldrich (Merck KGaA, Darmstadt, Germany); phenolphthalein was acquired from Remed (Prodimpex, Bucharest, Romania). The chemical reagents were of analytical grade.

2.2. Sample Preparation

The fermentation took place in glass jars that were washed and sterilized before use in a hot air oven (150 °C) for 15 min. The apples at the complete ripening stage were washed and introduced in 1500 mL volume jars (4–5 apples in every jar). After that, the brine was added, just enough to cover the apples. Three types of brine were prepared by boiling 3 L of water, 100 g salt (NaCl, KCl or MgCl2), 8 g garlic, 3 g horseradish, 2 g whole black peppercorns, 2 g mustard seeds, 0.7 g bay leaves and 0.5 g dill inflorescences. The jars were closed and left for fermentation at 20 ± 2 °C for 35 days. Five jars of each brine type were prepared. The pickled samples were analyzed with a frequency of 7 days. For a better interpretation of the results, fresh apples were also analyzed in terms of physicochemical, phytochemical, textural and color aspects (time 0).

2.3. Physical and Chemical Analysis

2.3.1. Mass Evaluation

The apples were weighed before being placed in the jars and during the pickling process at every 7-day intervals, using an Adam PGW 2502M (Amex-lab, Bucharest, Romania) scale.

2.3.2. Dry Matter

The dry matter (DM) content was determined using the gravimetric method. Approximately 5 g of fermented apples was placed on a plate, dried at 105 °C and atmospheric pressure in a convection oven until reaching constant weight. The dry matter was assessed according to [15]. The results were expressed in grams per 100 g of sample. All measurements were made in triplicate.

2.3.3. Titratable Acidity

The titratable acidity (TA) of the fermented apple samples was measured by the acid–base titration method. The fermented apples and brine solution were homogenized at a 1:1 (w/w) ratio to create a pickle homogenate. The pickle homogenate was transferred to 250 mL volumetric flasks with distilled water, and the mixture was filtered using Fisher Whatman filter paper grade 540 (Amex-lab, Bucharest, Romania) to obtain the supernatant used for TA analysis. 50 mL of supernatant was titrated with 0.1 N NaOH to a pH of 8.2 ± 0.1, using three drops of phenolphthalein (Remed Prodimpex, Bucharest, Romania) as an indicator until a light pink color (persistent for 30 s) was observed. The results were expressed in grams of lactic acid per 100 g of sample. This measurement was performed in triplicate for each sample.

2.3.4. Salinity

The salinity (%) was measured directly using a salt meter (PAL-BX/SALT + 5, ATAGO, Tokyo, Japan) [16]. Measurements were made in triplicate.

2.3.5. Reducing Sugar Concentration

The quantitative analysis of sugars and uronic acids was performed using the 3,5-dinitrosalicylic acid method (measured absorbance at 540 nm) and the carbazole-borax method (measured absorbance at 530 nm), respectively [17]. Previously, approximately 10–15 g of finely comminuted and homogeneous samples were subjected to extraction for 30 min, then the extracts were clarified using potassium ferrocyanide 10% and zinc sulfate 15%. After being brought to a volume of 100 mL, the samples were centrifuged at 9000 rpm/10 min. For the quantification of total sugars and fermentable uronic acids, the extract was hydrolyzed as follows: 20 mL of clear supernatant was placed into a 50 mL volumetric flask and treated to hydrolysis on a water bath with 3 mL HCl density 1.19 g/mL at a temperature of 68–70 °C for 8 min. After cooling and neutralization with 30% NaCl solution, the volume was completed up to 50 mL. The evaluation of the amount of reducing sugars and reducing uronic acids was performed on the basis of the clarified and cleared samples, without their being subjected to acid hydrolysis. To quantify the reducing and total sugars, 0.25 mL of the clarified sample, 4–5 drops of 10% NaOH and 0.04 M DNS reagent were used. To evaluate uronic acids, 0.1 mL of the clarified samples was used, to which 0.9 mL of distilled water, 3 mL of 0.025 M sodium tetraborate in sulfuric acid and 0.2 mL of 0.125% carbazole reagent were added. After boiling for 10 min and 15 min, respectively, and cooling, the color intensity was measured at the wavelengths shown above.
The reducing sugars and total sugars were expressed in g glucose/100 g sample, and the reducing uronic acids and fermentable uronic acids were expressed in g galacturonic acid/100 g sample.

2.3.6. Concentration of Cations

The cations from the samples (apple peels and brine) were determined by analyzing the potassium (K), sodium (Na), and magnesium (Mg), respectively, through the analytical method of high-resolution continuous source flame atomic absorption spectrometry (HR-CS-FAAS) and by using the ContrAAA 700 instrument (AnalytikJena, Jena, Germany). The continuum source and the high-resolution monochromator provide the spectrum for the analysis of multiple elements. The instrument was calibrated before the working session using the ICP multi-element standard solution IV 23 elements (Merck, Darmstadt, Germany, Certipur®). The cations were extracted from the calcinated peel samples in an acidic solution. The extraction was performed according to the method described by Constandache (Lungeanu) et al. [17]. Approximately 0.5 g of the calcinated peel was weighed and placed into polytetrafluoroethylene containers in order to disaggregate the cations in an acidic aqueous solution by microwave-assisted digestion. Digestion was achieved using an extraction matrix consisting of nitric acid (HNO3 65% Suprapur) and hydrogen peroxide (H2O2 30% Emsure). The treated samples were placed into the TopWave (AnalytikJena, Germany) microwave digestion system, using a program of 200 °C temperature for 45 min. After digestion, the samples were diluted with ultrapure water (Evoqua (Pittsburgh, PA, USA), Siemens (Seoul, Republic of Korea)) (volume = 50 mL) in previously rinsed Falcon tubes. The brine samples were filtered in Falcon tubes, rinsed beforehand, and mineralized with HNO3 65% Suprapur. The results are expressed as mg/g dry weight in the case of the peel samples and mg/L in the case of the brine samples.

2.3.7. Phytochemical Analysis of Fresh and Fermented Apple

Total Phenolic Content (TPC) Determination
The Folin-Ciocalteu method was used to estimate the total phenolic content using gallic acid as standard as presented by Shan et al. [18]. Up to 0.1 mL of the extract (1 mg/mL), 1 mL Folin-Ciocalteu reagent (diluted 1:10) was added, and the mixture was left out for 5 min, and then 1 mL (75 g/L) of sodium carbonate, Na2CO3, was added. The resulting solutions were incubated at room temperature for 90 min. The absorbance of the samples was read at 765 nm.
The total phenolic content was estimated from the gallic acid calibration curve of 0, 25, 50, 75, 100, 125, and 150 µg/mL concentrations, prepared in methanol 95%; the results were expressed as mg gallic acid equivalent per gram of extract (mg GAE/g).
Total Flavonoid Content (TFC)
The TFC was estimated by means of the method of Asale et al. [11]. The extract (1 mL, 1 mg/mL) was diluted with 1.25 mL distilled water, and 75 µL 5% NaNO2 was added to the mixture. After 6 min, 150 µL 10% AlCl3 was added; afterwards, another 5 min, 1 mL 1 M NaOH was added to the mixture. The absorbance was assessed at 510 nm versus water blank. A standard curve of catechin was prepared using 5–1000 µg/mL of catechin, and the results were expressed as milligrams of catechin equivalents per gram of sample (mg CE/g).
Determination of Total Carotenoids and Chlorophyll
In both cases of determining the total carotenoids and chlorophyll, 1 g of finely ground sample was mixed with organic solvents mixture, 10 mL of hexane-acetone 3:1 in a Falcon tube of 50 mL, as Escoto et al. [19] described. Then, it was placed in the ultrasonication water bath (ARGO LAB Digital Ultrasonic Cleaner, ARGO LAB, Carpi, Italy) at 30–40 °C for 30 min to accelerate the reaction, because heat will increase the kinetic energy of the molecules, thus improving the extraction of carotenoids and chlorophylls. After the ultrasonication treatment, the samples were centrifuged with Hettich 320 R at 9000 rpm, 4 °C, 5–10 min. The filtrate was used to read the absorbances of the samples. A Biochrom Libra S22 UV/Vis spectrometer (Biochrom, Cambridge, UK) was used to determine the absorbances at different specific wavelengths: 450 nm for total carotenoids, 470 nm for β-carotene, and 663 nm and 645 nm, respectively, for chlorophylls.
All phytochemical assessments were carried out in triplicate, and the results presented are averages.

2.4. Texture Analysis

For the instrumental texture analysis, a Brookfield CT-3 texture analyzer (Brookfield Ametek, Middleborough, MA, USA) was used. The apples were cut transversally in two halves, and a double indentation until 10 mm depth was applied at the halfway between the peel and the seminal vesicle. For indentation, a metallic cylinder (2 mm diameter, 20 mm length) was used at 0.5 mm/s speed. The textural parameters (firmness, cohesiveness, springiness, and chewiness) were automatically calculated by TexturePro CT V1.5 software. Five determinations for each sample were made, and the results are presented as the mean ± standard deviation.

2.5. Color Analysis

The color parameters of the flesh (fresh and pickled) samples including L* (lightness/darkness), a* (red and green color coordinate), b* (blue and yellow color coordinate), C* (chroma), h* (hue angle) were determined with a NR110 colorimeter (Shenzhen 3nh Technology Co., Shenzhen, Guangdong, China).
The total color change (ΔE), browning index (BI) [20], whiteness index (WI) [21] and yellowness index (YI) [22] of the flesh samples were calculated using Equations (1)–(5).
E = L 0 * L * 2 + a 0 * a * 2 + b 0 * b * 2
B I = 100 · x 0.31 0.17
x = a * + 1.75 · L * 5.645 · L * + a * 3.012 · b *
W I = 100 100 L * 2 + a * 2 + b * 2
Y I = 142.86 · b * L *
where L0*, a0* and b0* are the color parameters of the fresh samples; L*, a* and b* represent the corresponding color parameters of flesh samples. All the experiments were performed in triplicate.

2.6. Statistical Analysis

Each test was performed in triplicate, and all the data were presented as mean value ± standard deviation. The obtained results were subjected to analysis of variance (ANOVA) using the MINITAB 20 statistical software (Romsym Data, Bucharest, Romania); the mean values were compared by Tukey’s test at a significance level of 5% (p < 0.05). Pearson’s correlation analysis and Agglomerative Hierarchical Clustering was calculated using XLSTAT version 2021.5 software.

3. Results

3.1. Physical and Chemical Analysis

3.1.1. Mass Evaluation

Mass evaluation is important in finding the physical quality of the pickled products [23]. Generally, the mass variation during pickling is due to several factors like osmosis or fermentation, leading to mass decrease, or liquid absorption (inverse osmosis), leading to mass increase. The percentage variation of apple samples during fermentation is shown in Table 1.
During the first 7 days, no mass variation could be observed, probably due to the short time interval; when fermentation started, the rate of the process was too low to be visible. Starting on day 14, a slight decrease in mass could be noticed for all the samples. This decrease continued until day 28 of the fermentation for NaCl and MgCl2 samples and until day 21 for the KCl samples. This behavior may be caused by both the osmosis phenomenon (the water from the apples migrates into the pickling solution that has a higher salt concentration) and the fermentation process (the saccharides are transformed into substances with lower molecular mass that migrate into brine or into gases that are eliminated from the system). Within the final interval, an increase in mass was noticed for the NaCl samples, while for the other samples, the decrease was lower than within the previous intervals. This could be explained by diffusion-driven uptake of brine components into the apple tissue. Fadhil et al. [23] reported a mass decrease of sauerkraut by 4.6–7.9% in seven days of fermentation. In another study, a decrease in the mass of black garlic during 20 days of fermentation was reported [24].

3.1.2. Dry Matter

The dry matter content has an important impact on the textural properties of fermented products [25]. The highest dry matter content (Figure 1) was recorded for fresh apple sample (14.94 ± 0.25 g/100 g product). During fermentation, the dry matter content decreased for all samples until day 28. The highest decrease of this parameter was found for the samples fermented in the NaCl brine solution. The dry matter content decreased by 26.17%, reaching 10.62 ± 0.19 g/100 g product. This reduction in dry matter content could be due to lactic acid bacteria using the carbohydrates, minerals and other components necessary for their development during the fermentation period. After 28 days of fermentation, the dry matter for all samples started to increase. The reason for this increase could be the difference in osmotic pressure that exists between the saline solution and the fermented plant material, respectively, due to the mass transfer that occurs by diffusion. At the end of the storage period, after 35 days, the dry matter varied between 13.00 ± 0.45 g/100 g product (for the samples fermented in KCl brine solution) and 13.67 ± 0.29 g/100 g product (for the samples fermented in MgCl2 brine solution).

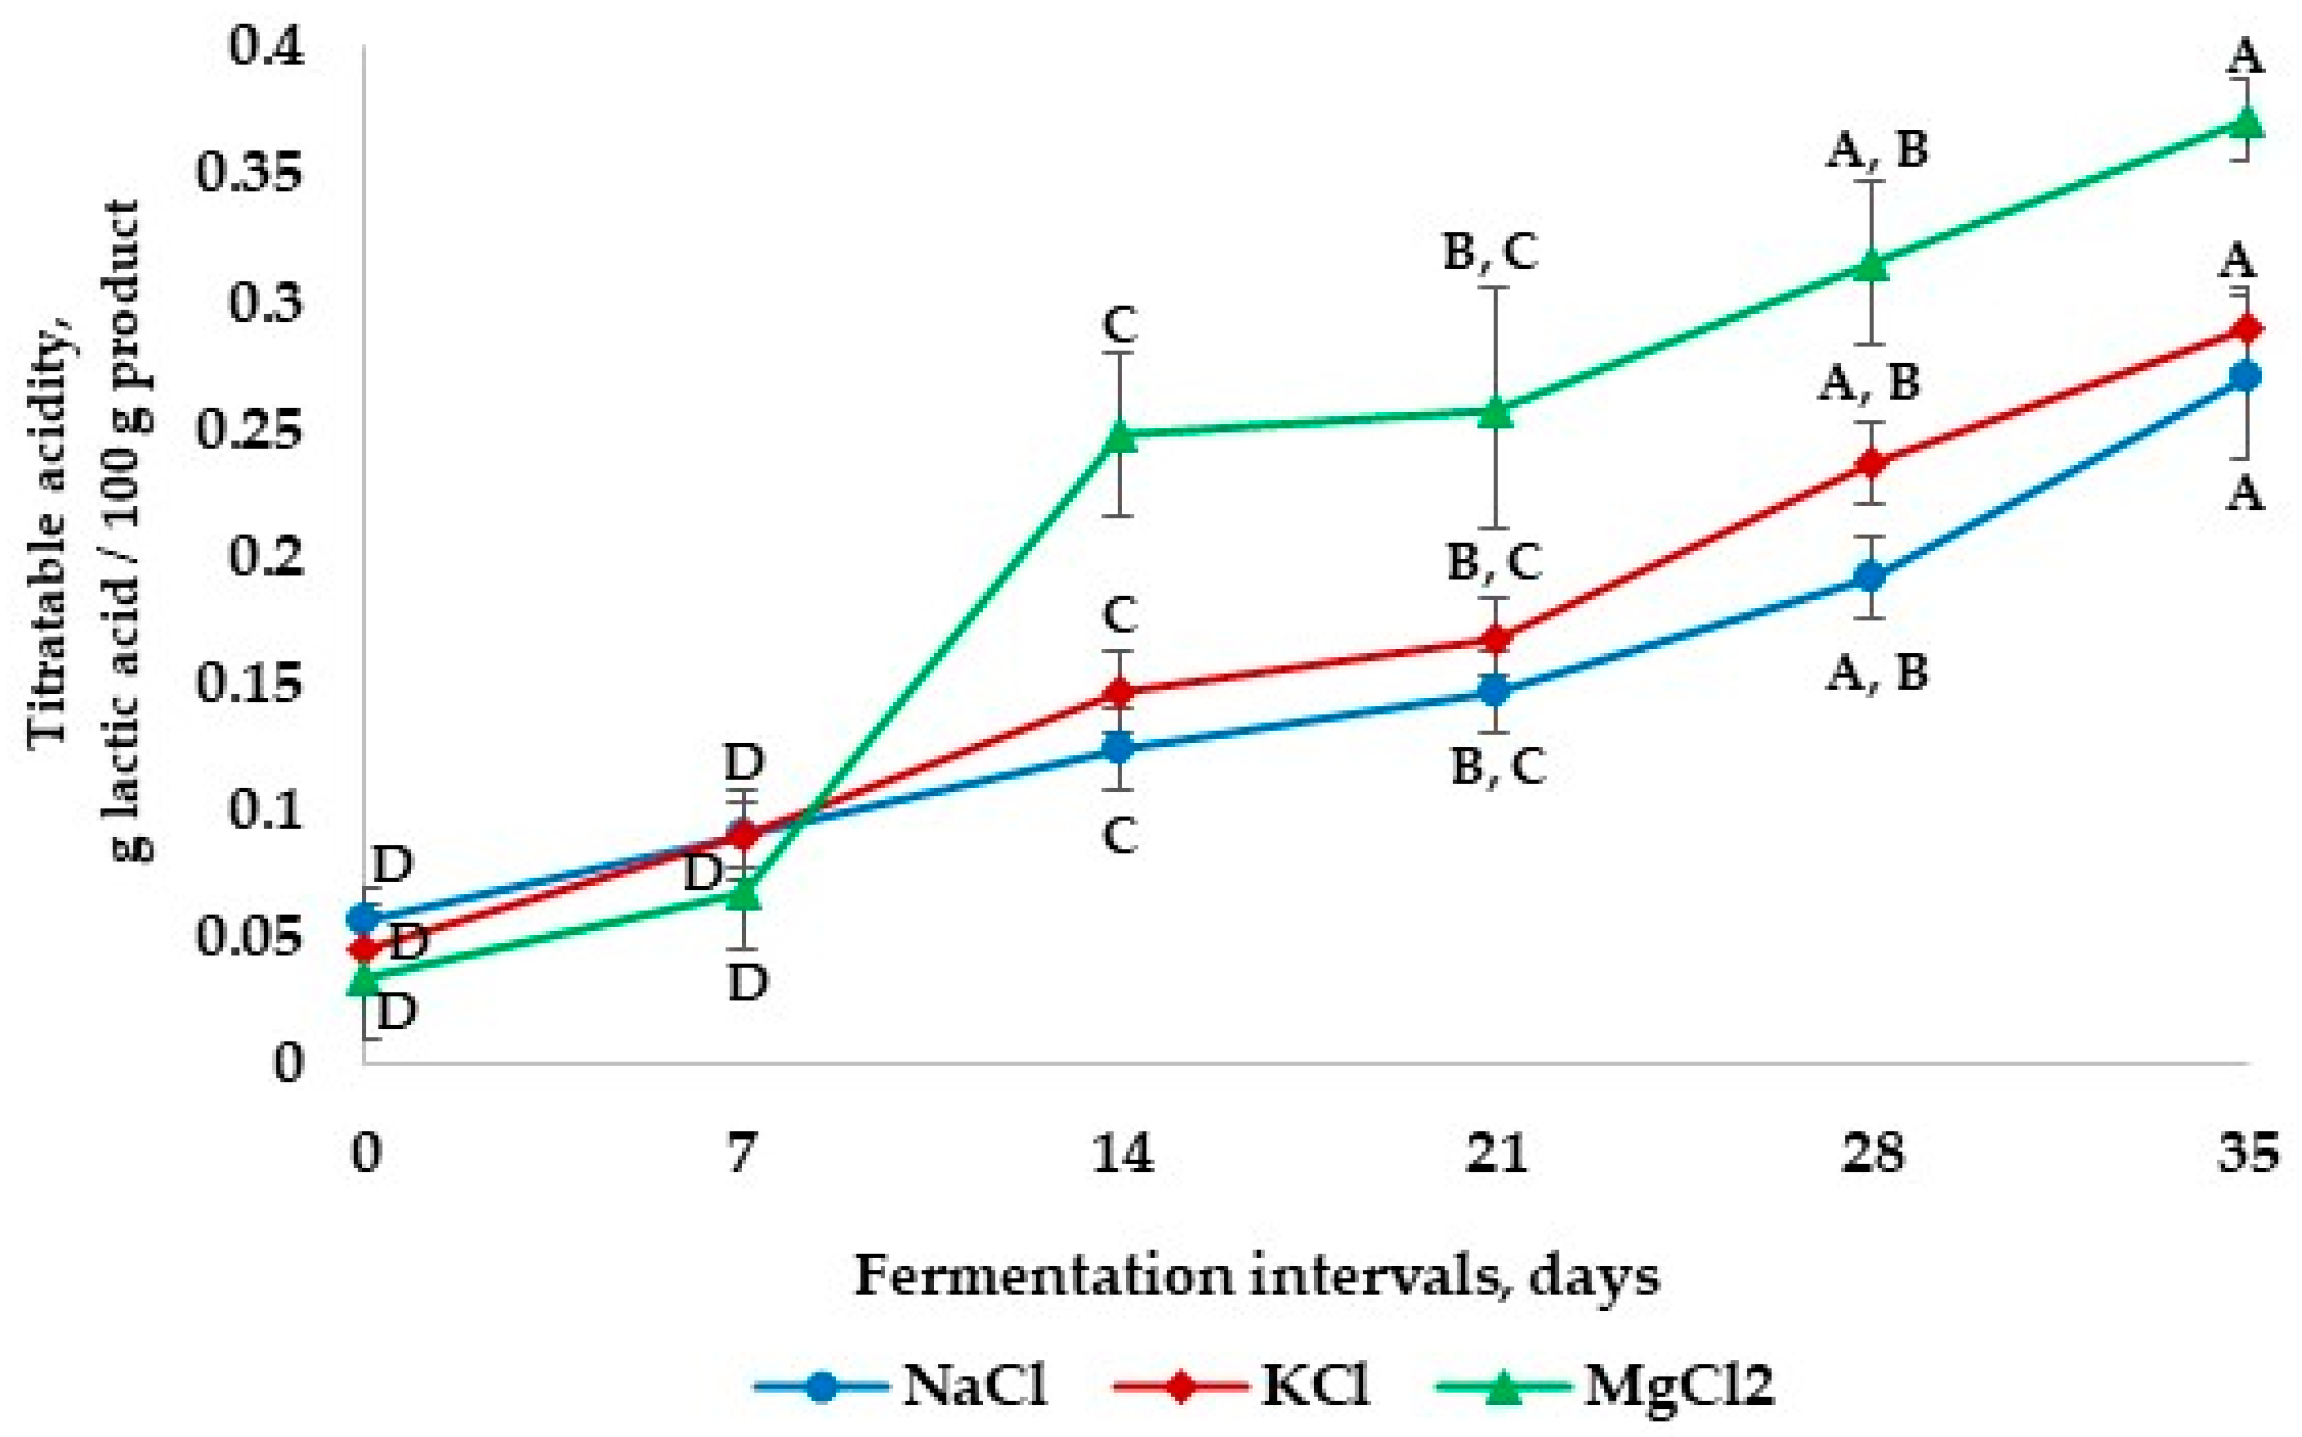
3.1.3. Titratable Acidity
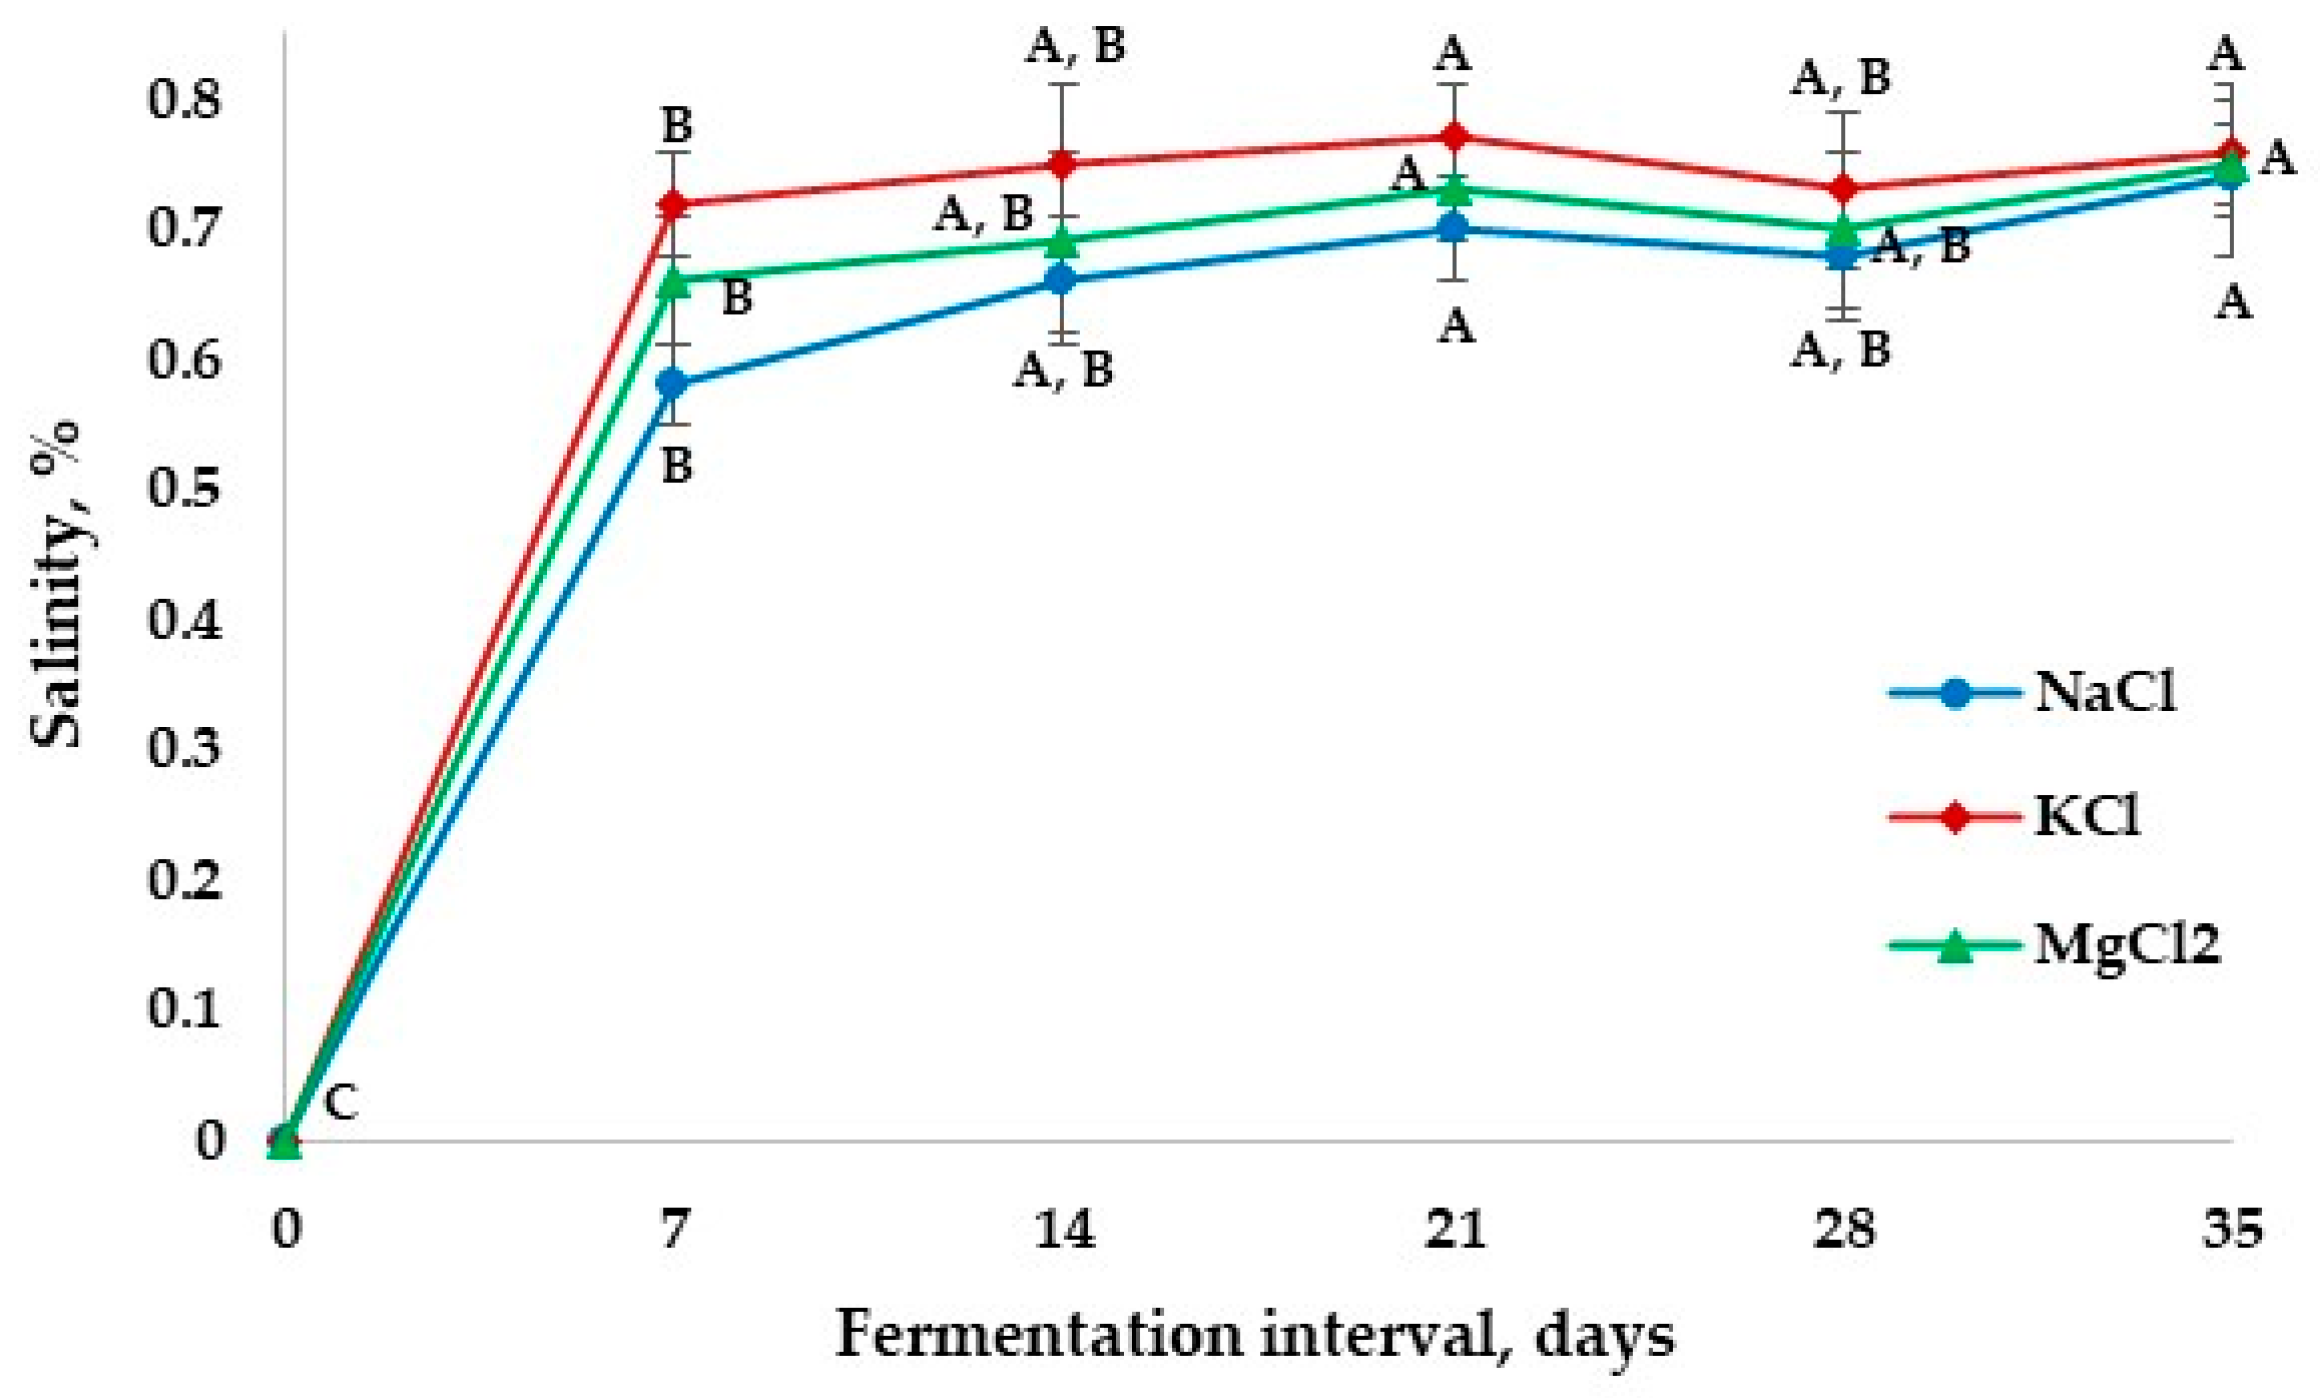
The titratable acidity and pH values are the main indicators of microorganism and microbial metabolite increase [26]. The changes in titratable acidity in the apple pickles during 35 days of storage are shown in Figure 2. It was found that, during the fermentation period, the titratable acidity of apple pickles increased from the first day until the 35th day. All pickle samples reached a high level of acidity up to 14 days of fermentation, after which they became relatively stable, showing a slow increase until day 21. The highest value (0.248 ± 0.032 g lactic acid/100 g product) of titratable acidity was registered for the samples fermented with MgCl2, while the lowest value (0.124 ± 0.016 g lactic acid/100 g product) was found for the samples fermented with NaCl. The difference in titratable acidity may also come from the nature of the cations (Mg2+ vs. Na+) and their interaction with water. It is possible that MgCl2 inhibits the lactic acid bacteria resulting in a higher titratable acidity, while the NaCl tends to slow down the lactic acid fermentation process, leading to a lower titratable acidity.
From day 21 to day 35 of fermentation, the titratable acidity for all samples increased by 30.5% for the samples fermented in MgCl2 brine, 35.1% for the samples fermented in KCl brine, and 46% for the samples fermented in NaCl brine. The final titratable acidity level for the samples fermented in NaCl is lower when compared with the samples fermented in MgCl2 and KCl at the end of the storage interval. The acidity values could be explained by the evolution of lactic bacteria, which registered rapid development in the first 14 days, followed by stagnation and decrease as presented in a previous study [17]. Similar results were reported by Yousefi et al. [1], who found that after one month of fermentation, the titratable acidity of pickled cucumbers with different brines increased during this period.

3.1.4. Salinity

Salinity plays an important function in fruit and vegetable fermentation, changing microbial activity and the texture of the final product [27]. Figure 3 shows the changes in salinity in apple pickles during the fermentation period. The salinity levels for the fermented samples gradually increased from 0.58 ± 0.03 g/100 g to 0.66 ± 0.05 g/100 g (samples fermented with NaCl brine), from 0.72 ± 0.04 g/100 g to 0.75 ± 0.06 g/100 g (samples fermented with KCl brine), and from 0.66 ± 0.05 g/100 g to 0.69 ± 0.07 g/100 g (samples fermented with MgCl2 brine) on day 14, continuing to increase slightly until day 21 of fermentation. After this period, the values of salinity started to stabilize around 0.76 ± 0.05 g/100 g by day 35. Lee et al. [28] reported similar results for kimchi during long-term fermentation under varying salinity conditions. Similar salinity patterns for all samples suggest that different types of salt used to obtain the brine solution do not alter the distribution of salt during fermentation and preserve product safety and quality during storage.

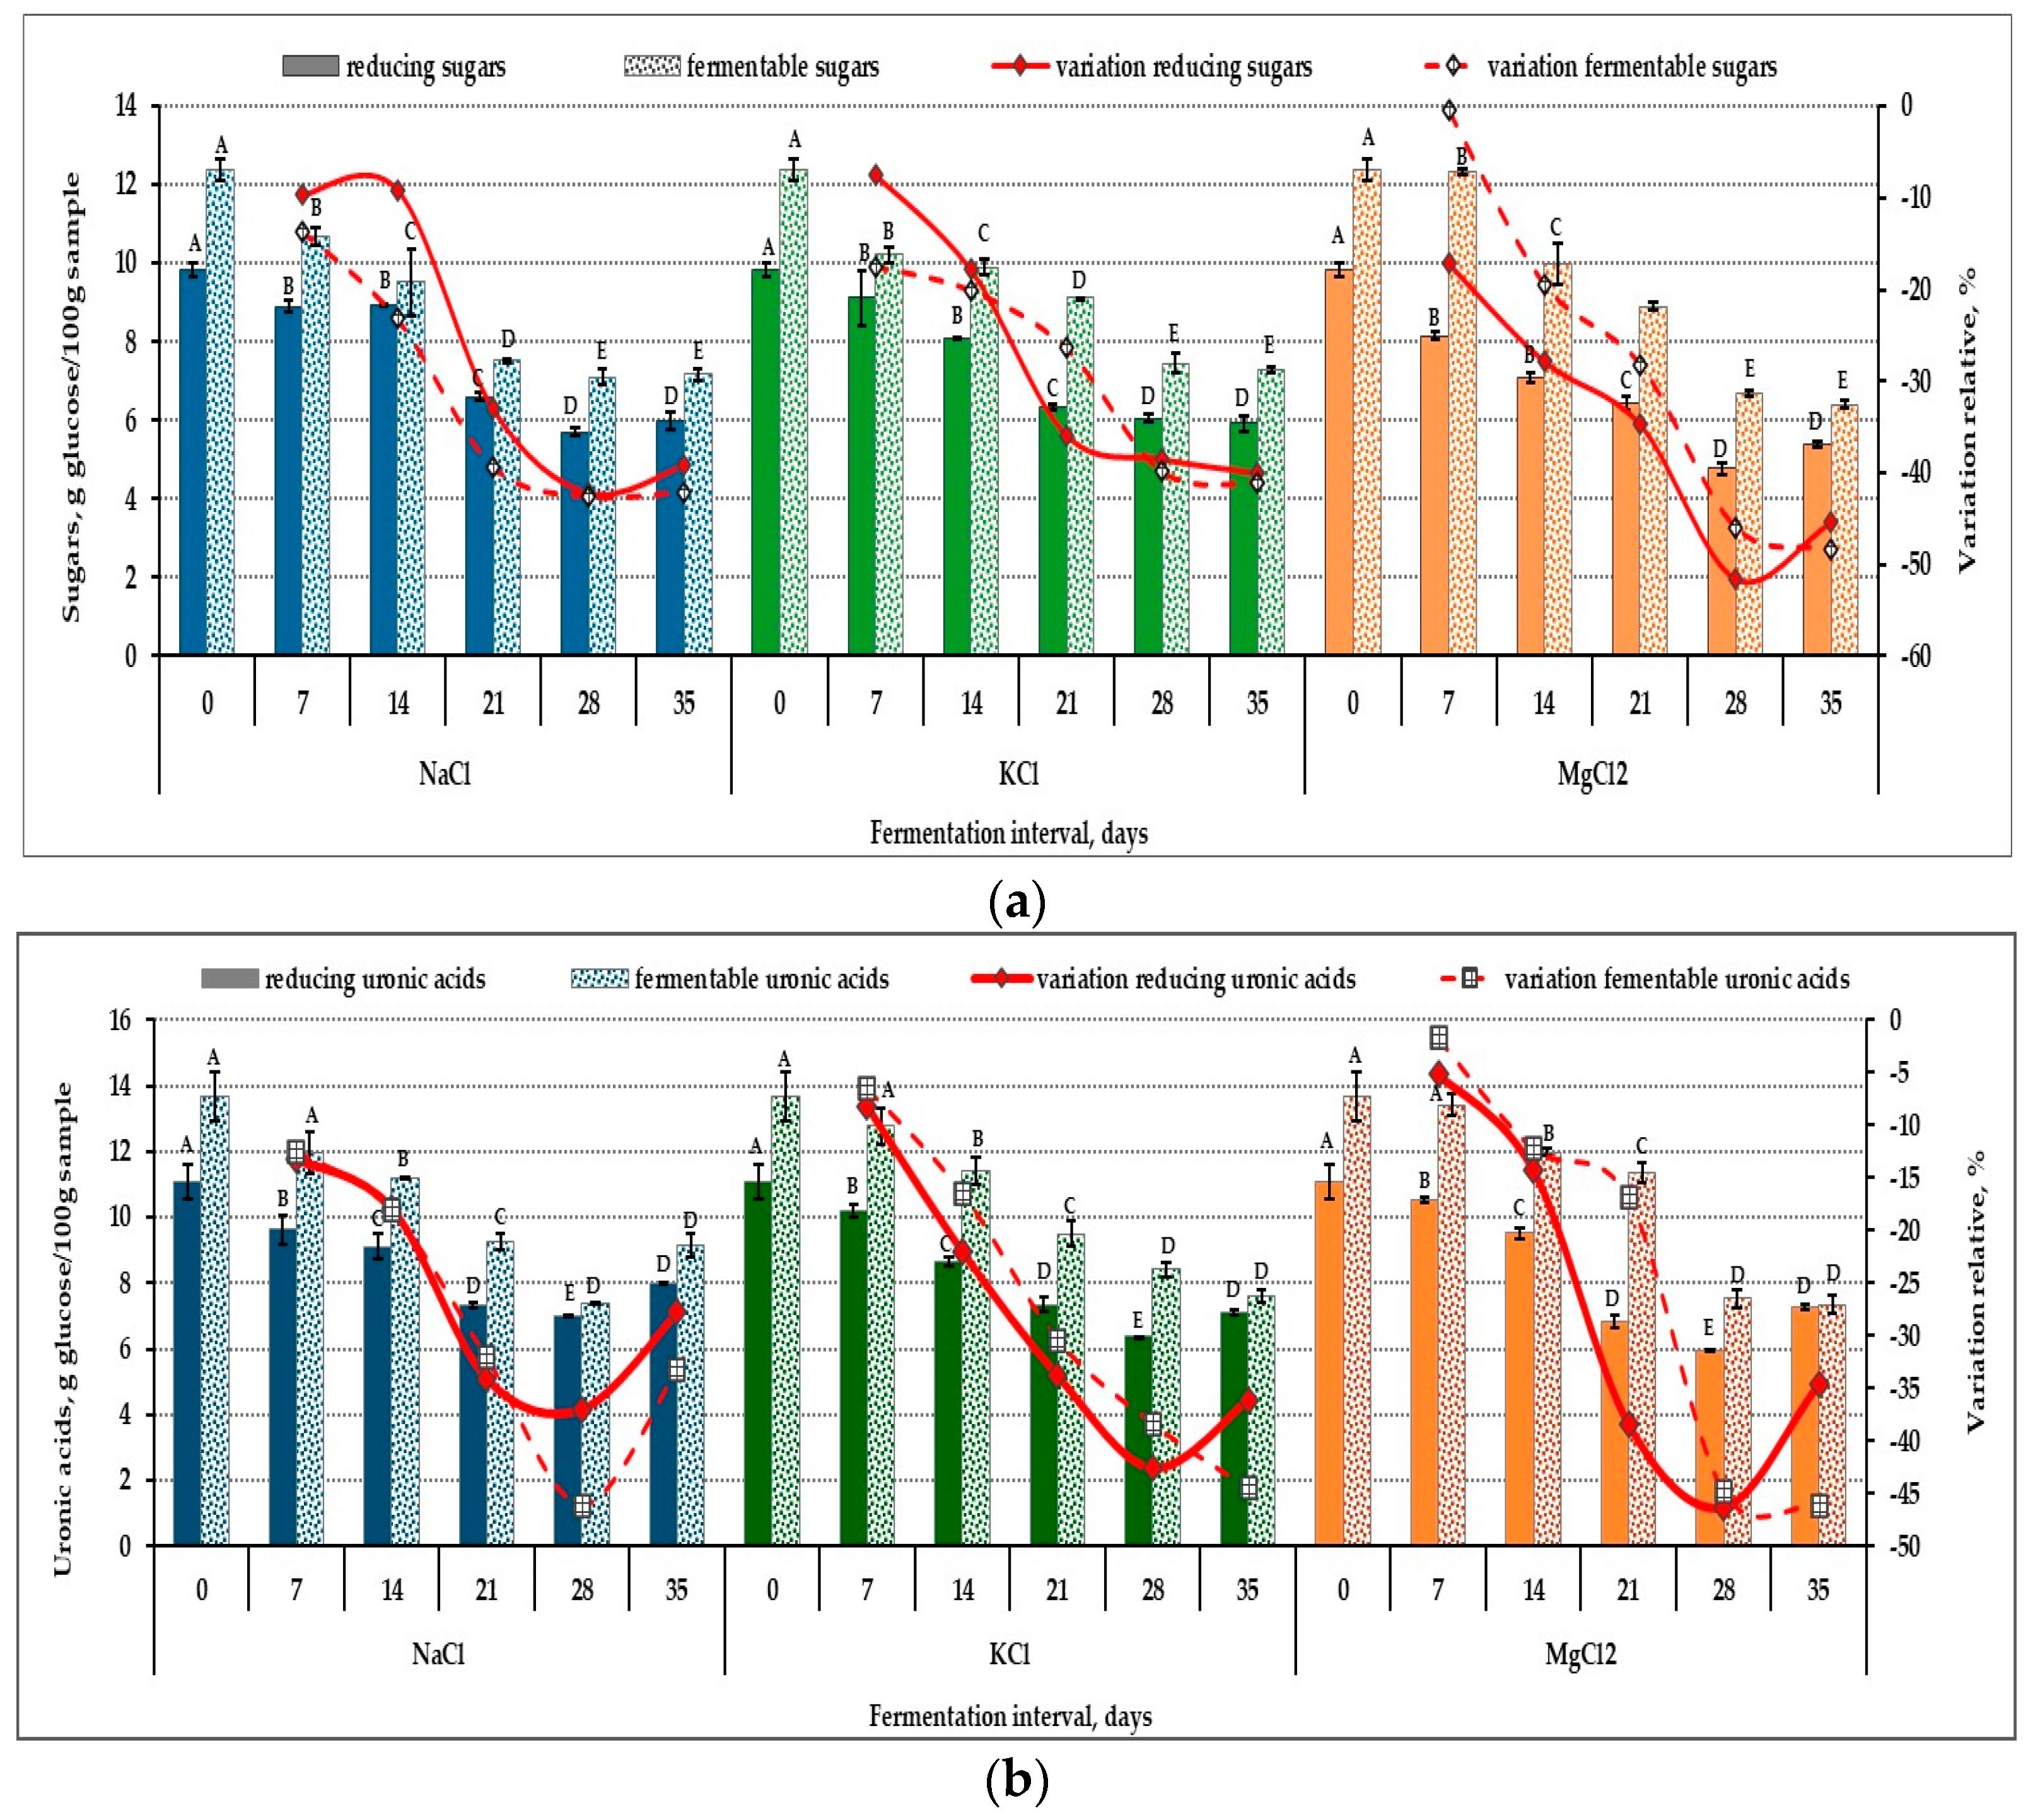
3.1.5. Reducing Sugar

The success of pickling vegetable products in brine solutions depends largely on the initial content of fermentable sugars, the main source of carbon and energy for their native microbiota [29]. Apples contain appreciable amounts of monosaccharides such as glucose, fructose, galactose and uronic acids (mainly galacturonic and glucuronic acids), but also non-reducing sugars (primarily sucrose) and oligomers of pectic substances that can be used in the early stages of fermentation [30]. The total content of reducing carbohydrates and uronic acid, as well as the level of sugars and also di- and trimers of uronic acids, was measured in order to follow the dynamics of spontaneous fermentation of apples in magnesium, calcium and sodium chloride brine. Figure 4 shows that at the end of the fermentation period, the apples fermented in MgCl2 brine solution exhibit the highest decrease in the level of reducing carbohydrates (45.35%), as compared to the samples fermented with NaCl (39.08%) and KCl (39.6%), respectively. The evolution of the level of reducing carbohydrates and that of fermentable sugars is similar.
During the first 7 days of fermentation, the variation in simple and fermentable carbohydrates, as well as uronic acids, is different between samples. However, at the end of the second week, regardless of the type of brine used, the sugar concentration decreased by 21%, while the uronic acids decreased by 16%. This aspect can be explained by the different adaptation capacity of the microorganisms involved in the fermentation process. The results show that after 3 weeks of fermentation, the level of reducing sugars and uronic acids in the pulp of pickled apples is approximately 35% lower than in unfermented apples, for all brine variants.
The aspect of the relative variation curves of the carbohydrates analyzed throughout the fermentation period differs depending on the type of salt used. Differences are also noted regarding the classes of carbohydrates (reducing carbohydrates and uronic acids, fermentable sugars and uronic acids); present in the samples. These variations, observed weekly, result from microbial interactions (competition, cooperation, inhibition) and the enzymatic reactions of the microbiota. Carbohydrate levels change due to their consumption in metabolic processes, reactions that occur simultaneously with the hydrolysis of polysaccharides and the formation of exopolysaccharides. Therefore, simple carbohydrates, uronic acids and fermentable sugars may show slight increases or variable rates of decrease from one analysis stage to another, as a result of the balance created between these biochemical processes. Additionally, the leaching of soluble compounds into the brine solution is an important factor influencing the levels of sugars and uronic acids in the pulp of pickled apples [31].

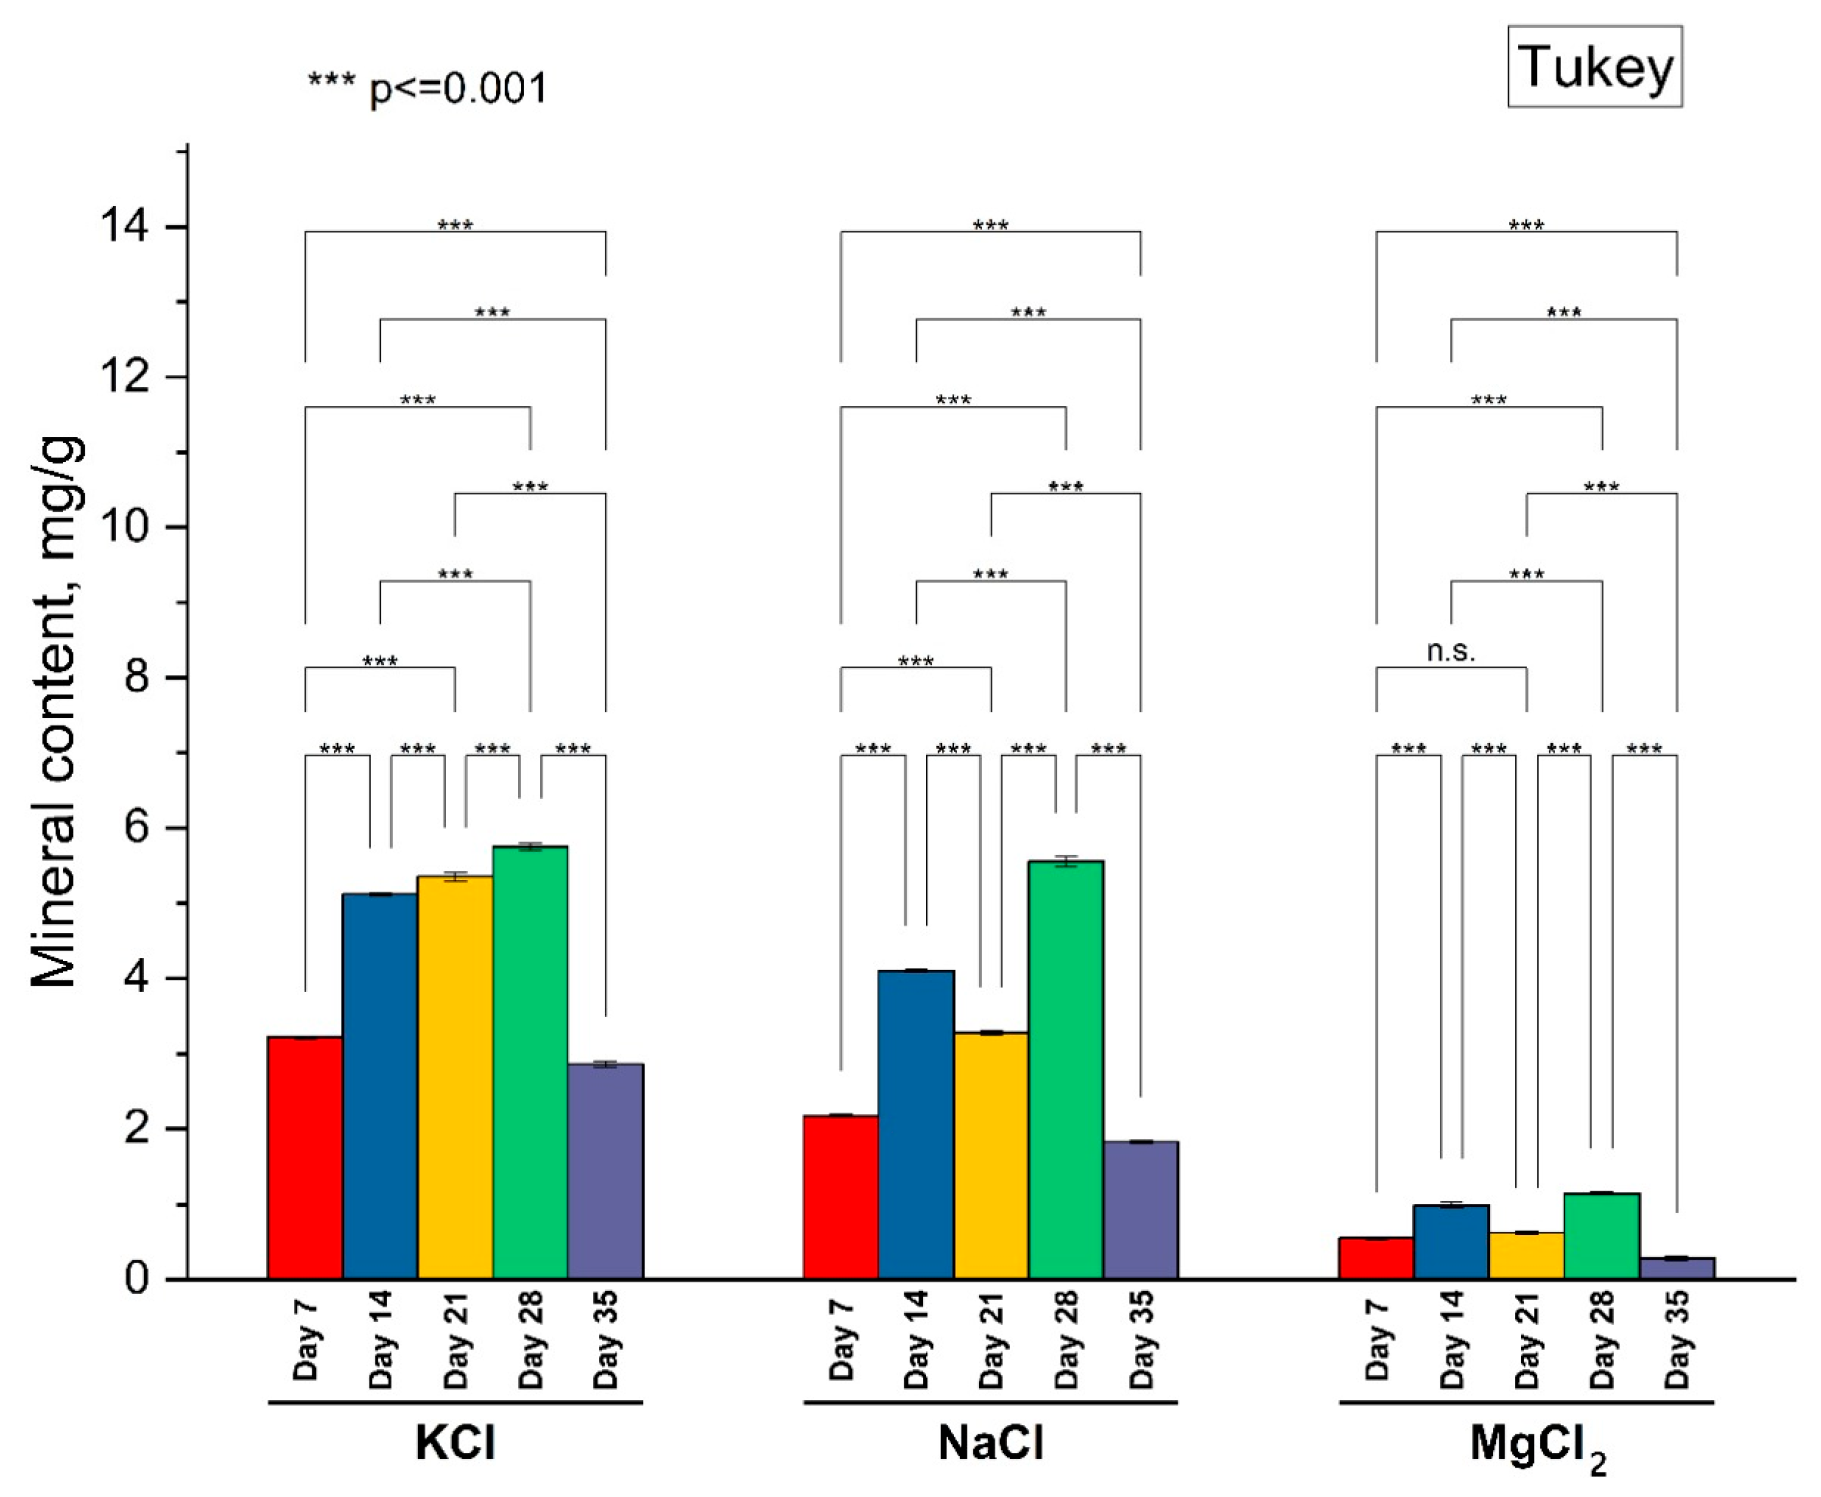
3.1.6. Concentration of Cations

The replacement of NaCl used for preserving foods with other salts such as KCl and MgCl2 is beneficial for human health and can also improve consumer perception [3]. The concentration of K, Na, and Mg in the peel of the fermented apples showed the same trend in intake, with the highest values on day 28 of the experiment (K: 5.75 ± 0.04 mg/g; Na: 5.55 ± 0.05 mg/g; Mg: 1.14 ± 0.01 mg/g), while the lowest concentration in the peels was observed on the last day of the experiment (K: 2.86 ± 0.03 mg/g; Na: 1.82 ± 0.01 mg/g; Mg: 0.28 ± 0.02 mg/g). In the case of KCl treatment, a steady increase was observed in K concentration in apple peels from day 7 of the experiment to day 28, after which a sharp decrease was attained on the last day of the experiment (Figure 5). Significant differences (p < 0.01) were observed during the experimental trial regarding K, Na, and Mg intake in apple peels (Figure 5). However, while the intake of K and Na in the peel samples was similar in terms of concentrations, in the case of Mg, the concentration values were significantly lower. This can be attributed to the lower permeability of Mg across cell membranes as compared to Na and K [32]. In a study by Francini et al. [33], the concentration of Na in the peel of figs exposed for 28 days to 100 mM NaCl was more than 0.16 mg/g dry weight.
Regarding the concentration of cations in the brine, the concentration fluctuated during the experimental period, and no significant differences (p > 0.05) were observed in terms of K and Na from the first analysis (day 7) and the last day of the experiment (day 35). Regarding the Mg concentration in the brine, a significant decreasing trend was observed from day 7 to day 28, after which a sharp increase was observed by the end of the experimental period (Table 2). Furthermore, the highly significant differences between the Mg concentration in the brine and K and Na, respectively, are due to differences in the molecular masses of salts and electrical charge [34]. In a soluble state, Mg can bind hydration water stronger than K and Na [35], and therefore, MgCl2 is more soluble than NaCl and KCl [36].

3.1.7. The Results of Phytochemical Analysis

Apples are among the main sources of phenols in plants. However, only a few studies have so far reported the phytochemical characterization of naturally fermented apples, and not necessarily as apple pickles. Table 3 shows the average of three successive determinations of the main phytochemicals of fresh and fermented apples.
Table 3 shows a gradual increase in TPC and TFC according to the three types of brine and the days of fermentation. According to [37], the effect of the fermentation of fruits and vegetables impacts the bioavailability of the TP and TF compounds, which will determine the increase in antioxidant activity. This affirmation could be sustained by the results of the present study on apple fermentation due to the notable increases: by 90% for the TPC registered for NaCl after 35 days of storage, by 33% for KCl fermentation, and by 23% for MgCl2, respectively. The results of TPC are heavily dependent on the brine type.
It is certain that lactic acid bacteria can increase the content of flavonoids (from 9.57 ± 0.40 to 15.26 ± 0.42 mg EQ/g d.w. for NaCl brine, from 8.03 ± 0.35 to 16.30 ± 0.33 mg EQ/g d.w. for KCl brine, and from 9.21 ± 0.50 to 15.21 ± 0.61 for MgCl2 brine) and metabolize them into more bioavailable forms, which is confirmed by the TFC content evolution (Table 3) in dependence on the days of fermentation. These could be associated with the activity of the most common flavonoids (procyanidins, epicatechin, catechin and quercetin) found especially in apple peel and less in flesh, which have strong antioxidant activity and could also inhibit low-density lipoprotein (LDL) oxidation, as Charde et al. [38] reported.
It is to be remarked that comparable results were reported by Gao et al. [39] for the biotransformation of flavonoids from alfalfa during fermentation with lactic bacteria.
Interestingly, in accordance with the studies of Ahrazem et al. [40] and Rodriguez-Concepcion et al. [41], the β-carotene content, independent of the salt type but dependent on the fermentation time, could be associated with oxidative cleavage into apocarotenoids and other compounds because of some non-specific reactions such as lipoxygenase co-oxidation or photooxidation or by oxygenase influence.
The β-carotene content is highly influenced by the fermentation phenomenon and the plant material, as Mapelli-Brahm et al. [42] pointed out.
By fermentation, the cell wall of apples was broken down by releasing lycopene from the tissue matrix and causing several important related bioavailability changes. An apparent increase in lycopene, a trans-isomer, was observed on day 21 of fermentation (0.57 ± 0.62 to 0.82 ± 0.00 mg/g d.w. for NaCl brine, 0.63 ± 0.00 to 0.90 ± 0.00 mg/g d.w. for KCl, and at least 0.65 ± 0.00 to 0.93 ± 0.01 for MgCl2).
Nonetheless, the β-carotene content decrease is almost always associated with lycopene increase, as our study has revealed, similar to Cakir and Helvacioglu [43]. Even so, lycopene bioavailability increases due to fermentation or any other type of processing owing to its unique property of being hydrophobic and somewhat lipophilic [8], which on the other hand makes it unstable for digestion.
The phase marked by fermentation from day 7 to day 28 registers a chlorophyll content decrease of almost 16% for NaCl brine, 13.5% for KCl brine, and the highest percentage of 26% for MgCl2 brine. Possible physiological and metabolic changes, such as the hydrolysis of starch, degradation of chlorophyll, and CO2 gas diffusion, could occur through apple tissue; these expected phenomena are visible due to the color changes identified [44].
Unexpectedly, on day 35 of fermentation, the chlorophyll content increased up to values almost comparable with those registered on day 7 of fermentation. This instant phenomenon could be attributed to the formation of some compounds or complexes of compounds originating from cellular enzymatic and non-enzymatic reactions produced under the action of lactic acid bacteria, the fermentation environment, and conditions.

3.2. Texture Analysis
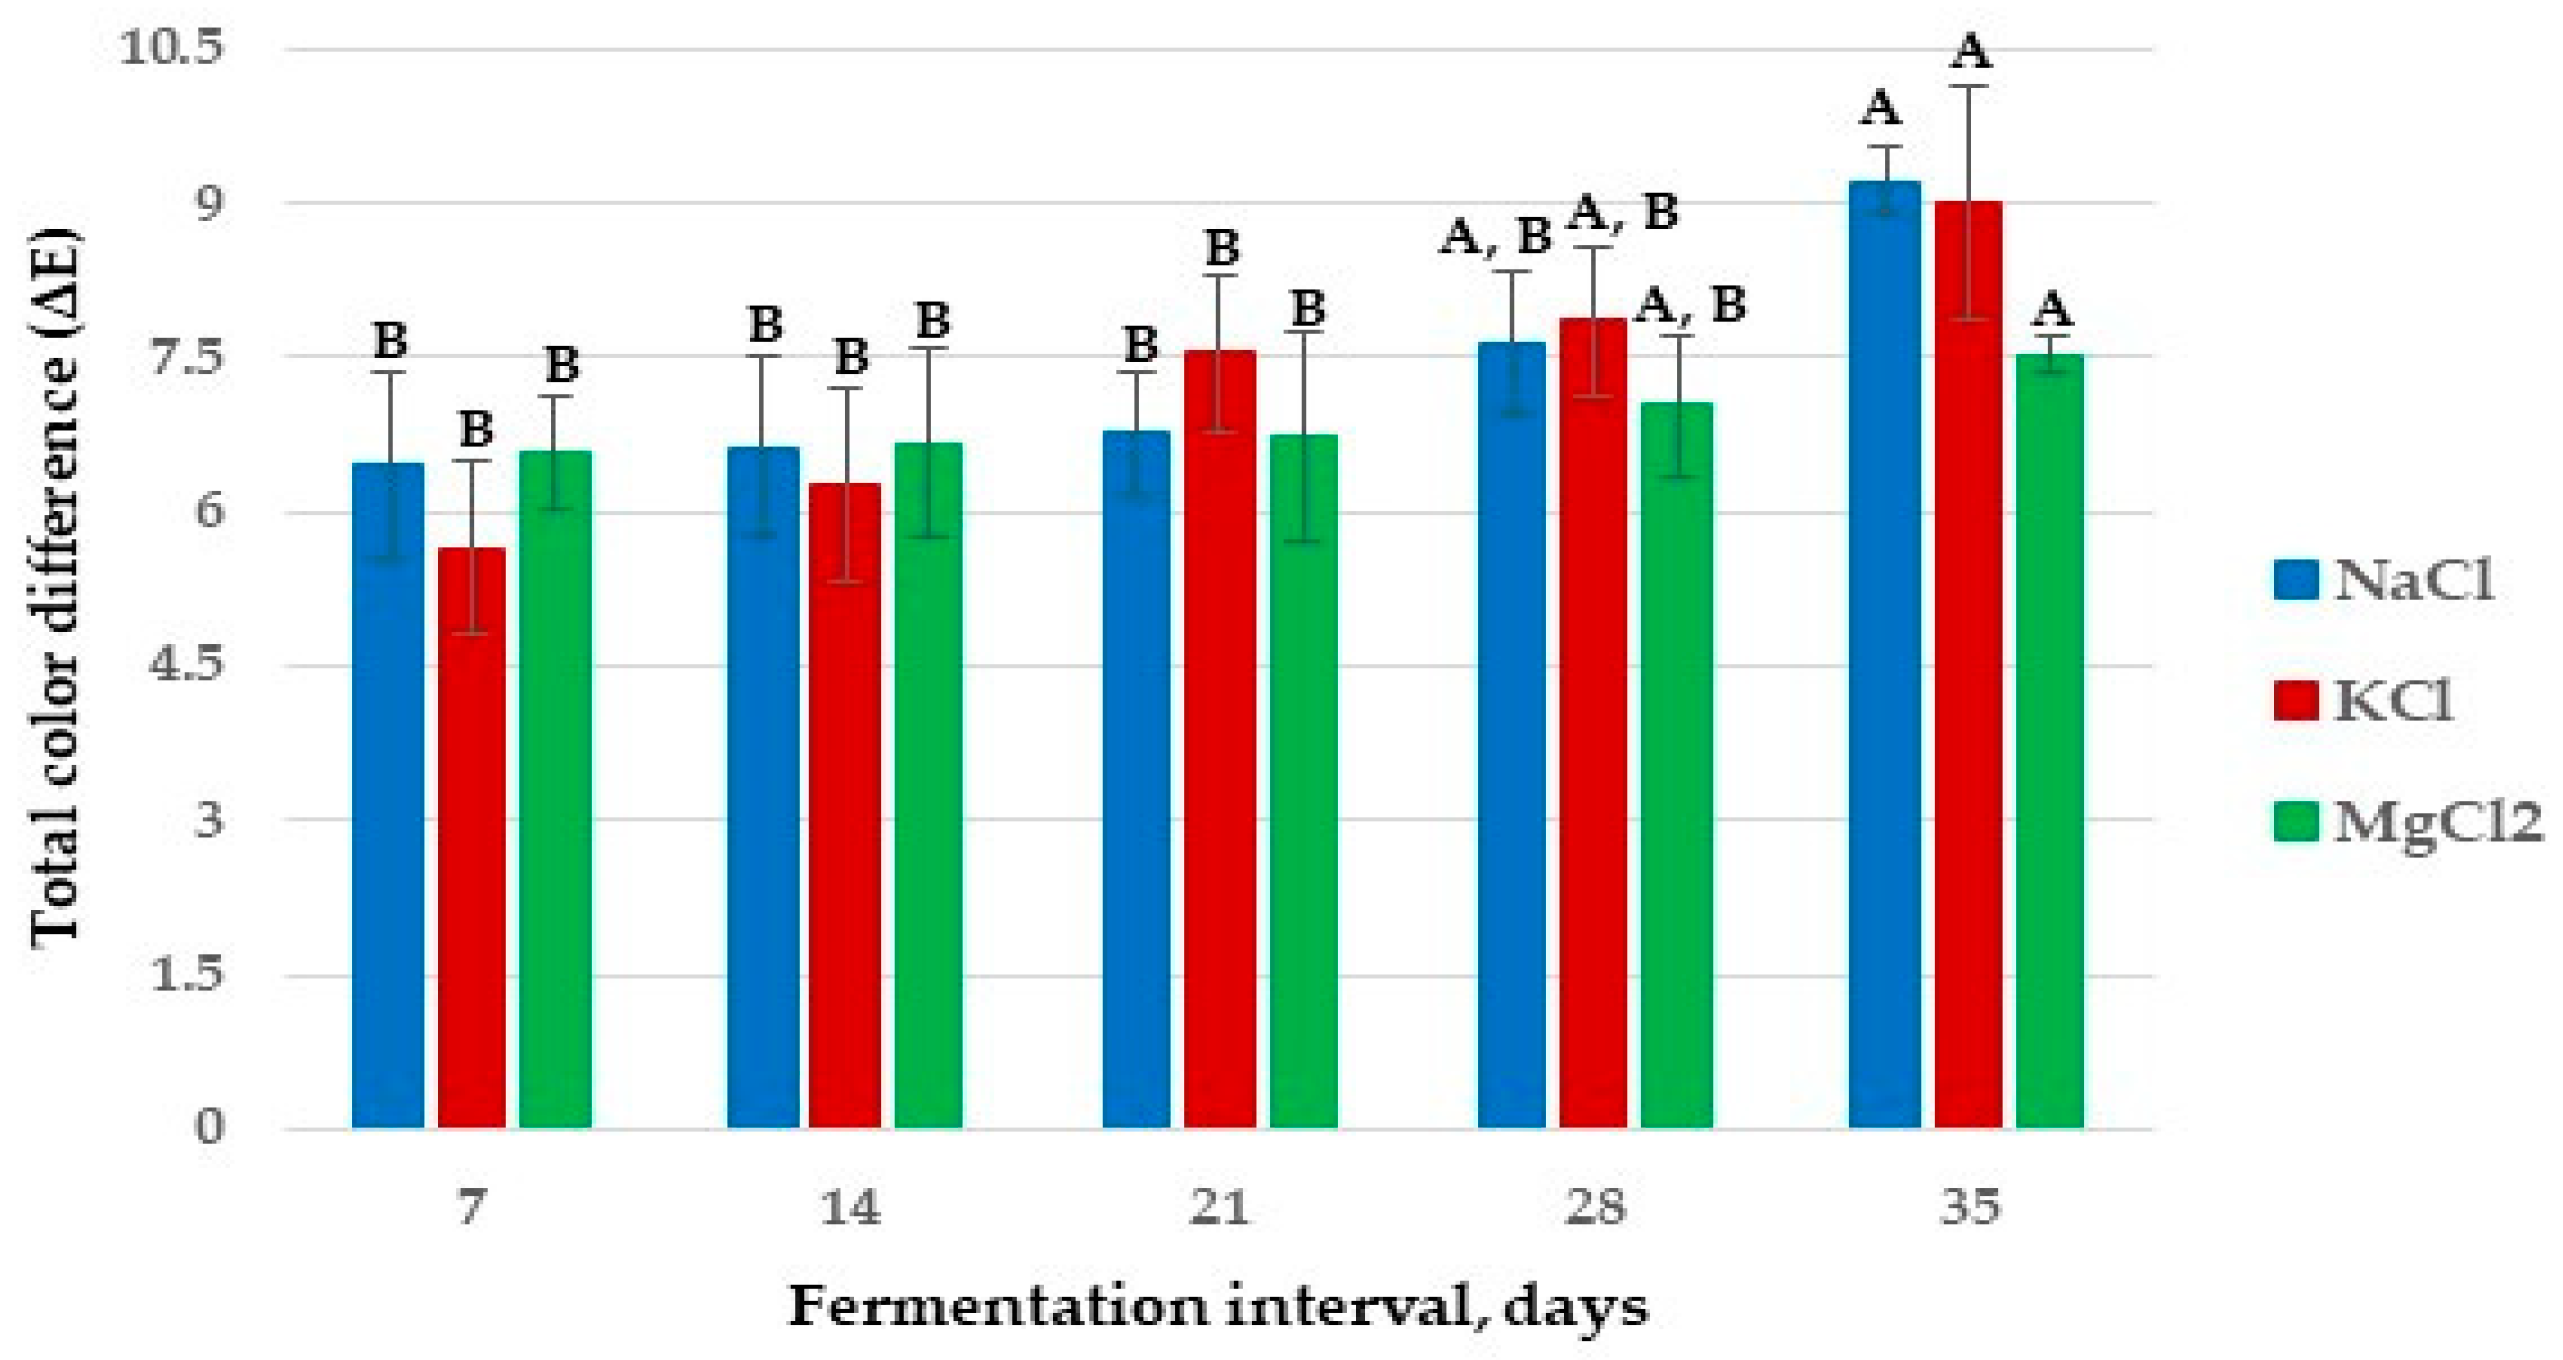
Texture is very important for food products, as it is one of the factors that influence the consumer’s decision when buying the product. The values of texture parameters are to be seen in Table 4. For all the samples, a continuous decrease in firmness, cohesiveness, springiness and chewiness was noticed up to day 21 of the fermentation process. After that moment, the parameters did not register significant changes. These results could be explained by the structural changes that occur within the vegetal tissue during fermentation. The main changes are the degradation of macromolecular compounds from the cellular walls under the activity of the enzymes produced by the microorganisms involved in the fermentation process. NaCl is well-known as a firmness protector due to its inhibiting effect on microorganism development. On the other hand, magnesium has the potential to protect the structure of vegetal tissue, bonding the free carboxyl groups left after pectin degradation [45]. Thus, the textural parameters of NaCl samples are similar to those of the MgCl2 samples. Moreover, tissue with softer texture, as in the case of the KCl samples, is easier to destroy during the mechanical stress induced by the texture analyzer, resulting in lower values of cohesiveness and chewiness. At the same time, once the tissue was destroyed, the deformation is difficult to recover, leading to lower values of springiness. Similar changes were reported for pickled jalapeno [46] or carrots [47]. Slight differences in values could be noticed when compared to data reported previously for pickled apples [17], maybe due to the different analysis method: in this study, only the mesocarp was taken into consideration, while in the previous study, the whole pericarp (including the peel) was analyzed.

3.3. Color Analysis

The changes in the flesh color of apple samples (fresh and pickled) during fermentation are shown in Table 5. The L*, a*, and b* color parameters decreased for all the samples during fermentation, indicating that the color of apple flesh samples degraded with the fermentation period. The total color difference (ΔE) is a quality parameter used to determine color changes in food items [26]. In the present study, the ΔE (Figure 6) of all brine-pickled apples changed significantly during the fermentation process, showing that the brightness of the fermented samples was reduced and the color difference was more evident.
The saturation of a color (C*) and yellowness index (YI) are especially used to determine the brightness and yellow degree of food [22]. As shown in Table 5, the values of C* and YI decreased for all brine-pickled samples during fermentation. This aspect may be due to the presence of some enzymes (lipase, nitrite reductase), bacteriocins, and organic acids (secondary metabolites) produced by lactic acid bacteria, affecting the color characteristics of brine-pickled apples. Chen et al. [22] reported similar results for yellow pepper sauce (Capsicum chinense Jacq.) fermented by Lactobacillus plantarum. The decrease in yellow color intensity (b*) of the samples caused the increase in whiteness index values in the case of all the fermented samples.
To assess the strength and direction of the relationships between the physicochemical parameters monitored in the lactic fermented apple samples, Pearson correlation analysis was used (Table 6). During pickling, independent of the type of salt used for fermentation, strongly significant inverse correlations (p < 0.05) were observed between the decrease in the carbohydrate profile and the accumulation of lactic acid (r = −0.842 ÷ −0.960). The strong positive correlations between the level of lactic acid and that of total polyphenols and flavonoids (r > 0.9) indicate that fermentation could have the potential to increase the antioxidant and antiradical activity of apples. Also, the enzymatic hydrolysis processes of complex carbohydrates (pectic substances, hemicellulose and, to a lesser extent, cellulose) influence the physical parameters of apple tissue such as firmness and cohesiveness, which are closely correlated (r = −0.778 ÷ −0.964) with the accumulation of bioaccessible biologically active compounds such as polyphenols and flavonoids, thus increasing their availability [48].
Thus, the entire dynamics of the fermentation process can be explained: as the firmness and cohesion of apple tissue decrease (r = 0.857 ÷ 0.899), the fermentative biochemical processes intensify, leading to the accumulation of acidity due to the reduction in fermentable carbohydrates (sugars and uronic acids) and to the permanent exchanges between organic compounds and the microbiota in apple pulp and brine solution. The values of the Pearson coefficients emphasize that the type of salt used for spontaneous fermentation of apples does not significantly influence the physicochemical profile of the products [49].
To identify the degree of similarity of apple samples fermented with the three types of salts, the unweighted average method on pairs and the Pearson coefficient as a measure of similarity were used, without imposing a fixed number of clusters. The grouping was performed taking into account the level of chemical compounds present throughout the fermentation period (sugars, uronic acids, lactic acid, biologically active compounds), but also the physical parameters firmness and cohesiveness.
The analysis classifies the samples throughout the fermentation period into three groups (Figure 7). The first group contains all apple samples from the first 2 fermentation stages: 7 and 14 days, regardless of the different brine solution used. Apples pickled for 3 weeks form cluster 2, and those from the final weeks (28 and 35 days of fermentation, respectively) are all grouped in the third cluster. This distribution demonstrates that the type of brine used for apple fermentation—NaCl, KCl or MgCl2—does not greatly influence the dynamics of the fermentation process. After each 7-day pickling stage, the chemical composition and texture of the apples do not differ greatly.
Therefore, it can be stated that replacing NaCl-based brine with MgCl2 and KCl represents, in each case, a good alternative in obtaining pickled apples by spontaneous lactic fermentation [50,51,52].

4. Conclusions

Potassium or magnesium chlorides could be used as alternatives to sodium chloride in the apple fermentation process. The evolution of the main quality characteristics of the final product shows a similar tendency, with slight differences in values, due to the different types of salt used in the study. The physicochemical parameters of fermented apples were mainly influenced by the length of the fermentation process, and less by the salts used in the brine preparation. The dry matter content initially decreased for all samples until day 28, and then increased due to the osmotic pressure existing between the saline solution and the fermented apples. The TA value significantly increased and reached the highest values in the final phase of fermentation (after day 35). In contrast, the levels of reducing sugars and uronic acids content decreased for all the samples. This aspect can be accounted for by the different adaptation capacity and metabolic activity of the microorganisms involved in the fermentation process.
The phytochemical compounds concentration was enhanced by the action of lactic bacteria, as a result of their metabolization into more bioavailable forms. The present study indicates that the pickling process where NaCl was substituted by KCl or MgCl2 has beneficial effects on the concentration of the bioactive compounds of fermented apples. The results showed that these substitutions can increase the levels of carotenoids, TPC, TFC and chlorophyll. The results of textural analysis indicated that the KCl produced small changes on the textural characteristics of brine-pickled apples in comparison to NaCl or MgCl2. The color parameters of all brine-pickled apple samples decreased during the pickling process.
As to what the future holds, great attention should be placed on the phytochemical characterization of fermented fruits and vegetables, especially apples. Moreover, further digestibility investigations and distinctive studies regarding the phytochemical compounds involvement and synergies in fermentation are needed.

Author Contributions

Conceptualization, E.B. and O.V.N.; methodology, D.-G.A. and G.-D.M.; software, G.-D.M.; validation, E.B., D.-G.A., O.V.N. and G.-D.M.; formal analysis, G.-D.M.; investigation, D.C., D.I.M., I.-A.S., D.-G.A. and O.V.N.; resources, E.B.; data curation, D.-G.A., O.V.N. and G.-D.M.; writing—original draft preparation, D.C., D.-G.A., O.V.N., D.I.M., I.-A.S. and G.-D.M.; writing—review and editing, D.-G.A., O.V.N. and G.-D.M.; visualization, D.-G.A., O.V.N. and G.-D.M.; supervision, E.B.; project administration, E.B.; funding acquisition, D.C. All authors have read and agreed to the published version of the manuscript.

Funding

This research received no external funding.

Institutional Review Board Statement

Not applicable.

Informed Consent Statement

Not applicable.

Data Availability Statement

The data presented in this study are available on request from the corresponding author.

Acknowledgments

The Integrated Center for Research, Expertise and Technology Transfer in the Food Industry (BioAliment-TehnIA), as well as the MoRAS Center developed through the POSCCE ID 1815, SMIS number 48745 (https://www.unicer.ugal.ro/index.php/en/about-moras, accessed on 9 July 2025), are to be thanked for their technical assistance throughout this experiment.

Conflicts of Interest

The authors declare no conflicts of interest.

References

  1. Yousefi, M.; Arianfar, A.; Hakimzadeh, V.; Rafe, A. Enhancing the Texture and Sensory Properties of Pickled Cucumbers with Different Brine Solutions. Foods 2025, 14, 336. [Google Scholar] [CrossRef]
  2. Knez, E.; Kadac-Czapska, K.; Grembecka, M. Fermented Vegetables and Legumes vs. Lifestyle Diseases: Microbiota and More. Life 2023, 13, 1044. [Google Scholar] [CrossRef]
  3. Bautista-Gallego, J.; Rantsiou, K.; Garrido-Fernández, A.; Cocolin, L.; Arroyo-López, F.N. Salt Reduction in Vegetable Fermentation: Reality or Desire? J. Food Sci. 2013, 78, R1095–R1100. [Google Scholar] [CrossRef]
  4. Panagou, E.Z.; Hondrodimou, O.; Mallouchos, A.; Nychas, G.-J.E. A Study on the Implications of NaCl Reduction in the Fermentation Profile of Conservolea Natural Black Olives. Food Microbiol. 2011, 28, 1301–1307. [Google Scholar] [CrossRef]
  5. Zinno, P.; Guantario, B.; Perozzi, G.; Pastore, G.; Devirgiliis, C. Impact of NaCl Reduction on Lactic Acid Bacteria during Fermentation of Nocellara Del Belice Table Olives. Food Microbiol. 2017, 63, 239–247. [Google Scholar] [CrossRef]
  6. Öztürk Güngör, F.; Özdestan Ocak, Ö.; Ünal, M.K. Effects of Different Preservation Methods and Storage on Spanish-Style Domat Olives Fermented with Different Chloride Salts. J. Food Process. Preserv. 2022, 46, e15236. [Google Scholar] [CrossRef]
  7. Mahdi, Z.A.; Al-Khatib, A.M.; Fneich, B. Replacement of Sodium Chloride by Potassium Chloride in Armenian Cucumber “Cucumis Melo Var. Flexuosu” Pickles: Sensory and Microbiological Evaluation. Middle East J. Appl. Sci. 2020, 10, 755–761. [Google Scholar] [CrossRef]
  8. Li, Z.; Xie, S.; Sun, B.; Zhang, Y.; Liu, K.; Liu, L. Effect of KCl Replacement of NaCl on Fermentation Kinetics, Organic Acids and Sensory Quality of Sauerkraut from Northeast China. J. Food Process. Preserv. 2022, 46, e16622. [Google Scholar] [CrossRef]
  9. Özer, C.; Yıldırım, H.K. Some Special Properties of Fermented Products with Cabbage Origin: Pickled Cabbage, Sauerkraut and Kimchi. Turk. J. Agric. Food Sci. Technol. 2019, 7, 490–497. [Google Scholar] [CrossRef]
  10. Salanță, L.-C.; Păucean, A.; Tofană, M.; Man, S.; Pop, C. Romanian Cuisine: Culinary Habits and Local Produce. J. Agroaliment. Process. Technol. 2015, 21, 186–191. [Google Scholar]
  11. Asale, Y.; Dessalegn, E.; Assefa, D.; Abdisa, M. Phytochemicals and Antioxidant Activity of Different Apple Cultivars Grown in South Ethiopia: Case of the Wolayta Zone. Int. J. Food Prop. 2021, 24, 354–363. [Google Scholar] [CrossRef]
  12. Boyer, J.; Liu, R.H. Apple Phytochemicals and Their Health Benefits. Nutr. J. 2004, 3, 5. [Google Scholar] [CrossRef]
  13. Delgado-Pelayo, R.; Gallardo-Guerrero, L.; Hornero-Méndez, D. Chlorophyll and Carotenoid Pigments in the Peel and Flesh of Commercial Apple Fruit Varieties. Food Res. Int. 2014, 65, 272–281. [Google Scholar] [CrossRef]
  14. Jia, K.-P.; Baz, L.; Al-Babili, S. From Carotenoids to Strigolactones. J. Exp. Bot. 2018, 69, 2189–2204. [Google Scholar] [CrossRef]
  15. ISO 1026:1982; Fruit and Vegetable Products—Determination of Dry Matter Content by Drying Under Reduced Pressure and of Water Content by Azeotropic Distillation. ISO: Geneva, Switzerland, 1982. Available online: https://www.iso.org/standard/5498.html (accessed on 3 July 2025).
  16. Zhou, Q.; Zheng, Z.; Li, L.; Gao, J.; Wu, Y.; Yang, F.; Zhong, K.; Gao, H. Effects of Variety on Quality and Taste of Spontaneous Fermented Dried Radish. Food Sci. Technol 2023, 43, e125322. [Google Scholar] [CrossRef]
  17. Constandache, D.; Andronoiu, D.-G.; Nistor, O.V.; Constantin, O.E.; Moraru, D.I.; Simionov, I.-A.; Botez, E.; Mocanu, G.-D. The Impact of Total Replacement of Sodium Chloride with Potassium and Magnesium Chloride on Pickling of Granny Smith Apples. Appl. Sci. 2025, 15, 3924. [Google Scholar] [CrossRef]
  18. Shan, B.; Cai, Y.Z.; Sun, M.; Corke, H. Antioxidant Capacity of 26 Spice Extracts and Characterization of Their Phenolic Constituents. J. Agric. Food Chem. 2005, 53, 7749–7759. [Google Scholar] [CrossRef]
  19. Escoto, D.F.; Ramborger, B.P.; Gayer, M.C.; Rodrigues, D.T.; Gasparoto Denardin, E.L.; Roehrs, R.; Roehrs, M. Lycopene Extraction and Analysis. In Lycopene: Food Sources, Potential Role in Human Health and Antioxidant Effects; Nova Science Publishers: New York, NY, USA, 2015; pp. 91–105. [Google Scholar]
  20. Gao, L.; Zhang, H.; Wang, H.; Li, A.-C.; Wu, M.; Wang, Q.-Z.; Zheng, Z.-A. Quality Evaluation and Browning Control in the Multi-Stage Processing of Mume Fructus (Wumei). Foods 2024, 13, 272. [Google Scholar] [CrossRef]
  21. Hien, T.T.; Truc, T.T.; Muoi, N.V. Effect of Salt Concentration and pH Value on the Lactic Fermentation Process of Kohlrabi (Brassica Oleracea L.). Res. Innov. Food Sci. Technol. 2022, 10, 399–412. [Google Scholar] [CrossRef]
  22. Chen, M.; Wang, X.; Liu, Y.; Li, P.; Wang, R.; Jiang, L. Discoloration Investigations of Yellow Lantern Pepper Sauce (Capsicum Chinense Jacq.) Fermented by Lactobacillus Plantarum: Effect of Carotenoids and Physiochemical Indices. Molecules 2022, 27, 7139. [Google Scholar] [CrossRef]
  23. Fadhil, R.; Hayati, R.; Agustina, R. Quality Characteristics of Sauerkraut from Cabbage (Brassica Oleracea) during Fermentation and Variation of Salt Concentration. Int. J. Sci. Technol. Res. 2019, 8, 2906–2909. [Google Scholar]
  24. Anoraga, S.B.; Sari, A.R.; Wikarta, J.; Sabarisman, I. Preliminary Study on the Fermentation Medium of the Black Garlic Production. IOP Conf. Ser. Earth Environ. Sci. 2021, 686, 012059. [Google Scholar] [CrossRef]
  25. Tang, Y.; Chen, G.; Wang, D.; Hu, R.; Li, H.; Liu, S.; Zhang, Q.; Ming, J.; Chi, Y. Effects of Dry-Salting and Brine-Pickling Processes on the Physicochemical Properties, Nonvolatile Flavour Profiles and Bacterial Community during the Fermentation of Chinese Salted Radishes. LWT 2022, 157, 113084. [Google Scholar] [CrossRef]
  26. Zong, K.; Jin, F.; Wang, D.; Hu, H.; Cui, H.; Yang, J. Effects of Different Pickling Methods on Physicochemical Properties and Flavor Profiles of Tongling White Ginger: Dry-Salting, Brine-Pickling, and Inoculation-Pickling. Food Sci. Nutr. 2024, 12, 2597–2610. [Google Scholar] [CrossRef]
  27. Chen, Y.; Gong, H.; Wang, J.; Liu, T.; Zhao, M.; Zhao, Q. Study on the Improvement of Quality Characteristics of Pickles During Fermentation and Storage. Foods 2024, 13, 3989. [Google Scholar] [CrossRef]
  28. Lee, D.-Y.; Park, S.-E.; Kim, E.-J.; Kim, H.-W.; Cho, K.-M.; Kwon, S.J.; Roh, S.W.; Kwak, S.; Whon, T.W.; Son, H.-S. A Comparative Study of the Physicochemical, Microbial, and Metabolic Profiling of Kimchi during Long-Term Fermentation Under Varying Salinity Conditions. LWT 2024, 196, 115838. [Google Scholar] [CrossRef]
  29. George, F.; Daniel, C.; Thomas, M.; Singer, E.; Guilbaud, A.; Tessier, F.J.; Revol-Junelles, A.-M.; Borges, F.; Foligné, B. Occurrence and Dynamism of Lactic Acid Bacteria in Distinct Ecological Niches: A Multifaceted Functional Health Perspective. Front. Microbiol. 2018, 9, 2899. [Google Scholar] [CrossRef]
  30. Di Cagno, R.; Coda, R.; De Angelis, M.; Gobbetti, M. Exploitation of Vegetables and Fruits through Lactic Acid Fermentation. Food Microbiol. 2013, 33, 1–10. [Google Scholar] [CrossRef]
  31. Wang, Y.; Wu, J.; Lv, M.; Shao, Z.; Hungwe, M.; Wang, J.; Bai, X.; Xie, J.; Wang, Y.; Geng, W. Metabolism Characteristics of Lactic Acid Bacteria and the Expanding Applications in Food Industry. Front. Bioeng. Biotechnol. 2021, 9, 612285. [Google Scholar] [CrossRef]
  32. Wang, E.; Lv, X.; Liu, S.; Dong, Q.; Li, J.; Li, H.; Su, B. A Selective Separation Mechanism for Mono/Divalent Cations and Properties of a Hollow-Fiber Composite Nanofiltration Membrane Having a Positively Charged Surface. Membranes 2024, 14, 1. [Google Scholar] [CrossRef]
  33. Francini, A.; Sodini, M.; Vicario, G.; Raffaelli, A.; Gucci, R.; Caruso, G.; Sebastiani, L. Cations and Phenolic Compounds Concentrations in Fruits of Fig Plants Exposed to Moderate Levels of Salinity. Antioxidants 2021, 10, 1865. [Google Scholar] [CrossRef] [PubMed]
  34. Martins, M.J.N.; Sanches, M.A.R.; Polachini, T.C.; de Oliveira, E.B.; Coimbra, J.S.d.R.; Telis-Romero, J. Solubility of Different Salts Used in the Control of the Water Activity of Foods. Ciênc. Agrotec. 2023, 47, e018722. [Google Scholar] [CrossRef]
  35. Jahnen-Dechent, W.; Ketteler, M. Magnesium Basics. Clin. Kidney J. 2012, 5, i3–i14. [Google Scholar] [CrossRef] [PubMed]
  36. Xie, Y.; Zhang, J. Chloride-Induced Stress Corrosion Cracking of Used Nuclear Fuel Welded Stainless Steel Canisters: A Review. J. Nucl. Mater. 2015, 466, 85–93. [Google Scholar] [CrossRef]
  37. Ajila, C.M.; Brar, S.K.; Verma, M.; Tyagi, R.D.; Valéro, J.R. Solid-State Fermentation of Apple Pomace Using Phanerocheate chrysosporium—Liberation and Extraction of Phenolic Antioxidants. Food Chem. 2011, 126, 1071–1080. [Google Scholar] [CrossRef]
  38. Charde, M.; Chakole, R.D.; Ahmed, A. Apple phytochemicals for human benefits. Int. J. Pharmacol. Res. 2011, 1, 40–55. [Google Scholar] [CrossRef]
  39. Gao, Y.; Zhou, H.; Wang, Y.; Nussio, L.G.; Yang, F.; Ni, K. Insights into Fermentation with Lactic Acid Bacteria on the Flavonoids Biotransformation of Alfalfa Silage. Chem. Biol. Technol. Agric. 2024, 11, 73. [Google Scholar] [CrossRef]
  40. Ahrazem, O.; Gómez-Gómez, L.; Rodrigo, M.J.; Avalos, J.; Limón, M.C. Carotenoid Cleavage Oxygenases from Microbes and Photosynthetic Organisms: Features and Functions. Int. J. Mol. Sci. 2016, 17, 1781. [Google Scholar] [CrossRef]
  41. Rodriguez-Concepcion, M.; Avalos, J.; Bonet, M.L.; Boronat, A.; Gomez-Gomez, L.; Hornero-Mendez, D.; Limon, M.C.; Meléndez-Martínez, A.J.; Olmedilla-Alonso, B.; Palou, A.; et al. A Global Perspective on Carotenoids: Metabolism, Biotechnology, and Benefits for Nutrition and Health. Prog. Lipid Res. 2018, 70, 62–93. [Google Scholar] [CrossRef]
  42. Mapelli-Brahm, P.; Barba, F.J.; Remize, F.; Garcia, C.; Fessard, A.; Mousavi Khaneghah, A.; Sant’Ana, A.S.; Lorenzo, J.M.; Montesano, D.; Meléndez-Martínez, A.J. The Impact of Fermentation Processes on the Production, Retention and Bioavailability of Carotenoids: An Overview. Trends Food Sci. Technol. 2020, 99, 389–401. [Google Scholar] [CrossRef]
  43. Cakir, M.A.; Helvacioglu, I. Bioavailability and Health Effects of Some Carotenoids by Different Cooking Methods. Int. J. Gastron. Res. 2023, 2, 70–77. [Google Scholar] [CrossRef]
  44. Pérez-Llorca, M.; Muñoz, P.; Müller, M.; Munné-Bosch, S. Biosynthesis, Metabolism and Function of Auxin, Salicylic Acid and Melatonin in Climacteric and Non-Climacteric Fruits. Front. Plant Sci. 2019, 10, 136. [Google Scholar] [CrossRef]
  45. Yoo, K.M.; Hwang, I.K.; Eog Jr, G.; Moon, B. Effects of Salts and Preheating Temperature of Brine on the Texture of Pickled Cucumbers. J. Food Sci. 2006, 71, C97–C101. [Google Scholar] [CrossRef]
  46. Gu, Y.S.; Howard, L.R.; Wagner, A.B. Physicochemical Factors Affecting Firmness of Pasteurized Jalapeno Pepper Rings. J. Food Qual. 1999, 22, 619–629. [Google Scholar] [CrossRef]
  47. Llorca, E.; Puig, A.; Hernando, I.; Salvador, A.; Fiszman, S.M.; Lluch, M.A. Effect of Fermentation Time on Texture and Microstructure of Pickled Carrots. J. Sci. Food Agric. 2001, 81, 1553–1560. [Google Scholar] [CrossRef]
  48. Adebo, O.A.; Gabriela Medina-Meza, I. Impact of Fermentation on the Phenolic Compounds and Antioxidant Activity of Whole Cereal Grains: A Mini Review. Molecules 2020, 25, 927. [Google Scholar] [CrossRef]
  49. Leonard, W.; Zhang, P.; Ying, D.; Adhikari, B.; Fang, Z. Fermentation Transforms the Phenolic Profiles and Bioactivities of Plant-Based Foods. Biotechnol. Adv. 2021, 49, 107763. [Google Scholar] [CrossRef]
  50. McFeeters, R.F.; Pérez-Díaz, I. Fermentation of Cucumbers Brined with Calcium Chloride Instead of Sodium Chloride. J. Food Sci. 2010, 75, C291–C296. [Google Scholar] [CrossRef]
  51. Hayek, S.A.; Ibrahim, S.A. Current Limitations and Challenges with Lactic Acid Bacteria: A Review. FNS 2013, 4, 73–87. [Google Scholar] [CrossRef]
  52. Alvanoudi, P.; Ordoudi, S.A.; Nakas, A.; Assimopoulou, A.N.; Mantzouridou, F.T. Brine Volatilome Changes Along the Spontaneous Fermentation of Spanish-Style Cv. Chalkidiki Green Olives Under High and Low NaCl Conditions. Food Bioprocess. Technol. 2024, 17, 1462–1478. [Google Scholar] [CrossRef]
Figure 1. Variation of dry matter in apple pickles during fermentation interval. The values on the same line marked with different letters are different in a statistically significant manner (p < 0.05).
Applsci 15 07799 g001
Figure 2. The changes in titratable acidity in apple pickle fermentation with different brine solutions. The values on the same line marked with different letters are different in a statistically significant manner (p < 0.05).
Applsci 15 07799 g002
Figure 3. Changes in salinity in apple pickle fermentation with different brine solutions. The values on the same line marked with different letters are different in a statistically significant manner (p < 0.05).
Applsci 15 07799 g003
Figure 4. Variation in carbohydrate content: reducing simple carbohydrates and fermentable sugars (a) and reducing and fermentable uronic acids (b) in fermented apple (Malus domestica) samples in different brine solutions. The values on the same line marked with different letters are different in a statistically significant manner (p < 0.05).
Applsci 15 07799 g004
Figure 5. The dynamics of metallic ion concentrations in apple peel during the experimental trial. n.s. means not significant.
Applsci 15 07799 g005
Figure 6. Total color difference (ΔE) in apple pickle fermentation with different brine solutions. The values on the same line marked with different letters are different in a statistically significant manner (p < 0.05).
Applsci 15 07799 g006
Figure 7. Dendrogram of clustering apple samples fermented in magnesium, potassium and sodium chloride brine.
Applsci 15 07799 g007
Table 1. Mass differences between fresh and pickled apple samples (%).
7 Days14 Days21 Days28 Days35 Days
NaCl0 ± 0.01 A−0.33 ± 0.02 B−0.97 ± 0.01 C−1.26 ± 0.02 D0.94 ± 0.02 E
KCl0 ± 0.01 A−0.24 ± 0.01 B−1.25 ± 0.02 B−1.01 ± 0.02 C−0.67 ± 0.02 D
MgCl20 ± 0.02 A−0.32 ± 0.01 B−1.25 ± 0.01 C−2.10 ± 0.01 D−0.97 ± 0.01 E
The values on the same line marked with different letters are different in a statistically significant manner (p < 0.05).
Table 2. The dynamics of cation concentrations in the brine during the experimental trial (expressed as mg/L).
Fermentation IntervalKClNaClMgCl2
7 days5.71 ± 0.01 a14.00 ± 0.09 a97.3 ± 1.63 a
14 days4.56 ± 0.03 a15.31 ± 0.17 a,d59.0 ± 4.15 b
21 days7.50 ± 0.009 a,b21.02 ± 0.08 b55.4 ± 2.93 c
28 days7.25 ± 0.03 a17.71 ± 0.17 c,d42.8 ± 1.63 d
35 days10.41 ± 0.10 b12.5 ± 0.24 a78.6 ± 1.22 e
Values with different letters in a column indicate significant differences (p < 0.05) among experimental variants.
Table 3. The values of phytochemical compound determinations.
Fermentation Time, DaysPhytochemical Compounds
TPC mg GAE/g d.w.TFC, mg EQ/g d.w.TC, mg/g d.w.β-Carotene, mg/g d.w.Lycopene, mg/g d.w.Chl, μg/g d.w.
NaCl
05.95 ± 0.63 E7.23 ± 0.30 E1.59 ± 0.01 D1.03 ± 0.00 B,C0.45 ± 0.05 E15.40 ± 0.00 B
710.93 ± 0.58 D9.57 ± 0.40 D1.89 ± 0.21 B,C1.12 ± 0.00 A0.57 ± 0.07 C,D16.60 ± 0.00 A
1411.85 ± 0.77 C12.30± 0.43 C2.04 ± 0.07 A,B1.25 ± 0.00 A0.67 ± 0.04 B15.70 ± 0.12 B
2112.32 ± 0.38 B,C13.04 ± 0.39 B2.16 ± 0.01 A1.07 ± 0.02 A,B0.82 ± 0.00 A14.30 ± 0.00 C
2813.65 ± 0.17 B13.34 ± 0.79 A1.70 ±0.02 C0.95 ± 0.02 B,C0.66 ± 0.01 C14.00 ± 0.14 C
3519.88 ± 0.41 A15.26 ± 0.42 A1.32 ± 0.09 D0.76 ± 0.02 C0.52 ± 0.01 D16.30 ± 0.00 A
KCl
78.69 ± 0.32 D8.03 ± 0.35 D2.25 ± 0.26 B,C1.46 ± 0.02 A0.63 ± 0.00 C,D15.60 ± 0.00 A
1412.34 ± 0.43 C10.44 ± 0.12 C2.56 ± 0.01 A,B1.35 ± 0.13 A0.74 ± 0.08 B15.00 ± 0.03 B
2115.65 ± 0.21 B,C13.02 ± 0.20 B2.64 ± 0.02 A1.24 ± 0.01 A,B0.90 ± 0.00 A14.00 ± 0.00 C
2816.52 ± 0.44 B16.24 ± 0.13 A1.90 ± 0.03 C1.16 ± 0.00 B,C0.68 ± 0.01 C13.50 ± 0.00 C
3516.81 ± 0.76 A16.30 ± 0.33 A1.52 ± 0.02 D1.01 ± 0.01 C0.48 ± 0.01 D16.70 ± 0.01 A
MgCl2
79.23 ± 0.37 D9.21 ± 0.50 D2.24 ± 0.14 B,C1.44 ± 0.00 A0.65 ± 0.00 C,D18.20 ± 0.00 A
1413.04 ± 0.32 C12.08 ± 0.77 C2.30 ± 0.04 A,B1.40 ± 0.02 A0.87 ± 0.01 B14.00 ± 0.14 B
2114.02 ± 0.76 B,C13.49± 0.93 B2.43 ± 0.05 A1.28 ± 0.00 A,B0.93 ± 0.01 A13.80 ± 0.14 C
2815.27 ± 0.32 B13.77 ± 0.21 A1.99 ± 0.05 C1.25 ± 0.00 B,C0.67 ± 0.01 C13.40 ± 0.14 C
3516.53 ± 0.21 A15.21 ± 0.61 A1.80 ± 0.11 D1.09 ± 0.01 C0.67 ± 0.01 D16.60 ± 0.01 A
TPC—total phenolic content; TFC—total flavonoids content; TC—total carotenoids; Chl—chlorophyll. The values on the same line marked with different letters exhibit statistically significant differences (p < 0.05).
Table 4. Values of textural parameters during fermentation.
Days of
Fermentation
0714212835
NaCl
Firmness, N2.53 ± 0.08 A2.13 ± 0.02 B2.01 ± 0.04 B0.95 ± 0.02 C0.93 ± 0.01 C0.95 ± 0.02 C
Cohesiveness0.64 ± 0.01 A0.52 ± 0.01 B0.48 ± 0.02 C0.45 ± 0.01 D0.45 ± 0.01 D0.45 ± 0.01 D
Springiness, mm2.53 ± 0.01 A2.16 ± 0.06 B1.98 ± 0.02 C1.47 ± 0.03 D1.46 ± 0.03 D1.44 ± 0.01 D
Chewiness, mJ4.27 ± 0.04 A3.12 ± 0.04 B2.17 ± 0.04 C1.06 ± 0.02 D1.05 ± 0.02 D1.03 ± 0.01 D
KCl
Firmness, N2.53 ± 0.08 A2.06 ± 0.04 B1.93 ± 0.09 B0.73 ± 0.02 C0.72 ± 0.02 C0.72 ± 0.02 C
Cohesiveness0.64 ± 0.01 A0.50 ± 0.01 B0.46 ± 0.02 C0.41 ± 0.02 D0.40 ± 0.02 D0.40 ± 0.01 D
Springiness, mm2.53 ± 0.01 A2.07 ± 0.07 B1.82 ± 0.04 C1.26 ± 0.05 D1.24 ± 0.03 D1.25 ± 0.02 D
Chewiness, mJ4.27 ± 0.04 A3.03 ± 0.08 B1.92 ± 0.08 C0.74 ± 0.01 D0.74 ± 0.01 D0.73 ± 0.04 D
MgCl2
Firmness, N2.53 ± 0.08 A2.11 ± 0.05 B2.00 ± 0.04 B1.12 ± 0.02 C1.12 ± 0.02 C1.11 ± 0.02 C
Cohesiveness0.64 ± 0.01 A0.51 ± 0.01 B0.47 ± 0.01 C0.45 ± 0.01 D0.44 ± 0.02 D0.44 ± 0.02 D
Springiness, mm2.53 ± 0.01 A2.18 ± 0.05 B1.99 ± 0.04 C1.49 ± 0.02 D1.47 ± 0.01 D1.49 ± 0.05 D
Chewiness, mJ4.27 ± 0.04 A3.14 ± 0.06 B2.09 ± 0.09 C1.03 ± 0.02 D1.02 ± 0.02 D1.02 ± 0.05 D
The values on the same line marked with different letters show statistically significant differences (p < 0.05).
Table 5. Color parameters of apple flesh samples (fresh and pickled).
ParameterFermentation Intervals, Days
0714212835
NaCl
L*69.19 ± 0.77 D74.00 ± 0.31 A72.82 ± 0.84 A,B72.26 ± 0.53 B,C70.98 ± 0.58 C,D69.09 ± 0.77 D
a*6.05 ± 0.57 A3.92 ± 0.39 B2.65 ± 0.11 C2.59 ± 0.15 C,D2.48 ± 0.29 D2.35 ± 0.14 D
b*30.51 ± 0.18 A26.79 ± 0.52 B26.24 ± 0.40 B25.61 ± 0.45 B,C24.08 ± 0.86 C,D22.32 ± 0.87 D
C*31.11 ± 0.29 A27.07 ± 0.56 B26.37 ± 0.41 B,C25.74 ± 0.46 C,D24.21 ± 0.87 D,E22.45 ± 0.87 E
h*78.79 ± 0.97 C81.67 ± 0.69 B84.22 ± 0.16 A84.23 ± 0.29 A84.12 ± 0.62 A83.98 ± 0.34 A
BI63.09 ± 1.99 A47.83 ± 1.19 B46.29 ± 1.36 B45.36 ± 1.41 B,C43.12 ± 1.30 C,D40.69 ± 2.17 D
WI56.21 ± 0.75 B62.46 ± 0.23 A62.12 ± 0.35 A62.16 ± 0.69 A62.21 ± 0.76 A61.78 ± 0.48 A
YI63.01 ± 1.08 A51.71 ± 0.82 B51.48 ± 0.34 B,C50.64 ± 1.23 B,C48.50 ± 1.77 C,D46.18 ± 2.01 D
KCl
L*69.19 ± 0.77 D72.19 ± 0.77 A71.89 ± 0.31 A,B70.99 ± 0.87 B,C69.34 ± 0.69 C,D67.20 ± 1.09 D
a*6.05 ± 0.57 A3.72 ± 0.12 B2.84 ± 0.39 C2.41 ± 0.26 C,D2.39 ± 0.20 D2.13 ± 0.10 D
b*30.51 ± 0.18 A26.37 ± 0.78 B25.87 ± 0.52 B24.27 ± 0.27 B,C23.58 ± 0.87 C,D22.78 ± 1.11 D
C*31.11 ± 0.29 A26.63 ± 0.78 B26.03 ± 0.55 B,C24.39 ± 0.29 C,D23.70 ± 0.89 D,E22.88 ± 1.10 E
h*78.79 ± 0.97 C81.98 ± 0.14 B83.74 ± 0.76 A84.34 ± 0.57 A84.22 ± 0.30 A84.65 ± 0.39 A
BI63.09 ± 1.99 A48.21 ± 1.59 B46.47 ± 1.50 B43.35 ± 1.33 B,C43.15 ± 1.34 C,D42.76 ± 1.77 D
WI56.21 ± 0.75 B61.49 ± 0.59 A61.68 ± 0.46 A62.09 ± 0.49 A61.25 ± 0.64 A60.00 ± 0.53 A
YI63.01 ± 1.08 A52.18 ± 1.39 B51.42 ± 1.09 B,C48.83 ± 1.43 B,C48.58 ± 2.07 C,D48.42 ± 1.78 D
MgCl2
L*69.19 ± 0.77 D74.50 ± 1.14 A73.39 ± 0.49 A,B73.11 ± 0.26 B,C71.40 ± 0.58 C,D70.81 ± 0.77 D
a*6.05 ± 0.57 A4.17 ± 0.16 B2.98 ± 0.48 C2.74 ± 0.19 C,D2.30 ± 0.21 D2.16 ± 0.19 D
b*30.51 ± 0.18 A27.12 ± 0.12 B26.40 ± 0.14 B26.19 ± 0.17 B,C25.02 ± 0.77 C,D24.38 ± 0.63 D
C*31.11 ± 0.29 A27.44 ± 0.12 B26.57 ± 0.18 B,C26.34 ± 0.17 C,D25.13 ± 0.76 D,E24.48 ± 0.62 E
h*78.79 ± 0.97 C81.26 ± 0.34 B83.56 ± 0.99 A84.04 ± 0.41 A84.75 ± 0.49 A84.94 ± 0.47 A
BI63.09 ± 1.99 A48.37 ± 0.86 B46.52 ± 0.45 B46.06 ± 0.46 B,C44.50 ± 1.37 C,D43.45 ± 1.14 D
WI56.21 ± 0.75 B62.53 ± 0.72 A62.40 ± 0.25 A62.36 ± 0.24 A61.93 ± 0.79 A61.90 ± 0.57 A
YI63.01 ± 1.08 A52.01 ± 0.61 B51.39 ± 0.23 B,C51.19 ± 0.43 B,C50.07 ± 0.75 C,D49.19 ± 1.18 D
The values on the same line marked with different letters show statistically significant differences (p < 0.05).
Table 6. Pearson correlation coefficients (r) between sample physicochemical characteristics.
Brine
Sol.
VariablesReducing
Sugars
Fermentable
Sugars
Reducing
Uronic Acids
Fermentable
Uronic Acid
Lactic AcidTotal PolyphenolsTotal FlavonoidsFirmnessCohesi-veness
NaClReducing sugars1
KCl1
MgCl21
NaClFermentable sugars0.9051
KCl0.8671
MgCl20.9121
NaClReducing uronic acids0.8880.9841
KCl0.9620.8621
MgCl20.8590.8541
NaClFermentable
uronic acids
0.9190.8990.8681
KCl0.9690.9220.9181
MgCl20.8460.9520.7241
NaClLactic acid−0.928−0.958−0.909−0.9531
KCl−0.922−0.955−0.942−0.9601
MgCl2−0.951−0.945−0.859−0.8421
NaClTotal polyphenols−0.842−0.928−0.884−0.8600.9641
KCl−0.961−0.891−0.984−0.9230.9521
MgCl2−0.985−0.884−0.860−0.7750.9701
NaClTotal flavonoids−0.787−0.951−0.936−0.8950.9250.9221
KCl−0.951−0.930−0.971−0.9670.9870.9571
MgCl2−0.981−0.908−0.897−0.7890.9740.9951
NaClFirmness0.8620.8870.9270.915−0.847−0.778−0.8911
KCl0.9840.8800.9700.934−0.908−0.964−0.9431
MgCl20.9240.8400.9740.732−0.878−0.920−0.9371
NaClCohesiveness0.6080.8870.8350.771−0.772−0.817−0.9360.8571
KCl0.8620.8750.9010.809−0.877−0.952−0.8560.8991
MgCl20.9190.6940.7540.671−0.840−0.945−0.9230.8631
Values are different from 0 with a significance level p = 0.05.
Disclaimer/Publisher’s Note: The statements, opinions and data contained in all publications are solely those of the individual author(s) and contributor(s) and not of MDPI and/or the editor(s). MDPI and/or the editor(s) disclaim responsibility for any injury to people or property resulting from any ideas, methods, instructions or products referred to in the content.

