1. Introduction
As digital transformation accelerates across the manufacturing industry, there is growing interest in predicting and mitigating process bottlenecks to maintain high throughput and yield. Because production time and yield directly impact profitability, any single task that becomes a bottleneck can severely degrade overall factory performance.
Manufacturing processes form complex networks of tasks that exchange intermediate products. Each task receives inputs from one or more preceding tasks, performs its operation, and forwards its outputs to its follower. Although many processes are automated, cycle times can still vary for various reasons, particularly in operations like garment assembly, which continue to rely on manual labor. Accurately forecasting which task will become a bottleneck ahead is vital for maintaining throughput of manufacturing processes. For example, managers can take proactive measures, such as allocating additional workers to the precarious tasks, to avoid potential bottleneck by anticipating them.
In practice, most production facilities lack high-performance servers and instead deploy low-cost, resource-constrained devices: for instance, embedded devices. Complex algorithms that require substantial computing power are therefore impractical, while prediction latency is crucial to prevent production delays from bottlenecks. Thus, bottleneck prediction should run efficiently on embedded devices.
To address these challenges, we propose MicroForest, a method to compress multiple random forests into a compact forest-based model. Researches on compressing random forests has been carried out with various approaches, including boosting-based methods [
1,
2] and knowledge distillation [
3]. However, we observed that such methods do not outperform others in all aspects for the given manufacturing process scenarios, particularly when simultaneous multi-task prediction is required. In this paper, we focus on bottleneck prediction performance, model size, and inference latency so as to exploit the bottleneck prediction in manufacturing processes even with resource-constrained edge devices.
We first model the manufacturing process as a directed graph with nodes that represent tasks and edges that represent flows of products. Random forests are trained to predict which task will bottleneck after a certain number of cycles. Then, high-information-gain nodes from those random forests are selected in order to build a compact and ready-to-deploy decision tree. This paper proposes MicroForest for collecting those decision trees.
To demonstrate the efficacy of the proposed method, we compared MicroForest with recent works and achieved up to faster inference latency compared to the original random forest even though it has the highest prediction performance against them.
This paper makes the following key contributions:
We propose MicroTree, an effective random forest compression technique for bottleneck prediction in manufacturing process. MicroTree is built upon a set of high-information-gain nodes in the random forest, by which we generate a ready-to-deploy compact model without fine-tuning.
MicroForest architecture is proposed, which employs multiple MicroTrees to predict multiple bottlenecks across many manufacturing tasks simultaneously.
An extensive evaluation against four different models was conducted to test efficacy of the proposed method, and MicroForest achieves by up to latency reduction as well as the highest recall performance.
We evaluated the generality of the proposed method by applying it to several other classification tasks and experimentally confirmed its exceptional effectiveness for the specific problem of bottleneck prediction in manufacturing processes.
The remainder of this paper is organized as follows.
Section 2 reviews related studies. Then, we present our motivation and necessary background in
Section 3.
Section 4 details the proposed method called MicroForest. We evaluate the performance of MicroForest in
Section 5. Finally, we conclude in
Section 6.
2. Related Work
Random forest-based models are widely [
4,
5,
6,
7] used as they deliver strong predictive performance. However, their high resource requirements impede deployment on embedded systems and mobile devices where compute and memory budgets are tight. Many works have tried to preserve the accuracy of random forests while improving their efficiency in terms of model size and inference speed. One representative method is pruning, which removes some leaf nodes or sub-trees with a contribution to prediction that is marginal [
8,
9,
10,
11]. However, these schemes often leave inefficient or non-informative nodes at intermediate levels untouched, and the overall optimization effect can be limited.
A second approach exploits feature-importance statistics obtained during training or by post hoc analysis. Importance can be measured by impurity reduction or by the drop in accuracy when a feature is permuted [
12,
13,
14]. As a result, only the top-N features are retained, and a smaller forest is re-trained on this subset, yielding compact models and potential speed-ups by eliminating low-relevance or redundant variables.
In addition, gradient boosting-based ensembles such as LightGBM [
1] and XGBoost [
2] can build trees with efficiency as an another design goal. They adopt leaf-wise expansion that splits the leaf with the largest contribution in reducing loss. LightGBM combines this with Gradient-based One-Side Sampling (GOSS) and Exclusive Feature Bundling (EFB) to train faster than a conventional forest [
1]. XGBoost achieves a speed-up of up to a ten times by approximate split finding and aggressive parallelization [
2]. Also, there are explicit compression schemes and model-distillation methods that cut model size without significant accuracy loss [
15,
16].
These works aim to improve the performance of random forests by adopting better training method or by making forest efficient. On the other hand, there is a line of work that aim to transfer the knowledge of a large, accurate model (the teacher) into a smaller, more efficient student, which are called knowledge-distillation approaches. In this teacher–student architecture, the student is trained to mimic the teacher’s soft labels rather than the hard class assignments, thereby exploiting richer information [
3,
17,
18,
19]. A straightforward method is to set a trained random forest as the teacher and a single decision tree as the student; the tree is fitted so that, for any input, it reproduces the forest’s soft outputs. One study identifies decision paths with the largest Gini-impurity reductions and encodes whether a sample satisfies each path as a binary feature; these features are then used to train a separate model (e.g., a decision tree) [
20,
21]. Another work extracts core nodes, which are jointly based on impurity reduction and balance of split, and converts each into a stump, and feeds the stump outputs into a logistic regression layer that learns their relative importance, yielding a compact yet accurate surrogate [
22].
Overall, many works have been proposed to make random forests simple and efficient, but optimizing individual forests still falls short when a system must predict multiple tasks at the same time. First, even those optimized forests need one model per task, so the set of multiple models consume significant memory on embedded hardware. Second, separate models cannot effectively integrate cross-task information, leaving untapped the potentially informative relationship among tasks [
23].
We address these gaps with MicroForest: a compressed tree model distilled from multiple source forests. This unified model enables fast bottleneck prediction across all tasks in manufacturing process on resource-constrained devices.
3. Background and Motivation
In this section, we present the theoretical background and our observation that motivates this study.
3.1. Decision Tree and Random Forest Structure
A decision tree is a hierarchical model that recursively partitions the feature space via binary tests. Each node is associated with a feature
f and a threshold
, defining two child subsets from given a dataset
D:
The optimal split
at each node maximizes information gain
:
Note that the information gain
is defined as
where
denotes the entropy of
D.
Leaf nodes assign class labels based on the majority of samples reaching that leaf.
A random forest is an ensemble of many decision trees, each trained on a bootstrap sample of the data and considering a random subset of features. At inference time, classification is performed by majority voting across all trees. This combination of bagging and randomized feature sampling improves generalization compared to a single decision tree. However, they exhibit two inherent limitations in resource-constrained environments. First, their model size and memory footprint are substantial: storing hundreds of decision trees consumes significant memory space. Second, their inference latency is high: predicting with a new data requires traversing and aggregating outputs from every tree in the ensemble, resulting in longer response times compared to single models (e.g., a single decision tree or a linear classifier). Consequently, random forests are often unsuitable for edge or embedded systems, where both memory and computational resources are limited.
3.2. Motivation
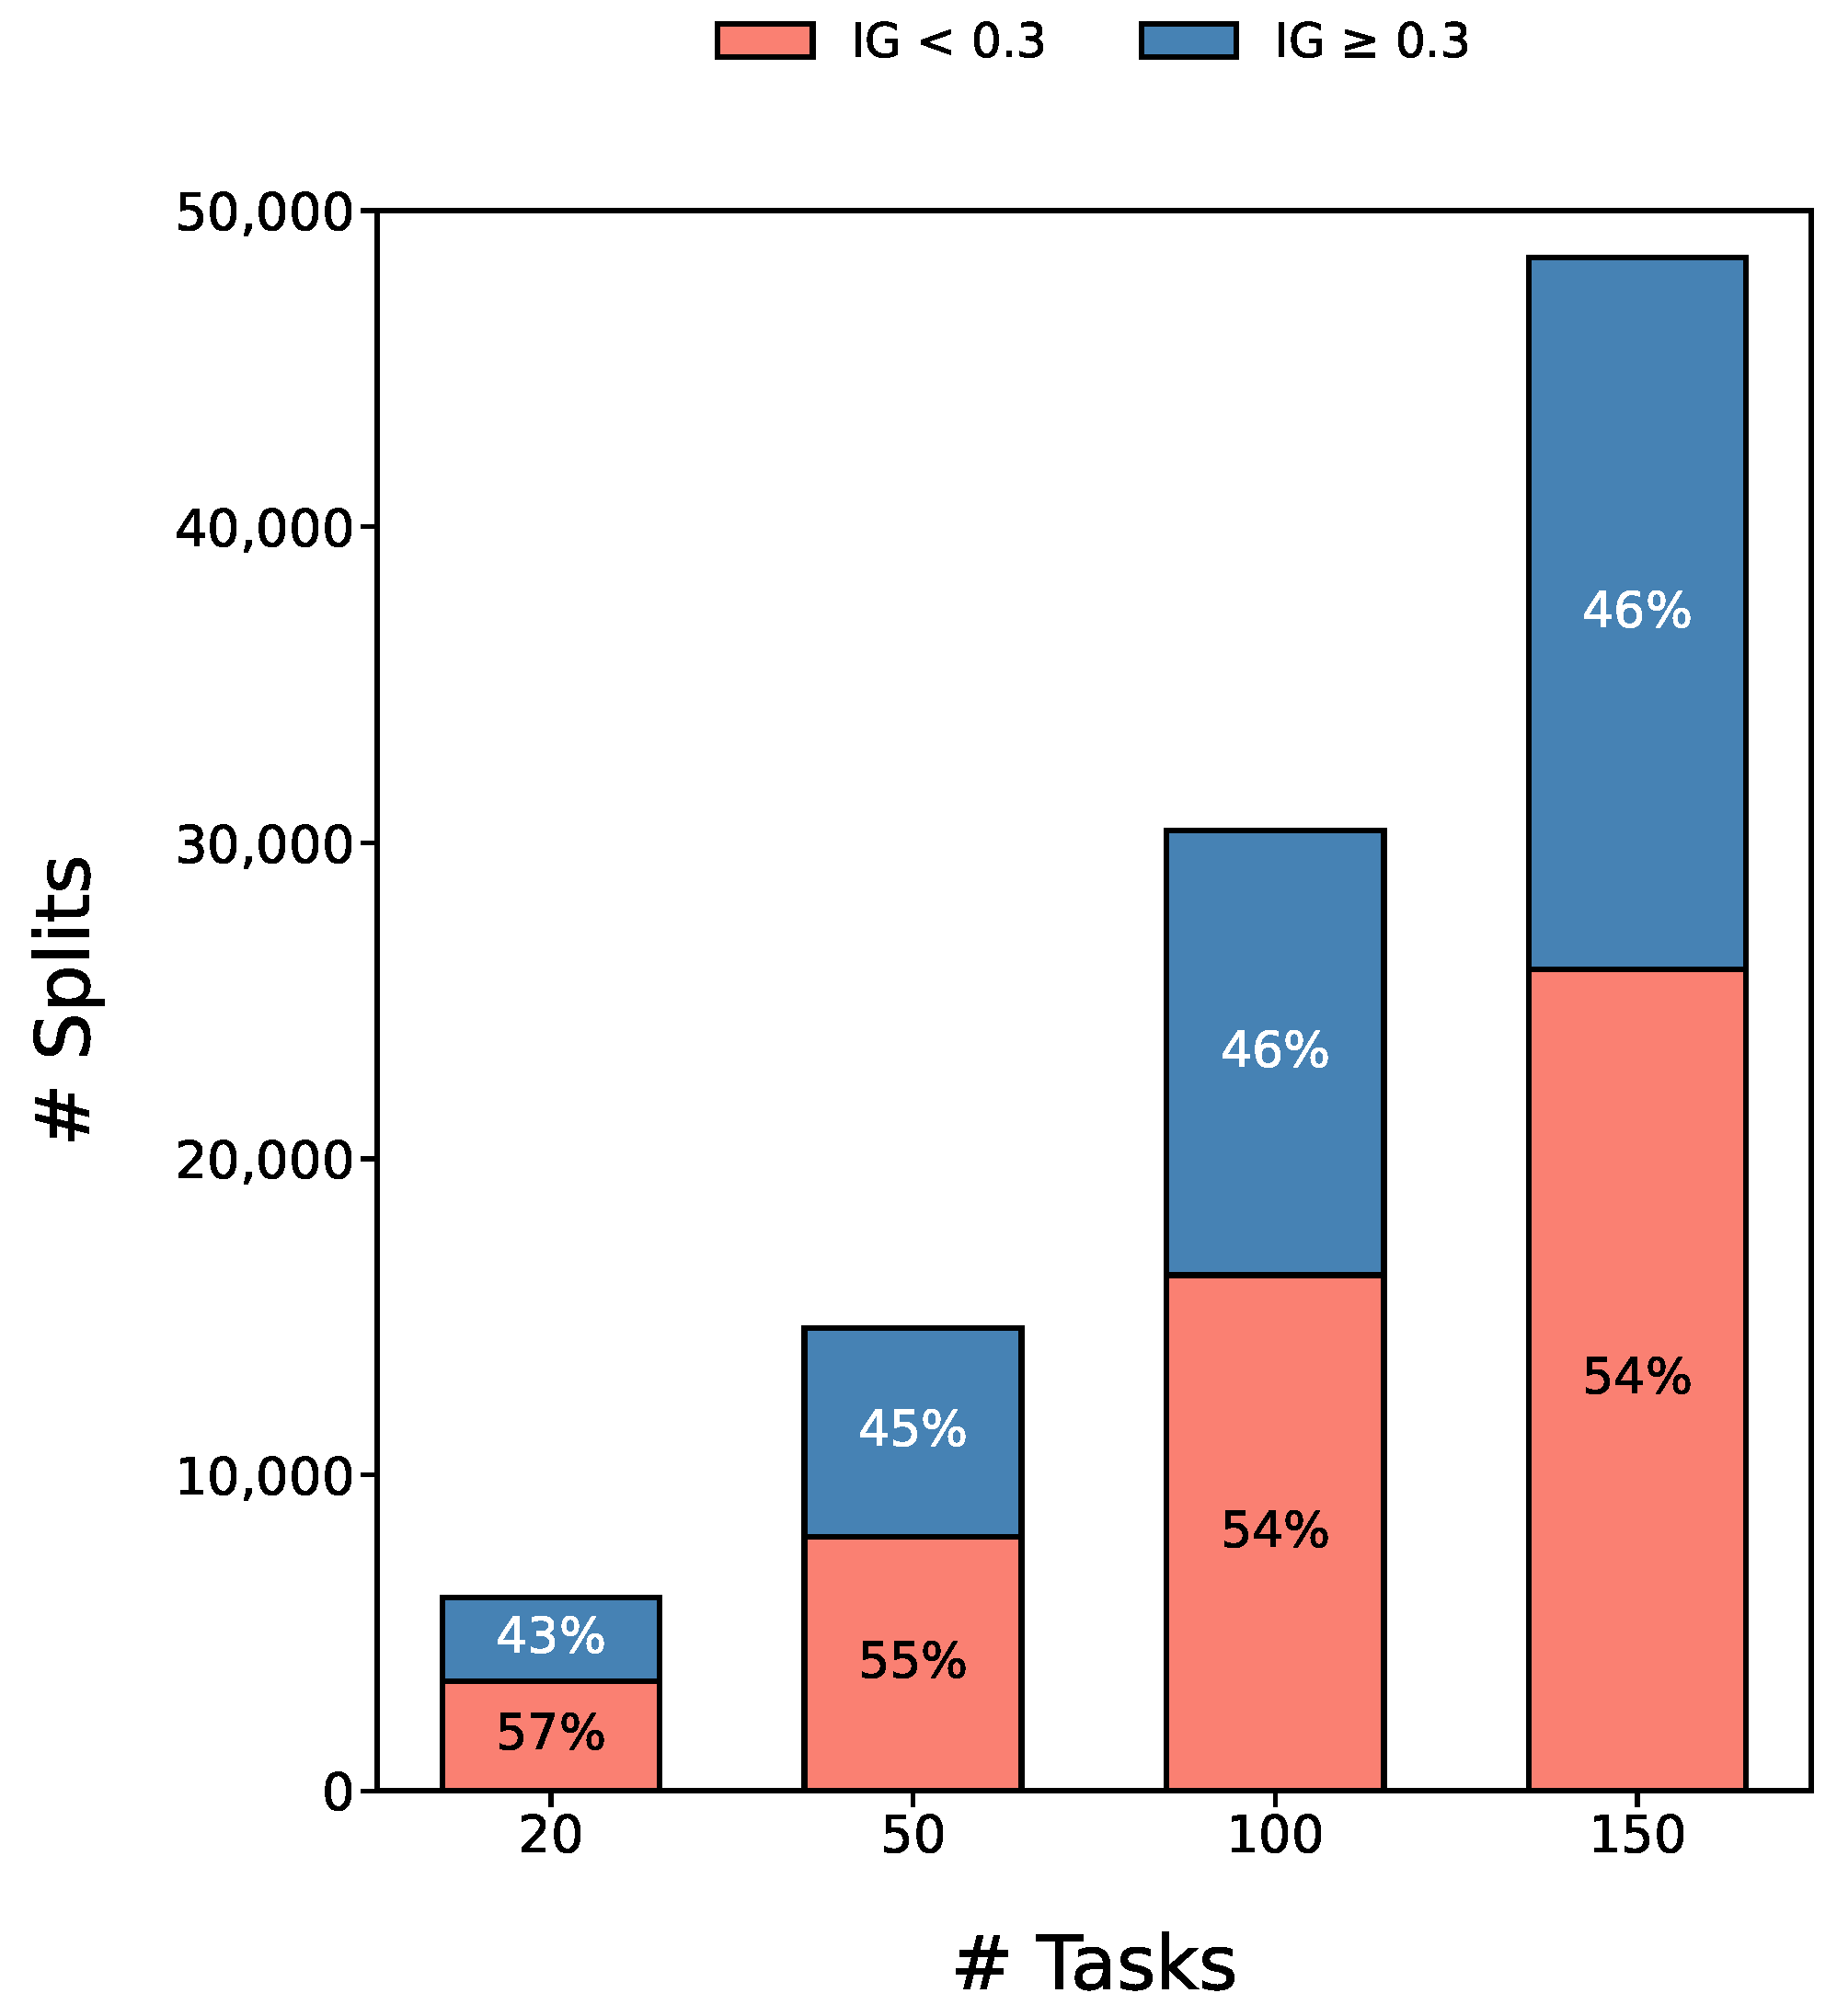
Figure 1 summarizes our observation: many nodes in random forests are not crucial. Although random forests achieve high accuracy by aggregating hundreds of trees, many of their decision nodes contribute negligibly to overall prediction results. These low-gain splits inflate model size and inference latency without meaningfully improving classification performance. In our analysis of a trained forest on manufacturing simulation data, it is observed that nearly 55% of all nodes have information gain below 0.3 regardless to the complexity of tasks, as shown in
Figure 1.
This finding motivates us: by selecting only those feature–threshold pairs with splits that exceed a high information-gain threshold, it is able to compress the entire forest into a single, compact tree. The resulting model preserves most of the original accuracy while dramatically reducing memory footprint and inference time on resource-constrained embedded devices.
4. Proposed Method
This work proposes a lightweight model for efficient prediction of bottlenecks in manufacturing processes. Because production sites seldom have access to high-end computing resources, the model must run quickly and efficiently on edge devices.
4.1. Manufacturing Process Modeling
Before delving into the proposed method, we first define the manufacturing process simulation problem that this paper aims to solve.
We model the manufacturing workflow as a Directed Acyclic Graph (DAG) , where each node represents a distinct production task, and each directed edge denotes the flow of an intermediate product from one task to another. The entire process is simulated in discrete time steps (i.e., cycles), yielding a cycle-accurate view of material movements and task throughput.
Once the number of tasks and the relationship between tasks are given, the simulation is parameterized by two input sets: buffer levels and cycle times. Each edge e has an initial buffer level specifying the quantity of intermediate product in transit. The cycle time for each task n denotes the number of cycles required to process one unit. Although cycle times may vary in real manufacturing scenarios, we treat them as fixed for simplicity.
At each cycle, every task examines its incoming edges; if all required buffers contain sufficient material, it consumes one unit from each and produces one unit of output after its cycle time elapses. The output is then enqueued on the task’s outgoing edges. The simulator records, per cycle, (a) cumulative production per task, (b) current buffer occupancy per edge, and (c) which task(s), if any, have become bottlenecks due to buffer starvation or processing delays. This cycle-level simulation enables precise determination of both the timing and the location at which bottlenecks arise.
With the cycle-level simulation, we pose the bottleneck prediction problem as follows. Given a user-specified horizon of cycles, the model must decide, for every task , whether that task will become a bottleneck at cycle based on the system state observed at cycle t. Because the manufacturing process network contains N distinct tasks, the simulator generates N prediction queries per decision, each of which is a binary decision (“bottleneck” or “non-bottleneck”).
For illustration,
Figure 2 depicts a simple manufacturing workflow comprising nine tasks. Each node is labeled with its task index and the cumulative count of intermediate products it has produced, while the numbers on the edges indicate the quantity of product currently buffered along each connection. In this example, three tasks (highlighted in red) act as the bottleneck because it receives no input from its predecessor.
4.2. Overview
We propose MicroForest, a lightweight bottleneck prediction method for manufacturing process.
Figure 3 shows the overview of MicroForest.
Given multiple random forests which are trained to predict the bottleneck of each task, SplitSelector creates a Split Pool by selecting (feature-threshold) pairs with information gain that is high. Then, MTConstructor builds new compact decision trees called MicroTree by searching only within Split Pool for each group of tasks. As a result, each MicroTree is constructed from multiple-source random forests; the ensemble of these MicroTrees constitutes the proposed MicroForest. It is notable that, while random forests leverage ensemble effects to improve a single classification task, each MicroTree in a MicroForest operates independently to predict the bottleneck of a distinct task.
4.3. Building MicroForest
In this section, we explain the modules introduced in
Section 4.2 in more detail.
The first step in constructing MicroForest is to extract only the key information needed to predict bottlenecks from a pretrained large random forest for each task
n. Although a random forest contains many decision nodes, not all contribute equally to the final prediction; a considerable portion exhibits low information gain and simply inflates model complexity as discussed in
Section 3.2.
To reduce this inefficiency, the proposed SplitSelector analyzes each random forest, which is trained for a specific task n, independently. It calculates for every split and retains those in the top T%. Each selected split is represented by a feature–threshold pair (f, ) that partitions the data into two subsets. The resulting set of high-information-gain splits for task n is denoted .
SplitSelector does not extract entire high-information-gain nodes or their sub-trees; it retrieves only the split-rule information. The selected rules form the candidate split-rule set used for MicroTree construction. Once the candidate set is assembled, the MicroTree can be generated. MicroTree is a decision tree that spans the feature–threshold pairs extracted by SplitSelector and requires no further fine-tuning before deployment. Its structure resembles that of a conventional decision tree, but at each internal node, branching is restricted to the candidate splits .
The MicroTree construction algorithm, which is executed by MTConstructor, takes as input the training data for task n and the candidate split-rule set , then builds the tree in a recursive manner. Algorithm 1 demonstrates the MicroTree construction flow. At each node k with data at current depth d, it first evaluates a series of stopping conditions: whether the current depth has reached the predefined maximum ; whether the number of samples falls below the minimum threshold K; whether the highest information gain among splits in is below a ; or whether has become empty. If any of these conditions is met, the node is converted into a leaf (line 2–3). Otherwise, the algorithm selects the split that maximizes (line 5), partitions into left and right subsets accordingly (line 6–7), and verifies that each child contains at least K sample (line 8). If this sample-size check fails for either child, the node becomes a leaf (line 9); otherwise, the procedure recurses on each child sub-tree with depth (line 12–14). Note that the used split-rule is removed from the candidate set (line 11). The resulting MicroTree is immediately ready for deployment without further fine-tuning.
As the constructed MicroTree uses only the highly informative split-rules selected by SplitSelector, it contains very few nodes. This reduces the model’s size and shortens the decision paths traversed during inference, resulting in a significant speedup. Consequently, MicroTree becomes a lightweight model well suited for resource-constrained edge environments.
| Algorithm 1 MicroTree Construction |
- Input:
, - Output:
Root of MicroTree for task n - 1:
procedure Build_MicroTree() - 2:
if or or then - 3:
return Leaf node with majority class of - 4:
end if - 5:
- 6:
- 7:
- 8:
if or then - 9:
return Leaf node with majority class of - 10:
end if - 11:
remove from - 12:
left ← Build_MicroTree - 13:
right ← Build_MicroTree - 14:
return Internal node with children , - 15:
end procedure
|
MicroForest is an ensemble of multiple MicroTrees constructed as described above. For a manufacturing process with
N distinct tasks,
M MicroTrees are employed to predict bottlenecks, where
. Each MicroTree
(
) is trained independently using the candidate split-rule set
and training data
extracted by SplitSelector for its assigned tasks. The
M MicroTrees together form the MicroForest, defined as
At inference time, given the current state of the manufacturing process, each MicroTree receives the relevant input features and independently predicts whether its associated task(s) will become a bottleneck. This design enables the use of cross-task information in the overall prediction framework while ensuring that no single MicroTree exceeds its capacity.
4.4. Contributions
There has been a line of work that constructs a small model from a large random forest by extracting high-value rules. Those approaches can be grouped by their granularity. The coarsest approach is tree-level optimization [
8,
10] in which less contributing trees are pruned. In this scheme, individual high-value rules in a low-value tree are ignored.
MicroTree, by contrast, employs split-level optimization, the finest method that evaluates individual splits and then reconstructs a tree from the selected high-value rules. This process ensures no important decision rules are lost, and because the result remains a decision tree, the model’s interpretability is fully preserved. Similar fine-grain approaches evaluate individual splits as well [
11,
21]. However, SSF (Splitting Stump Forests) [
21] does not apply the extracted rules directly; instead, it trains a separate classifier on their binary outputs. Jiang et al. [
11] prune low-value splits but do not reconstruct a compact new tree from the retained rules.
A modest approach is path-level optimization, which focuses on entire root-to-leaf paths [
14]. Although this approach preserves interactions among rules along each path, it offers less flexibility.
Overall, MicroForest introduces several novel contributions that set it apart from prior work. First, it compresses and reconstructs decision trees solely from high-information-gain splits, ensuring no critical rules are lost. Moreover, unlike most prior methods that focus on single-task prediction, MicroForest combines multiple MicroTrees to perform simultaneous bottleneck prediction across many tasks. Consequently, it offers a flexible mechanism for tuning the number of MicroTrees (M) to meet diverse resource and latency requirements.
5. Experimental Results
In this section, we evaluate the proposed MicroForest on an edge device for predicting bottlenecks in manufacturing processes.
5.1. Target Board
Our target platform is the ODROID-M2. The ODROID-M2 development board integrates a Rockchip RK3588S2 SoC featuring four high-performance ARM Cortex-A76 cores clocked at 2.3 GHz and four energy-efficient ARM Cortex-A55 cores at 1.8 GHz. It is equipped with 16 GB of LPDDR5 memory. In particular, with a retail price below USD 150, it can be easily deployed in smart factories.
5.2. Overall Results
We first present overall performance of MicroForest. To evaluate MicroForest, it is compared against four baselines: the original Random Forest (RF), LightGBM (LGBM) [
1], Distilled Causal Tree (DCT) [
3], and Splitting Stump Forest (SSF) [
21]. RF and LGBM serve as standard forest baselines. Note that, in this paper, we train and deploy a separate random forest for each task. For clarity in the following discussion, “RF” refers to the set of random forests trained independently for each task. Instead, we use the term “1-RF” for a single random forest trained to predict all tasks’ bottleneck. DCT is a single-tree model distilled to mimic the outputs of RF. SSF resembles our approach in that it reuses split rules extracted from RF; however, it converts each high-value rule into a depth-1 stump and feeds the binary outputs of many stumps into a linear classifier such as logistic regression.
Experiments use the simulation framework described in
Section 4.1. We vary the number of tasks from 20 to 150 and predict whether a bottleneck will occur after 100 cycles (i.e.,
) for each task. The threshold for information-gain
T is set as 25% based on a sensitivity analysis, which will be shown in the
Section 5.7. We initially set the number of trees
M equal to the number of tasks
N to assess its predictive potential. Experiments exploring the effect of varying
M are presented in a later section. Metrics reported are precision, recall, F1-score, model size, and inference latency.
For a fair comparison, we tune major hyperparameters of every baseline via GridSearch-based optimization. For example, we sweep maximum depth and the number of estimators of RF from 5 to 80; the optimal setting consistently emerges around max_depth = 5 and n_estimators = 40. Similar searches are applied to other baselines, and each model adopts the setting that yields its best performance under the given experimental environment.
Table 1 shows overall results. We evaluate the prediction performance with precision and recall. In bottleneck prediction, successful prediction of rare bottleneck case is more important, so it is critical to weight each class equally. We therefore report the macro-averaged precision and recall in the evaluation. Overall, MicroForest show a high efficiency as well as the highest prediction performance in most cases. Although DCT and SSF deliver lower latency, their precision and recall decrease sharply as the number of tasks increase. Conversely, RF and LGBM maintain competitive predictive performance across all task scales, but their memory footprints remain an order of magnitude larger and their inference latency is much higher than MicroForest. Detailed results will be discussed in the following sections.
5.3. Recall Analysis
One of the crucial goals in bottleneck prediction is to detect as many true bottlenecks as possible. The relevant metric is recall. We analyze how well each model identifies actual bottlenecks through its recall scores in this section.
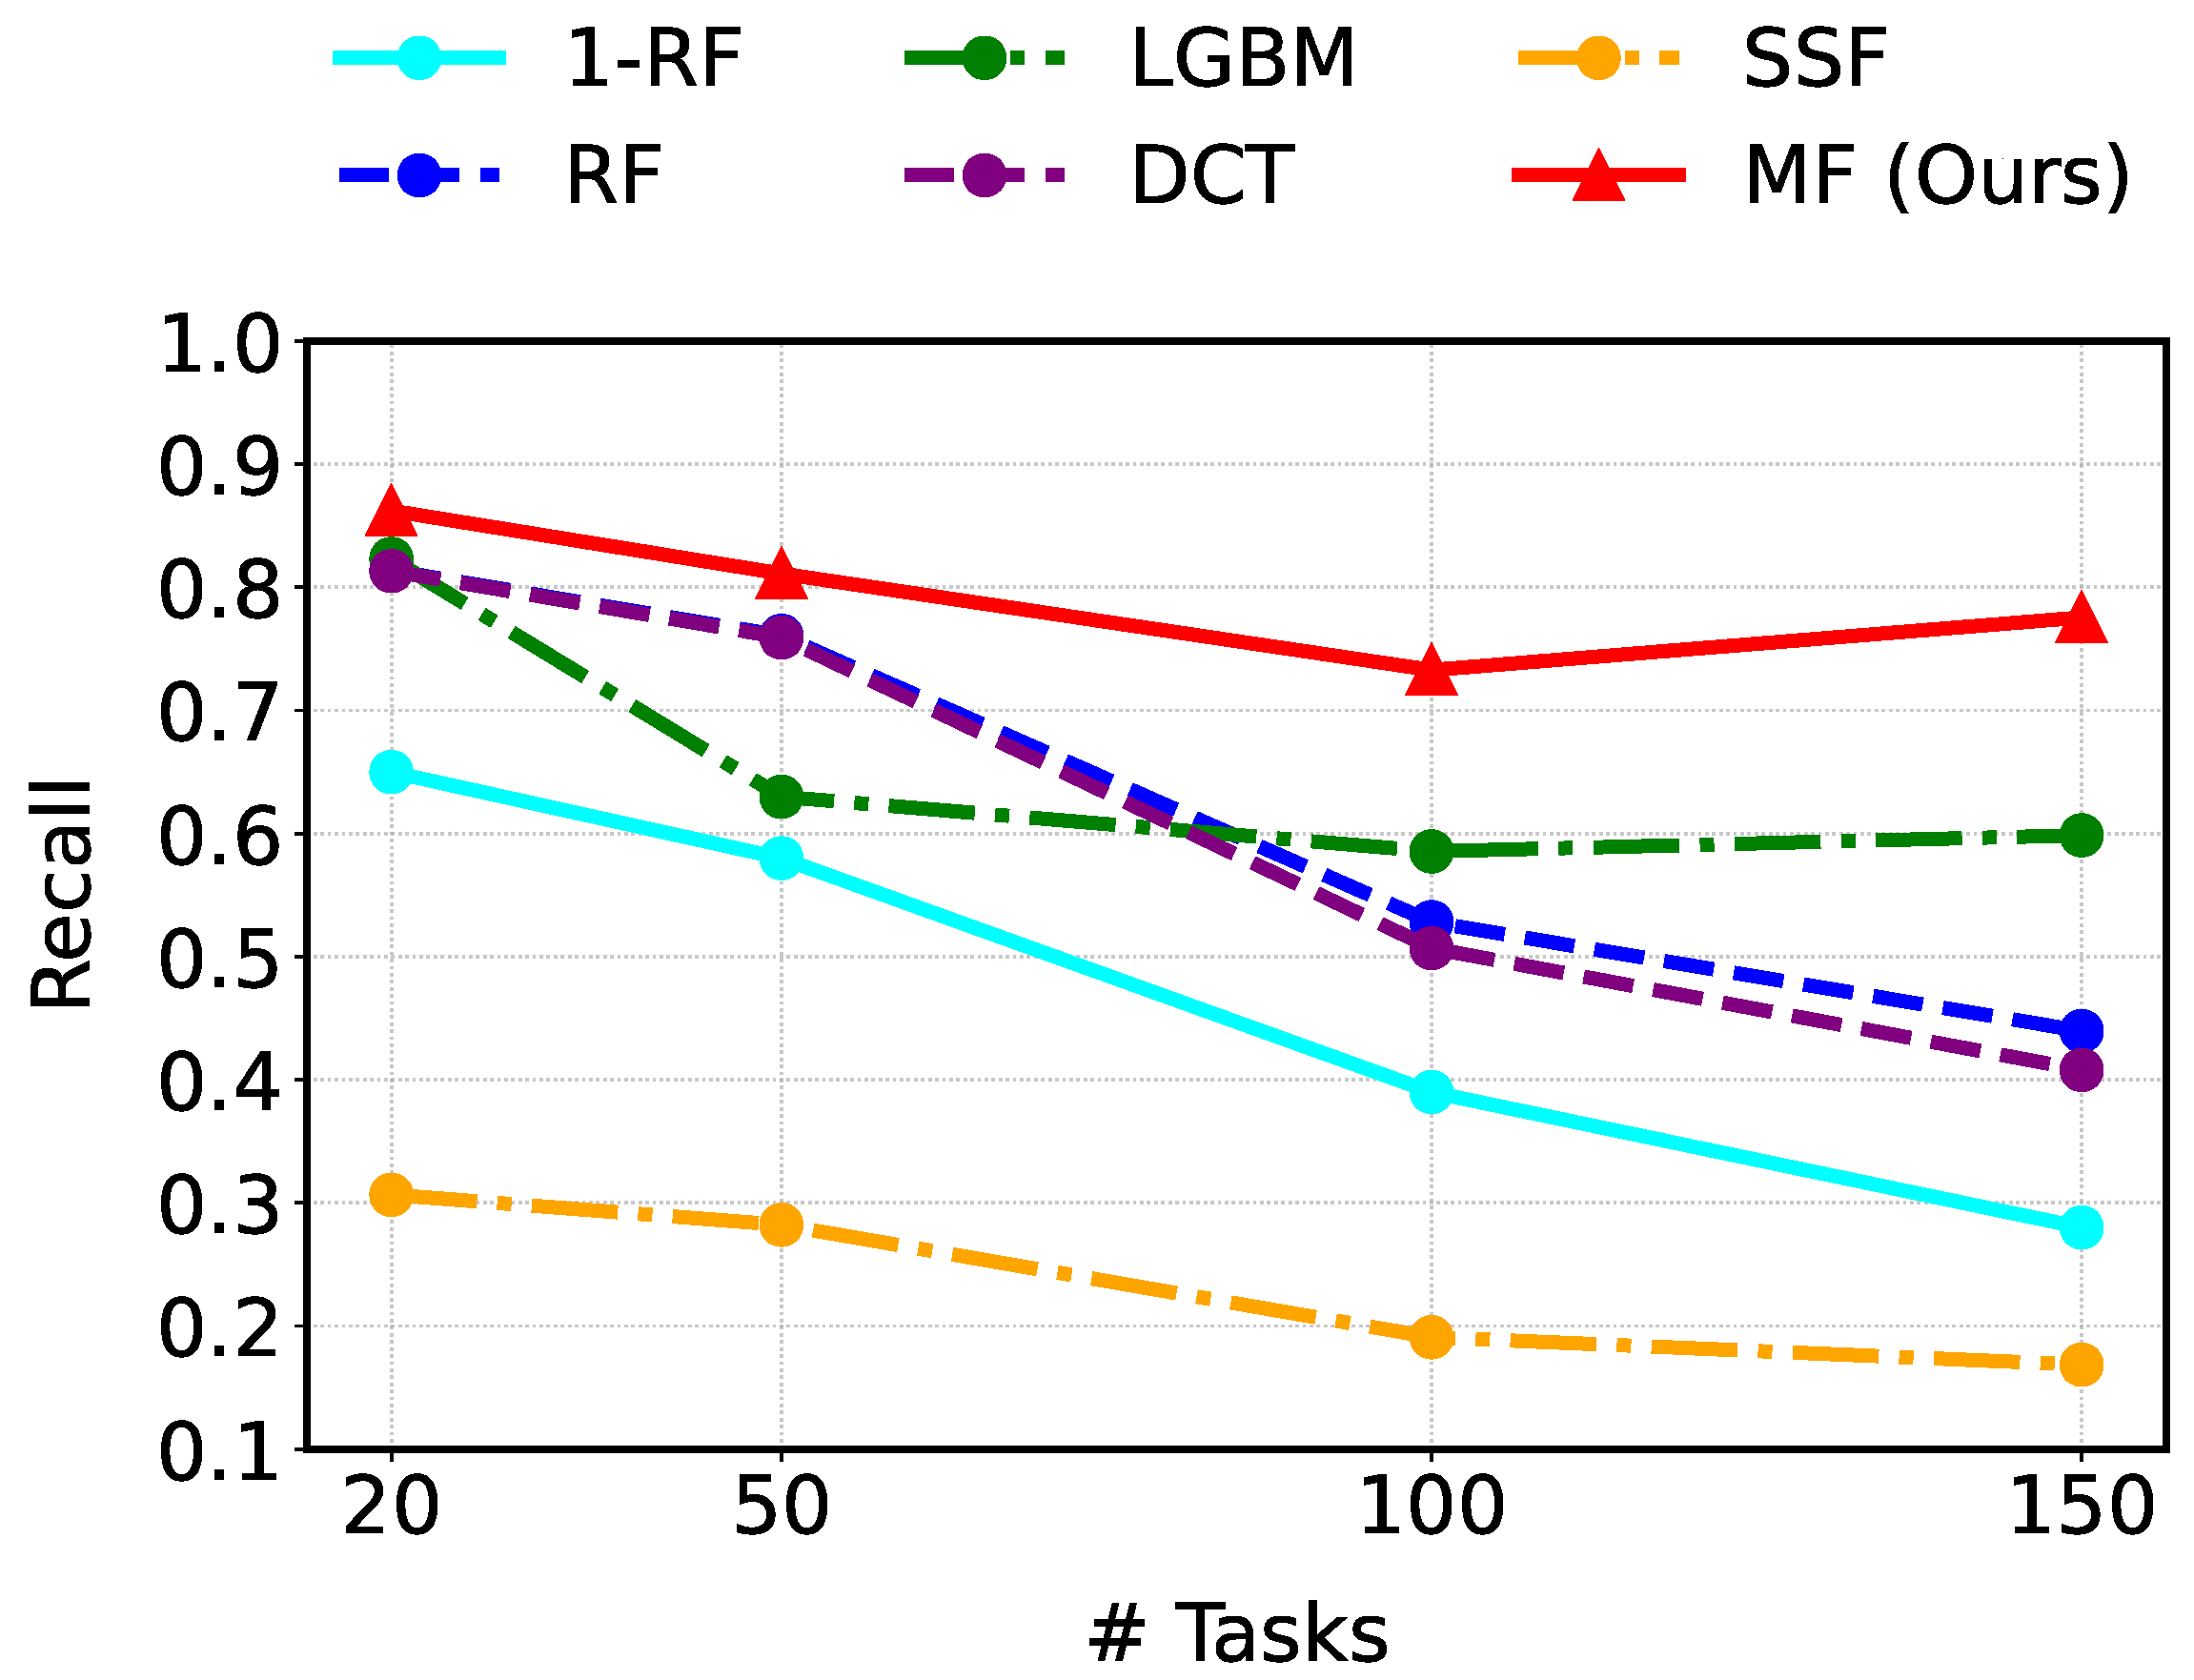
Figure 4 illustrates recall as the number of tasks increases. MF consistently outperforms all baselines across every task count evaluated (i.e., 20, 50, 100, and 150). With 20 tasks, MF attains a recall of 0.86, surpassing RF (0.81), LGBM (0.82), DCT (0.81), and SSF (0.31). Even when the task count grows to 150, MF still achieves the highest recall at 0.78, whereas DCT drops sharply. SSF consistently shows low recall scores. With 1-RF, which uses a single random forest, the recall score is 0.28. Since its performance is very poor, it is not practical. These results indicate that MF is able to predict bottlenecks effectively as manufacturing process complexity increases.
On the other hand, precision measures the proportion of predicted bottlenecks that are correct. Although RF attains very high precision at 100 and 150 tasks, its recall scores are 0.53 and 0.44, respectively, as shown in
Table 1. It means that it misses many true bottlenecks while being accurate only on the few it does predict. As a result, MF outperforms it in F1-score.
5.4. Model Size
Model size directly impacts storage and memory consumption, making it a critical factor for resource-constrained edge deployments.
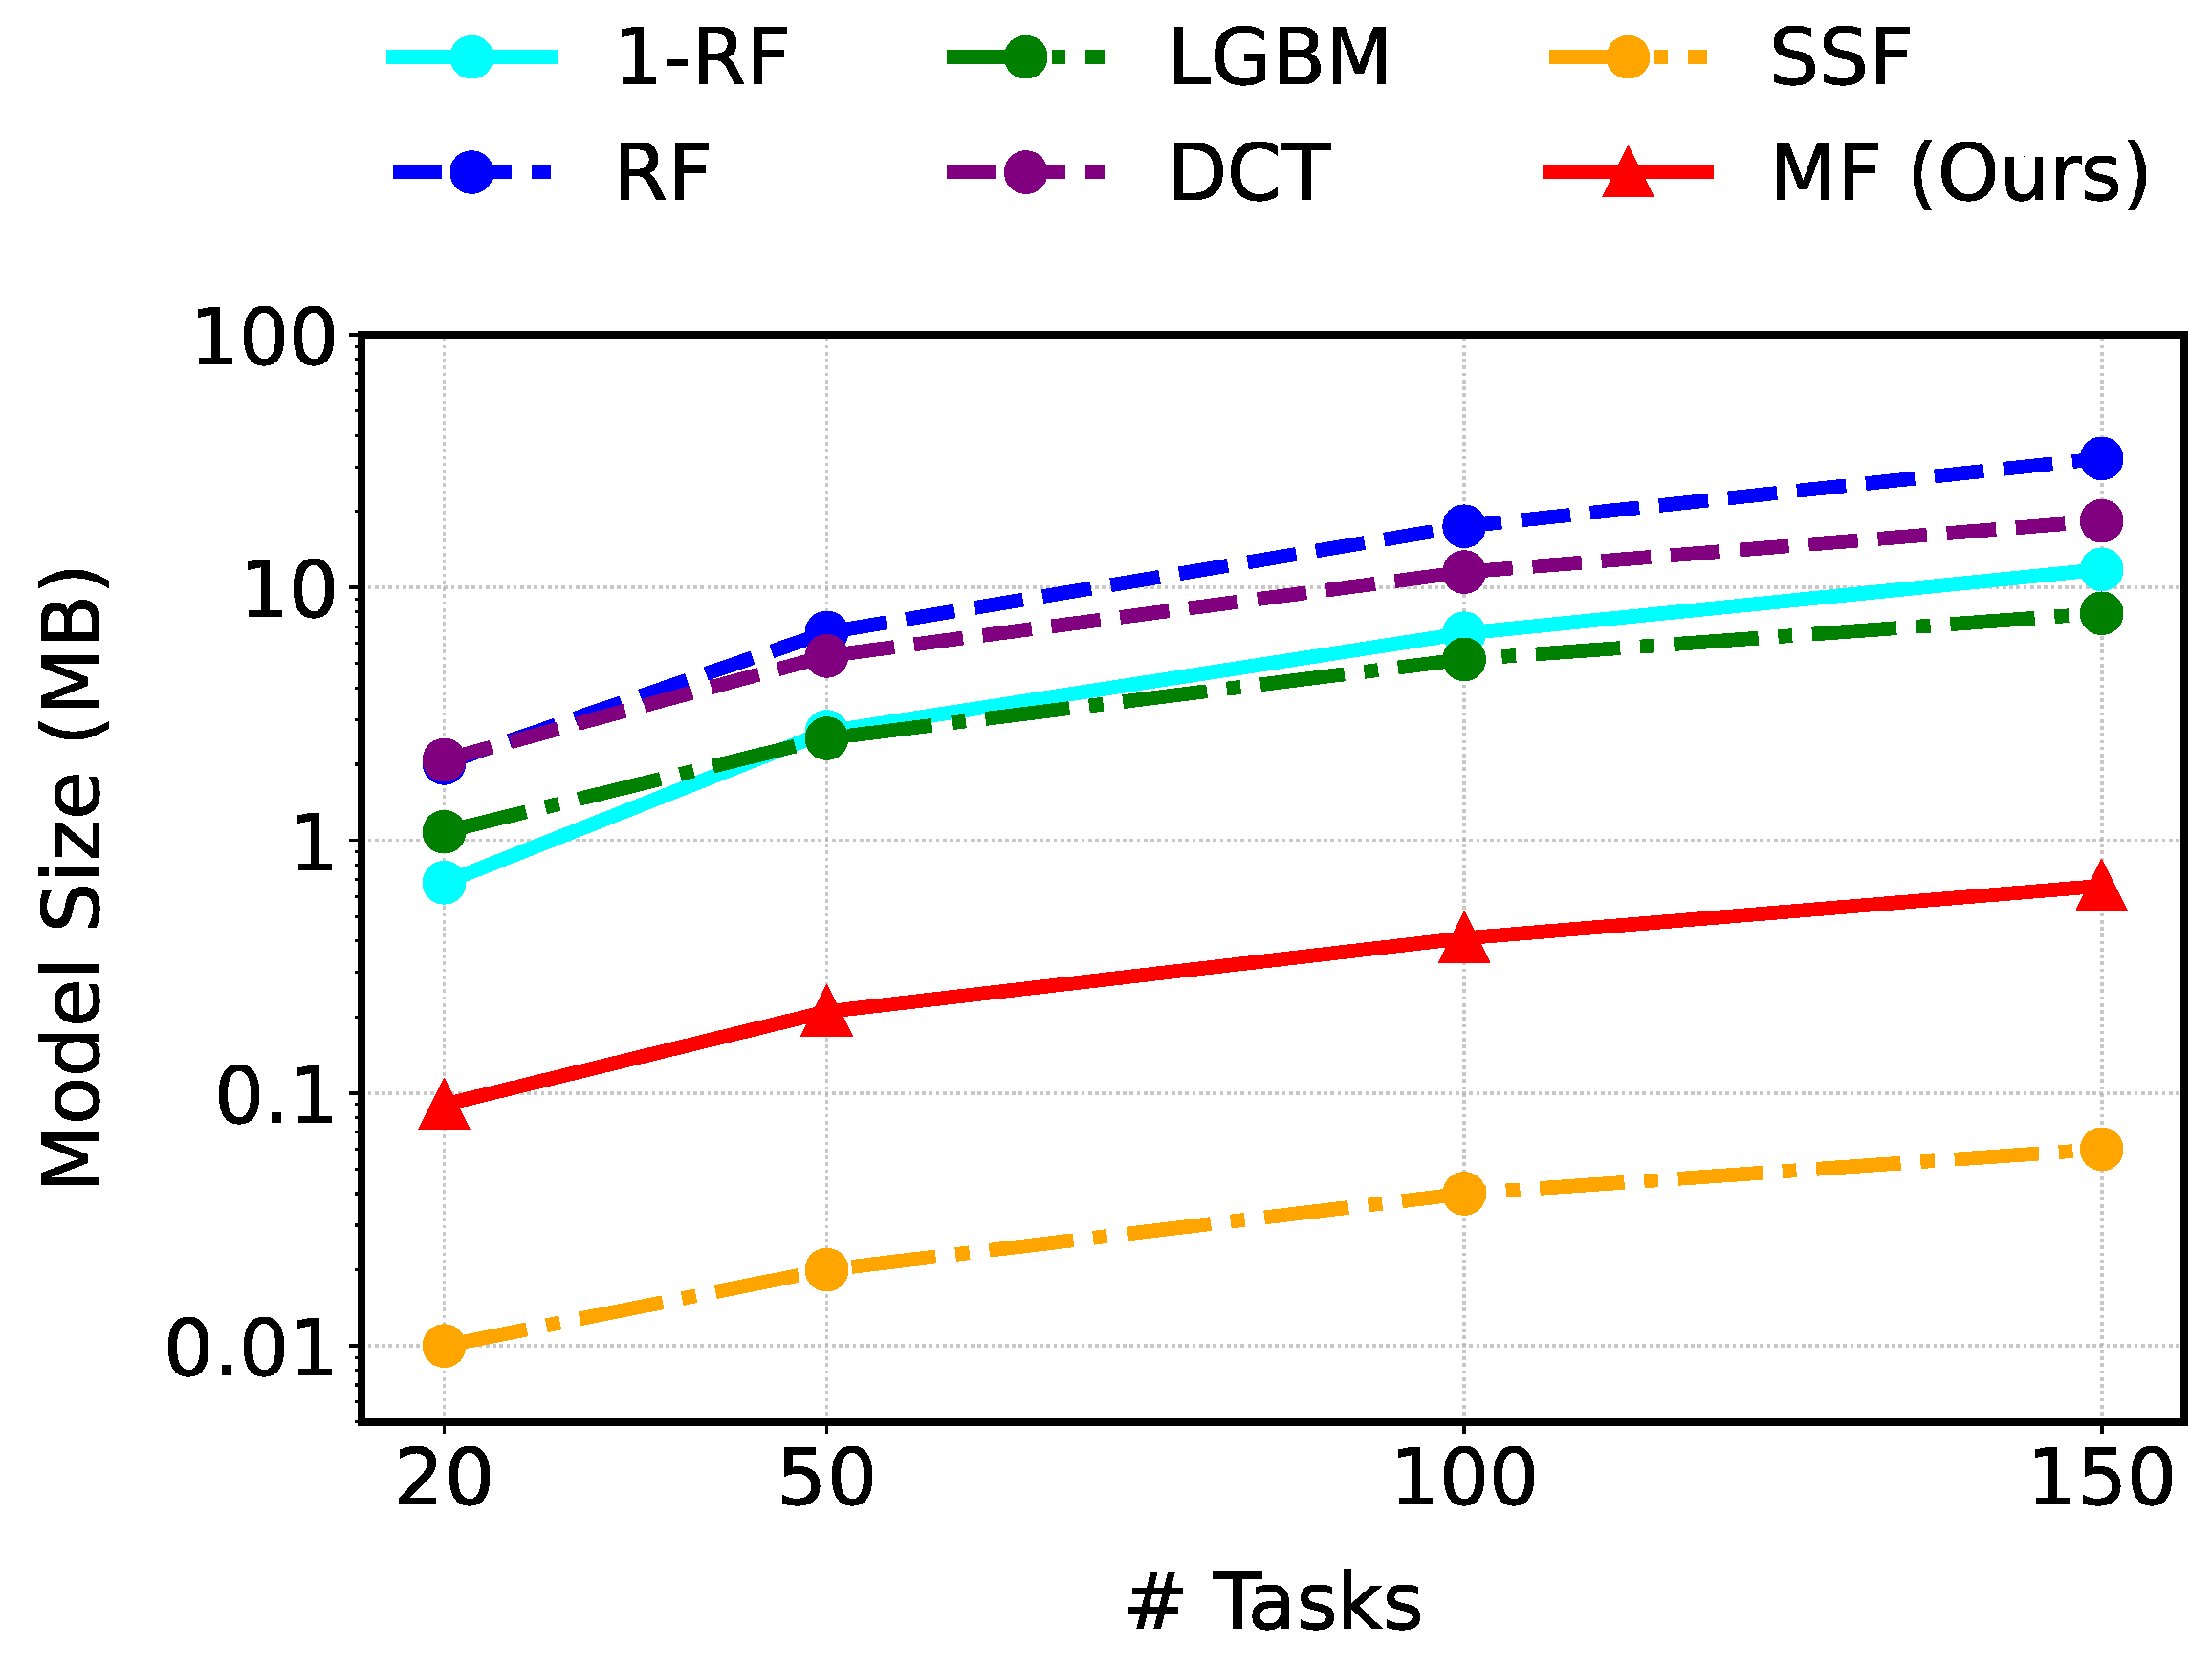
Figure 5 shows how each model’s size grows with the number of tasks. Except for SSF, MF is the smallest in every setting. With 150 tasks, MF occupies only 0.66 MB, which is about 1/49 the size of RF and roughly 1/12 that of LightGBM. Although SSF yields the tiniest footprint overall, its prediction performance is inadequate. These results demonstrate that MF can be deployed efficiently even in environments where storage and memory are constrained.
5.5. Inference Latency
In edge environments with limited resources, inference latency is a critical performance metric. Model size alone does not guarantee low latency, so we measure actual prediction times.
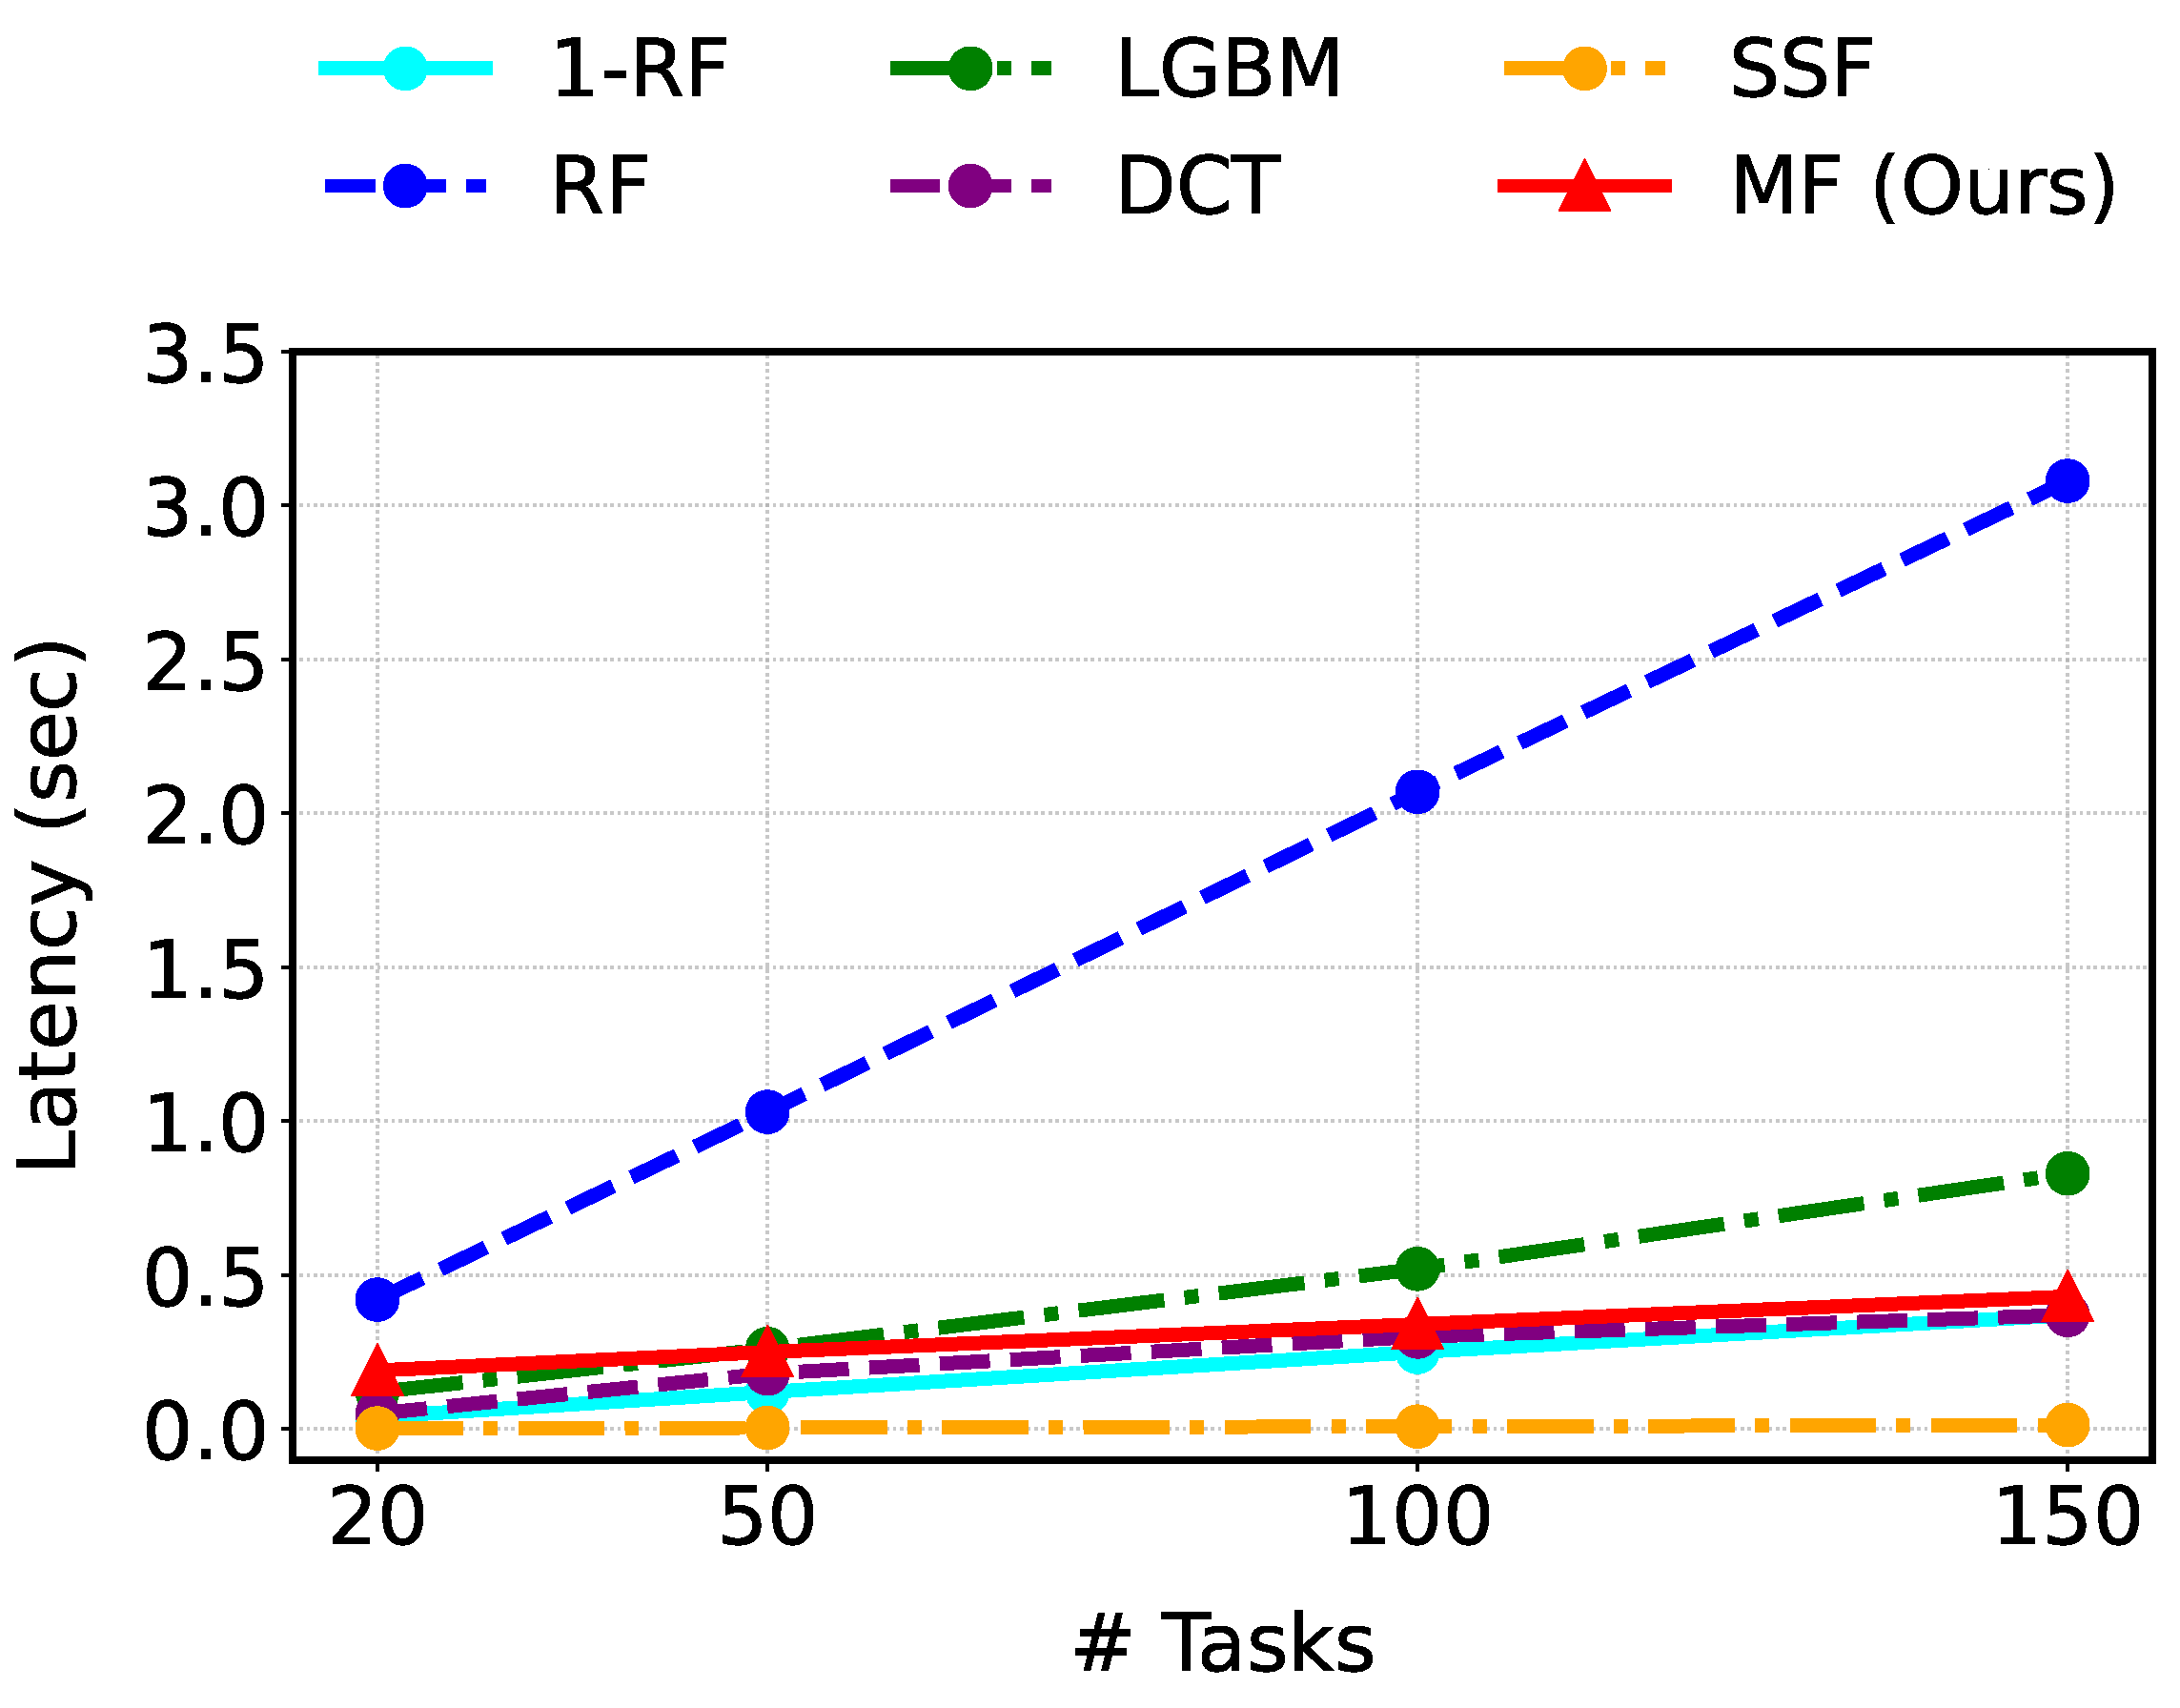
Figure 6 compares inference latency for every models as the number of tasks increases. The proposed MF model consistently outperforms RF and LGBM in most settings. DCT exhibits latency similar to MF, while SSF remains the fastest in all cases. It is notable how inference time scales with task count. When the number of tasks grows
(from 20 to 150), RF’s latency increases by
, LGBM’s by
, DCT’s by
, and SSF’s by
. By contrast, MF’s inference time rises by only
. This demonstrates that MF offers superior scalability, incurring the smallest latency increase as task complexity grows.
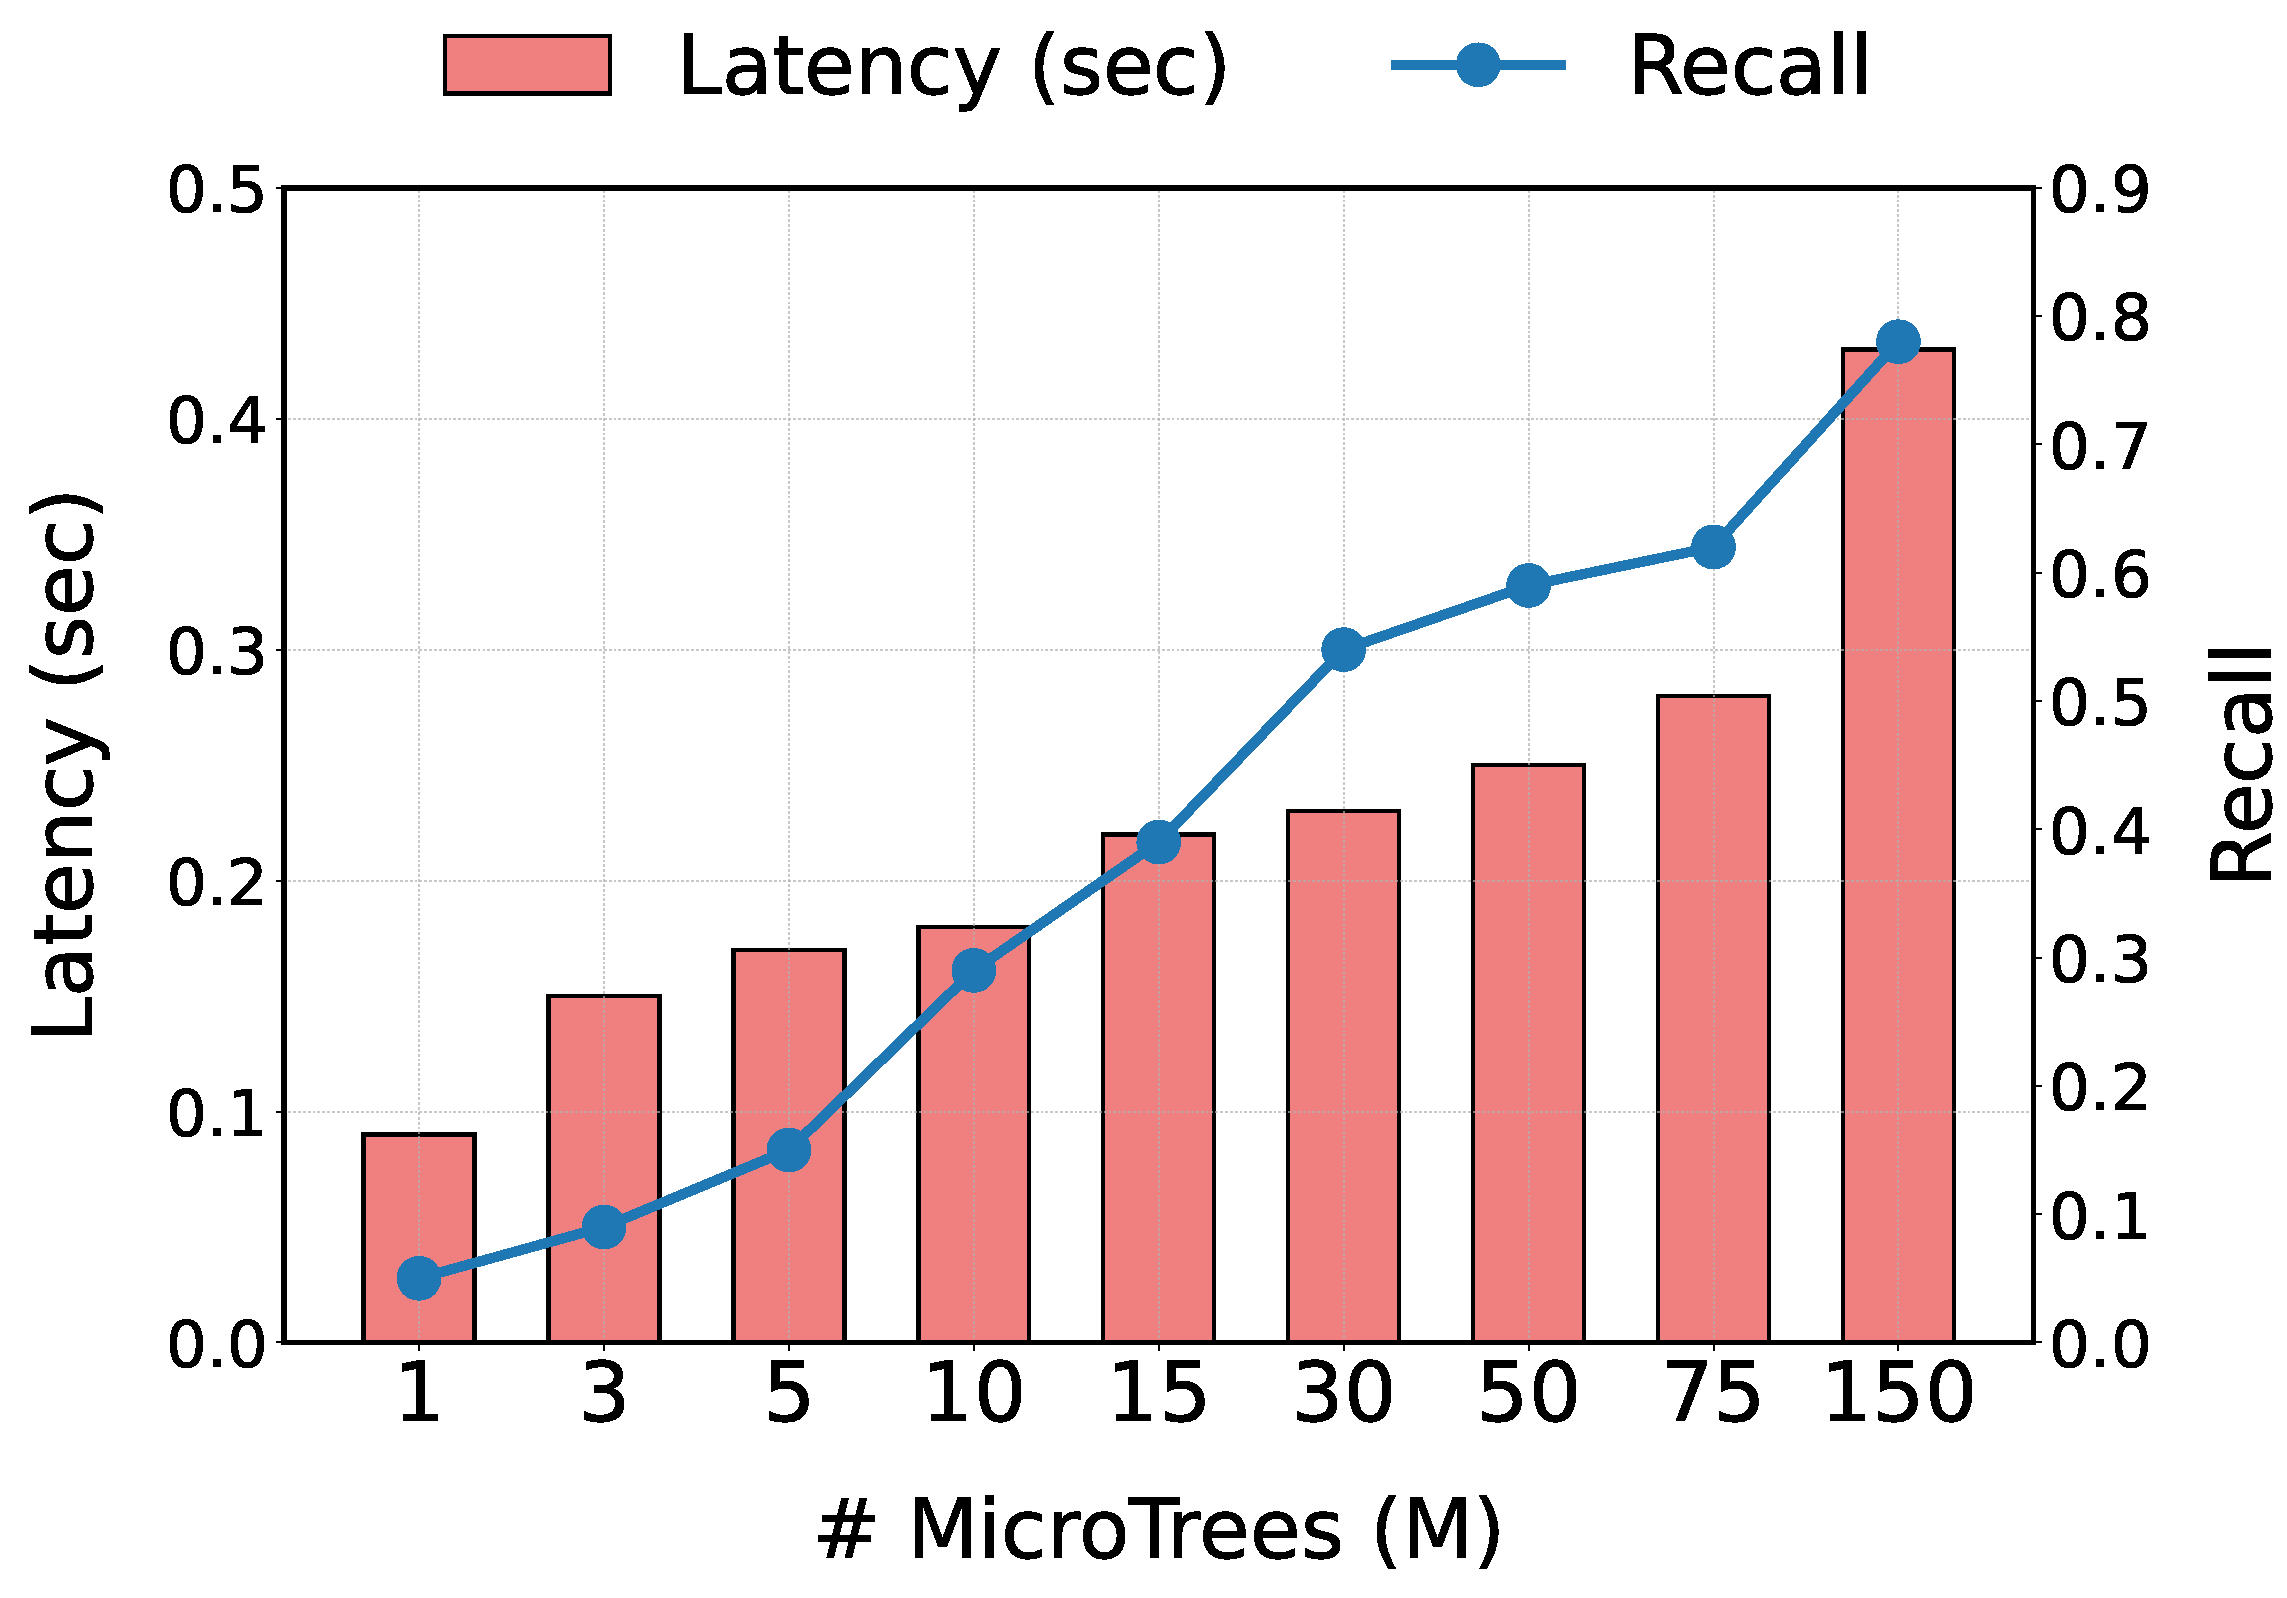
5.6. Tree Count Impact
Figure 7 shows how varying the number of MicroTrees affects recall and inference latency. The experiment is conducted under 150-task configuration. As described in
Section 4, each MicroTree predicts bottlenecks for multiple tasks, and we employ
M MicroTrees to form a MicroForest, where
.
With , the highest recall (0.78) is achieved but incur the longest execution time (0.43 s). In contrast, with , it yields a recall of 0.62 with a latency of 0.28 s. These results demonstrate that adjusting M allows us to balance prediction accuracy against inference speed. This flexibility makes our method well suited to diverse edge-device environments.
5.7. Sensitivity Analysis for IG Threshold
MicroTrees are constructed using the top-
T% of information-gain splits from the baseline random forests. In our experiments, we set
.
Figure 8 plots the sensitivity of MicroForest to varying
T, showing both model size and recall. As
T increases, model size grows monotonically, whereas recall is saturated at
% (marked by the red line). Including additional, lower-information-gain splits offers no further improvement, since these splits contribute negligibly to overall performance. This analysis, therefore, validates our choice of selecting the top 25% of splits for MicroForest.
5.8. Real-World Dataset
In this section, we evaluate the adaptability of the proposed method to a real-world application beyond bottleneck prediction in manufacturing by assessing its performance on other dataset. The chosen dataset is
IDA-2016 challenge [
24], which predicts whether the failure has occurred in air pressure system using data collected from real heavy Scania trucks. Since it is a single-task binary classification problem, MicroForest (MF), which is for multi-task problems, cannot be applied. Instead, we evaluate MicroTree (MT), using 1-RF as the baseline of random forest.
As shown in
Table 2, the MT model does not achieve the highest F1 scores on this dataset. For instance, 1-RF attains an 0.76, whereas MF reaches only 0.68. However, this performance gap does not undermine MT’s key purpose of enabling multi-task prediction in resource-constrained environments. As MT excels in both model size and inference latency compared to other models, multiple MTs can be combined to form an MF that scales efficiently to larger multi-task problems.
Note that the inference latency of MT in
Table 2 and that in
Figure 7 (
) are not consistent. This is because the MT in
Figure 7 is built from much huge amount of splits so as to predict 150 tasks at once, while that in
Table 2 has only few splits for single-task prediction.
5.9. Discussion
In summary, the proposed MicroForest demonstrates three key advantages for bottleneck prediction: First, it consistently achieves high recall. MicroForest effectively detects true bottlenecks across varying task counts and network complexities, whereas RF and DCT suffer from noticeable drops in recall as complexity grows even though they exhibit higher precision. Second, MicroForest’s model size is orders of magnitude smaller than that of competing methods (RF, LGBM, DCT). Although SSF yields the smallest footprint, its extreme simplicity comes at the cost of substantially lower accuracy. Third, MicroForest delivers efficient inference, scaling far better than the baselines as task count increases.
Overall, MicroForest strikes a balanced trade-off between accuracy, compactness, and speed, making it a superior approach for bottleneck prediction under resource-constrained conditions.
Despite its promising performance, this study has two main limitations. First, evaluations rely on a synthetic DAG-based simulation and thus do not account for real-world issues such as missing sensor readings or dynamic fluctuations in task cycle times. Second, when compressing multiple tasks into a single MicroTree, we currently apply a simple heuristic to group tasks and order splits; however, deciding the optimal grouping of tasks and the sequence of split rules is known to be NP-hard. Developing efficient algorithms for task grouping and split-ordering could be important future work.
6. Conclusions
In this paper, we have proposed MicroForest, a lightweight forest model for bottleneck prediction in manufacturing processes. MicroForest is built from MicroTrees, each assembled by selecting high-information-gain nodes from a trained RandomForest. To test the efficacy of the proposed method, we conducted experiments on a DAG-based manufacturing simulation, comparing MicroForest against random forest and other baselines. The results show that MicroForest achieves the highest recall in bottleneck prediction while maintaining model size orders of magnitudes smaller than comparable methods. Moreover, MicroForest exhibits superior scalability in inference latency as the number of tasks, and thus process complexity, increases. MicroForest offers an effective solution for fast, efficient bottleneck prediction on edge devices, making it particularly well suited for resource-constrained manufacturing environments.
Author Contributions
Conceptualization, S.Y.; methodology, S.Y. and C.O.; software, S.Y.; validation, C.O.; formal analysis, C.O.; resources, C.O.; writing—original draft preparation, S.Y. and C.O.; writing—review and editing, C.O.; supervision, C.O.; project administration, C.O.; funding acquisition, C.O. All authors have read and agreed to the published version of the manuscript.
Funding
This research was supported by the MSIT (Ministry of Science, ICT), Korea, under the National Program for Excellent in SW, supervised by the IITP (Institute of Information & Communications Technology Planning & Evaluation) in 2025 (2024-0-00073).
Data Availability Statement
The original contributions presented in this study are included in the article. Further inquiries can be directed to the corresponding author.
Conflicts of Interest
The authors declare no conflicts of interest.
Abbreviations
The following abbreviations are used in this manuscript:
| IG | Information gain |
| DAG | Directed acyclic graph |
| RF | Random forest |
| MF | MicroForest |
| MT | MicroTree |
| LGBM | LightGBM |
| DCT | Distilled Causal Tree |
| SSF | Splitting Stump Forest |
References
- Ke, G.; Meng, Q.; Finley, T.; Wang, T.; Chen, W.; Ma, W.; Ye, Q.; Liu, T.Y. LightGBM: A Highly Efficient Gradient Boosting Decision Tree. In Proceedings of the Advances in Neural Information Processing Systems, Long Beach, CA, USA, 4–9 December 2017; Volume 30, pp. 3149–3157. [Google Scholar]
- Chen, T.; Guestrin, C. XGBoost: A Scalable Tree Boosting System. In Proceedings of the 22nd ACM SIGKDD International Conference on Knowledge Discovery and Data Mining, San Francisco, CA, USA, 13–17 August 2016; pp. 785–794. [Google Scholar]
- Rehill, P. Distilling interpretable causal trees from causal forests. arXiv 2024, arXiv:2408.01023. [Google Scholar]
- Farhadi, Z.; Bevrani, H.; Feizi-Derakhshi, M.R.; Kim, W.; Ijaz, M.F. An Ensemble Framework to Improve the Accuracy of Prediction Using Clustered Random-Forest and Shrinkage Methods. Appl. Sci. 2022, 12, 10608. [Google Scholar] [CrossRef]
- Zhu, N.; Zhu, C.; Zhou, L.; Zhu, Y.; Zhang, X. Optimization of the Random Forest Hyperparameters for Power Industrial Control Systems Intrusion Detection Using an Improved Grid Search Algorithm. Appl. Sci. 2022, 12, 10456. [Google Scholar] [CrossRef]
- Liu, C.Y.; Ku, C.Y.; Wu, T.Y.; Ku, Y.C. An Advanced Soil Classification Method Employing the Random Forest Technique in Machine Learning. Appl. Sci. 2024, 14, 7202. [Google Scholar] [CrossRef]
- Cao, Y.; Zhao, P.; Xu, B.; Liang, J. An Improved Random Forest Approach on GAN-Based Dataset Augmentation for Fog Observation. Appl. Sci. 2024, 14, 9657. [Google Scholar] [CrossRef]
- Nan, F.; Wang, J.; Saligrama, V. Pruning random forests for prediction on a budget. In Proceedings of the Advances in Neural Information Processing Systems, Barcelona, Spain, 5–10 December 2016; Volume 29. [Google Scholar]
- Ren, S.; Zhao, W.; Zhou, X.; Sun, J. Global Refinement of Random Forest. In Proceedings of the IEEE Conference on Computer Vision and Pattern Recognition, Boston, MA, USA, 7–12 June 2015; pp. 723–730. [Google Scholar]
- Khan, Z.; Gul, A.; Perperoglou, A.; Miftahuddin, M.; Mahmoud, O.; Adler, W.; Lausen, B. Ensemble of optimal trees, random forest and random projection ensemble classification. Adv. Data Anal. Classif. 2020, 14, 97–116. [Google Scholar] [CrossRef]
- Jiang, X.; Wu, C.a.; Guo, H. Forest pruning based on branch importance. Comput. Intell. Neurosci. 2017, 2017, 3162571. [Google Scholar] [CrossRef] [PubMed]
- Zhang, F.; Yang, X. Improving Land Cover Classification in an Urbanized Coastal Area by Random Forests: The Role of Variable Selection. Remote Sens. Environ. 2020, 241, 111736. [Google Scholar] [CrossRef]
- Meinshausen, N. Node harvest. Ann. Appl. Stat. 2010, 4, 2049–2072. [Google Scholar] [CrossRef]
- Cohen-Shapira, N.; Rokach, L. PnT: Born-again tree-based model via fused decision path encoding. Inf. Fusion 2024, 112, 102545. [Google Scholar] [CrossRef]
- Painsky, A.; Rosset, S. Lossless compression of random forests. J. Comput. Sci. Technol. 2019, 34, 494–506. [Google Scholar] [CrossRef]
- Buciluǎ, C.; Caruana, R.; Niculescu-Mizil, A. Model Compression. In Proceedings of the 12th ACM SIGKDD International Conference on Knowledge Discovery and Data Mining, Philadelphia, PA, USA, 20–23 August 2006; pp. 535–541. [Google Scholar]
- Hinton, G.; Vinyals, O.; Dean, J. Distilling the Knowledge in a Neural Network. arXiv 2015, arXiv:1503.02531. [Google Scholar]
- Vidal, T.; Schiffer, M.; Pacheco, T. Born-Again Tree Ensembles. In Proceedings of the 37th International Conference on Machine Learning, Online, 13–18 July 2020; pp. 9730–9740. [Google Scholar]
- Zhou, Y.; Hooker, G. Interpreting Models via Single Tree Approximation. arXiv 2016, arXiv:1610.09036. [Google Scholar]
- Bénard, C.; Biau, G.; Da Veiga, S.; Scornet, E. Interpretable Random Forests via Rule Extraction. In Proceedings of the 24th International Conference on Artificial Intelligence and Statistics, Virtual, 13–15 April 2021; pp. 231–239. [Google Scholar]
- Alkhoury, F.; Welke, P. Splitting Stump Forests: Tree Ensemble Compression for Edge Devices. In International Conference on Discovery Science; Springer: Cham, Switzerland, 2024; pp. 3–18. [Google Scholar]
- Sagi, O.; Rokach, L. Explainable Decision Forest: Transforming a Decision Forest into an Interpretable Tree. Inf. Fusion 2020, 61, 124–138. [Google Scholar] [CrossRef]
- Schmid, L.; Gerharz, A.; Groll, A.; Pauly, M. Tree-based ensembles for multi-output regression: Comparing multivariate approaches with separate univariate ones. Comput. Stat. Data Anal. 2023, 179, 107628. [Google Scholar] [CrossRef]
- IDA2016Challenge. UCI Machine Learning Repository. 2016. [CrossRef]
| Disclaimer/Publisher’s Note: The statements, opinions and data contained in all publications are solely those of the individual author(s) and contributor(s) and not of MDPI and/or the editor(s). MDPI and/or the editor(s) disclaim responsibility for any injury to people or property resulting from any ideas, methods, instructions or products referred to in the content. |
© 2025 by the authors. Licensee MDPI, Basel, Switzerland. This article is an open access article distributed under the terms and conditions of the Creative Commons Attribution (CC BY) license (https://creativecommons.org/licenses/by/4.0/).


