Article

Determining Factors Influencing Operating Speeds on Road Tangents

by
Juraj Leonard Vertlberg
*,
Marijan Jakovljević
,
Borna Abramović
and
Marko Ševrović
Faculty of Transport and Traffic Sciences, University of Zagreb, Vukelićeva 4, 10000 Zagreb, Croatia
*
Author to whom correspondence should be addressed.
Appl. Sci. 2025, 15(13), 7549; https://doi.org/10.3390/app15137549
Submission received: 3 May 2025 / Revised: 10 June 2025 / Accepted: 1 July 2025 / Published: 4 July 2025

Abstract

Road traffic accidents remain a critical global issue with approximately 1.19 million fatalities each year, on which excessive and inappropriate speeds contribute significantly. Managing vehicle speeds is essential for improving road safety, yet predicting and understanding operating speeds remains a challenge. Among different road elements, tangents play a crucial role, as they serve as transition segments between curves and allow for free acceleration, making them particularly relevant for speed management and road design. This study investigates the operating speeds on both single- and dual-carriageway road tangents to identify the key influencing factors. Data were collected from 24 single-carriageway and 20 dual-carriageway road tangents in Croatia, comprising a total of 14,854 speed observations (filtered sample size). The analysis focuses on the impact of geometric, traffic, and roadside environment characteristics on operating vehicle speeds. The results reveal that for single-carriageway road tangents, the most influential factors were traffic volume and terrain type, while for dual-carriageway road tangents, the factors traffic flow density, average summer daily traffic, and heavy goods vehicle share. These findings provide essential insights for the future development of operating speed prediction models, enhancing road design guidelines, and improving speed management strategies.

1. Introduction

Road traffic safety is a global challenge for many countries around the world. According to the World Health Organization report [1], approximately 1.19 million people die in road traffic accidents each year worldwide, with an even larger number of them being injured. Therefore, road traffic accidents are the eighth leading cause of death globally and the leading cause of death among young individuals, aged 5 to 29 [2]. Most fatalities occur in low- and middle-income countries, where infrastructure, vehicles, and education on road traffic safety are not at satisfactory levels. Consequently, road traffic accidents have become one of the most critical public health issues facing modern societies, and their significance is expected to grow in the future.
The OECD (2018) [3] estimates the social cost of road traffic accidents in the European Union at around EUR 500 billion (or 3% of its GDP). This cost includes medical expenses, productivity losses, repair and reconstruction costs for road infrastructure, as well as other related costs. Internationally, it is estimated that about one-third of fatal road traffic accidents are partially caused by excessive or inappropriate speed [4]. Numerous studies have found a link between speed and the likelihood of road traffic accidents. Furthermore, an increase in average speed is directly associated with a higher probability of accidents and the severity of their consequences. Specifically, a 1% increase in average speed leads to a 4% increase in the risk of fatal accidents and a 3% increase in the risk of accidents results in serious injuries [1].
Straight road segments, or tangents, facilitate higher vehicle speeds due to the absence of geometric constraints, such as horizontal curves or intersections. While this characteristic enhances traffic flow, it also contributes to increased crash risk and severity. Studies have indicated that excessive speed is a primary factor in road traffic accidents, with a significant proportion occurring on road tangents. According to the National Highway Traffic Safety Administration (NHTSA), speeding contributed to 29% of all fatal road traffic accidents in 2022, emphasizing the relationship between high speeds and accident severity [5]. Furthermore, data have suggested that a substantial share of fatal road traffic accidents on rural (68%) and urban (81%) roads occur on road tangents, where drivers are more likely to exceed speed limits due to the absence of speed-reducing elements [6]. The physics of high-speed travel further exacerbates risk, as increased speed reduces driver reaction time and extends stopping distances, increasing the probability of collision [7]. Moreover, speed-related road traffic accidents on road tangents often result in fatalities or severe injuries due to higher impact forces [8]. A critical issue contributing to road safety concerns is the discrepancy between the speed limits and the actual vehicles’ speeds, with research indicating that drivers frequently exceed regulatory limits on straight road segments, leading to increased crash risk and severity [9]. These “actual vehicles’ speeds” are defined as operating speeds.
Following the above, operating vehicle speed can be defined in several ways. It may be considered the actual speed at which a vehicle is driving under free-flow conditions [10], or as the 85th percentile speed distribution used to measure operating speeds related to specific locations or road geometries [11]. Studies have shown that operating speed under free-flow conditions, particularly on roads without speed monitoring/speed enforcement, tends to exceed posted speed limits [12,13]. The highest operating speeds are typically achieved under free-flow conditions, where road geometry rather than interactions with other vehicles primarily influences speed. Thus, it may be presupposed that vehicle interaction has minimal effect on operating speed under such conditions [14].
The existing research on operating speeds has encompassed various types of roads, with single-carriageway and dual-carriageway roads being of particular interest. Moreover, operating speeds have been analyzed in multiple road segments, such as horizontal curves, vertical curves, tangents, and combinations of these. In studies examining factors influencing operating speed in horizontal curves across all road types, radius of horizontal curve has proven to be the most statistically significant variable [15,16,17,18,19,20]. For instance, Wang et al. (2018) [16] found that operating speeds significantly decrease when the curve radius is less than 300 m, and that vehicle speed stabilizes as the radius increases. Similarly, Russo et al. (2016) [21] noted that a radius of horizontal curve greater than 400 m has a negligible impact on the operating speed. The existing research on tangent road sections is relatively limited compared to the studies conducted on horizontal curves. Fitzpatrick et al. (2005) [22] conducted a study in both urban and rural areas, identifying a strong correlation between posted speed limits and operating speed on tangents. Other parameters affecting operating speed included driveway density, median type, and the presence of parked vehicles and pedestrians. Notably, pedestrian presence was found to be inversely proportional to operating speed. Additionally, on rural tangents, lane width has been shown to proportionally increase operating speed. The Federal Highway Administration (FHWA) notes that wider lanes and shoulders result in faster operating speeds; for instance, methodologies in the Highway Capacity Manual predict an approximately 0.64 to 1.77 km/h increase in speeds on two-lane highways for every 0.3 m increase in lane width. [23]. Maji et al. (2020) [15] conducted research across 251 locations in Oklahoma, developing three models to predict operating speed, including one for roads with higher speed limits (80–105 km/h), one for roads with lower speed limits (56–72 km/h), and a third for roads with varying speed limits, with the latter model proving most accurate. Among the most statistically significant variables were posted speed limits and pavement friction coefficients across all speed limit categories. Conversely, for roads with lower speed limits, only the posted speed limit proved to be statistically significant. Furthermore, the differences in predicting operating speeds can be attributed to varying driving behavior patterns. Özkan et al. (2006) [24] compared aggressive driving behavior across different nationalities and cultures, specifically between Finnish, British, Greek, Iranian, Dutch, and Turkish drivers. They found that Greek drivers engaged in aggressive violations more frequently and expressed greater anger and impatience towards other road users. British, Dutch, and Finnish drivers exhibited the least aggression, while Iranian and Turkish drivers fell between these groups. In light of the aforementioned considerations, it may be presupposed that driving behavior varies among nationalities and cultures, therefore influencing operating speed [25].
The existing studies on operating speeds on road tangents have identified several factors influencing operating speed. Research by Fitzpatrick et al. (2005) [22] found that driveway density, median type, and the presence of parked vehicles and pedestrians significantly affect vehicle speeds. In particular, pedestrian presence has been shown to inversely correlate with operating speeds, as drivers tend to reduce speed when pedestrian activity is high [21]. Furthermore, road design characteristics, such as lane width, was found to have an essential role in speed variations. Wider lanes have been associated with higher operating speeds, as drivers perceive them to be safer and less restrictive [15]. However, some studies, such as Fitzpatrick et al. (2005) [22], have reported that lane width does not always have a statistically significant impact on operating speed, suggesting that additional contextual factors may be at play. Despite the existence of operating speed prediction models for road tangents, many studies have questioned their accuracy due to regional differences, variations in driving behavior, and site-specific conditions. Additionally, models that rely primarily on posted speed limits often fail to account for the impact of environmental factors, leading to discrepancies between the predicted and actual speeds [15].
While some operating speed prediction models for road tangents incorporate variables, such as the operating speed, on the preceding curve or previous road segment [26,27,28,29,30,31,32], this approach presents limitations when applied to newly designed roads. In such cases, the operating speeds on preceding segments are unknown, and thus must also be predicted, which introduces additional uncertainty into the model. The reliance on prior speed data increases the potential for errors, as these predictions may not accurately reflect real-world conditions without empirical speed data from the existing roads. Consequently, for newly designed roads, it is crucial to develop independent models that can predict operating speeds on tangents without relying on the operating speeds of preceding segments or curves, thereby minimizing the prediction errors and enhancing the accuracy of operating speed prediction. Without this consideration, models may be less reliable and less applicable to modern road design, where prior speed data is unavailable and must be estimated, leading to a higher margin of error in predictions.
This research focuses on analyzing the operating speeds on tangent sections of both single- and dual-carriageway roads in Croatia, with the primary objective of examining the impact of various contributing factors on operating vehicle speeds. Road tangents were specifically chosen due to their distinctive influence on driver behavior and speed selection. Unlike horizontal curves, which impose physical constraints, such as centrifugal force, tangents are free from such limitations, enabling drivers to select speeds based on road geometry, visibility, and environmental conditions [15,22,33,34,35,36,37]. The lack of geometric constraints on tangents often results in higher operating speeds, making them crucial for understanding the variations in driving speeds and their implications for traffic dynamics. By concentrating on tangent sections, this study aims to enhance the understanding of how factors such as road design, surrounding environment, and traffic conditions interact to influence operating speeds. Through comprehensive data collection and subsequent statistical analysis, the research seeks to provide empirical insights into the factors shaping operating speeds, thereby contributing to a more nuanced understanding of speed behavior on road tangents.

2. Methodology

A simplified overview of the applied methodology is presented in Figure 1, while a detailed explanation of each step is provided in the subsequent subsections.

2.1. Research Context

This research was conducted in Croatia, a country situated in Southeastern Europe, with a population of approximately 3.85 million inhabitants [38]. The capital city, Zagreb, functions as the administrative, economic, and academic center of the country. Croatia has a relatively low population density, with a significant proportion of the population residing in urban areas, while other regions exhibit varied settlement patterns influenced by geographical and infrastructural characteristics. The national road network supports both regional connectivity and long-distance transport, with notable seasonal fluctuations in traffic volumes, particularly in the coastal and southern regions. These fluctuations are driven by increased mobility during the summer months, contributing to distinct transport demand patterns that must be considered in traffic and infrastructure studies [39]. Croatia’s road infrastructure comprises a network of both single- and dual-carriageway roads, which together facilitate the movement of local commuters, tourists, and freight. While dual-carriageway roads are essential for connecting major urban centers and popular tourist destinations, single-carriageway roads also play a pivotal role in regional connectivity and local traffic management, particularly in rural and less densely populated areas. The inclusion of both road types in this research is crucial, as operating speeds on single-carriageway roads often differ due to distinct geometric features, traffic flow conditions, and road capacity, which can affect driver behavior in ways that differ from dual-carriageway roads. Given the central role of tourism in Croatia’s economy, both single- and dual-carriageway roads are key arteries for domestic and international travelers, providing essential access to the Adriatic coast and other prominent tourist regions. The interaction between local traffic, freight transport, and tourist flows creates a complex and dynamic environment where understanding operating speeds is essential.

2.2. Data Collection

The research was conducted on road tangents on dual- and single-carriageway roads:
  • Dual-carriageway roads—motorways;
  • Single carriageway roads:
    State roads,
    County roads.
According to the Croatian Road Traffic Safety Act [40], a “motorway” is defined as a public road built and designated exclusively for motor vehicle traffic, with two physically separated carriageways (using a median, guardrails, etc.) for traffic in opposite directions, with at least two traffic lanes per direction, each lane being a minimum of 3.5 m wide. Depending on the terrain configuration, an emergency lane of at least 2.5 m in width is also required. Motorways do not intersect with other roads or railway or tram tracks at the same level, and access is allowed only via specific acceleration or deceleration lanes and ramps, facilitating safe traffic flow at speeds of at least 80 km/h. Motorways are marked with prescribed traffic signs. The total length of the motorways in Croatia is approximately 1313 km [41].
On the other hand, a “state road” is a public road that connects the entire territory of the Republic of Croatia and links it to the network of major European roads. A “county road” is a public road that connects the area of one or more counties [40]. The total length of state roads in Croatia is approximately 7307 km, and the total length of county roads is 9371 km [42]. State roads and county roads in Croatia differ primarily in their functional importance, design standards, and maintenance levels. State roads are classified as part of the national road network, and serve a critical role in connecting major cities, regions, and international borders. As such, they are generally subject to higher maintenance standards, featuring better quality pavement surfaces, higher retroreflective horizontal and vertical signage, and enhanced road safety equipment, such as guardrails. These roads are designed to accommodate higher traffic volumes and more diverse vehicle types, including heavy goods vehicles, and are typically prioritized in infrastructure planning and investment. By contrast, county roads primarily serve to connect smaller towns, municipalities, and local administrative areas. They are often characterized by lower design standards and are less frequently maintained, which may result in poorer pavement quality and reduced visibility or completeness of traffic signage and safety features.
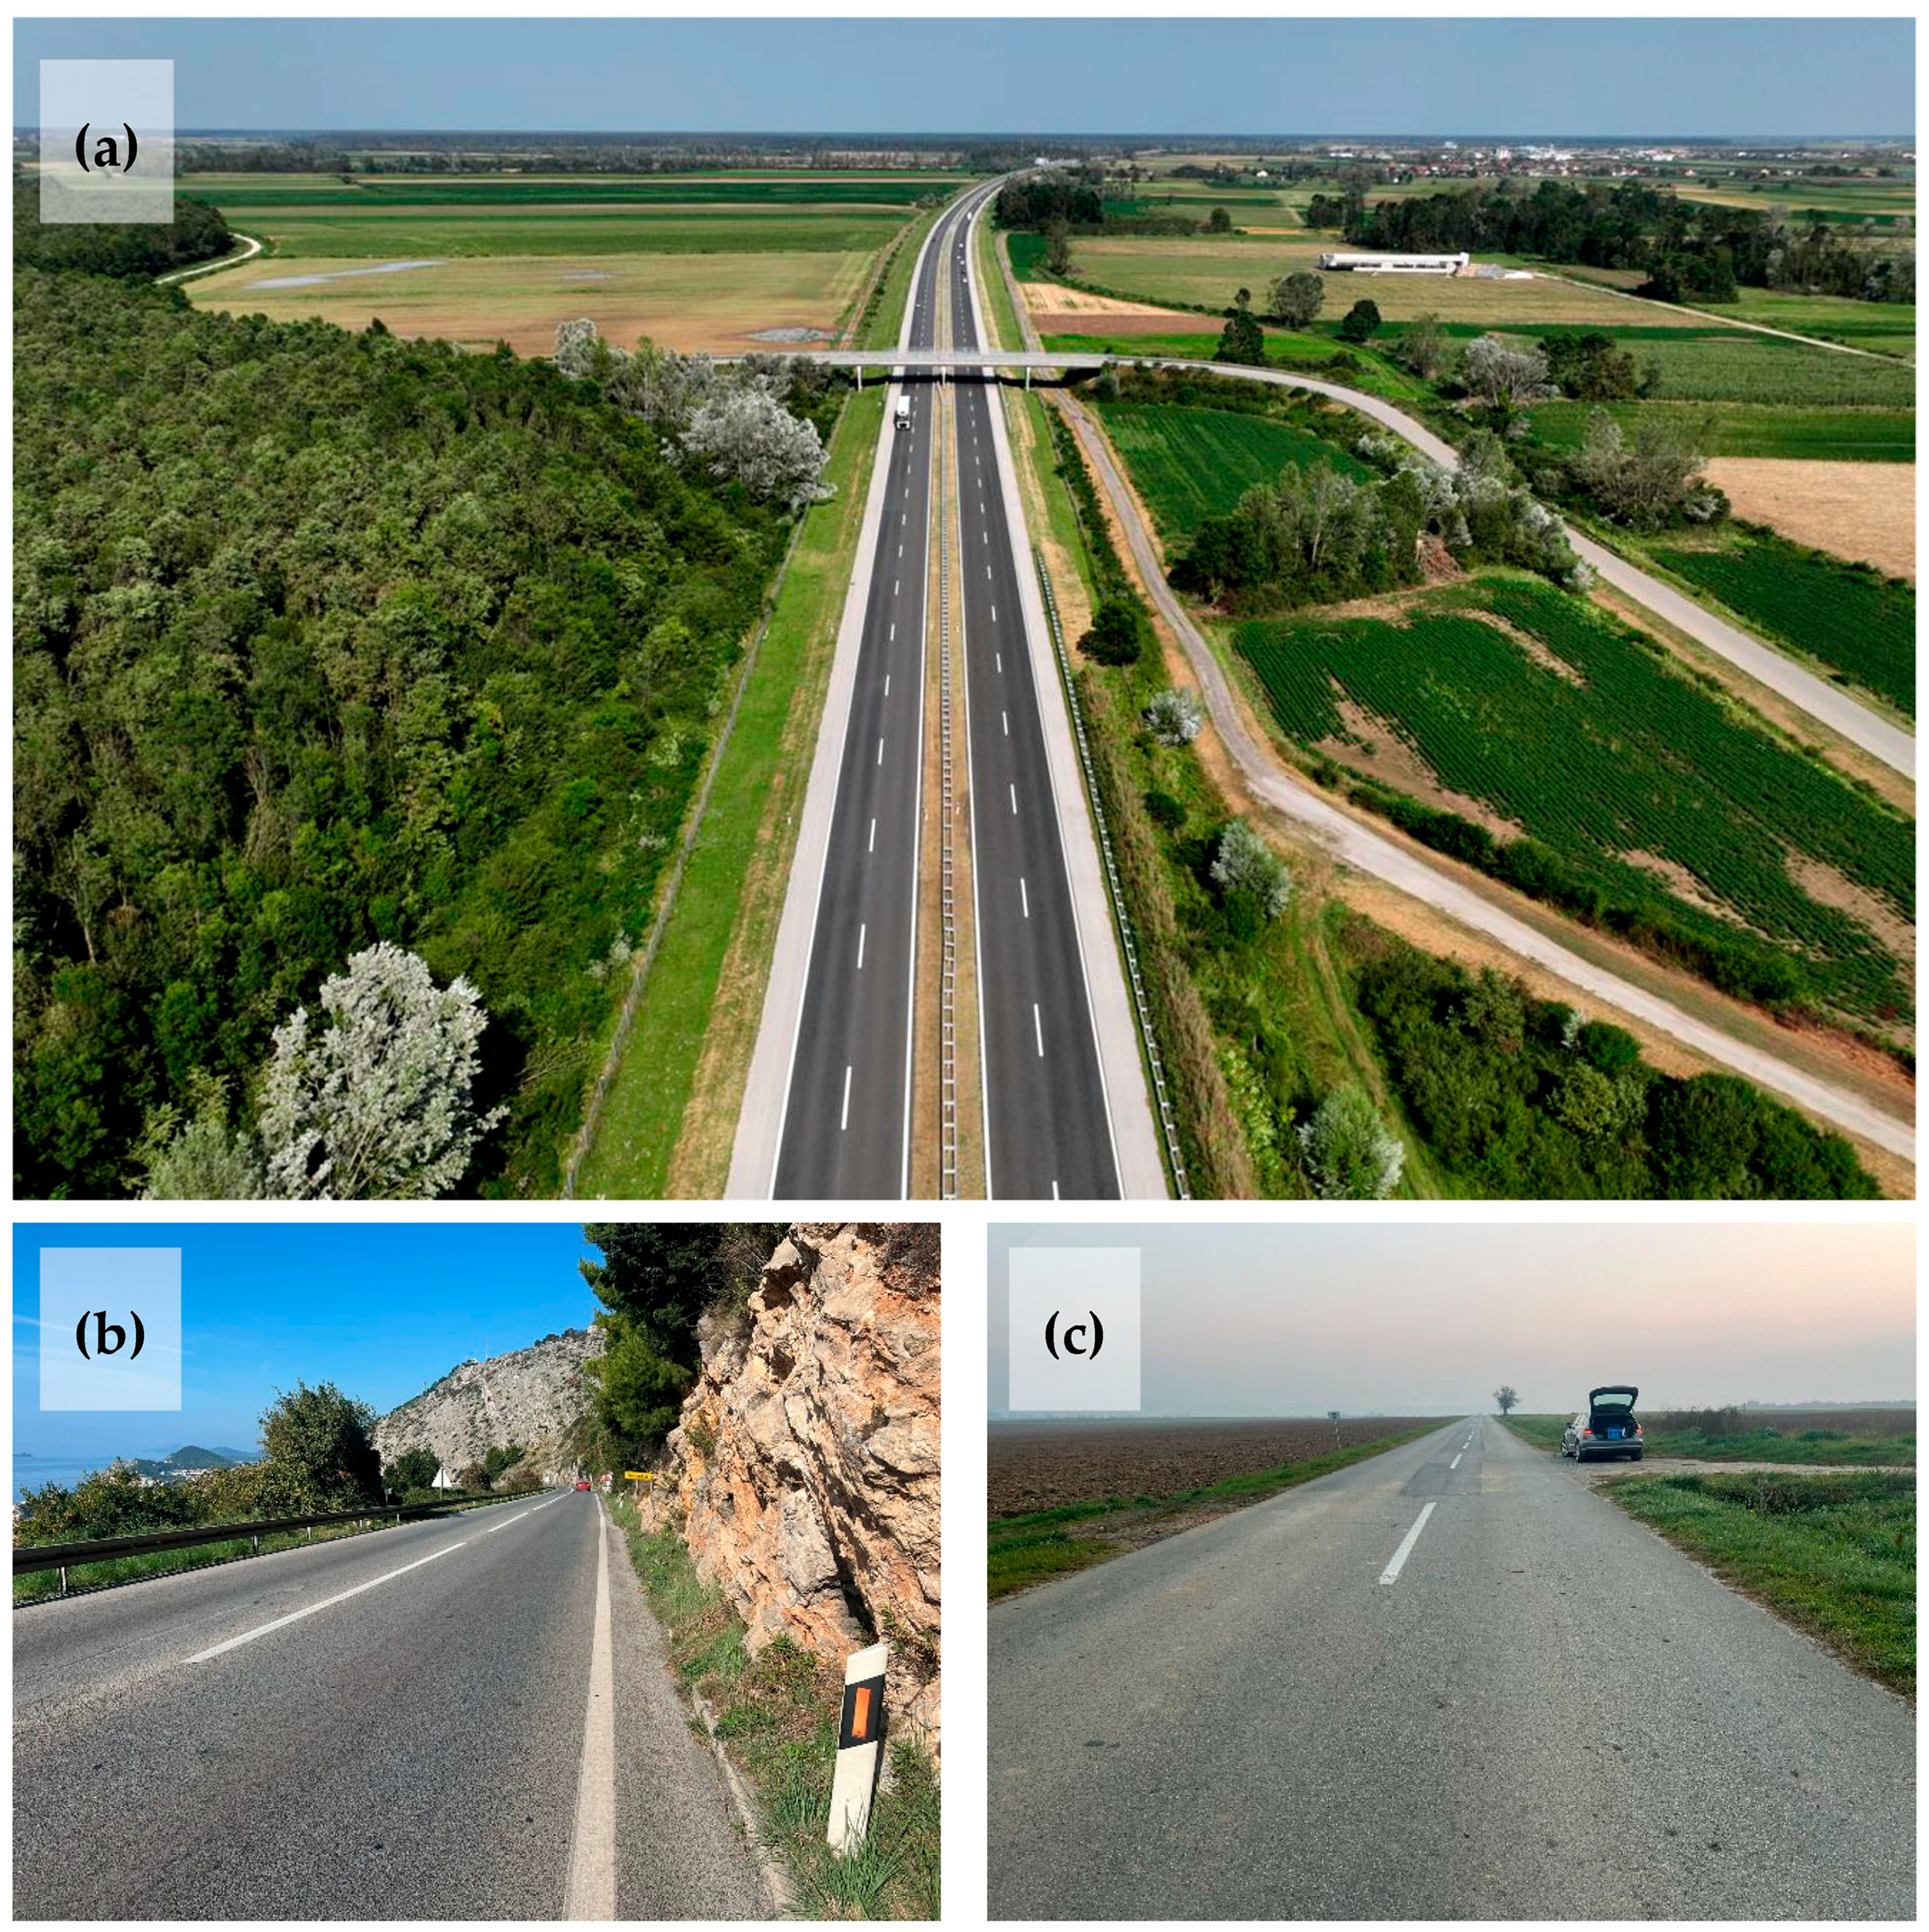
A typical motorway, state road, and county road in Croatia are shown in Figure 2.
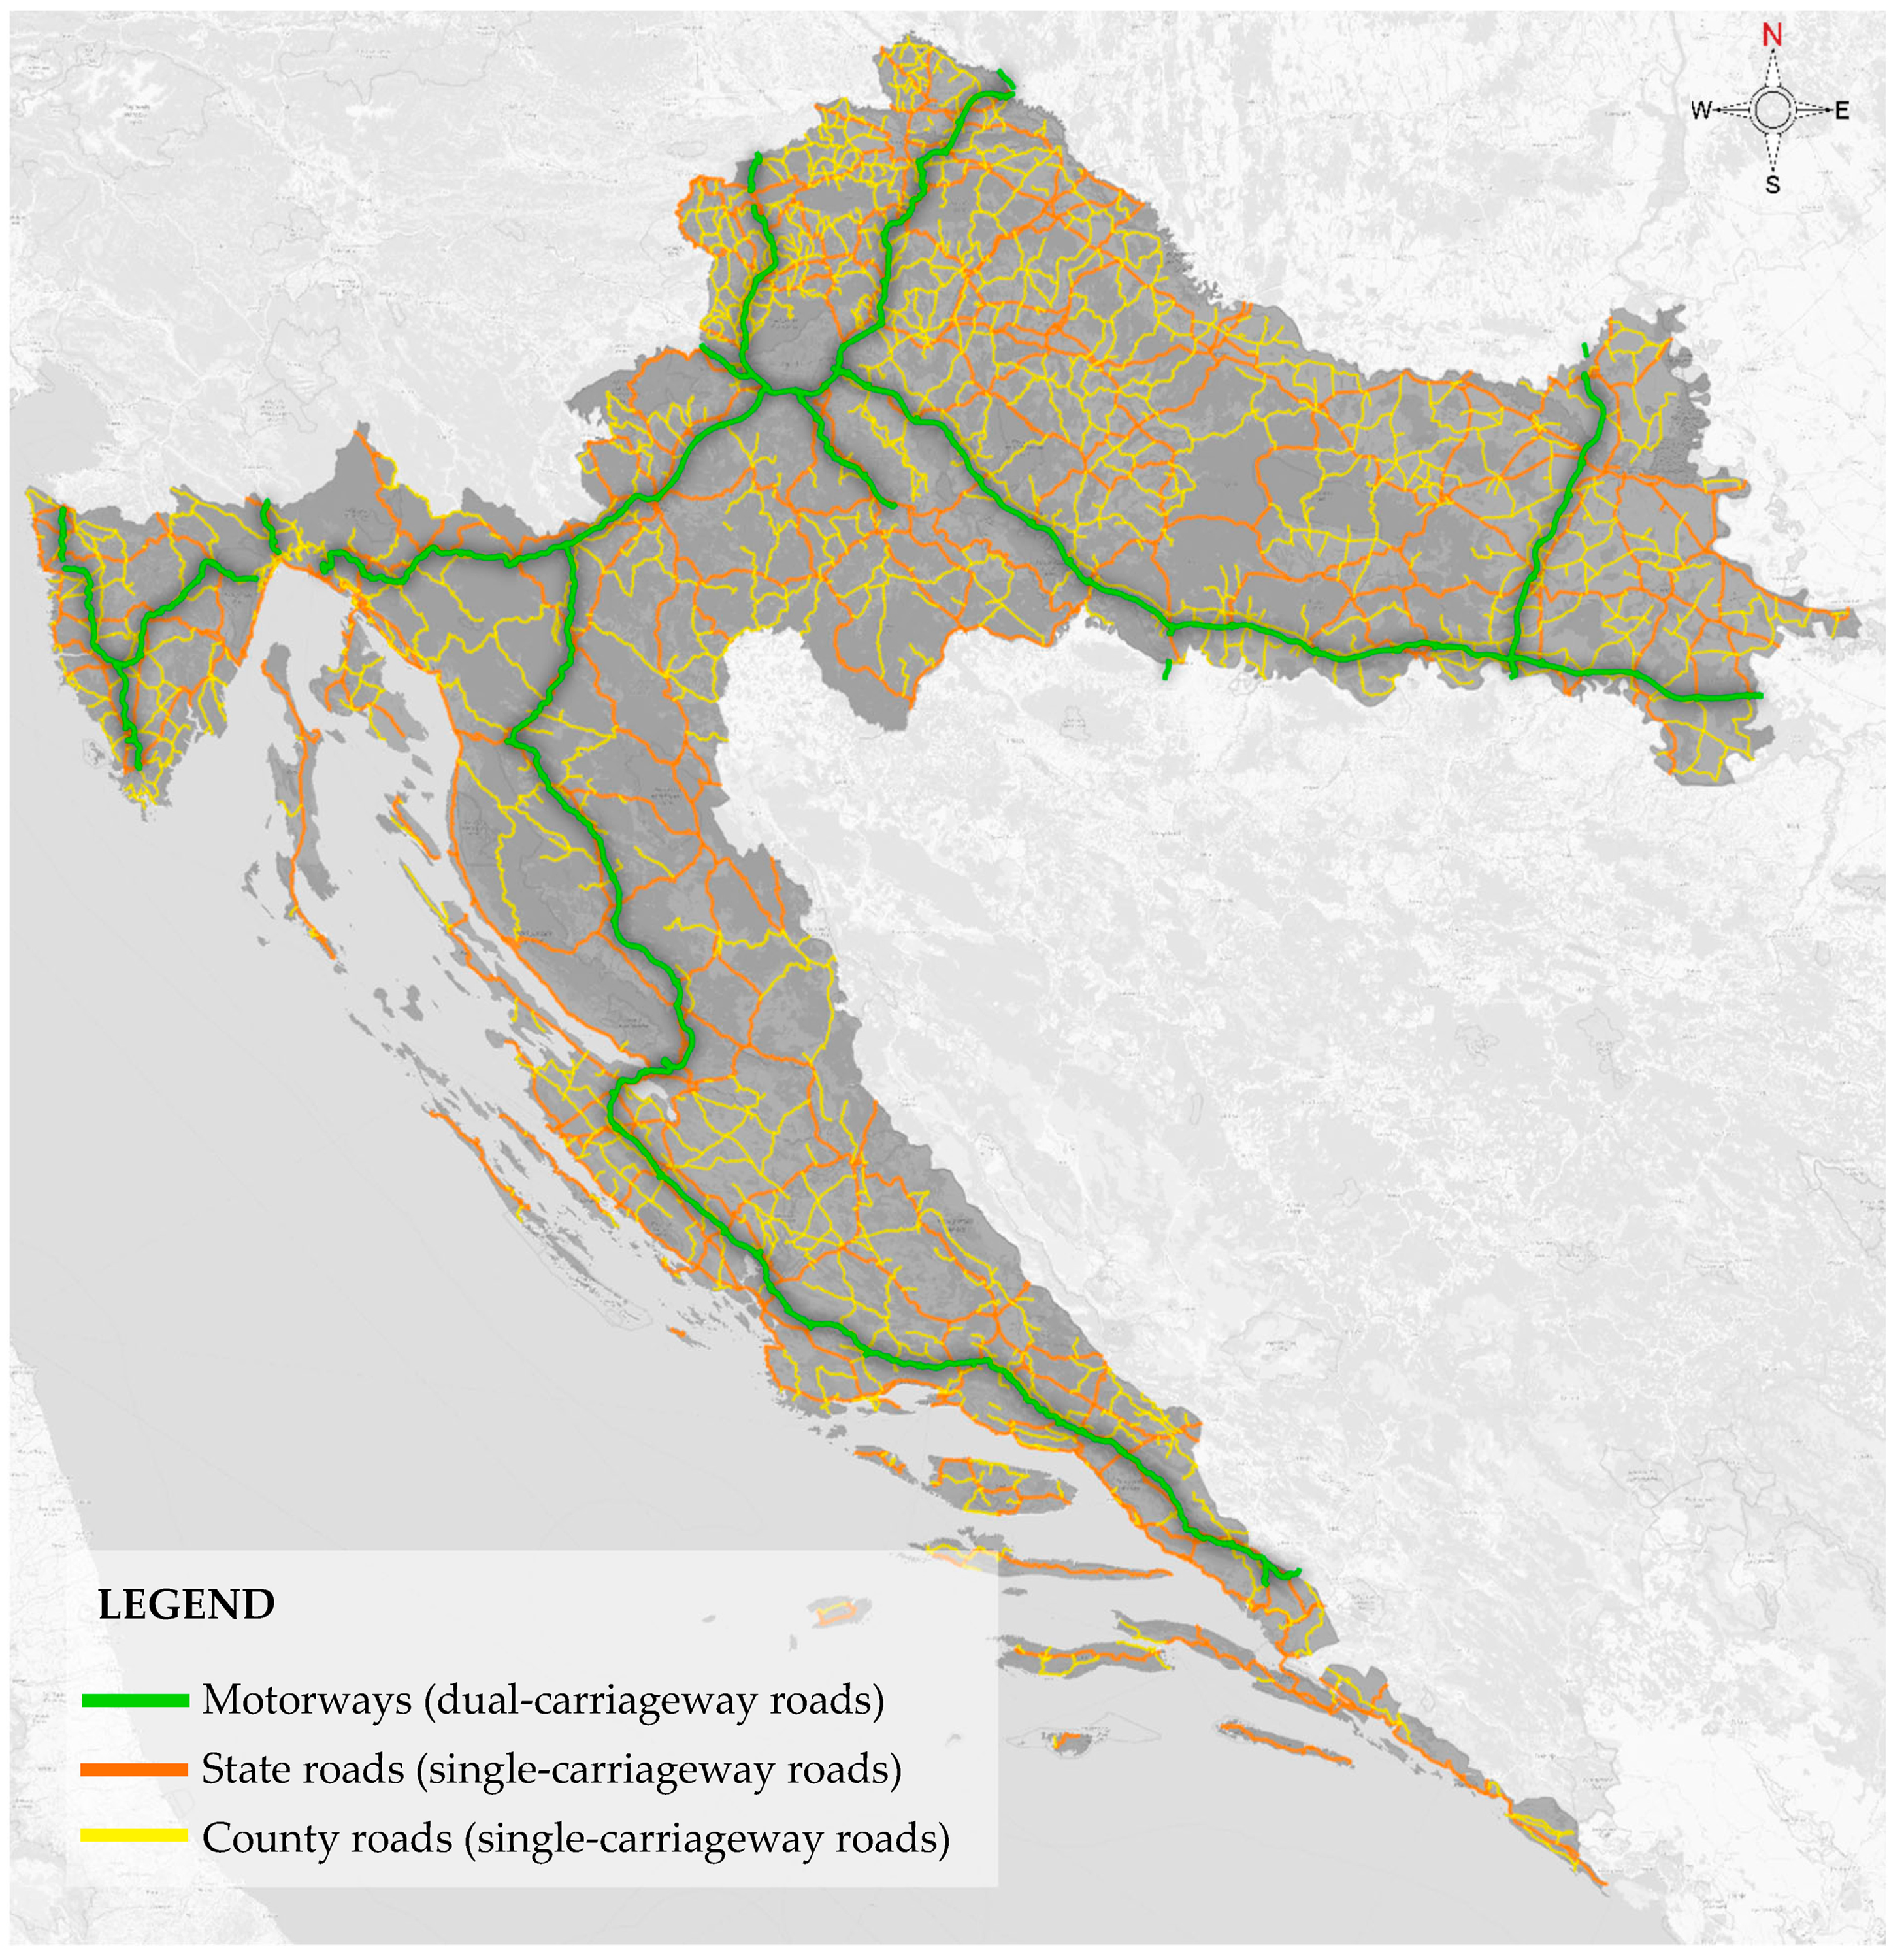
The network comprising motorways, state roads, and county roads is shown in Figure 3.

2.2.1. Locations Selection

To ensure a representative and methodologically valid dataset, the locations for speed measurements were selected following a structured approach. According to the previously described metrics, and to ensure relevant results, this study focuses on road tangents on single-carriageway roads (state roads; county roads) and dual-carriageway roads (motorways). The following parameters were considered for selecting the representative locations:
  • Efforts were made to select locations as randomly as possible within the constraints of the road network, ensuring national representativeness and covering all major geographic regions (Central Croatia, Slavonia and Baranja, Lika, Istria, Dalmatia);
  • Existing speed limit (70, 80, 90 km/h for single-carriageway roads; 100, 110, 120, 130 km/h for dual-carriageway roads). It should be noted that, in Croatia, the default speed limit outside of urban areas is 90 km/h, unless otherwise indicated by a posted speed limit sign;
  • Other relevant road design, vehicle structure, road capacity, and other contributing elements;
  • Speeds were measured during the week (from Monday to Friday) at off-peak hours so that the established patterns of driver behavior could be disregarded or excluded from consideration;
  • To maintain data integrity and to avoid behavioral bias, all selected locations were situated away from fixed or mobile speed enforcement zones;
  • Only extra-urban areas were considered to eliminate the influence of urban traffic patterns and to minimize the impact of pedestrian activity;
  • Measurements were conducted exclusively on tangent segments, with a minimum tangent length of 100 m;
  • Within each tangent, measurements were performed at various positions (beginning, middle, and end) to account for potential intra-segment speed variations;
  • Each location also met the following geometric and environmental criteria:
    A straight and uniform road section, free from nearby horizontal curves that could affect vehicle speed;
    This study did not consider the horizontal tangents in vertical curves;
    A section where it is technically possible to exceed the posted speed limit;
    Sections exhibiting a range of longitudinal slopes (from −5.20% to +5.20% (single-carriageway roads); from −4.00% to 4.00% (dual-carriageway roads));
    Locations chosen across different terrain types (flat, hilly, mountainous);
    Locations exhibiting a variety of AADT and ASDT values.
To ensure adequate traffic flow for statistical relevance, locations were only included if a minimum hourly traffic volume of 10 vehicles was observed during the measurement window. Additionally, favorable weather conditions were a prerequisite for conducting measurements—locations experiencing rain, snow, strong winds, or extreme temperatures during the survey period were excluded to ensure consistency under free-flow and safe driving conditions.
In total, 44 measurement locations (22 cross-sections) were selected and distributed across the Croatian road network, as shown in Figure 4 and detailed in Appendix A.
As shown in Appendix A, the locations encompass various speed limits as well as different values for AADT and ASDT. It should however be noted that, for dual-carriageway roads, AADT and ASDT data were only available for whole cross-sections (both carriageways) [43]. Therefore, the AADT and ASDT values for each carriageway were assumed to be half of the AADT and ASDT values of the dual-carriageway cross-sections. Similarly, for single-carriageway roads, AADT and ASDT data were only available for the entire cross-section (both directions of travel) [43]. Therefore, the AADT and ASDT values for each direction of travel were assumed to be half of the AADT and ASDT values of the single-carriageway cross-sections.

2.2.2. Speed Measurement

The vehicles’ speeds were measured differently for single- and dual-carriageway road tangents. On single-carriageway road tangents speeds were measured by speed radar; on dual-carriageway road tangents speeds were measured based on video recordings captured using an unmanned aerial vehicle (UAV)—drone. A more detailed explanation is provided below for each road type.
  • Speed Measurement—Single-carriageway Road tangents
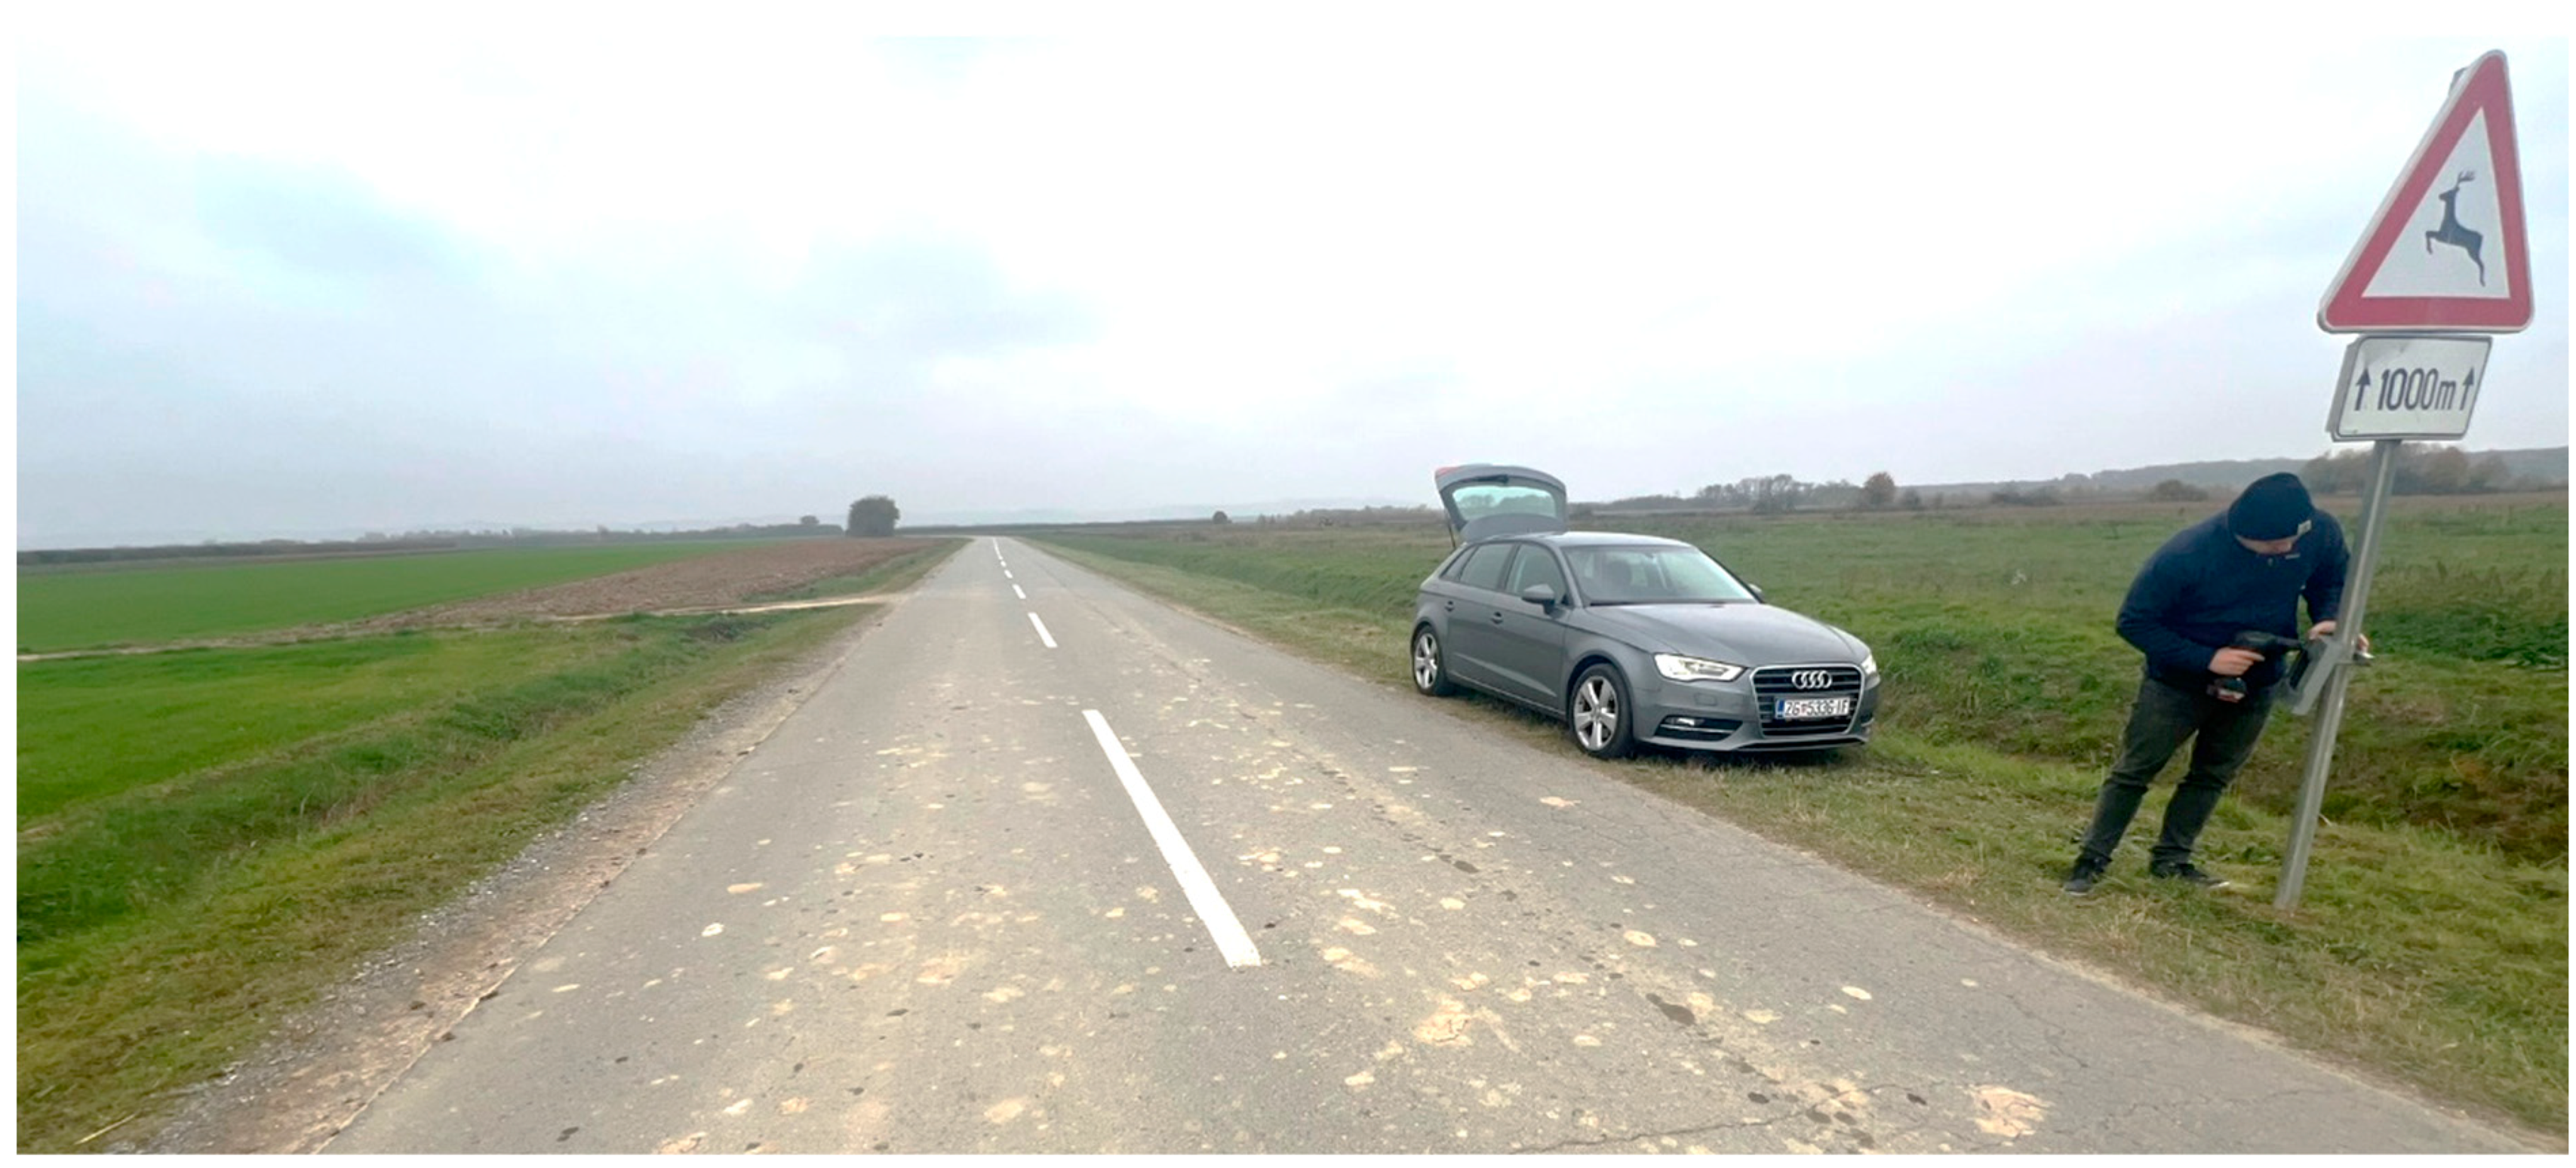
Speed data for single-carriageway road tangents were collected through field surveys which covered 12 cross-sections, corresponding to 24 measurement locations. Speed data were gathered using a radar device mounted discreetly on vertical road signs to ensure minimal visibility to drivers (Figure 5). Speeds were collected on days with moderate temperatures, low cloud cover, and no precipitation, wind, or fog, ensuring good visibility. Prior to conducting field research, data on the current road conditions were collected to avoid issues such as temporary road closures or traffic diversions caused by roadworks, accidents, or other incidents.
The radar device recorded the exact time of passage of each vehicle, its direction of travel, speed, and length (based on which the vehicle category could be determined). The radar device recorded vehicle speeds with high precision, capturing natural driving behaviors uninfluenced by the awareness of ongoing measurements. The radar-based data were subsequently processed to remove anomalies and to ensure reliability.
  • Speed Measurement—Dual-carriageway Road Tangents
Speed data for dual-carriageway road tangents were measured based on video recordings captured using an unmanned aerial vehicle (UAV)—the MAVIC 2 PRO drone (Figure 6). This drone is specifically equipped with GPS/GLONASS satellite positioning systems and advanced sensor systems for intelligent navigation, detection, and avoidance of stationary and moving obstacles during flight. It is also fitted with a fully stabilized video camera capable of recording an exceptionally high-quality 4K Quad HD video with a resolution of 3840 × 2160 pixels at a frame rate of up to 30 frames per second, as well as capturing photographs with a resolution of 12 megapixels.
To ensure an unobstructed flight of the unmanned aerial vehicle during traffic flow recording and to maintain a high level of aerial video quality, the recording days were selected based on weather forecasts predicting favorable conditions at the selected locations. These included days with moderate temperatures, low cloud cover, and no precipitation, wind, or fog, ensuring good visibility. Prior to conducting the field research, data on the current road conditions were collected to avoid issues such as temporary road closures or traffic diversions caused by roadworks, accidents, or other incidents. The distance for speed measurements was defined along a road tangent approximately 100 m in length. Only vehicles traveling under free-flow traffic conditions were considered, ensuring that the recorded speeds were not influenced by interactions with other vehicles. Given these conditions, it is reasonable to assume that vehicle speeds remained stable over the observed segment, with no significant acceleration or deceleration occurring within this short distance. Consequently, the measured speeds can be considered representative of the constant speed travel under natural driving conditions. It should also be emphasized that the methodology used for determining vehicle speeds from aerial video footage (drone) was previously validated at a separate test location on the Zagreb bypass (dual-carriageway road—motorway). At this location, a radar speed measurement device was installed in parallel with the drone-based recording system. The speeds obtained from both methods were subsequently compared to assess measurement accuracy. The comparison revealed no significant discrepancies between the radar and the drone-derived speed values, thereby confirming the reliability and validity of the drone-based speed measurement approach used in this research.
The aerial video recordings at the selected locations were conducted using the drone during the period from 7 July 2023 to 8 August 2023, where the measurements were conducted during the week (Monday–Friday), excluding the weekend. [45]. The recordings were carried out during relevant off-peak hourly intervals, selected based on an analysis of hourly traffic flow fluctuations. Detailed information on the measurement periods is provided in Table 1.
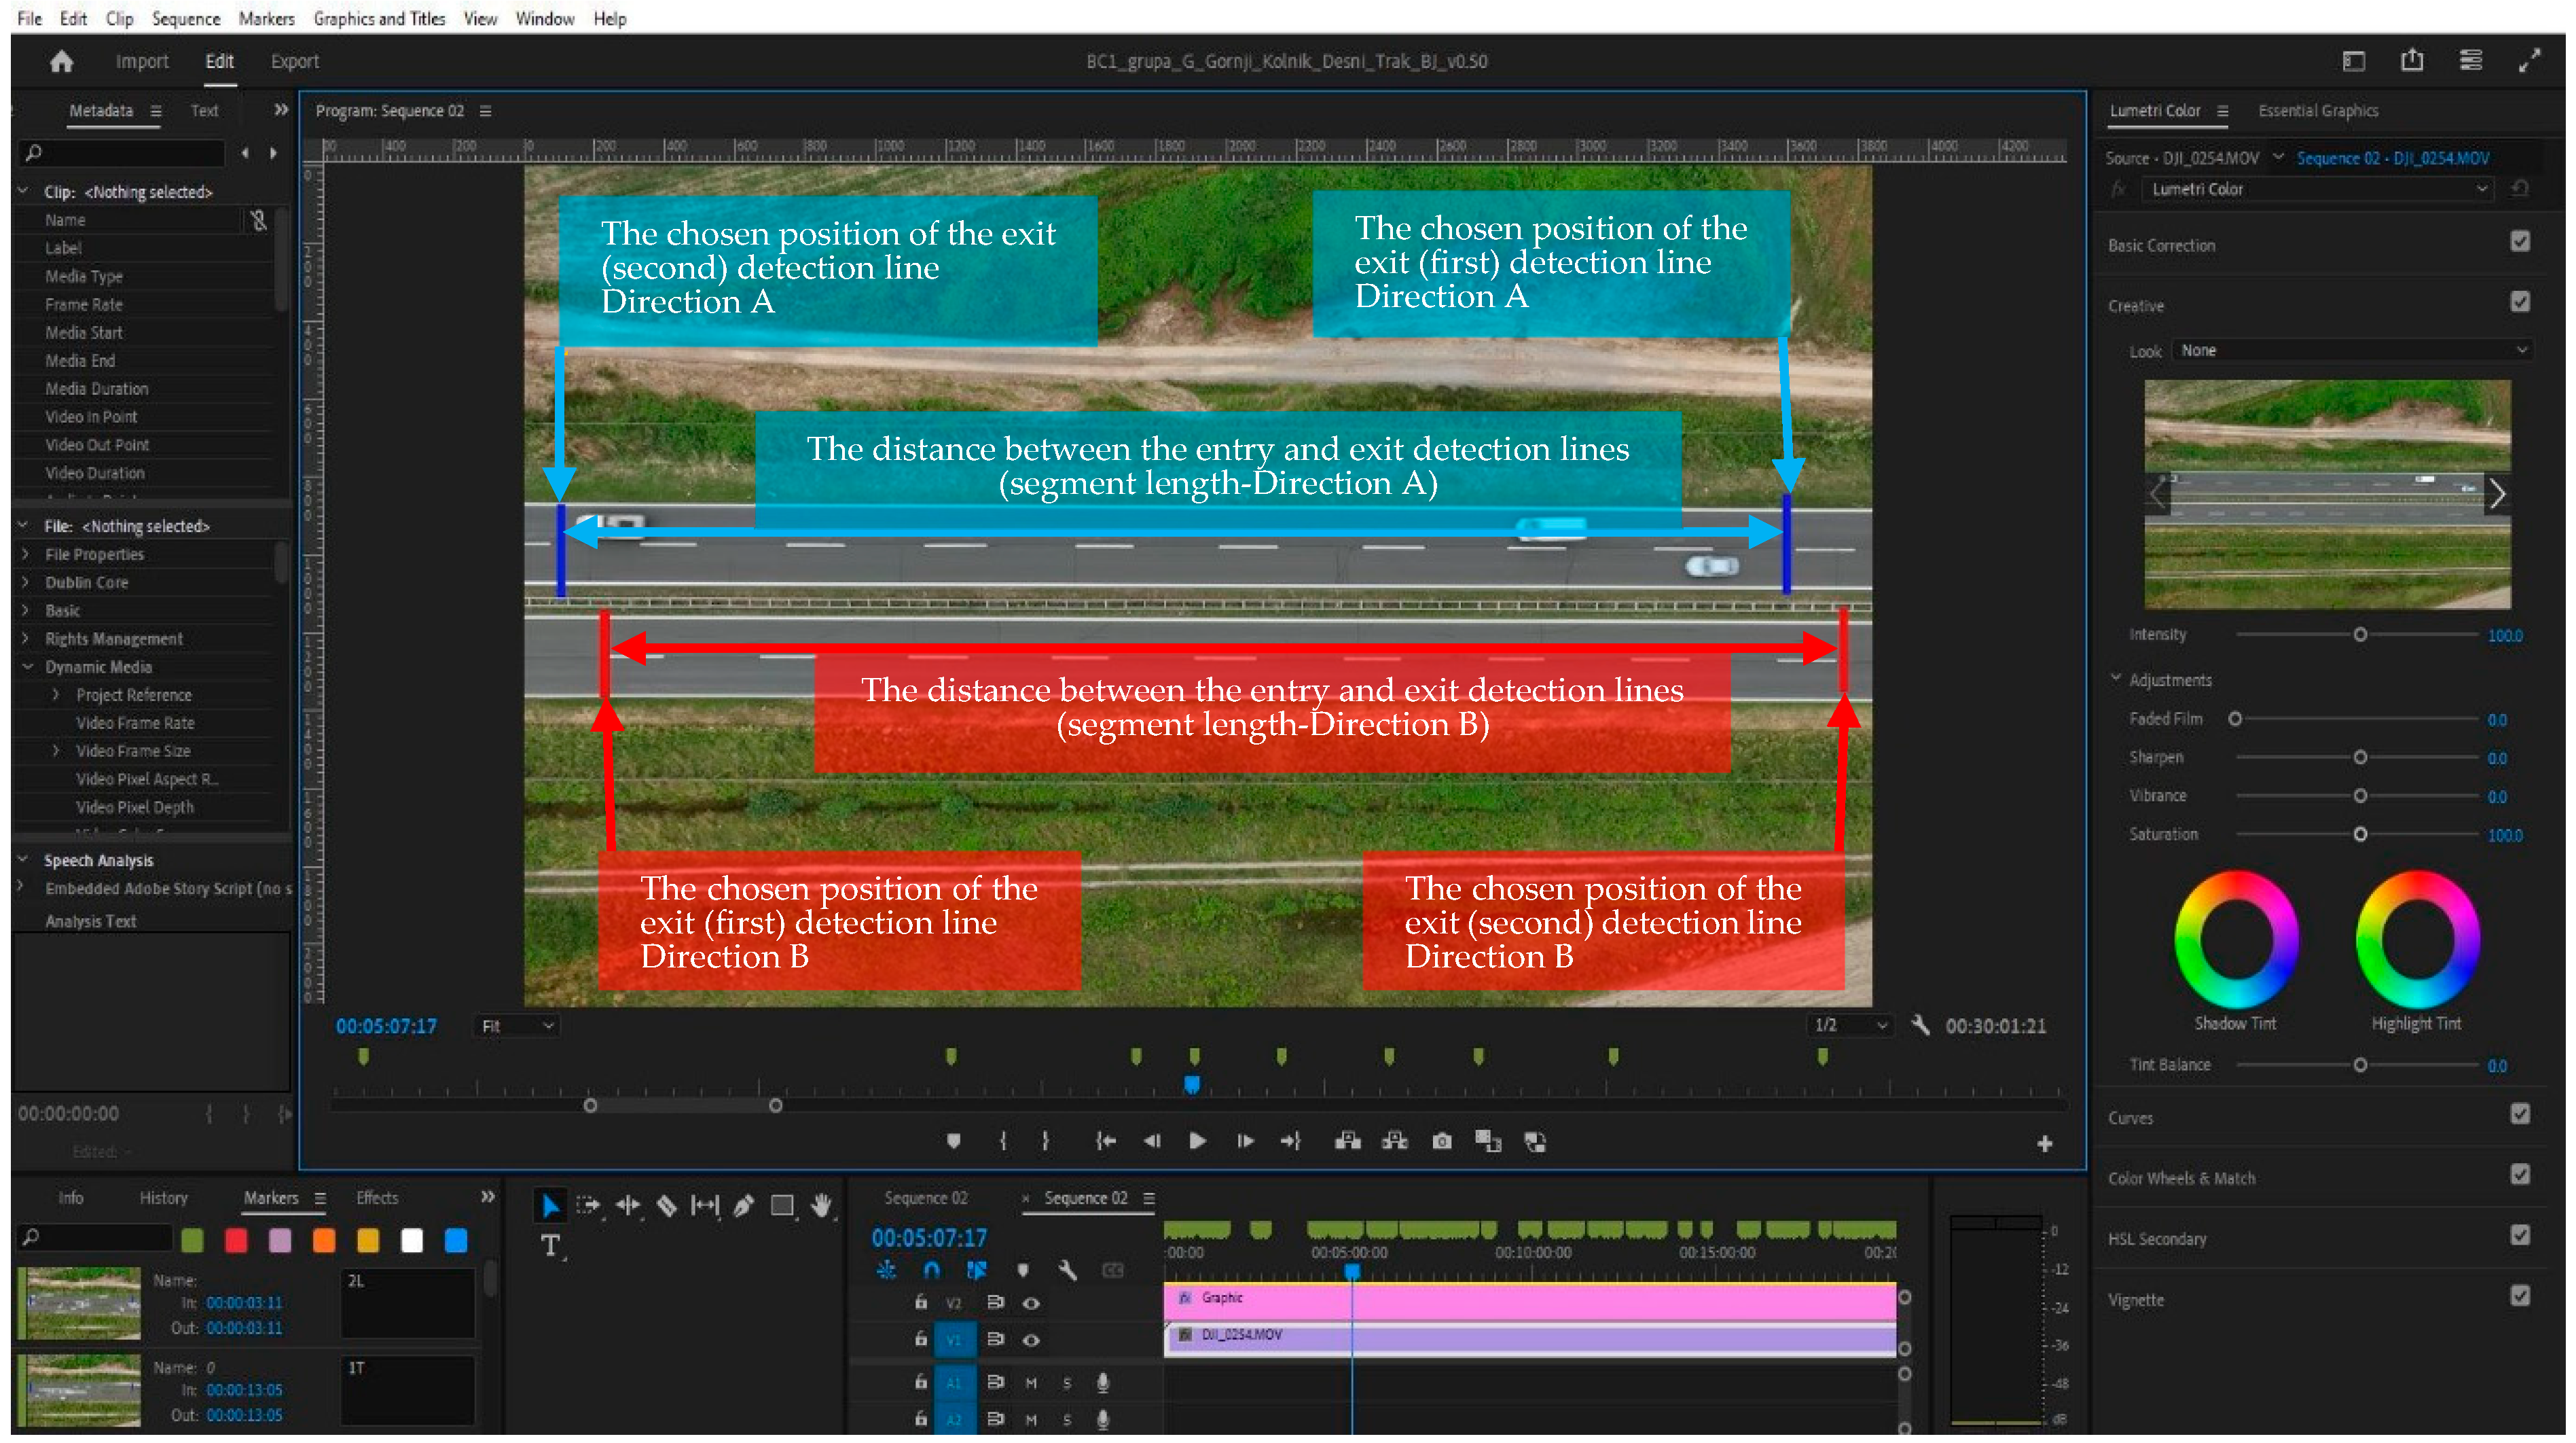
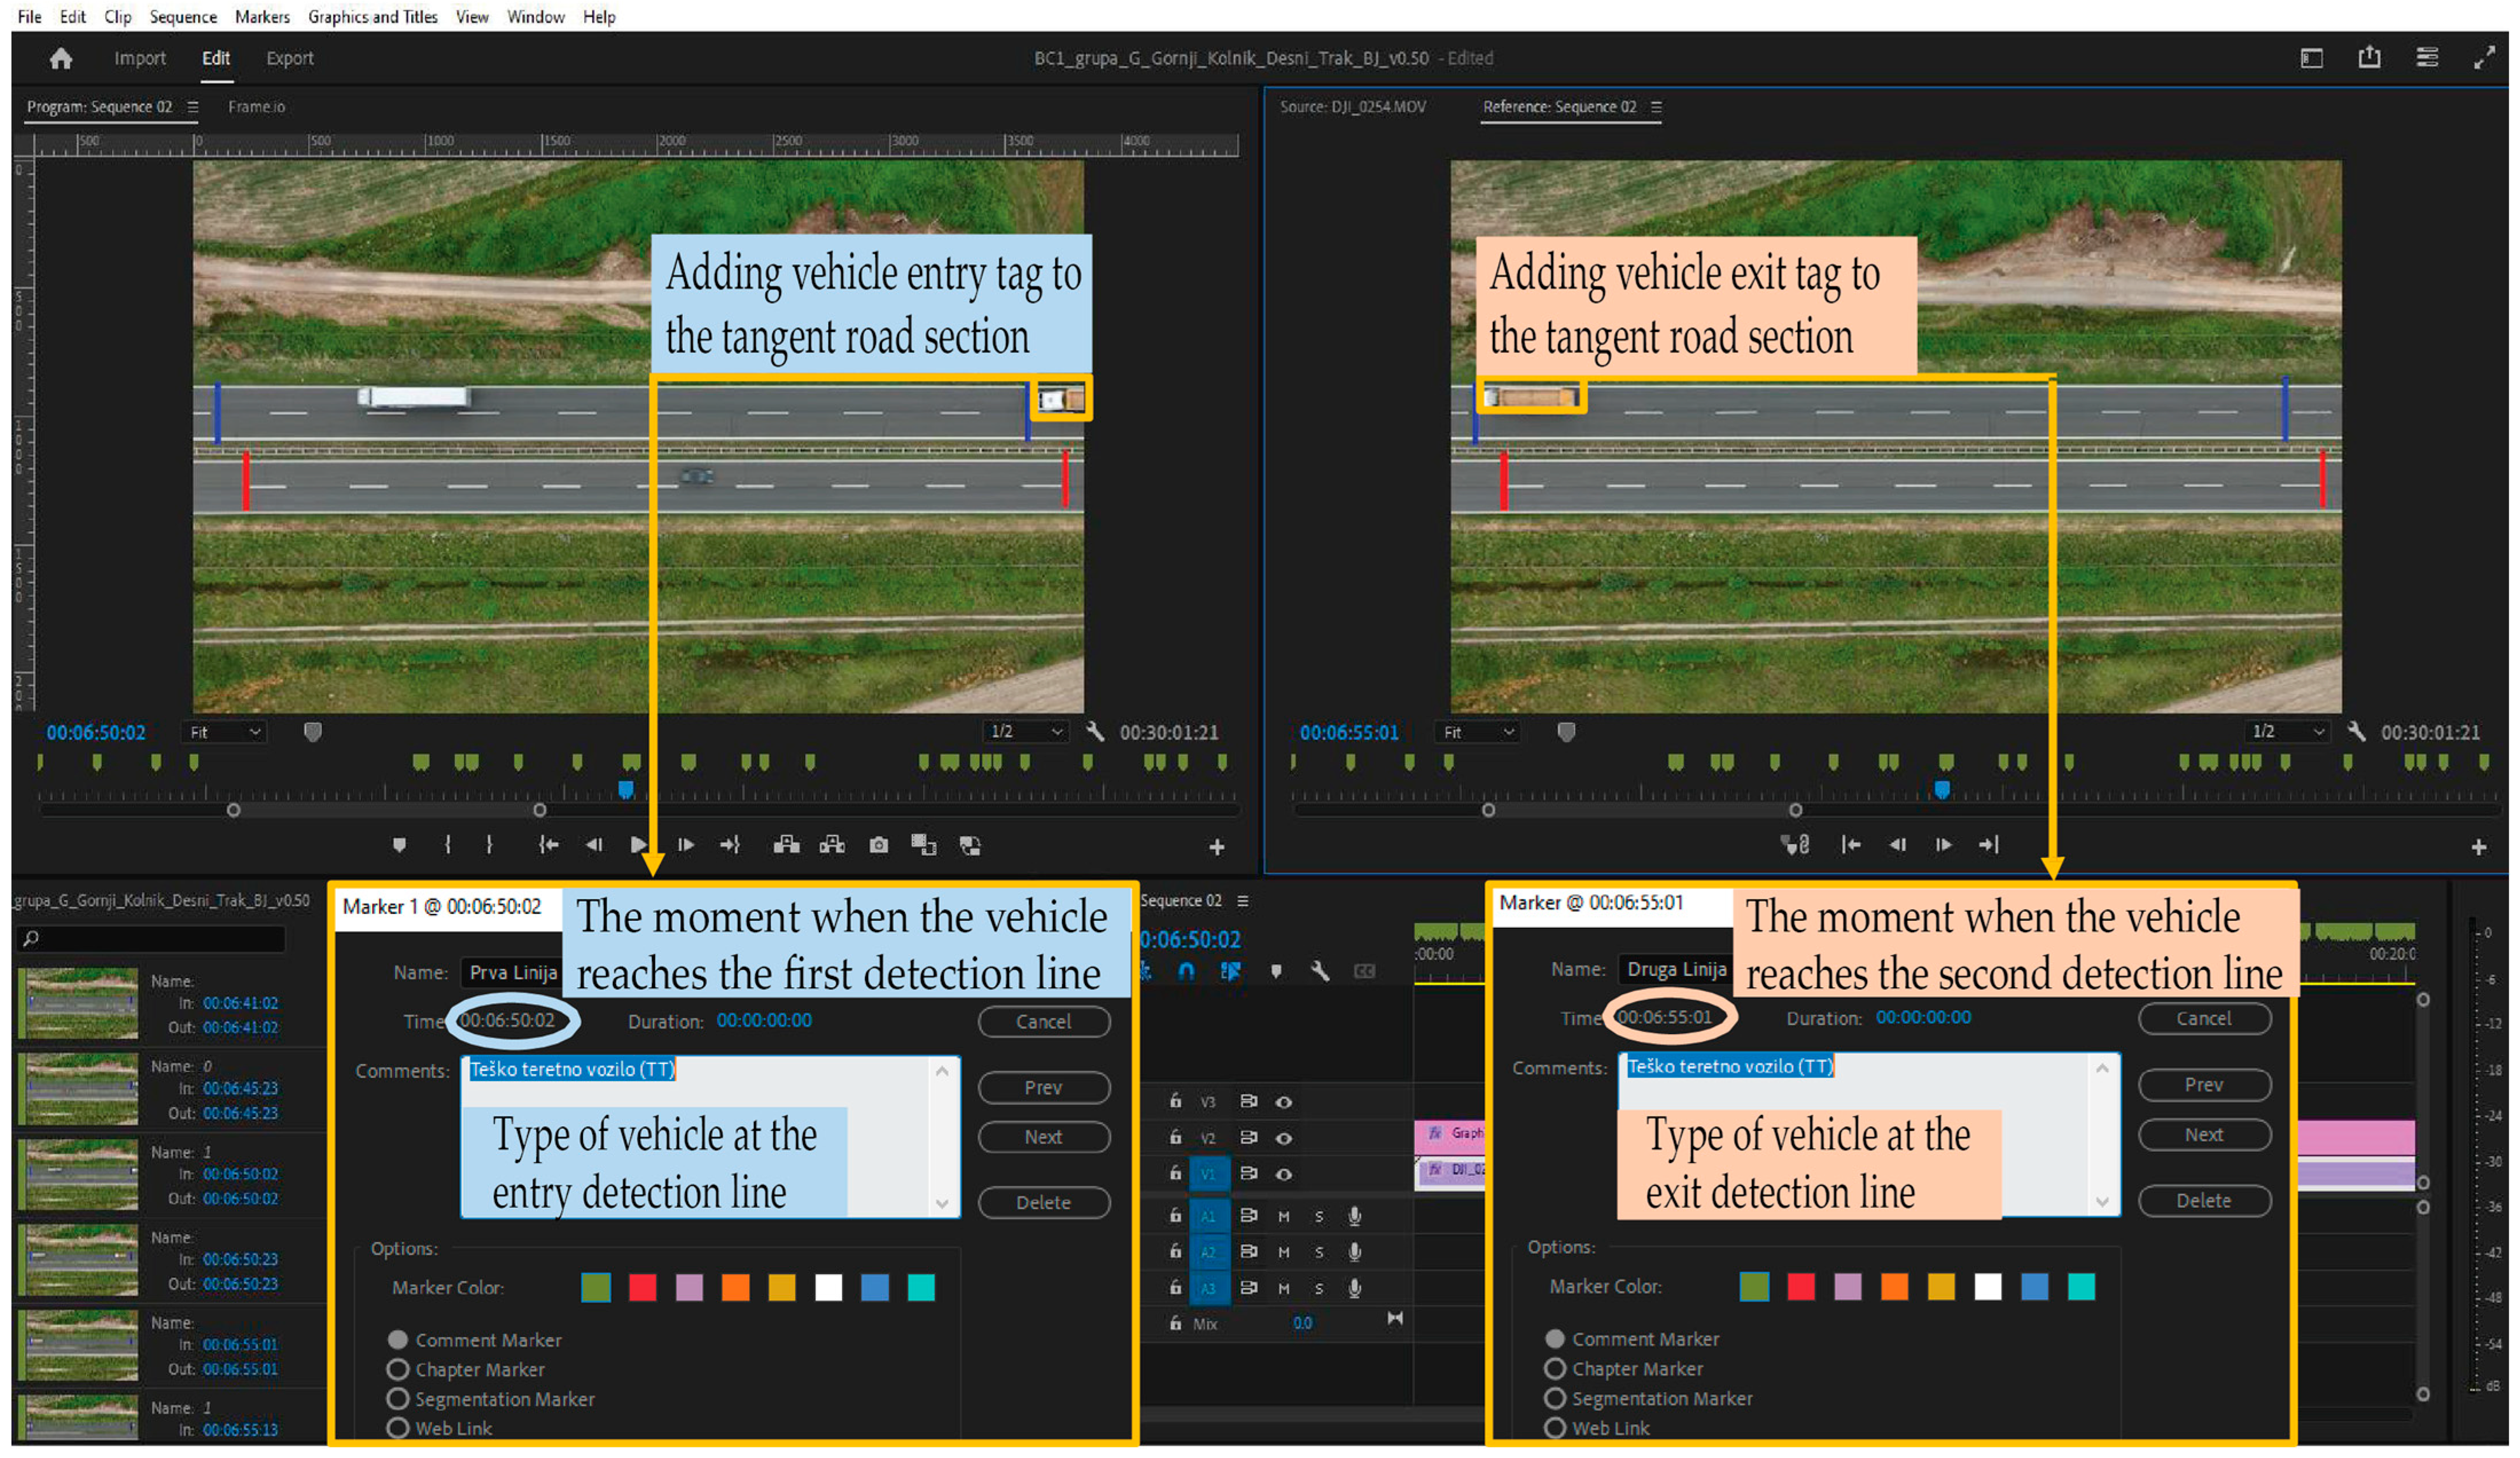
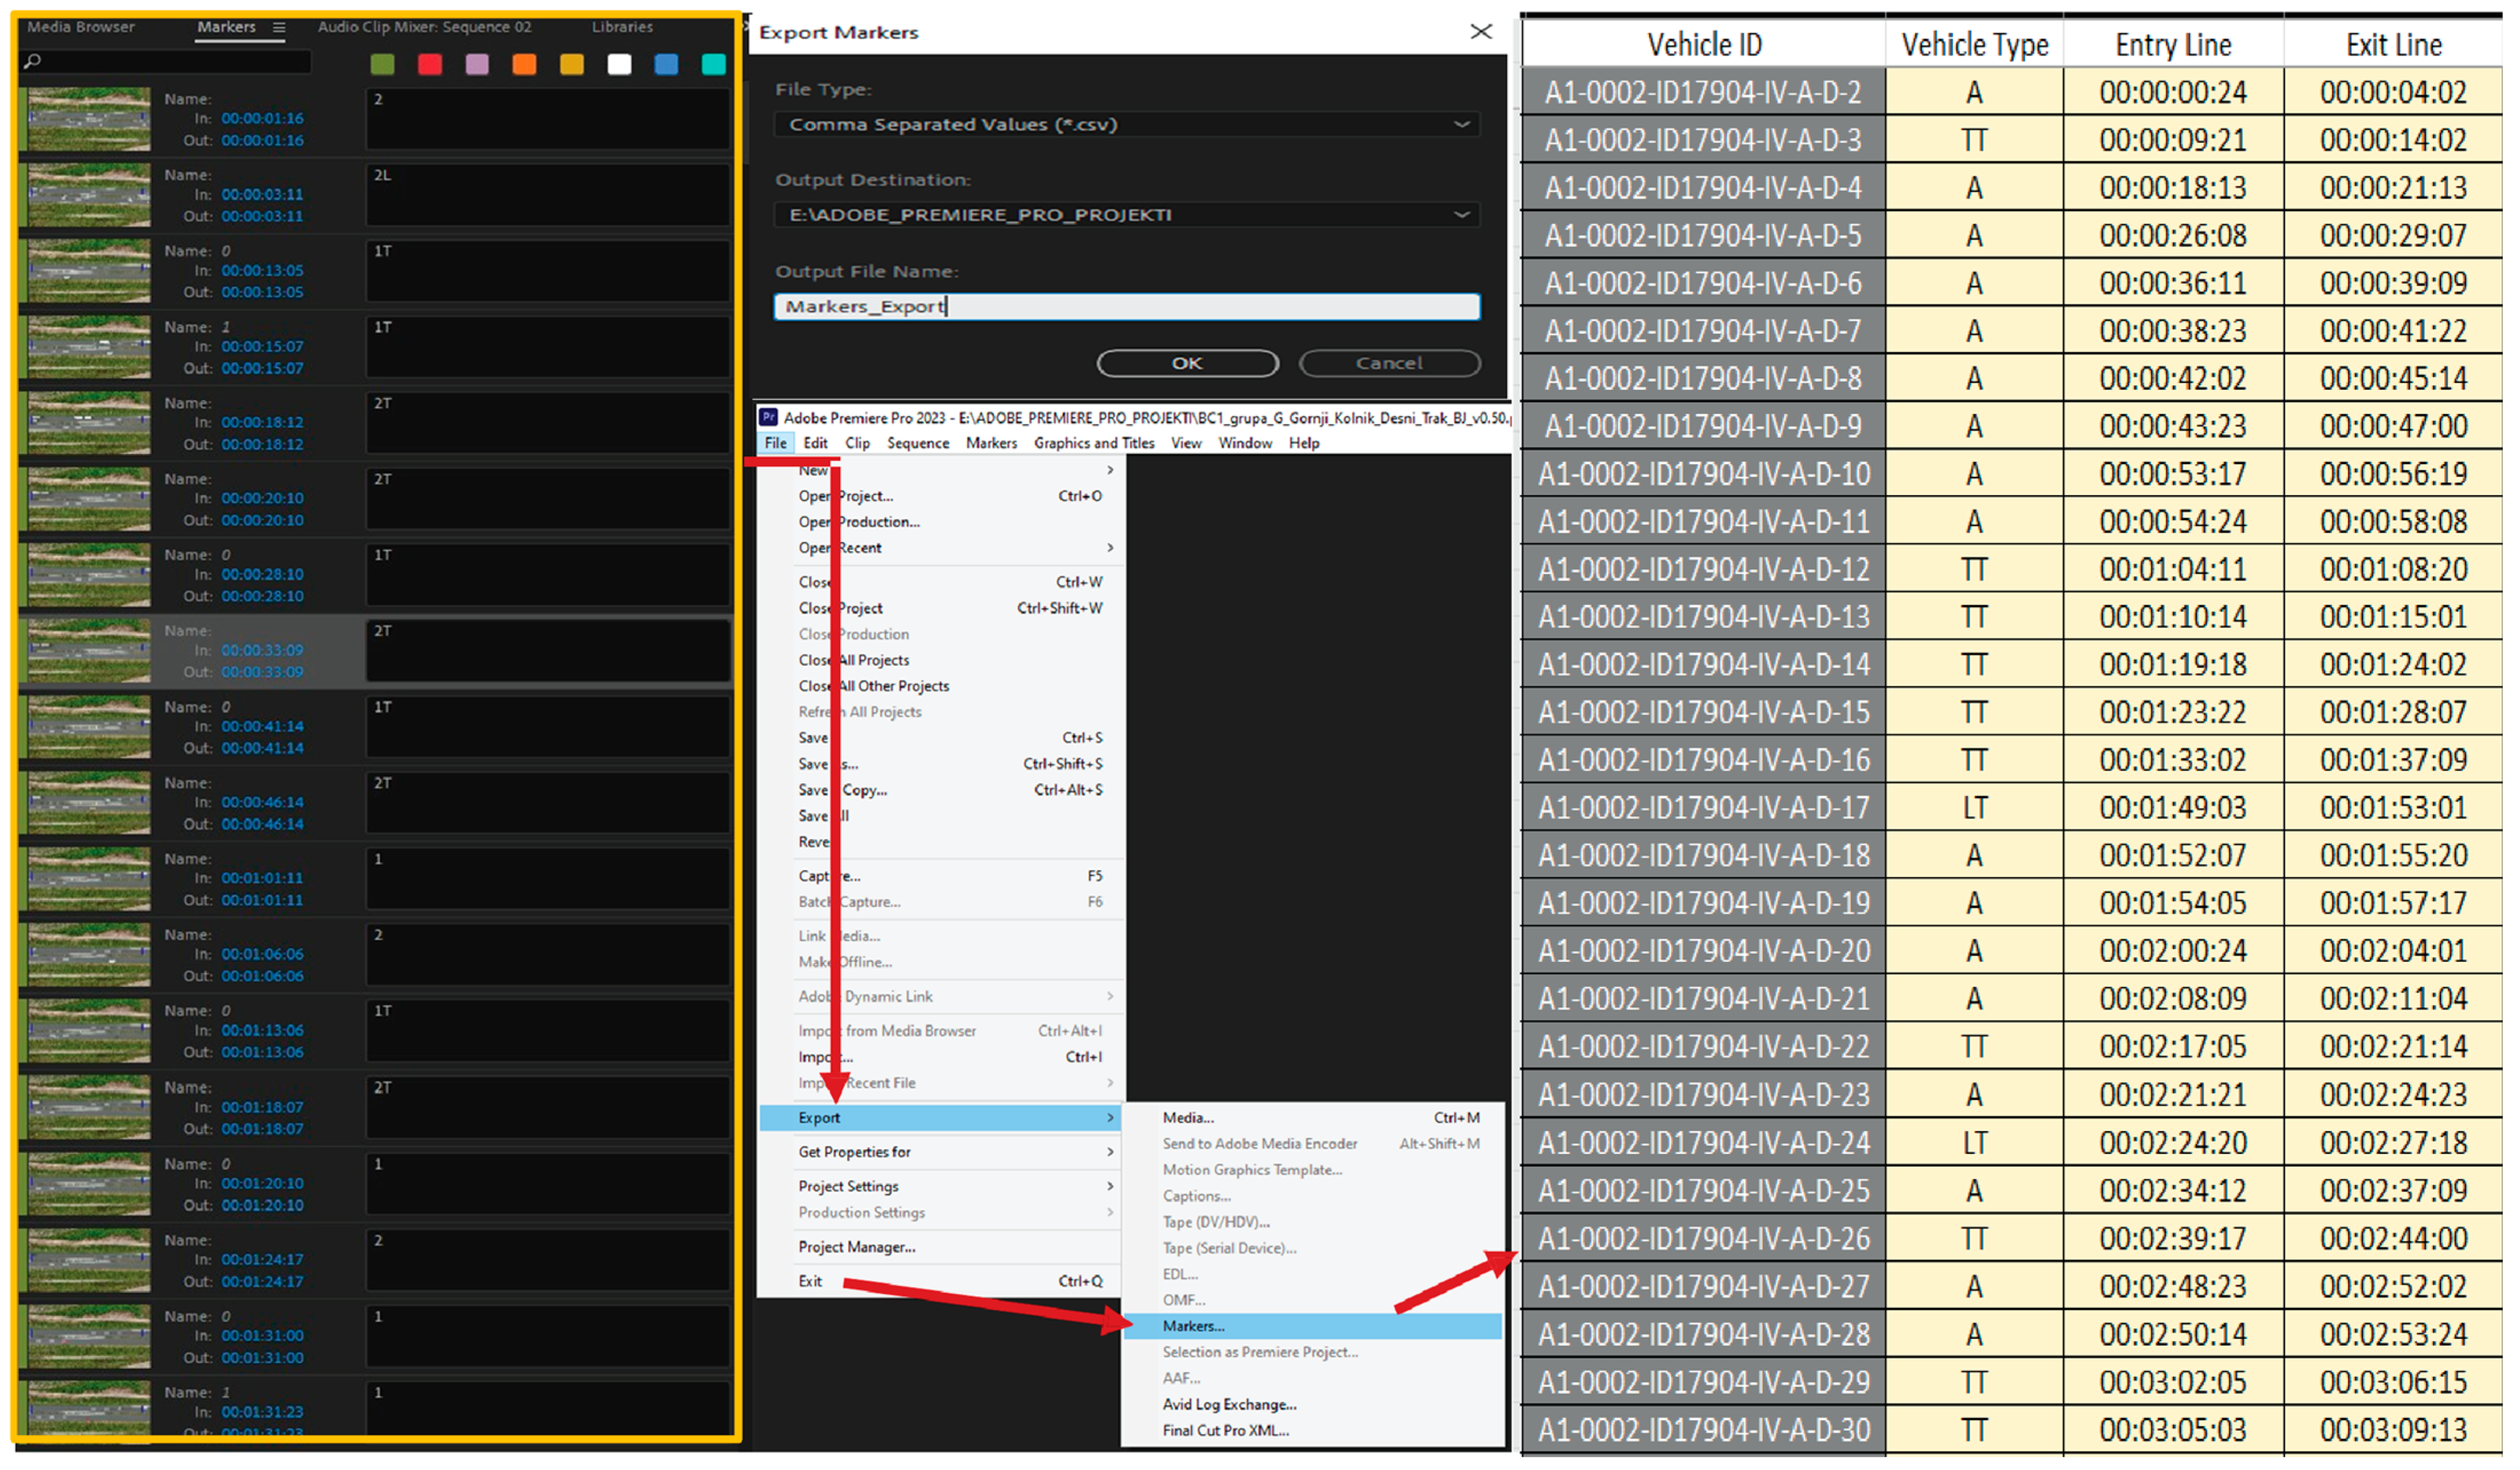
To determine the speed values, the aerial video footage was first converted into a format suitable for data processing, and then imported into the Adobe Premiere Pro 2023 software. Within this software, the video footage underwent detailed review, preprocessing, and analysis, during which the timepoints of the individual vehicles passing the entry and exit detection reference lines on each carriageway of the observed locations were identified. Upon a vehicle crossing the defined detection reference lines, the video frame’s timestamp and the vehicle type present at the detection line were recorded (Figure 7, Figure 8 and Figure 9) [45].
The data collected during each vehicle’s passage over the entry and exit detection lines were exported from Adobe Premiere Pro 2023 into CSV format files upon completing the video frame processing and annotation procedure. The data contained within the CSV files, generated from the processed aerial footage of specific motorway segments, were subsequently merged into a unified output attribute table. This table, created based on the described data processing procedure, was stored in a separate XLSX format file, suitable for performing the subsequent steps of statistical analysis. Subsequently, the speeds of individual vehicles in the traffic flow were determined based on the lengths of the observed motorway segments and the calculated travel times through each segment [45].

2.2.3. Data Cleaning and Finalizing

The research conducted recorded a total of 45,850 samples/vehicles. After data cleaning, a total of 14,854 samples/vehicles remained, upon which this research is based.
For the purposes of this research, only passenger cars were considered. Motorcycles were excluded due to their small share in the traffic flow, and their inclusion would not have provided a representative or statistically significant sample. In addition to motorcycles, heavy goods vehicles and buses were also not considered, as they are subject to lower speed limits than passenger cars. It is also worth noting that most heavy goods vehicles operate with tachographs, which can be used to detect speed violations, thus indirectly contributing to speed control in some sense. Furthermore, it should be highlighted that only off-peak data were used in this research to avoid the speeds associated with typical peak-hour driving behavior.
To obtain data on the operating speeds, only speed values recorded under free-flow traffic conditions were considered. This means that a 5-s gap between vehicles was taken into account to ensure that the vehicle ahead did not influence the speed of the following vehicle [22]. After filtering the data as described, the 85th percentile speeds were calculated for each direction of travel (single-carriageway roads) i.e., for each road lane (right-driving lane; left-overtaking lane–dual-carriageway roads), at each cross-section.

2.2.4. Factors Identification

In this research, an analysis of 24 factors on single-carriageway road tangents and 16 factors on dual-carriageway road tangents was conducted to assess their potential influence on the vehicles’ operating speeds. These factors were selected based on their relevance to traffic flow and roadway design, as well as their potential to impact driver behavior and, consequently, the operating vehicles’ speeds. The factors analyzed included both roadway characteristics and traffic flow factors. Roadway characteristics encompassed parameters, such as lane width, speed limit, and longitudinal slope, among other parameters, all of which are critical in defining the physical constraints and perceived driving comfort on road tangents. Additionally, traffic flow factors, such as annual average daily traffic (AADT), average summer daily traffic (ASDT), and heavy goods vehicles share, among other factors, were examined to understand if and how the variations in traffic volume and vehicle distribution influence the operating speed. These factors were assessed for their individual impact on the operating speed on single- and dual-carriageway road tangents. Detailed factor identification forms the foundation for the subsequent statistical analysis, aimed at elucidating the relationships between these factors and the observed operating speeds. Accordingly, the factors that were analyzed for single- and dual-carriageway road tangents are shown in Appendix B.
  • Factors Identified—Single-carriageway Road Tangents
The external roadside environment can influence driver behavior and, consequently, operating speed. Three distinct passenger-side conditions were identified, including cutting sections, guardrails, and flat area. Each of these conditions can affect driver perception and lane positioning, with cut sections and guardrails potentially inducing a more cautious driving approach. However, following that, shoulder presence and composition were analyzed at each location, with five possible classifications, including absence of a shoulder, extremely narrow shoulder, unpaved (earth/grass) shoulder, gravel shoulder, and paved (asphalt/concrete) shoulder. The shoulder type may affect vehicle stability and driver confidence, therefore influencing speed selection. Similarly, the edge line quality on the passenger side was assessed subjectively in the following four categories: absence of an edge line, poor, satisfactory, and excellent. Clearly marked and visible edge lines may contribute to improved lane discipline and potentially higher operating speeds, while faded or missing lines may cause drivers to reduce their speed (or vice versa) [46]. Visibility was assessed in terms of forward sight distance, considering terrain configuration, longitudinal slope, and vegetation. This assessment was conducted subjectively, with three classifications, including poor, good, and excellent. It should be noted that visibility was assessed in terms of horizontal sight distance, as vertical curves were not included in the scope of this analysis. Horizontal visibility was evaluated based on the driver’s line of sight along the road alignment, which can vary significantly depending on several contextual factors. These factors include terrain configuration, road width, and the positional characteristics of the road segment, such as whether the segment is located in a cutting, on an embankment, or on flat terrain. Such conditions may substantially influence a driver’s ability to perceive the road ahead and to respond to potential hazards, thereby affecting speed selection. Reduced visibility can lead to lower speeds, as drivers may compensate for the increased risk of sudden obstacles. Moreover, the density of lateral accesses, measured as the number of lateral accesses in one previous kilometer may have an impact on the driver—a higher access density may result in lower operating speeds due to increased potential for vehicle interactions and conflict points. Pavement quality was evaluated based on observable distress features, such as rutting, cracking, and potholes. Three classifications were established, including poor, satisfactory, and excellent pavement conditions. Poor pavement conditions can lead to speed reductions as drivers may need to maneuver to avoid road imperfections.
The length of the tangent section, both preceding and following the measurement point, could have a role in determining vehicle speeds. Extended tangents may encourage higher speeds due to the absence of horizontal curvature, while shorter tangents preceding sharp curves may necessitate speed reductions. These lengths were precisely measured using QGIS 3.32.3 software. Speed limits serve as a regulatory measure influencing driver behavior. The default speed limit for single-carriageway roads outside urban areas in Croatia is 90 km/h, though variations due to local conditions may alter actual operating speeds. Furthermore, traffic volume and composition were considered through the average annual daily traffic (AADT) and average summer daily traffic (ASDT) values, obtained from Croatian Roads Ltd. [43]. Higher AADT and ASDT values generally correlate with lower operating speeds due to increased vehicle interactions and congestion effects. Lane width was directly measured on site using precise measuring tools. Wider lanes typically facilitate higher speeds, whereas narrow lanes can contribute to cautious driving and speed reduction. Longitudinal slope could impact the vehicles’ acceleration and deceleration patterns, particularly on extended gradients. Indeed, empirical studies have confirmed the impact of longitudinal slope on speed variation [47,48,49]. This parameter was measured using field equipment to ensure accuracy. On the other hand, a crash ratio is an indicator that was derived by calculating the ratio of registered vehicles to speed-related crashes within the county where each site is located. This factor was defined as the ratio between the number of recorded speed-related crashes and the number of registered vehicles within a specific county in Croatia, both measured over a one-year period. This annualized metric serves as a normalized indicator of speed-related crash frequency relative to the size of the vehicle fleet in each county. By accounting for the number of registered vehicles, the crash ratio enables a more accurate comparison of road safety conditions across counties with differing vehicle ownership levels. The variable was introduced to capture the potential regional variations in driver behavior, enforcement intensity, and road infrastructure quality, which may influence the prevalence of speed-related incidents. A higher accident ratio may suggest an increased likelihood of speed-related incidents, influencing driver behavior and risk perception.
Defined by Croatian regulations [50], the design speed (Vp) represents the maximum safe speed under optimal weather conditions. This factor reflects roadway design intent and provides a benchmark for expected operating speeds. Terrain classification—flat, hilly, or mountainous—was included as a key factor due to its influence on vehicle speeds. The study by Martinelli et al. [51] indicated that operating speeds tend to be higher in flat areas and lower in hilly and mountainous regions due to challenging road geometry. The presence of guardrails enhances roadside safety and can encourage higher speeds by providing a perceived safety buffer. Conversely, roads without guardrails may prompt cautious driving. Similarly, shoulder lanes provide additional maneuvering space, which could potentially influence speed selection. Also, two road categories were analyzed, namely state roads and county roads. State roads generally exhibit superior design characteristics and maintenance, accommodating higher traffic volumes compared to county roads. The share of heavy goods vehicles and buses could also be an important factor. Large vehicles generally reduce speeds due to their lower acceleration capabilities and extended braking distances. Data on vehicle composition were sourced from Croatian Roads Ltd. [43]. Finally, the disruptive presence factor captures the influence of roadside infrastructure elements that may affect driver behavior and operating speed. This includes features such as bus stops, lay-bys, rest areas, pedestrian crossings, and similar elements located within or in close proximity to the observed road segment. The presence of these features can introduce potential conflict points, requiring drivers to reduce speed preemptively due to the increased likelihood of vehicle deceleration, pedestrian activity, or unexpected maneuvers [52,53]. As such, these factors represent localized disturbances to the otherwise uniform driving environment of tangent sections, and their inclusion in the analysis helps to account for reductions in speed that are not attributable to road geometry or traffic volume alone, but rather to contextual roadside conditions that influence risk perception and driving decisions.
  • Factors Identified—Dual-carriageway Road Tangents
Tunnels have a potential impact on driving speeds due to narrower lanes, an absence of emergency lanes, and lower speed limits. Additionally, the enclosed environment of tunnels alters driver perception and behavior, contributing to reduced speeds. This parameter was quantified by summing the lengths of tunnels over the designated distance (previous 20 km) using the official road network data.
The posted speed limit may directly influence operating speeds, often serving as the upper boundary for vehicle speed under free-flow conditions. This factor was obtained from regulatory signage at each study location, ensuring accuracy in reflecting the prescribed speed limits. Moreover, the research has demonstrated that lane width influences driving speed, with wider lanes generally supporting higher speeds due to increased perceived safety margins [54,55]. Lane width was measured using drone high-resolution imagery, providing precise data on this parameter.
Defined by Croatian regulations (Official Gazette 110/2001 and 90/2022) [50], the design speed represents the maximum safe speed under optimal weather conditions. This factor reflects the intent of roadway designers and policymakers to ensure safety and functionality. Data on the design speed (Vp) were derived from the official design documents and engineering standards.
The distance from the preceding infrastructure facility (e.g., junction, rest area, bridge, etc.) was included as a factor due to its potential impact on speed changes. These distances were measured using geospatial analysis tools, accounting for features that may disrupt or influence steady traffic flow.
Similar to the previous object distance, the following object distance factor accounts for the proximity of upcoming infrastructure that could influence driver behavior and speed. To be more precise, the following object distance refers to the distance from the measurement point to the next significant road infrastructure element, such as an interchange, rest area, or toll station. This parameter is relevant because the presence of such facilities is often announced in advance through vertical traffic signage, typically 1000 to 2500 m before the actual object. As a result, some drivers may begin adjusting their behavior in anticipation, such as changing lanes toward the right (driving) lane or reducing their speed to prepare for an exit maneuver. These anticipatory actions can influence the operating speed measured at the observation point, particularly if the upcoming object is within a range that drivers perceive as necessitating a preparatory response. Therefore, the following object distance serves as a proxy for evaluating the potential behavioral impact of upcoming infrastructure on vehicle speed and lane choice. Measurements were performed using geospatial tools, ensuring consistency with the methodology for the previous object distance.
The longitudinal slope of the road might significantly impact vehicle speeds, particularly on extended ascents or descents [47,48,49]. This parameter was measured using Google Earth, which provided accurate slope data.
The share of heavy goods vehicles (including buses) in traffic flow may affect operating speeds, particularly in the right (driving) lane where heavy goods vehicles predominantly travel. These shares were determined by analyzing the drone video recordings, enabling lane-specific evaluations.
The AADT and ASDT factors represent traffic volumes, and were obtained from official datasets. Since the data were available only at the cross-section level (both carriageways), values for the individual carriageways were assumed to be half of the total values.
Traffic flow density, defined as vehicles per kilometer per lane, may influence speed by affecting vehicle interactions [56]. Lane-specific traffic flow densities were calculated using the drone video recordings.

2.3. Data Analysis

The data collected for this study were subjected to a comprehensive statistical analysis using SAS JMP 18 Pro software. The primary objective of the analysis was to examine the relationships between the operating vehicle speeds (V85) and the various geometric, environmental, and traffic-related factors along the road tangents. This analysis aimed to identify the significant associations that could provide insights into speed behavior on both single- and dual-carriageway road tangents.
The first step in the data analysis process involved data cleaning, where anomalies and extreme outliers were identified and removed to minimize any potential distortions caused by measurement errors. Only passenger cars speed values recorded under free-flow conditions were retained to ensure that vehicle interactions did not confound the analysis.
For continuous variables, the distribution was first assessed using the Shapiro–Wilk test to determine whether the data followed a normal distribution. For variables that were normally distributed, the Pearson correlation was applied to assess the strength and direction of the relationship between the operating speed and the respective factors. For variables that did not meet the assumption of normality, Spearman’s rank correlation was used to assess the monotonic relationships, as this method does not assume normal distribution. A significance level of 0.05 was used to identify statistically significant relationships.
For categorical variables, a one-way analysis of variance (ANOVA) or t-test was employed to test statistically significant differences in operating speeds across the different levels of each categorical variable. If a significant difference was found, the Tukey–Kramer test was then used to perform pairwise comparisons between the levels of the variable, identifying where significant differences in the operating speed occurred and quantifying the magnitude of these differences.
The analysis was conducted separately for single- and dual-carriageway road tangents. On dual-carriageway road tangents, further distinctions were made between the right (driving) lane and the left (overtaking) lane to examine the influence of lane-specific factors, such as the share of heavy goods vehicles and traffic flow density.
The results of this analysis provided valuable insights into the factors influencing operating speeds, highlighting the relative contributions of geometric, environmental, and traffic-related variables to variations in speed. These findings formed the basis for the interpretation and discussion of this study’s results.

3. Results

3.1. Single-Carriageway Road Tangents

For the single-carriageway road tangents, the statistical analysis focused on examining the relationships between the operating speeds (V85) and various factors, both numerical and categorical. The approach varied depending on the type of variable being analyzed (Table 2).
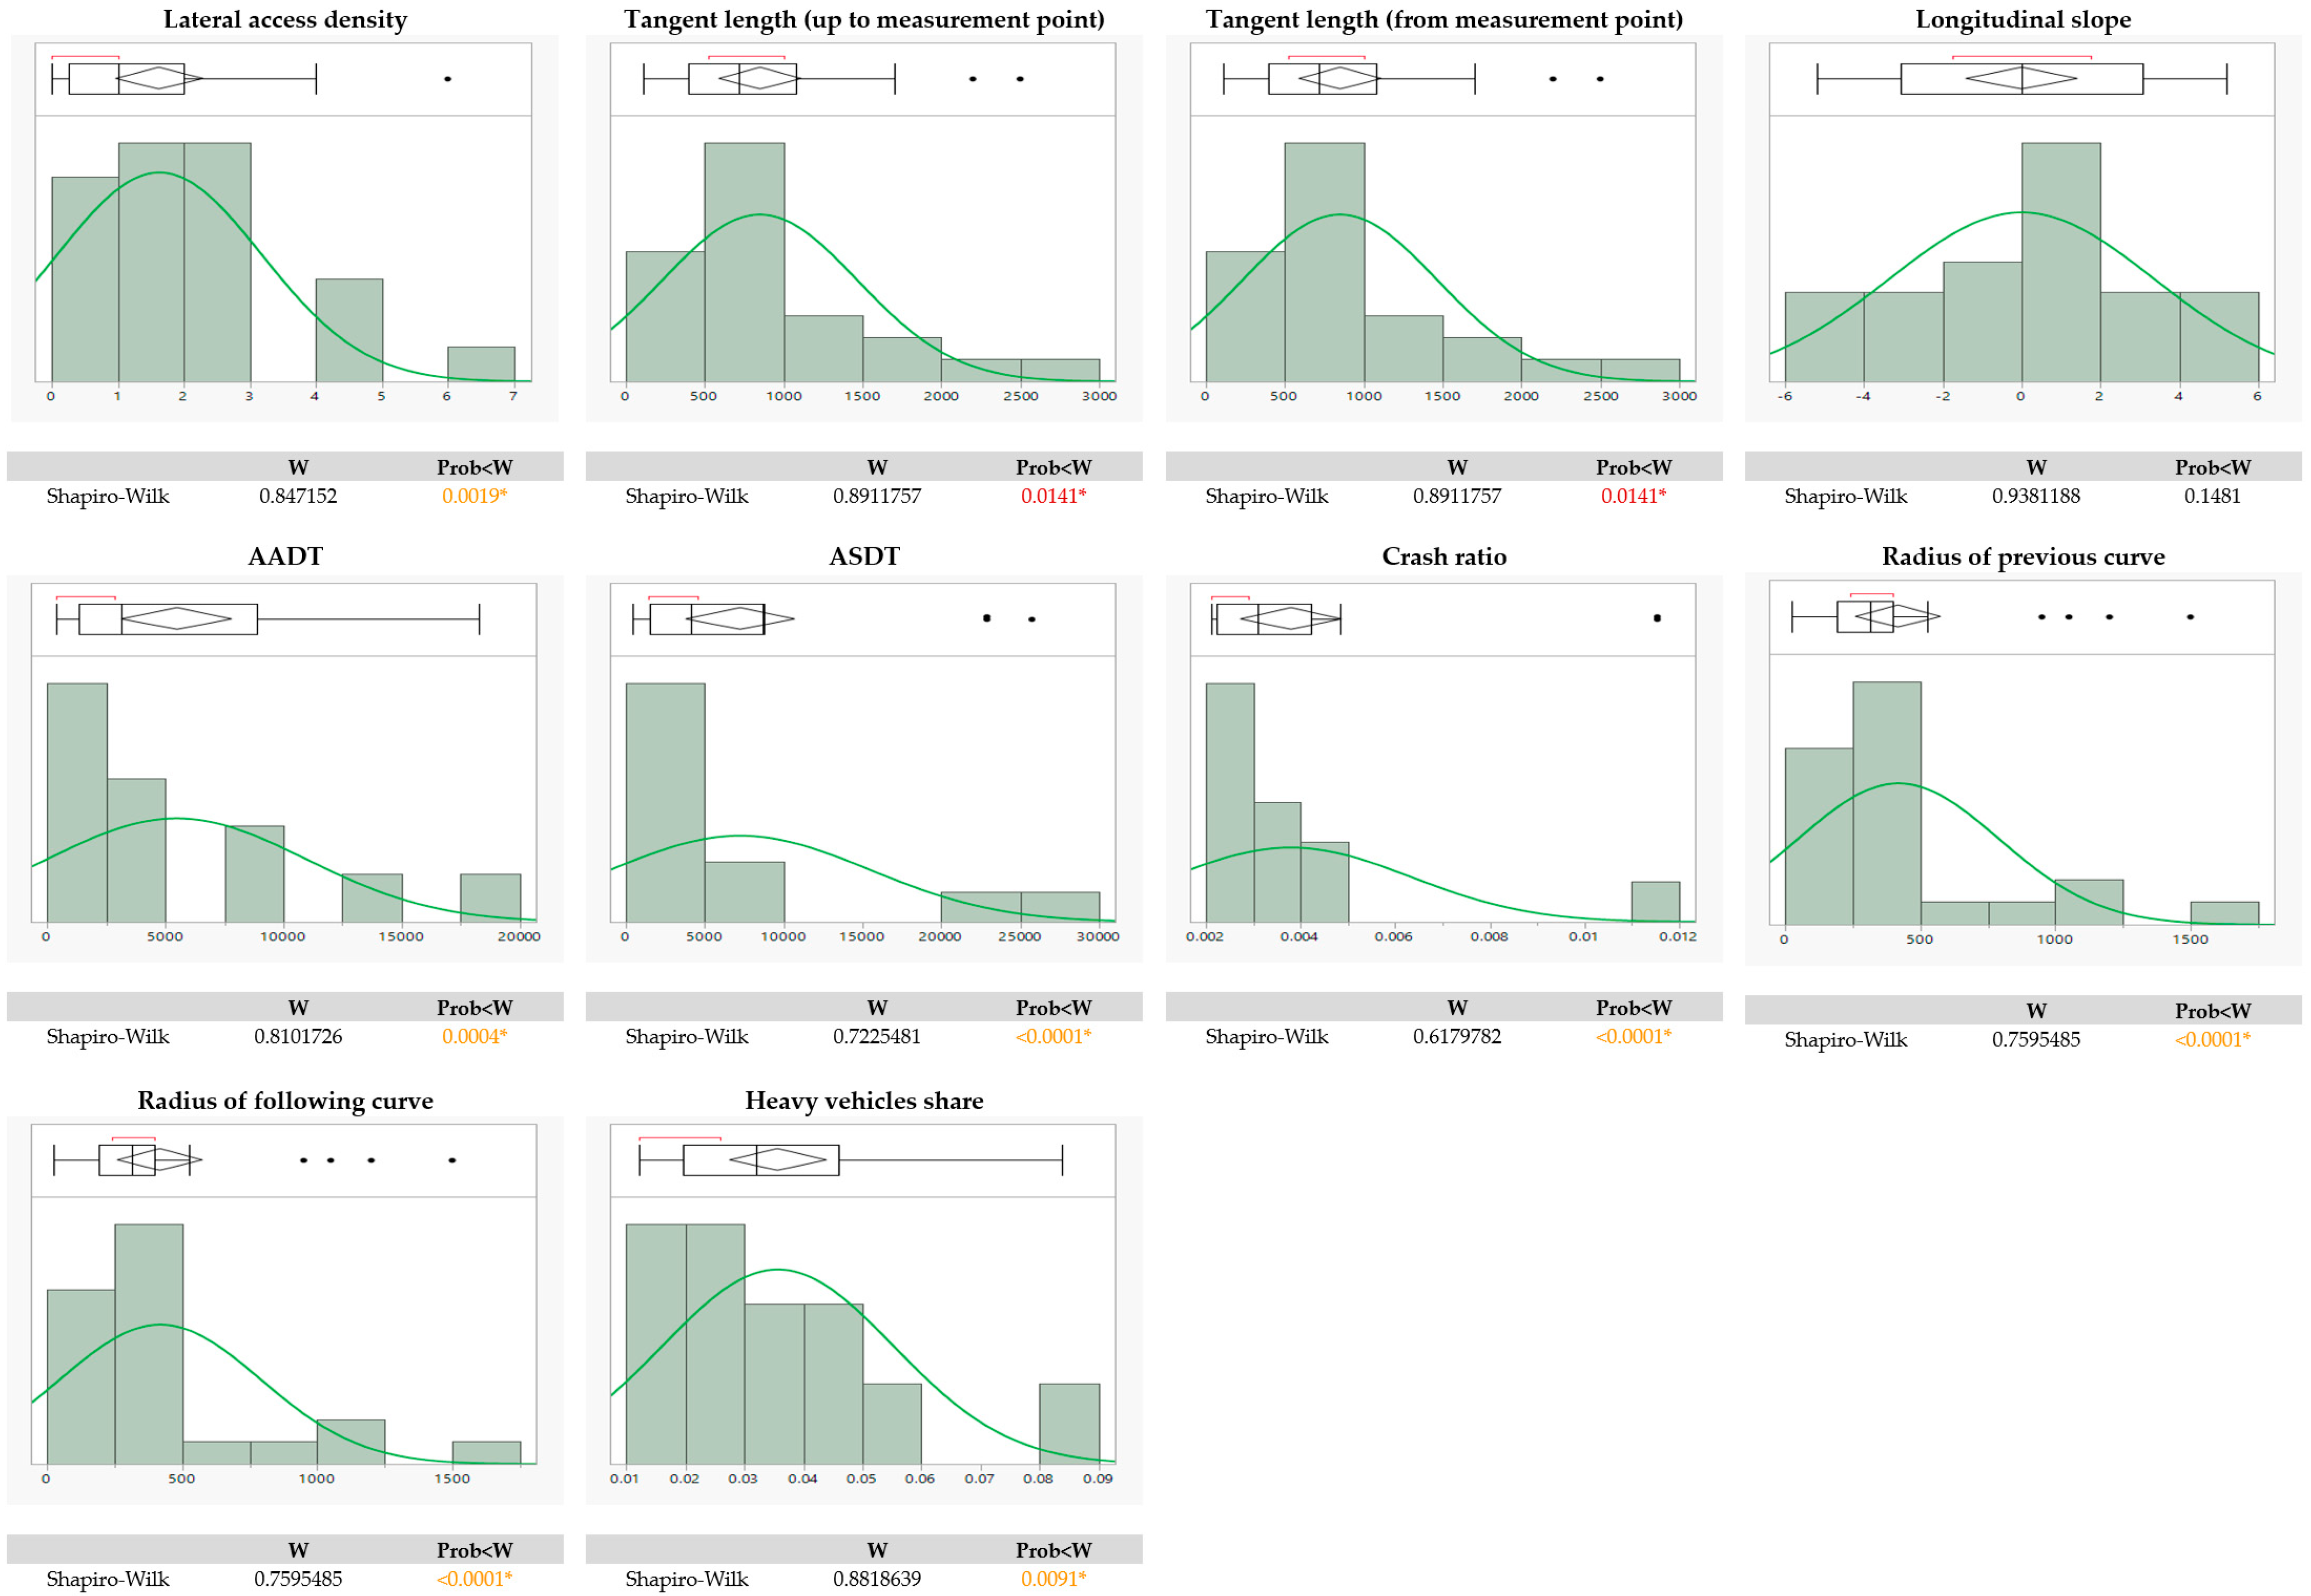
For numerical factors, the normality of the data distribution was first assessed using the Shapiro–Wilk test. This step was essential to determine whether the data met the assumption of normality. Continuous variables that were found to be normally distributed were analyzed using the Pearson correlation, while those that did not meet the assumption of normality were analyzed using Spearman’s rank correlation. The detailed normality distribution (Shapiro–Wilk test) results are shown in Figure 10.
Based on the results of the Shapiro–Wilk test for normality, further analysis was conducted to assess the relationships between the operating vehicle speed and continuous factors. For one factor—longitudinal slope—which was found to be normally distributed, the Pearson correlation was applied to evaluate the strength and direction of the relationship with operating speed. For the remaining continuous factors, which did not meet the assumption of normality, Spearman’s rank correlation was used to assess the monotonic relationships. The results of both the Pearson and Spearman are shown in Table 3.
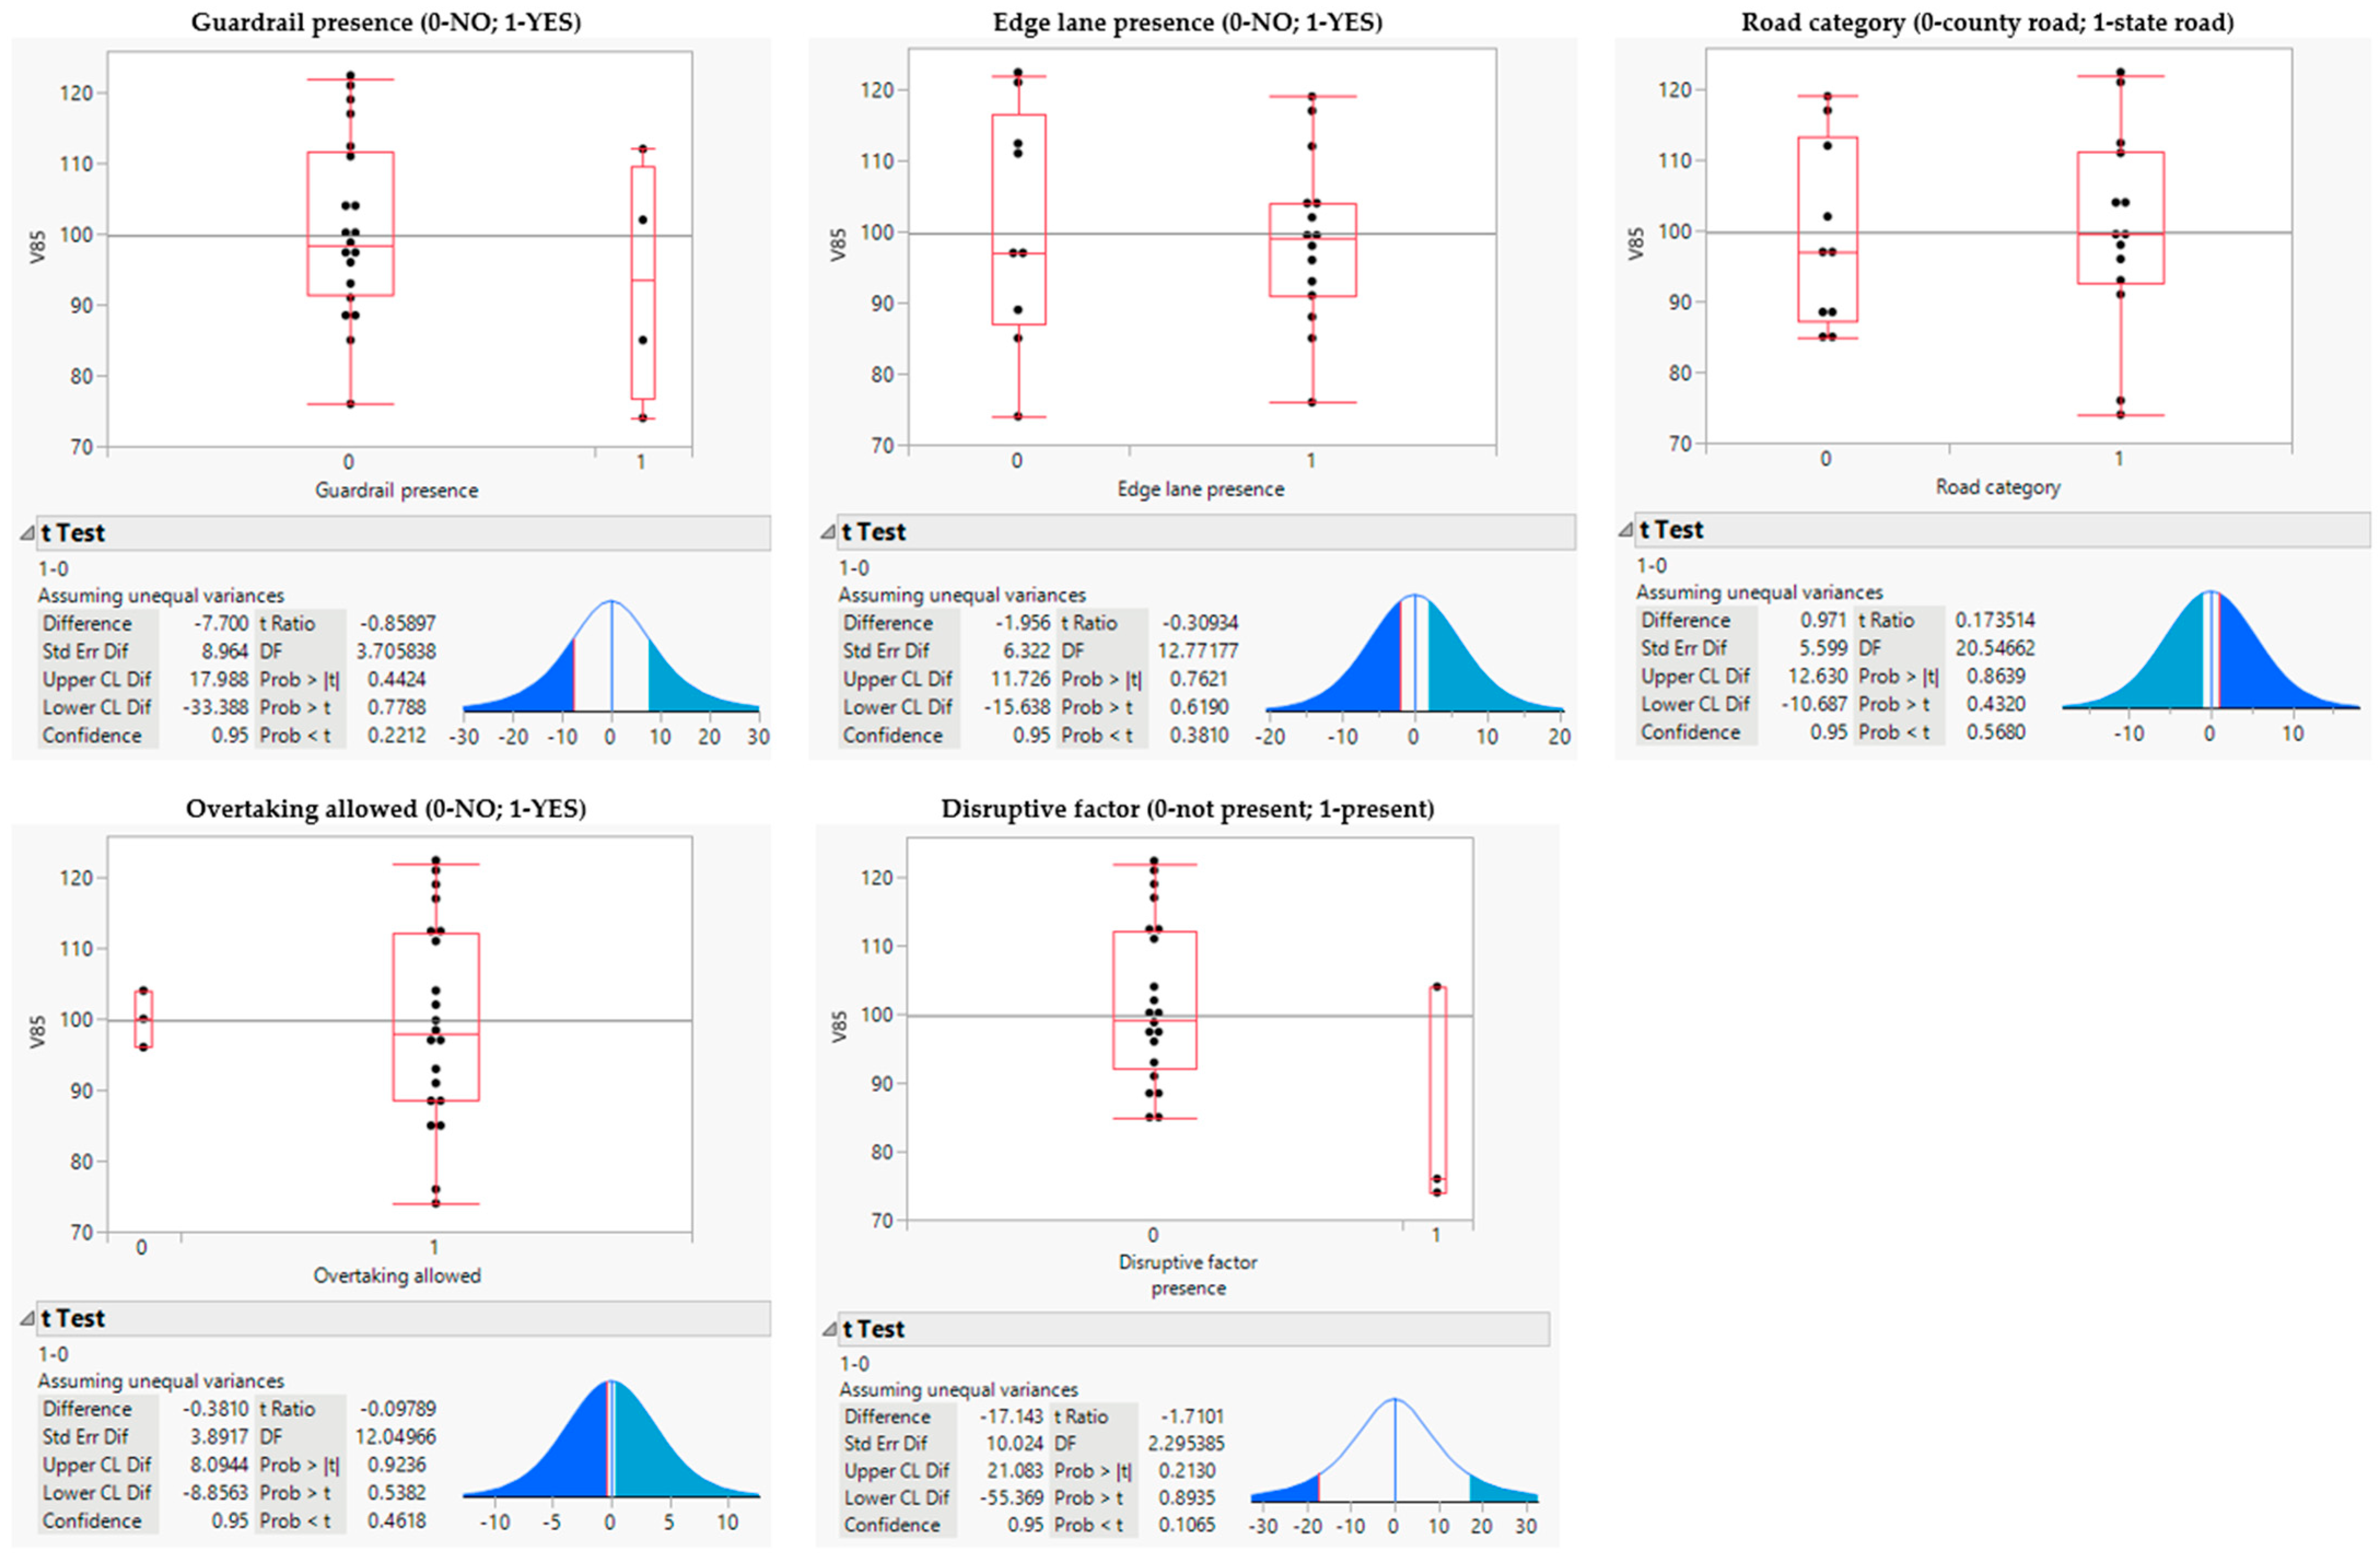
For the binary categorical factors, a t-test was conducted to test for the significant differences in operating speeds between the two categories. The results of the t-test analysis are shown in Figure 11.
For multi-level categorical variables the relationship between the operating speeds and the different levels within each variable was analyzed using an analysis of variance (ANOVA). This approach allowed for the assessment of significant differences in operating speeds across multiple categories. The ANOVA results are shown in Figure 12.
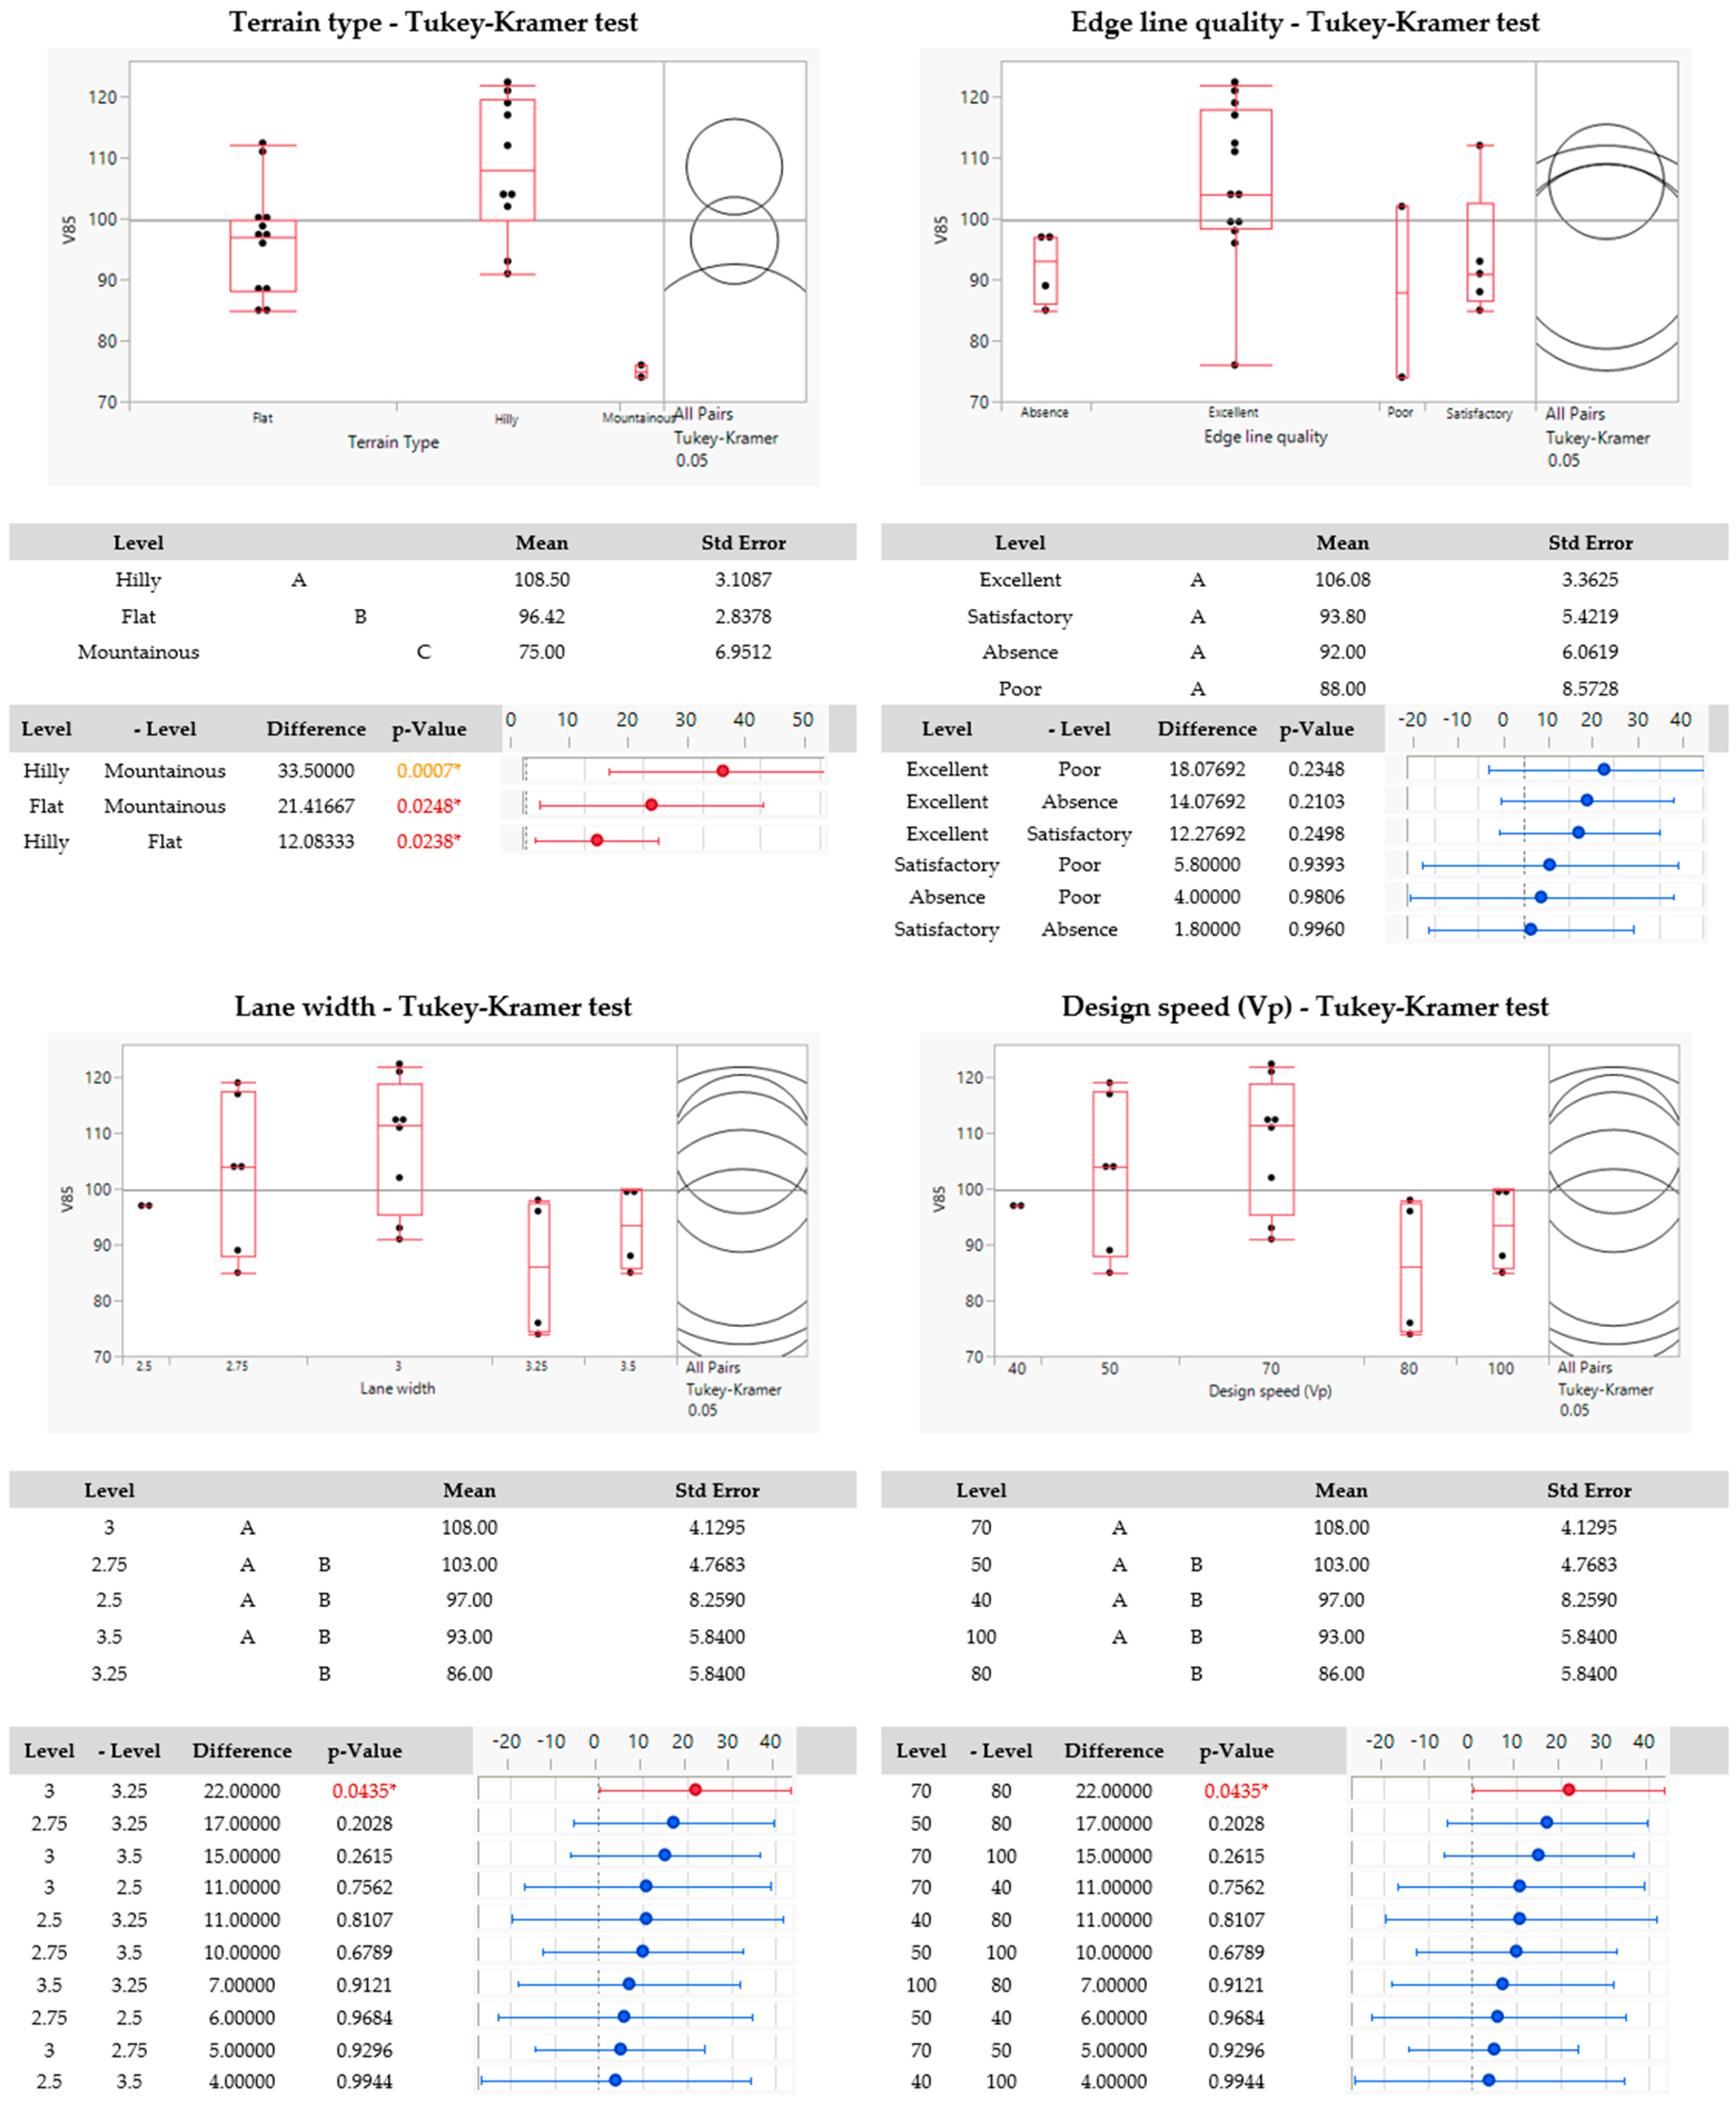
An analysis of variance (ANOVA) was conducted to examine the influence of nine categorical factors on the operating vehicle speed (V85). The results revealed that for most factors—namely passenger side (p = 0.5042), shoulder type (p = 0.2764), visibility (p = 0.8159), pavement quality (p = 0.2816), and speed limit (p = 0.3454)—there was no statistically significant difference in V85 across the categories (p > 0.05). However, terrain type showed a highly significant effect on operating speed (F = 10.99, p = 0.0005), indicating substantial differences in operating speeds across different terrain types.
In addition, three variables—edge line quality (p = 0.0695), lane width (p = 0.0519), and design speed (Vp) (p = 0.0519)—produced marginal p-values, falling just above the conventional significance threshold of 0.05. Given their proximity to statistical significance, a post hoc Tukey–Kramer test was performed for these three factors (along with the factor terrain type) to further investigate the pairwise differences between the group levels (Figure 13). This approach allows for more detailed identification of which specific categories may be contributing to the observed variation, while appropriately controlling for multiple comparisons.

3.2. Dual-Carriageway Road Tangents

Similar to single-carriageway road tangents, for dual-carriageway road tangents the statistical analysis focused on examining the relationships between operating speeds (V85) and various factors, both numerical and categorical. The approach varied depending on the type of variable being analyzed (Table 4).
For numerical factors, the normality of the data distribution was first assessed using the Shapiro–Wilk test. This step was essential to determine whether the data met the assumption of normality. Continuous variables that were found to be normally distributed were analyzed using the Pearson correlation, while those that did not meet the assumption of normality were analyzed using Spearman’s rank correlation. The detailed normality distribution (Shapiro–Wilk test) results are shown in Figure 14.
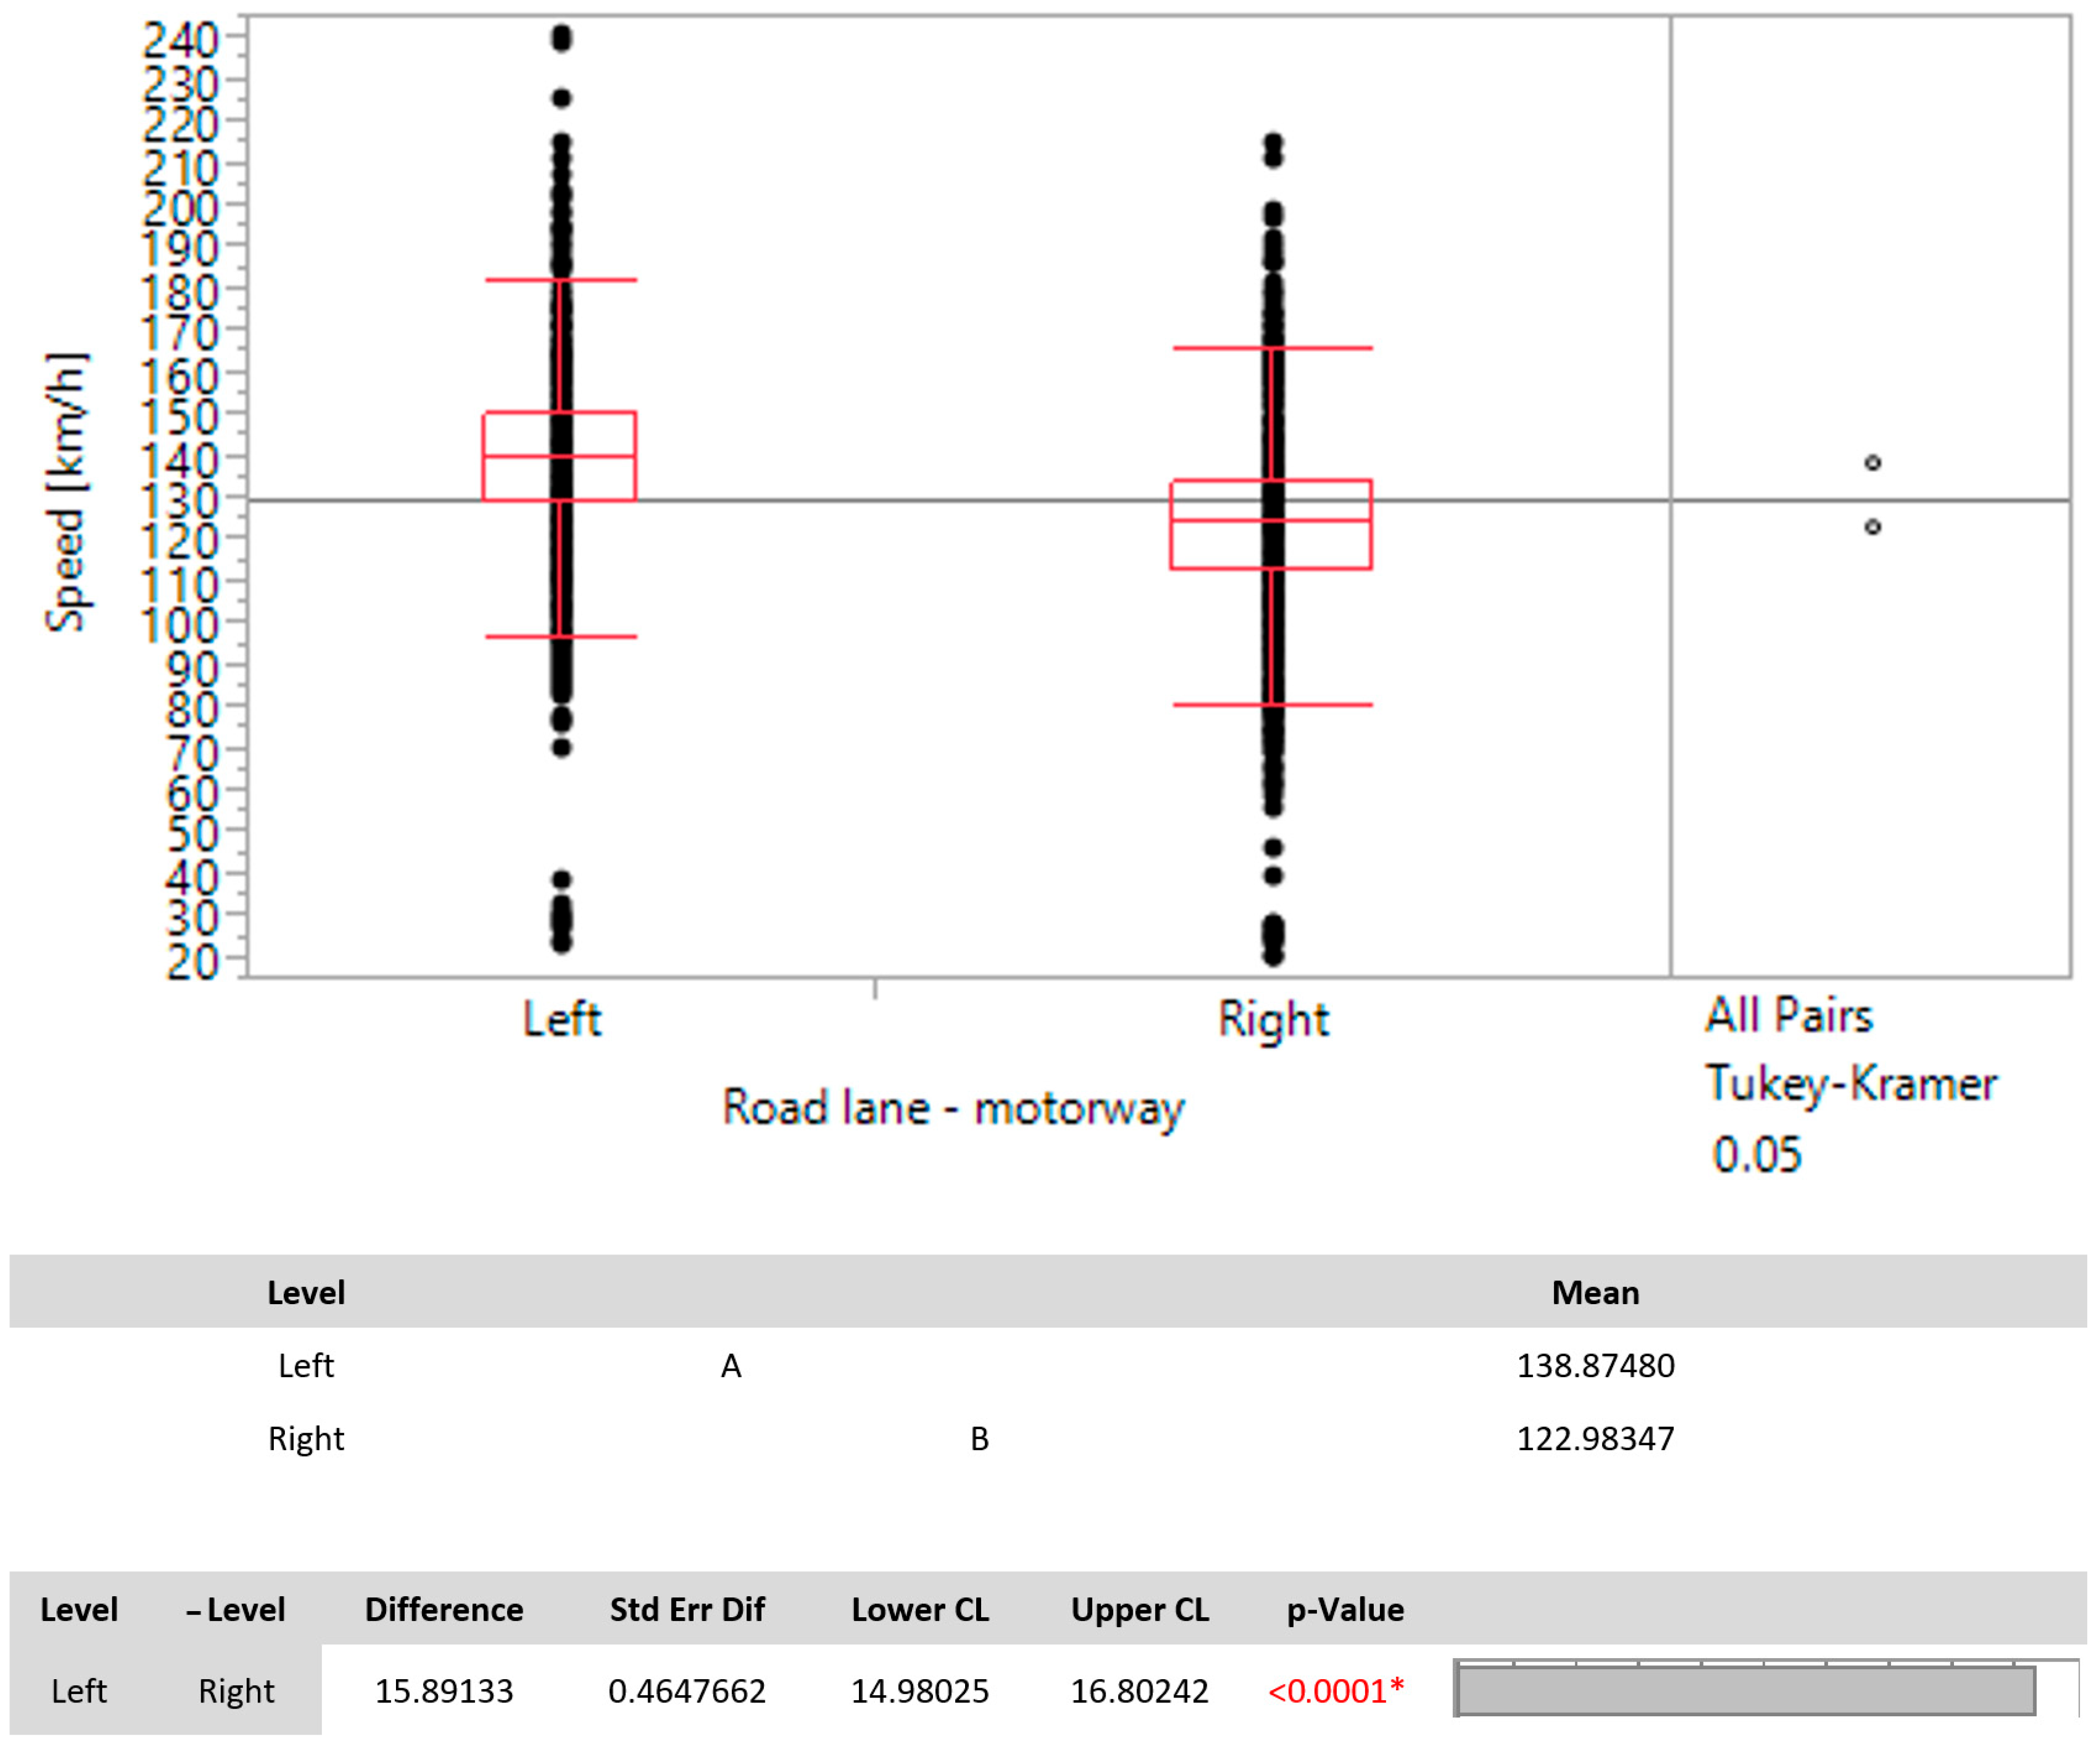
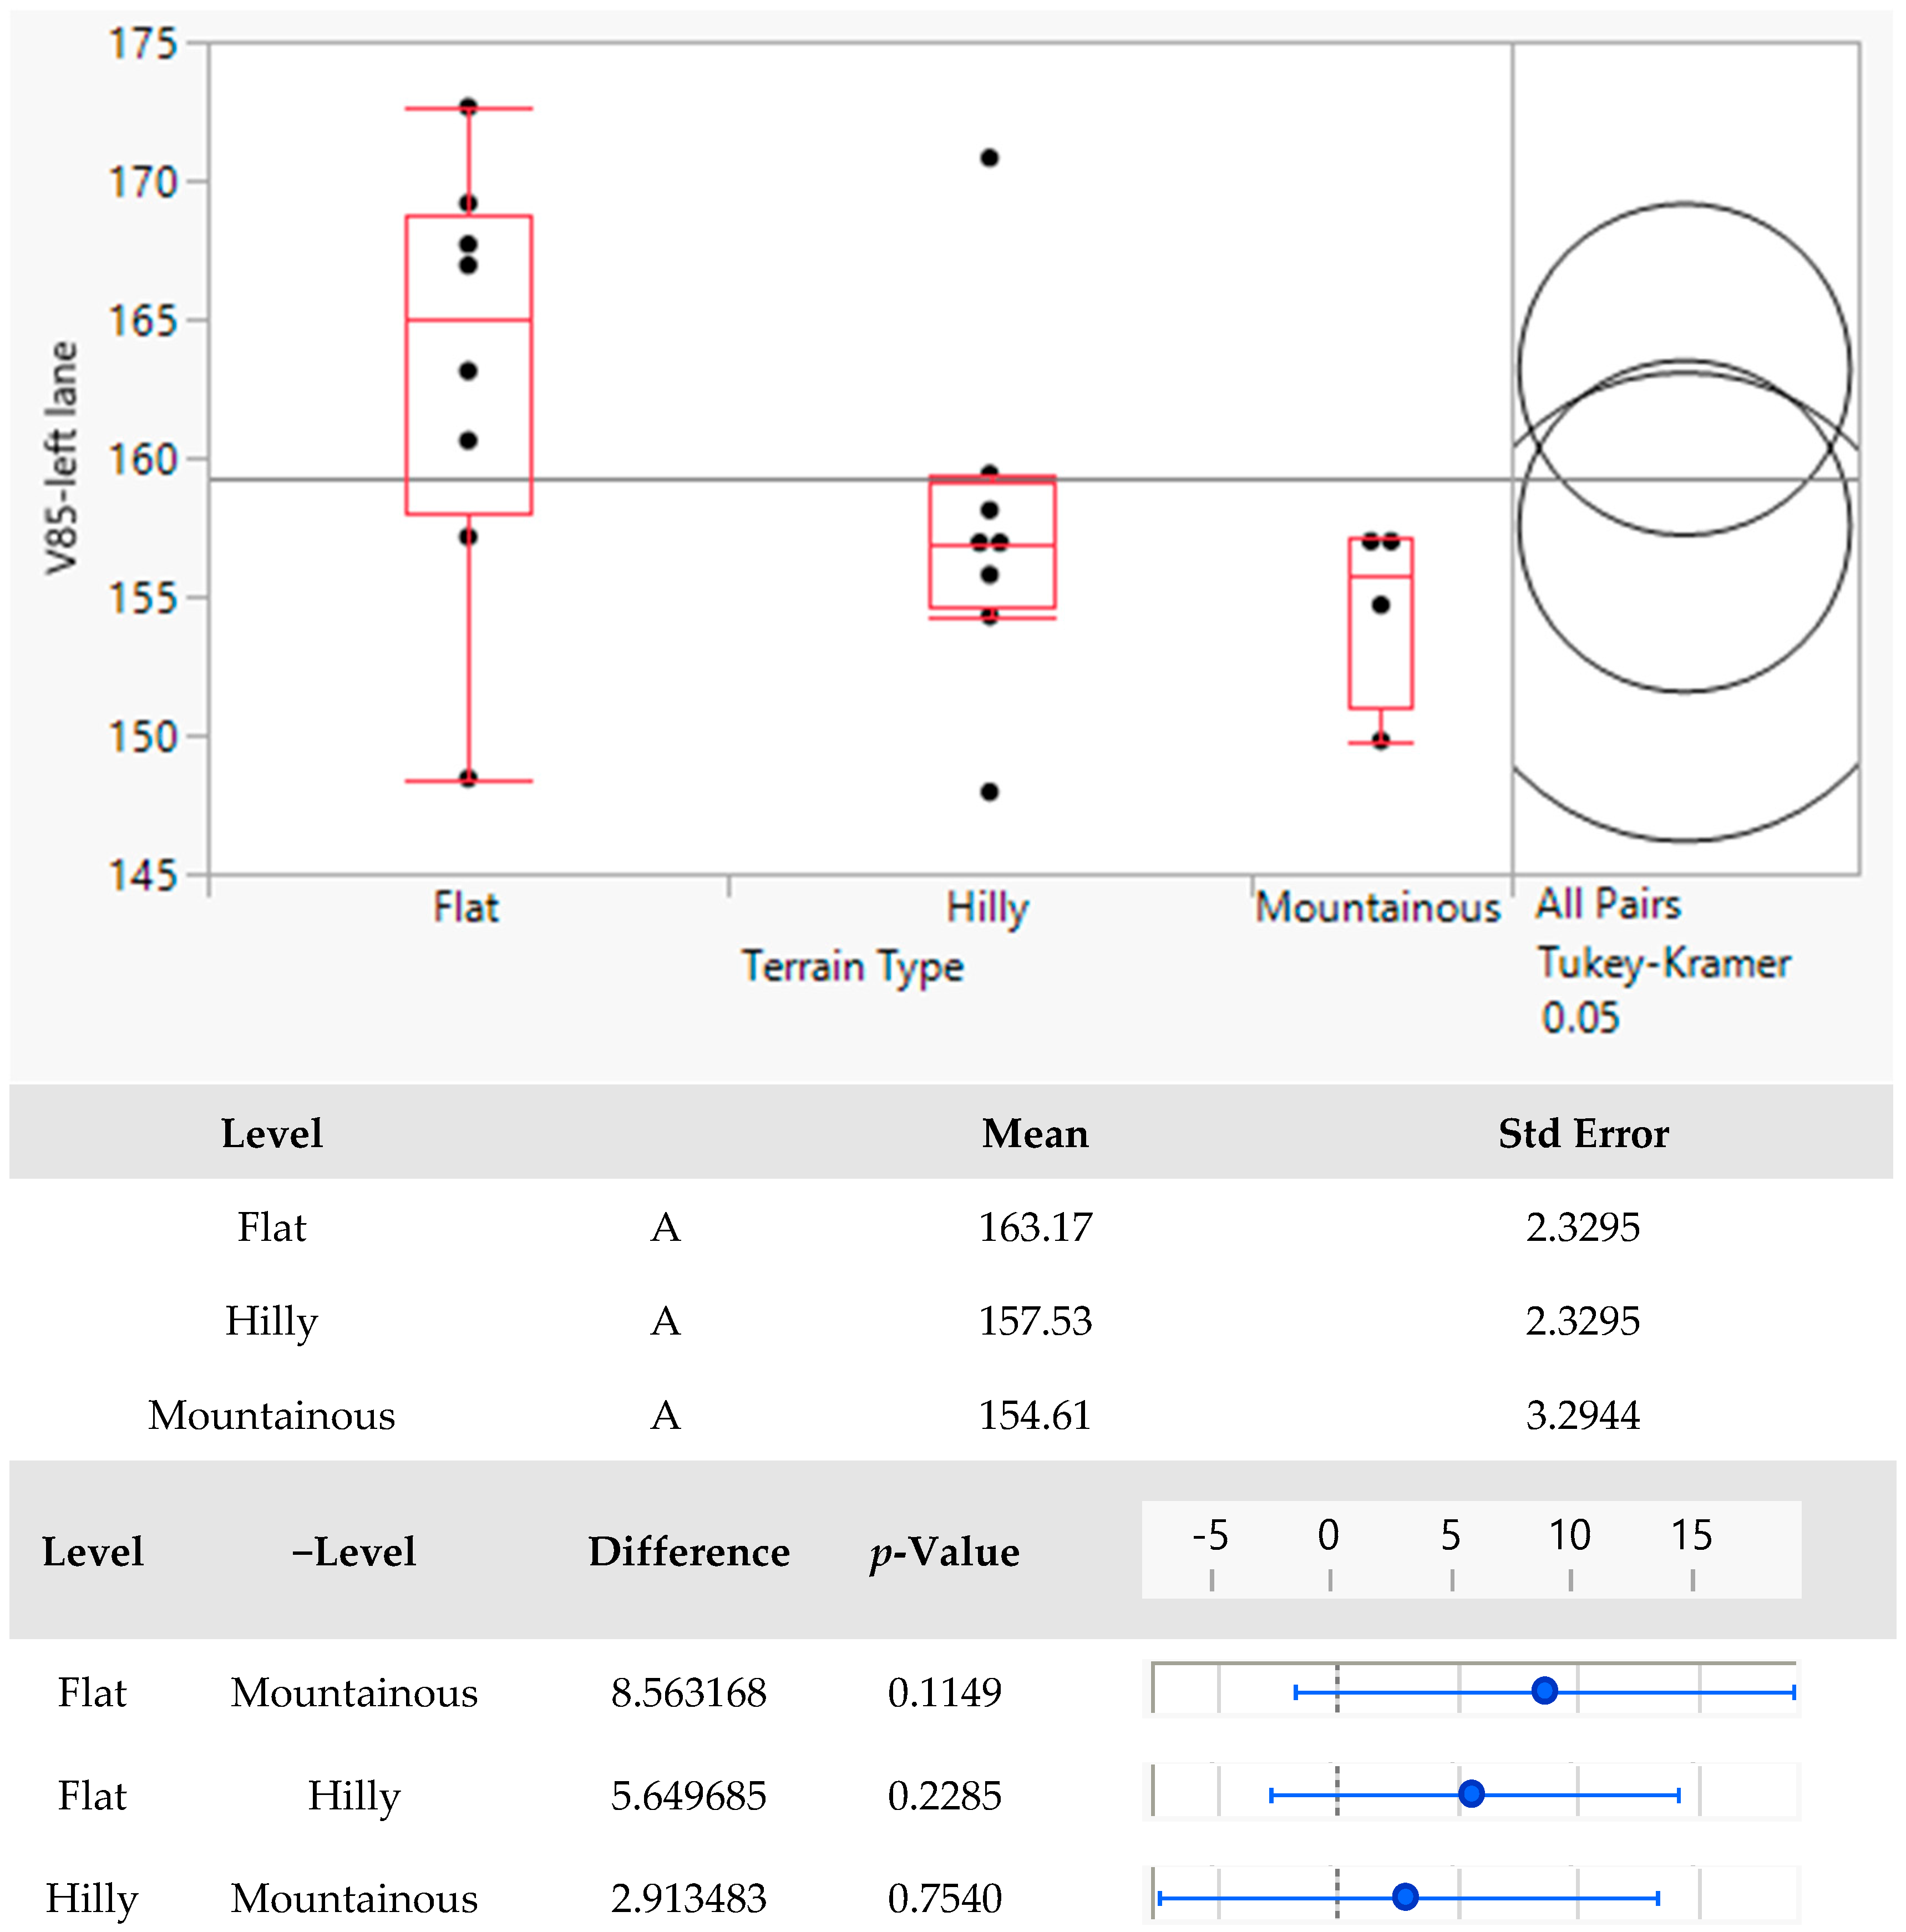
Further analysis was conducted separately for the left (overtaking) lane and the right (driving) lane. This approach was taken due to the differences in the traffic flow structure (with a higher share of heavy goods vehicles in the right lane) and greater variations in the speeds. For this reason, a difference test (Tukey–Kramer test) was conducted to compare the difference in the deviations of the measured speeds from the speed limit on these roads. The analysis included the speeds of passenger cars under free-flow traffic conditions. The conducted Tukey–Kramer test revealed a statistically significant difference between the left (overtaking) lane and the right (driving) lane in terms of the deviations of the measured speeds from the speed limit (Figure 15).

3.2.1. Left (Overtaking) Lane

In order to explore the relationships between the operating vehicle speed and the continuous factors in the left (overtaking) lane of dual-carriageway road tangents, a similar approach to that used for single-carriageway roads was employed. Following the Shapiro–Wilk test, the Pearson correlation coefficient was applied for those variables that were found to be normally distributed, while Spearman’s rank correlation was utilized for the remaining variables that did not meet the assumption of normality. The results of both the Pearson and Spearman’s correlations are summarized in Table 5, which highlights the strength and direction of the relationships between the operating vehicle speed and each of the continuous factors.
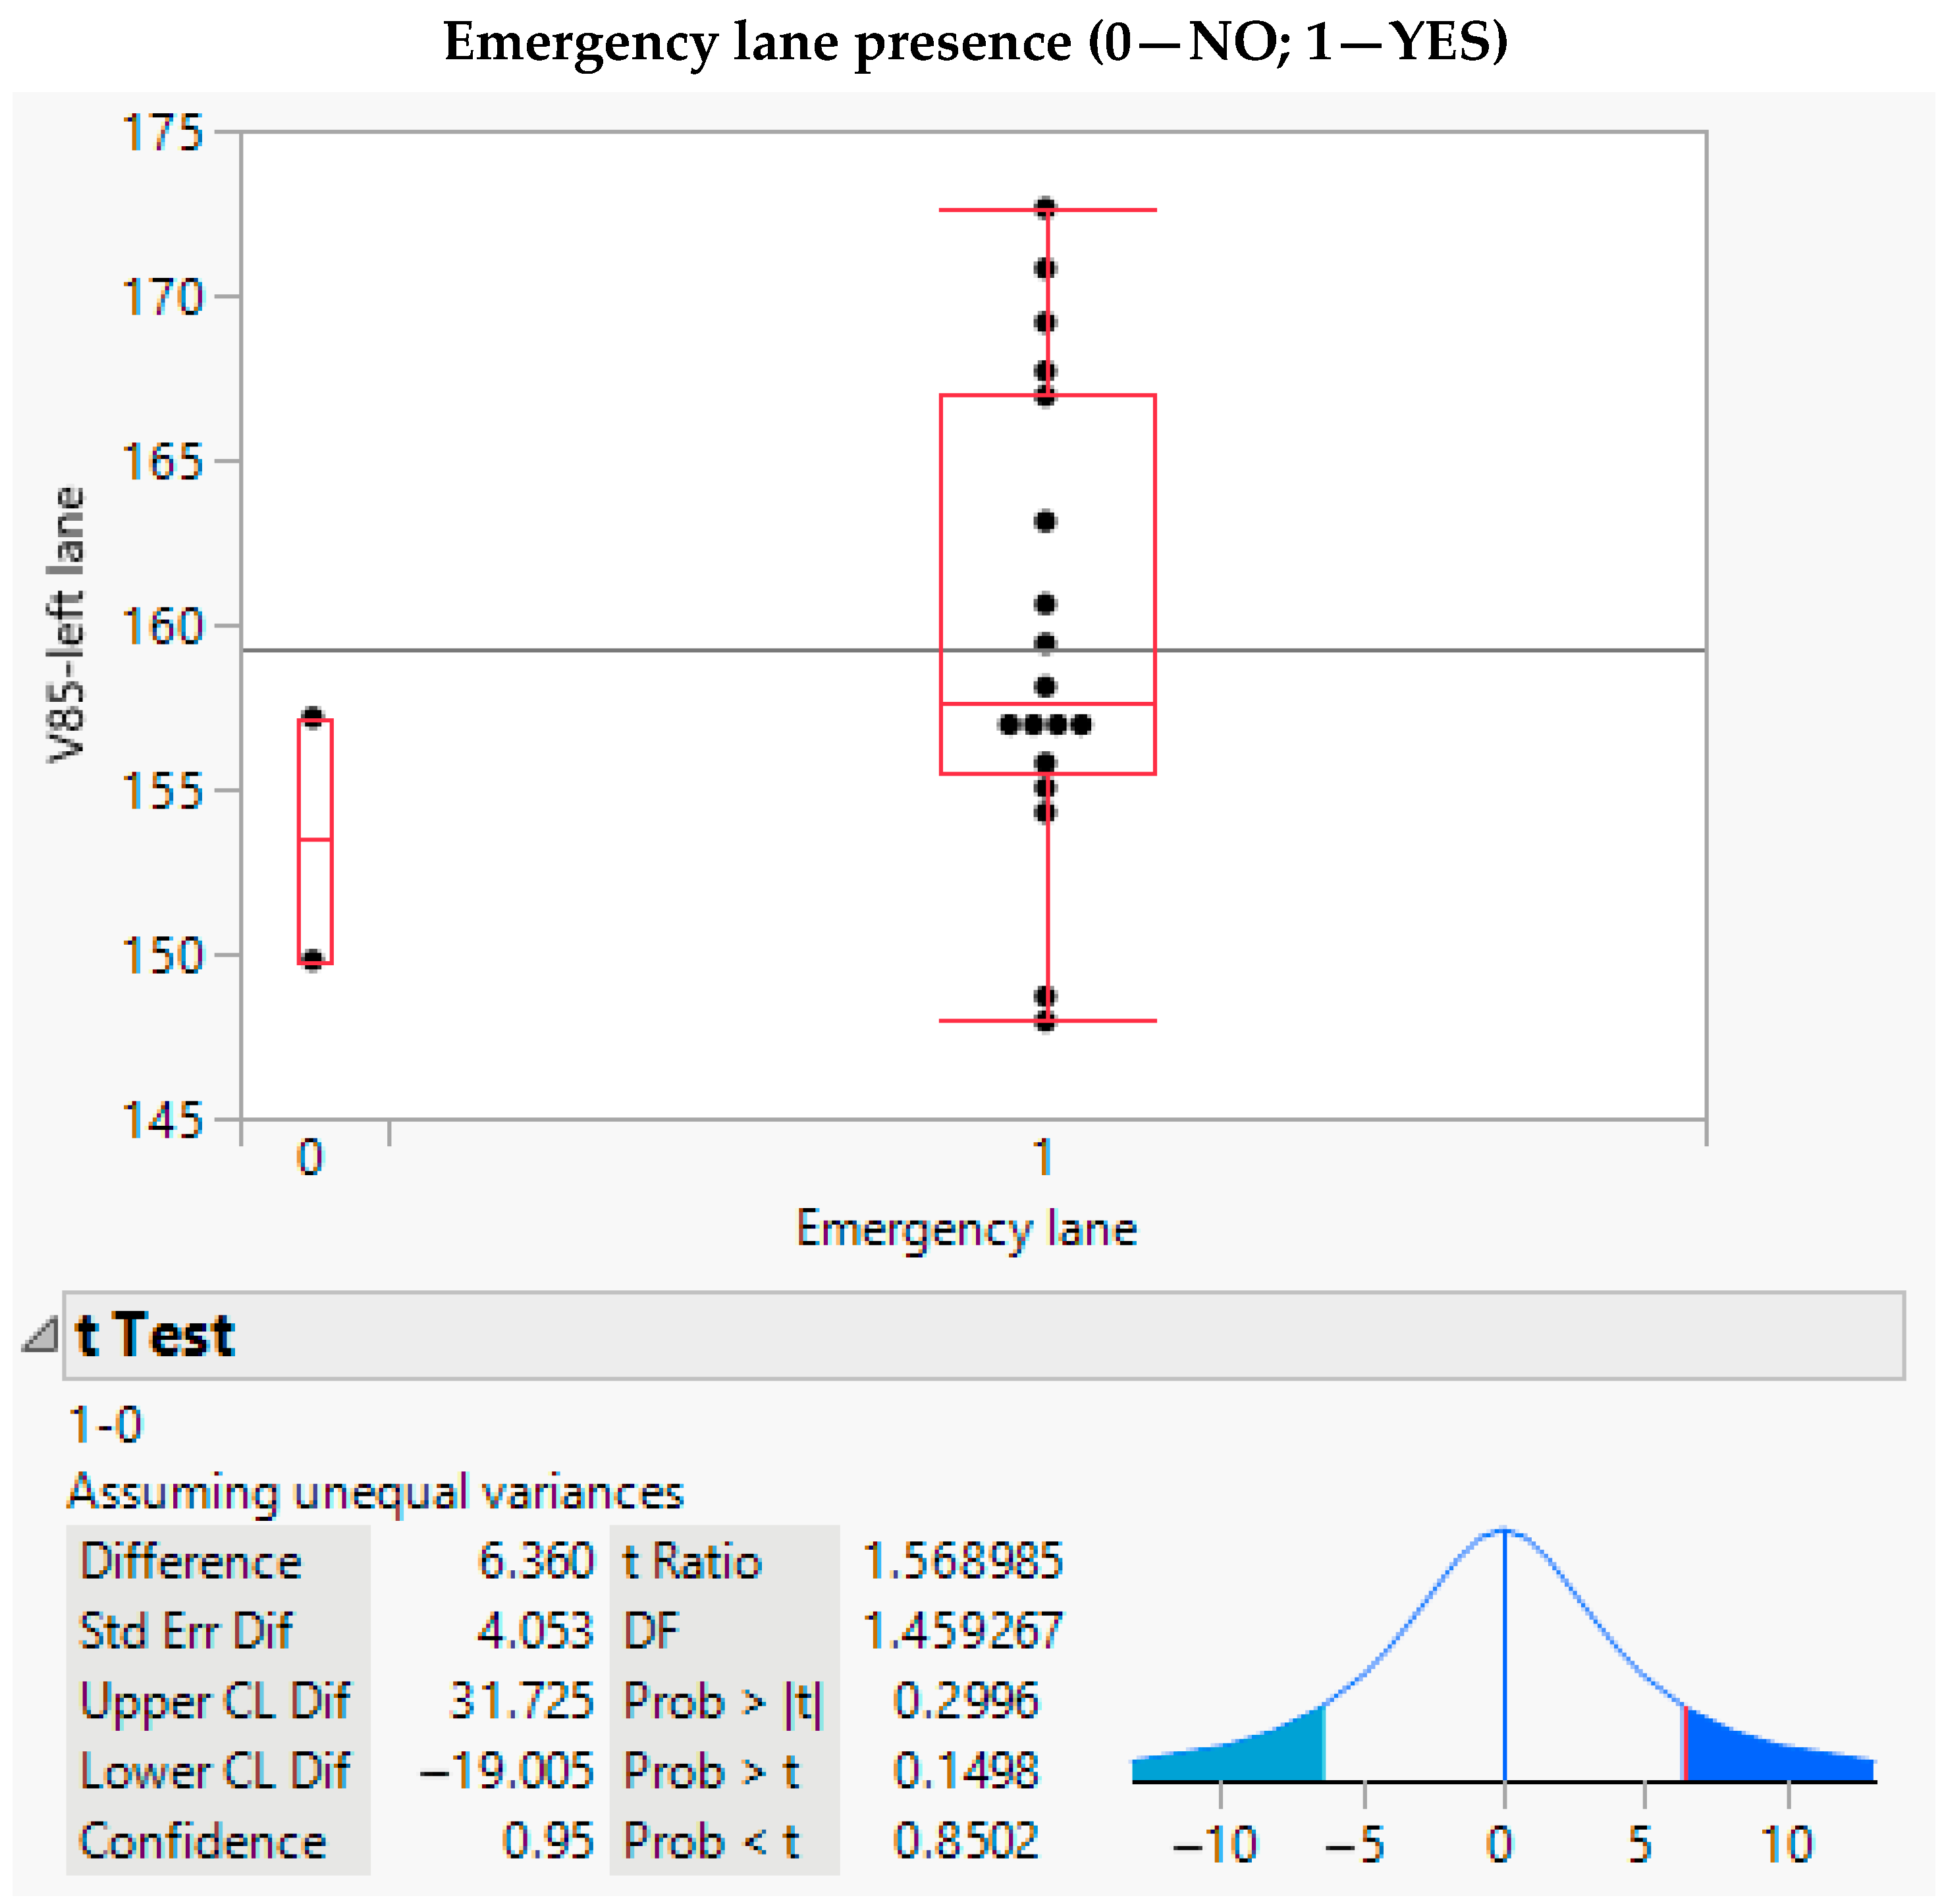
For the binary categorical factor (only the emergency lane presence), a t-test was conducted to test for significant differences in the operating speeds between the two categories. The results of the t-test analysis are shown in Figure 16.
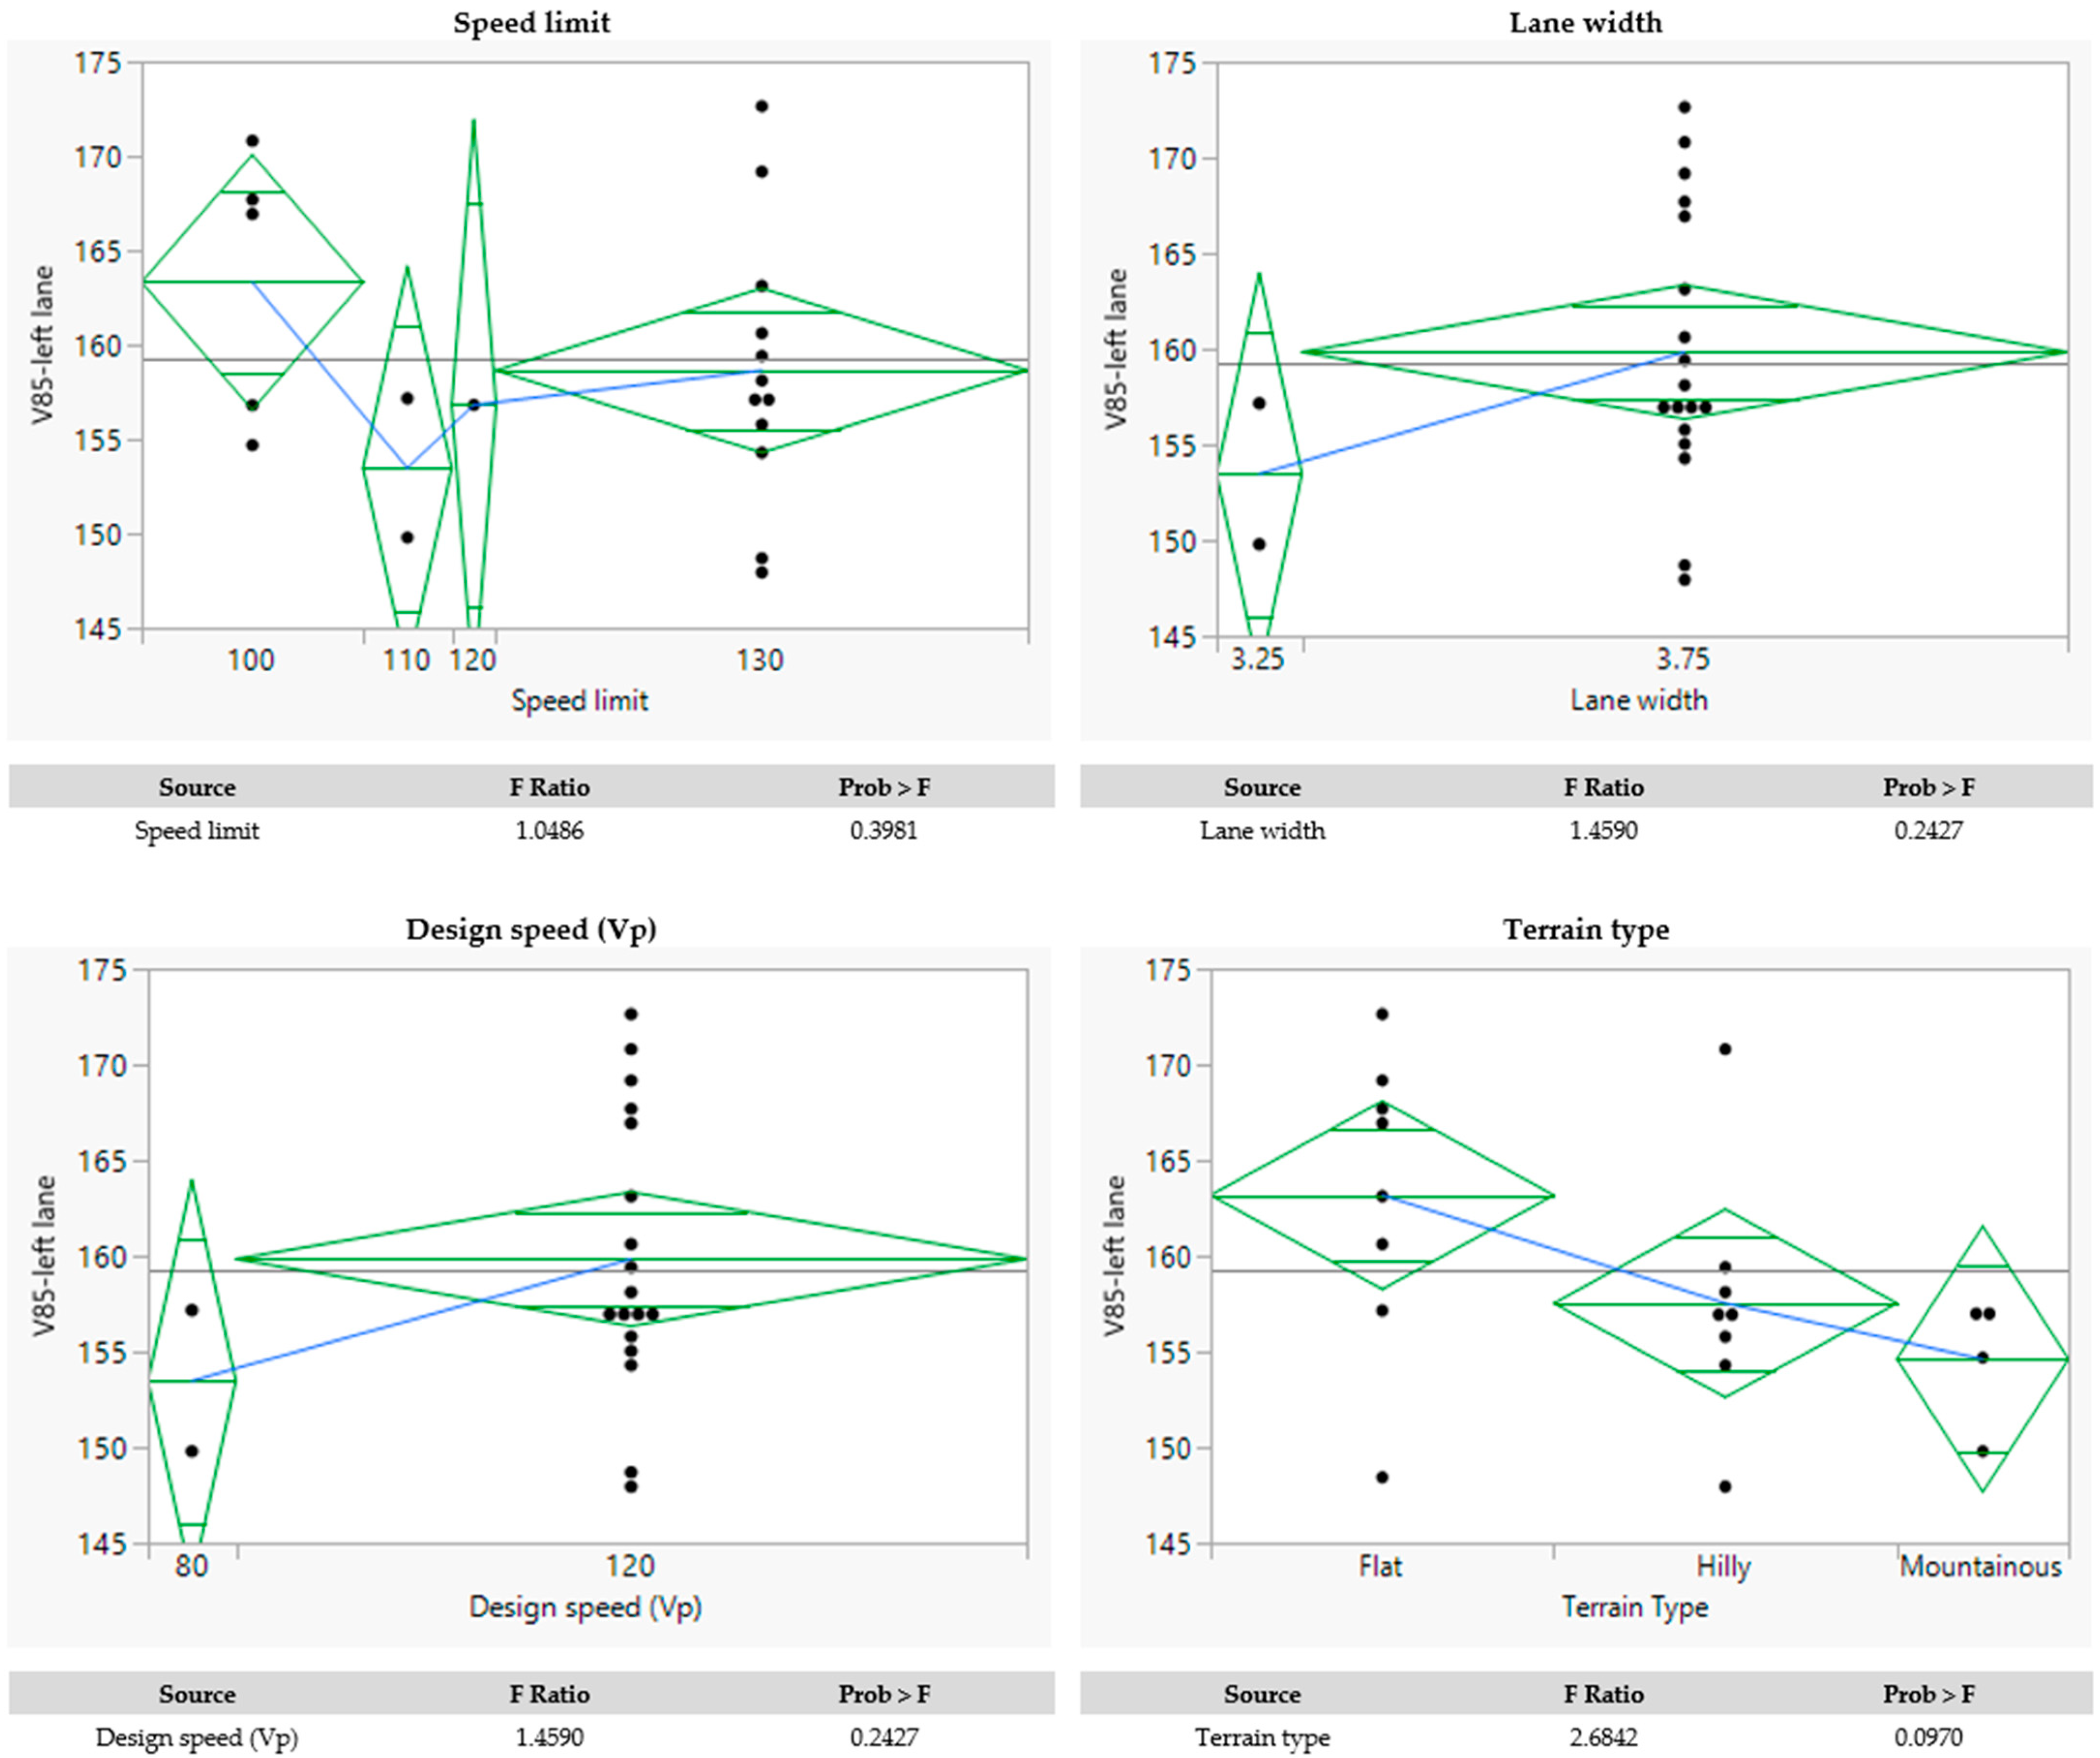
For multi-level categorical variables, the relationship between the operating speeds and the different levels within each variable was analyzed using an analysis of variance (ANOVA). This approach allowed for the assessment of significant differences in the operating speeds across multiple categories. The ANOVA results are shown in Figure 17.
An analysis of variance (ANOVA) was conducted to examine the influence of several categorical factors on the operating vehicle speed (V85) in the left (overtaking) lane of dual-carriageway road tangents. The results revealed that most factors did not exhibit statistically significant differences in the operating speed. Specifically, the factors speed limit (p = 0.3981), lane width (p = 0.2427), and design speed (Vp) (p = 0.2427) all produced p-values greater than the 0.05 threshold, suggesting no significant effect on V85 in the left lane. However, terrain type (p = 0.0970) showed a borderline significant effect on the operating speed, with an F-ratio of 2.6842, indicating potential differences in speed across terrain types, but failing to reach the conventional significance level of 0.05. Given that the p-value for terrain type was close to 0.05, it was decided to perform a post hoc Tukey–Kramer test to further investigate the pairwise operating speed differences between the terrain categories. The Tukey–Kramer test results are shown in Figure 18.

3.2.2. Right (Driving) Lane

In order to explore the relationships between the operating vehicle speed and continuous factors in the right (driving) lane of dual-carriageway road tangents, the same approach to that used for the right (driving) lane of dual-carriageway road tangents was employed. Following the Shapiro–Wilk test, the Pearson correlation coefficient was applied for those variables that were found to be normally distributed, while Spearman’s rank correlation was utilized for the remaining variables that did not meet the assumption of normality. The results of both the Pearson and Spearman’s correlations are summarized in Table 6, which highlights the strength and direction of the relationships between the operating vehicle speed and each of the continuous factors.
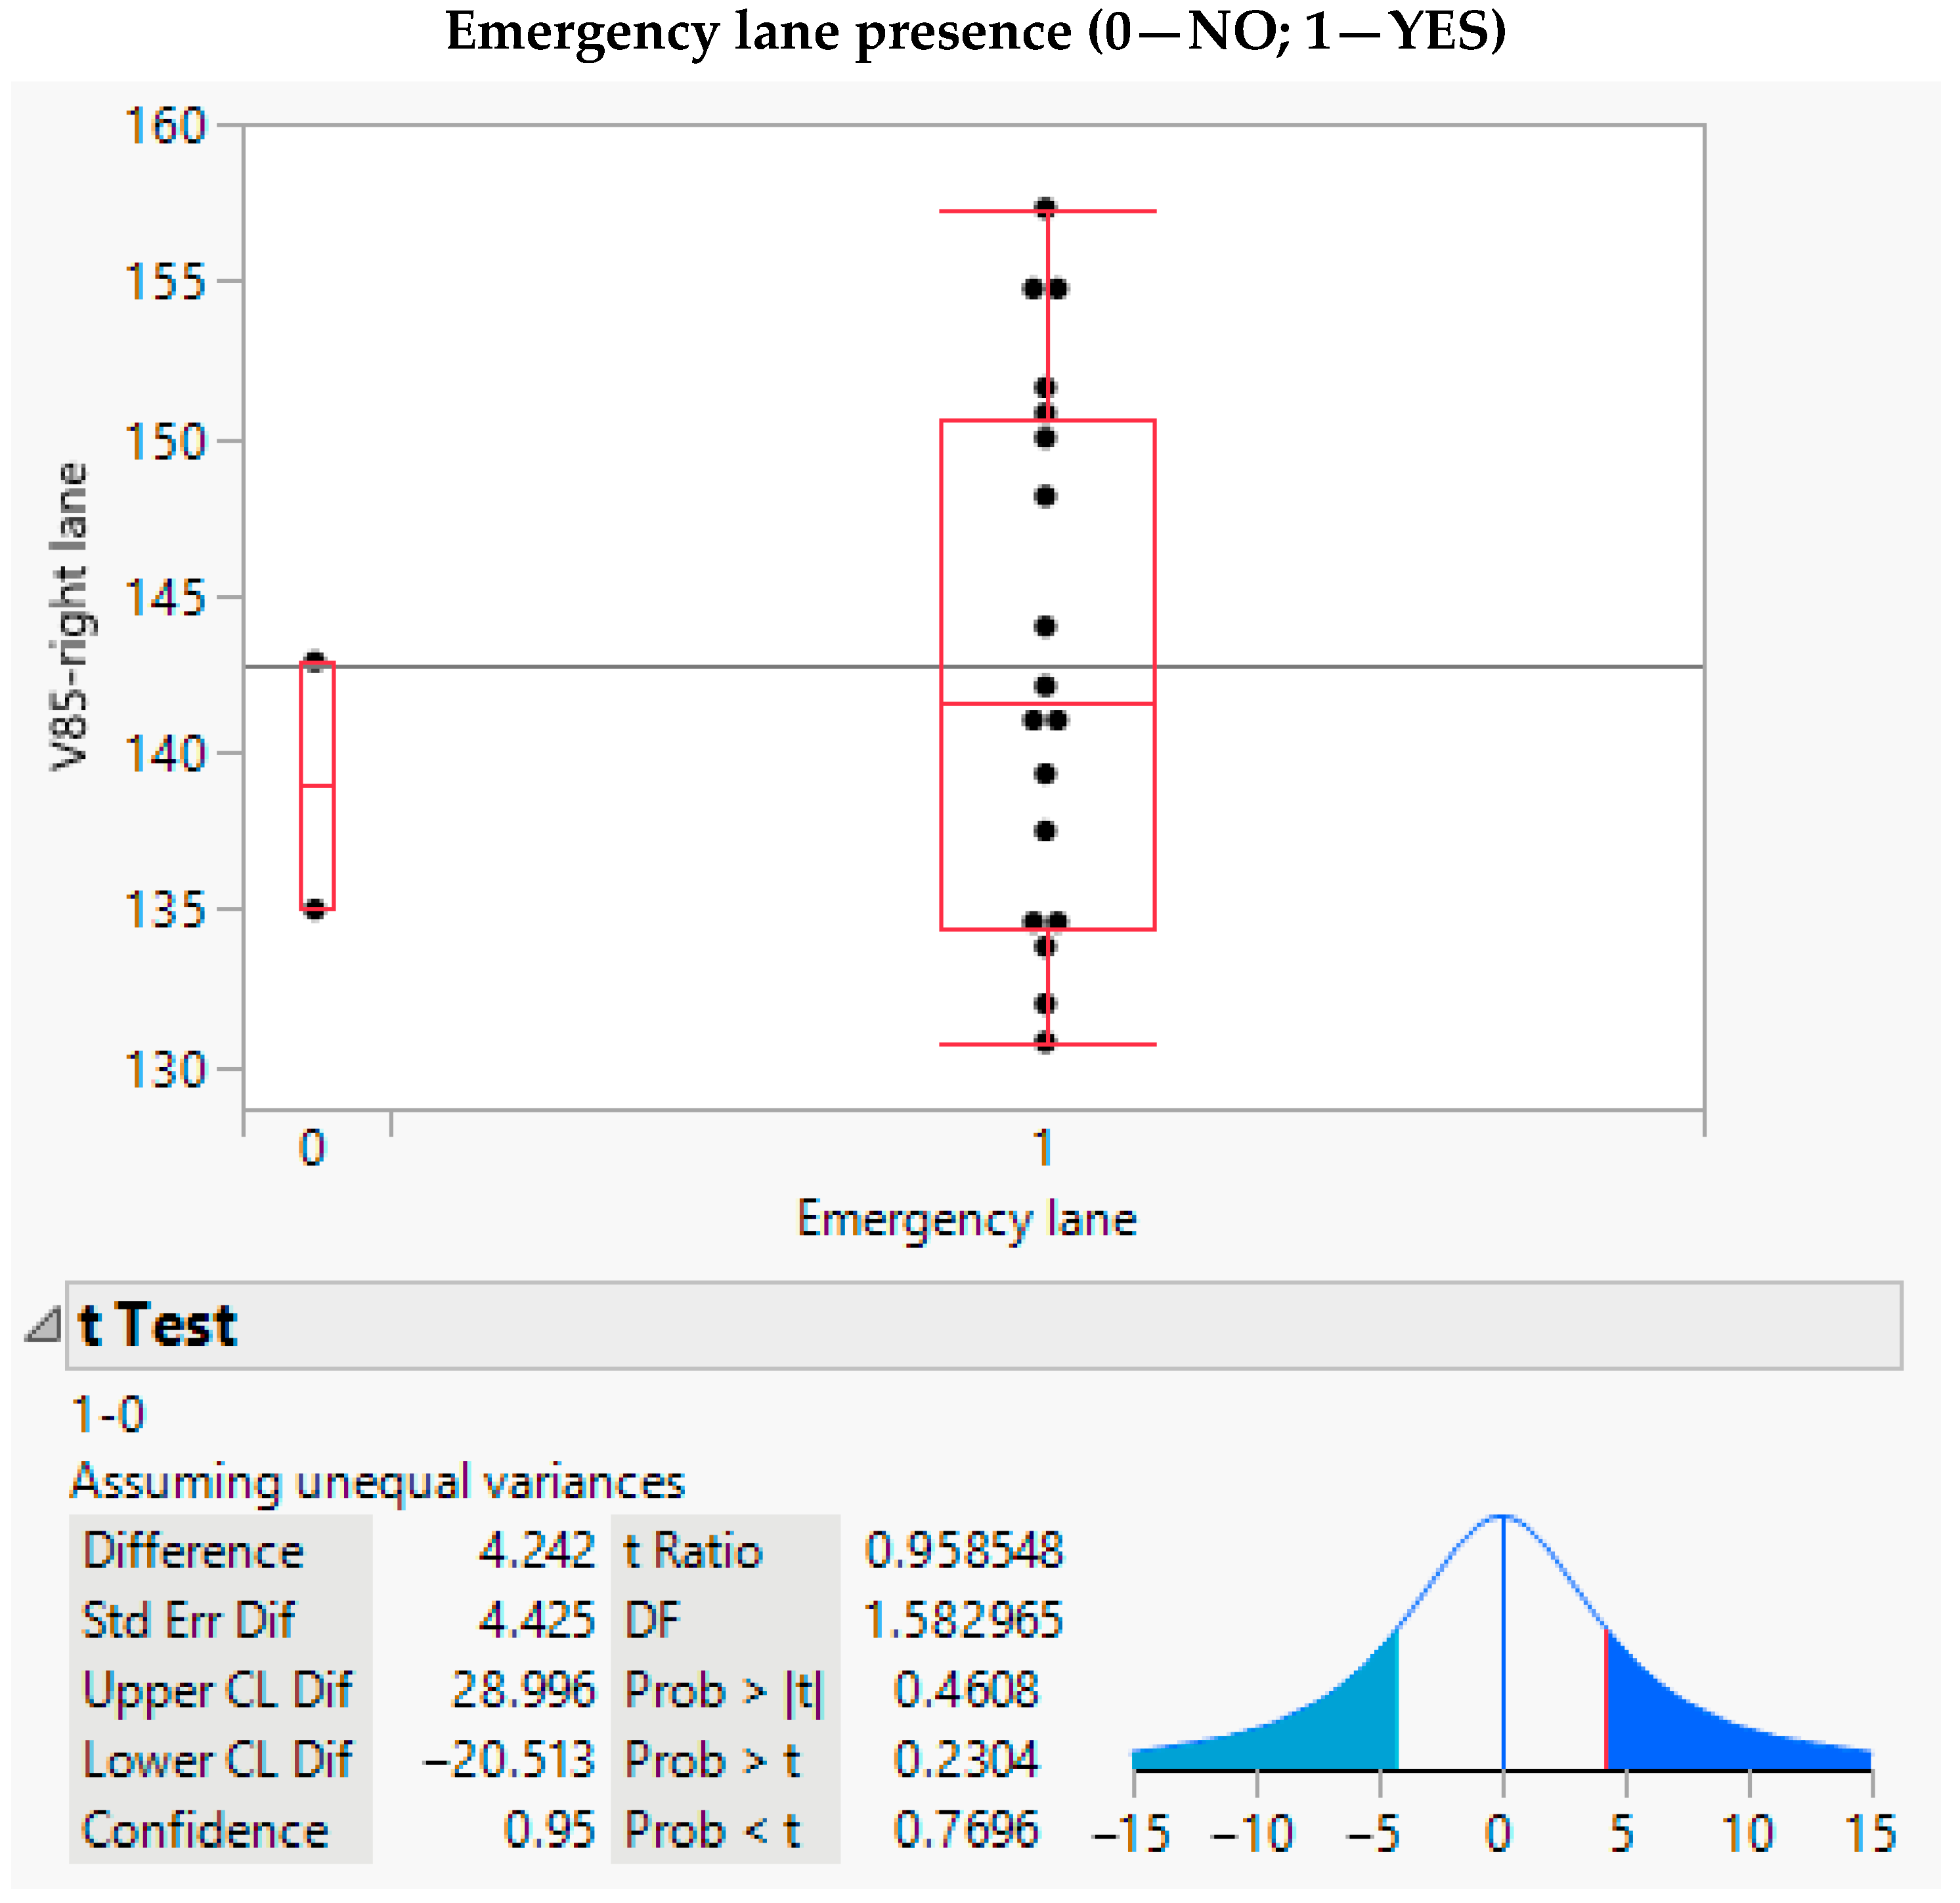
For the binary categorical factor (only the emergency lane presence), a t-test was conducted to test for significant differences in the operating speeds between the two categories. The results of the t-test analysis are shown in Figure 19.
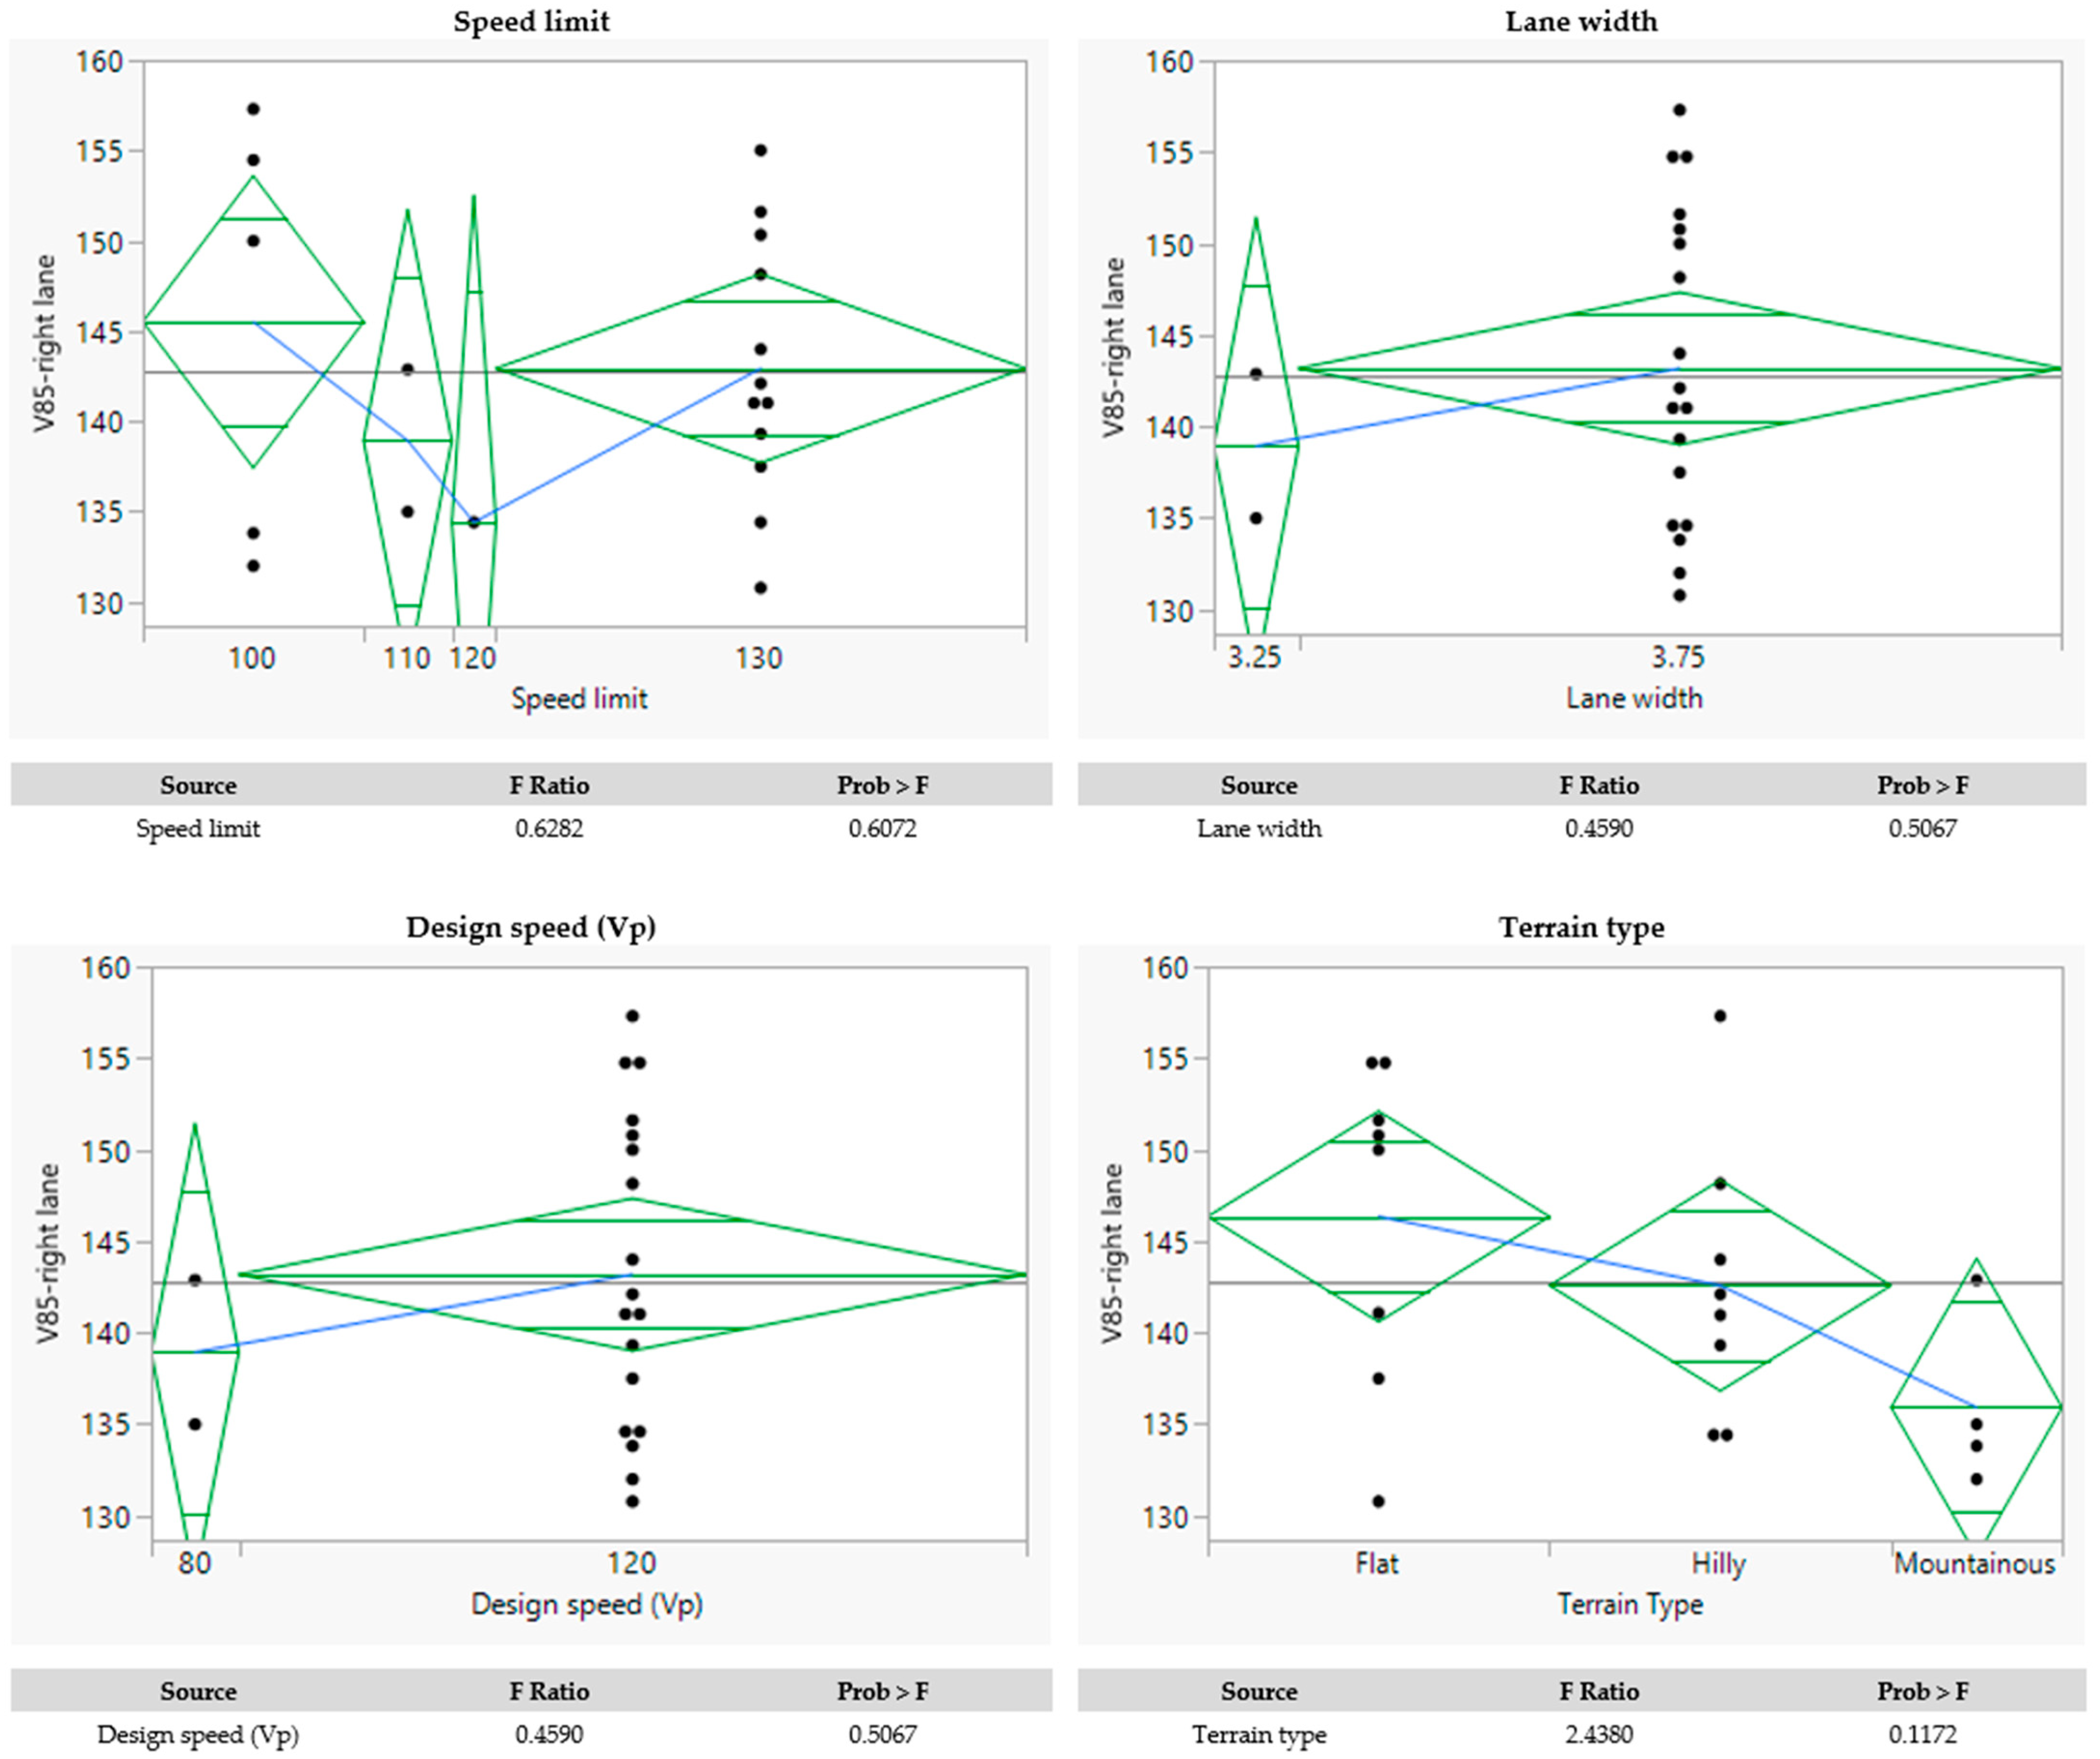
For multi-level categorical variables, the relationship between the operating speeds and the different levels within each variable was analyzed using an analysis of variance (ANOVA). This approach allowed for the assessment of significant differences in the operating speeds across multiple categories. The ANOVA results are shown in Figure 20.
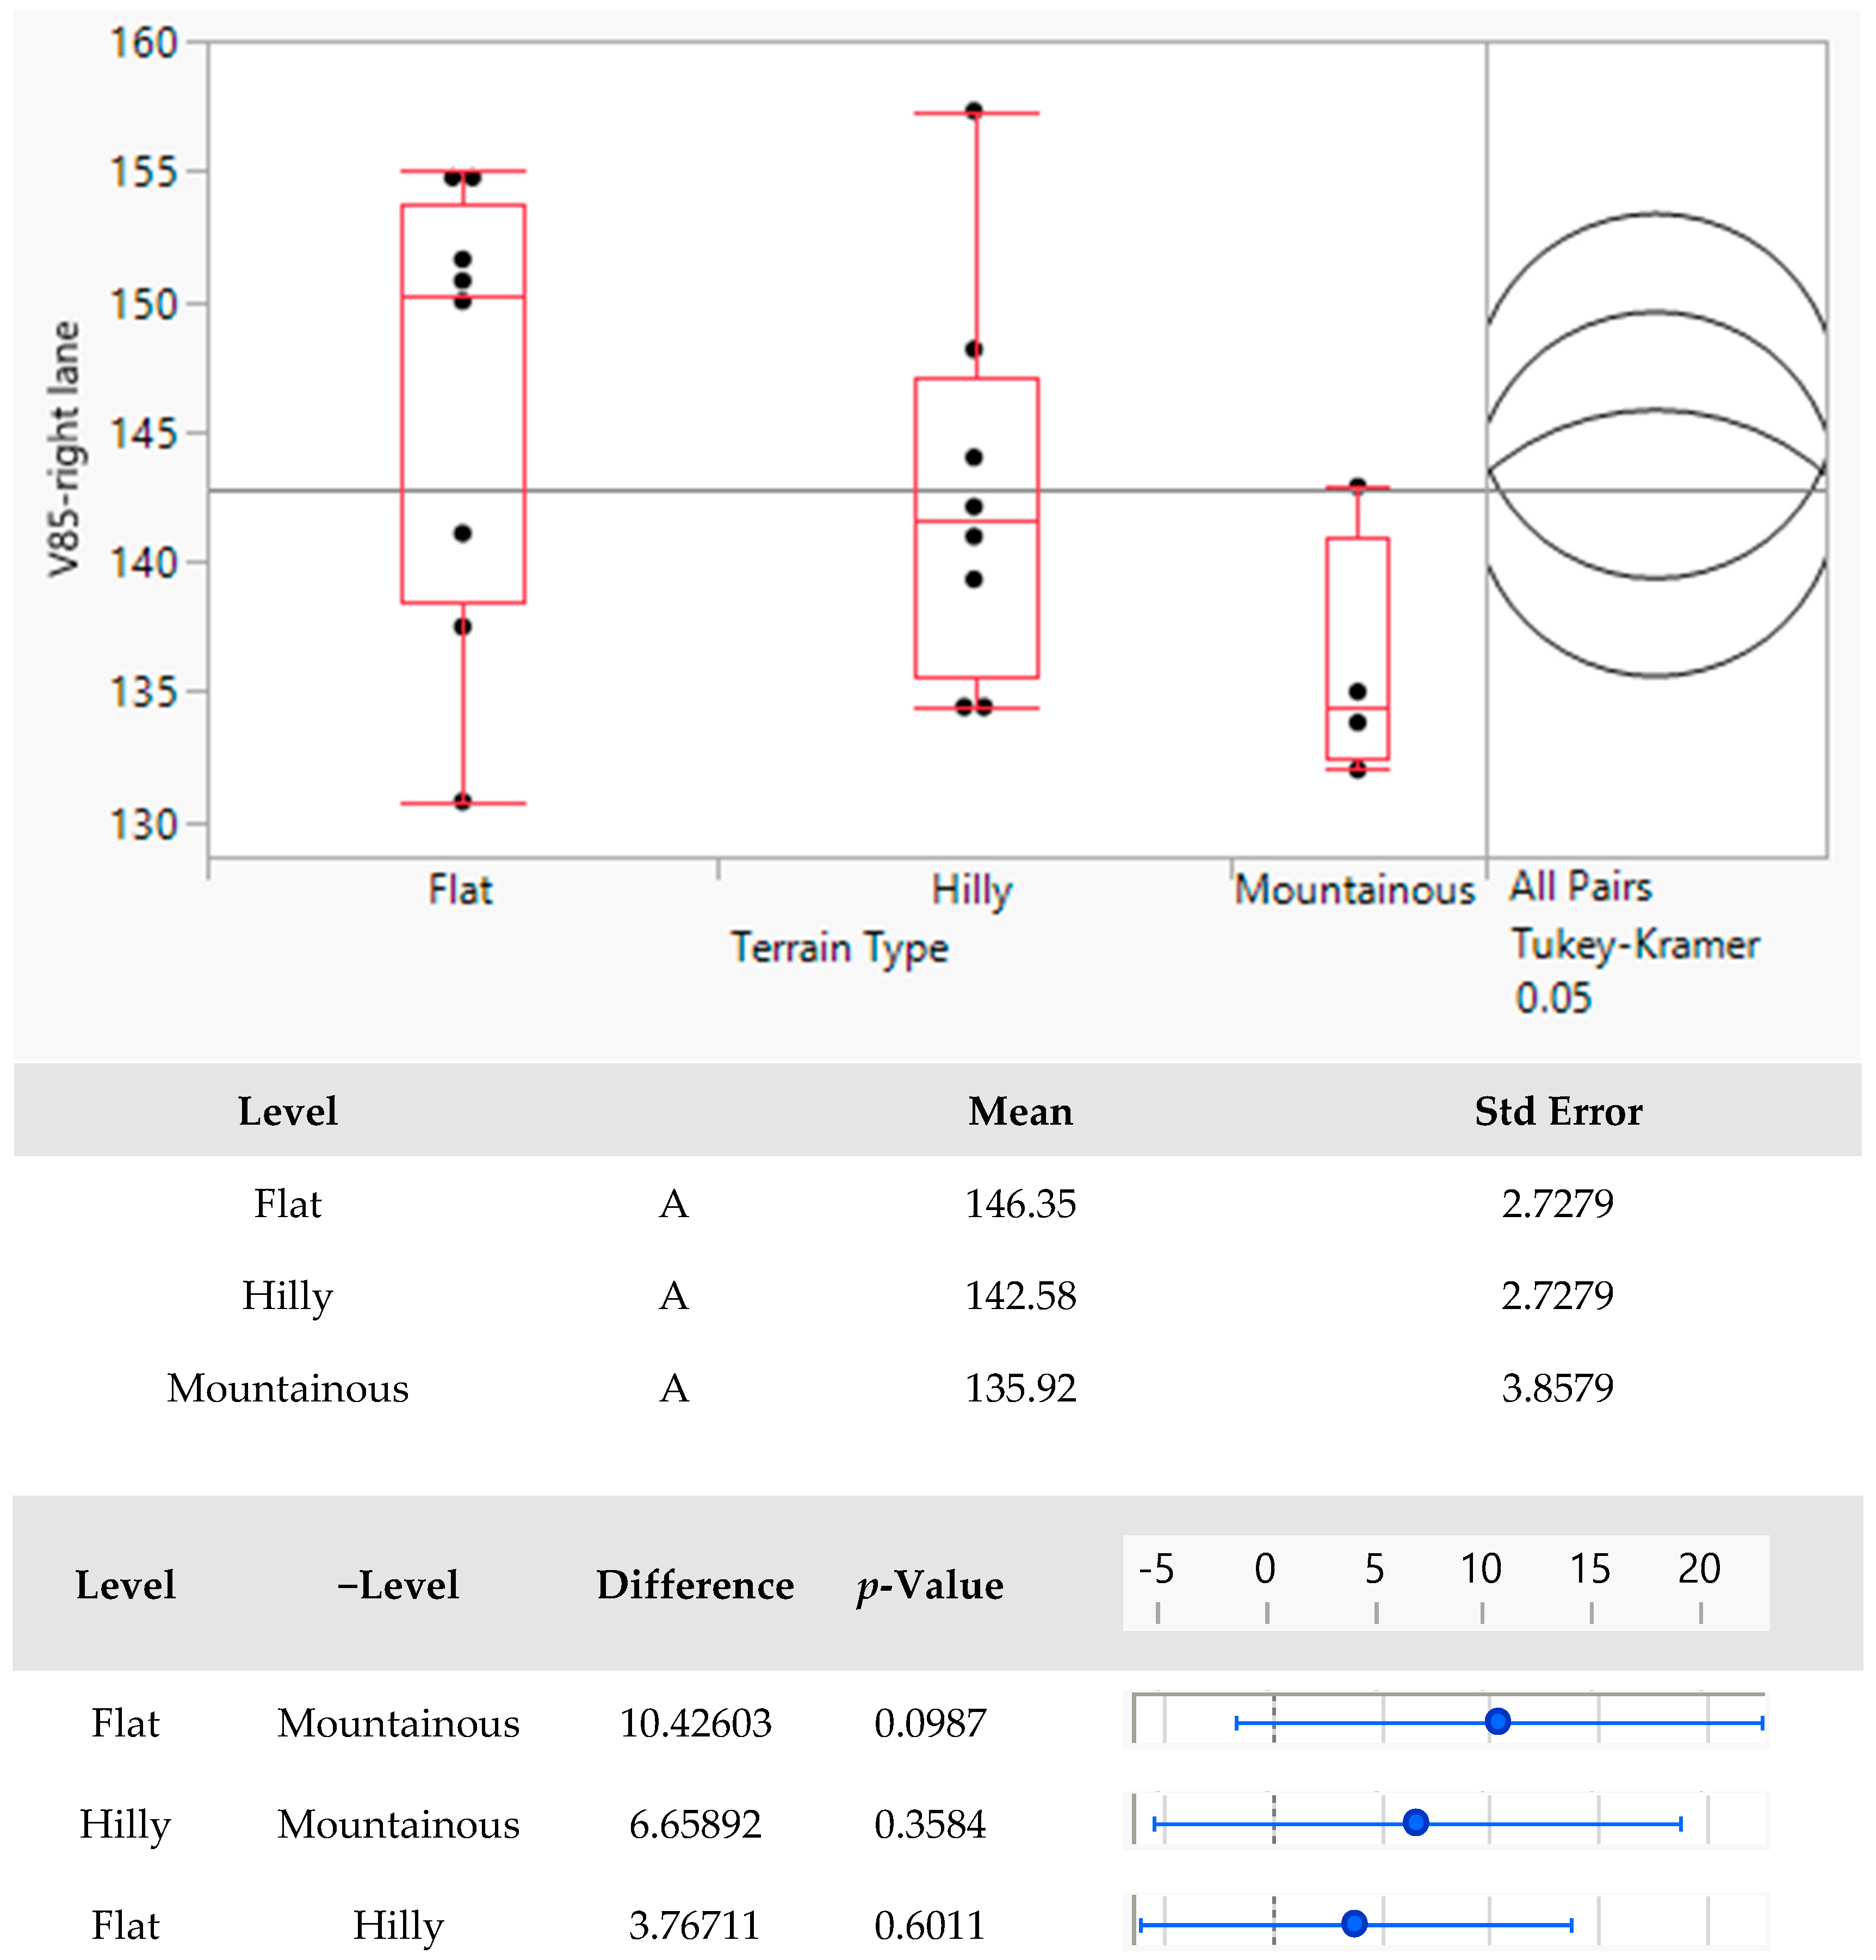
An analysis of variance (ANOVA) was conducted to investigate the influence of several categorical factors on the operating vehicle speed (V85) in the right (driving) lane of dual-carriageway road tangents. The results showed that, for most factors, there was no statistically significant effect on the operating speed. Specifically, the factors speed limit (p = 0.6072), lane width (p = 0.5067), and design speed (Vp) (p = 0.5067) all resulted in p-values greater than 0.05, indicating that these factors did not significantly influence the vehicle speed in the right lane. Similarly, the factor terrain type (p = 0.1172) exhibited a borderline significant effect, with an F-ratio of 2.4380, suggesting potential differences in the speed across terrain types, but failing to meet the conventional significance threshold of 0.05. Given that terrain type approached statistical significance, it was decided to conduct a post hoc Tukey–Kramer test to further explore the pairwise differences between the terrain categories. The Tukey–Kramer test results are shown in Figure 21.

4. Discussion and Conclusions

Road traffic safety is a critical global issue, with approximately 1.19 million fatalities occurring annually due to road traffic accidents, as reported by the World Health Organization. The socioeconomic burden of these accidents is substantial, with costs estimated at 3% of GDP in the European Union alone. Among the key contributors to road traffic accidents is excessive or inappropriate speed, which is linked to higher crash rates and severity levels. Studies have indicated that a 1% increase in average speed results in a 4% increase in fatal crash risk. Indeed, road tangents, characterized by their straight alignment and lack of geometric constraints, are particularly associated with higher operating speeds, making them crucial areas for traffic safety research. Despite their role in enhancing traffic flow efficiency, tangents pose significant safety risks due to the potential for excessive speeds and increased crash severity. Previous research has highlighted various factors influencing operating speeds, such as road geometry, traffic conditions, and human behavior, but a comprehensive understanding of these influences remains incomplete. This study aimed to address this gap by analyzing the operating speeds (V85) on road tangents of both single-carriageway and dual-carriageway roads, investigating their correlation with geometric, traffic-related, and environmental factors. To achieve this, a combination of field data collection and statistical analysis was performed, including the Pearson correlation test and the Tukey–Kramer test for categorical variables. The research was conducted on carefully selected road segments in Croatia, covering various speed limits and road environments to ensure a diverse and representative dataset. By identifying key relationships between the operating speed and influential factors, this study contributes to a more detailed understanding of speed behavior on road tangents and its implications for road safety and infrastructure planning.
The analysis of single-carriageway road tangents revealed limited statistically significant relationships between the investigated factors and the operating speed (V85). The initial assumption that road geometry, traffic flow characteristics, and roadside features substantially influence speed behavior was only partially supported by the data.
Among the continuous variables, correlation analyses using the Pearson and Spearman’s tests indicated that none of the examined factors were significantly correlated with operating speed on single-carriageway road tangents at the 5% significance level. Although the average annual daily traffic (AADT) and the crash ratio demonstrated moderate negative correlations with V85 (ρ = −0.3970, ρ = 0.0547 and ρ = 0.3628, p = 0.0815, respectively), the associations did not reach statistical significance. Similarly, tangent lengths, longitudinal slope, and heavy goods vehicles share exhibited weak or negligible correlations with the operating speed, suggesting that these variables alone are insufficient predictors of speed behavior on single-carriageway road tangents.
For the binary variables, independent sample t-tests did not identify any statistically significant differences in the operating speed across categories such as guardrail presence, shoulder lane presence, overtaking allowance, road category, or the disruptive presence factor. These results imply that such binary features may not play a dominant role in speed selection on tangent segments or that their effects are moderated by other, unmeasured factors, such as driver behavior or the contextual environment.
More insight was gained from the multi-level categorical variables assessed through one-way ANOVA and post hoc Tukey–Kramer testing. The ANOVA results showed that only terrain type had a statistically significant effect on the operating speed (F = 10.99, p = 0.0005), with post hoc comparisons revealing that vehicles drove significantly faster on hilly and flat terrain than in mountainous areas. This finding aligns with the existing literature [51], which consistently links reduced speeds to increased perceived and actual driving difficulty in mountainous regions. Additionally, lane width, design speed (Vp), and edge line quality exhibited marginal p-values (all around 0.05), suggesting potential effects that warrant further investigation. Consequently, a Tukey–Kramer post hoc analysis was conducted for these variables. For lane width, the comparison between 3.00 m and 3.25 m widths reached statistical significance (p = 0.0435), with wider lanes supporting higher operating speeds, which is consistent with findings from the road safety literature. Edge line quality, while not yielding statistically significant differences, showed a tendency toward higher speeds on road sections with higher edge line quality ratings, though these differences did not achieve significance in pairwise comparisons.
Importantly, these results underscore the need for nuanced interpretation when analyzing categorical variables. Unlike continuous predictors, which are often evaluated through correlation, categorical variables require group-wise comparison methods, such as ANOVA and post hoc testing, to uncover meaningful patterns.
In summary, while the majority of the investigated factors did not show statistically significant associations with the operating speed, the influence of terrain type was clearly evident. Additionally, lane width demonstrated borderline significance and could contribute to speed behavior under certain conditions. These findings reinforce the complexity of speed choice on single-carriageway road tangents, and highlight the importance of considering both environmental context and roadway design features in road safety analyses. Future studies should expand the dataset to enhance the statistical power, to incorporate objective measures for road quality assessments, and to explore the interactive effects among multiple road attributes.
The analysis of dual-carriageway road tangents included a separate examination of the left (overtaking) and right (driving) lanes, recognizing their distinct traffic functions. Various factors were tested for their statistical association with operating speed, using correlation analysis for continuous variables (Pearson or Spearman’s depending on the data distribution), t-tests for the binary variables, and ANOVA with post hoc Tukey–Kramer testing for categorical variables with more than two levels.
Among the continuous variables, the most consistent and statistically significant associations were observed for traffic flow-related parameters, especially in the left (overtaking) lane. A strong negative correlation was found between traffic flow density and operating speed in both lanes, particularly in the left lane (ρ = –0.7434, p = 0.0002) and the right lane (ρ = –0.7901, p < 0.0001). Similarly, the average summer daily traffic (ASDT) was significantly negatively correlated with the operating speed in both lanes, more prominently in the right lane (p = 0.0115). These results confirm the intuitive expectation that increased traffic volumes and densities reduce the potential for maintaining higher operating speeds.
A statistically significant positive correlation was also identified between the share of heavy goods vehicles in the left lane and the operating speed in that same lane (ρ = 0.6152, p = 0.0039). This may indicate driver tendency to accelerate in overtaking lanes when passing slower heavy goods vehicles, thereby increasing the average speeds. However, other continuous factors, such as longitudinal slope, object distances (previous and following), and total tunnel length in the preceding 20 km, did not show statistically significant associations with the operating speed in either lane.
Regarding the binary variable of emergency lane presence, the t-test showed no statistically significant difference in the operating speed between road sections with and without emergency lanes. However, this result must be interpreted with caution due to the extremely small sample size in the group without emergency lanes, which included only one road segment.
The analysis of categorical variables via ANOVA did not reveal statistically significant differences in operating speed for speed limit, lane width, design speed, or terrain type, though terrain type approached statistical significance for both lanes (p = 0.0970 for the left land; p = 0.1172 for the right). Tukey–Kramer post hoc testing suggested higher speeds on flat terrain compared to hilly or mountainous terrain, but these differences were not statistically significant at the 0.05 level. Nonetheless, the consistent trend suggests a potential practical relevance worth exploring further in future research.
In summary, the results for dual-carriageway road tangents indicate that traffic-related variables, particularly traffic flow density and ASDT, are the most influential factors affecting the operating speed. These effects are more pronounced in the left lane, likely due to its function in overtaking maneuvers. While the geometric characteristics and infrastructure features did not show strong statistical relationships in this dataset, their influence may become clearer with a larger and more diverse sample. Future studies should continue to examine the interaction between traffic flow dynamics and road design elements, especially in multilane settings where lane function varies.
An important consideration arising from both analyses is the overall weak association between the operating speed and most investigated factors. This pattern suggests that factors beyond road geometry and traffic flow characteristics may exert a stronger influence on driver speed choice in these contexts. One plausible explanation is the absence of strong physical constraints on speed, such as those present on horizontal curves (e.g., curve radius and therefore centrifugal force). Tangents offer relatively unobstructed sight distances and driving comfort, enabling drivers to travel at speeds of their choosing with limited immediate feedback or correction imposed by the road itself.
Moreover, the research was conducted on road segments outside urban areas, where default speed limits apply (typically 90 km/h for single-carriageway roads) unless otherwise posted. In such zones, in contrast to urban areas, enforcement intensity is generally lower, and penalties for speeding are comparatively lenient, particularly for marginal excesses over the posted speed limit. Additionally, Croatian legislation [57] include a legally recognized tolerance margin of 10 km/h for speed limits up to 100 km/h, and 10% for limits above 100 km/h. This means that a driver traveling at 100 km/h in a 90 km/h zone, or at 143 km/h on a motorway with a 130 km/h limit, is not considered to be speeding. This regulatory structure likely reduces the perceived risk of enforcement and diminishes the drivers’ motivation to strictly adhere to speed limits on these segments.
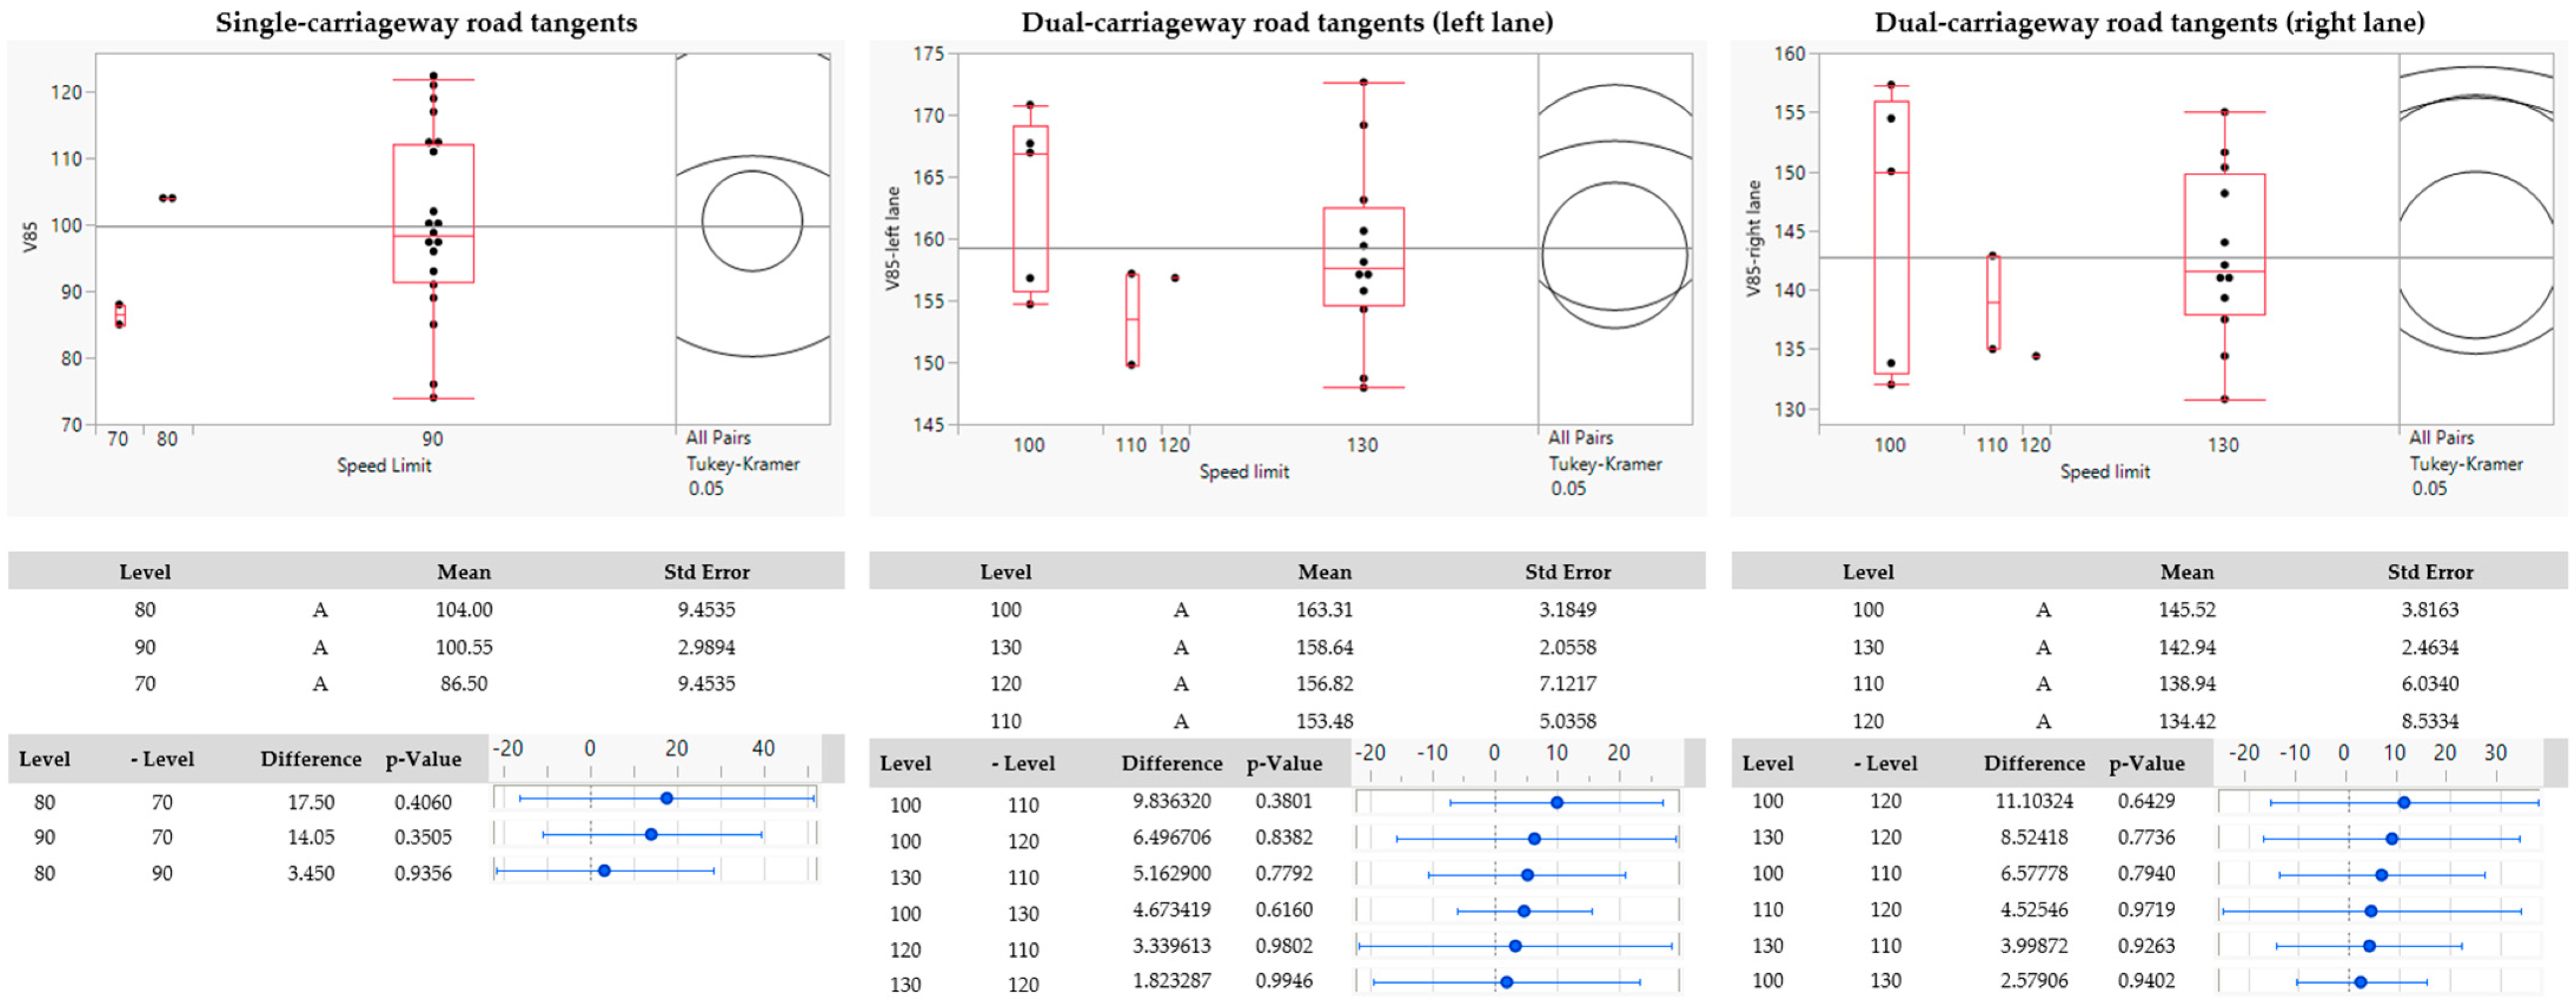
This interpretation is further supported by the findings of the Tukey–Kramer post hoc tests, which revealed no statistically significant differences in the operating speed across different posted speed limit categories for both single- and dual-carriageway road tangents (Figure 22).
Such results underscore the salience of driver psychology and enforcement perception as determinants of actual driving behavior. On many roads where the measurements were taken, fixed speed enforcement is absent and its position is likely well known through public mapping platforms (like Google Maps), allowing drivers to adjust their behavior accordingly when appearing closer to the location of enforcement. In particular, dual-carriageway roads (e.g., motorways) lack fixed enforcement systems, relying instead on mobile enforcement (e.g., unmarked police vehicles), which tend to target only extreme cases of speeding. This enforcement environment likely contributes to the high and relatively uniform operating speeds observed, independent of posted limits or road design features.
This research has several limitations. First, this study was conducted on a limited number of locations, and expanding the research to a broader range of sites would improve the generalizability of the findings. Additionally, examining the same tangent segments in different countries could reveal variations in speed selection due to the differences in driving behavior and traffic culture. An area that warrants further investigation is whether driver demographics or vehicle types systematically differ between single- and dual-carriageway roads. Such differences could potentially influence observed speed behavior and contribute to variations in operating speeds across road types. For instance, it is plausible that dual-carriageway roads, particularly motorways, attract a higher proportion of long-distance travelers, commercial vehicles, or more experienced drivers, whereas single-carriageway roads may be more frequently used by local traffic with a different demographic or vehicle composition. If such systematic differences are confirmed, they could represent an important factor in understanding driver behavior and speed selection, offering a valuable direction for future research aimed at refining speed prediction models and enhancing road safety measures.
Further research should also focus on tangent segments with lower speed limits and a wider range of speed limits to explore better their influence on operating speeds. This study should also be extended to other road categories as well as to 2 + 1 road configurations to capture more diverse road environments. It is important to acknowledge that certain variables used in the analysis, specifically edge line quality, visibility, and pavement quality were assessed subjectively based on a visual inspection in the field. While this approach provides a practical initial estimation, it introduces a level of observer bias and limits the reproducibility of the results. For future research, it would be fruitful for these parameters to be quantified using objective measurement techniques. For instance, edge line quality could be evaluated using retroreflectivity meters, visibility through precise geometric modeling, or LiDAR-based sight distance analysis, and pavement quality via standardized indices, such as the International Roughness Index (IRI) or the Pavement Condition Index (PCI). Implementing such objective methodologies would enhance the reliability and comparability of the findings, allowing for more precise conclusions. Moreover, the research was limited to extra-urban areas, excluding urban contexts where different factors may influence operating speeds. Future studies should also incorporate driver perception through surveys or questionnaires to better understand visibility-related influences on the operating speed. Finally, future research should focus on developing predictive models for the operating speed on road tangents, enabling more accurate assessments of speed trends and their implications for road safety and infrastructure design.

Author Contributions

Conceptualization, J.L.V.; methodology, J.L.V., M.J., and B.A.; validation, M.J., J.L.V., and M.Š.; formal analysis, J.L.V., M.J., and B.A.; investigation, J.L.V. and M.J.; resources, M.Š. and M.J.; data curation, J.L.V.; writing—original draft preparation, J.L.V.; writing—review and editing, J.L.V., M.J., and B.A.; supervision, M.J., B.A., and M.Š.; project administration, M.J.; funding acquisition, M.J. and M.Š. All authors have read and agreed to the published version of the manuscript.

Funding

This research received no external funding.

Institutional Review Board Statement

Not applicable.

Informed Consent Statement

Not applicable.

Data Availability Statement

The data used to support the findings of this study are available from the corresponding author upon request.

Conflicts of Interest

The authors declare no conflicts of interest.

Appendix A

Table A1. Locations (cross sections) general data.
Road TypeRoad
Category
Road NameDirectionSpeed Limit [km/h]AADT ASDT Total Sample Size (All Vehicle Categories) [veh]Filtered Sample Size (Passenger Cars) [veh]
[veh/day][veh/day]
Single-carriageway
road
State roadDubrovniktowards Dubrovnik9018,29225,75782221024
towards Čilipi9018,29225,75768021287
Single-carriageway
road
County roadGospićfrom toll908781118242161
towards toll908781118176119
Single-carriageway
road
County roadKninfrom Knin90121614508870
towards Knin90121614507656
Single-carriageway
road
County roadOsijekfrom Osijek70871784382433933
towards Osijek708717843835261147
Single-carriageway
road
State roadPazinfrom Pazin9033913847492335
towards Pazin9033913847488338
Single-carriageway
road
County roadPožegafrom Požega9016561655836323
towards Požega9016561655928429
Single-carriageway
road
State roadPulafrom Pula90287343751602771
towards Pula90287343751557762
Single-carriageway
road
State roadSisaktowards Sisak9039534550479248
towards Stružec9039534550516234
Single-carriageway
road
State roadSplitfrom Klis8024043522823299
towards Klis80240435221234359
Single-carriageway
road
State roadVaraždinfrom Varaždin90894787731603564
towards Varaždin90894787731696661
Single-carriageway
road
County roadViroviticafrom Novaki903804107462
towards Novaki903804107563
Single-carriageway
road
State roadZadartowards Zadar9013,02222,9041914906
towards Nin9013,02222,9041211502
Total:37,09311,653
Road typeRoad
Category
Road nameCarriageway/DirectionSpeed limit [km/h]AADTASDTTotal sample size (all vehicle categories)Filtered sample size (passenger cars)
[veh/day][veh/day]Left lane [veh]Right lane [veh]Left lane [veh]Right lane [veh]
Dual-carriageway
road
MotorwayMotorway A1Bisko—Blato na Cetini130525311,05939173986113
Blato na Cetini—Bisko130525311,05934061486113
Dual-carriageway
road
MotorwayMotorway A1Bosiljevo 2—Ogulin10010,51124,74741460094106
Ogulin—Bosiljevo 210010,51124,747506703102105
Dual-carriageway
road
MotorwayMotorway A1Donja Zdenčina—Jastrebarsko13020,60334,4747735509979
Jastrebarsko—Donja Zdenčina13020,60334,4748635858679
Dual-carriageway
road
MotorwayMotorway A1Gornja Ploča—Gospić100925522,5812434682573
Gospić—Gornja Ploča120925522,58144368882114
Dual-carriageway
road
MotorwayMotorway A1Zadar Center—Zadar East130785719,27957475394110
Zadar East—Zadar Center130785719,27961177085106
Dual-carriageway
road
MotorwayMotorway A2Zabok—Zaprešić130999915,4731373552986
Zaprešić—Zabok130999915,47323250243108
Dual-carriageway
road
MotorwayMotorway A3Babina Greda—Županja100598891841672616081
Županja—Babina Greda10059889184872113262
Dual-carriageway
road
MotorwayMotorway A3Križ—Popovača13013,42518,0672424435272
Popovača—Križ13013,42518,0672734207381
Dual-carriageway
road
MotorwayMotorway A3Lužani—Nova Gradiška130900712,9472653626570
Nova Gradiška—Lužani130900712,9473503837874
Dual-carriageway
road
MotorwayMotorway A6Delnice—Ravna Gora110798113,2331584385499
Ravna Gora—Delnice110798113,2333804636382
Total:744910,30813881813
17,7573201

Appendix B

Table A2. Factors identified—Summary.
Operating Speed ValuesSymbolUnit of MeasureTypeMeanStDevMinMaxMedian
Operating speed (V85) for single-carriageway road tangentsV85[km/h]Continuous93.1814.3774.00128.0091.50
Operating speed (V85) for dual-carriageway road tangents (left lane)V85L[km/h]Continuous159.207.19148.00173.00157.00
Operating speed (V85) for dual-carriageway road tangents (right lane)V85R[km/h]Continuous142.708.22131.00157.00141.50
Factors—Single-carriageway roadsSymbolUnit of measureTypeMeanStDevMinMaxMedian
Passenger sidePS[-]Categorical—Multi-level; ---------------
Shoulder typeST[-]Categorical—Multi-level; ---------------
Edge line qualityELQ[-]Categorical—Multi-level; ---------------
VisibilityVsb[-]Categorical—Multi-level; ---------------
Pavement qualityPQ[-]Categorical—Multi-level; ---------------
Lateral access densityLAD[-]Continuous1.631.55061
Tangent length (up to measurement point)TL1[m]Continuous848.75619.25110.002500.00715.00
Tangent length (from measurement point)TL2[m]Continuous848.75619.25110.002500.00715.00
Speed limitSL[km/h]Categorical—Multi-level;87.506.0870.0090.0090.00
AADTAADT[veh/day]Continuous5477.425488.92380.0018,292.003132.00
ASDTASDT[veh/day]Continuous7233.258244.36410.0025,757.004111.00
Lane widthLW[m]Categorical—Multi-level;3.020.302.503.503.00
Longitudinal slopeLS[%]Continuous0.003.364-5.205.200.00
Crash ratioCR[-]Continuous0.0037850.0025440.0021080.0115450.003098
Design speedVp[km/h]Categorical—Multi-level;69.16718.8640.00100.0070.00
Terrain typeTT[-]Categorical—Multi-level; ---------------
Guardrail presenceGP[-]Binary0.170.38010
Shoulder lane presenceELP[-]Binary0.630.49011
Radius of previous curveRpC[m]Continuous418.75372.5125.001500.00315.00
Radius of following curveRfC[m]Continuous418.75372.5125.001500.00315.00
Road categoryRC[-]Binary0.580.50011
Overtaking allowedOA[-]Binary0.880.34011
Heavy goods vehicles shareHVS[%]Continuous3.601.901.208.403.20
Disruptive factor presenceDFP[-]Binary0.130.34010
Factors—Dual-carriageway roadsSymbolUnit of measureTypeMeanStDevMinMaxMedian
Total tunnel length in last 20 kmTTL[m]Continuous274.50662.0502640.000
Speed limitSL[km/h]Categorical—Multi-level;120.0013.38100.00130.00130.00
Lane widthLW[m]Categorical—Multi-level;3.700.153.253.753.75
Design speedVp[km/h]Categorical—Multi-level;116.0012.3180.00120.00120.00
Emergency lane presenceSLP[-]Binary0.900.31011
Previous object distancePOD[m]Continuous4810.003066.96013,400.004400.00
Following object distanceFOD[m]Continuous4400.003067.66013,400.003650.00
Longitudinal slopeLS[%]Continuous0.431.81-4.004.000.00
Terrain typeTT[-]Categorical—Multi-level;---------------
Heavy goods vehicles share (left lane)HVS_LL[%]Continuous0.870.930.002.920.54
Heavy goods vehicles share (left lane)HVS_RL[%]Continuous17.129.384.5235.0814.83
Heavy goods vehicles share (both lanes)HVS_2L[%]Continuous10.535.812.5622.8210.09
AADTAADT[veh/day]Continuous9.994.275.2520.609.13
ASDTASDT[veh/day]Continuous18.107.399.1834.4716.77
Traffic flow density (left lane)TFD_LL[veh/km/lane]Continuous2.491.420.704.802.15
Traffic flow density (right lane)TFD_RL[veh/km/lane]Continuous4.331.631.807.003.80

References

  1. World Health Organization. Global Status Report on Road Safety 2023; WHO: Geneva, Switzerland, 2023. [Google Scholar]
  2. Ministry of the Interior, Republic of Croatia. National Road Safety Plan of the Republic of Croatia for the Period 2021–2030; Ministry of the Interior: Zagreb, Croatia, 2021.
  3. International Transport Forum (ITF). Road Safety Annual Report 2018; OECD Publishing: Paris, France, 2018. [Google Scholar] [CrossRef]
  4. SWOV Institute for Road Safety Research. Speed and Speed Management; SWOV: The Hague, The Netherlands, 2021. [Google Scholar]
  5. National Highway Traffic Safety Administration (NHTSA). Traffic Safety Facts: Speeding; NHTSA: Washington, DC, USA, 2022. [Google Scholar]
  6. Insurance Institute for Highway Safety (IIHS). Speed and Fatality Statistics; IIHS: Arlington, VA, USA, 2022. [Google Scholar]
  7. National Highway Traffic Safety Administration (NHTSA). Crash Data Analysis; NHTSA: Washington, DC, USA, 2022. [Google Scholar]
  8. World Health Organization (WHO). Speed and Road Safety; WHO: Geneva, Switzerland, 2021. [Google Scholar]
  9. Fitzpatrick, K.; Carlson, P.; Brewer, M.; Wooldridge, M. Design Speed, Operating Speed, and Posted Speed Practices; Transportation Research Board: Washington, DC, USA, 2003. [Google Scholar]
  10. Transport for New South Wales (Transport NSW). Annual Report 2010; Transport NSW: Sydney, Australia, 2010. Available online: https://www.transport.nsw.gov.au/system/files/media/documents/2023/2010-annual-report-overview.pdf (accessed on 10 March 2025).
  11. European Automobile Manufacturers Association. Road Safety: Safe Vehicles, Safe Drivers, Safe Roads; European Automobile Manufacturers Association: Brussels, Belgium, 2019; Available online: https://www.roadsafetyfacts.eu/themes/ACEA-Road-Safety-Facts/img/ACEA_Road_Safety.pdf (accessed on 10 March 2025).
  12. Tabish, S.A. Road Traffic & Safety: Risk Factors & Recommendations; Nova Science Publishers Inc: Hauppauge, NY, USA, 2017. [Google Scholar]
  13. European Transport Safety Council. Reducing Speeding in Europe. PIN Flash Report 36; European Transport Safety Council: Brussels, Belgium, 2019; Available online: https://etsc.eu/wp-content/uploads/PIN-flash-report-36-Final.pdf (accessed on 10 March 2025).
  14. Eluru, N.; Bhat, C.R. A Joint Econometric Analysis of Seat Belt Use and Crash-Related Injury Severity. Accid. Anal. Prev. 2007, 39, 1037–1049. [Google Scholar] [CrossRef]
  15. Maji, A.; Singh, D.; Agrawal, N.; Zaman, M. Operating Speed Prediction Models for Tangent Sections of Two-Lane Rural Highways in Oklahoma State. Transp. Lett. 2020, 12, 130–137. [Google Scholar] [CrossRef]
  16. Wang, B.; Hallmark, S.; Savolainen, P.; Dong, J. Examining Vehicle Operating Speeds on Rural Two-Lane Curves Using Naturalistic Driving Data. Accid. Anal. Prev. 2018, 118, 236–243. [Google Scholar] [CrossRef]
  17. Abdul-Mawjoud, A.A.; Sofia, G.G. Development of Models for Predicting Speed on Horizontal Curves for Two-Lane Rural Highways. Arab. J. Sci. Eng. 2008, 33, 365–377. [Google Scholar]
  18. Echaveguren, T.; Díaz, Á.; Vargas-Tejeda, S. Operating Speed Models for Horizontal Reverse Curves. Proc. Inst. Civ. Eng. Transp. 2015, 168, 510–522. [Google Scholar] [CrossRef]
  19. Shallam, R.D.K.; Ahmed, M.A. Operating Speed Models on Horizontal Curves for Two-Lane Highways. Transp. Res. Procedia 2016, 17, 445–451. [Google Scholar] [CrossRef]
  20. Malaghan, V.; Pawar, D.S.; Dia, H. Modeling Operating Speed Using Continuous Speed Profiles on Two-Lane Rural Highways in India. J. Transp. Eng. Part A Syst. 2020, 146, 04020124. [Google Scholar] [CrossRef]
  21. Russo, F.; Biancardo, S.A.; Busiello, M. Operating Speed as a Key Factor in Studying Driver Behaviour in a Rural Context. Transport 2016, 31, 260–270. [Google Scholar] [CrossRef]
  22. Fitzpatrick, K.; Miaou, S.P.; Brewer, M.; Carlson, P.; Wooldridge, M.D. Exploration of the Relationship between Operating Speed and Roadway Features on Tangent Sections. J. Transp. Eng. 2005, 131, 261–269. [Google Scholar] [CrossRef]
  23. Federal Highway Administration (FHWA). Safety Performance Functions: Development and Application; U.S. Department of Transportation: Washington, DC, USA, 2015. Available online: https://www.fhwa.dot.gov/publications/research/safety/15030/006.cfm#073 (accessed on 10 March 2025).
  24. Özkan, T.; Lajunen, T.; El Chliaoutakis, J.; Parker, D.; Summala, H. Cross-Cultural Differences in Driving Behaviours: A Comparison of Six Countries. Transp. Res. Part F Traffic Psychol. Behav. 2006, 9, 227–242. [Google Scholar] [CrossRef]
  25. Jiang, Z.; Jadaan, K.; Ouyang, Y.; University of Illinois; Illinois Department of Transportation; Federal Highway Administration. Speed Harmonization—Design Speed vs. Operating Speed; Civil Engineering Studies, Illinois Center for Transportation Series No. 16-021; Illinois Center for Transportation: Rantoul, IL, USA, 2016; Available online: https://apps.ict.illinois.edu/projects/getfile.asp?id=5056 (accessed on 10 March 2025).
  26. Zuriaga, A.M.P.; García, A.G.; Torregrosa, F.J.C.; D’Attoma, P. Modeling Operating Speed and Deceleration on Two-Lane Rural Roads with Global Positioning System Data. Transp. Res. Rec. 2010, 2171, 11–20. [Google Scholar] [CrossRef]
  27. Dell’Acqua, G.; Russo, F. Speed Factors on Low-Volume Roads for Horizontal Curves and Tangents. Balt. J. Road Bridge Eng. 2010, 5, 89–97. [Google Scholar] [CrossRef]
  28. Abbondati, F.; Capaldo, F.S.; Lamberti, R. Predicting Driver Speed Behavior on Tangent Sections of Low-Volume Roads. Int. J. Civ. Eng. Technol. 2017, 8, 1047–1060. [Google Scholar]
  29. Eboli, L.; Guido, G.; Mazzulla, G.; Pungillo, G. Experimental Relationships between Operating Speeds of Successive Road Design Elements in Two-Lane Rural Highways. Transport 2015, 32, 138–145. [Google Scholar] [CrossRef]
  30. Montella, A.; Galante, F.; Mauriello, F.; Aria, M. Continuous Speed Profiles to Investigate Drivers’ Behavior on Two-Lane Rural Highways. Transp. Res. Rec. 2015, 2521, 3–11. [Google Scholar] [CrossRef]
  31. Dell’Acqua, G.; Esposito, T.; Lamberti, R.; Abate, D. Operating Speed Model on Tangents of Two-Lane Rural Highways. In Proceedings of the 4th International SIIV Congress, Palermo, Italy, 12–14 September 2007; p. 2848. Available online: https://www.siiv.net/site/sites/default/files/Documenti/palermo/63_2848_20080110105803.pdf (accessed on 10 March 2025).
  32. Crisman, B.; Marchionna, A.; Perco, P.; Robba, A.; Roberti, R. Operating Speed Prediction Model for Two-Lane Rural Roads. In Proceedings of the 3rd International Symposium on Highway Geometric Design, Chicago, IL, USA, 29 June–l July 2005; Available online: https://www.siiv.net/site/sites/default/files/Documenti/firenze/firenze05.pdf (accessed on 10 March 2025).
  33. Lobo, A.; Amorim, M.; Rodrigues, C.; Couto, A. Modelling the Operating Speed in Segments of Two-Lane Highways from Probe Vehicle Data: A Stochastic Frontier Approach. J. Adv. Transp. 2018, 2018, 3540785. [Google Scholar] [CrossRef]
  34. Stamatiadis, N.; Gong, H. Analysis of Inconsistency Related to Design Speed, Operating Speed, and Speed Limit; Kentucky Transportation Center Report KTC-06-12/SPR286-05-1F; University of Kentucky: Lexington, KY, USA, 2006. [Google Scholar]
  35. Abbas, S.K.S.; Adnan, M.A.; Endut, I.R. Exploration of 85th Percentile Operating Speed Model on Horizontal Curve: A Case Study for Two-Lane Rural Highways. Procedia-Soc. Behav. Sci. 2011, 16, 352–363. [Google Scholar] [CrossRef]
  36. Medina, A.M.F.; Tarko, A.P. Speed Changes in the Vicinity of Horizontal Curves on Two-Lane Rural Roads. J. Transp. Eng. 2007, 133, 215–222. [Google Scholar] [CrossRef]
  37. Gong, H.; Stamatiadis, N. Operating Speed Prediction Models for Horizontal Curves on Rural Four-Lane Highways. Transp. Res. Rec. 2008, 2075, 1–7. [Google Scholar] [CrossRef]
  38. Croatian Bureau of Statistics. Estimation of the Population of the Republic of Croatia in 2023; Croatian Bureau of Statistics: Zagreb, Croatia, 2024. Available online: https://podaci.dzs.hr/2024/hr/76804 (accessed on 10 March 2025).
  39. Croatian Bureau of Statistics. 1731 Tourism, 2023, Statistical Reports; Croatian Bureau of Statistics: Zagreb, Croatia, 2024; ISSN 1331-341X. Available online: https://podaci.dzs.hr/2024/hr/79000 (accessed on 10 March 2025).
  40. Republic of Croatia. Road Traffic Safety Act (Zakon o sigurnosti prometa na cestama). Narodne Novine 2020, 60, 1225. [Google Scholar]
  41. Ministry of the Sea, Transport and Infrastructure of the Republic of Croatia. Highways. Available online: https://mmpi.gov.hr/infrastruktura/prometna-infrastruktura-137/autoceste/8272 (accessed on 10 March 2025).
  42. Ministry of the Sea, Transport and Infrastructure of the Republic of Croatia. The Republic of Croatia Manages the Following Basic Traffic Infrastructure Network. Available online: https://mmpi.gov.hr/infrastruktura/prometna-infrastruktura-137/republika-hrvatska-raspolaze-sa-sljedecom-osnovnom-mrezom-prometne-infrastrukture/10402 (accessed on 10 March 2025).
  43. Croatian Roads Ltd. In Traffic Counting on the Roads of the Republic of Croatia, 2023; Croatian Roads Ltd.: Zagreb, Croatia, 2023; Available online: https://hrvatske-ceste.hr/uploads/documents/attachment_file/file/1804/Brojenje_prometa_na_cestama_Republike_Hrvatske_godine_2023.pdf (accessed on 10 March 2025).
  44. Kiss, B.; Ballagi, Á.; Kuczmann, M. An Efficiency Examination of the DJI Mavic 2 Pro’s Precision Landings. Preprints 2024. [Google Scholar] [CrossRef]
  45. Jovanović, B. Fundamental Probabilistic Traffic Flow Model for High-Performance Roads in the Republic of Croatia. Ph.D Thesis, University of Zagreb, Zagreb, Croatia, 2024. [Google Scholar]
  46. Van Driel, C.J.G.; Davidse, R.J.; Van Maarseveen, M.F.A.M. The Effects of an Edgeline on Speed and Lateral Position: A Meta-Analysis. Accid. Anal. Prev. 2004, 36, 671–682. [Google Scholar] [CrossRef]
  47. Boroujerdian, A.M.; Seyedabrishami, E.; Akbarpour, H. Analysis of Geometric Design Impacts on Vehicle Operating Speed on Two-Lane Rural Roads. Procedia Eng. 2016, 161, 1144–1151. [Google Scholar] [CrossRef]
  48. Yan, Y.; Li, G.; Tang, J.; Guo, Z. A Novel Approach for Operating Speed Continuous Prediction Based on Alignment Space Comprehensive Index. J. Adv. Transp. 2017, 2017, 9862949. [Google Scholar] [CrossRef]
  49. Li, Y.F.; Chen, M.N.; Lu, X.D.; Zhao, W.Z. Research on Optimized GA-SVM Vehicle Speed Prediction Model Based on Driver-Vehicle-Road-Traffic System. Sci. China Technol. Sci. 2018, 61, 782–790. [Google Scholar] [CrossRef]
  50. Croatia. Ordinance on Basic Conditions That Public Roads Outside Settlements and Their Elements Must Meet from the Point of View of Traffic Safety (OG 110/2001 and 90/2022); Ministry of the Sea, Transport and Infrastructure: Zagreb, Croatia, 2022.
  51. Martinelli, V.; Ventura, R.; Bonera, M.; Barabino, B.; Maternini, G. Estimating Operating Speed for County Road Segments—Evidence from Italy. Int. J. Transp. Sci. Technol. 2022, 12, 560–577. [Google Scholar] [CrossRef]
  52. Charef, A.; Jarir, Z.; Quafafou, M. The Impact of Pedestrian Crossings on Speed Patterns and Roundabout Capacity. Int. J. Sci. Res. Innov. Stud. 2024, 3, 13–20. [Google Scholar]
  53. Prakash, C.M.; Navandar, Y.V.; Golakiya, H.D.; Dhamaniya, A. Analysis of the Impact of Pedestrian Crossing Activity on Traffic Characteristics at Urban Midblock Sections Using a Simulation Technique. In Recent Advances in Transportation Systems Engineering and Management; Anjaneyulu, M.V.L.R., Harikrishna, M., Arkatkar, S.S., Veeraragavan, A., Eds.; Lecture Notes in Civil Engineering; Springer: Singapore, 2023; Volume 261. [Google Scholar] [CrossRef]
  54. Aram, A. Effective Safety Factors on Horizontal Curves of Two-Lane Highways. J. Appl. Sci. 2010, 10, 2814–2822. [Google Scholar] [CrossRef]
  55. Liu, S.; Wang, J.; Fu, T. Effects of Lane Width, Lane Position, and Edge Shoulder Width on Driving Behavior in Underground Urban Expressways: A Driving Simulator Study. Int. J. Environ. Res. Public Health 2016, 13, 1010. [Google Scholar] [CrossRef]
  56. Gaddam, H.K.; Rao, K.R. Speed–Density Functional Relationship for Heterogeneous Traffic Data: A Statistical and Theoretical Investigation. J. Mod. Transp. 2019, 27, 61–74. [Google Scholar] [CrossRef]
  57. Croatian Bureau of Metrology. Ordinance on Metrological and Technical Requirements for Speedometers in Road Traffic; Official Gazette 60/2020; Croatian Bureau of Metrology: Zagreb, Croatia, 2020.
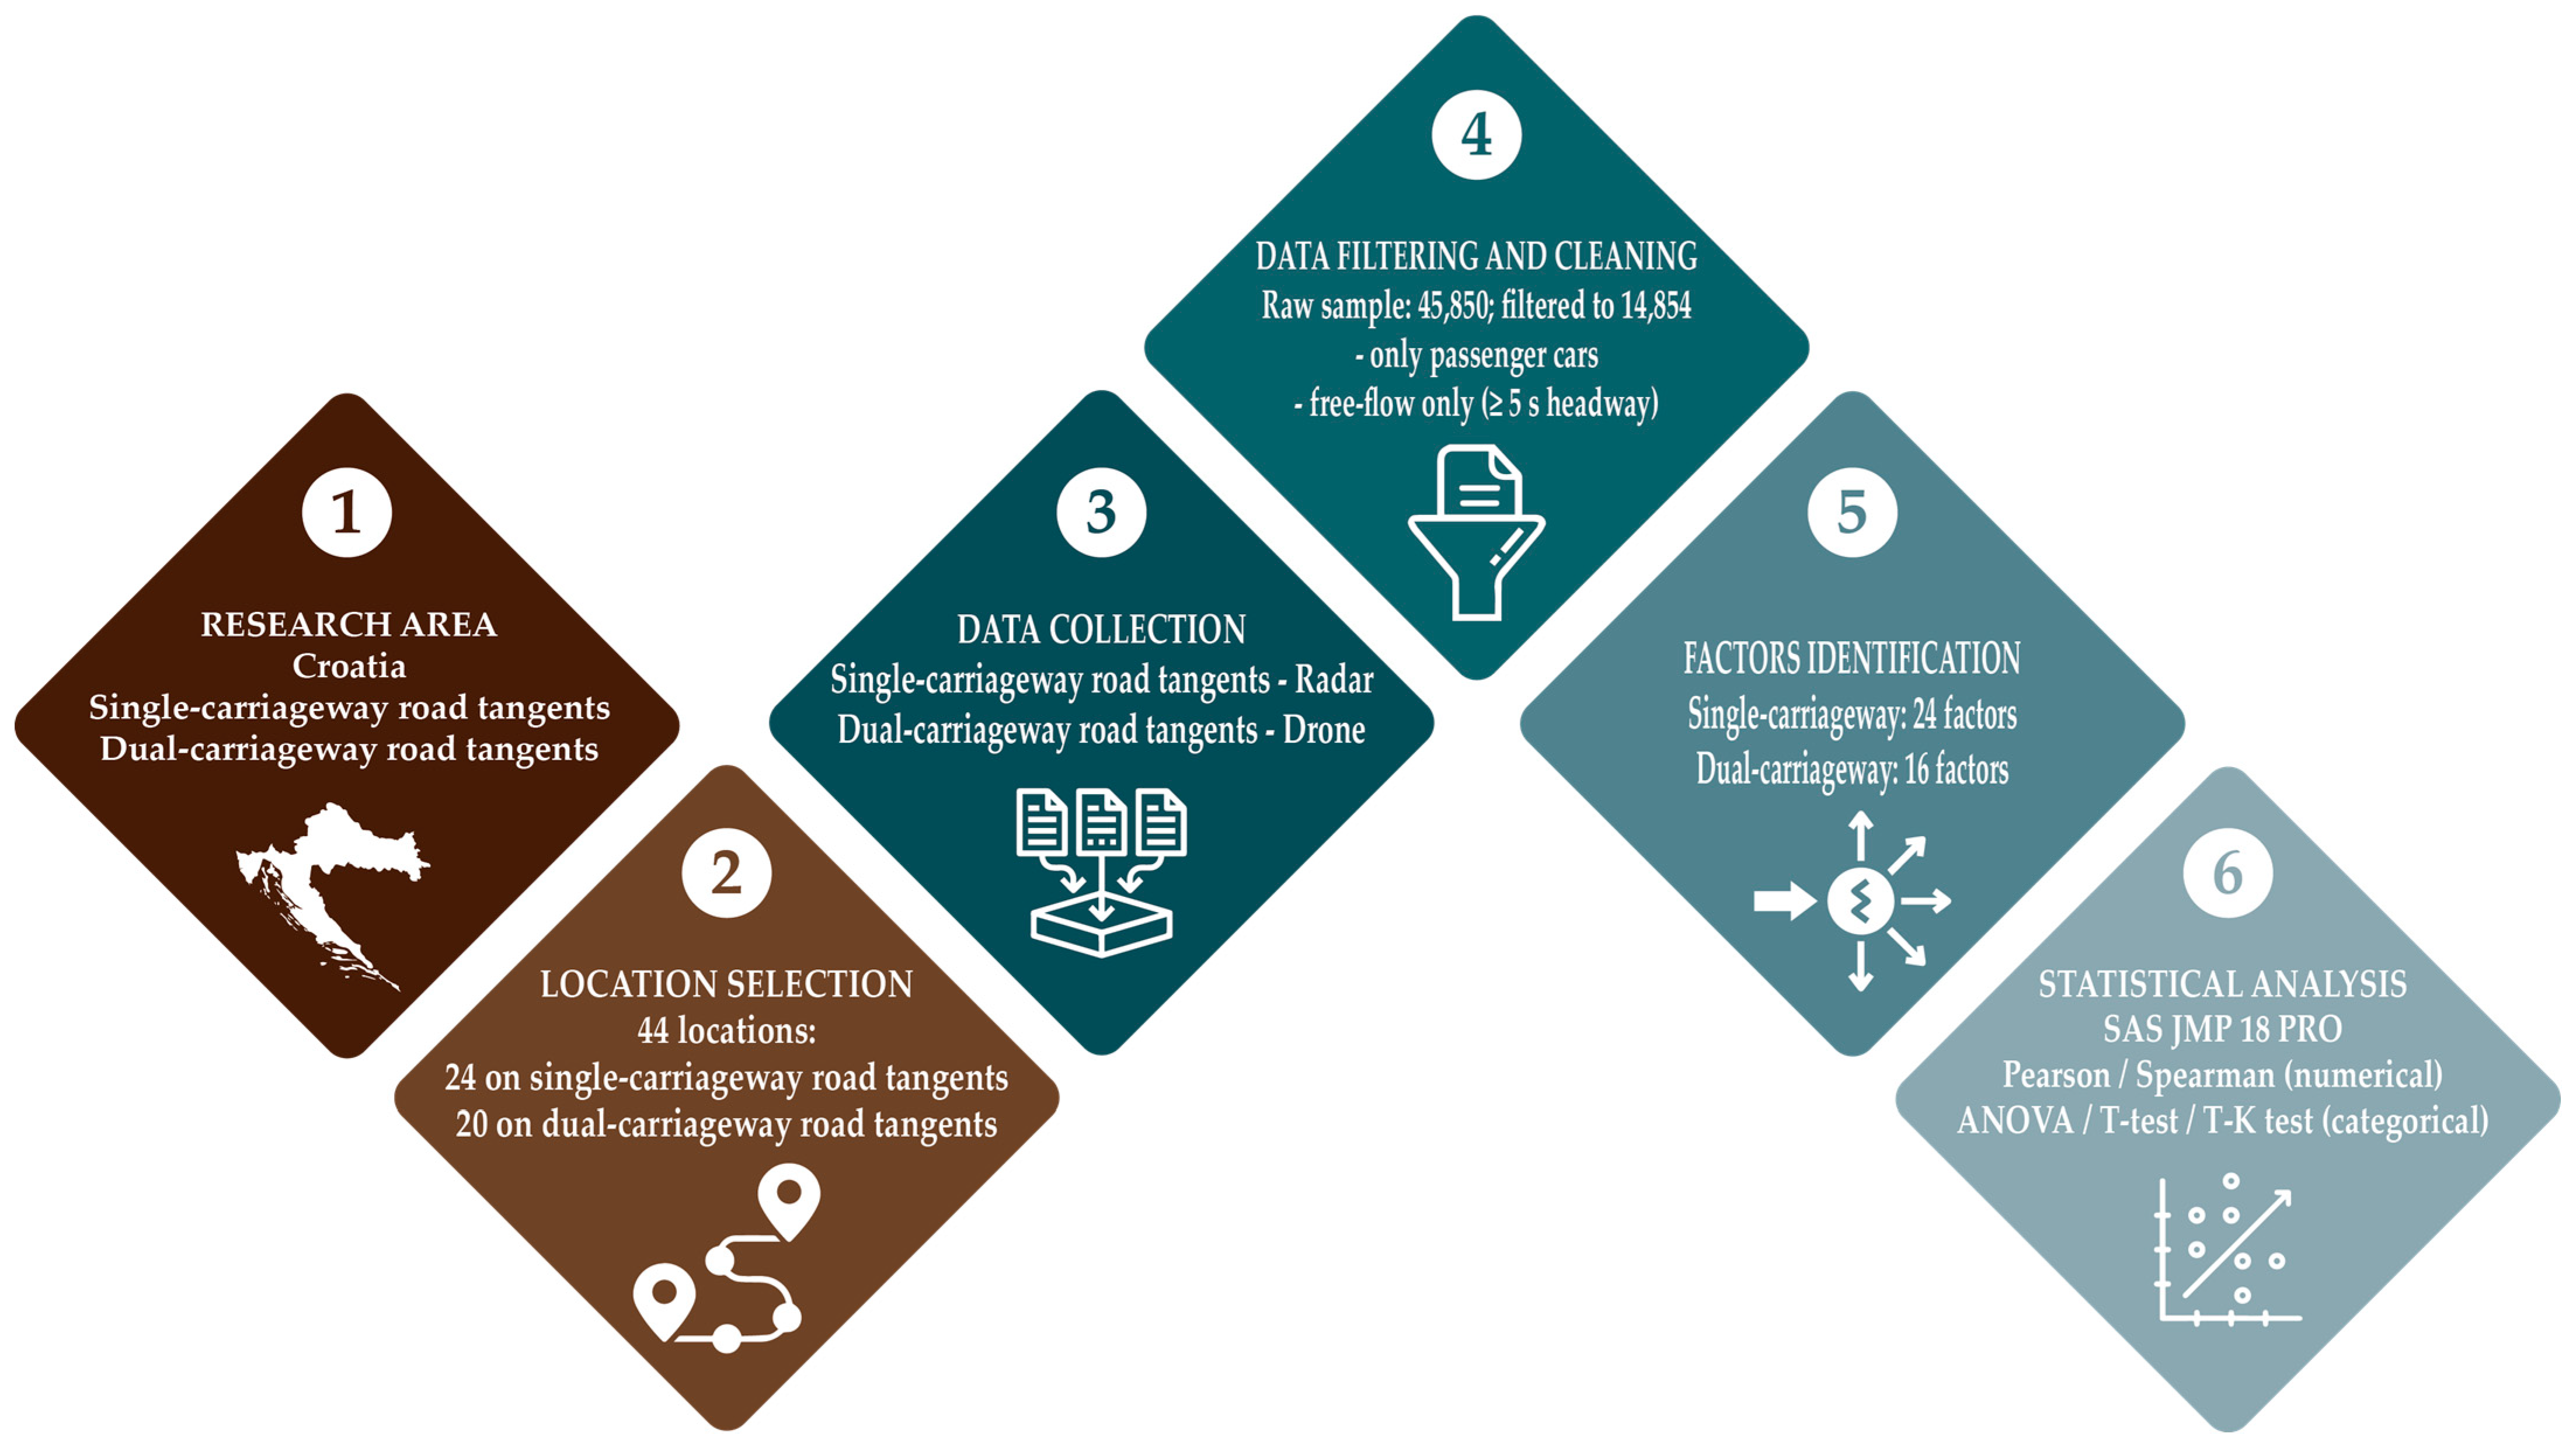
Figure 1. Methodology flowchart.
Applsci 15 07549 g001
Figure 2. Typical (a) motorway, (b) state road, and (c) county road in Croatia.
Applsci 15 07549 g002
Figure 3. Croatian road network—motorways; state roads; county roads.
Applsci 15 07549 g003
Figure 4. Map showing selected locations (cross sections) on dual- and single-carriageway roads in Croatia.
Applsci 15 07549 g004
Figure 5. Radar device installation on one of the locations.
Applsci 15 07549 g005
Figure 6. The unmanned aerial vehicle (drone) MAVIC 2 PRO, utilized for recording video footage of the selected locations [44].
Applsci 15 07549 g006
Figure 7. Defining the positions of entry and exit reference lines for vehicle detection on aerial video footage within the Adobe Premiere Pro 2023 software [45].
Applsci 15 07549 g007
Figure 8. Marking the moments of individual vehicles entering the entry and exit detection lines, based on adding tags with comments to the video timeline in the Adobe Premiere Pro 2023 software [45].
Applsci 15 07549 g008
Figure 9. Exporting tags with comments recorded during video playback from the Adobe Premiere Pro 2023 software to an MS Excel database [45].
Applsci 15 07549 g009
Figure 10. Shapiro–Wilk test for continuous factors—single-carriageway road tangents (Values marked with * indicate statistically significant results at the 0.05 level).
Applsci 15 07549 g010
Figure 11. t-Test results for the binary factors—single-carriageway road tangents.
Applsci 15 07549 g011
Figure 12. ANOVA results for multi-level categorical factors—single-carriageway road tangents (Values marked with * indicate statistically significant results at the 0.05 level).
Applsci 15 07549 g012
Figure 13. Tukey–Kramer test results—single-carriageway road tangents (Values marked with * indicate statistically significant results at the 0.05 level).
Applsci 15 07549 g013
Figure 14. Shapiro–Wilk test for continuous factors—dual-carriageway road tangents (Values marked with * indicate statistically significant results at the 0.05 level).
Applsci 15 07549 g014
Figure 15. Determination of statistically significant difference between measured speeds in the left and right lane on motorways (Values marked with * indicate statistically significant results at the 0.05 level).
Applsci 15 07549 g015
Figure 16. t-test results for the binary factor (emergency lane presence)—left (overtaking) lane of dual-carriageway road tangents.
Applsci 15 07549 g016
Figure 17. ANOVA results for multi-level categorical factors—left (overtaking) lane of dual-carriageway road tangents.
Applsci 15 07549 g017
Figure 18. Tukey–Kramer test results—terrain type—left (overtaking) lane of dual-carriageway road tangents.
Applsci 15 07549 g018
Figure 19. t-test result for the binary factor (emergency lane presence)—right (driving) lane of dual-carriageway road tangents.
Applsci 15 07549 g019
Figure 20. ANOVA results for multi-level categorical factors—right (driving) lane of dual-carriageway road tangents.
Applsci 15 07549 g020
Figure 21. Tukey–Kramer test results—terrain type—right (driving) lane of dual-carriageway road tangents.
Applsci 15 07549 g021
Figure 22. Comparison of the operating speeds across different speed limit categories on single- and dual-carriageway road tangents—Tukey–Kramer post hoc test results.
Applsci 15 07549 g022
Table 1. List of dates and relevant hourly intervals during which traffic flow recordings were conducted using drone on selected dual-carriageway segments [45].
Road NameCarriageway/DirectionAerial Video Recording DateOff-Peak Hour
Selected for
Recording
Motorway A1Bisko–Blato na CetiniMonday, 31 July 202312:00–13:00
Blato na Cetini–Bisko
Motorway A1Bosiljevo 2–OgulinTuesday, 18 July 202313:00–14:00
Ogulin–Bosiljevo 2
Motorway A1Donja Zdenčina–JastrebarskoTuesday, 11 July 202318:45–19:45
Jastrebarsko–Donja Zdenčina
Motorway A1Gornja Ploča–GospićTuesday, 18 July 202307:00–08:00
Gospić–Gornja Ploča
Motorway A1Zadar Center–Zadar EastTuesday, 8 August 202312:00–13:00
Zadar East–Zadar Center
Motorway A2Zabok–ZaprešićTuesday, 11 July 202318:45–19:45
Zaprešić–Zabok
Motorway A3Babina Greda–ŽupanjaMonday, 24 July 202318:30–19:30
Županja–Babina Greda
Motorway A3Križ–PopovačaWednesday, 12 July 202306:00–07:00
Popovača–Križ
Motorway A3Lužani–Nova GradiškaMonday, 24 July 202313:00–14:00
Nova Gradiška–Lužani
Motorway A6Delnice–Ravna GoraMonday, 7 July 202318:30–19:30
Ravna Gora–Delnice
Table 2. Statistical approach for factors on single-carriageway road tangents.
Factors—Single-Carriageway RoadsTypeNormal DistributionTest Used
Passenger sideCategorical—Multi-level---ANOVA
Shoulder typeCategorical—Multi-level---ANOVA
Edge line qualityCategorical—Multi-level---ANOVA
VisibilityCategorical—Multi-level---ANOVA
Pavement qualityCategorical—Multi-level---ANOVA
Lateral access densityContinuousNOSpearman
Tangent length (up to measurement point)ContinuousNOSpearman
Tangent length (from measurement point)ContinuousNOSpearman
Speed limitCategorical—Multi-level---ANOVA
AADTContinuousNOSpearman
ASDTContinuousNOSpearman
Lane widthCategorical—Multi-level---ANOVA
Longitudinal slopeContinuousYESPearson
Crash ratioContinuousNOSpearman
Design speedCategorical—Multi-level---ANOVA
Terrain typeCategorical—Multi-level---ANOVA
Guardrail presenceBinary---t-test
Shoulder lane presenceBinary---t-test
Radius of previous curveContinuousNOSpearman
Radius of following curveContinuousNOSpearman
Road categoryBinary---t-test
Overtaking allowedBinary---t-test
Heavy goods vehicles shareContinuousNOSpearman
Disruptive factor presenceBinary---t-test
Table 3. Correlation results—Pearson and Spearman for continuous factors on single-carriageway road tangents.
Continuous Factors
Single-Carriageway Roads
Test UsedPearson Coefficient/Spearman’s ρSignificance Level (p-Value)
Lateral access densitySpearman−0.05400.8020
Tangent length (up to measurement point)Spearman0.10760.6168
Tangent length (from measurement point)Spearman0.15680.4643
AADTSpearman−0.39700.0547
ASDTSpearman−0.34120.1028
Longitudinal slopePearson−0.033520.8764
Crash ratioSpearman0.36280.0815
Radius of previous curveSpearman0.32420.1222
Radius of following curveSpearman0.33490.1097
Heavy goods vehicles shareSpearman0.08290.7002
Table 4. Statistical approach for factors on dual-carriageway road tangents.
Factors—Dual-Carriageway RoadsTypeNormal DistributionTest Used
Total tunnel length in last 20 kmContinuousNOSpearman
Speed limitCategorical—Multi-level---ANOVA
Lane widthCategorical—Multi-level---ANOVA
Design speedCategorical—Multi-level---ANOVA
Emergency lane presenceBinary---t-test
Previous object distanceContinuousYESPearson
Following object distanceContinuousYESPearson
Longitudinal slopeContinuousYESPearson
Terrain typeCategorical—Multi-level---ANOVA
Heavy goods vehicles share (left lane)ContinuousNOSpearman
Heavy goods vehicles share (right lane)ContinuousYESPearson
Heavy goods vehicles share (both lanes)ContinuousYESPearson
AADTContinuousNOSpearman
ASDTContinuousNOSpearman
Traffic flow density (left lane)ContinuousNOSpearman
Traffic flow density (right lane)ContinuousYESPearson
Table 5. Correlation results—Pearson and Spearman’s for continuous factors in the left (overtaking) lane of dual-carriageway road tangents (Values marked with * indicate statistically significant results at the 0.05 level).
Continuous Factors
Dual-Carriageway Roads—Left (Overtaking) Lane
Test UsedPearson Coefficient/Spearman’s ρSignificance Level (p-Value)
Total tunnel length in last 20 kmSpearman−0.21940.3527
Previous object distancePearson0.1709520.4711
Following object distancePearson0.1889810.4249
Longitudinal slopePearson−0.18760.4283
Heavy goods vehicles share (left lane)Spearman0.61520.0039 *
Heavy goods vehicles share (right lane)Pearson0.1151680.6287
Heavy goods vehicles share (both lanes)Pearson0.2848160.2236
AADTSpearman−0.11170.6392
ASDTSpearman−0.46490.0389 *
Traffic flow density (left lane)Spearman−0.74340.0002 *
Traffic flow density (right lane)Pearson−0.666120.0013 *
Table 6. Correlation results—Pearson and Spearman’s for continuous factors in the right (driving) lane of dual-carriageway road tangents (Values marked with * indicate statistically significant results at the 0.05 level).
Continuous Factors
Dual-Carriageway Roads—Right (Driving) Lane
Test UsedPearson Coefficient/Spearman’s ρSignificance Level (p-Value)
Total tunnel length in last 20 kmSpearman−0.20950.3754
Previous object distancePearson0.251150.2855
Following object distancePearson0.0836310.7259
Longitudinal slopePearson−0.100030.6748
Heavy goods vehicles share (left lane)Spearman0.25910.2700
Heavy goods vehicles share (right lane)Pearson0.255930.2761
Heavy goods vehicles share (both lanes)Pearson0.4300920.0584
AADTSpearman−0.31700.1733
ASDTSpearman−0.55250.0115 *
Traffic flow density (left lane)Spearman−0.7901<0.0001 *
Traffic flow density (right lane)Pearson−0.704320.0005 *
Disclaimer/Publisher’s Note: The statements, opinions and data contained in all publications are solely those of the individual author(s) and contributor(s) and not of MDPI and/or the editor(s). MDPI and/or the editor(s) disclaim responsibility for any injury to people or property resulting from any ideas, methods, instructions or products referred to in the content.