Article

Freezing Behavior of Clayey Sand and Spatiotemporal Evolution of Seasonally Frozen Soil Distribution in the Qinghai–Tibet Plateau

1
School of Resources and Geosciences, China University of Mining and Technology, Xuzhou 221116, China
2
School of Geosciences and Info-Physics, Central South University, Changsha 410083, China
*
Author to whom correspondence should be addressed.
Appl. Sci. 2025, 15(13), 7498; https://doi.org/10.3390/app15137498
Submission received: 20 May 2025 / Revised: 1 July 2025 / Accepted: 1 July 2025 / Published: 3 July 2025

Abstract

Seasonally frozen soils are widely distributed across the Qinghai–Tibet Plateau and play a crucial role in regional hydrological processes, ecosystem stability, and infrastructure development. In this study, a custom-designed freeze–thaw apparatus was employed to investigate the freezing behavior of clayey sand with varying initial volumetric water contents. The relationship between electrical resistivity and unfrozen water content was examined through laboratory tests, while six-month resistivity monitoring tests were conducted in a representative frozen soil region of the plateau. The results show that the freezing points for samples with initial volumetric water contents of 30%, 18.5%, and 10% were −2.34 °C, −4.69 °C, and −6.48 °C, respectively, whereas the thawing temperature remained approximately −4 °C across all cases. A strong inverse correlation between resistivity and unfrozen water content was observed during the freezing process. Moreover, the resistivity exhibited a typical U-shaped trend with increasing initial water content, with a minimum level observed at 6~10%. Field resistivity profiles demonstrated limited variation between July and September, while in December, a pronounced thickening of the transition zone and an upward shift in the high-resistivity layer were evident. These findings enhance the understanding of the freeze–thaw mechanisms and the spatiotemporal evolution of frozen soils in high-altitude environments.

1. Introduction

Frozen soils formed under low-temperature conditions significantly influence regional ecosystems, hydrological processes, and infrastructure development [1,2]. The Qinghai–Tibet Plateau hosts extensive frozen soil deposits and, as one of the most climate-sensitive spheres, its frozen soils are experiencing pronounced degradation under the current context of global warming [3,4]. In particular, the dynamic variations in the thickness of the frozen layer, freezing depth, and moisture migration in seasonally frozen soils directly govern the coupled hydrothermal processes of shallow geotechnical materials, and exhibit high sensitivity to surface soil structure, moisture redistribution, and root-zone activity, thereby affecting vegetation growth. In addition, infrastructure such as roads, pipelines, and site foundations in the region are susceptible to disturbance and damage caused by freeze–thaw deformation and water content fluctuations [5,6]. Consequently, in-depth investigation of the freezing characteristics and spatiotemporal evolution of frozen soils in the Qinghai–Tibet Plateau is vital for ensuring ecological security and the stable operation of regional infrastructure [7,8].
In recent years, electrical resistivity tomography (ERT) technology has demonstrated significant potential in identifying frozen soil distribution and monitoring moisture dynamics due to its non-destructive nature, high resolution, and capability for large-scale detection. This technique is particularly suitable for the plateau’s remote and geologically complex areas with restricted access and challenging conditions. However, the practical application of ERT in monitoring frozen soils on the Qinghai–Tibet Plateau remains limited. This limitation is attributed to the complex geological and harsh climatic conditions that strongly affect detection accuracy, as well as incomplete understanding of the electrical response mechanisms and freezing processes of frozen soils, which results in inaccurate estimation of unfrozen water content [9,10,11].
During the freeze–thaw evolution of frozen soils, the phase-change behavior of pore water plays a dominant role. In particular, the state and content of unfrozen water govern key soil properties such as thermal conductivity, electrical response, and mechanical strength. Compared to frozen water, unfrozen water exhibits higher polarity and conductivity, and its distribution determines the continuity of electrical conduction pathways in soil, serving as a primary factor controlling resistivity variations [12,13]. Nevertheless, due to the combined influences of temperature, initial water content, and pore structure, the quantitative relationship between unfrozen water content and resistivity is complex and remains unresolved [14,15]. The interference mechanisms affecting geophysical monitoring results are not yet clearly elucidated, thus hindering the widespread application of resistivity methods in frozen soil environments [16,17,18,19].
In contrast, traditional research on frozen soils has predominantly focused on the thermophysical processes and mechanical characteristics of frozen soils, emphasizing issues such as thermal equilibrium below the freezing point and stress redistribution. Investigations into the spatial distribution of frozen soils have frequently relied on integrated geophysical methods and comparative analyses of the resolution and sensitivity of different techniques [20,21]. For instance, Léger et al. (2017) [22] employed ground-penetrating radar (GPR) and electrical resistivity tomography (ERT) in the vicinity of Barrow, Minnesota, USA, to determine the thickness of the active layer, snow depth, and frozen soil features in support of parameterizing soil freeze–thaw dynamic models. Their study demonstrated that the combination of these methods significantly improved the accuracy in detecting the heterogeneity of frozen soils. Similarly, Krzeminska et al. (2022) [23] combined frequency domain reflectometry (FDR) and ERT to conduct point-scale field measurements of soil water content and temperature associated with freeze–thaw and snowmelt infiltration. They concluded that, in addition to meteorological conditions and land management practices, freeze–thaw cycles also contribute substantially to soil erosion processes. Tomaskovicová and Ingeman-Nielsen (2024) [24] monitored seasonal variations in ground resistivity, unfrozen water content, and ground temperature at a high-latitude site in western Greenland, and quantified the relationship between clayey soil resistivity and unfrozen water content. Gu et al. (2024) [25] applied ERT to examine moisture migration in ground improved with geosynthetic-encased stone columns (GESCs) subjected to freeze–thaw cycles, revealing that moisture tended to migrate upward and outward from the reinforcement zone during freezing, and inward during thawing. Teng et al. (2025) [26] investigated the formation and frost heave behavior of frozen soils under liquid-nitrogen-induced rapid freezing, incorporating nondestructive monitoring techniques such as ERT to analyze the coupled thermo-hydro-mechanical processes, with results indicating discontinuous frost heave displacements. Ge et al. (2025) [27] employed an integrated geophysical approach combining GPR, ERT, ambient noise seismic interferometry (ANSI), and UAV-based infrared thermography to assess frozen soil conditions in the Tuotuo River Basin on the Qinghai–Tibet Plateau, providing a comparative evaluation of each method’s strengths and limitations. Despite these advancements, existing studies remain limited in their investigation of the evolution of soil electrical properties under low-temperature conditions, particularly the dominant role of unfrozen water content in governing electrical resistivity. Moreover, prior work has often considered the influence of soil moisture on electrical conductivity in isolation, whereas in natural high-altitude frozen ground environments, significant coupling exists among key parameters such as initial water content, dry density, and temperature. This lack of systematic analysis on the combined effects of these three factors on soil resistivity hampers the development of reliable quantitative inversion models for ERT surveys under complex field conditions [28,29,30].
To address these challenges, this study targets typical clayey sand from the Qinghai–Tibet Plateau, integrating laboratory freeze–thaw experiments with long-term field resistivity imaging observations. It explores the coupled control mechanisms of initial volumetric water content, dry density, and temperature on soil resistivity under low-temperature conditions. The freezing and thawing points of soil samples with varying initial volumetric water contents were determined, and the functional relationship between unfrozen water content and resistivity was quantified. Furthermore, high-density resistivity forward modeling was conducted to optimize deployment schemes for plateau surveys. Based on these efforts, field ERT tests were implemented to assess the spatiotemporal evolution of frozen soils on the Qinghai–Tibet Plateau.

2. Materials and Methods

2.1. Study Area Overview

The study area is located in the southern part of Qinghai Province, China, in the northwest of Guoluo Tibetan Autonomous Prefecture (Figure 1). It is situated on a high plateau region with an elevation mostly ranging between 4500 and 5000 m. The terrain is relatively flat, characterized primarily by river–lake basins. The stratigraphic thickness varies significantly across different regions. From top to bottom, the stratigraphic consists of sandy loam (thickness 2.0~10.0 m), clayey sand (thickness 4.0~8.0 m), fine sand (thickness 2.0~15.0 m), and an underlying bedrock layer (not penetrated). Among these, the clayey sand layer represents the primary seasonally frozen soil layer, while the fine sand layer corresponds to the perennially frozen soil. The frozen soil layers act as an aquifuge, maintaining the moisture stability of the overlying soil layers.

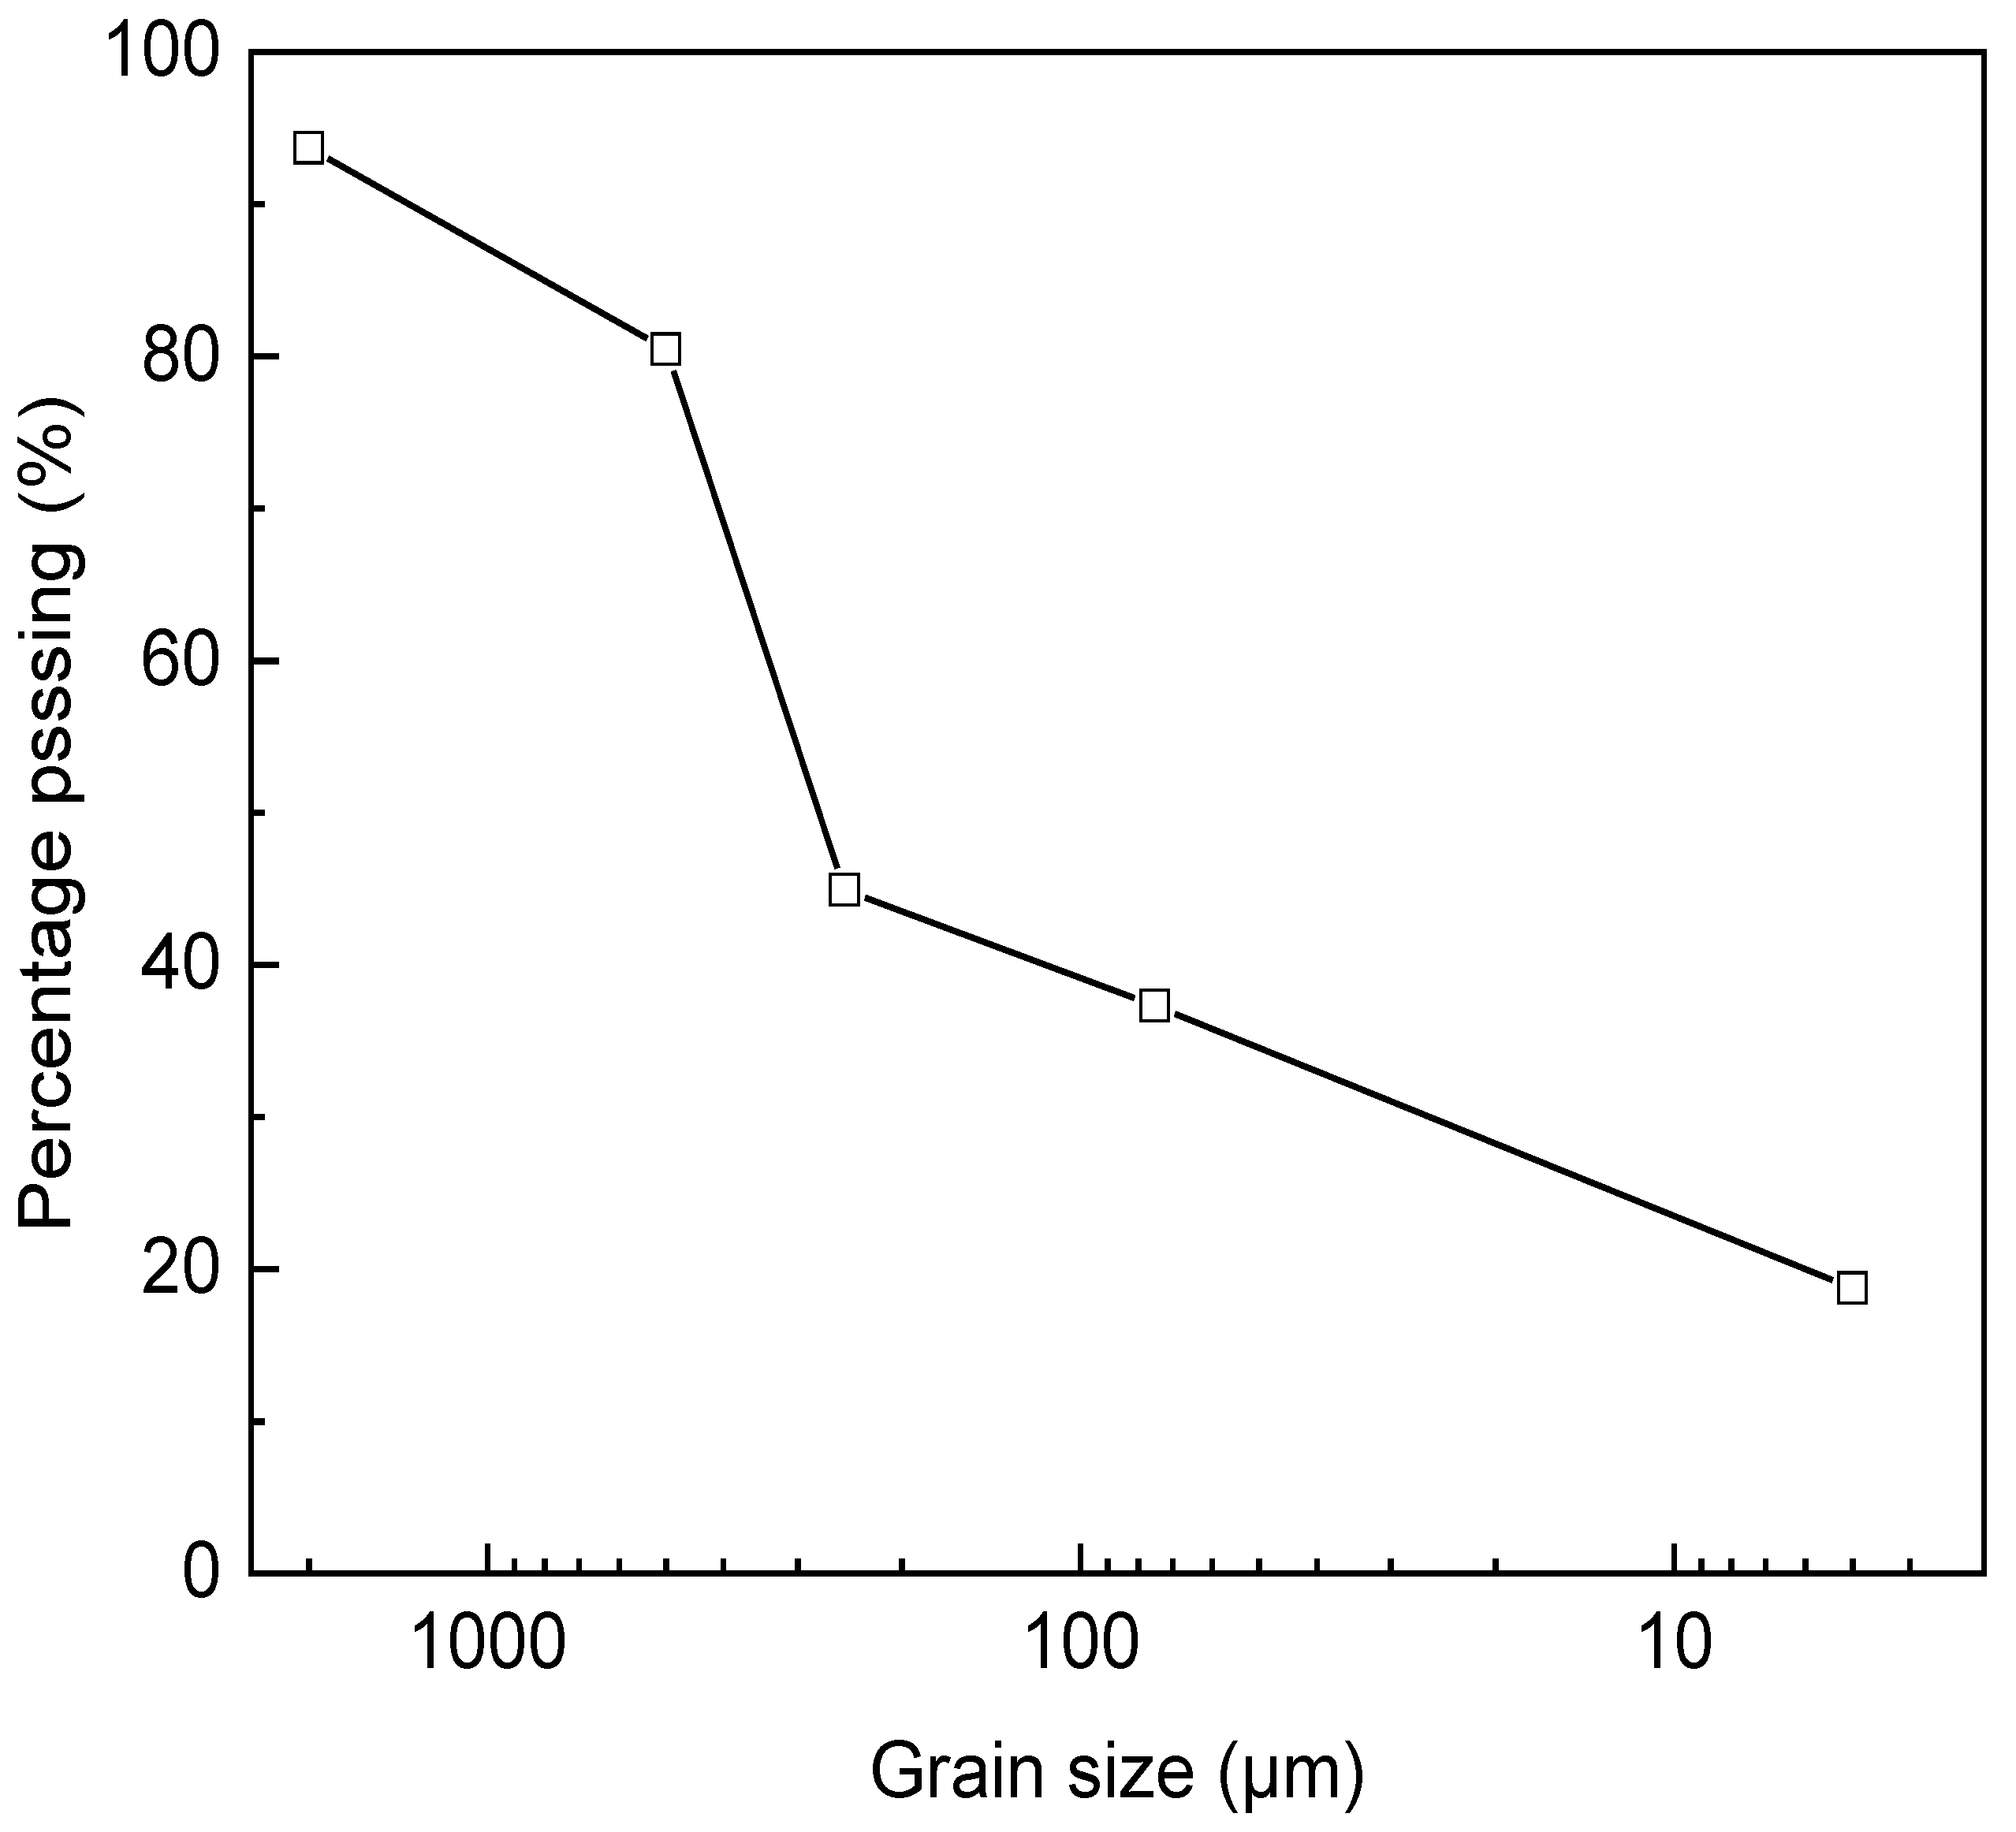
2.2. Preparation of Clayey Sand Samples

The test soil used in the experiments was collected from the above-mentioned study area. The samples were air-dried naturally, impurities were removed, and then the samples were ground and sieved through a 2 mm sieve for later use. X-ray Fluorescence Spectrometer (XRF) analysis indicates that the main chemical components of the test soil are SiO2 (71.05%), Al2O3 (16.13%), Fe2O3 (8.02%), K2O (1.23%), TiO2 (1.47%), and SO3 (1.04%). According to the Standard for Soil Test Methods (GB/T 50123-2019) [31], the fundamental physicochemical properties of the test soil were measured using devices such as a combined liquid–plastic limit apparatus and a pycnometer. The results are summarized in Table 1, and the particle size distribution curve is shown in Figure 2. According to this standard, the test soil is defined as clayey sand with a fine particle content (d ≤ 0.075 mm) between 15% and 50%, and with silt accounting for no more than 50% of the fine fraction. The target volumetric water content for sample preparation was set at 18.5% (natural volumetric water content). Distilled water was used to humidify the soil samples, which were then sealed in plastic wrap and rested for 24 h to equilibrate moisture. Subsequently, cylindrical specimens with a diameter of 50 mm and height of 100 mm were prepared by a layered compaction method, with dry densities of 1.45 g/cm3, 1.55 g/cm3, 1.65 g/cm3, and 1.75 g/cm3, all at 18.5% volumetric water content. After compaction, the cylindrical samples were fixed in saturation devices. Different initial volumetric water contents were achieved by spraying distilled water or air-drying the samples as required.

2.3. Test Equipment and Methods

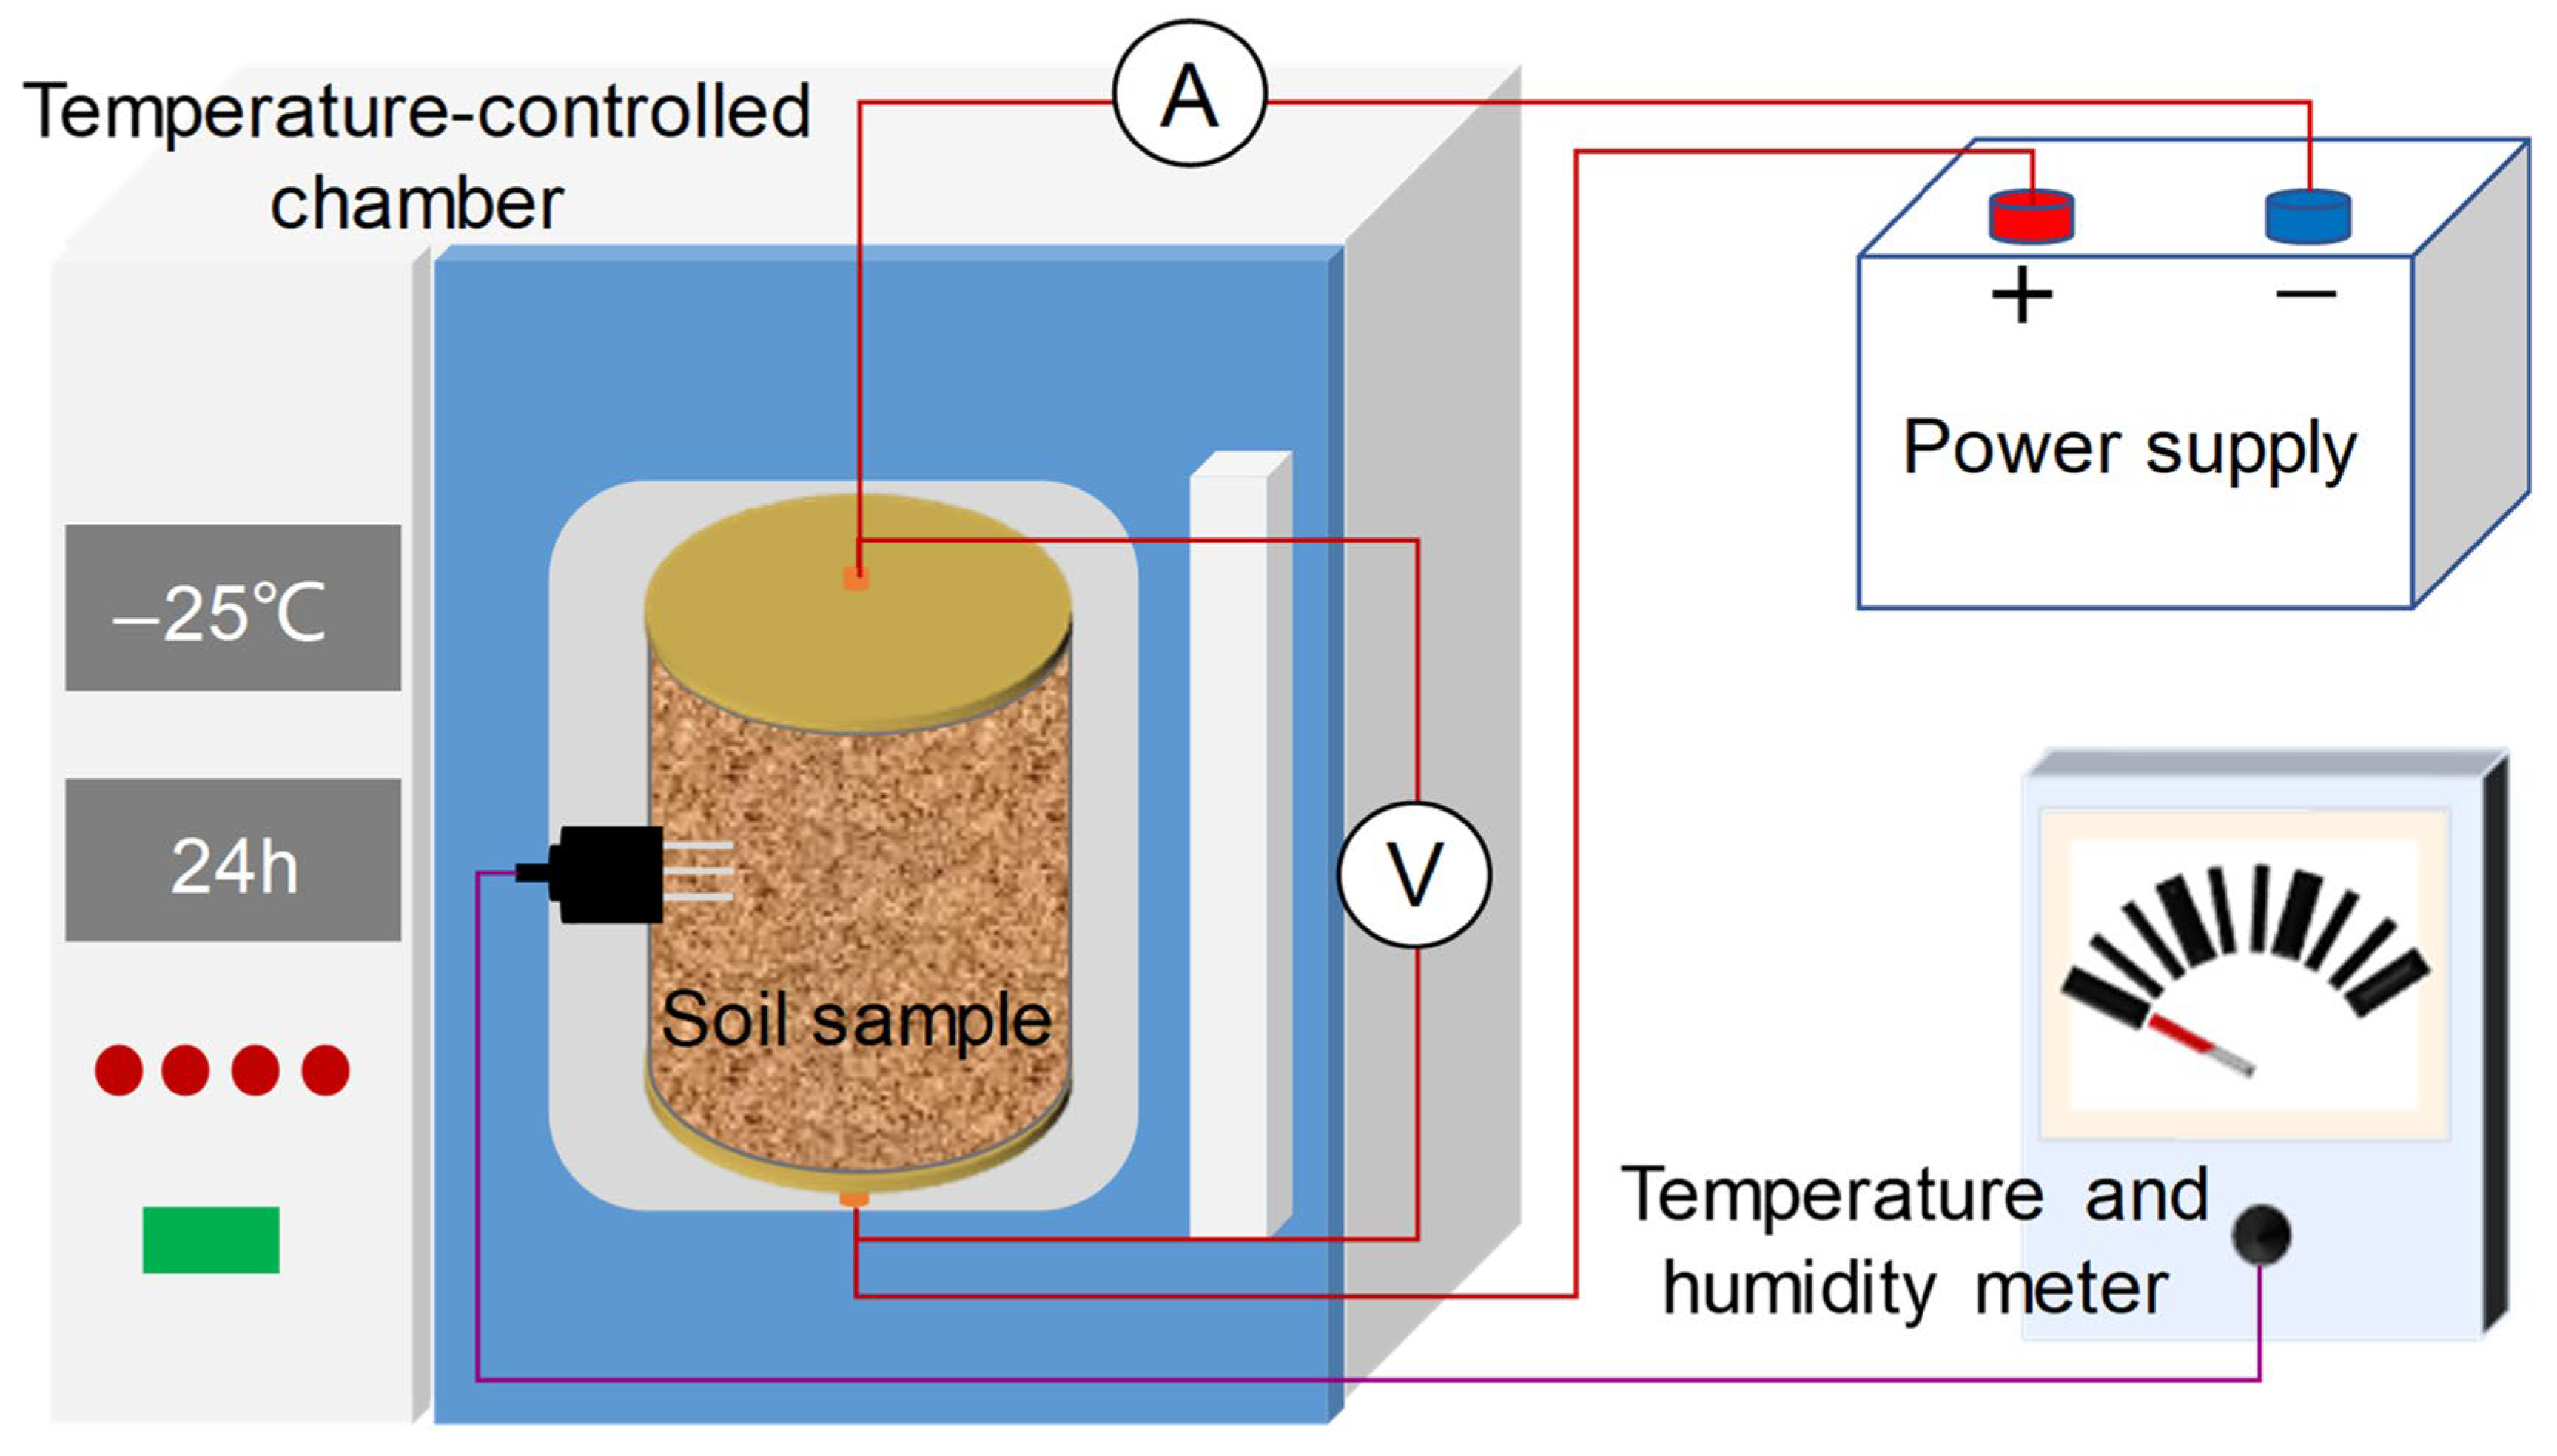
2.3.1. Freezing–Thawing Test Apparatus and Procedure

The custom-developed freezing–thawing test apparatus is illustrated in Figure 3. The system mainly consists of a DC power supply (12 V), a temperature control chamber (ranging from −50 to 150 °C), a voltmeter, an ammeter, and temperature–humidity sensors. During the test, the prepared cylindrical soil specimen with a known initial volumetric water content is placed inside the specimen chamber of the temperature control box. A temperature–humidity sensor is then inserted at the center of the soil column. To avoid damaging the soil specimen, three small-diameter holes, each slightly smaller than the sensor probe diameter, are pre-drilled on the soil sample to facilitate sensor insertion. The temperature during the freeze–thaw cycle experiment ranged from −28 °C to 22 °C. Throughout the experiment, temperature increments and decrements were set at 2 °C, with a constant temperature maintained for 1 h at each step. The total duration to complete one freezing or thawing test was 26 h.
Copper electrode plates were connected to both ends of the soil specimen, which were then linked to the voltmeter and the positive and negative terminals of the power supply, respectively. To prevent moisture evaporation during the test, the cylindrical soil sample was tightly wrapped with plastic wrap. The soil resistivity (ρ) during the freezing–thawing process was calculated using Equation (1) [32,33]. Variations in the content of unfrozen water and temperature in the soil sample were recorded via the temperature–humidity sensor at 30 s intervals.
ρ = π U D 2 4 I L
where ρ is the resistivity (Ω·m), U is the voltage across the soil specimen (V), I is the current passing through the specimen (A), and L is the length of the soil specimen (m).

2.3.2. ERT Tests Apparatus and Procedure

The two-dimensional forward modeling for the high-density resistivity method was performed using Res2DMOD (3.03.06) software, which is specialized for 2D DC resistivity forward modeling. In this study, the 2D finite difference method was applied for forward analysis [34]. Based on geological data from the study area, a simplified 2D electrical model was designed as shown in Figure 4. Detailed model parameters are listed in Table 2. Four electrode array configurations were used for the forward simulations: the Wenner α, Wenner β, Wenner γ, and Schlumberger arrays. Each configuration employed 73 electrodes with an electrode spacing of 1.5 m. After removing outliers from the simulated forward data, resistivity inversion was conducted using Res2DINV (3.57) software. The root mean square error (RMSE) was used as the inversion quality metric. To obtain an optimal resistivity model, a total of seven iterations were performed on all simulated datasets [35].
To investigate the distribution and evolution characteristics of seasonally frozen soil in the study area, the field ERT survey was conducted using the EDJD-3 resistivity measurement system, manufactured by Chongqing Dingfeng Geological Exploration Instrument Co., Ltd. (Chongqing city, China). During the test, two parallel survey lines (A–A′ and B–B′) with a spacing of 10 m were arranged in the study area. Considering the environmental characteristics of the study region, the Wenner four-electrode array was employed, with an electrode sequence of A, B, M, N and an electrode spacing of 5 m. The resistivity was calculated according to Equation (2):
ρ s = K · Δ U I
where ρₛ is the apparent resistivity, K is a geometric factor related to the electrode configuration of the high-density method, ΔU is the potential difference, and I is the current.

3. Results and Discussion

3.1. Freezing Characteristics of Clayey Sand

The freeze–thaw curves of clayey sand with different initial volumetric water contents are shown in Figure 5. It can be seen that the freezing and thawing curves of soil samples with varying initial volumetric water contents exhibit similar trends throughout the test, characterized by gentle slopes at both ends and a steep curve in the middle. According to the trends of the freeze–thaw curves, the freeze–thaw process of clayey sand is divided into three main stages. The freezing process is divided into the rapid heat release stage, rapid freezing stage, and stable freezing stage; the thawing process corresponds to the rapid heat absorption stage, rapid thawing stage, and stable thawing stage [36,37].
During freezing, the free water in the soil sample first rapidly releases latent heat, causing the temperature to drop and gradually enter the rapid heat release stage. In this stage, free water begins to freeze slowly, and the curve shows a gentle decline. As freezing progresses and the temperature falls below 0 °C, free water quickly transforms into ice, entering the rapid freezing stage. At this point, free water content decreases sharply, accelerating the freezing process, which is reflected by a steep downward curve [38]. Once most free water has transformed into ice, the soil enters the stable freezing stage, where the temperature gradually decreases, bound water freezes slowly, and the freezing process approaches completion, causing the curve to flatten. During thawing, as the temperature rises, ice in the clayey sand absorbs heat and transitions into liquid water. In the rapid heat absorption stage, ice gradually melts and absorbs heat, causing a slow upward trend in the curve. As the temperature further increases, the thawing process accelerates, entering the rapid thawing stage. At this point, a large amount of ice converts to water, free water content rapidly increases, and the curve rises sharply [39]. Finally, as thawing nears completion, the sample enters the stable thawing stage, where thawing stabilizes, the temperature continues to rise, the curve flattens, and free water content approaches equilibrium [40,41].
Furthermore, a comparison of Figure 5a–c reveals that freeze–thaw cycles of clayey sand with different initial volumetric water contents all exhibit hysteresis loops. With decreasing initial volumetric water content, the difference between freezing and thawing curves increases, i.e., the hysteresis loop enlarges. This enlargement is mainly caused by changes in the freezing curve, while the thawing curve varies less. This indicates that as soil saturation decreases and the internal liquid water gradually deviates from free water status, the soil matrix effects become more pronounced. Moreover, changing the water state inside the soil requires the input of more energy to alter the system’s state [42,43].
Different initial volumetric water content freezing curves of clayey sand are shown in Figure 6a. From Figure 6a, it can be observed that the freezing temperatures of clayey sand with initial volumetric water contents of 30%, 18.5%, and 10% are −2.34 °C, −4.69 °C, and −6.48 °C, respectively. This indicates that the higher the initial volumetric water content, the higher the freezing temperature of the clayey sand. This is because, with higher soil saturation, the content of free water within the liquid phase increases, and the influence of the soil surface and pore structure on free water decreases, making the soil sample easier to freeze, i.e., exhibiting a higher freezing temperature [44]. As the initial volumetric water content decreases, the amount of free water correspondingly reduces, and the effects of mineral surface interactions and pore size increase, thus making liquid water more difficult to freeze, resulting in a lower freezing temperature. Additionally, it can be observed that as the initial volumetric water content increases, the slope of the freezing segment of the curve becomes steeper, indicating that the freezing rate increases with higher initial volumetric water content. This is related to the increase in free water content accompanying higher initial volumetric water content, as free water freezes faster under decreasing temperatures via phase change compared to adsorbed water; thus, the freezing segment curve becomes steeper with increasing initial volumetric water content [45,46].
Furthermore, Figure 6b shows that the thawing process is relatively stable. The clayey sand with different initial volumetric water contents generally thaws near −4 °C, with no significant differences and good consistency, indicating that changes in initial saturation only affect the freezing process. This is because the clayey sand has a relatively small specific surface area, large internal pores, and good connectivity, so the pore water after freezing forms a relatively coherent body similar to a single ice block. Partial pre-melting occurs only at the soil interface, while the remaining ice behaves like a solid phase, melting only when the melting point temperature is reached, resulting in little change in the thawing process with varying initial volumetric water content [47].

3.2. Resistivity Variation Characteristics of Frozen Clayey Sand

3.2.1. Influence of Unfrozen Water Content on the Resistivity of Clayey Sand

The variations in electrical resistivity and unfrozen water content with soil temperature during the freezing process are shown in Figure 7. As depicted in Figure 6, with the decrease in soil temperature, water within the soil gradually freezes, the unfrozen water content decreases, and the electrical resistivity increases accordingly. There exists a strong negative correlation between soil resistivity and unfrozen water content. Previous studies have confirmed an inverse relationship between the two. The results of this study yield a fitted equation of y = 8833.14x−1.58 (R2 = 0.98), where x represents the unfrozen water content and y denotes the resistivity, which aligns with prior findings, thereby verifying the accuracy of the experimental data [48,49].
In addition, by analyzing the curves of temperature, unfrozen water content, and resistivity, collectively, it can be observed that near the freezing point, the proportion of unfrozen water in the soil is relatively high and the resistivity is low. As the temperature continues to drop, unfrozen water gradually freezes, and the resistivity increases significantly. From Figure 7, it is evident that when the resistivity ranges from 105.14 Ω·m to 914.26 Ω·m, the soil is in the progressive freezing stage; when the resistivity exceeds 914.26 Ω·m, it can be considered that the soil is completely frozen. This phenomenon can be used to monitor and assess water distribution during the freezing process and has significant practical value in the identification and distribution analysis of frozen soils [50].

3.2.2. Influence of Initial Volumetric Water Content on the Resistivity of Frozen Clayey Sand

The variation curves of electrical resistivity with initial volumetric water content under different temperatures are shown in Figure 8. Overall, the electrical resistivity decreases first and then slightly increases with the increase in initial volumetric water content, exhibiting a typical “U”-shaped trend, indicating that initial water content plays a significant role in regulating the electrical conductivity of frozen soil. In the low initial water content range (3~6%), the ice content after freezing is limited, resulting in restricted conductive paths and insufficient contact among soil particles, leading to lower overall conductivity and higher resistivity. As the initial volumetric water content increases (6~9%), the ice crystals formed by frozen water partially fill the pores, enhancing the compactness of the ice–soil interface and improving the continuity of conductive paths, thus significantly reducing resistivity [51]. However, when the initial water content further increases (>9%), the dominant presence of ice crystals may lead to the isolation of soil particles, disrupting the original conductive network. Moreover, the poor conductivity of ice at low temperatures leads to a rebound in resistivity. Therefore, for each given dry density, there exists a specific initial water content at which the frozen soil exhibits the lowest resistivity, referred to as the “optimum volumetric water content” [52].
Further examination of the curves under different dry densities shows that overall resistivity decreases with increasing dry density, especially in the mid-to-low water content range (6~10%). Soils with higher dry density have a denser skeleton structure and closer particle contacts, allowing ice to bond more effectively with soil particles during freezing. This facilitates the formation of a more stable composite conductive network, thereby significantly reducing resistivity [53,54]. Additionally, a comparison between Figure 8a (−15 °C) and Figure 8b (−5 °C) reveals that under identical initial water content and dry density conditions, resistivity is generally higher at lower temperatures. This is attributed to the reduced conductivity of ice at lower temperatures and enhanced freezing intensity, which hinders charge migration and increases the insulating nature of the medium [55].
In summary, the electrical resistivity of frozen clayey sand is jointly influenced by initial volumetric water content, dry density, and freezing temperature. The lowest resistivity point corresponding to the optimum initial volumetric water content reflects the most continuous conductive channels and the best ice–soil interfacial bonding. Identifying this optimum point and understanding its underlying mechanisms are of great theoretical and practical significance for the accurate electrical testing of frozen soil, the identification of subsurface freezing characteristics, and the analysis of anomalous resistivity distribution zones.

3.3. Evolution of Frozen Soil Distribution in the Study Area

3.3.1. Forward Modeling

Forward modeling was conducted using four electrode configurations, with the resulting resistivity profiles presented in Figure 9. The profiles reveal that all configurations effectively delineate the resistivity transition zone between the surface thawed layer and the freezing transition layer, indicating that impedance contrasts due to ice–soil structural changes at this interface are readily identifiable. For the upper boundary between the freezing transition layer and the deeper permafrost layer, each profile exhibits high-resistivity anomalies closely matching the model-defined depths, demonstrating the forward-inversion process’s strong resolution capability for this interface. However, at the lower boundary of the permafrost layer, all configurations show a downward extension of low-resistivity zones slightly beyond the actual model boundaries. This deviation primarily results from the least-squares inversion process overfitting the shallow high-resistivity features, leading to a “stretching” effect in the deeper low-resistivity regions.
Comparative analysis of the anomaly responses from the four configurations indicates that the Wenner-α and Schlumberger arrays produce profiles with the most concentrated and continuous high-resistivity anomalies in the permafrost layer, with anomaly amplitudes closely aligning with theoretical model values. Notably, the Schlumberger array achieves the highest congruence between the resistivity gradient zones and the actual interface positions, with inversion bandwidth errors less than 5% relative to model thicknesses. In contrast, while the Wenner-β and Wenner-γ arrays can identify the primary interfaces, they exhibit slightly lower anomaly amplitudes and broader transition zones, suggesting comparatively reduced resolution for the permafrost layer [56]. Consequently, the Wenner-α array offers robust anti-interference and stability in field environments, whereas the Schlumberger array provides higher interface localization accuracy under similar conditions. Considering the challenging geological conditions of the study area, the Wenner-α array is recommended for field electrical resistivity surveys of frozen soil layers [57].

3.3.2. Field ERT Test Inversion

High-density resistivity inversion profiles for two survey lines across different months are illustrated in Figure 10. The profiles from July, September, and December display distinct vertical stratification. The first layer (0~10 m) is characterized by low resistivity (ρ < 100 Ω·m), corresponding to gravelly coarse sand and sandy gravel strata. The second layer (10~15 m) serves as a transitional zone with resistivity increasing from low to high (100~150 Ω·m), marking the boundary between seasonal and perennial permafrost. The third layer (below 15 m) exhibits high resistivity (ρ > 150 Ω·m), indicative of perennial permafrost.
Comparative analysis of the profiles reveals minimal changes between July and September, with consistent resistivity distributions and interface depths, suggesting stable thermal and moisture conditions from late summer to early autumn. By December, the second-layer transition zone notably thickens, and the resistivity gradient becomes broader and more gradual. Simultaneously, the high-resistivity interface of the third layer slightly ascends, reflecting the downward expansion of seasonal frost and increased resistivity at the upper boundary of the perennial permafrost due to declining ground temperatures in winter [58,59]. Further examination of the second-layer transition zone indicates significant horizontal extension in addition to vertical expansion. In July, this zone is primarily concentrated between 100 and 180 m along the profile; by September, it shows minor shifts but maintains its overall form; by December, it extends horizontally from 50 to 230 m.
Comparing Figure 10a,b, both survey lines exhibit consistent patterns, with the shallow low-resistivity areas diminishing as the seasons transition from summer to winter, indicating progressive freezing of the shallow seasonal permafrost. Additionally, both lines show that the deep high-resistivity regions do not exhibit gradual color variation indicating warming with seasonal changes. This phenomenon is attributed to the reduction in initial volumetric water content in the deep soil layers from summer to winter, leading to decreased resistivity upon freezing. This observation aligns with the latter part of the “U”-shaped curve in Figure 8, where frozen soil with a higher initial water content shows decreasing resistivity as the initial volumetric water content decreases [60,61].
In summary, high-density resistivity methods effectively capture the distribution and evolution of permafrost layers across the three surveyed months. The minimal differences between the July and September profiles suggest stable interfaces between seasonal and perennial permafrost during late summer to early autumn. The December profile’s significant thickening of the second-layer transition zone and the upward shift in the high-resistivity layer interface reflect deepening freezing processes in winter. The seasonal variability of the second-layer transition zone implies that its thickening and increased resistivity reduce the hydraulic conductivity of the soil, limiting the downward infiltration of moisture from the upper layers. This process provides a stable moisture environment for surface vegetation roots, particularly in December, where the thickened transition zone further impedes the infiltration of meltwater and shallow moisture into deeper layers, positively influencing surface water conservation and vegetation survival [62,63].

4. Conclusions

This study systematically investigated the freezing characteristics and geophysical properties of clayey sand from the Qinghai–Tibet Plateau through laboratory freeze–thaw tests, and conducted long-term field monitoring using the ERT test in a typical permafrost area to explore the evolution of frozen ground distribution. The main conclusions are as follows:
(1)
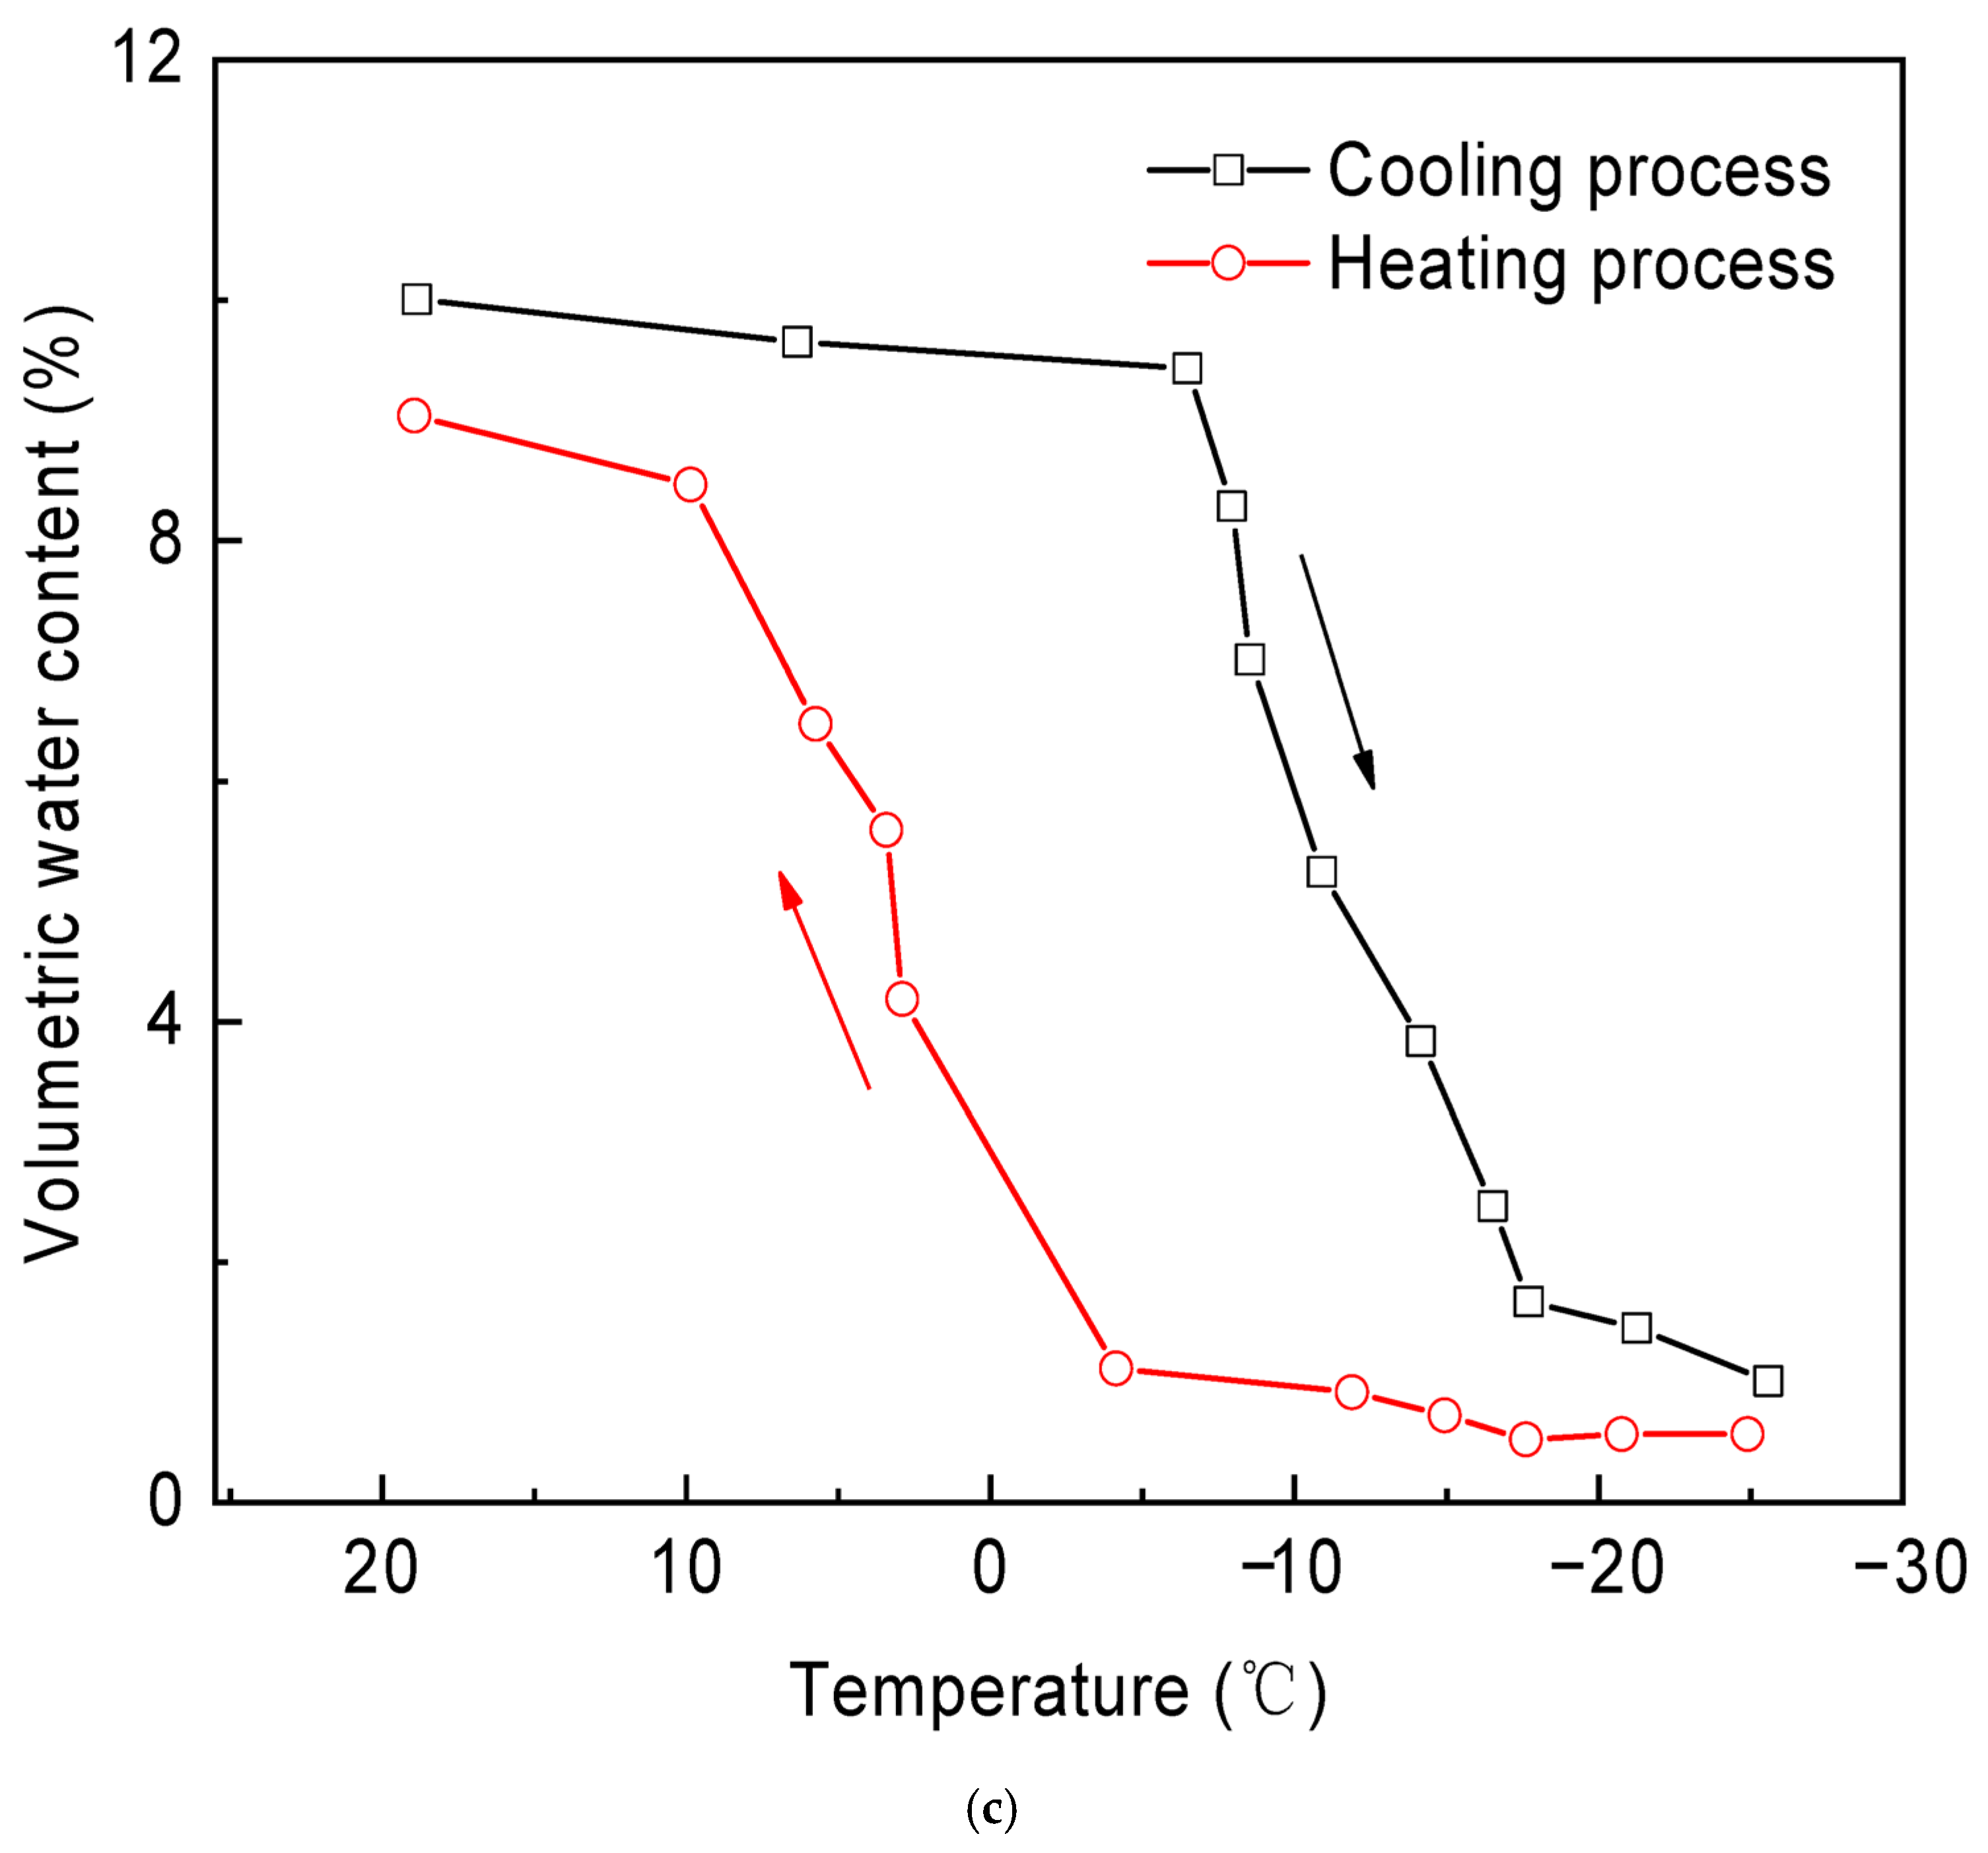
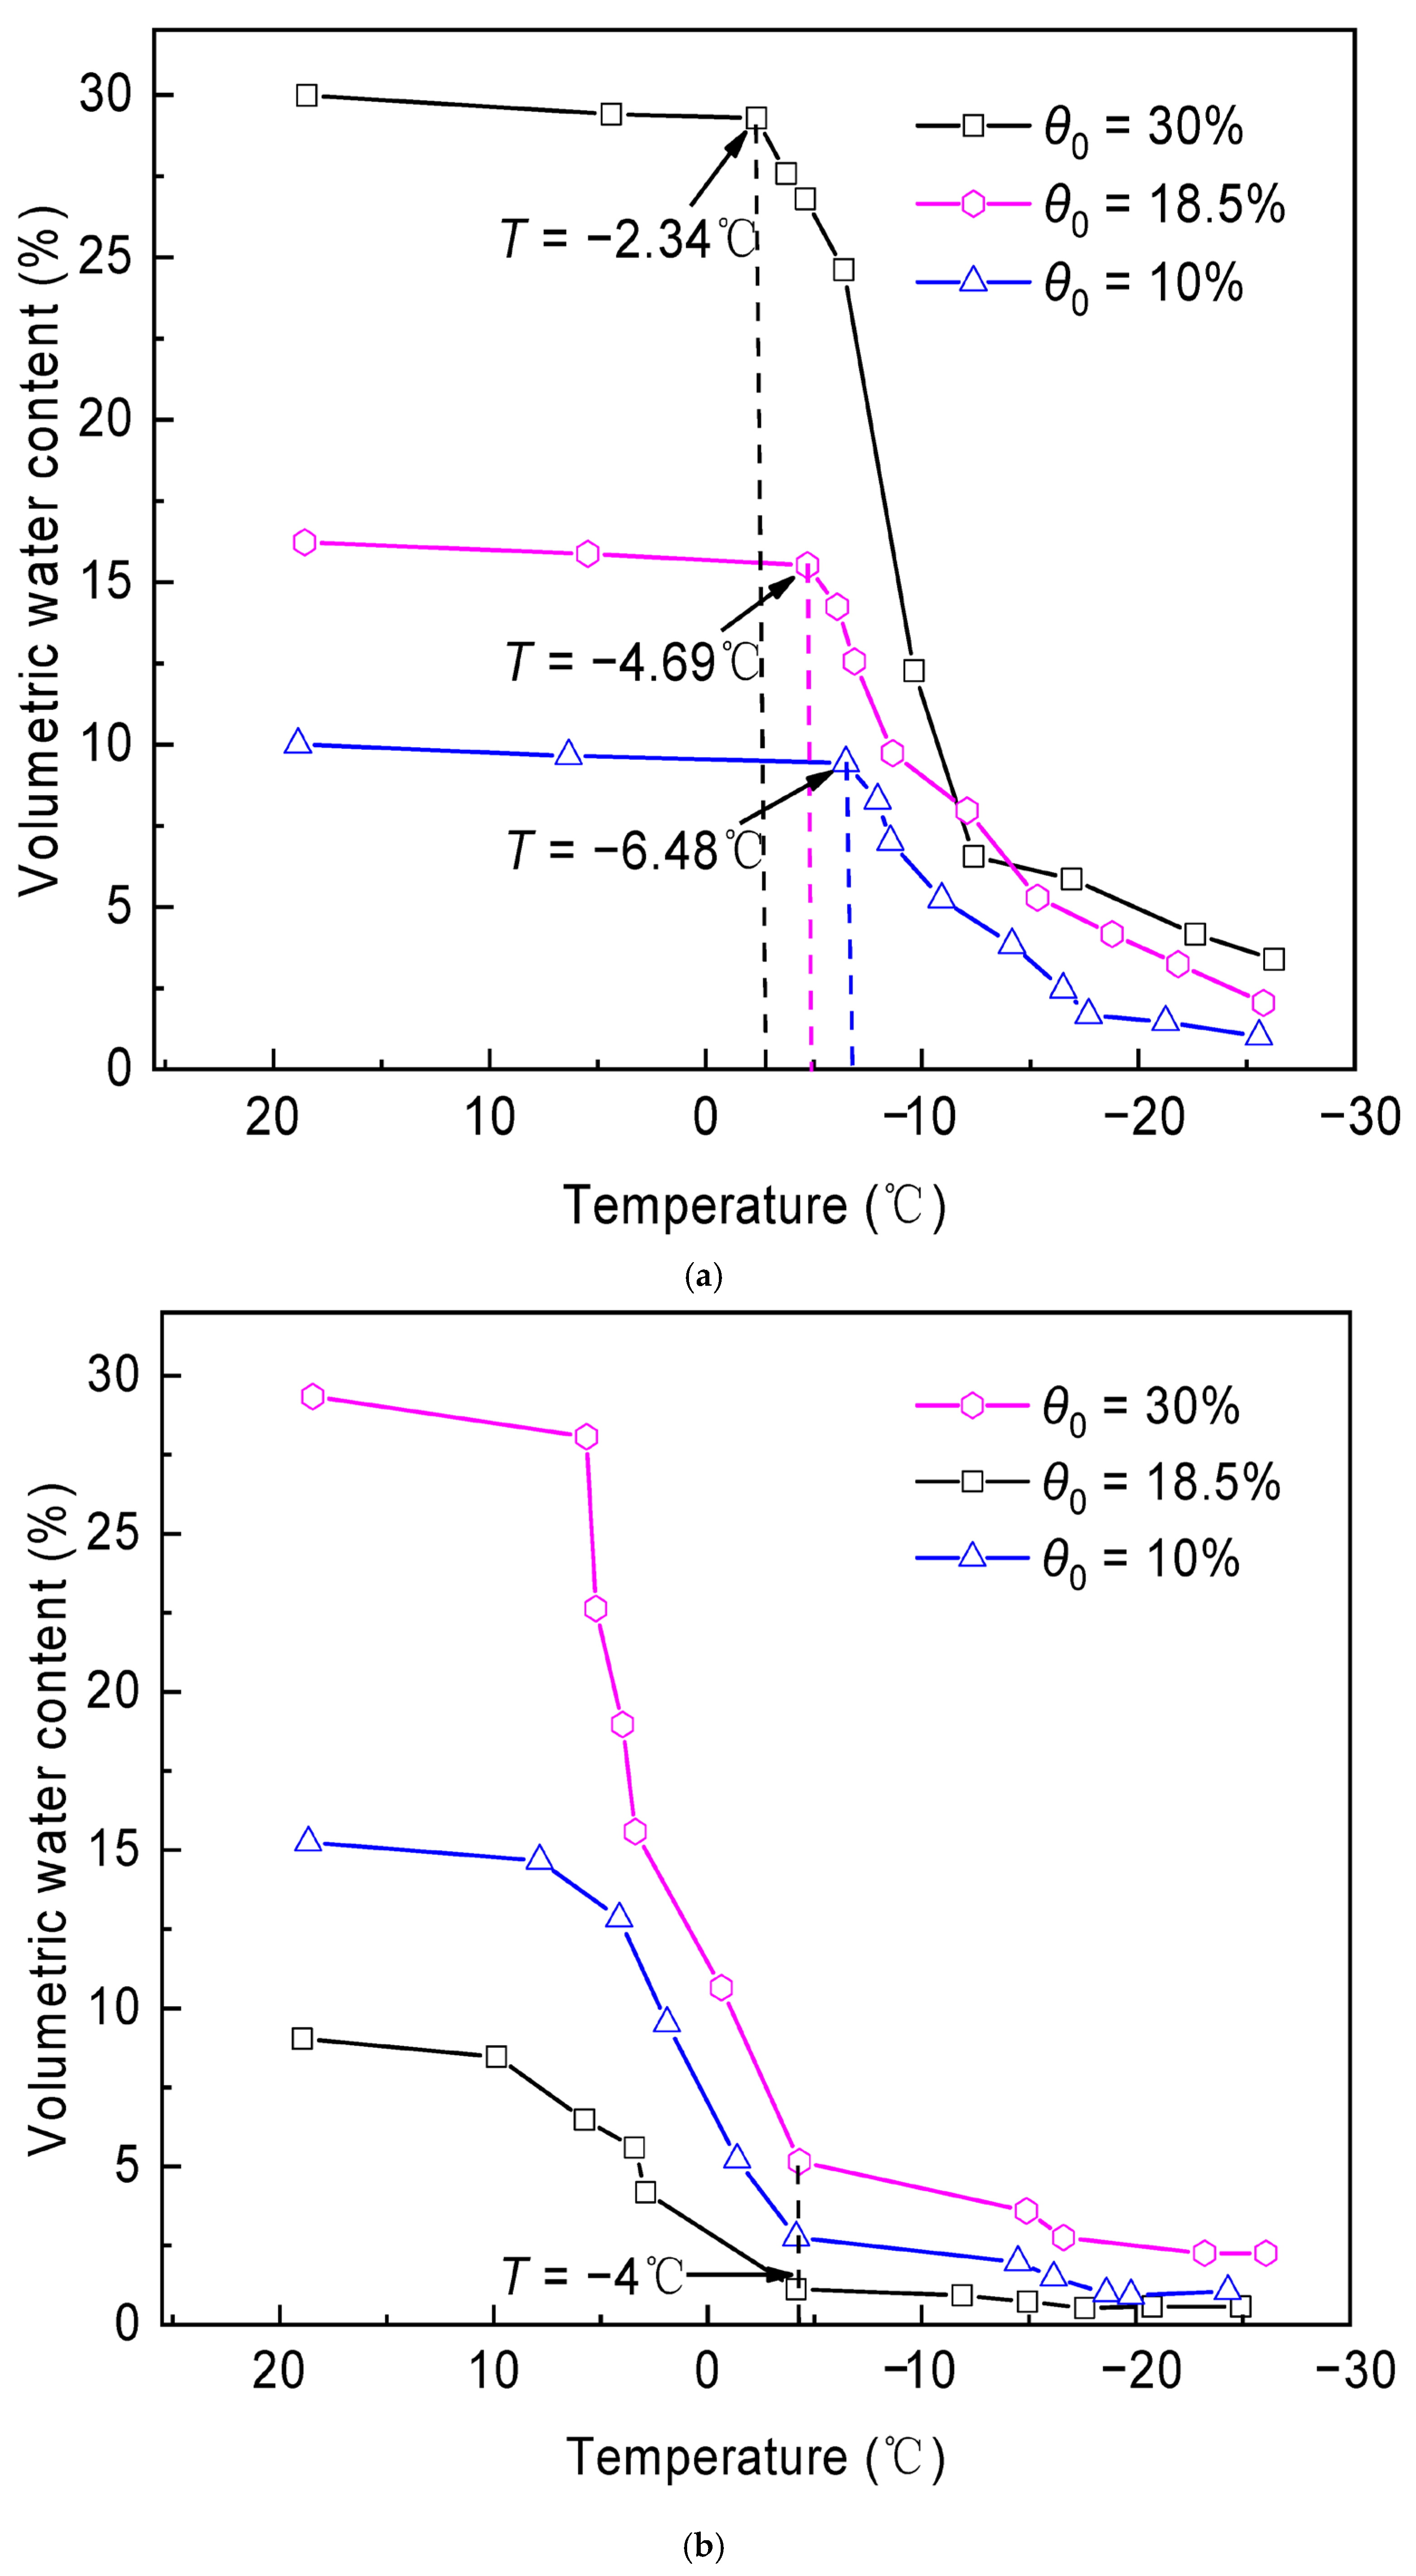
During the freezing process, clayey sand samples with different initial volumetric water contents exhibited S-shaped curves characterized by gentle slopes at both ends and a steep transition in the middle. This process can be divided into three stages: rapid heat release, rapid freezing, and stable freezing. A higher initial volumetric water content led to a higher freezing temperature and faster freezing rate, whereas the melting temperature remained consistent at approximately −4 °C.
(2)
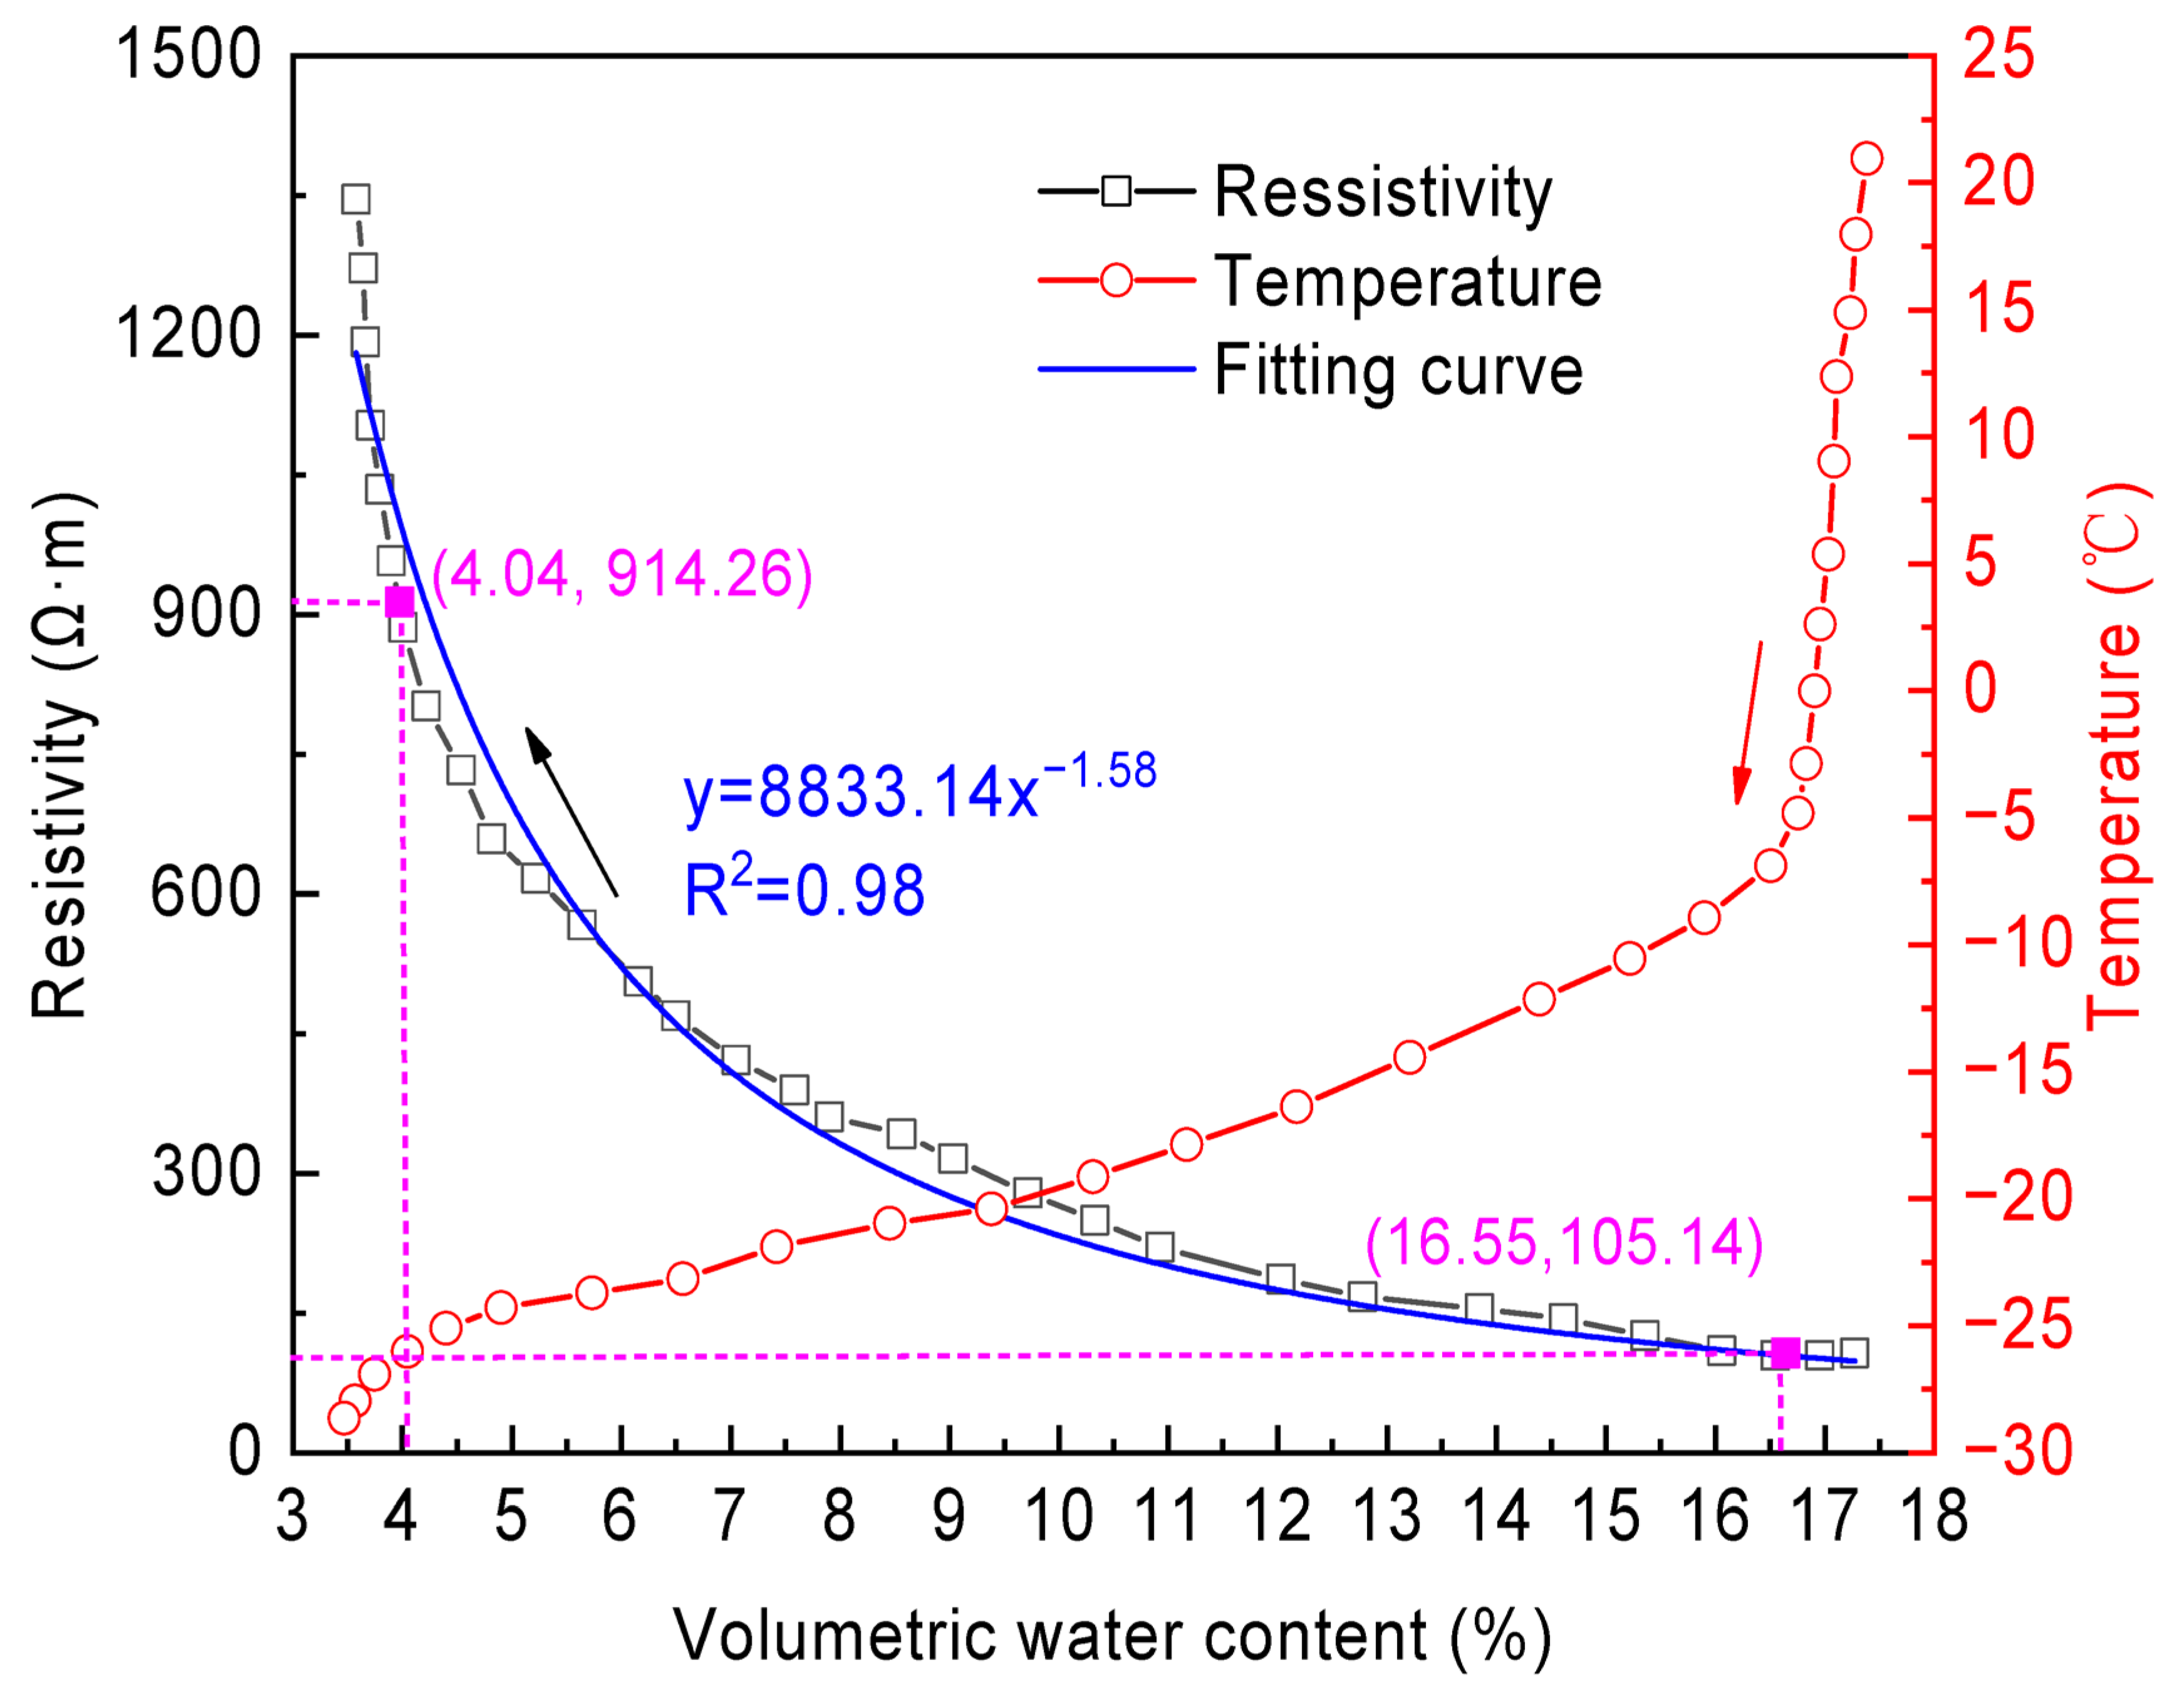
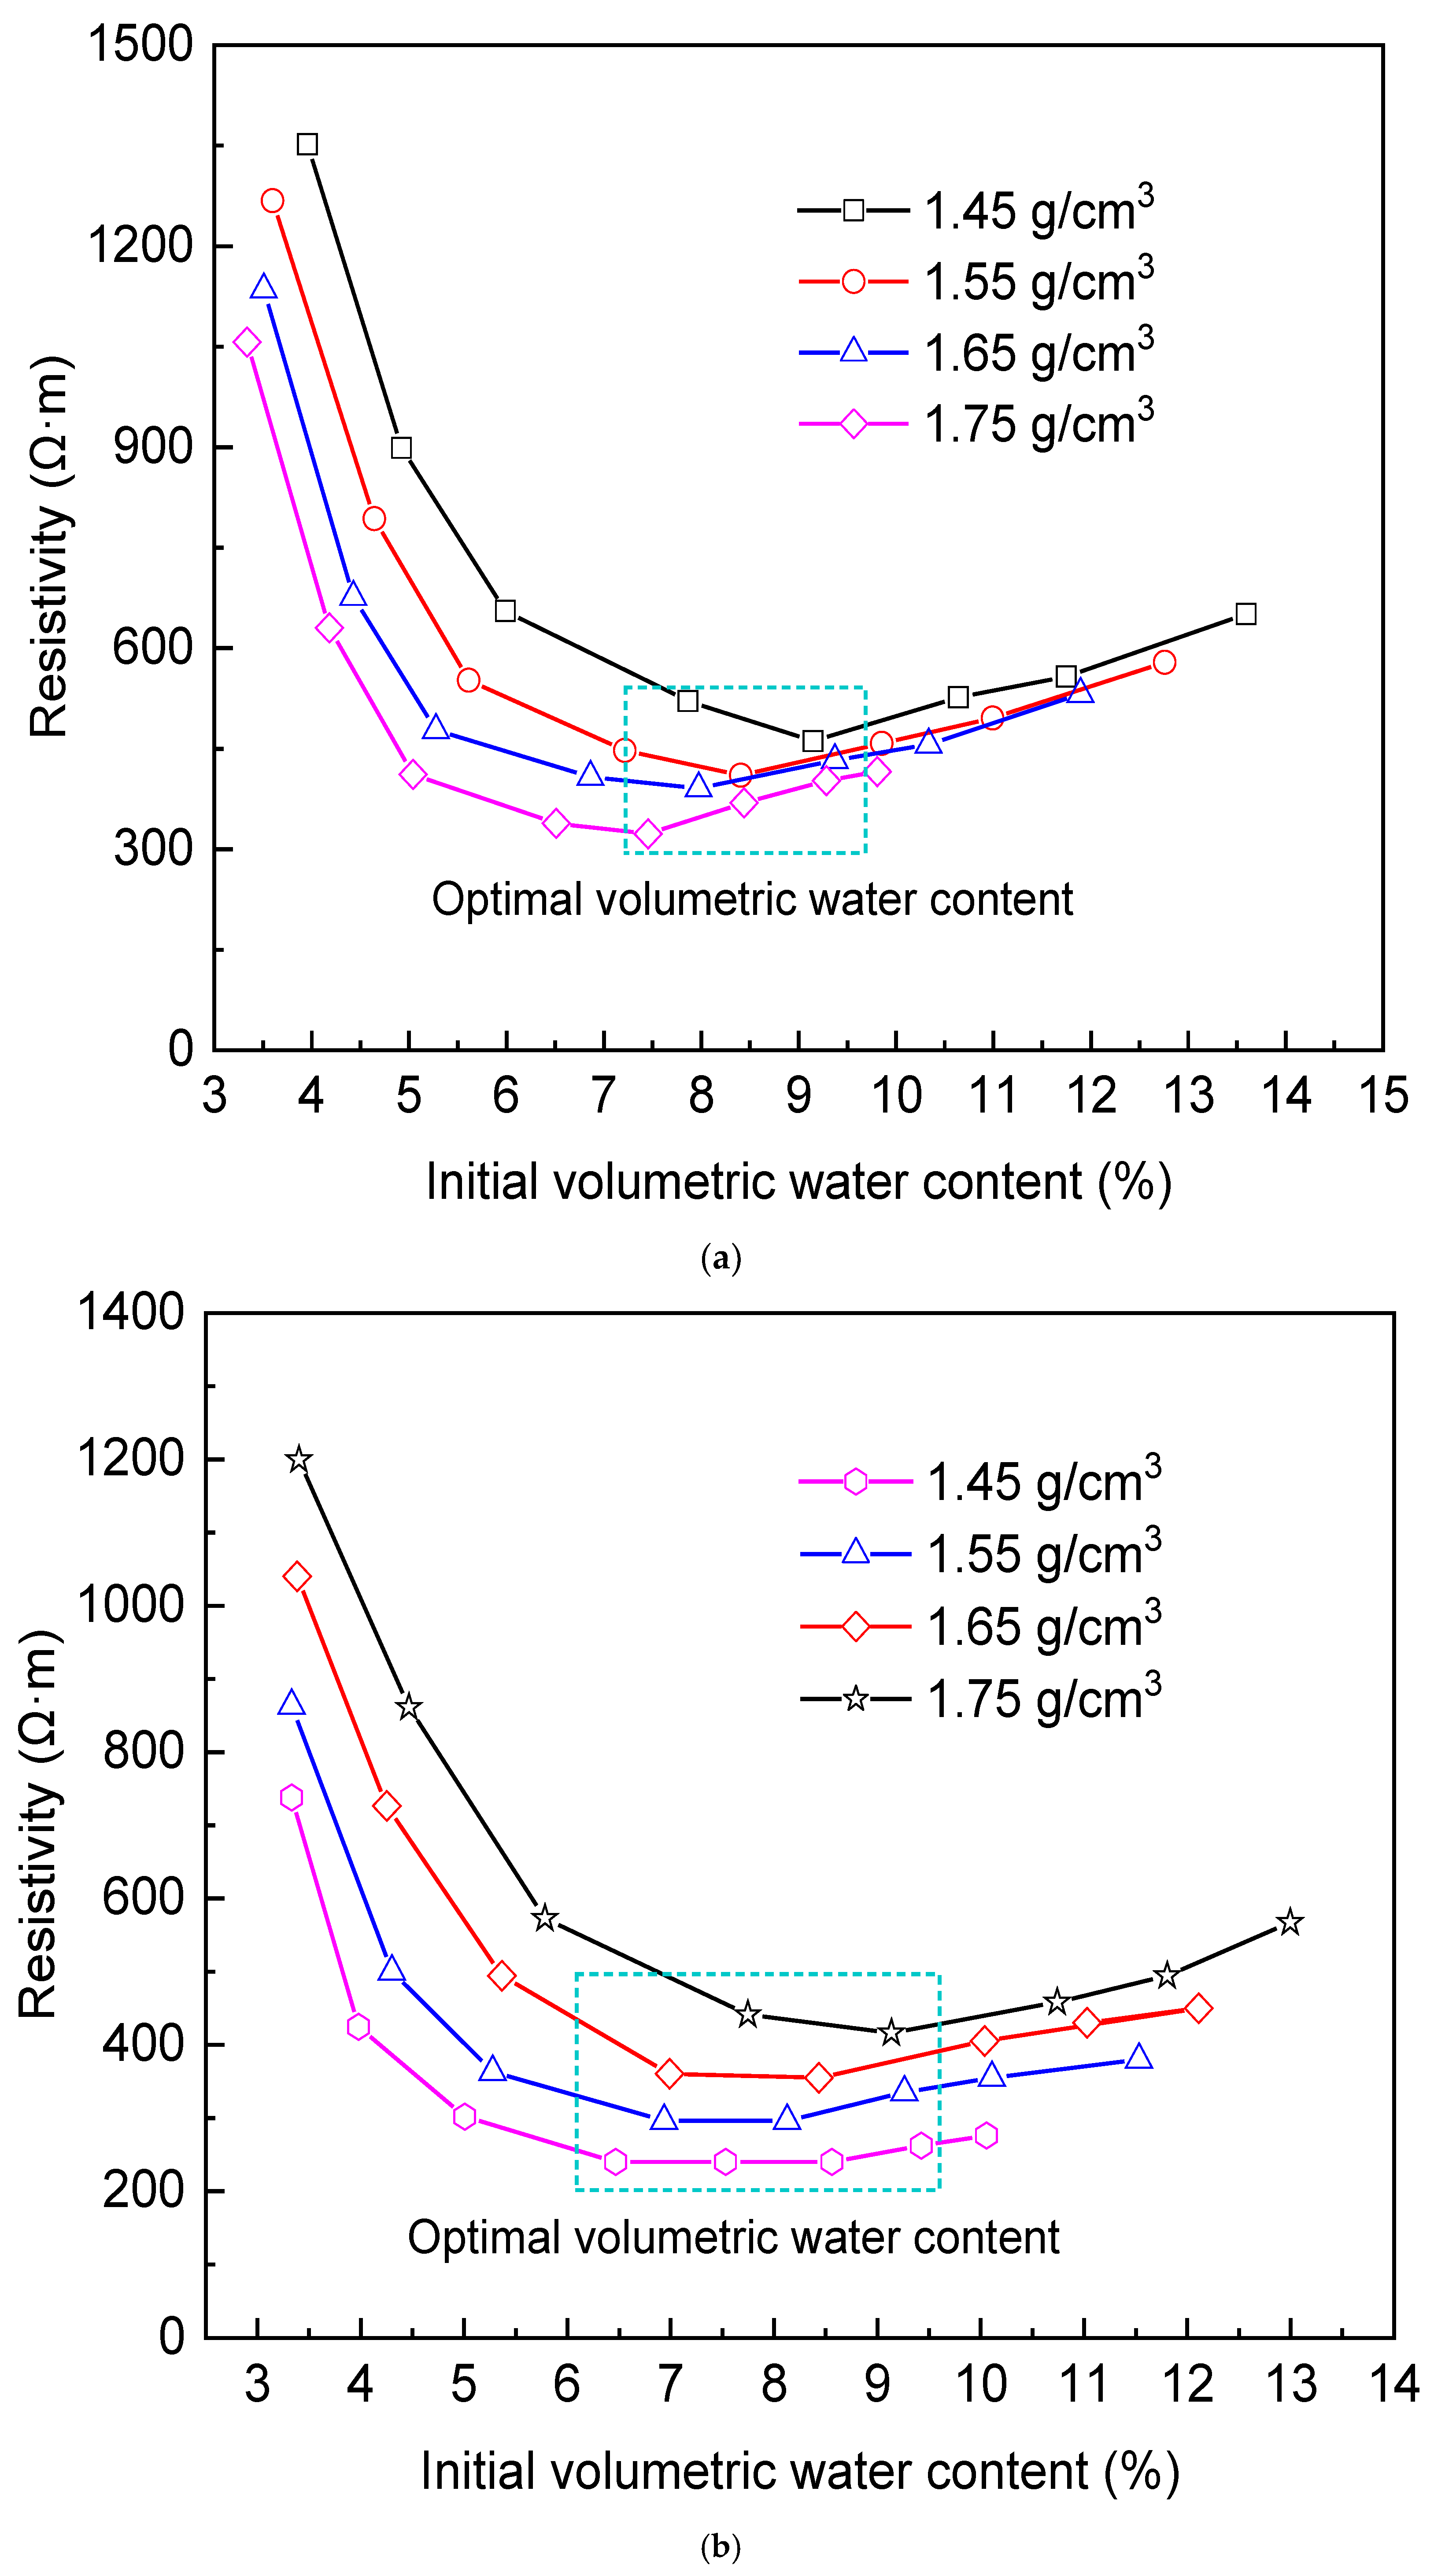
As soil temperature decreased, the unfrozen water content gradually declined, accompanied by a significant increase in resistivity. An inverse relationship between these two parameters was observed within the test range, confirming the dominant influence of unfrozen water content on the resistivity of frozen soil. This finding provides a basis for distinguishing seasonal and perennial frozen soils in the Qinghai–Tibet Plateau. For fully frozen soils, resistivity exhibited a U-shaped variation with respect to initial volumetric water content, reaching a minimum at an optimal initial volumetric water content. Additionally, the resistivity decreased with increasing dry density.
(3)
Forward modeling demonstrated that both Wenner-α and Schlumberger arrays exhibited good resolution for the upper and lower boundaries of frozen soil layers. However, the Wenner-α configuration showed stronger resistance to interference. Considering the harsh geological conditions in the study area, Wenner-α was selected as the primary electrode arrangement for field electrical surveys of frozen soils.
(4)
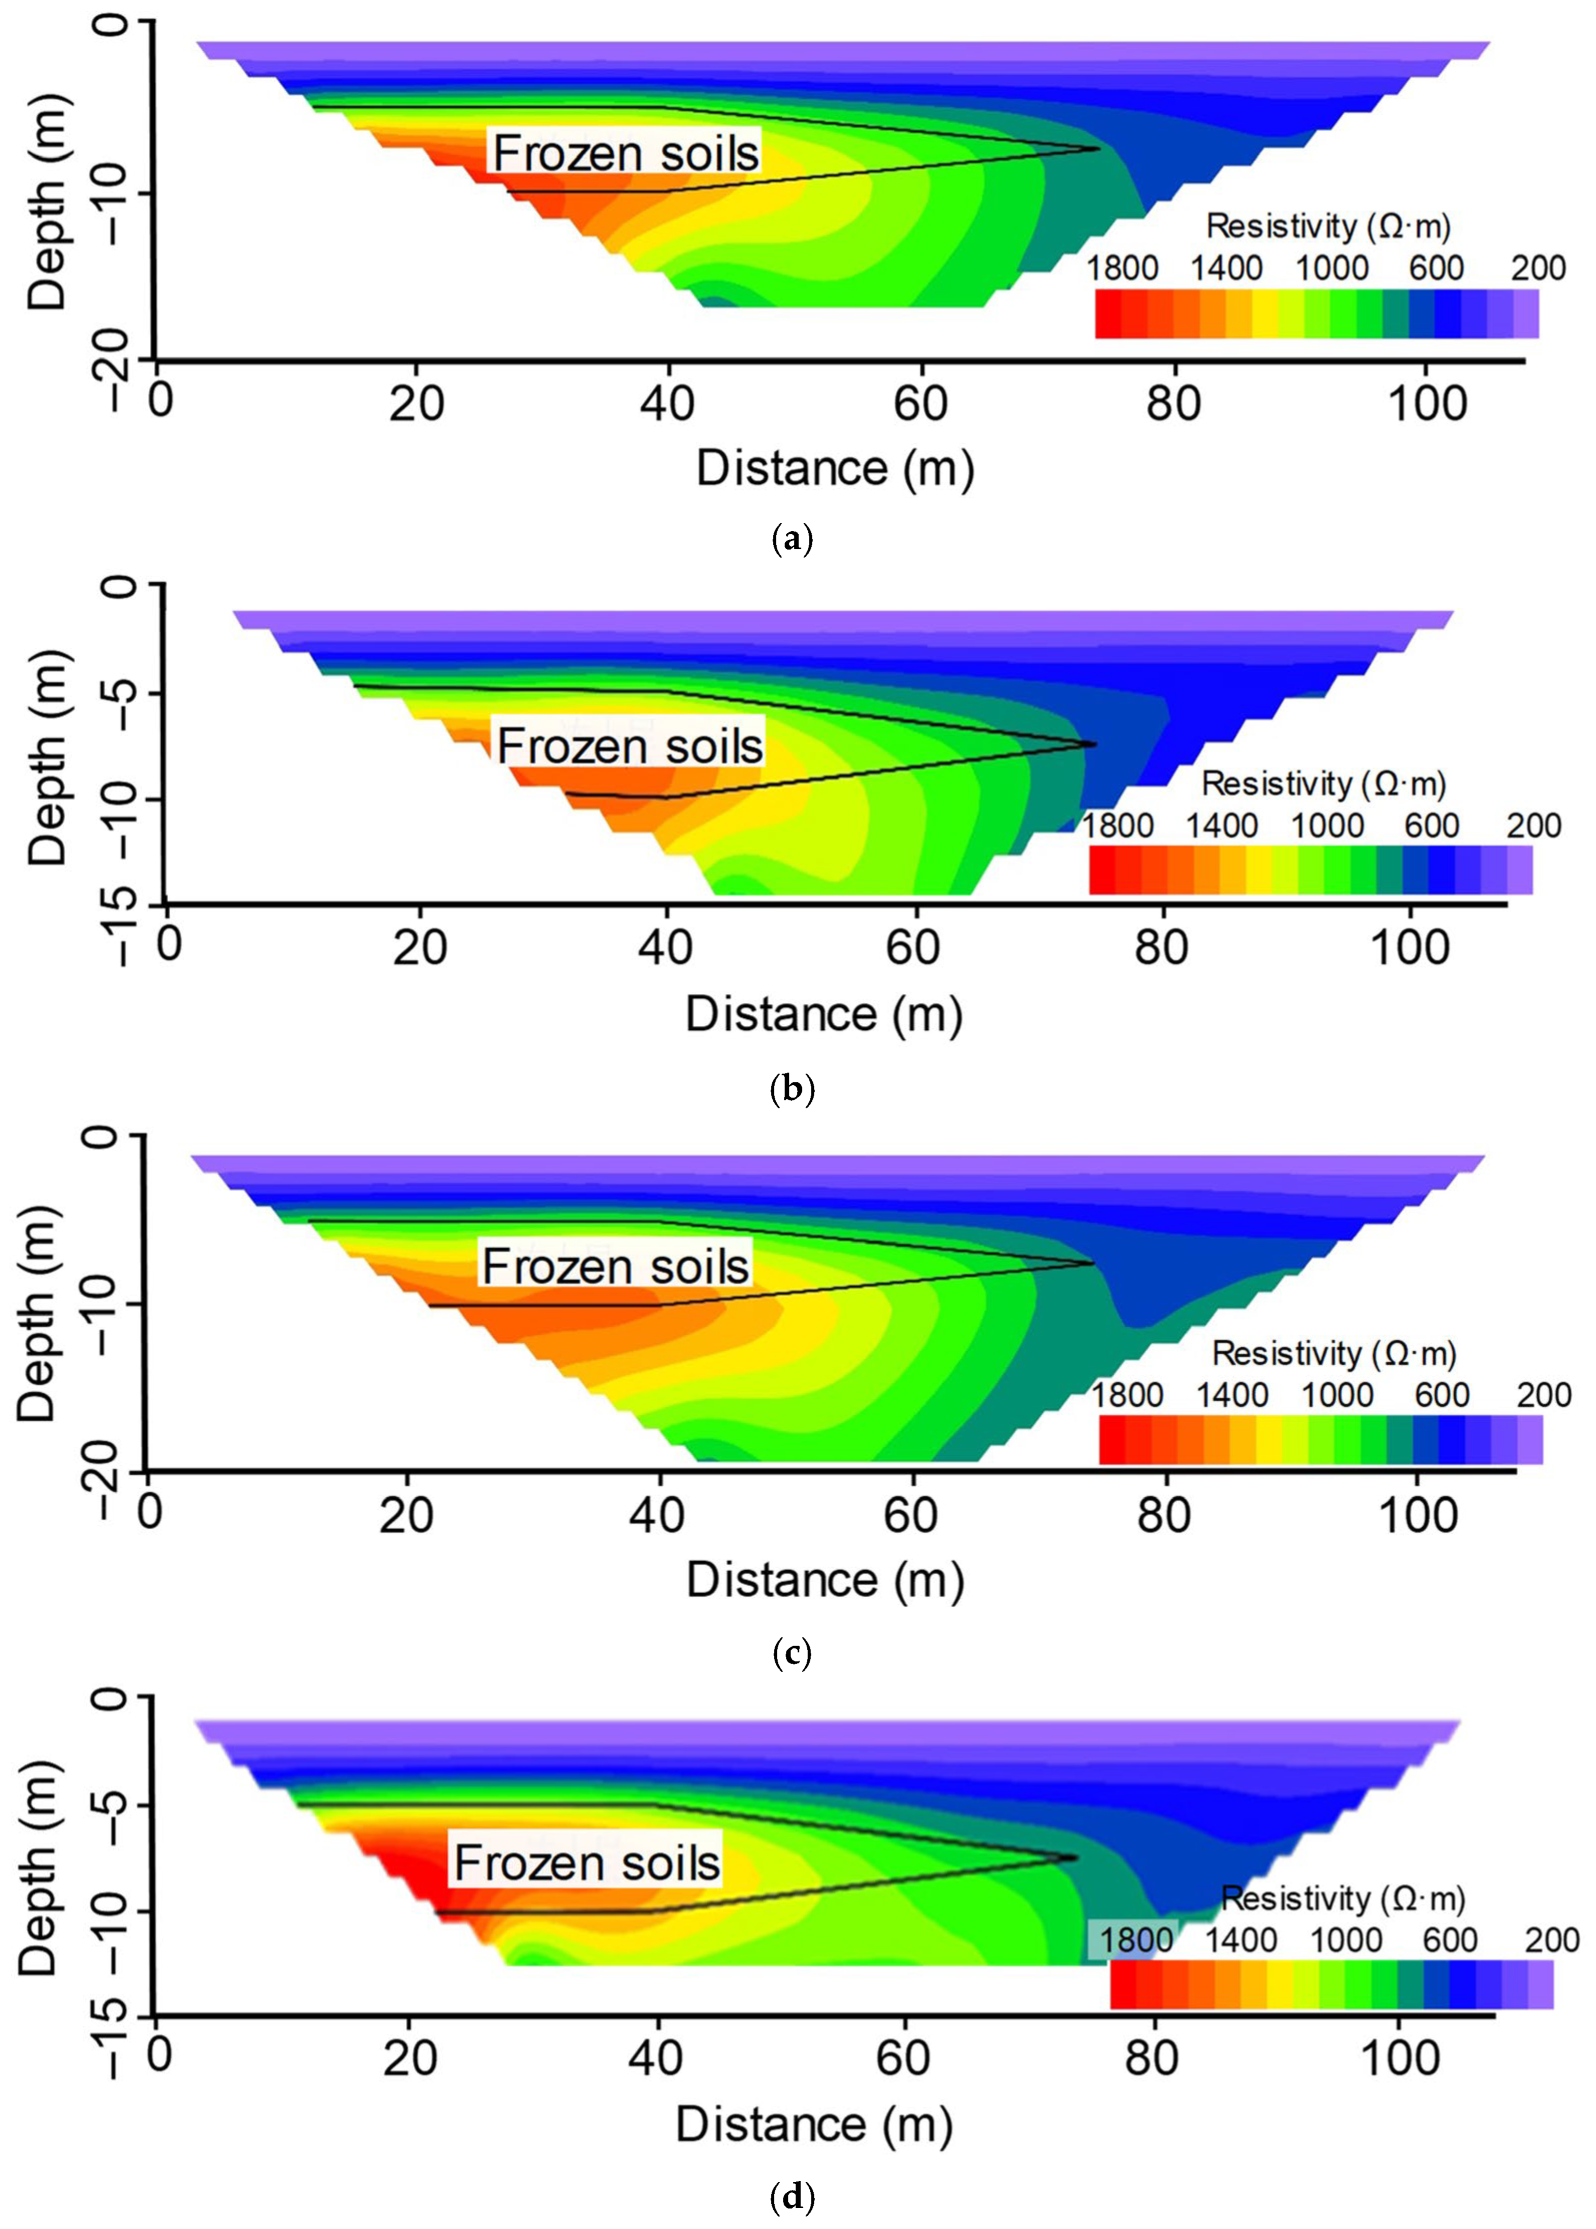
Field high-density resistivity profiles revealed minimal differences between summer (July) and early autumn (September). In contrast, by winter (December), the intermediate transition layer exhibited a pronounced increase in vertical thickness and horizontal extent, indicating the seasonal evolution of frozen soil. Once frozen, this transition layer acts as a “hydraulic barrier”, effectively reducing the downward infiltration of surface and shallow water, thereby supporting surface vegetation survival.

Author Contributions

Conceptualization, H.Y. and J.Y.; methodology, H.Y.; software, Y.X.; validation, H.W., R.C. and Q.D.; investigation, H.Y., S.Z., M.S. and Y.X.; resources, H.Y.; writing—original draft preparation, Y.X.; writing—review and editing, H.Y.; supervision, J.Y.; funding acquisition, H.Y. and J.Y. All authors have read and agreed to the published version of the manuscript.

Funding

This work was supported by the National Natural Science Foundation of China (Projects No. 42374082 and 42230811) and the Fundamental Research Funds for the Central Universities (Project No. 2024KYJD2009).

Institutional Review Board Statement

Not applicable.

Informed Consent Statement

Not applicable.

Data Availability Statement

The datasets used or analysed during the current study available from the corresponding author on reasonable request.

Conflicts of Interest

The authors have no known competing financial interests or personal relationships that could have appeared to influence the work reported in this paper.

References

  1. Yang, M.; Wang, X.; Pang, G.; Wang, G.; Liu, Z. The Tibetan Plateau Cryosphere: Observations and Model Simulations for Current Status and Recent Changes. Earth-Sci. Rev. 2019, 190, 353–369. [Google Scholar] [CrossRef]
  2. Zhang, L.; Ren, F.; Li, H.; Cheng, D.; Sun, B. The Influence Mechanism of Freeze-Thaw on Soil Erosion: A Review. Water 2021, 13, 1010. [Google Scholar] [CrossRef]
  3. Pan, Y.; Sun, Z.; Pan, Z.; Zhang, S.; Li, X.; Ma, R. Influence of Permafrost and Hydrogeology on Seasonal and Spatial Variations in Water Chemistry of An Alpine River in the Northeastern Qinghai-Tibet Plateau, China. Sci. Total Environ. 2022, 834, 155227. [Google Scholar] [CrossRef]
  4. Zhu, X.; Wu, T.; Chen, J.; Wu, X.; Wang, P.; Zou, D.; Yue, G.; Yan, X.; Ma, X.; Wang, D.; et al. Summer Heat Wave in 2022 Led to Rapid Warming of Permafrost in the Central Qinghai-Tibet Plateau. NPJ Clim. Atmos. Sci. 2024, 7, 216. [Google Scholar] [CrossRef]
  5. Xu, Z.; Jiang, L.; Guo, R.; Huang, R.; Zhou, Z.; Niu, F.; Jiao, Z. Interaction of Permafrost Degradation and Thermokarst Lakes in the Qinghai-Tibet Plateau. Geomorphology 2023, 425, 108582. [Google Scholar] [CrossRef]
  6. Xie, S.; Qu, J.; Zu, R.; Zhang, K.; Han, Q.; Niu, Q. Effect of Sandy Sediments Produced by the Mechanical Control of Sand Deposition on the Thermal Regime of Underlying Permafrost Along the Qinghai-Tibet Railway. Land Degrad. Dev. 2013, 24, 453–462. [Google Scholar] [CrossRef]
  7. Zhang, Z.; Ma, W.; Zhang, Z. Scientific Concept and Application of Frozen Soil Engineering System. Cold Reg. Sci. Technol. 2018, 146, 127–132. [Google Scholar] [CrossRef]
  8. Kong, B.; Yan, Y.; He, H.; Yu, J.; Zou, B.; Chen, Q. Strength and Fractal Characteristics of Artificial Frozen-Thawed Sandy Soft Soil. Fractal Fract. 2024, 8, 393. [Google Scholar] [CrossRef]
  9. Shan, W.; Liu, Y.; Hu, Z.; Xiao, J. A Model for the Electrical Resistivity of Frozen Soils and an Experimental Verification of the Model. Cold Reg. Sci. Technol. 2015, 119, 75–83. [Google Scholar] [CrossRef]
  10. Pan, Y.; Zhou, S.; Li, Z.; Zhang, M.; Zhang, Z. Hydrothermal Changes and Physicochemical Characteristics of Subtropical Subalpine Soils Under Freezing and Thawing. Sustainability 2022, 14, 13115. [Google Scholar] [CrossRef]
  11. Zhao, Y.; Zhang, M.; Gao, J. Research Progress of Constitutive Models of Frozen Soils: A Review. Cold Reg. Sci. Technol. 2023, 206, 103720. [Google Scholar] [CrossRef]
  12. Peng, S.; Xiong, F.; Yang, F.; Hu, L.; Wang, X. Study on the Effects of Artificial Trapezoidal Freezing Soil Mass on the Stability of Large-diameter Shield Tunnel Portal. Appl. Sci. 2022, 12, 12250. [Google Scholar] [CrossRef]
  13. Dong, C.; Chen, X.; Mu, Y.; Duan, Z.; Xue, Q.; Sun, C.; Li, J. Microscopic Analysis of Deformation and Water-Salt Transport in Chlorine Saline Soils Under Unidirectional Freezing in Cold and Arid Zones. J. Rock Mech. Geotech. Eng. 2024, 17, 2445–2460. [Google Scholar] [CrossRef]
  14. Tang, L.; Wang, K.; Jin, L.; Yang, G.; Jia, H.; Taoum, A. A Resistivity Model for Testing Unfrozen Water Content of Frozen Soil. Cold Reg. Sci. Technol. 2018, 153, 55–63. [Google Scholar] [CrossRef]
  15. Keating, K.; Binley, A.; Bense, V.; Van Dam, R.L.; Christiansen, H.H. Combined Geophysical Measurements Provide Evidence for Unfrozen Water in Permafrost in the Adventdalen Valley in Svalbard. Geophys. Res. Lett. 2018, 45, 7606–7614. [Google Scholar] [CrossRef]
  16. Wang, D.; Wang, Y.; Ma, W.; Lei, L.; Wen, Z. Study on the Freezing-Induced Soil Moisture Redistribution Under the Applied High Pressure. Cold Reg. Sci. Technol. 2018, 145, 135–141. [Google Scholar] [CrossRef]
  17. Kim, J.; Lee, A.H.; Chang, W. Manipulation of Unfrozen Water Retention for Enhancing Petroleum Hydrocarbon Biodegradation in Seasonally Freezing and Frozen Soil. Environ. Sci. Technol. 2021, 55, 9172–9180. [Google Scholar] [CrossRef]
  18. Meisner, A.; Snoek, B.L.; Nesme, J.; Dent, E.; Jacquiod, S.; Classen, A.T.; Prieme, A. Soil Microbial Legacies Differ Following Drying-Rewetting and Freezing-Thawing Cycles. ISME J. 2021, 15, 1207–1221. [Google Scholar] [CrossRef]
  19. Chen, M.; Mei, J.; Shen, K.; Gao, Y. Response of Sandy Soil-Water Migration to Different Conditions Under Unidirectional Freezing. Sustainability 2024, 16, 3597. [Google Scholar] [CrossRef]
  20. Chen, Z.; Chen, H.; Li, J.; Li, H.; Ma, W. Study on the Changing Rules of Silty Clay’s Pore Structure Under Freeze-Thaw Cycles. Adv. Civ. Eng. 2019, 2019, 7493872. [Google Scholar] [CrossRef]
  21. Zhang, T.; Li, H.; Hu, C.; Zhen, X.; Xu, Z.; Xue, Y. Review and Prospect of the Effects of Freeze-Thaw on Soil Geotechnical Properties. Sci. Cold Arid Reg. 2021, 13, 349–356. [Google Scholar]
  22. Léger, E.; Dafflon, B.; Soom, F.; Peterson, J.; Ulrich, C.; Hubbard, S. Quantification of Arctic Soil and Permafrost Properties Using Ground-Penetrating Radar and Electrical Resistivity Tomography Datasets. IEEE J. Sel. Top. Appl. Earth Obs. Remote Sens. 2017, 10, 4348–4359. [Google Scholar] [CrossRef]
  23. Krzeminska, D.; Bloem, E.; Starkloff, T.; Stolte, J. Combining FDR and ERT for Monitoring Soil Moisture and Temperature Patterns in Undulating Terrain in South-Eastern Norway. Catena 2022, 212, 106100. [Google Scholar] [CrossRef]
  24. Tomaškovičová, S.; Ingeman-Nielsen, T. Quantification of Freeze-thaw Hysteresis of Unfrozen Water Content and Electrical Resistivity from time Lapse Measurements in the Active Layer and Permafrost. Permafr. Periglac. Process. 2024, 35, 79–97. [Google Scholar] [CrossRef]
  25. Gu, Z.; Yoo, C.; Chen, J. Behavior of Geosynthetic-Encased Stone Column Reinforced Foundation Under Freeze-Thaw Cycles. Geotext. Geomembr. 2024, 52, 479–493. [Google Scholar] [CrossRef]
  26. Teng, F.; Sie, Y.; Kuo, C. Field Experimental and Numerical Study on the Formation and Frost Heave Development of Frozen Soil Under Rapid Freezing. Case Stud. Constr. Mater. 2025, 22, e04239. [Google Scholar] [CrossRef]
  27. Ge, J.; Sun, H.; Liu, R.; Huang, Z.; Tian, B.; Liu, L.; Zheng, Z. Permafrost Thawing Characterization in Engineering Scale by Multi-Geophysical Methods: A Case Study from the Tibet Plateau. Eng. Geol. 2025, 350, 108012. [Google Scholar] [CrossRef]
  28. Zhang, T.; Armstrong, R.L. Soil Freeze/Thaw Cycles Over Snow-Free Land Detected by Passive Microwave Remote Sensing. Geophys. Res. Lett. 2001, 28, 763–766. [Google Scholar] [CrossRef]
  29. Geng, L.; Cong, S.; Luo, J.; Ling, X.; Du, X.; Yu, Y. Stress-Strain Model for Freezing Silty Clay Under Frost Heave Based on Modified Takashi’s Equation. Appl. Sci. 2020, 10, 7753. [Google Scholar] [CrossRef]
  30. Liu, K.; Wang, Y. Influence of Soil Heterogeneity on the Behavior of Frozen Soil Slope Under Freeze-Thaw Cycles. CMES-Comput. Model. Eng. Sci. 2022, 131, 119–135. [Google Scholar] [CrossRef]
  31. Ministry of Housing and Urban Rural Development of the People’s Republic of China. GB/T 50123-2019; Standard for Geotechnical Testing Method. China Planning Press: Beijing, China, 2019.
  32. Watanabe, K.; Kito, T.; Wake, T.; Sakai, M. Freezing Experiments on Unsaturated Sand, Loam and Silt Loam. Ann. Glaciol. 2011, 52, 37–43. [Google Scholar] [CrossRef]
  33. Lei, H.; Wang, L.; Feng, S.; Zhang, W.; Bo, Y.; Tu, C. Laboratory Studies on the Influence of Freezing Methodology on the Shear Strength Behavior of Artificially Frozen Clays. Int. J. Geomech. 2023, 23, 04023122. [Google Scholar] [CrossRef]
  34. Qu, Y.; Ni, W.; Niu, F.; Mu, Y.; Chen, G.; Luo, J. Mechanical and Electrical Properties of Coarse-Grained Soil Affected by Cyclic Freeze-thaw in High Cold Regions. J. Cent. South Univ. 2020, 27, 853–866. [Google Scholar] [CrossRef]
  35. Tang, L.; Chen, W.; Luo, X.; Zhang, G.; Feng, X.; Guo, L.; Gao, W.; He, J.; Zhao, G.; Jiang, J.; et al. Multi-Technological Integration in a Smelting Site: Visualizing Pollution Characteristics and Migration Pattern. J. Hazard. Mater. 2023, 459, 132135. [Google Scholar] [CrossRef]
  36. Yang, Y.; Liao, M.; Cai, H.; Chen, P. Numerical Simulation of the Temperature Fields in the Shielding Walls of Frozen Soil with Multi-Circle-Pipe Freezing in Shaft Sinking. Therm. Sci. 2019, 23, 647–652. [Google Scholar] [CrossRef]
  37. Shi, Y.; Ma, W.; Zhang, L.; Yang, C.; Shang, F.; Chen, C. Change of Pore Water Near the Freezing Front During Soil Freezing: Migration and Mechanisms. Pedosphere 2024, 34, 770–782. [Google Scholar] [CrossRef]
  38. Wang, Y.; Hu, L. A Theoretical Model of Soil Freezing Characteristic Curve Considering the Freezing of Adsorbed Water and Capillary Water. Water Resour. Res. 2023, 59, e2023WR034662. [Google Scholar] [CrossRef]
  39. Teng, J.; Dong, A.; Zhang, S.; Zhang, X.; Sheng, D. Freezing-Thawing Hysteretic Behavior of Soils. Water Resour. Res. 2024, 60, e2024WR037280. [Google Scholar] [CrossRef]
  40. Zhao, Y.; Si, B.; He, H.; Xu, J.; Peth, S.; Horn, R. Modeling of Coupled Water and Heat Transfer in Freezing and Thawing Soils, Inner Mongolia. Water 2016, 8, 424. [Google Scholar] [CrossRef]
  41. Bai, R.; Lai, Y.; Zhang, M.; Yu, F. Theory and Application of a Novel Soil Freezing Characteristic Curve. Appl. Therm. Eng. 2018, 129, 1106–1114. [Google Scholar] [CrossRef]
  42. Nagare, R.M.; Schincariol, R.A.; Quinton, W.L.; Hayashi, M. Effects of Freezing On Soil Temperature, Freezing Front Propagation and Moisture Redistribution In Peat, Laboratory Investigations. Hydrol. Earth Syst. Sci. 2012, 16, 501–515. [Google Scholar] [CrossRef]
  43. Sun, K.; Tao, X.; Zhou, A. Phase Field Modeling of Freezing Characteristics of Saturated Soil with Different Particle Sizes. Comput. Geotech. 2023, 164, 105794. [Google Scholar] [CrossRef]
  44. Yang, H.; Lei, B.; Xie, L.; Hu, C.; Liu, J. Experimental Study on Water and Salt Migration and the Aggregate Insulating Effect in Coarse-grained Saline Soil Subgrade Under Freeze-thaw Cycles. Appl. Sci. 2024, 14, 8970. [Google Scholar] [CrossRef]
  45. Yu, Z.; Fang, J.; Xu, A.; Zhou, W. The Study of Influence of Freeze-Thaw Cycles on Silty Sand in Seasonally Frozen Soil Regions. Geofluids 2022, 2022, 6886108. [Google Scholar] [CrossRef]
  46. Han, S.; Cao, W.; Chou, Y.; Peng, E. Experimental Study on the Change in Freezing Temperature During the Remediation of Pb-Contaminated Soils with Biochar. Atmosphere 2024, 15, 1483. [Google Scholar] [CrossRef]
  47. Teng, J.; Kou, J.; Yan, X.; Zhang, S.; Sheng, D. Parameterization of Soil Freezing Characteristic Curve for Unsaturated Soils. Cold Reg. Sci. Technol. 2020, 170, 102928. [Google Scholar] [CrossRef]
  48. Miao, Y.; Cao, W.; Zhang, L.; Zhao, Q.; Ding, R.; Wang, S. Distribution of BTEX in Freeze-Thaw Soil System and Its Relationship with Soil Physical and Chemical Properties. Fresenius Environ. Bull. 2022, 31, 3483–3491. [Google Scholar]
  49. Wang, C.; Li, K.; Tian, J.; Meng, F.; Yang, H.; Ren, J.; Li, S. Quantification of Chloride Saline Soil Freezing-Thawing Temperature Threshold Based on Thermodynamic Theory. Acta Geotech. 2025, 20, 1049–1068. [Google Scholar] [CrossRef]
  50. Wan, X.; Lai, Y.; Wang, C. Experimental Study on the Freezing Temperatures of Saline Silty Soils. Permafr. Periglac. Process. 2015, 26, 175–187. [Google Scholar] [CrossRef]
  51. Xu, J.; Li, F.; Gao, W.; Ding, H.; Zhang, J.; Wen, H.; Yu, X. Study on the Evolution of the Dielectric Properties of Artificially Frozen Sand Under Temperature Variation. Environ. Earth Sci. 2024, 83, 355. [Google Scholar] [CrossRef]
  52. Ding, B.; Zhang, Y.; Yu, X.; Jia, G.; Wang, Y.; Zheng, P.; Li, Z. Comparative Study of Seasonal Freeze-thaw on Soil Water Transport in Farmland and Its Shelterbelt. Catena 2023, 225, 106982. [Google Scholar] [CrossRef]
  53. Henry, H.A.L. Soil Freeze-Thaw Cycle Experiments: Trends, Methodological Weaknesses and Suggested Improvements. Soil Biol. Biochem. 2007, 39, 977–986. [Google Scholar] [CrossRef]
  54. Wen, Y.; Liu, B.; Jiang, H.; Li, T.; Zhang, B.; Wu, W. Initial Soil Moisture Prewinter Affects the Freeze-Thaw Profile Dynamics of a Mollisol in Northeast China. Catena 2024, 234, 107648. [Google Scholar] [CrossRef]
  55. Yuan, G.; Che, A.; Tang, H. Evaluation of Soil Damage Degree Under Freeze-Thaw Cycles Through Electrical Measurements. Eng. Geol. 2021, 293, 106297. [Google Scholar] [CrossRef]
  56. Li, G.; Zhang, J.; Zhou, Z.; Wang, F.; Chen, D.; Cao, Y.; Wu, G. A Novel Freezing Point Determination Method for Oil-Contaminated Soils Based on Electrical Resistance Measurement and Its Influencing Factors. Sci. Total Environ. 2020, 721, 137821. [Google Scholar] [CrossRef]
  57. Yuan, G.; Che, A.; Feng, S. Evaluation Method for the Physical Parameter Evolutions of Highway Subgrade Soil Using Electrical Measurements. Constr. Build. Mater. 2020, 231, 117162. [Google Scholar] [CrossRef]
  58. Cheng, Z.; Wang, F.; Sun, J.; Ding, L.; Wang, Y.; Wang, H. Effect of Seasonal Freeze-Thaw Process on Spatial and Temporal Distribution of Soil Water and Its Infiltration to Recharge Groundwater. Hydrol. Process. 2024, 38, e15110. [Google Scholar] [CrossRef]
  59. Shi, Y.; Zhang, L.; Mu, Y.; Ma, W.; Kong, X.; Yang, C. Dynamic Characteristics of Soil Pore Structure and Water-heat Variations During Freeze-thaw Process. Eng. Geol. 2024, 343, 107785. [Google Scholar] [CrossRef]
  60. Kalyuzhnyi, I.L.; Lavrov, S.A. Mechanism of the Influence of Soil Freezing Depth on Winter Runoff. Water Resour. 2017, 44, 604–613. [Google Scholar] [CrossRef]
  61. Stuurop, J.C.; van der Zee, S.E.A.T.M.; French, H.K. The Influence of Soil Texture and Environmental Conditions on Frozen Soil Infiltration: A Numerical Investigation. Cold Reg. Sci. Technol. 2022, 194, 103456. [Google Scholar] [CrossRef]
  62. Li, N.; Cuo, L.; Zhang, Y. On the Freeze-Thaw Cycles of Shallow Soil and Connections with Environmental Factors Over the Tibetan Plateau. Clim. Dyn. 2021, 57, 3183–3206. [Google Scholar] [CrossRef]
  63. Huang, M.; Jia, J.; Liu, K. Probabilistic Analysis of the Frozen Depth of Soil Foundations Considering Thermal and Hydraulic Coupling by COMSOL. KSCE J. Civ. Eng. 2024, 28, 3671–3680. [Google Scholar] [CrossRef]
Figure 1. The regional location and topography of the study area.
Applsci 15 07498 g001
Figure 2. Particle size distribution curve of clayey sand in the study area.
Applsci 15 07498 g002
Figure 3. Schematic diagram of the freezing–thawing test apparatus.
Applsci 15 07498 g003
Figure 4. Forward model used for 2D resistivity simulation.
Applsci 15 07498 g004
Figure 5. Hysteresis characteristics of freeze–thaw cycles for clayey sand with different initial volumetric water contents: (a) 30%, (b) 18.5%, (c) 10%.
Applsci 15 07498 g005aApplsci 15 07498 g005b
Figure 6. Freeze–thaw characteristic curves of clayey sand with different initial volumetric water contents: (a) freezing process, (b) thawing process.
Applsci 15 07498 g006
Figure 7. Relationship curves of electrical resistivity and unfrozen water content with temperature during soil freezing (initial volumetric water content = 18.5%).
Applsci 15 07498 g007
Figure 8. Variation curves of resistivity of frozen clayey sand with initial volumetric water content under different temperatures: (a) −15 °C, (b) −5 °C.
Applsci 15 07498 g008
Figure 9. Forward modeling resistivity profiles obtained using different resistivity configurations: (a) Wenner-α array, (b) Wenner-β array, (c) Wenner-γ array, (d) Schlumberger array.
Applsci 15 07498 g009
Figure 10. Inverted high-density electrical resistivity profiles along different survey lines: (a) Line A–A′, (b) Line B–B′.
Applsci 15 07498 g010
Table 1. Physicochemical properties of clayey sand.
Natural Volumetric Water Content (%)Natural Dry Density (g·cm−3)Specific GravityPlastic Limit (%)Liquid Limit (%)Plasticity IndexpH
18.5%1.552.6523.734.110.46.78
Table 2. Model parameters.
No.ParameterDescriptionResistivity (Ω·m)
Iρ1First layer medium, thawed layer, 2 m parallel strata.200
IIρ2Second layer medium, freezing transition zone, 3~8 m inclined strata.500
IIIρ3Third layer medium, seasonally frozen soil layer, 4~6 m inclined strata.2000
IVρ4Fourth layer medium, bedrock layer, 20 m depth.800
Disclaimer/Publisher’s Note: The statements, opinions and data contained in all publications are solely those of the individual author(s) and contributor(s) and not of MDPI and/or the editor(s). MDPI and/or the editor(s) disclaim responsibility for any injury to people or property resulting from any ideas, methods, instructions or products referred to in the content.

