Article

Scale-Model Experiment on the Delayed Failure Mechanism of Deep Tunnels in Brittle Rock

Department of Underground Engineering, Nanjing Tech University, Nanjing 211816, China
*
Author to whom correspondence should be addressed.
Appl. Sci. 2025, 15(13), 7496; https://doi.org/10.3390/app15137496
Submission received: 31 May 2025 / Revised: 25 June 2025 / Accepted: 30 June 2025 / Published: 3 July 2025
(This article belongs to the Section Civil Engineering)

Abstract

Rock bursts usually happen during the hours or days after tunnel excavation, even in an unsupported opening where no collapses occur. To investigate the mechanism of those delayed failures in brittle rock tunnels, this paper showcases the performed scale-model test based upon the Jinping II headrace tunnelling project. The model test was conducted in a particularly designed loading apparatus; the scale-model is composed of a similar material for the deep brittle rock. The tunnel in the scale-model is excavated by a specially made drilling tool. The failure mode of the deep circle tunnel under isotropic and anisotropic geostress were obtained; the delay failure time was recorded, and the accompanying stresses and strains changing were monitored. Under isotropic geostress the failure shape has a smooth circle boundary, failure process totally costs 56 h. While under anisotropic geostress a dog-eared breakdown was found, the failure process amounted to 72 h. The time-to-failure was evaluated by delay failure theory, and the evaluation equation was implemented into in FEM code. Numerical simulations have been performed to simulate the failure time and failure mode. The numerical results of failure time and failure mode mainly match the scale-model testing results.

1. Introduction

Changes in local stress state due to deep tunnelling perturb the stability of the rock mass surrounding excavations. The subsequent readjustment of the rock towards a new equilibrium does not occur instantaneously but as a gradual process over time. This process can include two types of inelastic deformation, namely creep-like movements and violent failures, or rockbursts [1]. As the creep rate of the brittle rock is low, the rockbursts in deep tunnels tend to occur in a sudden way, with little warning of the deformation [2]. With rockbursts being found frequently in deep tunnels with brittle rock surrounding, causing men injury and destroying equipment [3], researchers conducted a theoretical and experiential studies on the delay mechanism of the rockburst [2,3,4,5,6,7,8].
Early research recognized that the delay time of the rockburst phenomenon determined the relaxation time. As the specific potential energy of weak rocks at a given time will be less than that of hard rock, the probability of the occurrence of brittle fractures will be greater in hard rock [4]. The relaxation time used in this study was measured by the ultrasonic method on rock cores; the engineering level evaluation method was not implemented [4]. Subsequent research on rockbursts focused on some engineering cases and rockburst prevention and control. Malan and Napier investigated the unique problems associated with the design of rockburst support for shallow-dipping tabular excavations [1]. Guo et al. studied rockbursts in the mine, his research shows that rockbursts are caused by a combination of movement, special breaking laws of thick conglomerate, and special breakage-induced stress fields [1,9]. Keneti and Sainsbury reviewed, selected, and published rockbursts’ case data and identified the contributing factors, including unfavourable stress states, excavation geometry (size and orientation in relation to the principal stresses), and rate and direction of advance [3]. Zhai et al. conducted rockburst tests on rectangular prismatic specimens of six types of intact hard brittle rocks, i.e., granodiorite, granite, marble, basalt, sandstone, and limestone, under one free-face true triaxial loading conditions. The results show that the inherent microstructures and fracture evolution under loading are the primary factors accounting for different rockbursts in various rock types [2]. Feng et al. monitored microseismicity during the excavation of deep tunnels, the difference in the mechanism of strain rockburst and strain structure slip rockburst was found [10]. The delayed failure mechanism has not reached a consensus yet.
To figure out the delayed failure mechanism, the focus of recent research has begun to shift towards the study of time-to-failure of rocks. Time-to-failure is the key indicator of delayed rockburst occurrence. Li and Konietzky reviewed the theory of the time-to-failure and proposed a simulation scheme to reproduce daily failure processes in macroscopic scale [11]. Liu et al. researched the time-dependent failure mechanism of rocks and associated the application in slope engineering with numerical simulation [12]. Wang and Cai proposed a time-to-failure creep model to simulate the lifetime of intact brittle rock under uniaxial and triaxial loading conditions [13]. Gao et al. predicted the time-to-failure of red sandstone by a temporal precursor of acoustic emission signals [14]. Kovrizhnykh proposed a unified approach to evaluate stresses in the limit state zones and the time-to-failure in rock mass with regard to internal friction [15]. Chen et al. established a time–lag numerical model using particle flow code 2D to investigate the failure characteristics and the time–lag of rock masses with structural planes under unloading conditions typical of hard brittle rock [16].
The time-to-failure, as the key indicator of delayed rockburst, was the main concern in recent studies. However, those studies focused mainly on rock sample level, the delayed failure mechanism of rockbursts based on time-to-failure in engineering level is still absent. To study the delay mechanism of the rockbursts, this paper conducted scale-model testing and numerical simulations based on the Jinping II deep tunnel.

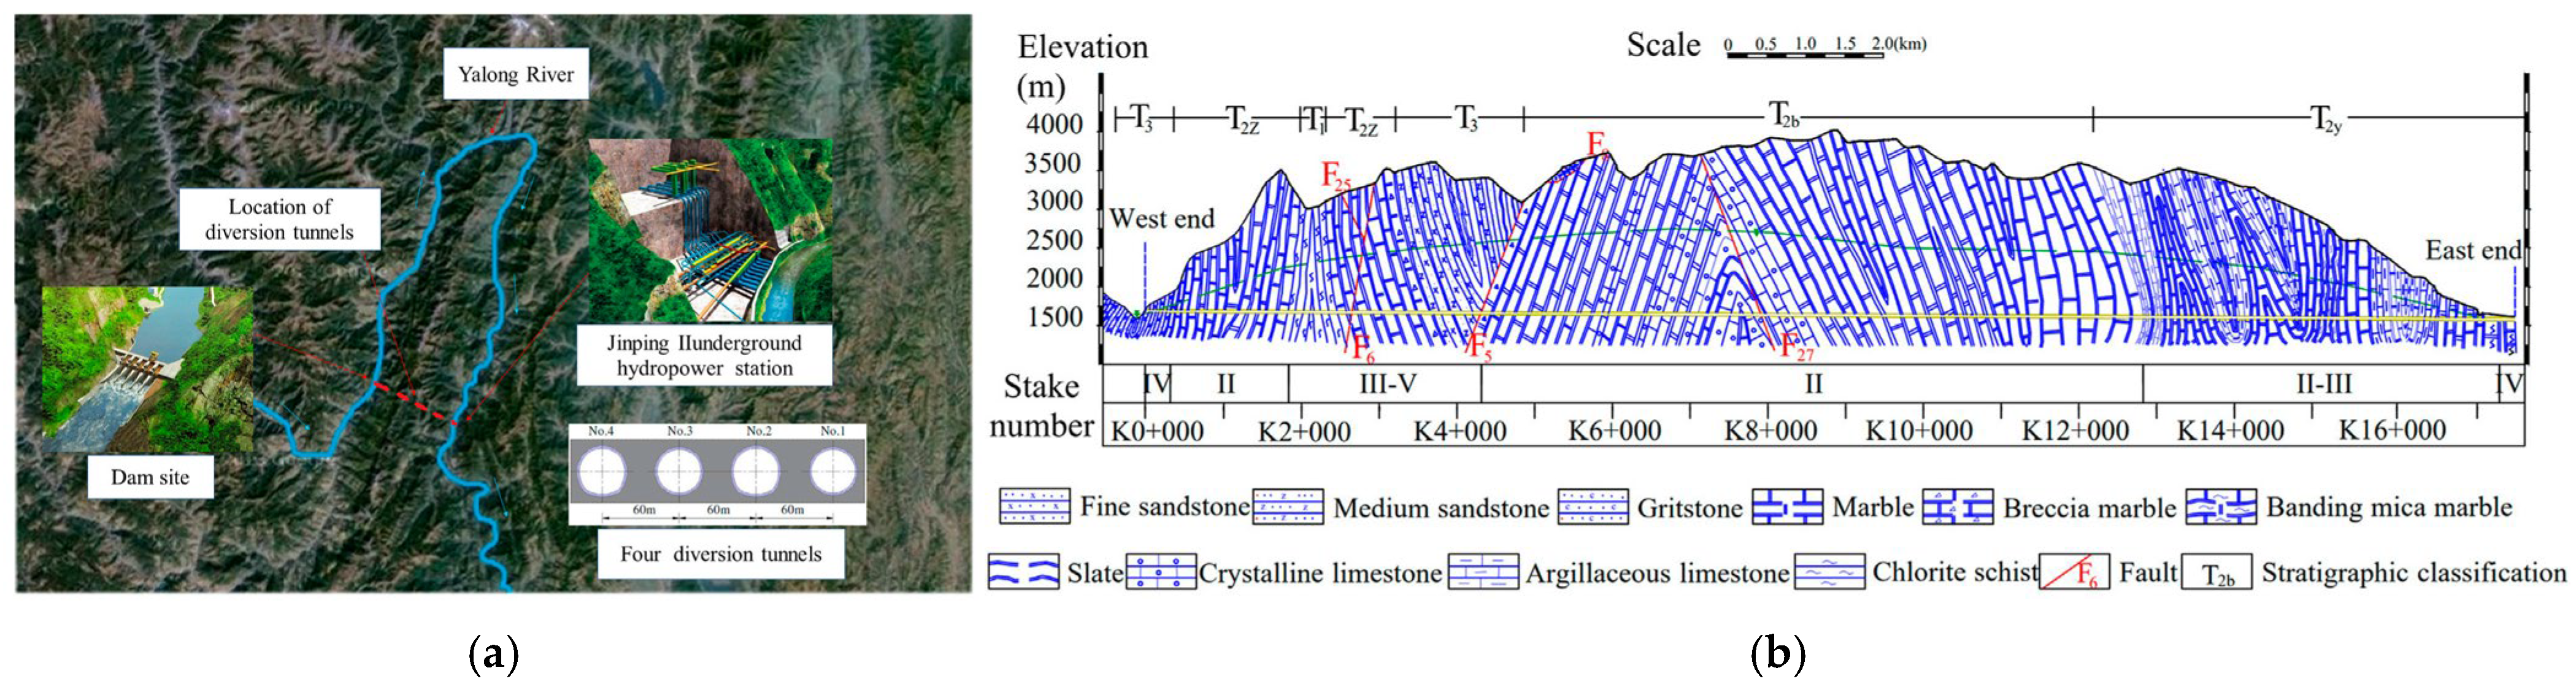
2. Background Engineering and Scientific Issue

Jinping II is a hydroelectric project located on the Yanlong River in Sichuan Province, southwest of China [17]. There is a total of seven tunnels in this project: twin transportation tunnels serving as accesses, one drainage tunnel, and four water-conveying (headrace) tunnels (Figure 1a). The length of each tunnel is about 16.7 m, and the total length of the tunnels is around 117 km. All the tunnels are located beneath Jinping Mountain, with a summit of 4455 m elevation. The maximum depth of the headrace tunnels is 2525 m from the mountain surface. The tunnels mainly go through huge blocks of marble (Figure 1b), except about 5 km weak rocks as slate and schist near west portal. Three tunnel-boring-machines (TBMs) drilled from the east portal of the drainage tunnel, No. 1 and No. 3 headrace tunnels. The other two headrace tunnels (No. 2 and No. 4) have been excavated by the traditional drill and blasting (D&B) method from the east portal and the west portal, respectively.
During the excavation of these tunnels, many time-delayed rockbursts occurred. The following phenomena could be found about the delayed time of the time-delayed rockbursts [19]:
(1)
Most of the time-delayed rockbursts occur within 7 days to 1 month after excavation;
(2)
The relationship between frequency of the time-delayed rockbursts and their delayed blasting time matches a power function, and the peak frequency of rockburst count is within 4 h after excavation.
The key scientific question is why the peak frequency of rockbursts is within 4 h after excavation, and why sometimes the delayed time can up to last one month. Solving this question would provide more key evidence for the mechanism of the rockbursts. In this paper, we review the delayed failure mechanism, design a scale-model test and conduct numerical simulations to seek the answer.

3. Research Methodology

In this study, the delayed rockburst process was reproduced through scale-model tests and numerical simulations, and the mechanism of delayed rockburst occurrence was determined based on the relationship between the delayed failure time and the parameters of the scale-model tests and simulations. The detailed research methodology was completed according to the following steps:
(1)
Conducted scale-model tests to determine the delayed failure model and time under different loading scheme.
  • Deep Rock Scale-model Testing Apparatus (DRSTA) preparation.
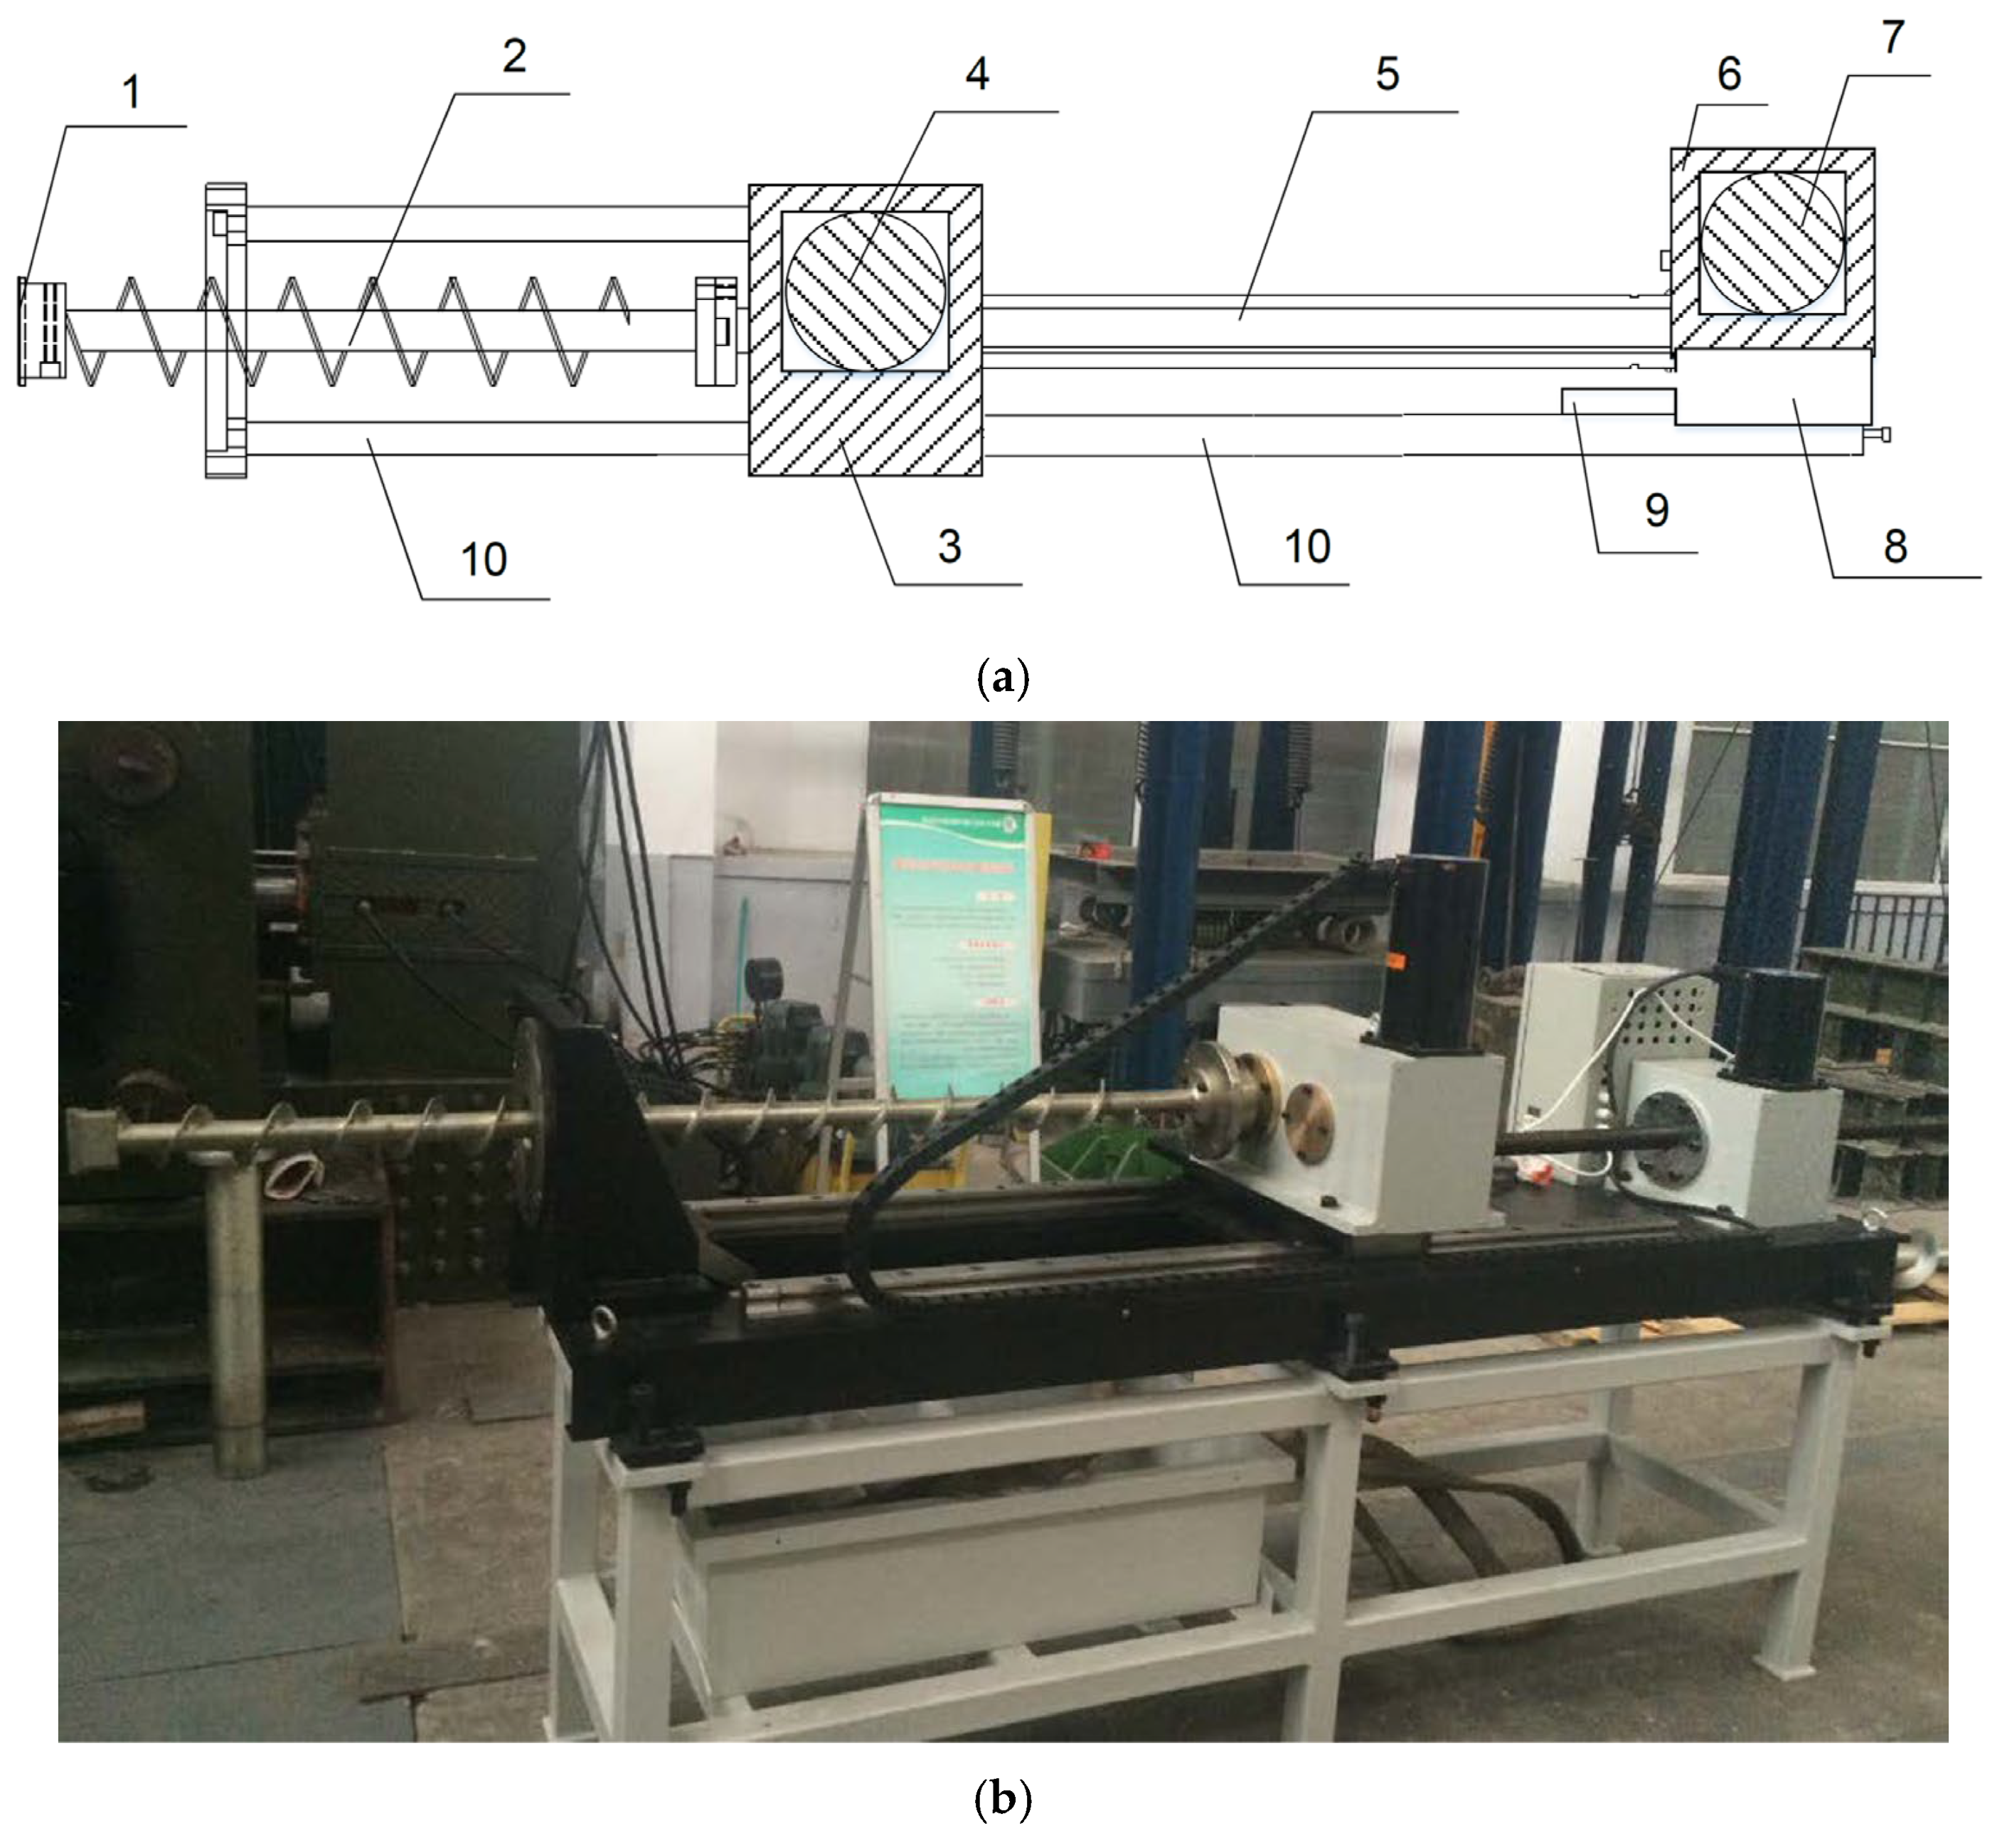
  • Drilling machine design and manufacture.
  • Scale factor determined based on the chamber size of DRSTA and tunnel diameter of the scaled model.
  • Similar material studied to simulate the brittle rock in Jinping site.
  • Monitoring system designed to obtain detailed data of the tunnel delayed rock burst.
(2)
Conducted the delayed failure time simulation of the scale-model testing.
  • Established a finite element model of the tunnel scaled model.
  • Initial geostress, material properties, boundary condition, etc., applied to the FEM model.
  • Numerical simulations under different loading scheme were conducted with Abaqus(V6.14) software.
(3)
Analyzed the results the scale-model tests and numerical simulations. Compared the time-to-failure of the scale-model tests and numerical simulations. Obtained the delayed failure mechanism based on the time-to-failure, rock properties, and geostress.

4. Scale-Model Testing of Deep Tunnel

A scaled model was designed based on the Jinping II tunnel; the scale-model was conducted on our apparatus. The failure phenomenon was analyzed, and the deformation, stress, and strains were monitored by sensors.

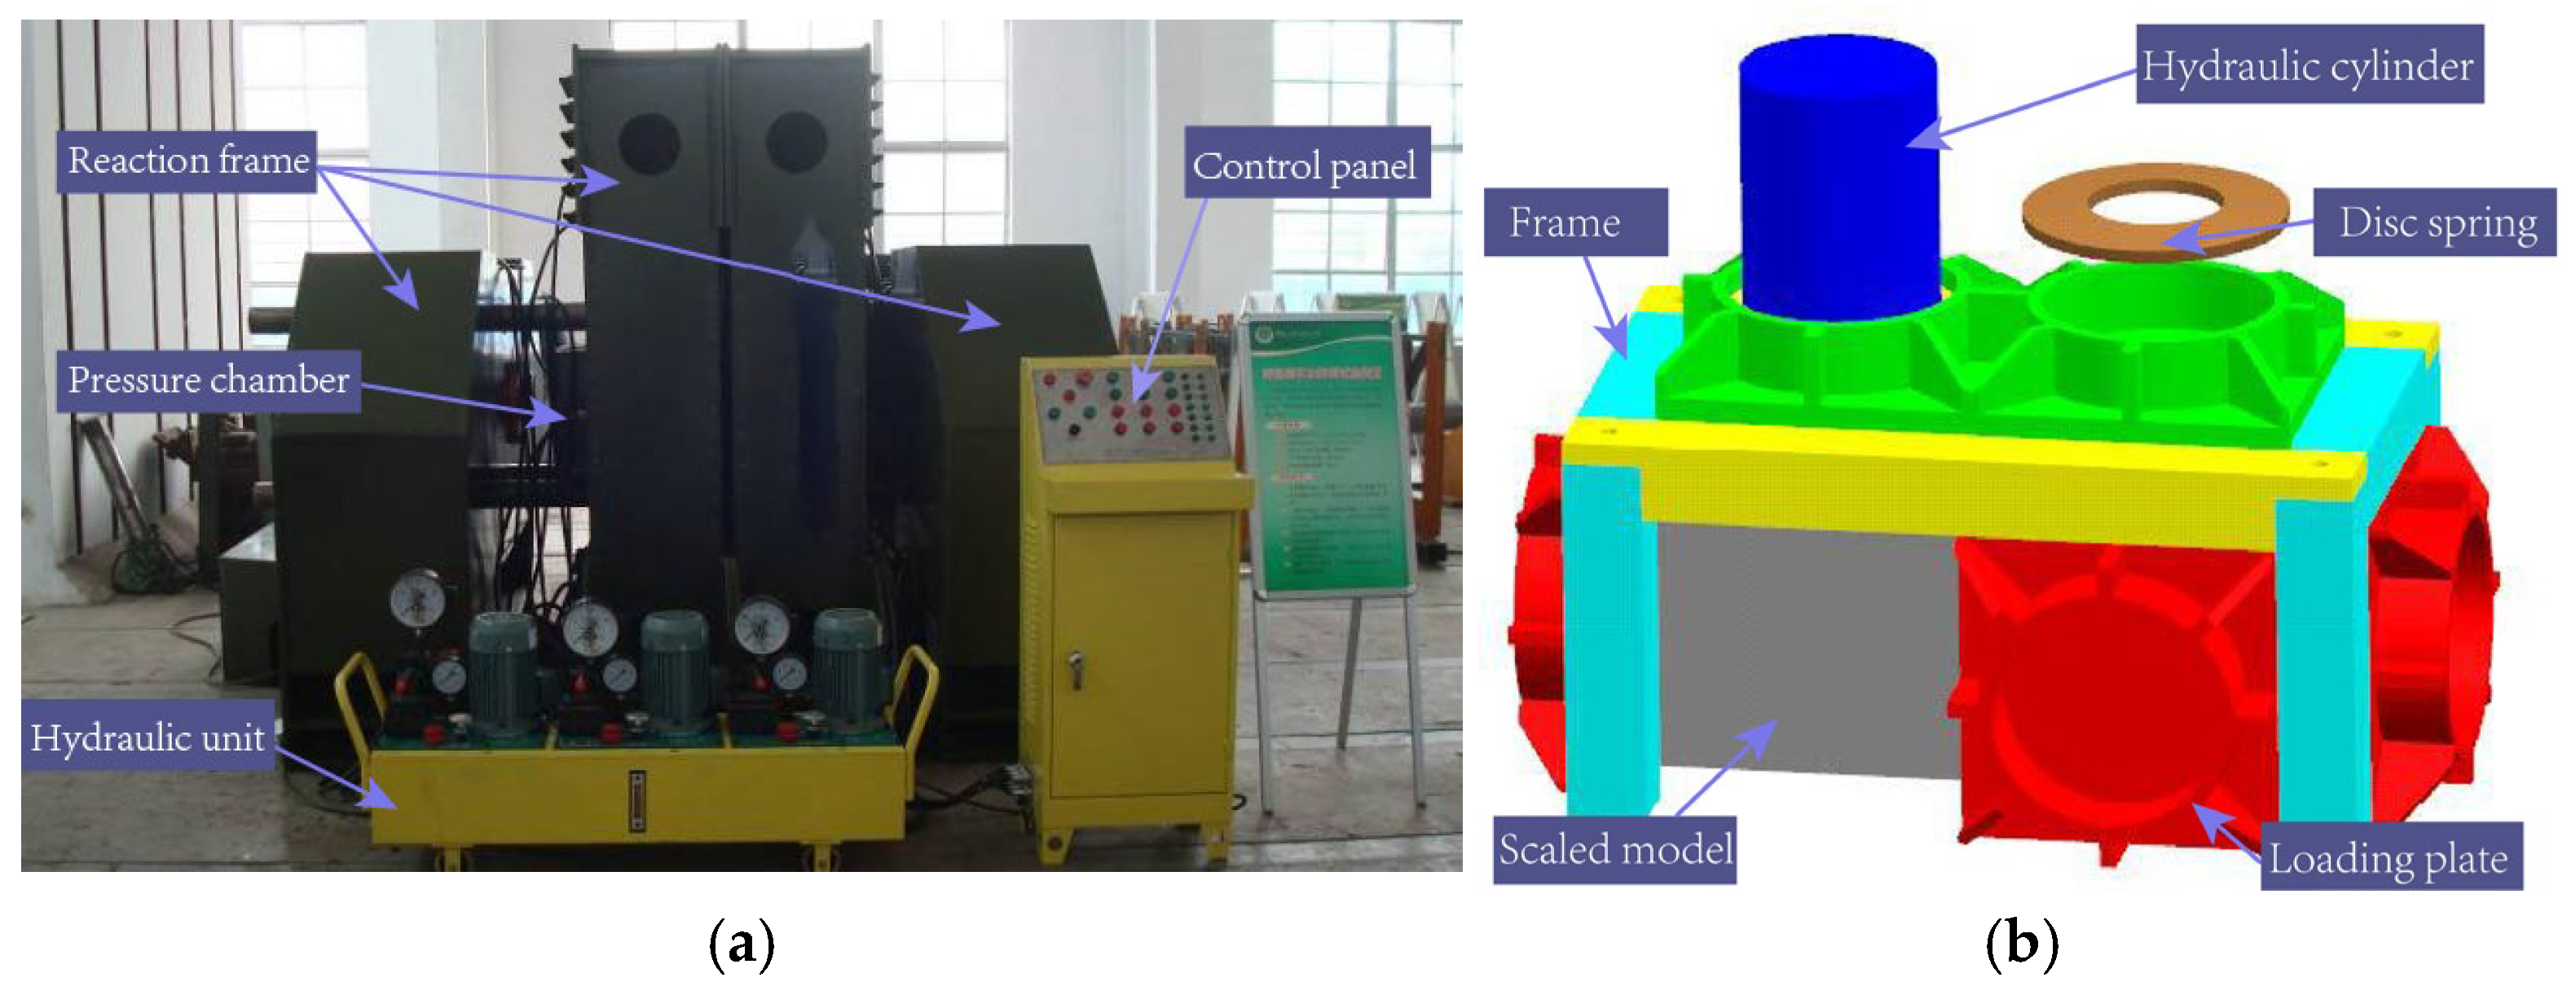
4.1. Deep Rock Scale-Model Testing Apparatus

DRSTA is designed particularly for deep engineering research. It is composed of a reaction frame, hydraulic unit, control unit, and pressure chamber (Figure 2a). The hydraulic unit is powered by three engines, where each of them control the hydraulic cylinders on one side (lateral, horizontal, and axial, respectively). Thus, triaxial pressure could be applied to the chamber. The insides of the pressure chamber are shown in Figure 2b. Multiple technical details in DRSTA were considered for simulating the deep underground environment:
(1)
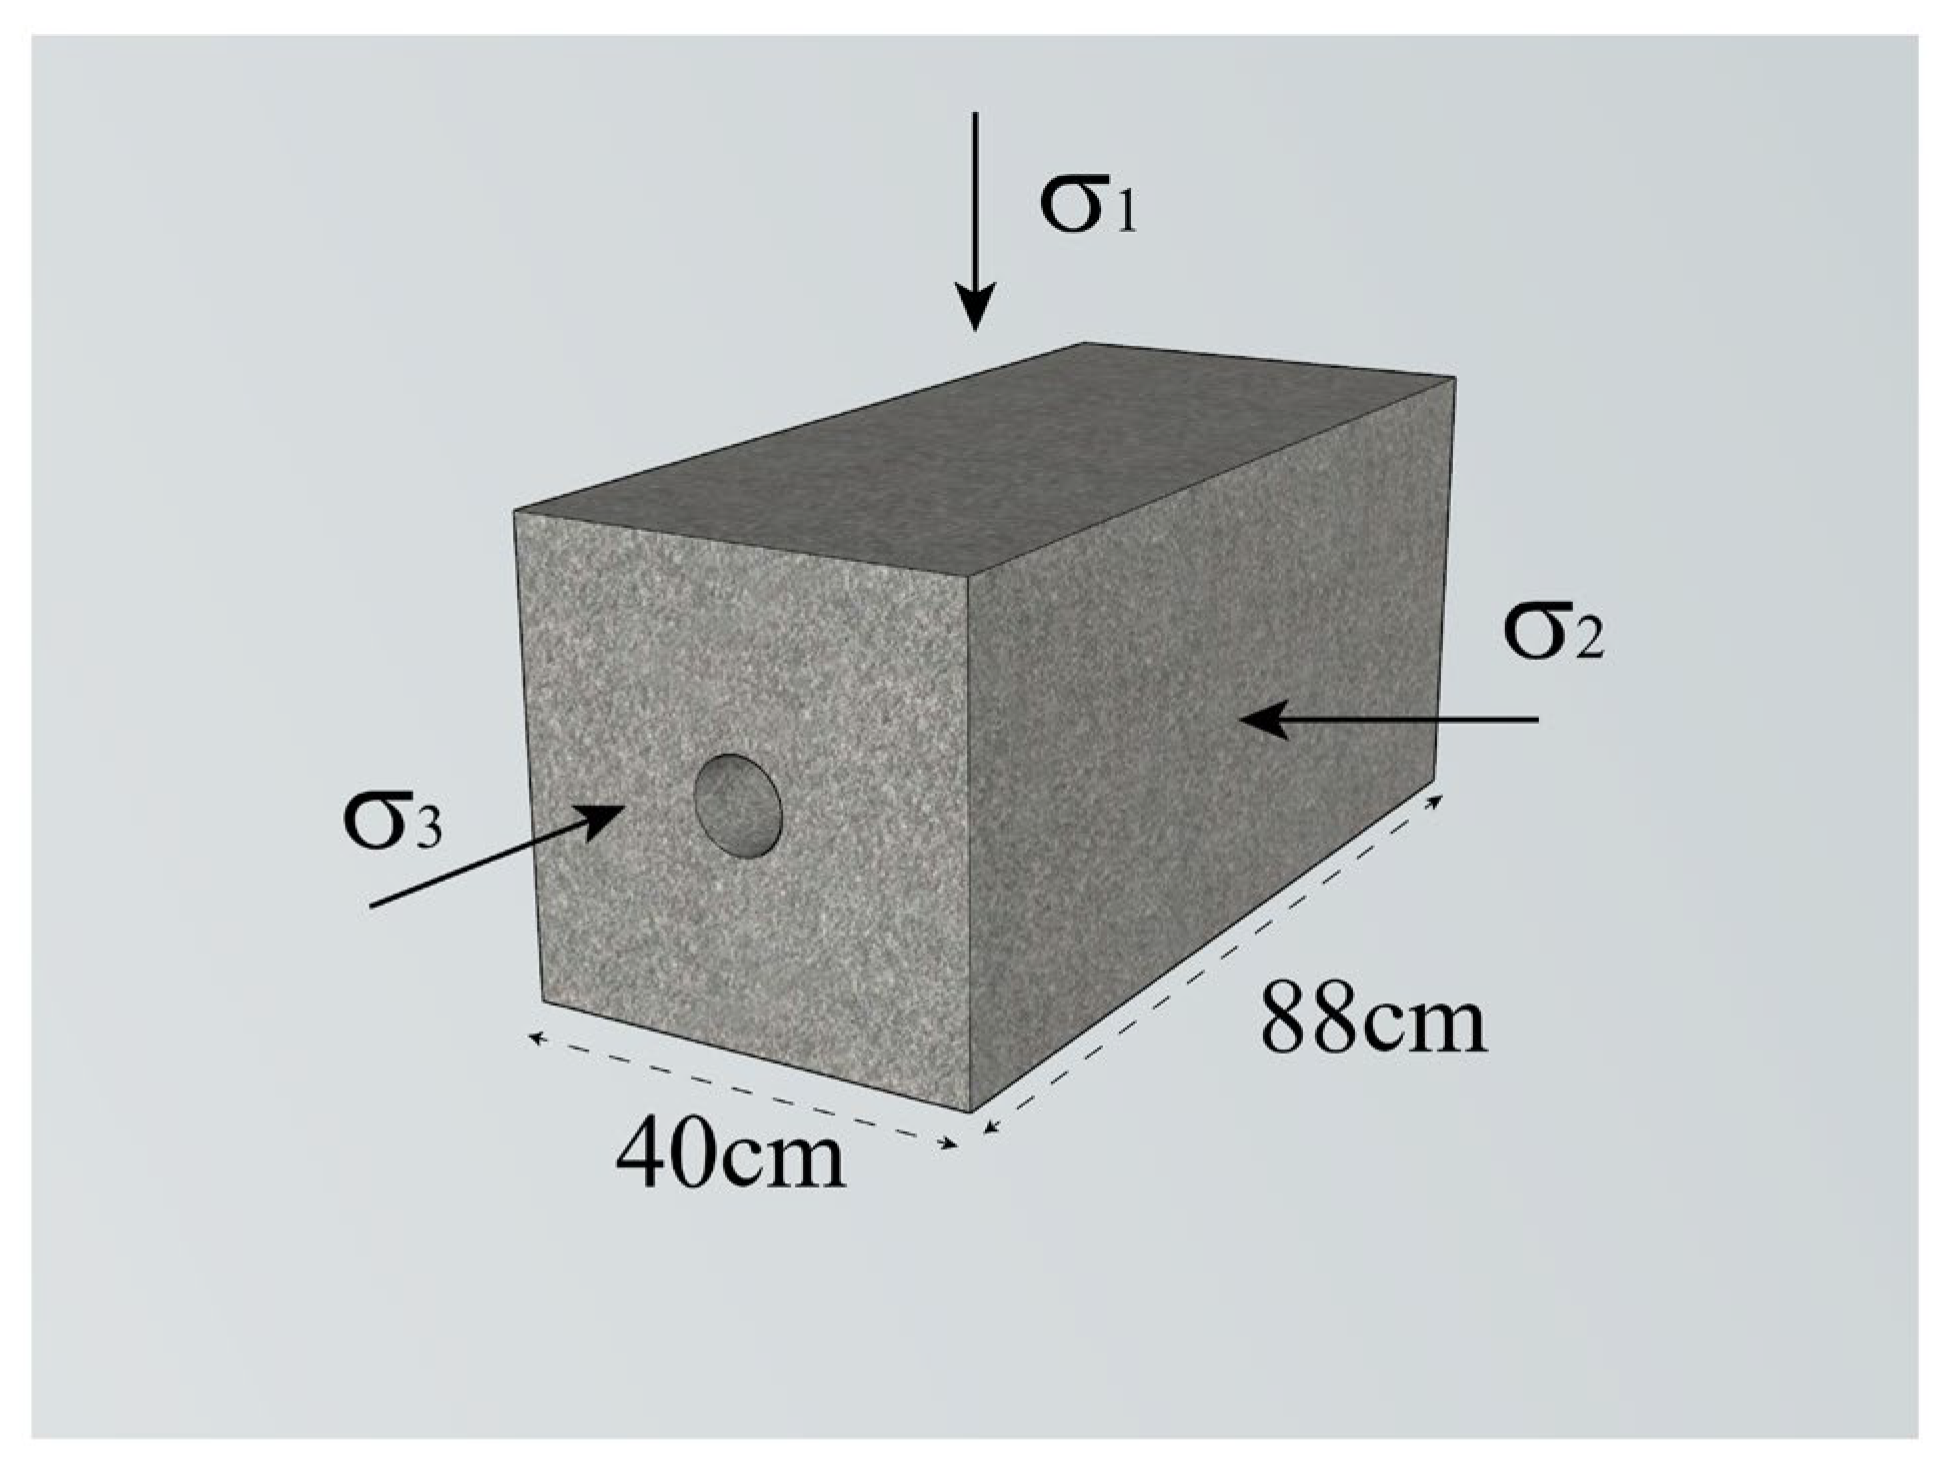
To obtain the high initial triaxial stress status of the model, we limited the size of the model chamber to 40 cm × 40 cm × 88 cm (lateral × horizontal × axial right), with this size each direction could apply 2MPa of stress;
(2)
Disc springs (Figure 2b) were installed between the hydraulic cylinder and the loading plate to simulate the infinite boundary of the surrounding rocks;
(3)
Polyvinyl chloride layer was pasted onto the scaled model to reduce the friction between the model and chamber.
The stiffness of disc springs should be of proper value according to the following equation:
K = E 1 + ν r    
where E is the elastic model of the similar material, ν   is Poisson’s ratio of the similar material, and r is the distance to the outline of the tunnel.
An excavation of the tunnel in DRSTA was performed with a self-designed drilling machine; the schematic and picture of the drilling machine are shown in Figure 3. The cutter of the drilling machine is driven by a horizontal motor. The cutter rotated at a very slow speed, which made little disturbance during the excavation.

4.2. Scale-Model Testing Design

The following similar principles should be satisfied in scale-model testing [20,21]:
C σ = C γ C L
C δ = C ε C L
C σ = C ε C E
where C σ , C γ , C L , C δ , C ε   , and C E are the scale factors of stress, volume–weight, geometry, displacement, strain, and elastic modulus, respectively.
The scale factor of dimensionless physical variable C ε   is always equal to 1. The volume–weight of the similar material is hardly changeable, so C γ is set to 1, then the scale factor of other variables is equal to C L . C L is the key scale factor to be determined in this scale-model testing. As the size of the pressure chamber is limited to 40 cm × 40 cm × 88 cm, the dimensions of the scale-model are immutable. The diameter of the Jinping II headrace tunnel is 6 m. The diameter of the scaled tunnel and dimensions of the model should be in proper proportion to reduce the influence of the boundary. With C L = 1:75, the diameter of the scaled tunnel is 8 cm, which occupies 20% of the overall model range. The size of the tunnel is small enough to reduce the boundary effects, but not too small to drill. The dimension and loading scheme of the scaled model are shown in Figure 4.
The geostress of the Jinping II headrace tunnel could be evaluated with the σ h = γ h equation, for the testing segment γ = 2770 kg/m3, and h = 2375 m, thus, σ h = 66 MPa. The stress scale factor is C σ = C L = 1:75. Thus, the scaled stress should be 0.88 MPa. Here, the conducted scale-model was tested twice, the first time with isotropic geostress, the second with anisotropic geostress. The loaded stresses in the scale-model are listed in Table 1.

4.3. Similar Material of the Deep Brittle Rock

According to the similarity theory, the prototype and model must satisfy the equilibrium equations, geometric equations, physical equations, stress–boundary conditions, and displacement–boundary conditions [21]. Similar material of the deep brittle rock was developed with barite powder, quartz powder, iron mineral powder, and rosin [22]. The scale factor was selected as 1:75. Table 2 lists the parameters of the rock prototype and similar materials.

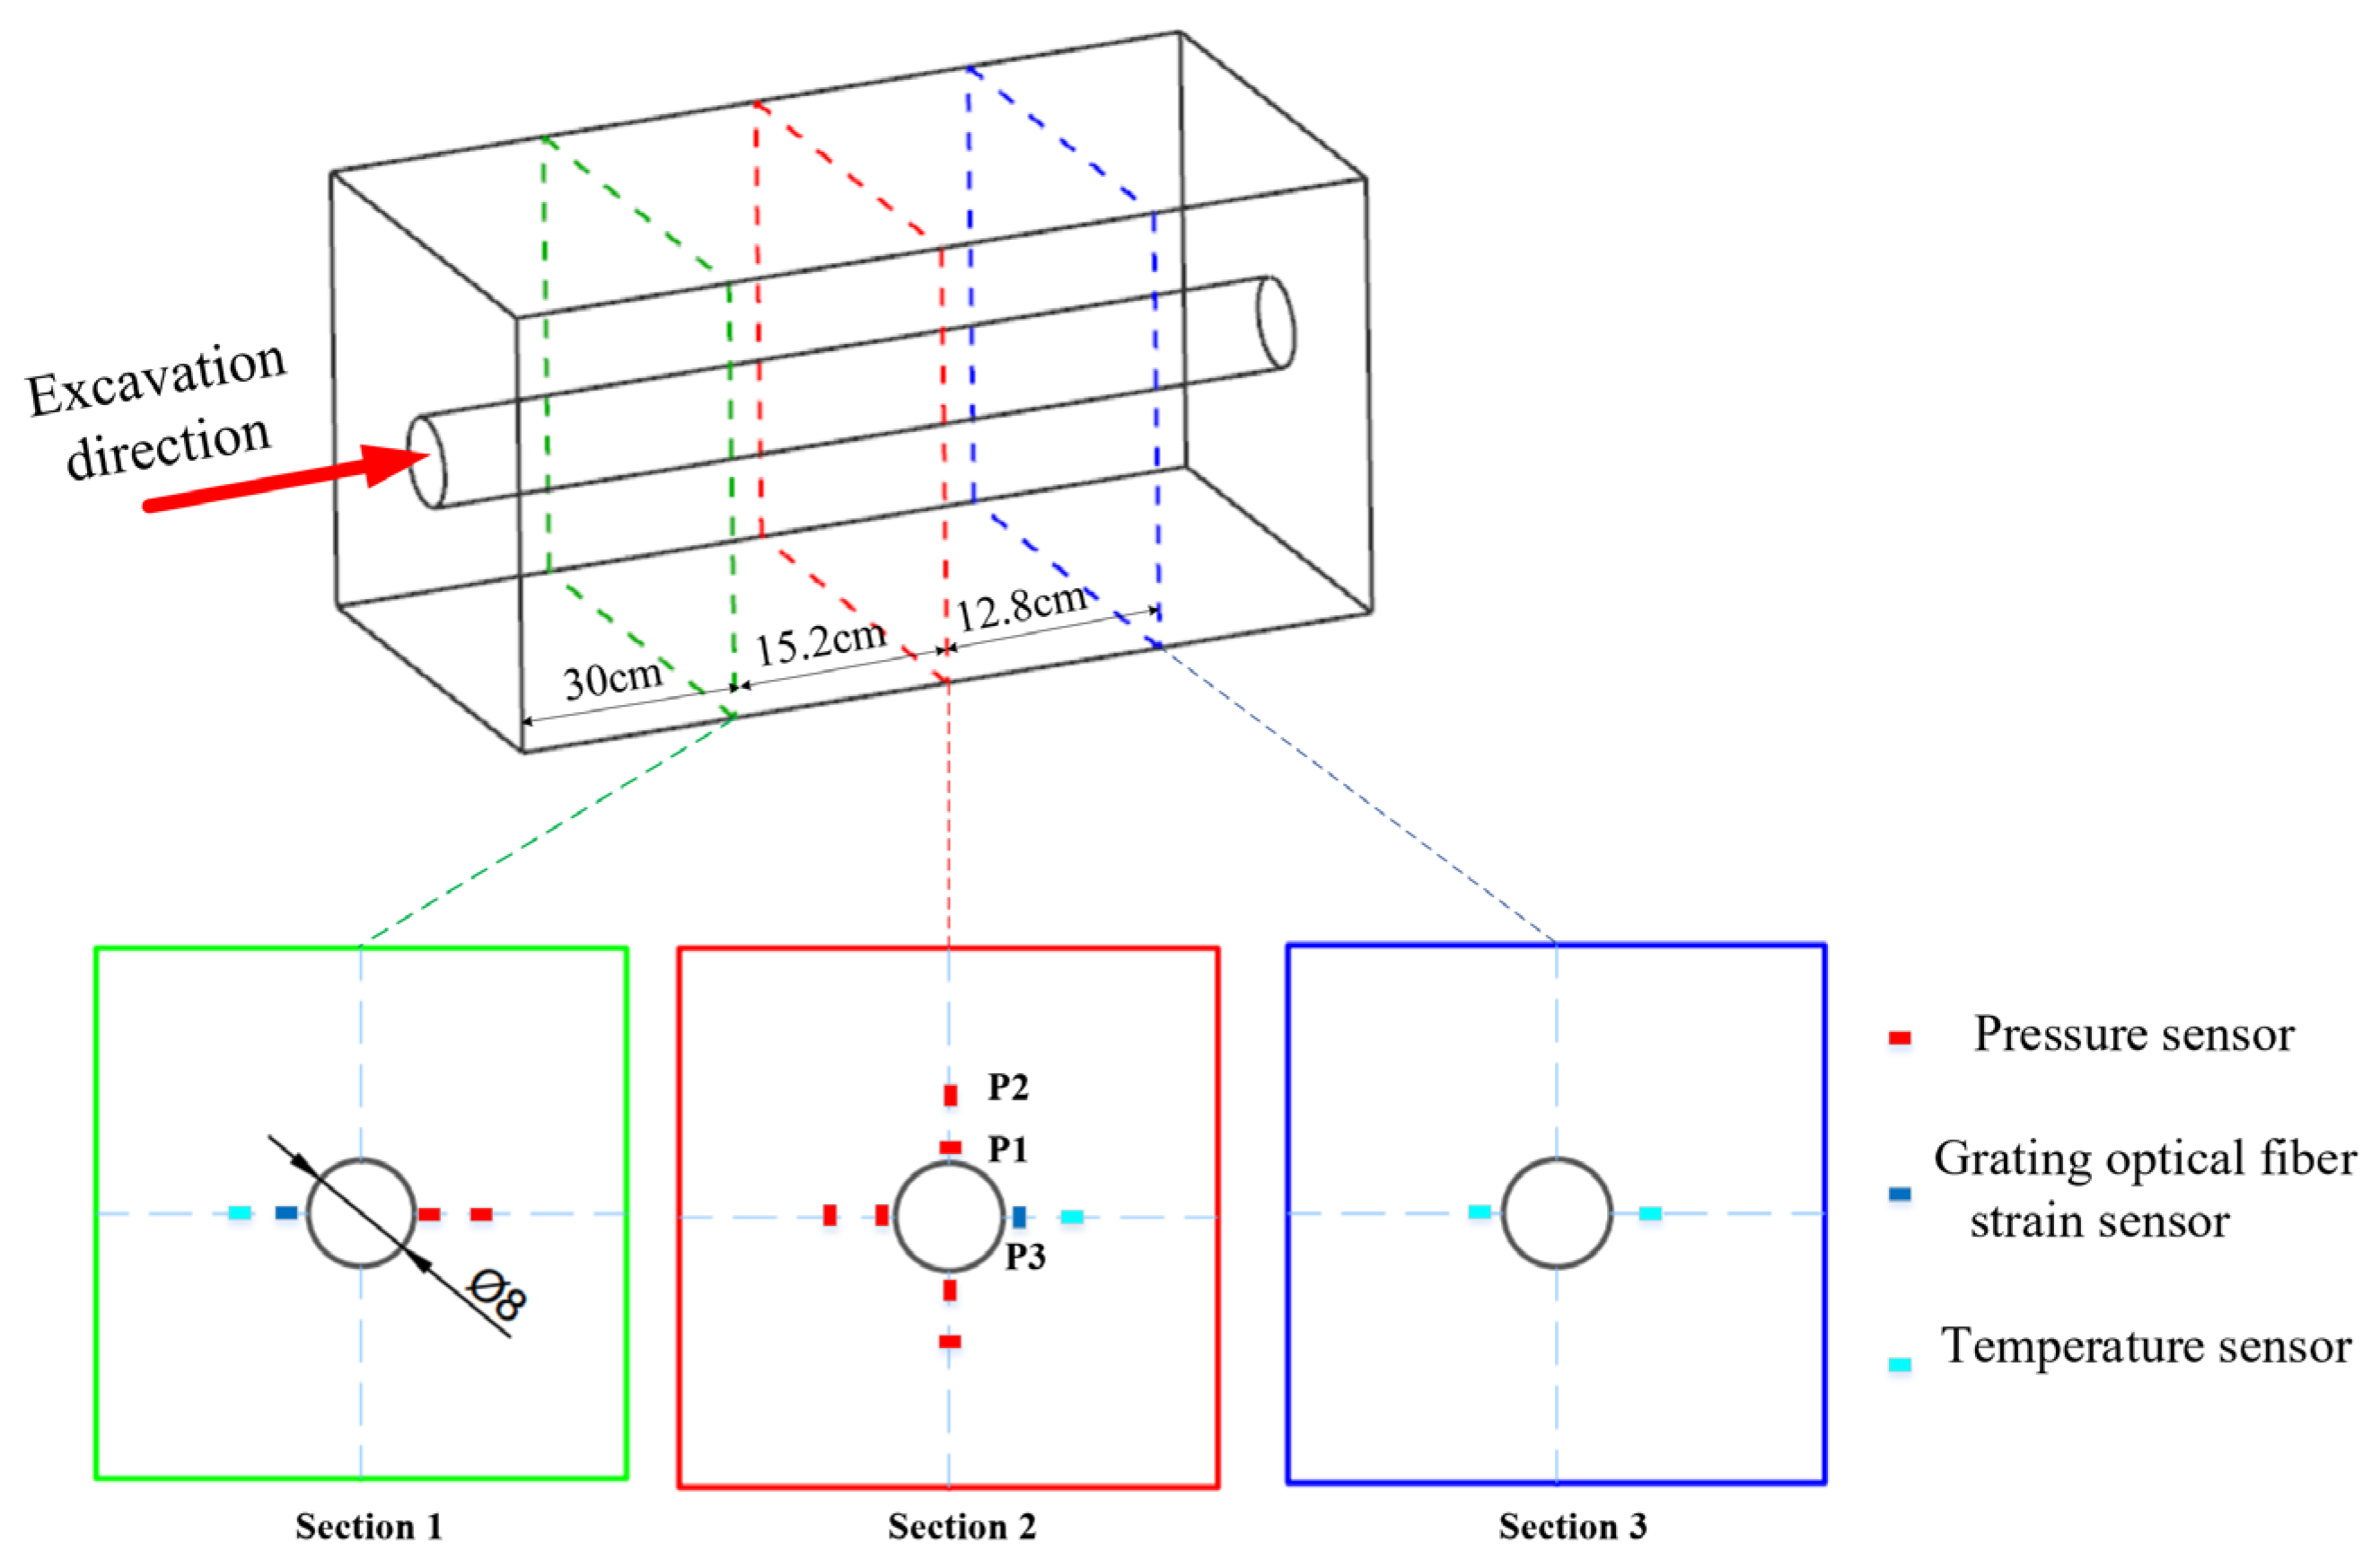
4.4. Monitoring System

During excavation, the stress and strain were monitored with a pressure sensor and optical fibre strain sensor, respectively. Temperature sensors were installed in the scale-model to correct the monitoring data of the strain. The middle section of the model was the privileged section for arranging sensors because it could minimize the boundary effect of the test. However, the cross-sectional area near the tunnel was too small to accommodate all the sensors. We added two more measurement sections at a distance of about 12 cm from the middle section. All kinds of sensors were arranged in the middle section, including a pressure sensor, grating optical fibre strain sensor, and temperature senor. A small number of sensors were placed in other sections for data comparison and verification. The location of the sensors is shown in Figure 5. Sensors are connected with two computers with hubs, and every 1 s computers read data from sensors.

4.5. Testing Results

The Jinping II headrace tunnel was excavated 4 m–5 m per step, with the scale factor of 1:75; the excavation length was set to 7 cm per step. During the testing, the total length of 70 cm of the tunnel were excavated (total length 88 cm). Each step of the excavation lasted 10 min, and then we waited for 10 min to observe the failure process. The strain and stress results were monitored by the sensors, while the failure mode and delayed failure time were recorded based on observation.

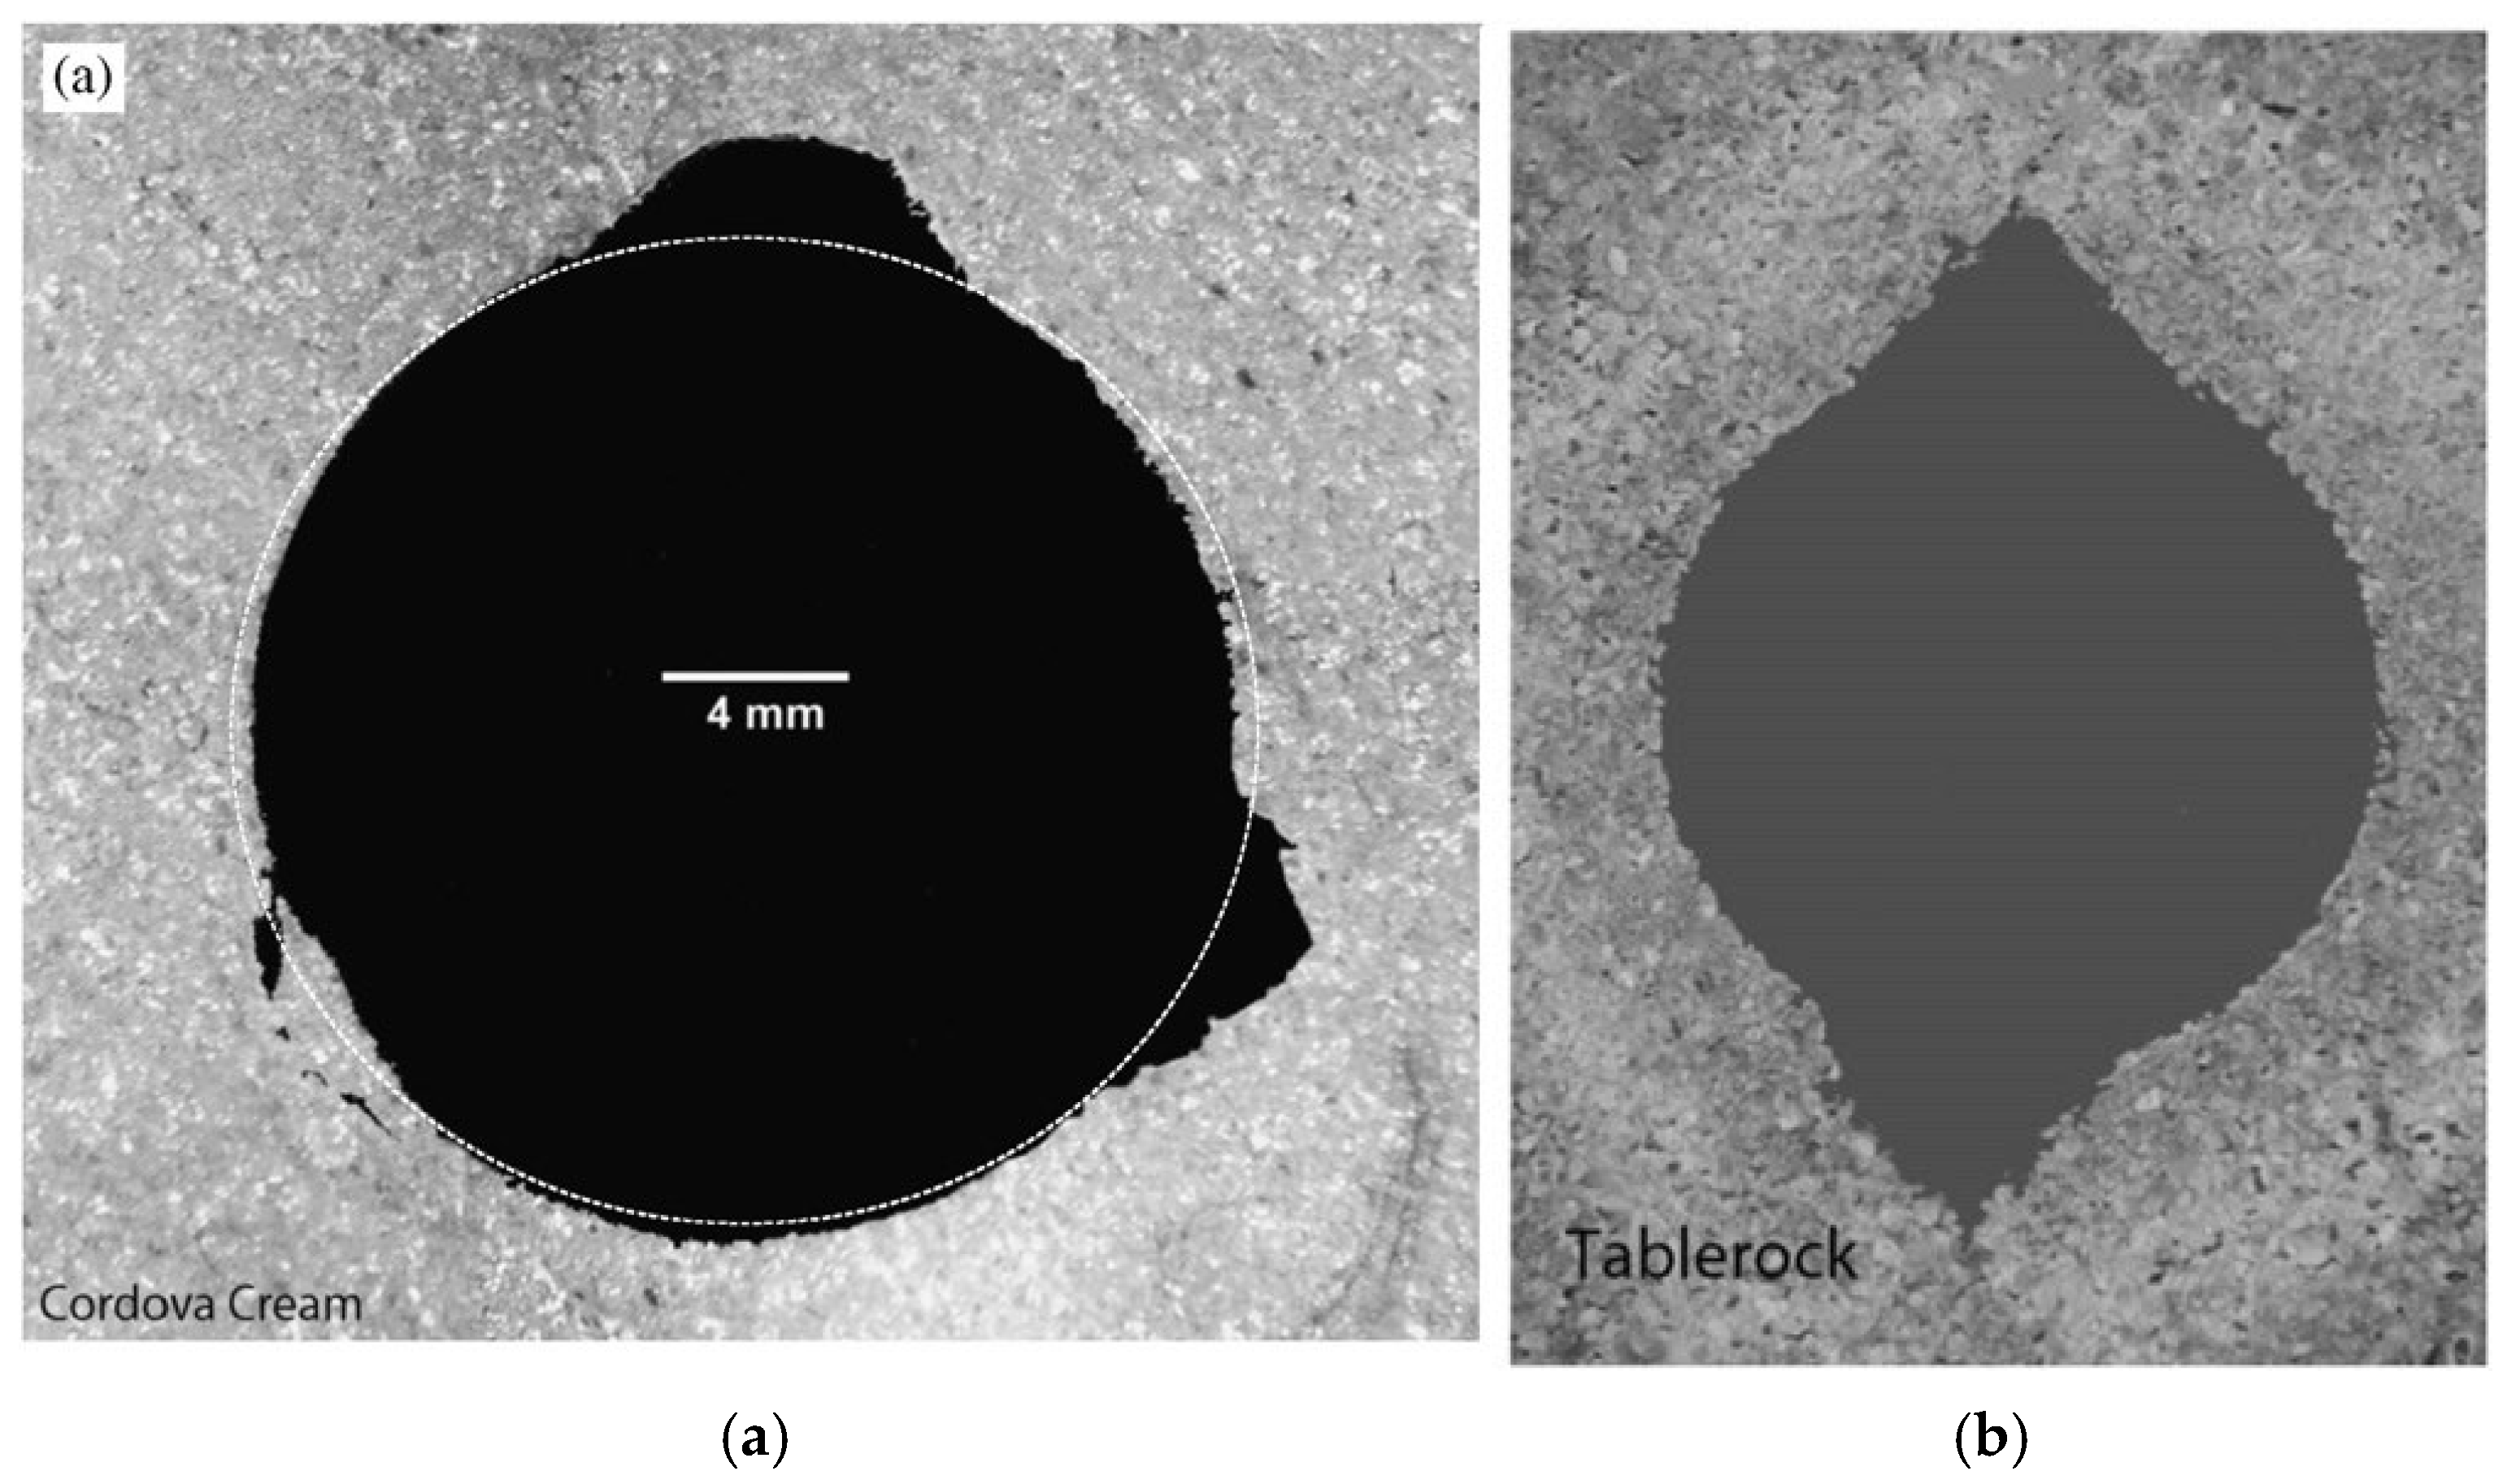
4.5.1. Failure Shape of the Tunnel

The failure shape of the tunnel in Section 2 (Figure 5) could be found in Figure 6. The failure boundary under isotropic geostress was fairly smooth, while under anisotropic geostress, a standard dog-eared breakdown shape was found. Similar failure boundaries could be found in Haimson’s research shown in Figure 7. Under isotropic geostress, Figure 7a breakdown blocks are located more randomly, while in Figure 7b the breakdown shape was more like a dog ear located on the top-bottom side. Our results with anisotropic geostress indicated the loss of the bottom dog ear (Figure 6b), which might be because of the dropping material filling up the bottom failure zone; however, the bottom breakdown should still exist. In Haimson’s tests the tunnel is excavated vertically, thus, its bottom dog-eared breakdown would not be influenced by gravity. The tunnel was stable during the first 24 h after the excavation; after that, small sizes of similar material dropped down. The rockburst breakdown under the isotropic geostress was occurring up until 56 h after excavation. While under the anisotropic geostress condition, the tunnel remained stable for the first 6 h, and then fracture events happened, rockburst phenomena with large blocks kept dropping; this happened from 6 h to 72 h after the excavation. No failure event happened after 72 h after the excavation.

4.5.2. Loop Stress Changes During Excavation

Loop stress   σ θ was monitored with pressure sensors; data of sensors P1 and P2 are shown in Figure 8. In Figure 8a, σ θ first gently increases during excavation for the isotropic geostress condition and then decreases abruptly when excavated. For the anisotropic geostress condition, only a decreasing process could be found. From an analytical solution of the tunnel, we can learn that σ θ increases in the elastic surrounding rock of an tunnel. Only when the surrounding rock turned into plastic or failure status, the σ θ would drop down. Therefore, under isotropic geostress, during excavation the status of surrounding rocks will first be elastic, then turn into plastic status. While under anisotropic geostress, the status of surrounding rocks is more likely to turn to plastic immediately after the excavation; the elastic process of the surrounding rock is almost invisible in Figure 8b.

4.5.3. Strain Monitoring Data

Under anisotropic geostress all strain sensors lost signal probably due to the large deformation destroying the strain gauges or connection wires. Therefore, the strain monitoring data were obtained only under the isotropic geostress condition. Figure 9 shows the results of the loop strain and radial strain data by monitoring. The radial strain increases more gently than the loop strain; the loop strain shows abrupt change when the tunnel face was being excavated. These results could explain the phenomenon of the rapture path that mainly follows the loop direction.

5. Delayed Failure Time Simulation of the Scale-Model Testing

5.1. Delayed Failure Mechanism and Model Review of the Brittle Rock

The lifetime of rocks is governed by sub-critical and critical crack growth. Above the critical value crack propagation speed reaches high values up to the speed of surface waves. Below a critical value given by a specific value for the stress intensity factor (or energy release rate or J-Integral) the crack growth is called sub-critical. The delayed failure time, called time-to-failure is defined as the time from the start of the sub-critical crack growth to the start of the critical crack growth. The common implementation on rock delayed failure is an exponential relation (Equation (5)) based on the rate process theory; the average time-to-failure is related to the applied stress [23,24].
t f = t 0 exp b σ σ 0
where σ 0 is a reference stress, t 0 is the time-to-failure under stress level σ 0 , b is a constant.
Equation (5) states that over the range of σ L < σ < σ N   for a given material having a characteristic value, the logarithm of the normalized time-to-failure is shown to be a “universal” linear function of the normalized applied stress. Hillig provides the upper cutoff σ N and the lower threshed σ L , where σ N is the failure stress determined at liquid nitrogen temperature, σ L is termed “the fatigue limit”, and in rock mechanics it is also termed long-term strength f 3 [25].
During the design of our similar material, elastic and plastic characteristics are considered; however, the complex laws for time-dependent parameters need to be involved in similar. The time-to-failure parameters of our similar material are independent with the real tunnel. However, the parameters were tested by the creep time-to-failure tests and the parameters can be found in Table 3.

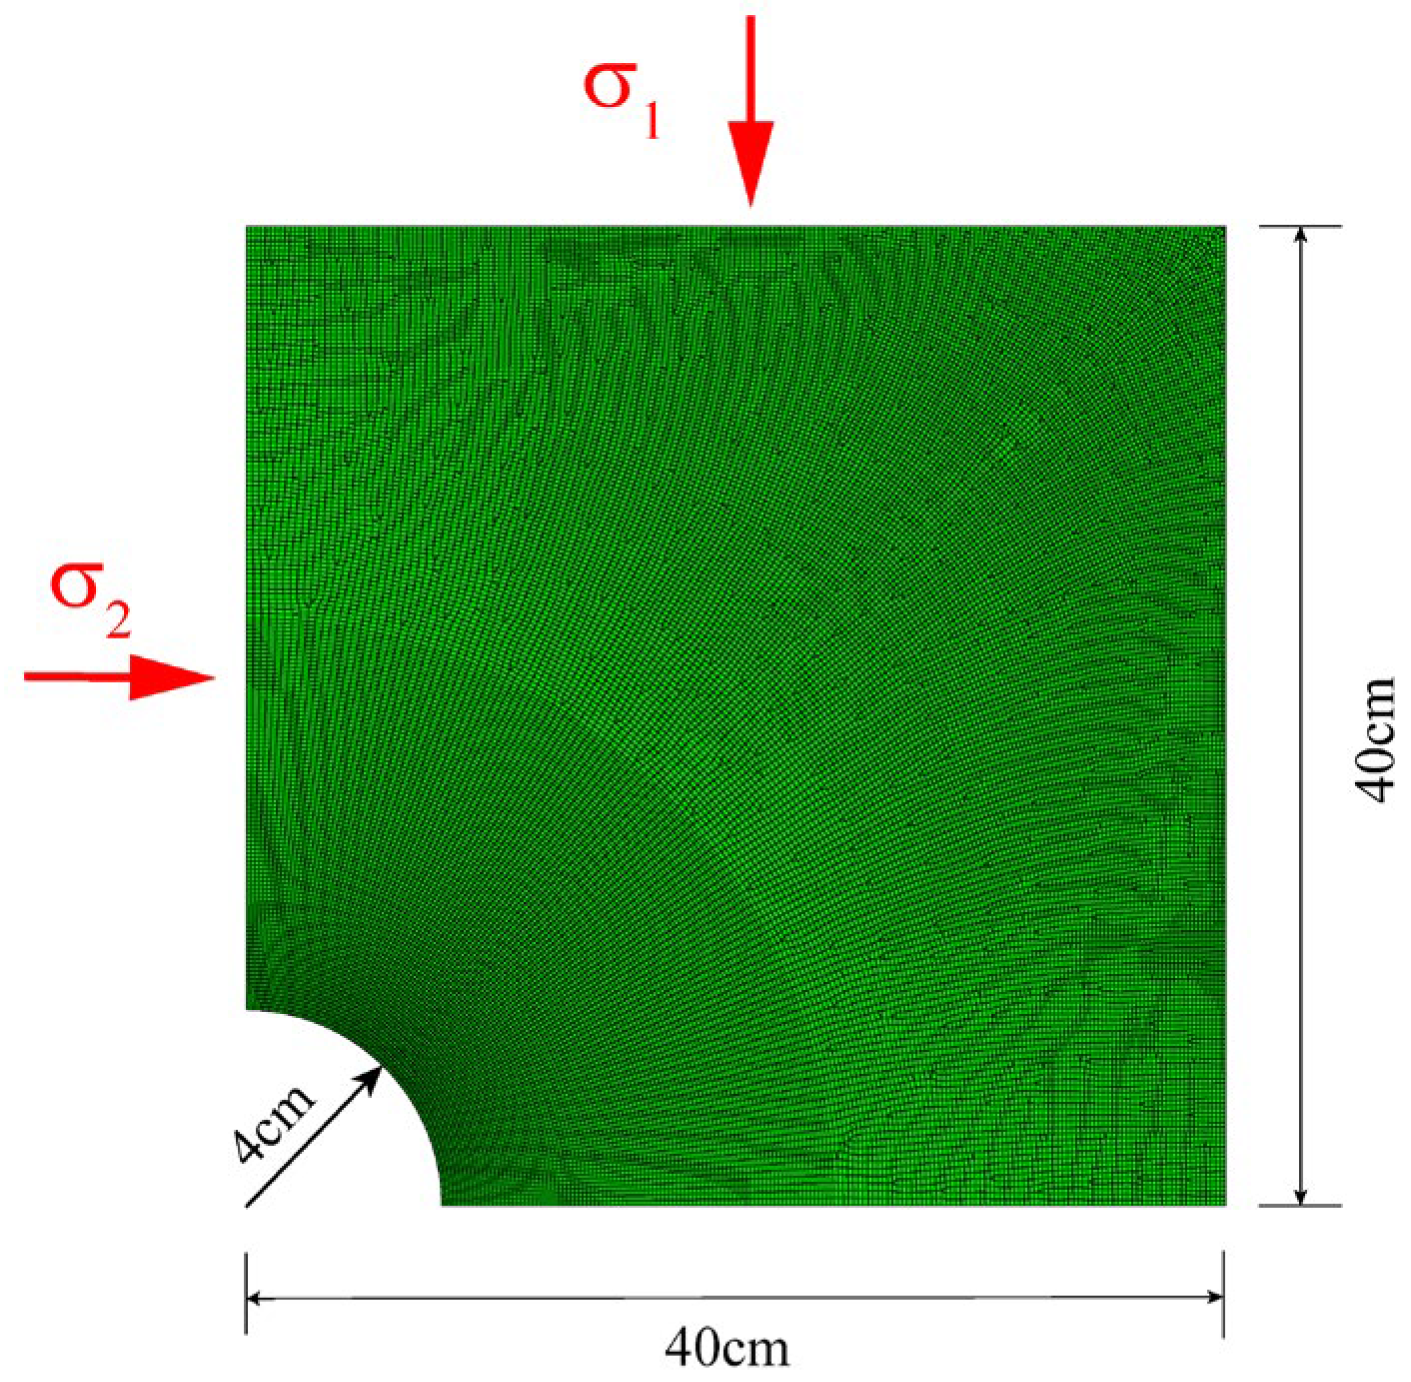
5.2. Numerical Model

The commercial finite element software Abaqus, version 6.20, was used in the simulation. To increase computational efficiency, a 3D sliced model orthogonal to the tunnel axis was built, instead of using a whole 3D model (Figure 10). The initial stress field was applied to the modelled domain. Boundary conditions were chosen the same as the scale-model testing, the outer boundary was compressed by pressure in Table 1, inner nodes of the tunnel wall were free. Using these boundary conditions, the analytical solutions for stresses around the tunnel were matched well. At the beginning of the simulation the nodes at the tunnel wall were fixed to simulate the undisturbed rock. Drilling of the tunnel was simulated by instantaneous release of this boundary condition.
To calculate the time-to-failure we employed Equation (5). In Equation (5), Amitrano proposed that σ is the mean major stress, which is typically the vertical stress in a uniaxial compressive test [26]. Schoenball proposed the hoop stress σ θ is the principal stress determining failure at the tunnel wall [25]; thus, here we replaced the σ in Equation (5) with σ θ . The hoop stress is obtained from the Cartesian stress components σ x , σ y , and the in-plane shear stress τ x y as follows:
σ θ = 1 2 σ x + σ y 1 2 σ x σ y cos 2 θ τ x y sin 2 θ
The elastic constitutive model was used in the simulation to obtain the initial hoop stress at the beginning of the excavation. Instantly after the excavation, the status of the surrounding rock would be elastic, then turn into plastic, and finally rockburst. Therefore, the loop stress status can be calculated with the elastic model. The model could be written as follows:
σ = D ε
where, σ is stress tensor, ε is the strain tensor, D is the stiffness matrix, which can be written as follows:
D = E ( 1 + μ ) ( 1 2 μ ) 1 μ μ μ μ 1 μ μ μ μ 1 μ 1 2 μ 2 1 2 μ 2 1 2 μ 2
The parameters of the stiffness matrix were applied to the values in Table 2.

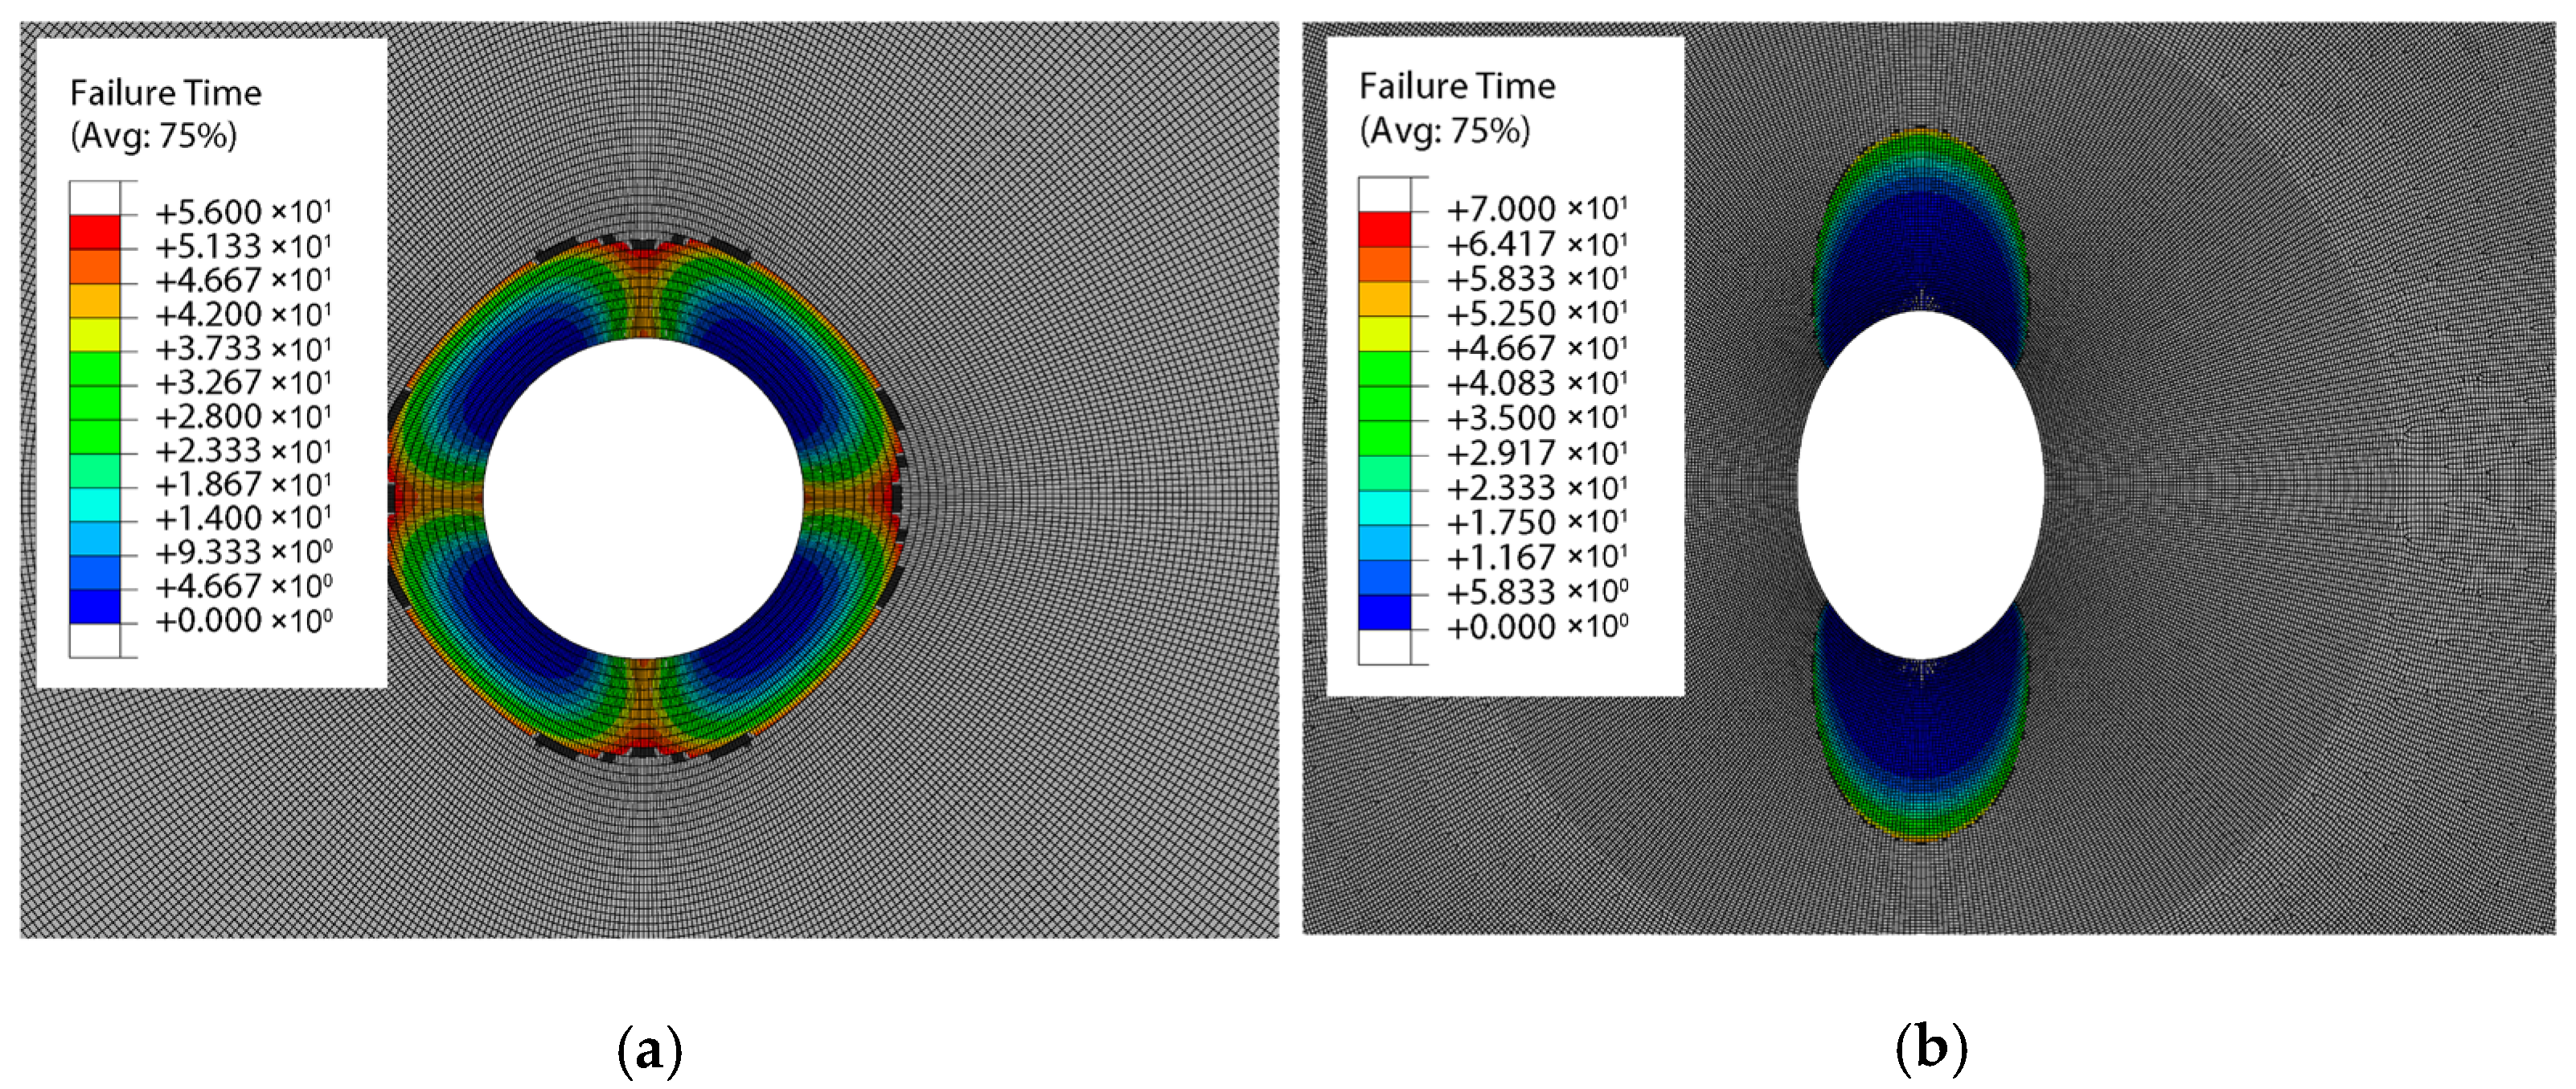
5.3. Simulation Results

For Equation (5), when stress level is less than the long-term strength f 3 , the time-to-failure is extremely long. The long-term strength is about 0.4–0.6 of the uniaxial strength [27]. Here, we selected the 0.5 multiple with strength σ 0 to obtain f 3 ; the failure time (time-to-failure) results can be found in Figure 11. The failure mode mainly matches the scale-model testing results on the maximum failure range, maximum failure position, and maximum failure time. Under the isotropic geostress, the maximum failure time is 56 h, same as the scale-model testing. The failure shape of the numerical result shows more average compared with the random depth of failure in the scale-model testing. Under the anisotropic geostress, the maximum failure time is 70 h, almost the same as the scale-model testing. The horizontal failure zone does not appear in Figure 11b, probably due to the failure factor not being included σ θ . A comprehensive time-to-failure evaluation model including more factors still needs to be investigated in a further study.
Based on the delayed failure theory, the predicted failure mode by numerical simulation mainly matches the scale-model testing results with the maximum failure range, maximum failure position, and maximum failure time. The delayed failure model was verified by laboratory tests, but since the exact time-scaled material was hard to obtain, the corresponding delayed failure time of real engineering has still not been checked. Further studies will focus on the real engineering issues. In Figure 6b, similar rocks fall down or burst out block by block; this phenomenon is similar to the rockbursts in the Jinping II headrace tunnel. Figure 12 shows the time-to-failure values at different distances to the wall of the tunnel. The value at the nodes far from the tunnel wall is an extensive number. To demonstrate the time-to-failure in the figure, we set the number to 0 in the simulations. The range of the surrounding rocks value of time-to-failure was about 0.8 cm under isotropic geostress 4.5 cm under anisotropic geostress. The trend of the value first decreased then increased back under isotropic geostress, while the value kept increasing under the anisotropic geostress. Furthermore, the current theory is implemented into the FEM code based on continuous mechanics, the characteristic block size still could not explain what delayed our failure model. The discontinuity factors should be considered in further studies.

6. Conclusions

To investigate the mechanism of the delayed failure in brittle rock tunnel, this paper performed scale-model tests and numerical simulations based upon the Jinping II headrace tunnelling project. The following conclusions have been obtained:
(1)
The scale-model test results show that the failure shape under isotropic geostress has a smooth circle boundary; the delayed failure time is 56 h. While under anisotropic geostress, the failure shape has a dog-eared breakdown; the delayed failure time is 72 h.
(2)
The failure mode obtained in the scale-model tests indicates that the loop stress of the tunnel surrounding rock is the main factor for the delayed failure. Under the isotropic geostress condition, the loop stress increases shortly after excavation, and then abruptly drops down. For the anisotropic geostress condition, the loop stress only has a decreasing tend. The surrounding rocks turn from elastic to rapidly plastic after excavation, the turnaround time for this status is shorter for anisotropic geostress.
(3)
In the scale-model tests the radial strain increases more slowly during the failure process; the loop strain shows an abrupt change. These results explain the phenomenon of the rapture interfaces mainly following loop direction.
(4)
The implementation of the rock delayed failure on an exponential relation was used in the FEM code. The failure time and failure mode results are obtained by numerical simulations. The predicted failure mode obtained by the numerical simulation matches the scale-model testing results, both on the failure boundary and delay failure time. The delayed failure mechanism of the deep brittle rock tunnel was verified by laboratory tests and numerical simulations.

Author Contributions

Conceptualization, N.Z.; methodology, N.Z.; software, N.Z.; validation, N.Z.; formal analysis, N.Z. and Z.C.; investigation, N.Z. and Z.C.; data curation, N.Z.; writing—original draft preparation, N.Z.; writing—review and editing, Z.C.; visualization, N.Z.; supervision, N.Z.; project administration, N.Z.; funding acquisition, N.Z.; All authors have read and agreed to the published version of the manuscript.

Funding

This research was funded by the National Natural Science Foundation of China (No. 51709268).

Institutional Review Board Statement

Not applicable.

Informed Consent Statement

Not applicable.

Data Availability Statement

The data that support the findings of this study are available from the corresponding author, upon reasonable request.

Acknowledgments

We are grateful to the High Performance Computing Center of Nanjing Tech University for supporting the computational resources.

Conflicts of Interest

The authors declare no conflict of interest.

References

  1. Malan, D.F. Manuel Rocha Medal Recipient Simulating the Time-Dependent Behaviour of Excavations in Hard Rock. Rock Mech. Rock Eng. 2002, 35, 225–254. [Google Scholar] [CrossRef]
  2. Zhai, S.; Su, G.; Yin, S.; Zhao, B.; Yan, L. Rockburst Characteristics of Several Hard Brittle Rocks: A True Triaxial Experimental Study. J. Rock Mech. Geotech. Eng. 2020, 12, 279–296. [Google Scholar] [CrossRef]
  3. Keneti, A.; Sainsbury, B.A. Review of Published Rockburst Events and Their Contributing Factors. Eng. Geol. 2018, 246, 361–373. [Google Scholar] [CrossRef]
  4. Zorin, A.N. Rock Bursts in Deep Mine Workings. Sov. Min. Sci. 1970, 6, 486–490. [Google Scholar] [CrossRef]
  5. Tan, T.K.; Kang, W.F. Locked in Stresses, Creep and Dilatancy of Rocks, and Constitutive Equations. Rock Mech. Felsmech. Mécanique Des Roches 1980, 13, 5–22. [Google Scholar] [CrossRef]
  6. Li, S.; Feng, X.T.; Li, Z.; Chen, B.; Zhang, C.; Zhou, H. In Situ Monitoring of Rockburst Nucleation and Evolution in the Deeply Buried Tunnels of Jinping II Hydropower Station. Eng. Geol. 2012, 137–138, 85–96. [Google Scholar] [CrossRef]
  7. Malan, D.F.; Napier, J.A.L. Rockburst Support in Shallow-Dipping Tabular Stopes at Great Depth. Int. J. Rock Mech. Min. Sci. 2018, 112, 302–312. [Google Scholar] [CrossRef]
  8. He, M.; Li, J.; Ren, F. Rock Burst Criterion Based on Clay Mineral Content. Arab. J. Geosci. 2020, 13, 185. [Google Scholar] [CrossRef]
  9. Guo, W.; Li, Y.; Yin, D.; Zhang, S.; Sun, X. Mechanisms of Rock Burst in Hard and Thick Upper Strata and Rock-Burst Controlling Technology. Arab. J. Geosci. 2016, 9, 561. [Google Scholar] [CrossRef]
  10. Feng, X.; Chen, B.; Ming, H.; Wu, S.; Xiao, Y.; Feng, G.; Zhou, H.; Qiu, S. Evolution Law and Mechanism of Rockbursts in Deep Tunnels: Immediate Rockburst. Chin. J. Rock Mech. Eng. 2012, 31, 433–444. [Google Scholar]
  11. Li, X.; Konietzky, H. Time to Failure Prediction Scheme for Rocks. Rock Mech Rock Eng. 2014, 47, 1493–1503. [Google Scholar] [CrossRef]
  12. Liu, H.; Li, L.; Li, S.; Yang, W. The Time-Dependent Failure Mechanism of Rocks and Associated Application in Slope Engineering: An Explanation Based on Numerical Investigation. Math Probl. Eng. 2020, 2020, 1680265. [Google Scholar] [CrossRef]
  13. Wang, M.; Cai, M. A Grain-Based Time-to-Failure Creep Model for Brittle Rocks. Comput. Geotech. 2020, 119, 103344. [Google Scholar] [CrossRef]
  14. Gao, A.; Qi, C.; Shan, R.; Wang, C. Predicting Time-to-Failure of Red Sandstone by Temporal Precursor of Acoustic Emission Signals. Geofluids 2022, 2022, 8063469. [Google Scholar] [CrossRef]
  15. Kovrizhnykh, A.M.; Baryshnikov, V.D.; Khmelinin, A.P. Determining Time-to-Failure in Rocks Using Long-Term Strength Criterion. J. Min. Sci. 2023, 59, 911–918. [Google Scholar] [CrossRef]
  16. Chen, S.; Zhao, P.; Jiao, Z.; Zhou, J.; Tang, X. Time-Lag Characteristics and Strength Evolution of Rock Failure under Unloading Conditions. Phys. Fluids 2025, 37, 054106. [Google Scholar] [CrossRef]
  17. Tang, C.; Wang, J.; Zhang, J. Preliminary Engineering Application of Microseismic Monitoring Technique to Rockburst Prediction in Tunneling of Jinping II Project. J. Rock Mech. Geotech. Eng. 2010, 2, 193–208. [Google Scholar] [CrossRef]
  18. Fan, Y.; Cui, X.; Leng, Z.; Zheng, J.; Wang, F.; Xu, X. Rockburst Prediction From the Perspective of Energy Release: A Case Study of a Diversion Tunnel at Jinping II Hydropower Station. Front. Earth Sci. 2021, 9, 711706. [Google Scholar] [CrossRef]
  19. Zhao, Z.N.; Feng, X.T.; Chen, T.Y.; Feng, G.L.; Liu, G.F.; Duan, S.Q. Correlation between Time-Delayed Rockburst and Blasting Disturbance in Deep-Buried Tunnel. Rock Characterisation, Modelling and Engineering Design Methods. In Proceedings of the 3rd ISRM SINOROCK 2013 Symposium, Shanghai, China, 18–20 June 2013; pp. 773–776. [Google Scholar] [CrossRef]
  20. Fumagalli, E. Statical and Geomechanical Models; Springer: Berlin/Heidelberg, Germany, 1973. [Google Scholar]
  21. Zhang, Q.; Liu, C.; Duan, K.; Zhang, Z.; Xiang, W. True Three-Dimensional Geomechanical Model Tests for Stability Analysis of Surrounding Rock During the Excavation of a Deep Underground Laboratory. Rock Mech. Rock Eng. 2020, 53, 517–537. [Google Scholar] [CrossRef]
  22. Zhu, W.S.; Zhang, Q.B.; Zhu, H.H.; Li, Y.; Yin, J.-H.; Li, S.C.; Sun, L.F.; Zhang, L. Large-Scale Geomechanical Model Testing of an Underground Cavern Group in a True Three-Dimensional (3-D) Stress State. Can. Geotech. J. 2010, 47, 935–946. [Google Scholar] [CrossRef]
  23. Hillig, W.B. The C-H Delayed Failure Mechanism Revisited. Int. J. Fract. 2006, 139, 197–211. [Google Scholar] [CrossRef]
  24. Schoenball, M.; Sahara, D.P.; Kohl, T. Time-Dependent Brittle Creep as a Mechanism for Time-Delayed Wellbore Failure. Int. J. Rock Mech. Min. Sci. 2014, 70, 400–406. [Google Scholar] [CrossRef]
  25. Wang, M.; Zhang, N.; Li, J.; Ma, L.; Fan, P. Computational Method of Large Deformation and Its Application in Deep Mining Tunnel. Tunn. Undergr. Space Technol. 2015, 50, 47–53. [Google Scholar] [CrossRef]
  26. Amitrano, D.; Helmstetter, A. Brittle Creep, Damage, and Time to Failure in Rocks. J. Geophys. Res. Solid Earth 2006, 111, 1–17. [Google Scholar] [CrossRef]
  27. Hoek, E.; Martin, C.D. Fracture Initiation and Propagation in Intact Rock—A Review. J. Rock Mech. Geotech. Eng. 2014, 6, 287–300. [Google Scholar] [CrossRef]
Figure 1. Jinping II headrace tunnel project schematics [18]: (a) project location; (b) geological conditions.
Applsci 15 07496 g001
Figure 2. Deep rock scale-model testing apparatus: (a) apparatus; (b) pressure chamber.
Applsci 15 07496 g002
Figure 3. Tunnel drilling machine: (a) design schematic (1. flat drilling head; 2. screw drilling pipe; 3. rotating gearbox; 4. rotating stepper motor; 5. lead screw; 6. pushing gearbox; 7. pushing stepper motor; 8. slider; 9. displacement sensor; 10. slideway) and (b) photo of the drilling machine.
Applsci 15 07496 g003
Figure 4. The scaled model (scale factor 1:75).
Applsci 15 07496 g004
Figure 5. The monitoring sensors’ layout.
Applsci 15 07496 g005
Figure 6. The failure shape of the tunnel (blue line is the original boundary of tunnel, red line is the collapsed boundary): (a) isotropic geostress; (b) anisotropic geostress.
Applsci 15 07496 g006
Figure 7. Testing results by Haimson: (a) isotropic geostress; (b) anisotropic geostress.
Applsci 15 07496 g007
Figure 8. The stresses monitoring data: (a) isotropic geostress; (b) anisotropic geostress.
Applsci 15 07496 g008
Figure 9. The strain monitoring data (isotropic geostress only): (a) σ r ; (b) σ θ .
Applsci 15 07496 g009
Figure 10. The numerical model.
Applsci 15 07496 g010
Figure 11. The failure time of tunnel: (a) isotropic geostress; (b) anisotropic geostress.
Applsci 15 07496 g011
Figure 12. Time-to-failure values at different distance to the tunnel boundary.
Applsci 15 07496 g012
Table 1. Applied stress in the scaled model.
Loading Scheme σ 1 /MPa σ 2 /MPa σ 3 /MPa
Isotropic0.880.880.88
Anisotropic0.882.833.95
Table 2. Parameters of the materials.
ParametersPrototype RockSimilar Material
Density ρ/kg/m327.727.7
Elastic module E/MPa16,950232.0
Poisson’s ratio μ 0.230.23
Cohesive c/MPa1.10.02
Fiction angle ϕ / ° 44.544.9
Compression strength σ c /MPa70.00.79
Tension strength σ t /MPa500067.6
Table 3. Parameters of delayed failure of the similar material.
Parameters t 0 /s b σ 0 /MPa
Value2.0 × 101216.03.6
Disclaimer/Publisher’s Note: The statements, opinions and data contained in all publications are solely those of the individual author(s) and contributor(s) and not of MDPI and/or the editor(s). MDPI and/or the editor(s) disclaim responsibility for any injury to people or property resulting from any ideas, methods, instructions or products referred to in the content.

