Abstract
In cold regions, the rock mass of open-pit mine slopes is continuously exposed to freeze–thaw (FT) environments, during which the fracture structures and their infilling materials undergo significant degradation, severely affecting slope stability and the assessment of service life. Conventional laboratory FT tests are typically based on uniform temperature settings, which fail to reflect the actual thermal variations at different burial depths, thereby limiting the accuracy of mechanical parameter acquisition. Taking the Wushan open-pit mine as the engineering background, this study establishes a temperature–depth relationship, defines multiple thermal intervals, and conducts direct shear tests on structural plane filling materials under various FT conditions to characterize the evolution of cohesion and internal friction angle. Results from rock mass testing and numerical simulation demonstrate that shear strength parameters exhibit an exponential decline with increasing FT cycles and decreasing burial depth, with the filling material playing a dominant role in the initial stage of degradation. Furthermore, a two-dimensional fracture network model of the rock mass was constructed, and the representative elementary volume (REV) was determined through the evolution of equivalent plastic strain. Based on this, spatial assignment of slope strength was performed, followed by stability analysis. Based on regression fitting using 0–25 FT cycles, regression model predictions indicate that when the number of FT cycles exceeds 42, the slope safety factor drops below 1.0, entering a critical instability state. This research successfully establishes a spatial field of mechanical parameters and evaluates slope stability, providing a theoretical foundation and parameter support for the long-term service evaluation and stability assessment of cold-region open-pit mine slopes.
1. Introduction
Freeze–thaw (FT) cycles are recognized as one of the primary natural factors contributing to slope instability in open-pit rock slopes [1]. Investigating the damage characteristics of rock masses in FT regions is crucial for understanding FT-related geohazards in both alpine and seasonally frozen areas.
Natural rock masses, shaped by long-term tectonic activity, commonly contain structural planes such as faults, joints, and infill layers. Among these, structural planes play a key role in geohazards like landslides, with the stability often controlled by the properties of the infill materials within them.
Consequently, many researchers have conducted shear creep tests and developed corresponding models of structural planes, yielding substantial insights. Luo et al. [2] conducted direct shear tests on weak interlayer rock joints with varying filling ratios and moisture contents under multi-level normal stresses. The results showed that the peak shear strength of the weak interlayer joints first increased and then decreased with increasing water content, while it initially decreased and then stabilized with increasing filling ratio. Wu et al. [3] investigated the influence of infilling condition between weak layers on the shear strength and failure mode of rock masses through direct shear tests and predicted the effect of infill thickness on jointed rock mass shear strength by analyzing changes in apparent cohesion and internal friction angle. Naghadehi [4] studied the shear behavior of natural rock joints filled with clay, sand, and sandy clay, and proposed a new model to predict the shear strength of filled joints. Jahanian and Sadaghiani [5] examined the shear strength under forward and reverse shearing of artificially prepared rough joints with varying surface roughness and infill characteristics under constant normal load. Hu et al. [6] carried out direct shear tests under different saturation levels to quantitatively assess the effect of saturation on the shear behavior of rock joints, finding that both peak and residual shear strengths decreased with increasing joint saturation. Gong et al. [7] employed the Fast Lagrangian Analysis of Continua (FLAC) with two-phase flow modeling to conduct a series of constant-moisture direct shear tests on unsaturated filled joints, emphasizing the changes in effective stress and average permeability of the infill layer induced by shearing. Ju et al. [8] categorized rock mass failure modes based on the influence of filling layers and summarized the key factors affecting rock mass strength, including joint strength and toughness, interface angle, interlayer effects, and dynamic loads. Ladanyi and Archambaul [9] introduced a new parameter, the filling ratio, defined as the thickness of the weak layer (t) to the amplitude of joint surface undulation (a). Indraratna et al. [10] found that even a thin layer of infill material can significantly reduce the shear strength of structural planes. Their results also indicated that when the filling ratio (t/a) was between 1.4 and 1.8, roughness had a marked impact on shear strength, whereas beyond this critical ratio, the shear behavior was governed solely by the infill material. Once the infill material controlled the joint shearing behavior, the displacement corresponding to the peak shear stress decreased significantly. Fu et al. [11] investigated the strength and failure modes of rocks with filling interlayers, analyzing their impact on slope failure, and revealed the influences of interlayer angle and confining pressure on the strength and failure modes of strongly weathered mudstone, clay interlayers, and weak interbedded mudstone. Huang et al. [12], Li et al. [13], and Tan et al. [14] studied the deformation and failure characteristics of slopes from aspects including shear behavior, failure mechanisms, creep properties of filling layers, and the deformation law of dual weak interlayers, providing theoretical support for slope stability and reinforcement analyses.
Some researchers have attempted to indirectly estimate the impact of FT on rock mechanical properties based on laboratory FT test results and field investigations of rock weathering conditions. By employing empirical models such as rock mass classification indices (e.g., RMR, GSI) or the Hoek–Brown strength criterion, these studies offer a practical approach to parameter estimation in the absence of in situ testing and provide theoretical and empirical support for stability assessments and inverse analysis of cold-region rock engineering.
Li et al. [15] used the Hoek–Brown empirical criterion to calculate slope safety factors before and after FT cycles, showing that FT significantly reduced the compressive strength of granite and thus decreased the overall slope safety factor. Luo et al. [16] established a linear relationship between the Geological Strength Index (GSI) and the Tianshan Slope Mass Rating (TSMR), further analyzing the mechanical behavior and stability state of slope rock masses. Chen et al. [17] investigated the degradation of Hoek–Brown parameters in multi-fractured rock masses under FT cycles, derived the shear expression of the Hoek–Brown criterion, and proposed a new estimation method based on shear tests. Results indicated that both GSI and the material constant declined with increasing FT cycles, with a decreasing rate that followed a negative exponential trend. Cao et al. [18], aiming to support FT damage prevention and mitigation in tunnels, proposed an elastoplastic solution for frost heave pressure based on the nonlinear Hoek–Brown criterion. Numerical analysis showed that as GSI decreased and disturbance parameter increased, both the plastic zone and frost heave pressure expanded. Rezaei and Mousavi [19] applied the generalized Hoek–Brown criterion to evaluate the optimal slope stability of the Angouran open-pit mine. Using the estimated rock mass properties, a numerical model of the pit slope was developed, and its stability conditions were analyzed. The results showed good agreement between monitored displacements and numerical predictions, with a coefficient of determination .
Dong-Su Park et al. [20] proposed a thermo–hydro–mechanical slope stability analysis model (THM-SSA) for evaluating slope stability. This model calculates the local factor of safety by incorporating the isotropic tensile strength of unfrozen soil and its evolution under multiple freeze–thaw cycles. Tan et al. [21], based on the Hoek–Brown criterion, determined the mechanical parameters of rock masses and employed FLAC3D numerical simulations to analyze stress–deformation characteristics and the trend of safety factor variation under freeze–thaw effects. Their simulation results were validated against field monitoring data. To investigate the internal physical and mechanical changes in expansive soil slopes, Yang et al. [22] conducted four freeze–thaw cycle experiments on slope models with slope ratios of 1:1.5, 1:1, and 1:0.5 in an environmental simulation chamber. The results indicated that steeper slopes lead to more intense temperature fluctuations, more pronounced crack development, and increased thermal gradients and moisture migration rates during freeze–thaw processes. Deepali Anand et al. [23] used finite element simulations to analyze the impact of frost heave on slope deformation and stability, revealing the spatiotemporal characteristics of deformation mechanisms under freeze–thaw action. Chen et al. [24] combined a THM model with field measurements to explore the coupled effects of freezing, leakage, and mechanical behavior on the stability of structural slopes and tunnels. In Youssef Zerradi et al.’s research [25], the maximum safe slope angle of fractured rock masses was optimized by eliminating slope angles inducing unstable blocks (key blocks) and by using the stereographic projection method of the key block theory. Olena Sdvyzhkova et al. [26] numerically modeled pit wall stability using finite element analysis, optimizing boundaries for complete ore excavation, and identified safety factor distribution, potential sliding surfaces, and the influence of wall slope and ore completeness on the stripping ratio in a super-deep open pit.
In addition to slope-related issues, the foundation stability of underground engineering structures under freeze–thaw conditions has also attracted considerable attention. Li et al. [27] developed a numerical simulation platform for complex pipe–soil systems by coupling heat conduction, moisture migration, and stress–strain governing equations. Their results systematically demonstrated how alternating frost heave and thaw settlement affect pipeline foundation stability. Zhang et al. [28], based on the Winkler elastic beam theory, established a mechanical response model for buried pipelines subjected to frost heave loads and conducted sensitivity analyses. Ma et al. [29] carried out centrifuge model tests to investigate the influence of buried pipelines on the temperature field and pore water migration in surrounding soils, providing important physical test support for engineering applications in cold regions.
In summary, conventional laboratory FT tests commonly adopt a unified freezing–thawing temperature regime based on atmospheric temperature, which can effectively reflect the FT response of shallow rock masses. However, this method fails to capture the actual thermal response of deeper rocks due to temperature lag and gradual thermal transitions. Such limitations affect the reliability of mechanical property estimation and stability analysis for fractured rock masses with infilling materials.
Therefore, this study takes a representative cold-region open-pit mine as the engineering background, analyzes the relationship between rock extreme temperature and burial depth, conducts FT cycles and shear tests on structural plane infilling materials under multiple temperature intervals, and systematically investigates the mechanical degradation characteristics and slope stability evolution of fractured rock masses with infill under various FT conditions. Based on this, the Hoek–Brown strength criterion is modified by introducing correction factors that account for infill effects, enhancing the adaptability and accuracy of strength parameter prediction.
2. Sample Preparation and Experimental Program
2.1. Sample Preparation
The filling material used in this experiment was sampled from the structural plane of the pit slope at the Wushan open-pit mine operated by China National Gold Group Inner Mongolia Mining Co., Ltd. (Hulunbuir, China), and it appeared yellowish-brown in color. Upon collection, the natural moisture content of the sample was measured to be 9%. The material was sieved using a 5 mm mesh and oven-dried at 104 °C for 24 h. It was then rehydrated to the target moisture content of 9%. To ensure uniform moisture content (9%) in the specimens, a controlled temperature and humidity chamber was used. Water was added in stages and manually mixed thoroughly. The samples were then sealed and left for 24 h to allow uniform moisture redistribution. The moistened filling material was compacted using a mechanical compaction method to form cylindrical specimens with a diameter of 61.8 mm and a height of 20 mm. For each test condition, no fewer than four parallel specimens were prepared. The prepared specimens are shown in Figure 1 (the differences in mineral composition and particle size of the fillings at different positions in the mine are shown in Appendix B).
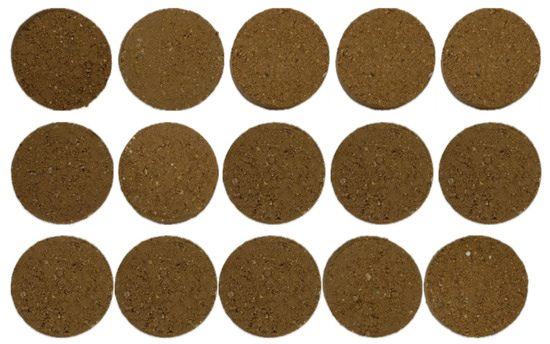
Figure 1.
Compacted specimens of structural plane filling material.
To ensure the uniformity of compaction and the reproducibility of mechanical behavior, a layered tamping method was employed during specimen preparation. Each layer was compacted with consistent thickness and energy using a fixed loading mass and drop height. This approach ensured relatively uniform density distribution throughout the specimen. To verify the consistency of specimen preparation, each prepared sample was subjected to direct shear testing in triplicate. The resulting shear strengths were 131.75 kPa, 134.85 kPa, and 128.65 kPa, respectively. The variation among these results was within ±5%, indicating that the specimen preparation method ensured good repeatability and reliability.
2.2. Experimental Program
2.2.1. Relationship Between Rock Mass Temperature and Burial Depth
Figure 2a illustrates the temporal variation in rock mass temperature at different depths along the slope of the Wushan open-pit mine. It can be observed that the temperature generally follows a sinusoidal trend in response to seasonal cycles. However, the thermal response varies with depth: shallow rock masses experience frequent thermal exchange with the atmosphere, resulting in more pronounced and rapid temperature fluctuations; in contrast, deeper rock masses are less affected by atmospheric conditions, exhibiting reduced amplitudes and slower rates of temperature change.
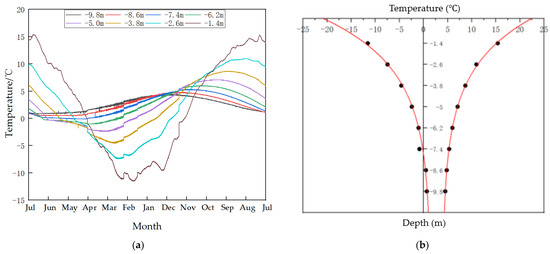
Figure 2.
Internal temperature variation process of the Wushan open-pit mine slope: (a) temperature changes at different depths over time; (b) depth-dependent variation in temperature range.
Furthermore, Figure 2b presents the distribution of extreme temperatures at various depths. As depth increases, both the positive and negative temperature extremes converge progressively, with the rate of convergence decreasing with depth. Notably, the depth at which the negative temperature extreme approaches 0 °C is approximately 7.5 m, which can be considered the maximum freezing depth of the rock mass in this region.
2.2.2. Freeze–Thaw Cycle Test
The freeze–thaw temperature conditions in this experiment were determined based on the actual temperature variation ranges observed in rock masses at different burial depths. Each freeze–thaw cycle consisted of a freezing phase and a thawing phase, with each phase lasting 4 h. The total number of cycles was set to 0 (unfrozen), 5, 10, 15, and 20, simulating varying degrees of freeze–thaw weathering. The detailed experimental scheme is provided in Table 1.

Table 1.
Experimental scheme.
The temperature–depth relationship used in this study is derived from field-measured data and represents the average freezing depth trend observed in the study area. It serves as a simplified expression of the freeze–thaw boundary condition in the current numerical model. In future work, more sophisticated thermo-hydraulic coupling models may be introduced to improve the accuracy and generalizability of temperature field simulations.
2.2.3. Direct Shear Tests on Infill Specimens
After completing the designated number of freeze–thaw cycles, direct shear tests were conducted on the specimens using a strain-controlled direct shear apparatus. For each test condition, four parallel specimens were prepared and subjected to four levels of vertical pressure. The vertical stress levels were selected based on engineering requirements and the mechanical properties of the specimens, with efforts made to maintain uniform intervals between pressure levels. In this study, a four-level loading scheme of 100 kPa, 200 kPa, 300 kPa, and 400 kPa was adopted. Each vertical load was applied slowly in a single stage; for relatively soft specimens, a stepwise loading approach was employed to prevent extrusion prior to shearing. The shear tests were carried out in strain-controlled mode with a shear rate of 2 r/min to ensure data accuracy and test stability.
3. Shear Strength Evolution of Structural Plane Infill Specimens
3.1. Shear Response Under Varying Freeze–Thaw Cycles and Vertical Pressures
The shear stress of the specimen was calculated using the following equation (Equation (1)):
where —shear stress (kPa); —load cell calibration coefficient (N/0.01 mm); —load cell reading (0.01 mm); —initial cross-sectional area of the specimen (cm2).
The shear stress–shear displacement curves of the infill material under various freeze–thaw cycles and vertical pressure conditions are shown in Figure 3. The results indicate that with increasing vertical pressure, the peak shear stress increases significantly, suggesting that higher confining stress suppresses lateral expansion of the infill material and enhances interparticle friction and interlocking, thereby improving shear strength.
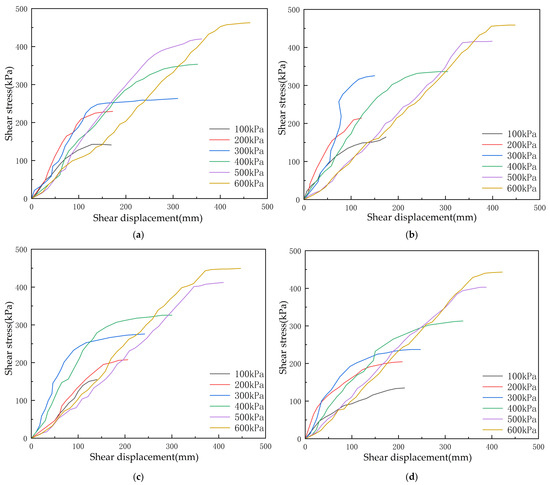
Figure 3.
Shear stress–displacement curves of infill material under different freeze–thaw cycles: (a) 2 freeze–thaw cycles; (b) 5 freeze–thaw cycles; (c) 10 freeze–thaw cycles; (d) 20 freeze–thaw cycles.
At constant confining pressure, the evolution of peak shear stress with freeze–thaw cycles reveals different trends. Under low confining pressure (100 kPa), the peak shear stress first increases and then decreases with the number of cycles, whereas under high confining pressure (400 kPa), it decreases progressively. This indicates that the initial freeze–thaw cycles densify the infill structure and enhance shear resistance, while prolonged cycling leads to structural degradation and strength attenuation.
3.2. Effects of Freeze–Thaw Cycles and Burial Depth on Strength Parameters
Based on the shear strength results under different normal stresses, the internal friction angle and cohesion of the infill material were calculated for each test condition, as shown in Figure 4. The results indicate that with increasing freeze–thaw cycles, the internal friction angle exhibits an initial decrease followed by a slight increase, while the cohesion initially increases and then decreases. This trend reflects the rearrangement of the microstructure and short-term cementation strengthening during the early stages of freeze–thaw cycling, followed by fatigue damage and structural weakening during prolonged cycling. Furthermore, the amplitude of variation in strength parameters decreases with increasing burial depth, indicating that deeper infill materials exhibit a weaker response to freeze–thaw effects compared to shallow layers.
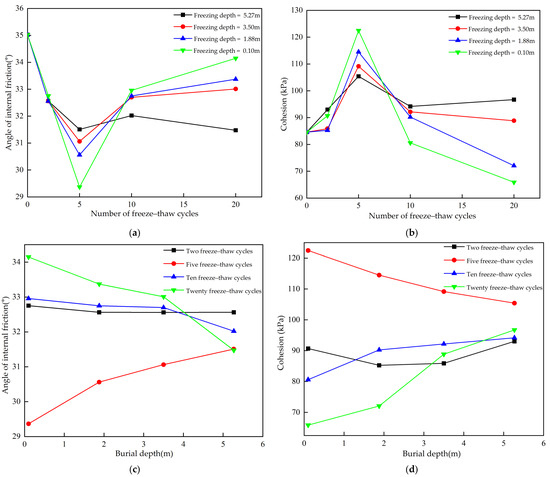
Figure 4.
Variations in internal friction angle and cohesion of the infill material under different freeze–thaw cycles and burial depths: (a) variation in the internal friction angle of infill material under different freeze–thaw cycles; (b) variation in the cohesion of infill material under different freeze–thaw cycles; (c) variation in the internal friction angle of infill material at different burial depths; (d) variation in the cohesion of infill material at different burial depths.
It is worth noting that after a certain number of freeze–thaw cycles, a slight increase in the internal friction angle was observed in some specimens. This non-monotonic degradation trend may be attributed to the rearrangement and densification of particles under repeated freeze–thaw cycling, leading to a more stable granular skeleton and enhanced inter-particle interlocking and friction. In addition, potential testing uncertainties or local stress disturbances may also contribute to this phenomenon. Further investigation at the microstructural level is planned for future work.
To further elucidate the response mechanism of strength parameters to freeze–thaw cycles and burial depth, three-dimensional scatter plots of internal friction angle and cohesion were constructed, and dual-exponential surface fitting was performed (Figure 5). The regression analysis yielded a coefficient of determination (R2) of 0.8285 for the internal friction angle and 0.7963 for cohesion, indicating a good level of correlation between the experimental data and the fitted models. The fitted equation for the internal friction angle is as follows:
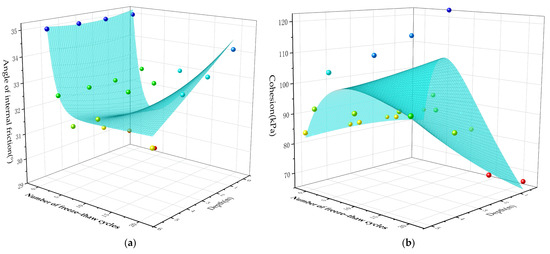
Figure 5.
Fitted surfaces showing the variation in internal friction angle and cohesion of infilling material under different freeze–thaw cycles and burial depths: (a) fitted surface of internal friction angle variation; (b) fitted surface of cohesion variation (different colored spheres represent the values of internal friction angle and cohesion under varying burial depths and numbers of freeze-thaw cycles).
The fitted equation for cohesion is as follows:
where is the depth of the rock mass (m, positive values indicate burial depth) and is the number of freeze–thaw cycles.
Figure 5 illustrates the three-dimensional variation patterns of the internal friction angle and cohesion of rock masses under different freeze–thaw cycles and burial depths. The results show that the internal friction angle exhibits a nonlinear response characterized by an initial decrease followed by a subsequent increase as the number of freeze–thaw cycles increases. Moreover, it generally increases with depth, indicating that shallow rock masses are more significantly affected by freeze–thaw action, whereas deeper rock masses exhibit greater structural stability. In contrast, cohesion demonstrates an initial increase followed by a decrease with increasing freeze–thaw cycles, suggesting that early-stage freeze–thaw may induce microstructural rearrangement and local cementation enhancement, while prolonged cycling results in structural fatigue and degradation, particularly in shallow regions. The deeper sections remain relatively stable. This figure clearly reveals the coupled influence mechanism of freeze–thaw processes and burial depth on the shear strength parameters of infilled fractured rock masses.
4. Mechanical Parameter Evolution and Slope Stability Analysis of Infilled Fractured Rock Masses Under Freeze–Thaw Cycles
4.1. Evolution of Mechanical Parameters of Infilled Fractured Rock Masses Under Freeze–Thaw Action
4.1.1. Construction of Triaxial Compression Numerical Model for Infilled Fractured Rock Mass
To investigate the mechanical response behavior of infilled fractured rock masses under freeze–thaw conditions, a two-dimensional joint network model was established (see Figure 6a). The fracture distribution parameters were generated using the Monte Carlo method, and a 2D structural surface model with a 10 mm thick infill layer was constructed in COMSOL 6.0. The mesh discretization is shown in Figure 6b. A Mohr–Coulomb constitutive model was adopted, with mechanical parameters for the rock matrix and infilling materials assigned based on experimental results under different freeze–thaw cycles. Triaxial compression simulations were performed by applying constant confining pressure and displacement boundary conditions. As the model geometry is a key control parameter, it is necessary to determine the representative elementary volume (REV) to ensure the reliability of simulation results.
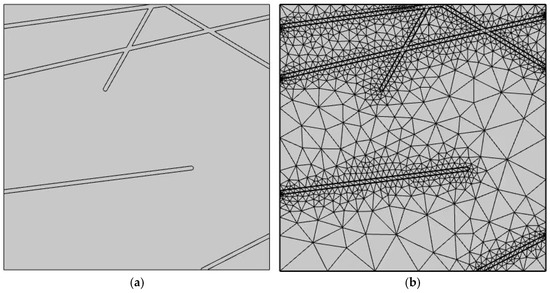
Figure 6.
Triaxial compression numerical model of a 1 × 1 m jointed rock mass: (a) geometric model; (b) mesh discretization.
4.1.2. Determination of Representative Elementary Volume (REV) Under Triaxial Compression Conditions
To investigate the mechanical response of fractured rock masses with infilled joints under freeze–thaw conditions, a series of triaxial compression numerical simulations was performed on models with side lengths increasing from 1 m to 9 m under a confining pressure of 1 MPa. The rock material parameters were selected with reference to Zhang et al. [30] and are presented in Table 2. This approach aimed to evaluate the influence of model size on mechanical behavior.
Table 2.
Mechanical properties of Wushan granite rock mass under different freeze–thaw cycles.
As shown in Figure 7, the peak compressive strength of the rock mass exhibits a decreasing trend with increasing model size. This phenomenon is attributed to the limited number of joints in smaller models, which results in more intact rock and consequently higher strength. As the model size increases, the number of joints grows, enhancing structural complexity and intensifying shear weakening effects, thereby reducing overall strength. A comparative analysis of strength variation across different sizes reveals that, when the model side length reaches 9 m, the peak strength stabilizes, with fluctuations controlled within 10%. Based on this convergence criterion, the 9 × 9 m model is identified as the minimum representative elementary volume (REV) in this study. At this scale, the joint distribution is sufficiently representative, and the mechanical response of the rock mass achieves statistical stability, effectively capturing the average macroscopic mechanical properties. This determination provides both geometric and computational justification for simulating the evolution of mechanical parameters in subsequent analyses.
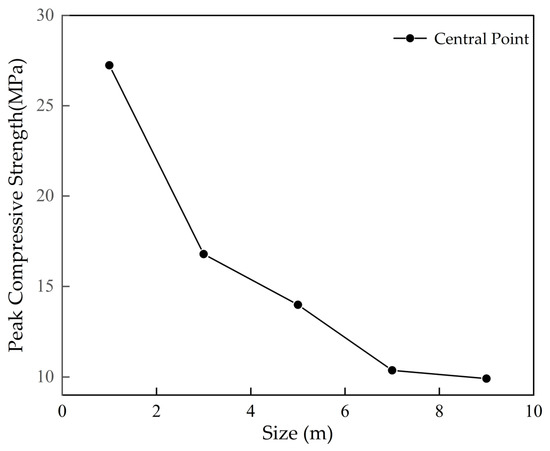
Figure 7.
Peak compressive strength of models with different sizes under 1 MPa confining pressure.
The 9 × 9 m representative elementary volume (REV) adopted in this study is determined based on the stabilization of peak compressive strength under a confining pressure of 1 MPa and is considered appropriate for representing the average mechanical response scale of the simulated slope (the peak compressive strengths under different angles and grid densities are shown in Appendix A). However, REV is inherently influenced by various factors such as loading mode, fracture scale, and lithological heterogeneity. Under shear-dominated or fracture-penetration-controlled failure mechanisms, the REV may require redefinition. Future studies may evaluate its general applicability and boundary conditions through multi-scale numerical simulations or discrete element modeling.
4.1.3. Evolution of Rock Mass Mechanical Parameters Under Freeze–Thaw Cycles
Based on the previously determined representative elementary volume (REV) model, triaxial compression simulations were conducted under different freeze–thaw cycles and burial depths. The internal friction angle and cohesion of the fractured granite were calculated, and the results are shown in Figure 8. It can be observed that both parameters decrease significantly with an increasing number of freeze–thaw cycles and decreasing burial depth. In general, the trends for internal friction angle and cohesion are similar, although the decline in internal friction angle is more pronounced.
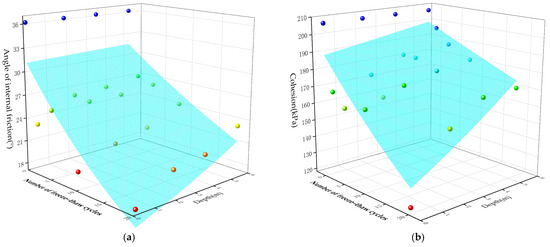
Figure 8.
Variations in internal friction angle and cohesion of the rock mass with burial depth and number of freeze–thaw cycles: (a) variation in internal friction angle with burial depth and freeze–thaw cycles; (b) variation in cohesion with burial depth and freeze–thaw cycles (different colored spheres represent the magnitude of internal friction angle and cohesion under different burial depths and numbers of freeze-thaw cycles).
Specifically, before undergoing any freeze–thaw cycles, the internal friction angle and cohesion of the rock mass were 36.167° and 207.485 kPa, respectively. After 20 freeze–thaw cycles at a burial depth of 5.27 m, the values decreased to 23.788° and 171.410 kPa, corresponding to reductions of 34.23% and 17.39%, respectively. At a shallower depth of 0.10 m, the degradation was more severe, with reductions of 51.10% and 41.44%, respectively, under the same freeze–thaw conditions.
To characterize these trends, a double-exponential function model was established using the Levenberg–Marquardt algorithm to fit the relationship between strength parameters, freeze–thaw cycles, and burial depth. The resulting fitting models (Equations (4) and (5)) achieved coefficients of determination of 0.67 and 0.75, respectively, indicating good applicability for capturing the evolutionary patterns of mechanical parameters.
The double-exponential model established in this study for strength parameters versus the number of freeze–thaw (F–T) cycles is fitted based on experimental data from 0 to 25 cycles, with R2 values ranging from 0.67 to 0.75, indicating an acceptable level of fit. The model predicts a critical instability state at N = 42 cycles, which serves primarily as a theoretical upper-bound estimate for failure trends. However, this prediction has not yet been validated by long-term experimental or field data and should not be interpreted as a definitive failure threshold. Future research should refine and verify this estimate through extended F–T testing and in situ monitoring.
The results indicate that under freeze–thaw cycling, both the internal friction angle and cohesion of fractured rock masses exhibit significant variation with the number of cycles and burial depth, and both parameters are closely associated with shear strength. Based on the Mohr–Coulomb strength criterion in the form , and in conjunction with the fitted results, the parameters were extended to develop a modified Mohr–Coulomb criterion (Equation (6)), which is applicable under coupled freeze–thaw and depth conditions for fractured rock masses.
4.2. Freeze–Thaw Induced Stability Analysis of Fractured Rock Slopes with Filled Joints
4.2.1. Spatial Distribution of Mechanical Parameters Considering Freeze–Thaw Degradation
A numerical model of a typical section at the 645 m bench of the Wushan open-pit mine was established in COMSOL 6.0. The model height is 40 m, with a bench slope angle of 65°, a bench height of 30 m, and both upper and lower platform widths of 13 m. Vertical boundaries and the horizontal bottom boundary are constrained with displacement perpendicular to the boundary lines, considering only the self-weight of the rock mass.
In the current numerical model, processes such as moisture migration, capillary pressure, and frost heave in saturated fill materials were not explicitly simulated, primarily due to limitations in parameter availability and multiphysics coupling capabilities within the modeling software. However, the strength degradation behavior observed in laboratory tests conducted under controlled temperature and saturation conditions implicitly reflects the integrated effects of these processes. Therefore, the input strength parameters used in the model can be considered as effective values incorporating the macroscopic influence of freeze–thaw action.
According to the multi-parameter coupling models for internal friction angle and cohesion established earlier (Equations (4) and (5)), the mechanical parameters corresponding to the freeze–thaw cycle number and burial depth were assigned to each mesh element of the 795 m platform slope model, constructing a spatial distribution field of mechanical parameters considering freeze–thaw effects. Figure 9 and Figure 10 show the spatial distribution trends of internal friction angle and cohesion in the slope rock mass under different freeze–thaw cycle conditions. The results indicate that with increasing freeze–thaw cycles, the mechanical parameters of the slope surface layer (within the freeze–thaw affected depth) continuously deteriorate, exhibiting a significant degradation-layer effect. In particular, the shallow rock mass, being more susceptible to temperature fluctuations and moisture migration, shows a faster rate of strength degradation than the deeper layers, resulting in a stratified mechanical enhancement with depth and an expanding weakened zone over time. After more than 10 freeze–thaw cycles, this stratified weakening feature becomes increasingly evident, demonstrating the reconstructive effect of freeze–thaw and depth coupling on the spatial distribution of rock strength and providing a mechanical basis for subsequent slope stability analysis.
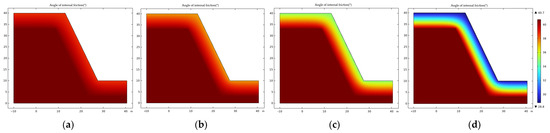
Figure 9.
Spatial distribution of internal friction angle in the slope rock mass under the influence of freeze–thaw cycles: (a) 2 freeze–thaw cycles; (b) 5 freeze–thaw cycles; (c) 10 freeze–thaw cycles; (d) 20 freeze–thaw cycles.
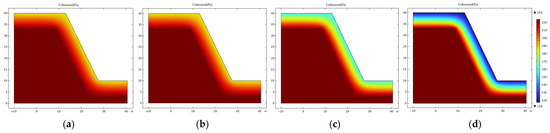
Figure 10.
Spatial distribution of cohesion in the slope rock mass under the influence of freeze–thaw cycles: (a) 2 freeze–thaw cycles; (b) 5 freeze–thaw cycles; (c) 10 freeze–thaw cycles; (d) 20 freeze–thaw cycles.
4.2.2. Influence of Freeze–Thaw Cycles on Slope Safety Factor
Based on the spatial distribution of rock mass mechanical parameters constructed earlier, the strength reduction method was further employed to analyze the slope safety response under different freeze–thaw (FT) cycle scenarios. By calculating the plastic strain distribution and factor of safety (FOS) along the potential slip surface, Figure 11 illustrates the evolution of plastic strain and the changes in FOS of the step slope after 0, 2, 5, 10, and 20 FT cycles.
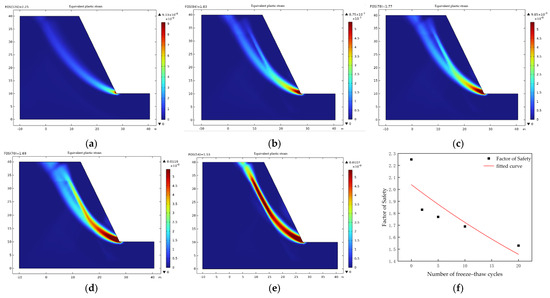
Figure 11.
Distribution of plastic strain and safety factor under different numbers of freeze–thaw cycles: (a) 0 freeze−thaw cycles; (b) 2 freeze−thaw cycles; (c) 5 freeze−thaw cycles; (d) 10 freeze−thaw cycles; (e) 20 freeze−thaw cycles; (f) variation patterns of safety factor (FOS) with freeze−thaw cycle counts.
The results indicate that with the increase in the number of FT cycles, the plastic strain in the shallow part of the slope intensifies significantly. The potential sliding zone gradually expands, and the failure mode tends toward a more continuous path, leading to a notable decline in slope stability. In the initial state (0 FT cycles), the safety factor of the slope is 2.25, indicating high stability. However, when the number of FT cycles increases to 20, the safety factor drops to 1.53, placing the slope in a marginally stable condition. A regression model describing the safety factor degradation with increasing FT cycles is established below (Equation (7)) (the calibration values used in Equation (7) are based on theoretical assumptions rather than site monitoring data.) No direct data from the Wushan mine were available; this model is intended for trend demonstration only,
where is the number of freeze–thaw cycles and the fitting coefficient of determination (R2) is 0.72, indicating a good explanatory capability of the model. Based on this, it is predicted that when the number of freeze–thaw cycles reaches 42, the safety factor of the slope will fall below 1.0, entering a potential failure state. This result highlights the cumulative impact of freeze–thaw-induced strength degradation on the long-term stability of slopes, providing a theoretical basis and parameter reference for stability evaluation and service life control of open-pit mine slopes in cold regions.
5. Discussion
By comparing the mechanical responses of fractured rock masses with and without infill under various freeze–thaw cycles, it was found that the infilling material plays a dominant role in strength degradation during the initial stages of freeze–thaw processes. After two freeze–thaw cycles, the influence of the infilling material on the internal friction angle and cohesion at a burial depth of 5.27 m reached 99.41% and 89.32%, respectively (see Figure 12 and Figure 13). This indicates that shallow rock masses are more susceptible to shear failure during early freeze–thaw stages due to the mechanical weakness of the infilling, leading to significant degradation of strength parameters.
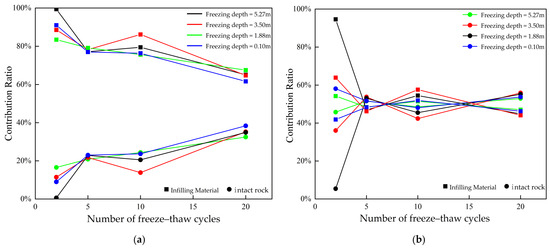
Figure 12.
Variation in the contribution of intact rock and infilling material to the degradation of rock mass mechanical properties with increasing freeze–thaw cycles at different burial depths: (a) internal friction angle; (b) cohesion.
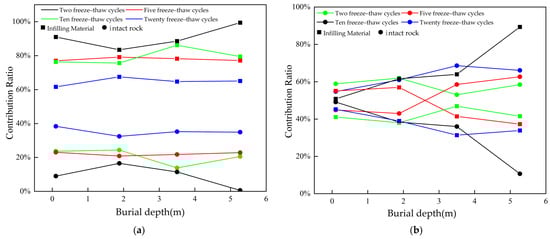
Figure 13.
Contribution of intact rock and infilling material to the degradation of rock mass properties under different freeze–thaw cycles as a function of burial depth: (a) internal friction angle; (b) cohesion.
As the number of freeze–thaw cycles increases, the strength of the infill tends to stabilize, and its softening effect gradually weakens. In contrast, the homogeneous degradation of the intact rock matrix becomes more pronounced, ultimately dominating the strength evolution at later stages. This process reveals a staged control mechanism of freeze–thaw effects on structural planes: the early-stage degradation is governed by infill-induced damage, while the later-stage strength loss is primarily driven by the propagation of microcracks within the intact rock blocks.
The above patterns are consistent with the coupled evolution trend of mechanical parameters under freeze–thaw cycles and burial depth established in Chapter 4. Furthermore, they provide a theoretical explanation for the rapid decrease in safety factors observed in shallow slope zones, thereby validating the critical role of infilling layers in the slope failure mechanism.
This study was conducted based on the geological conditions of a specific open-pit site, and the degradation parameters obtained are site-dependent. Nevertheless, the modeling framework, parameter calibration methodology, and predictive approach developed herein are generalizable. They can be applied to other cold-region slopes with similar lithological and hydrothermal conditions. To extend applicability, future studies should incorporate site-specific climatic, geological, and hydrogeological data for model calibration and validation.
The COMSOL model developed in this study adopts a continuous medium assumption and does not explicitly simulate the discrete characteristics of fracture geometry and block structure. The influence of fractures is incorporated through equivalent strength reduction factors, which are suitable for evaluating large-scale overall slope stability. In addition, the current model is based on partially saturated conditions and does not account for mechanisms such as capillary rise and rapid pore pressure buildup during thawing. It is recommended that future work employ a DFN–THM (Discrete Fracture Network—Thermo–Hydro–Mechanical) coupled framework to construct a more realistic, multi-scale, and multiphysics simulation system, enabling a more accurate representation of potential failure mechanisms.
6. Conclusions
Taking the Wushan open-pit mine slope in cold regions as a case study, this research systematically investigates the mechanical degradation mechanism of infilled fractured rock masses and the corresponding slope stability response under freeze–thaw (F–T) cycles. By analyzing in situ temperature data to determine the F–T influence range, conducting shear tests on infilled structural planes, and implementing fracture network modeling and numerical simulations, a degradation model that accounts for the infill effect was developed. A revised GSI calculation method and an extended form of the Hoek–Brown criterion were proposed, achieving spatial parameter field construction and dynamic stability evaluation under the coupled effects of freeze–thaw, burial depth, and structural degradation. The findings provide theoretical support and parameter guidance for slope design and operational management in cold-region open-pit mines. The main conclusions are as follows:
- (1)
- The slope rock temperature field in the Wushan open-pit mine shows significant variation with depth. Shallow rock masses are strongly influenced by atmospheric temperature, exhibiting frequent and large fluctuations, while deep rock masses show milder temperature changes. Based on the relationship between temperature extremes and depth, the maximum freezing depth was determined to be approximately 7.5 m. This indicates that the primary freeze–thaw affected zone is concentrated in the shallow layer, which should be considered a key zone for slope protection and instability control.
- (2)
- The shear strength of infilled structural planes decreases significantly during F–T cycles, with infill thickness playing a decisive role in degradation severity. Direct shear tests indicate that a 10 mm thick infill layer can result in a nearly 30% reduction in cohesion after 20 F–T cycles. This confirms that infill materials are the dominant factor in early-stage strength degradation, and mechanical parameters should be adjusted using correction coefficients accordingly.
- (3)
- Both the internal friction angle and cohesion exhibit exponential degradation trends under the combined influence of F–T cycles and burial depth. A dual-exponential fitting model was established to describe the evolution of shear strength, with fitting coefficients of determination (R2) of 0.67 and 0.75, respectively. These results reveal that shallow-buried rock masses are more susceptible to strength degradation due to temperature gradients and structural weakening, providing theoretical support for parameter field construction and predictive analysis.
- (4)
- Numerical modeling based on the fracture network indicates that a 9 × 9 m domain can be considered a representative elementary volume (REV), exhibiting stable mechanical responses and representative plastic strain distribution. Based on this REV, slope strength spatial assignment and stability calculations were conducted. Results show that the slope safety factor decreases exponentially with increasing F–T cycles, dropping from an initial value of 2.25 to 1.53 after 20 cycles. Regression model prediction suggests that once F–T cycles exceed 42, the safety factor drops below 1.0, entering a critical instability state. This highlights the cumulative effect of freeze–thaw as a key factor in controlling the service life of cold-region slopes.
Author Contributions
Conceptualization, P.Z. and Q.Y.; Methodology, J.H. and P.Z.; Software, J.H. and Q.Y.; Validation, J.H. and W.Y.; Formal analysis, J.H., W.Y. and Q.Y.; Investigation, J.H., N.G. and W.Y.; Resources, P.Z.; Data curation, J.H., N.G. and W.Y.; Writing—original draft, N.G.; Writing—review & editing, P.Z. and N.G.; Supervision, P.Z. and Q.Y. All authors have read and agreed to the published version of the manuscript.
Funding
The work presented in this paper is financially supported by the National Key R&D Program of China (Grant No. 2022YFC2903903) and the National Natural Science Foundation of China (Grant No. 52174070).
Data Availability Statement
The original contributions presented in this study are included in the article. Further inquiries can be directed to the corresponding authors.
Conflicts of Interest
Author Jun Hou was employed by Changchun Gold Research Institute Co., Ltd. The remaining authors declare that the research was conducted in the absence of any commercial or financial relationships that could be construed as a potential conflict of interest.
Appendix A
In COMSOL, meshes were generated at coarse, refined, and highly refined levels (see Appendix A, Table A1). The corresponding peak compressive strengths were 9.6604 MPa, 9.9067 MPa, and 10.3400 MPa, respectively. As the variation among these values is within 5%, it can be concluded that mesh density has a limited effect on the peak compressive strength. Therefore, the use of a refined mesh in this study is considered appropriate.
Table A1.
Mesh division configurations.
Table A1.
Mesh division configurations.
| Mesh Division | Maximum Element Size | Minimum Element Size | Curvature Factor | Domain Element (Boundary Element) | Degrees of Freedom (Internal DOF) | Peak Compressive Strength (MPa) |
|---|---|---|---|---|---|---|
| Regular Mesh | 0.606 | 0.0027 | 0.3 | 385,901 (35,247) | 434,735 (1,929,506) | 9.6604 |
| Refined Mesh | 0.333 | 0.00113 | 0.25 | 489,880 (39,307) | 552,767 (2,449,401) | 9.9067 |
| Ultra-Fine Mesh | 0.18 | 6.75E-4 | 0.25 | 618,184 (42,532) | 667,852 (3,090,921) | 10.3400 |
In COMSOL, meshes were generated at coarse, refined, and highly refined levels (see Appendix A, Table A2). The corresponding peak compressive strengths were 9.8629 MPa, 9.9067 MPa, and 10.0755 MPa, respectively. As the variation among these values is within 5%, it can be concluded that mesh density has a limited effect on the peak compressive strength. Therefore, the use of a refined mesh in this study is considered appropriate.
Table A2.
Mesh configurations at different angles.
Table A2.
Mesh configurations at different angles.
| Angle (°) | Maximum Element Size | Minimum Element Size | Curvature Factor | Domain Element (Boundary Element) | Degrees of Freedom (Internal DOF) | Peak Compressive Strength (MPa) |
|---|---|---|---|---|---|---|
| 32.44 | 0.333 | 0.00113 | 0.25 | 492,986 (39,625) | 556,953 (2,464,931) | 9.8629 |
| 34.44 | 0.333 | 0.00113 | 0.25 | 489,880 (39,307) | 552,767 (2,449,401) | 9.9067 |
| 36.44 | 0.333 | 0.00113 | 0.25 | 506,803 (39,949) | 575,112 (2,534,016) | 10.0755 |
Appendix B
Based on field investigations, the thickness of the fracture infill layer varies between approximately 18 mm and 24 mm. Therefore, a representative infill thickness of 20 mm was selected for this study.
The infill material collected from the engineering site was divided into four subsamples according to the sampling locations, and mineralogical composition analysis was performed for each. As shown in Figure A1 and Table A3, the five sets of samples exhibit a high degree of consistency in mineral composition. Major minerals such as quartz, albite, microcline, and muscovite-1M show relatively minor variations in content, with quartz content remaining stable at approximately 40–43.5%, and the variations in other major phases also within a reasonable range. In addition, minor minerals including kaolinite, gypsum, and calcite, although present in lower amounts, were consistently detected in all samples, indicating a relatively stable distribution within the infill material. Overall, the mineralogical differences among the samples are minimal.
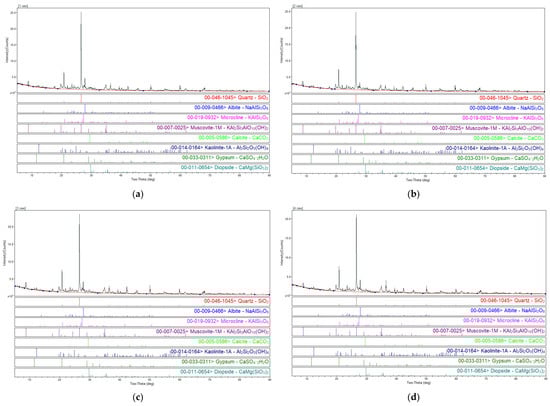
Figure A1.
Mineral composition of the samples: (a) Sample 1; (b) Sample 2; (c) Sample 3; (d) Sample 4.
Table A3.
Mineral composition of the samples.
Table A3.
Mineral composition of the samples.
| Number | Phase | Chemical Formula | PDF Card | Content (wt.%) |
|---|---|---|---|---|
| 1 | Quartz | SiO2 | 00-046-1045 | 41.3 |
| Albite | NaAlSi3O8 | 00-009-0466 | 21.0 | |
| Microcline | KAlSi3O8 | 00-019-0932 | 9.2 | |
| Muscovite-1M | KAl2Si3AlO10(OH)2 | 00-007-0025 | 17.9 | |
| Calcite | CaCO3 | 00-005-0586 | 1.3 | |
| Kaolinite | Al2Si2O5(OH)4 | 00-014-0164 | 4.7 | |
| Gypsum | CaSO4·2H2O | 00-033-0311 | 3.2 | |
| Diopside | CaMg(SiO3)2 | 00-011-0654 | 1.4 | |
| 2 | Quartz | SiO2 | 00-046-1045 | 43.5 |
| Albite | NaAlSi3O8 | 00-009-0466 | 20.0 | |
| Microcline | KAlSi3O8 | 00-019-0932 | 8.7 | |
| Muscovite-1M | KAl2Si3AlO10(OH)2 | 00-007-0025 | 17.1 | |
| Calcite | CaCO3 | 00-005-0586 | 1.5 | |
| Kaolinite | Al2Si2O5(OH)4 | 00-014-0164 | 4.9 | |
| Gypsum | CaSO4·2H2O | 00-033-0311 | 2.9 | |
| Diopside | CaMg(SiO3)2 | 00-011-0654 | 1.4 | |
| 3 | Quartz | SiO2 | 00-046-1045 | 41.3 |
| Albite | NaAlSi3O8 | 00-009-0466 | 21.8 | |
| Microcline | KAlSi3O8 | 00-019-0932 | 8.4 | |
| Muscovite-1M | KAl2Si3AlO10(OH)2 | 00-007-0025 | 17.4 | |
| Calcite | CaCO3 | 00-005-0586 | 1.1 | |
| Kaolinite | Al2Si2O5(OH)4 | 00-014-0164 | 5.1 | |
| Gypsum | CaSO4·2H2O | 00-033-0311 | 3.1 | |
| Diopside | CaMg(SiO3)2 | 00-011-0654 | 1.8 | |
| 4 | Quartz | SiO2 | 00-046-1045 | 40.2 |
| Albite | NaAlSi3O8 | 00-009-0466 | 19.7 | |
| Microcline | KAlSi3O8 | 00-019-0932 | 9.4 | |
| Muscovite-1M | KAl2Si3AlO10(OH)2 | 00-007-0025 | 18.7 | |
| Calcite | CaCO3 | 00-005-0586 | 2.5 | |
| Kaolinite | Al2Si2O5(OH)4 | 00-014-0164 | 4.7 | |
| Gypsum | CaSO4·2H2O | 00-033-0311 | 3.3 | |
| Diopside | CaMg(SiO3)2 | 00-011-0654 | 1.5 |
Similarly, samples collected from different locations on site were grouped and subjected to particle size distribution analysis. As shown in Figure A2, all four groups of samples exhibit typical bimodal distribution characteristics. The primary peaks are concentrated in the coarse particle range (approximately 300–1000 μm), while the secondary peaks are located in the fine particle range (approximately 1–10 μm), indicating the presence of both coarse and fine particles within the samples.
Although there are slight differences in the position of the main peaks, peak intensities, and volume density values among the four groups, their overall distribution patterns remain consistent, with similar curve shapes and comparable particle size spans. These results suggest that the particle size distributions are generally similar across the samples, reflecting comparable material sources or processing conditions. Therefore, the four groups can be considered as the same type of material and are suitable for unified comparative analysis in subsequent studies.
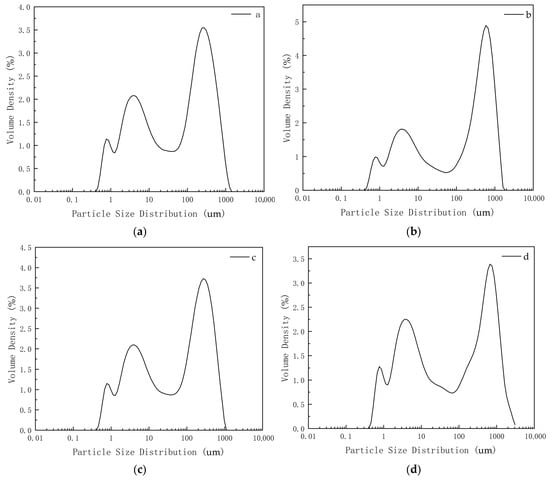
Figure A2.
Particle size distribution of the samples: (a) Sample a; (b) Sample b; (c) Sample c; (d) Sample d.
References
- Matsuoka, N.; Sakai, H. Rockfall activity from an alpine cliff during thawing periods. Geomorphology 1999, 28, 309–328. [Google Scholar] [CrossRef]
- Luo, Z.; Zhang, Y.; Du, S.; Huang, M.; Lyu, Y. Experimental study on shear performance of saw-tooth rock joint with weak interlayer under different moisture contents and filling degrees. Front. Earth Sci. 2023, 10, 982937. [Google Scholar] [CrossRef]
- Wu, D.; Chen, F.; Tang, L.; Wei, H. Influence of Weak Interlayer Filling State on the Failure Patterns of Natural Rock Joints. Int. J. Geomech. 2022, 22, 04022086. [Google Scholar] [CrossRef]
- Naghadehi, M.Z. Laboratory study of the shear behaviour of natural rough rock joints infilled by different soils. Period. Polytech. Civ. Eng. 2015, 59, 413–421. [Google Scholar] [CrossRef]
- Jahanian, H.; Sadaghiani, M.H. Experimental study on the shear strength of sandy clay infilled regular rough rock joints. Rock Mech. Rock Eng. 2015, 48, 907–922. [Google Scholar] [CrossRef]
- Hu, Y.; Wang, X.; Zhong, Z. Investigations on the jointed influences of saturation and roughness on the shear properties of artificial rock joints. Geomech. Geophys. Geo-Energy Geo-Resour. 2022, 8, 115. [Google Scholar] [CrossRef]
- Gong, L.; Nemcik, J.; Ren, T. Numerical simulation of the shear behavior of rock joints filled with unsaturated soil. Int. J. Geomech. 2018, 18, 04018112. [Google Scholar] [CrossRef]
- Ju, M.; Li, X.; Li, X.; Zhang, G. A review of the effects of weak interfaces on crack propagation in rock: From phenomenon to mechanism. Eng. Fract. Mech. 2022, 263, 108297. [Google Scholar] [CrossRef]
- Anonymous. Shear strength and deformability of filled indented joints: Ladanyi, B; Archambault, G Proc International Symposium on the Geotechnics of Structurally Complex Formations, Capri, 1977, Vol 1, P317–326. Int. J. Rock Mech. Min. Sci. Geomech. Abstr. 1980, 17, A3. [Google Scholar] [CrossRef]
- Indraratna, B.; Haque, A.; Aziz, N. Shear behaviour of idealized infilled joints under constant normal stiffness. Geotechnique 1999, 49, 331–355. [Google Scholar] [CrossRef]
- Fu, X.D.; Lu, J.Z.; Huang, B.; Zhang, Y. Experimental study on strength and failure mode of strongly weathered mudstone with weak interlayer. J. Southeast Univ. 2021, 51, 242–248. [Google Scholar]
- Huang, M.; Wang, H.; Sheng, D.; Liu, Y. Rotational–translational mechanism for the upper bound stability analysis of slopes with weak interlayer. Comput. Geotech. 2013, 53, 133–141. [Google Scholar] [CrossRef]
- Li, A.; Deng, H.; Zhang, H.; Liu, H.; Jiang, M. The shear-creep behavior of the weak interlayer mudstone in a red-bed soft rock in acidic environments and its modeling with an improved Burgers model. Mech. Time-Depend. Mater. 2023, 27, 1–18. [Google Scholar] [CrossRef]
- Tan, X.; Ren, Y.-K.; Li, T.-L.; Zhou, S.-H.; Zhang, J.-C.; Zhou, S.-K. In-situ direct shear test and numerical simulation of slate structural planes with thick muddy interlayer along bedding slope. Int. J. Rock Mech. Min. Sci. 2021, 143, 104791. [Google Scholar] [CrossRef]
- Li, J.; Zhou, K.; Liu, W.; Zhang, Y. Analysis of the effect of freeze-thaw cycles on the degradation of mechanical parameters and slope stability. Bull. Eng. Geol. Environ. 2018, 77, 573–580. [Google Scholar] [CrossRef]
- Luo, X.; Jiang, N.; Fan, X.; Mei, N.; Luo, H. Effects of freeze-thaw on the determination and application of parameters of slope rock mass in cold regions. Cold Reg. Sci. Technol. 2015, 110, 32–37. [Google Scholar] [CrossRef]
- Chen, Y.; Lin, H. Deterioration laws of Hoek-Brown parameters in freeze–thaw multi-fractured rock mass. Theor. Appl. Fract. Mech. 2023, 123, 103716. [Google Scholar] [CrossRef]
- Cao, S.; Xia, C.; Zhou, S.; Duan, J.; Peng, W. Elasto-plastic solution for frost heave force considering Hoek-Brown criterion and freezing temperature gradient in cold region tunnels. Tunn. Undergr. Space Technol. 2024, 147, 105691. [Google Scholar] [CrossRef]
- Rezaei, M.; Mousavi, S.Z.S. Slope stability analysis of an open pit mine with considering the weathering agent: Field, laboratory and numerical studies. Eng. Geol. 2024, 333, 107503. [Google Scholar] [CrossRef]
- Park, D.-S.; Shin, M.-B.; Park, W.-J.; Seo, Y.-K. Slope stability analysis model for the frost-susceptible soil based on thermal-hydro-mechanical coupling. Comput. Geotech. 2023, 163, 105715. [Google Scholar] [CrossRef]
- Tan, W.; Li, Z.; Li, Z.; Sothy, E.; Wu, S.; Guo, Q. Analysis of the Variation Characteristics of Rock Mechanical Parameters and Slope Stability Under Freeze-Thaw Cycles. Appl. Sci. 2025, 15, 5898. [Google Scholar] [CrossRef]
- Yang, Z.; Lv, J.; Shi, W.; Zhang, Q.; Lu, Z.; Zhang, Y.; Ling, X. Model Test Study on Stability Factors of Expansive Soil Slopes with Different Initial Slope Ratios under Freeze-Thaw Conditions. Appl. Sci. 2021, 11, 8480. [Google Scholar] [CrossRef]
- Anand, D.; Dey, A.; Karangat, R. Thermo-hydro-mechanical characterization and deformation behavior of reconstituted multi-couplets of varved laminae under freeze-thaw cycle. Geomech. Geoengin. 2025, 1–34. [Google Scholar] [CrossRef]
- Chen, P.; Yin, F.; Wang, M. Analysis of thermo-hydro-mechanical coupling characteristics of artificial freezing process under seepage effects. Front. Mater. 2025, 12, 1600337. [Google Scholar] [CrossRef]
- Zerradi, Y.; Souissi, M.; Larabi, A. Application of the deterministic block theory to the slope stability design of an open−pit mine in Morocco. Min. Miner. Depos. 2023, 17, 53–60. [Google Scholar] [CrossRef]
- Sdvyzhkova, O.; Moldabayev, S.; Babets, D.; Bascetin, A.; Asylkhanova, G.; Nurmanova, A.; Prykhodko, V. Numerical modelling of the pit wall stability while optimizing its boundaries to ensure the ore mining completeness. Min. Miner. Depos. 2024, 18, 1–10. [Google Scholar] [CrossRef]
- Li, Q.; Feng, P.; Wang, R.; An, N.; Bai, R.; Yang, G.; He, X.; Lin, P.; Hu, Z. Numerical Simulation of Frost Heave and Thaw Settlement Characteristics in a Complex Pipe–Soil System in the Seasonally Frozen Ground. Appl. Sci. 2025, 15, 4628. [Google Scholar] [CrossRef]
- Zhang, X.; Chen, L.; Sheng, Y.; Huang, L.; Ming, F.; Peng, C. Modeling mechanical behavior of buried pipe suffering from frost-heaving force based on the Winkler Elastic Foundation Beam Theory. Transp. Geotech. 2024, 49, 101425. [Google Scholar] [CrossRef]
- Ma, Q.; Zeng, G.; Xiao, H.; Zhou, X. Model Test Investigation of Pipe-Soil Interaction under Frost Heave Conditions of Roadbed. KSCE J. Civ. Eng. 2024, 28, 2647–2660. [Google Scholar] [CrossRef]
- Zhang, P.; Gao, N.; Yan, W.; Hou, J.; Liu, H. Strength Deterioration Pattern and Stability Evaluation of Open−Pit Mine Slopes in Cold Regions Under Freeze–Thaw Cycles. Appl. Sci. 2025, 15, 4853. [Google Scholar] [CrossRef]
Disclaimer/Publisher’s Note: The statements, opinions and data contained in all publications are solely those of the individual author(s) and contributor(s) and not of MDPI and/or the editor(s). MDPI and/or the editor(s) disclaim responsibility for any injury to people or property resulting from any ideas, methods, instructions or products referred to in the content. |
© 2025 by the authors. Licensee MDPI, Basel, Switzerland. This article is an open access article distributed under the terms and conditions of the Creative Commons Attribution (CC BY) license (https://creativecommons.org/licenses/by/4.0/).