You are currently viewing a new version of our website. To view the old version click .
Applied Sciences
  • Article
  • Open Access

5 July 2025

Study on Microseismic Monitoring of Landslide Induced by Blasting Caving

and
1
School of Resource & Environment and Safety Engineering, Hunan University of Science and Technology, Xiangtan 411100, China
2
State Key Laboratory of Metal Mine Safety Technology, Changsha 410012, China
*
Author to whom correspondence should be addressed.
This article belongs to the Special Issue Rock Mechanics and Mining Engineering

Abstract

This study focuses on the monitoring and early warning of landslide hazards induced by blasting caving in the Shizhuyuan polymetallic mine. A 30-channel microseismic monitoring system was deployed to capture the spatiotemporal characteristics of rock mass fracturing during a large-scale directional stratified blasting operation (419 tons) conducted on 21 June 2012. A total of 85 microseismic events were recorded, revealing two distinct zones of intense rock failure: Zone I (below 630 m elevation, P1–P3, C6–C8) and Zone II (above 630 m elevation, P4–P5, C1–C6). The upper slope collapse occurred within 5 min post-blasting, as documented by real-time monitoring and video recordings. Principal component analysis (PCA) was applied to 54 microseismic events in Zone II to determine the kinematic characteristics of the slip surface, yielding a dip direction of 324.6° and a dip angle of 73.2°. Complementary moment tensor analysis further revealed that shear failure dominated the slope instability, with pronounced shear fracturing observed in the 645–700 m height range. This study innovatively integrates spatial microseismic event distribution with geomechanical mechanisms, elucidating the dynamic evolution of blasting-induced landslides. The proposed methodology provides a novel approach for monitoring and forecasting slope instability triggered by underground mining, offering significant implications for disaster prevention in similar mining contexts.

1. Introduction

Landslide hazards triggered by underground mining operations often result in significant casualties and economic losses [,,,,]. For instance, on 10 April 2013, a massive landslide occurred at the Bingham Canyon Copper Mine in Utah, USA. With a volume of 65–70 million m3, the rock mass plunged 600 m and traveled 2.4 km within 90 s, triggering 16 minor seismic events. Numerous items of mining equipment were buried, resulting in a 50% reduction in copper production []. On 25 December 2015, a large-scale goaf collapse took place in the Wanzhuang Mining Area of Linyi City, Shandong Province, China. This event induced nine mining tremors ranging from M0.9 to M3.5, forming a ground collapse zone measuring approximately 1220 m in length and 660 m in width []. Two consecutive landslides occurred at the Laojinshan Mine in Yuan Yang, Yunnan, on 31 May and 3 June 1996, with a total volume of 430,000 m3, resulting in 227 deaths or missing persons. Post-event analysis attributed the failures to adverse geology and rainfall, with large-scale underground mining identified as a critical destabilizing factor [,]. The Jiwei Mountain landslide in Wulong, Chongqing (5 June 2009), covered 2150 m in length and had a volume of 7 million m3, causing 74 deaths and 8 injuries. Mining activities created a 50,000 m2 void zone at the lower slope, significantly influencing mountain deformation and stress redistribution [,]. Another notable case is the Zhaogou landslide in Zhenxiong County, Zhaotong, Yunnan (11 January 2013), involving 400,000 m3 of material and 46 fatalities, with underground coal mining implicated as a contributing factor [,]. The global impact of mining-induced landslide hazards has garnered widespread attention. While Western developed nations have prioritized mine geoenvironmental protection in recent decades, reducing incidents of large-scale mining-triggered landslides, such disasters remain prevalent in developing regions like southern and central China. This is partly due to the late onset of modernized large-scale mining in China, where small-scale operations still dominate, often lacking advanced safety protocols and exacerbating slope instability risks. Therefore, systematic research on mining-induced landslides is critical for ensuring safe mineral extraction in China.
Academic studies on mining-induced landslides generally fall into three categories: field monitoring and case analysis [], physical modeling [], and numerical simulations []. Jones et al. [] combined physical and numerical simulations to investigate shallow landslides in South Wales, revealing that mining-induced voids generated tensile stresses in roof strata, promoting the expansion of weak structural planes, thereby reducing slope safety factors by 66%. Benko et al. [] utilized FLAC and UDEC to simulate the impacts of mining depth, methods, locations, and topographic–geological conditions on slope deformation, with specific focus on the failure mechanisms of the Frank Slide. Mu Chenglin et al. [] take a field-excavated high slope in the Qianxi Area as the research object, establish a physical model test in the laboratory, and reveal the deformation and failure evolution process through different excavation scenarios. They analyze the deformation and failure models and their formation mechanisms, and determine the unstable failure zone. Yin Yueping et al. [] conducted a study on the Wulong Jiwushan Landslide using numerical simulation methods. The results indicated that underground mining altered the stress environment of the slope, inducing differential settlement in the rock mass and ultimately leading to instability and failure. Liu Can et al. [] simulated potential slip surfaces and displacements in a mine landslide, identifying three distinct stages: surface collapse crack initiation, crack propagation, and slope failure, with detailed mechanistic analyses for each phase.
This study addresses the Shizhuyuan polymetallic mine’s mining-induced landslide through microseismic monitoring. By analyzing microseismic event distributions, slip surface orientations, and rock mass failure mechanisms, this work proposes a novel methodology for investigating slope instabilities triggered by underground mining operations.

2. Engineering Background

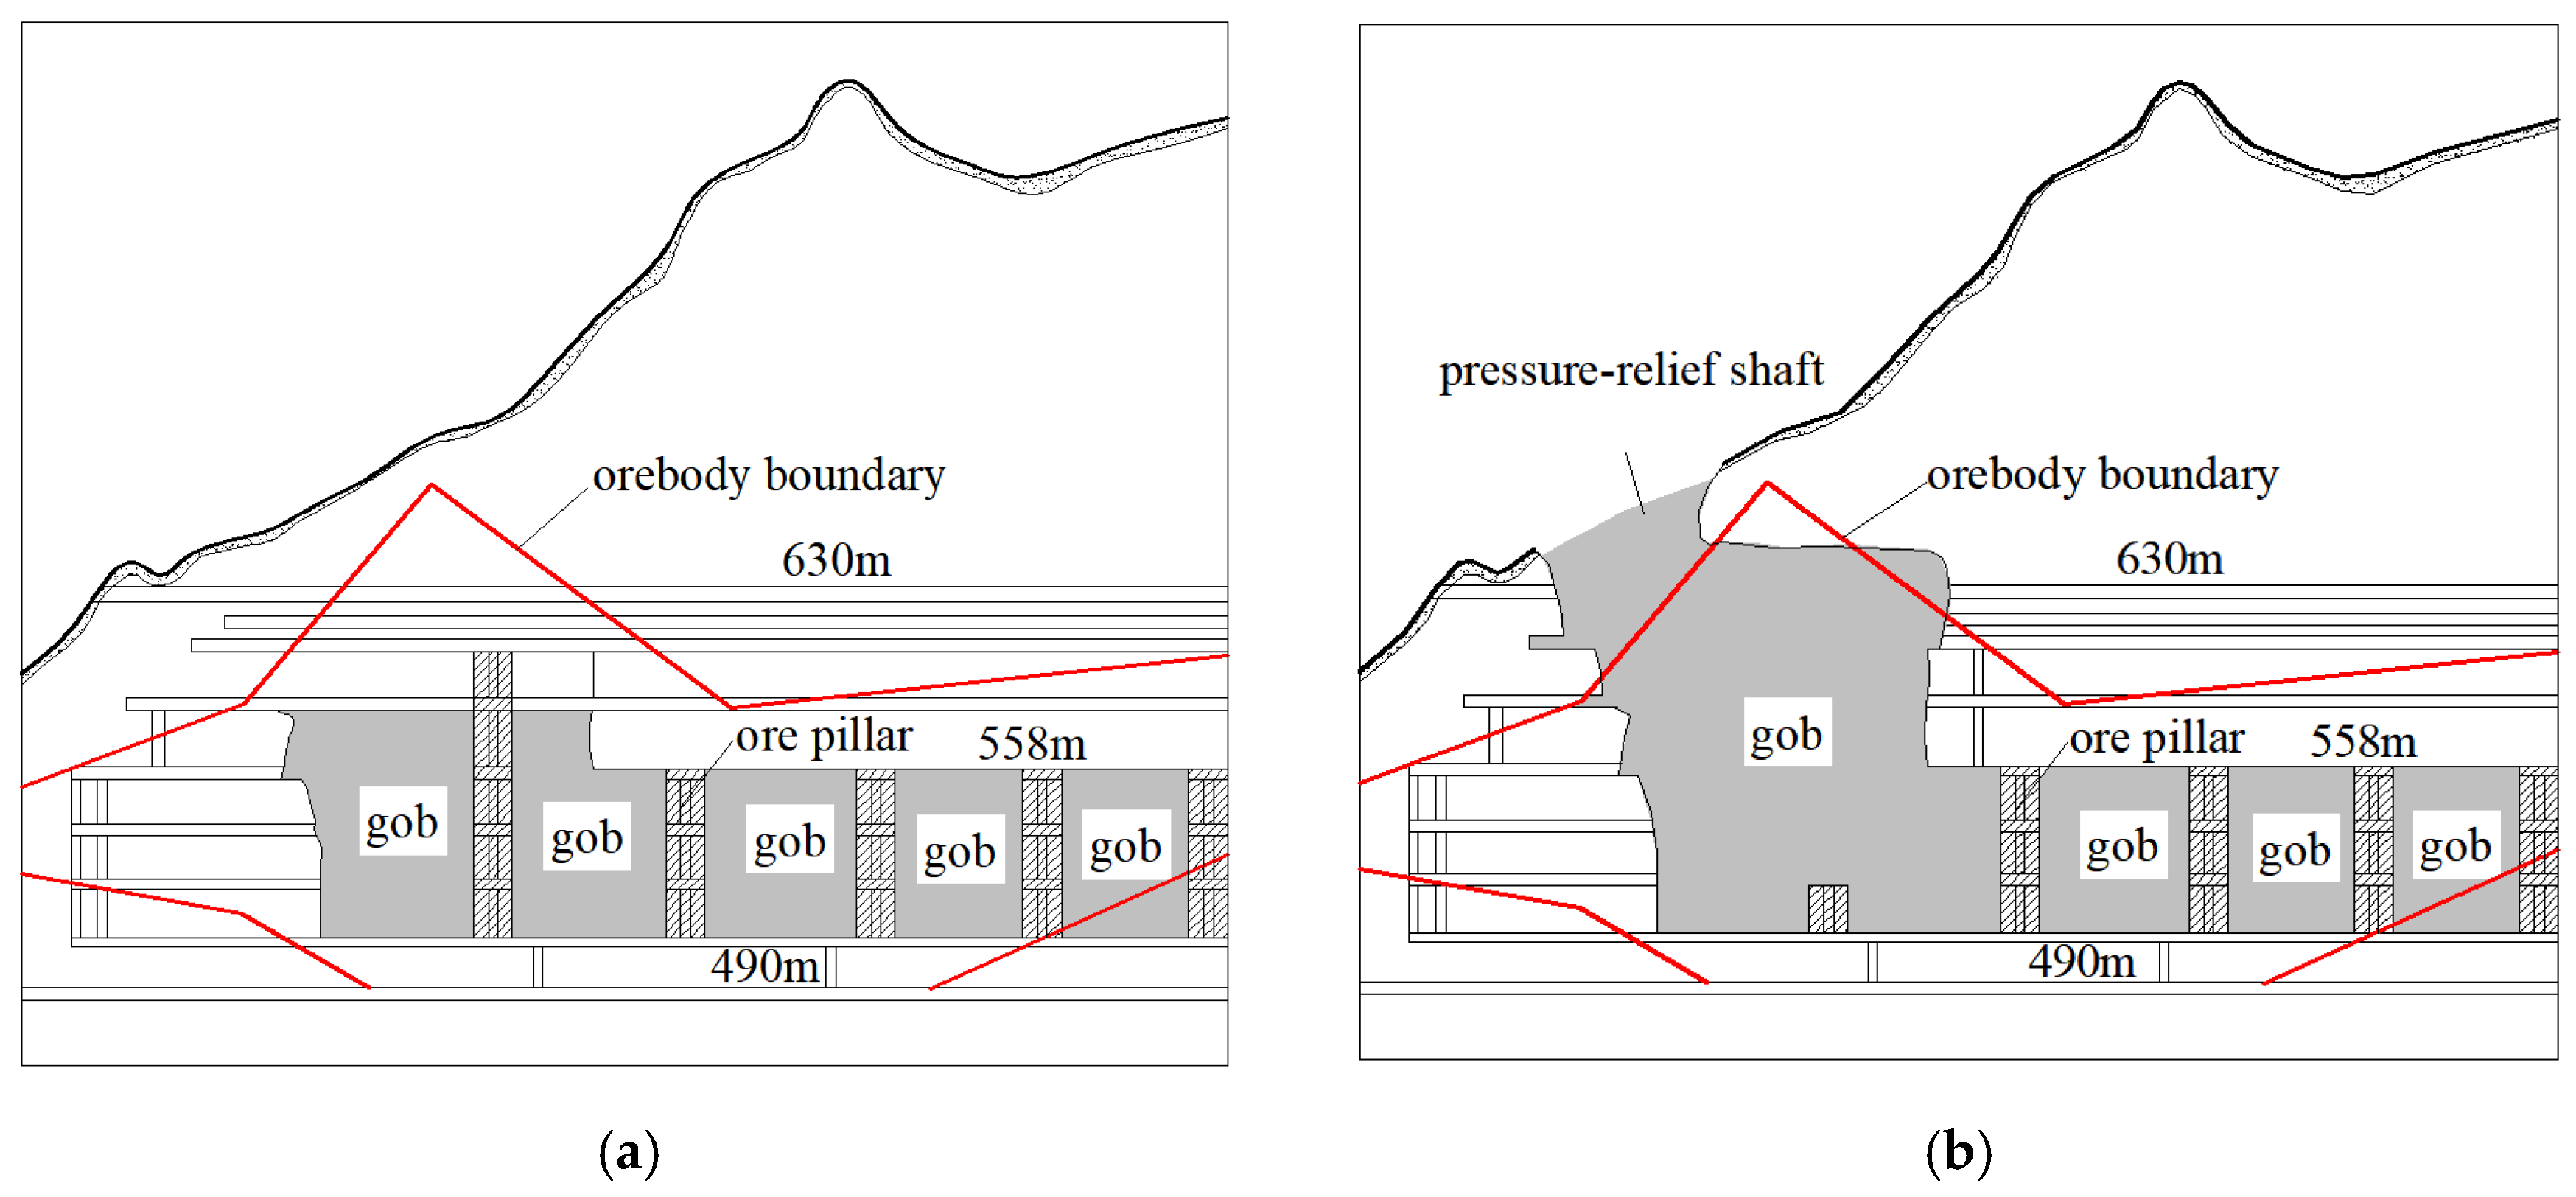
2.1. Mining Operation Context

The Shizhuyuan polymetallic mine is a large skarn deposit, primarily containing tungsten, molybdenum, bismuth, and tin. Early operations focused on the III-1-1 rich ore zone, which spans 16–24 horizontal lines and VII–XI vertical lines, covering an area of 315 × 313 m2 at elevations between 490 and 558 m. The mining area was divided into four block caving sections from west to east, with each section further subdivided into nine ore blocks from north to south, totaling 36 ore blocks. Each stope measures 64 m in length, 20 m in width, and 68 m in height. Continuous pillars (P1–P5 and C1–C8) with 15 m spacing were retained between stopes and block caving sections (see Figure 1). Due to historical reasons, the underground stopes were not backfilled, leaving approximately 60% of the ore pillars and over 3 million m3 of void space in the mining segment. To ensure continuous mining operations and effectively manage the voids while recovering ore pillars and hanging wall-rich ore, the mine adopted the caving method for pillar and hanging wall recovery, starting in 2006. This process involved first creating a pressure-relief shaft in the northwest corner of the mining area to connect with the surface, followed by progressive caving of the pillars and hanging wall ore using the shaft as a free face [,], as shown in Figure 2.
Figure 1. Mining plan view: (a) before pillar recovery, (b) after pressure-relief shaft formation.
Figure 2. Mining Sectional View: (a) before pillar recovery, (b) after pressure-relief shaft formation.

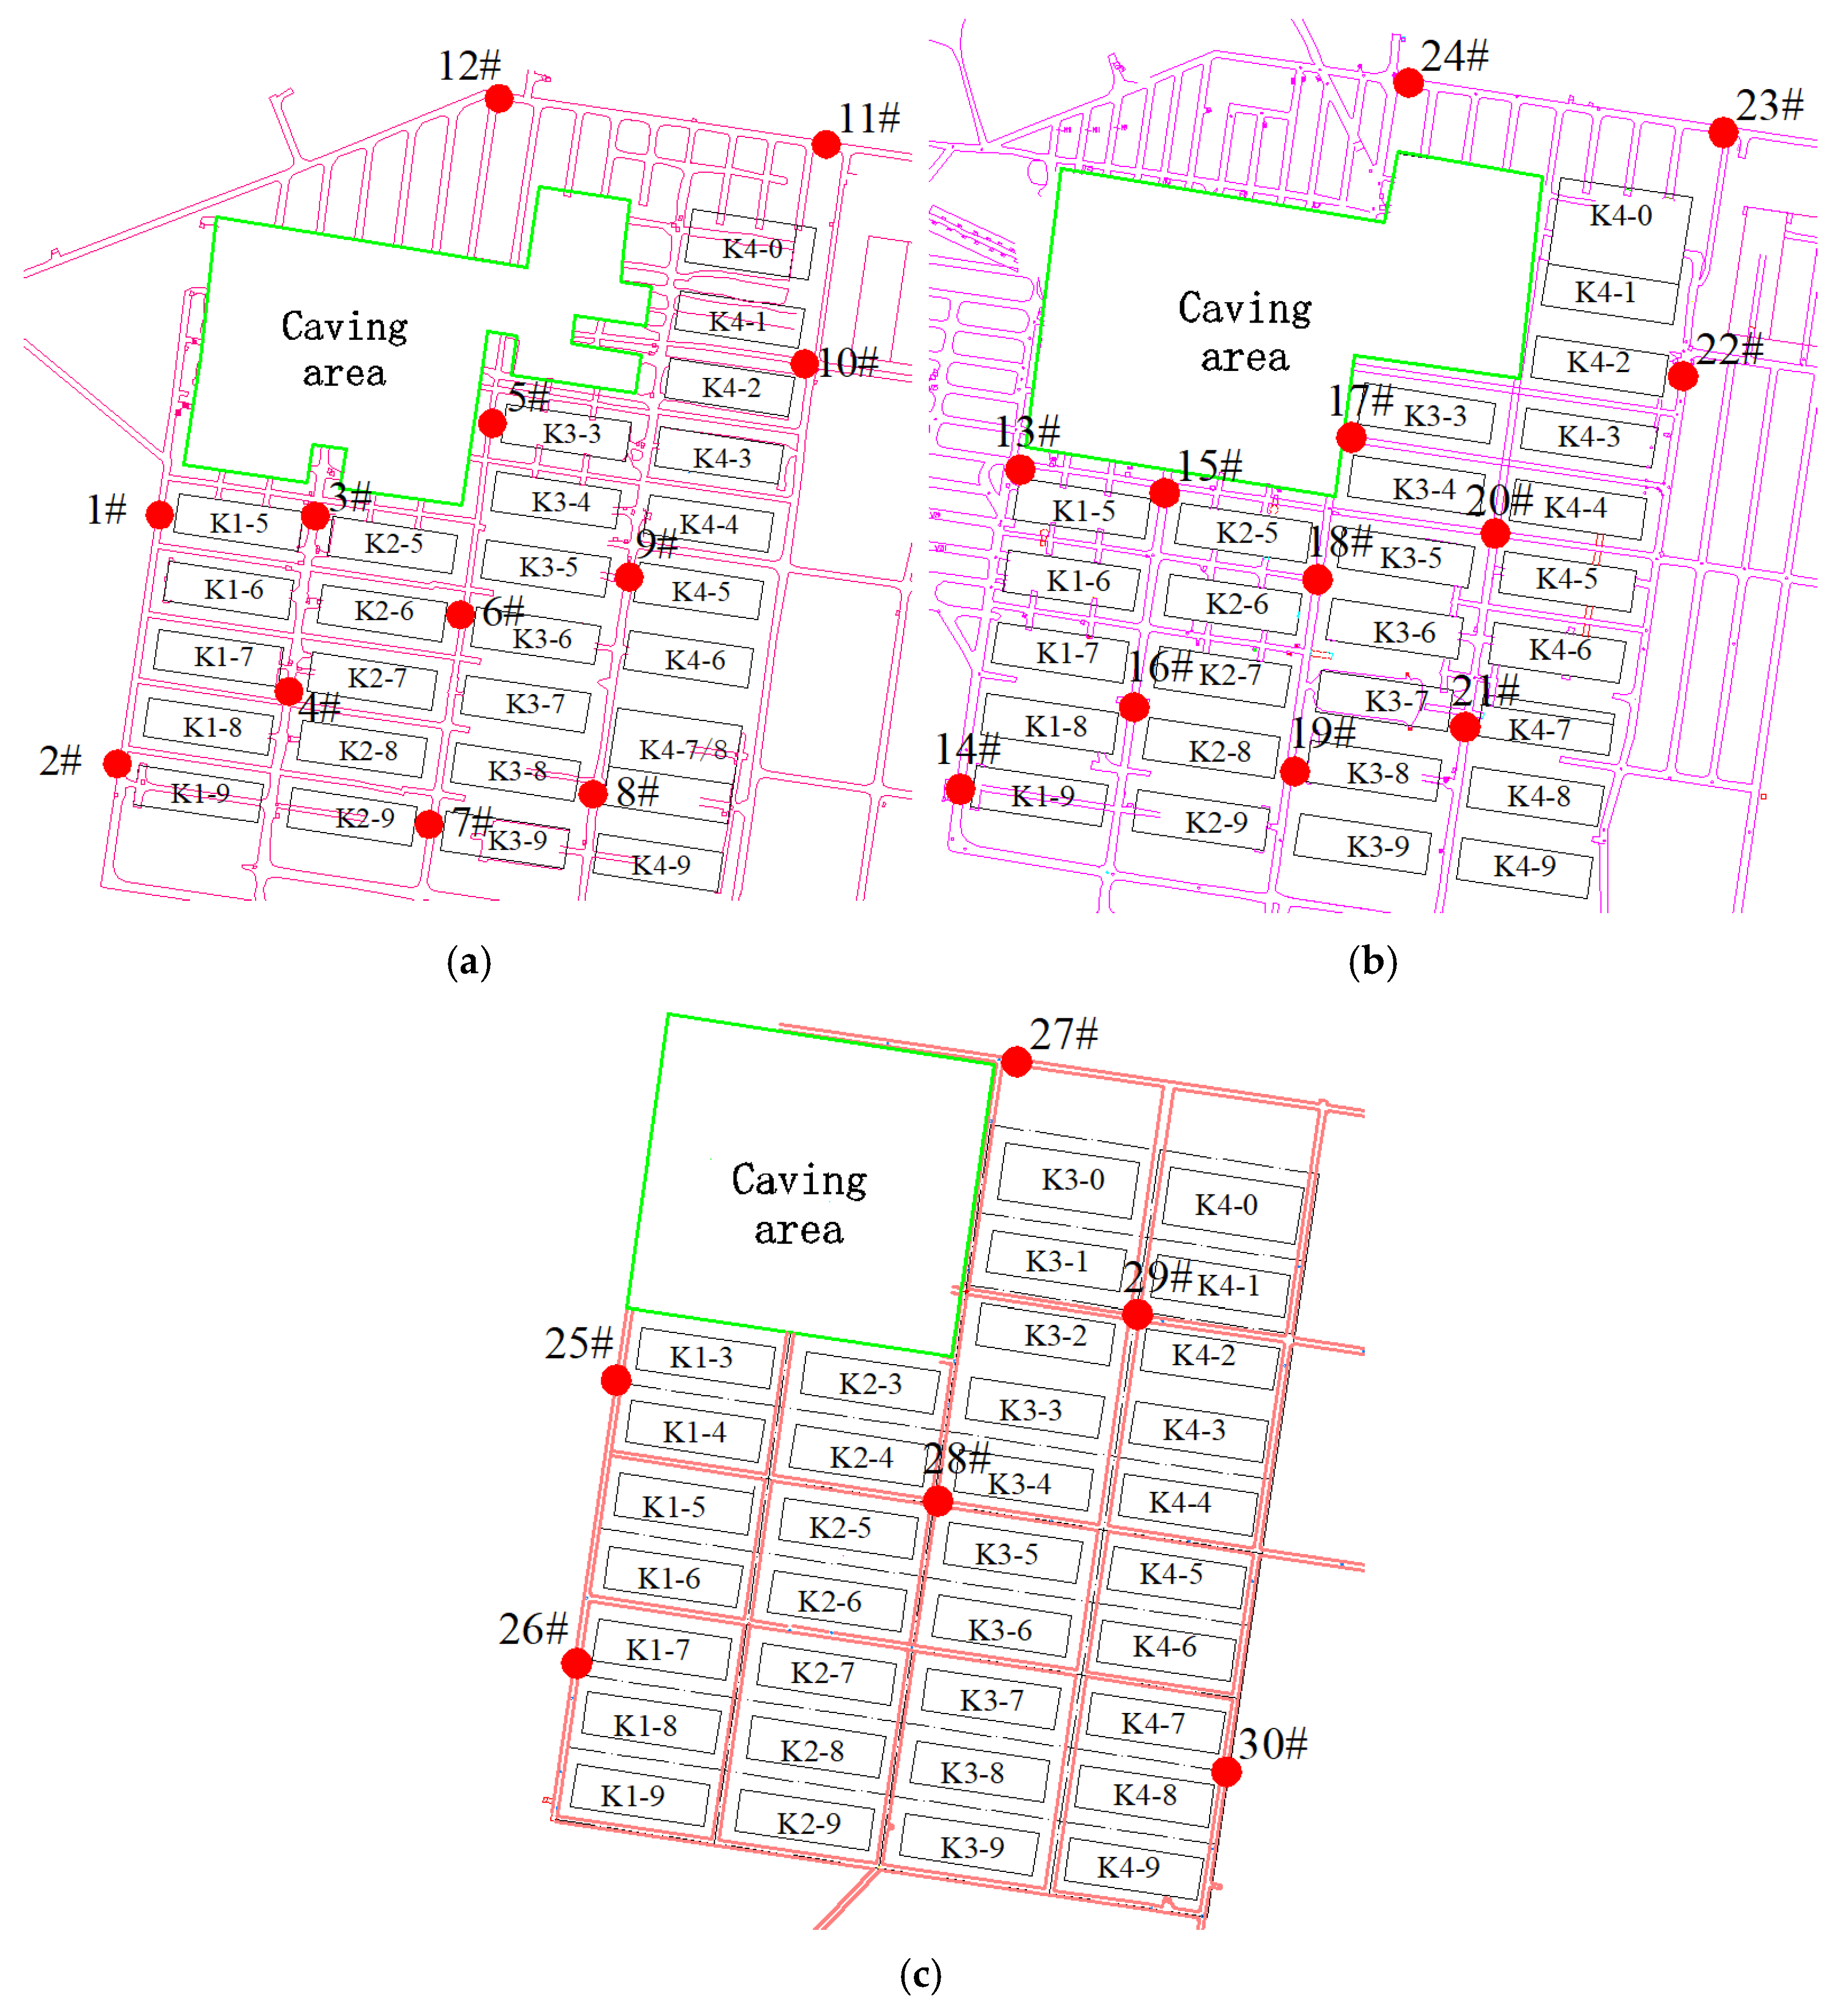
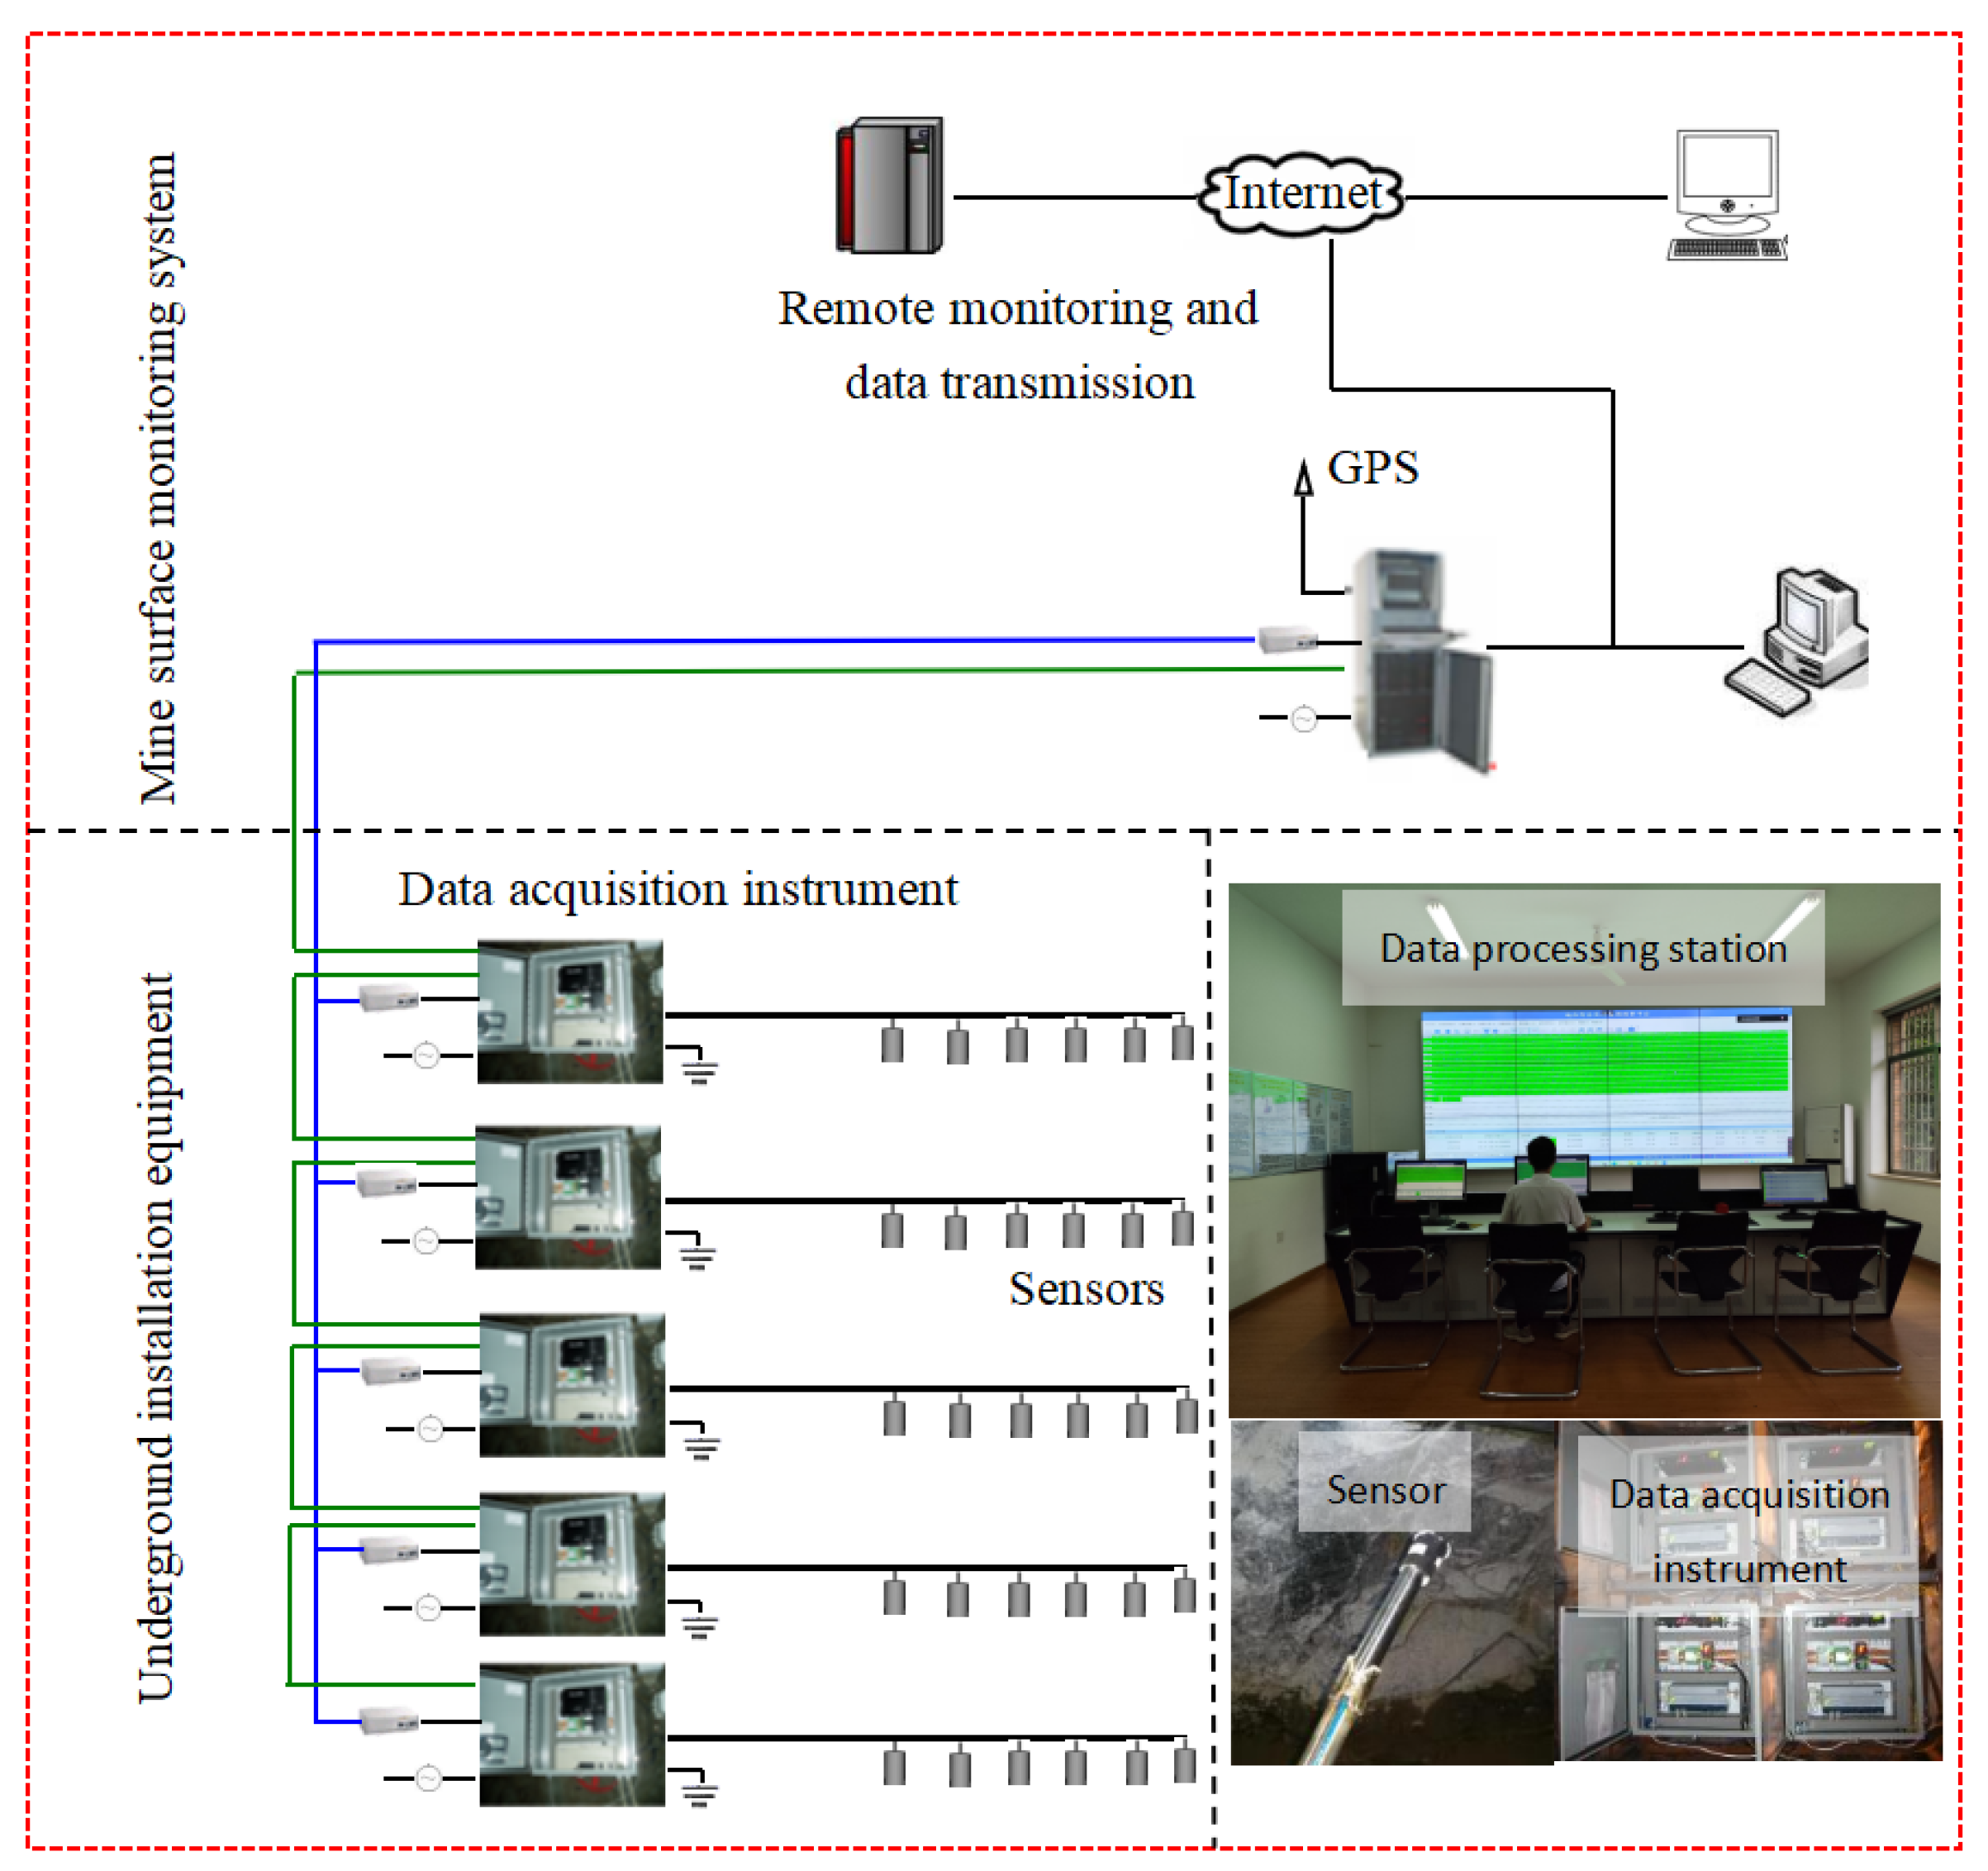
2.2. Introduction to the Microseismic Monitoring System

To monitor the stress distribution characteristics during pillar recovery operations, a 30-channel microseismic monitoring system was established in the mining area in 2008. The microseismic monitoring system of the Canadian ESG Company was adopted, with 24-bit analog-to-digital conversion and sampling frequency ranging from 3 Hz to 10 kHz. This system consists of sensors, paladin signal acquisition and processing system, time synchronization system, optical fiber data communication system and ground data comprehensive processing and analysis system. The system comprises five data acquisition units, each equipped with six single-axis acceleration microseismic sensors (sensitivity: 30 V/g; maximum output signal of the sensor is ±5 V; frequency response range: 50–5000 Hz). The 30 sensors were distributed across three mining levels: 12 sensors at the 514 m level, 6 sensors at the 558 m level, and 6 sensors at the 630 m level, as shown in Figure 3. The system consists of two major components: the surface monitoring system and the underground monitoring system. The surface monitoring system includes a local monitoring station and a remote data analysis station, while the underground monitoring system primarily comprises the underground microseismic sensors and data acquisition units. A schematic of the system’s configuration and signal transmission method is shown in Figure 4. In 2010, the mine further expanded the microseismic monitoring system to 36 channels.
Figure 3. Sensor distribution map: (a) 514 m, (b) 558 m, (c) 630 m.
Figure 4. Schematic of the monitoring system configuration.

3. Microseismic Monitoring Results of Blasting-Induced Landslide

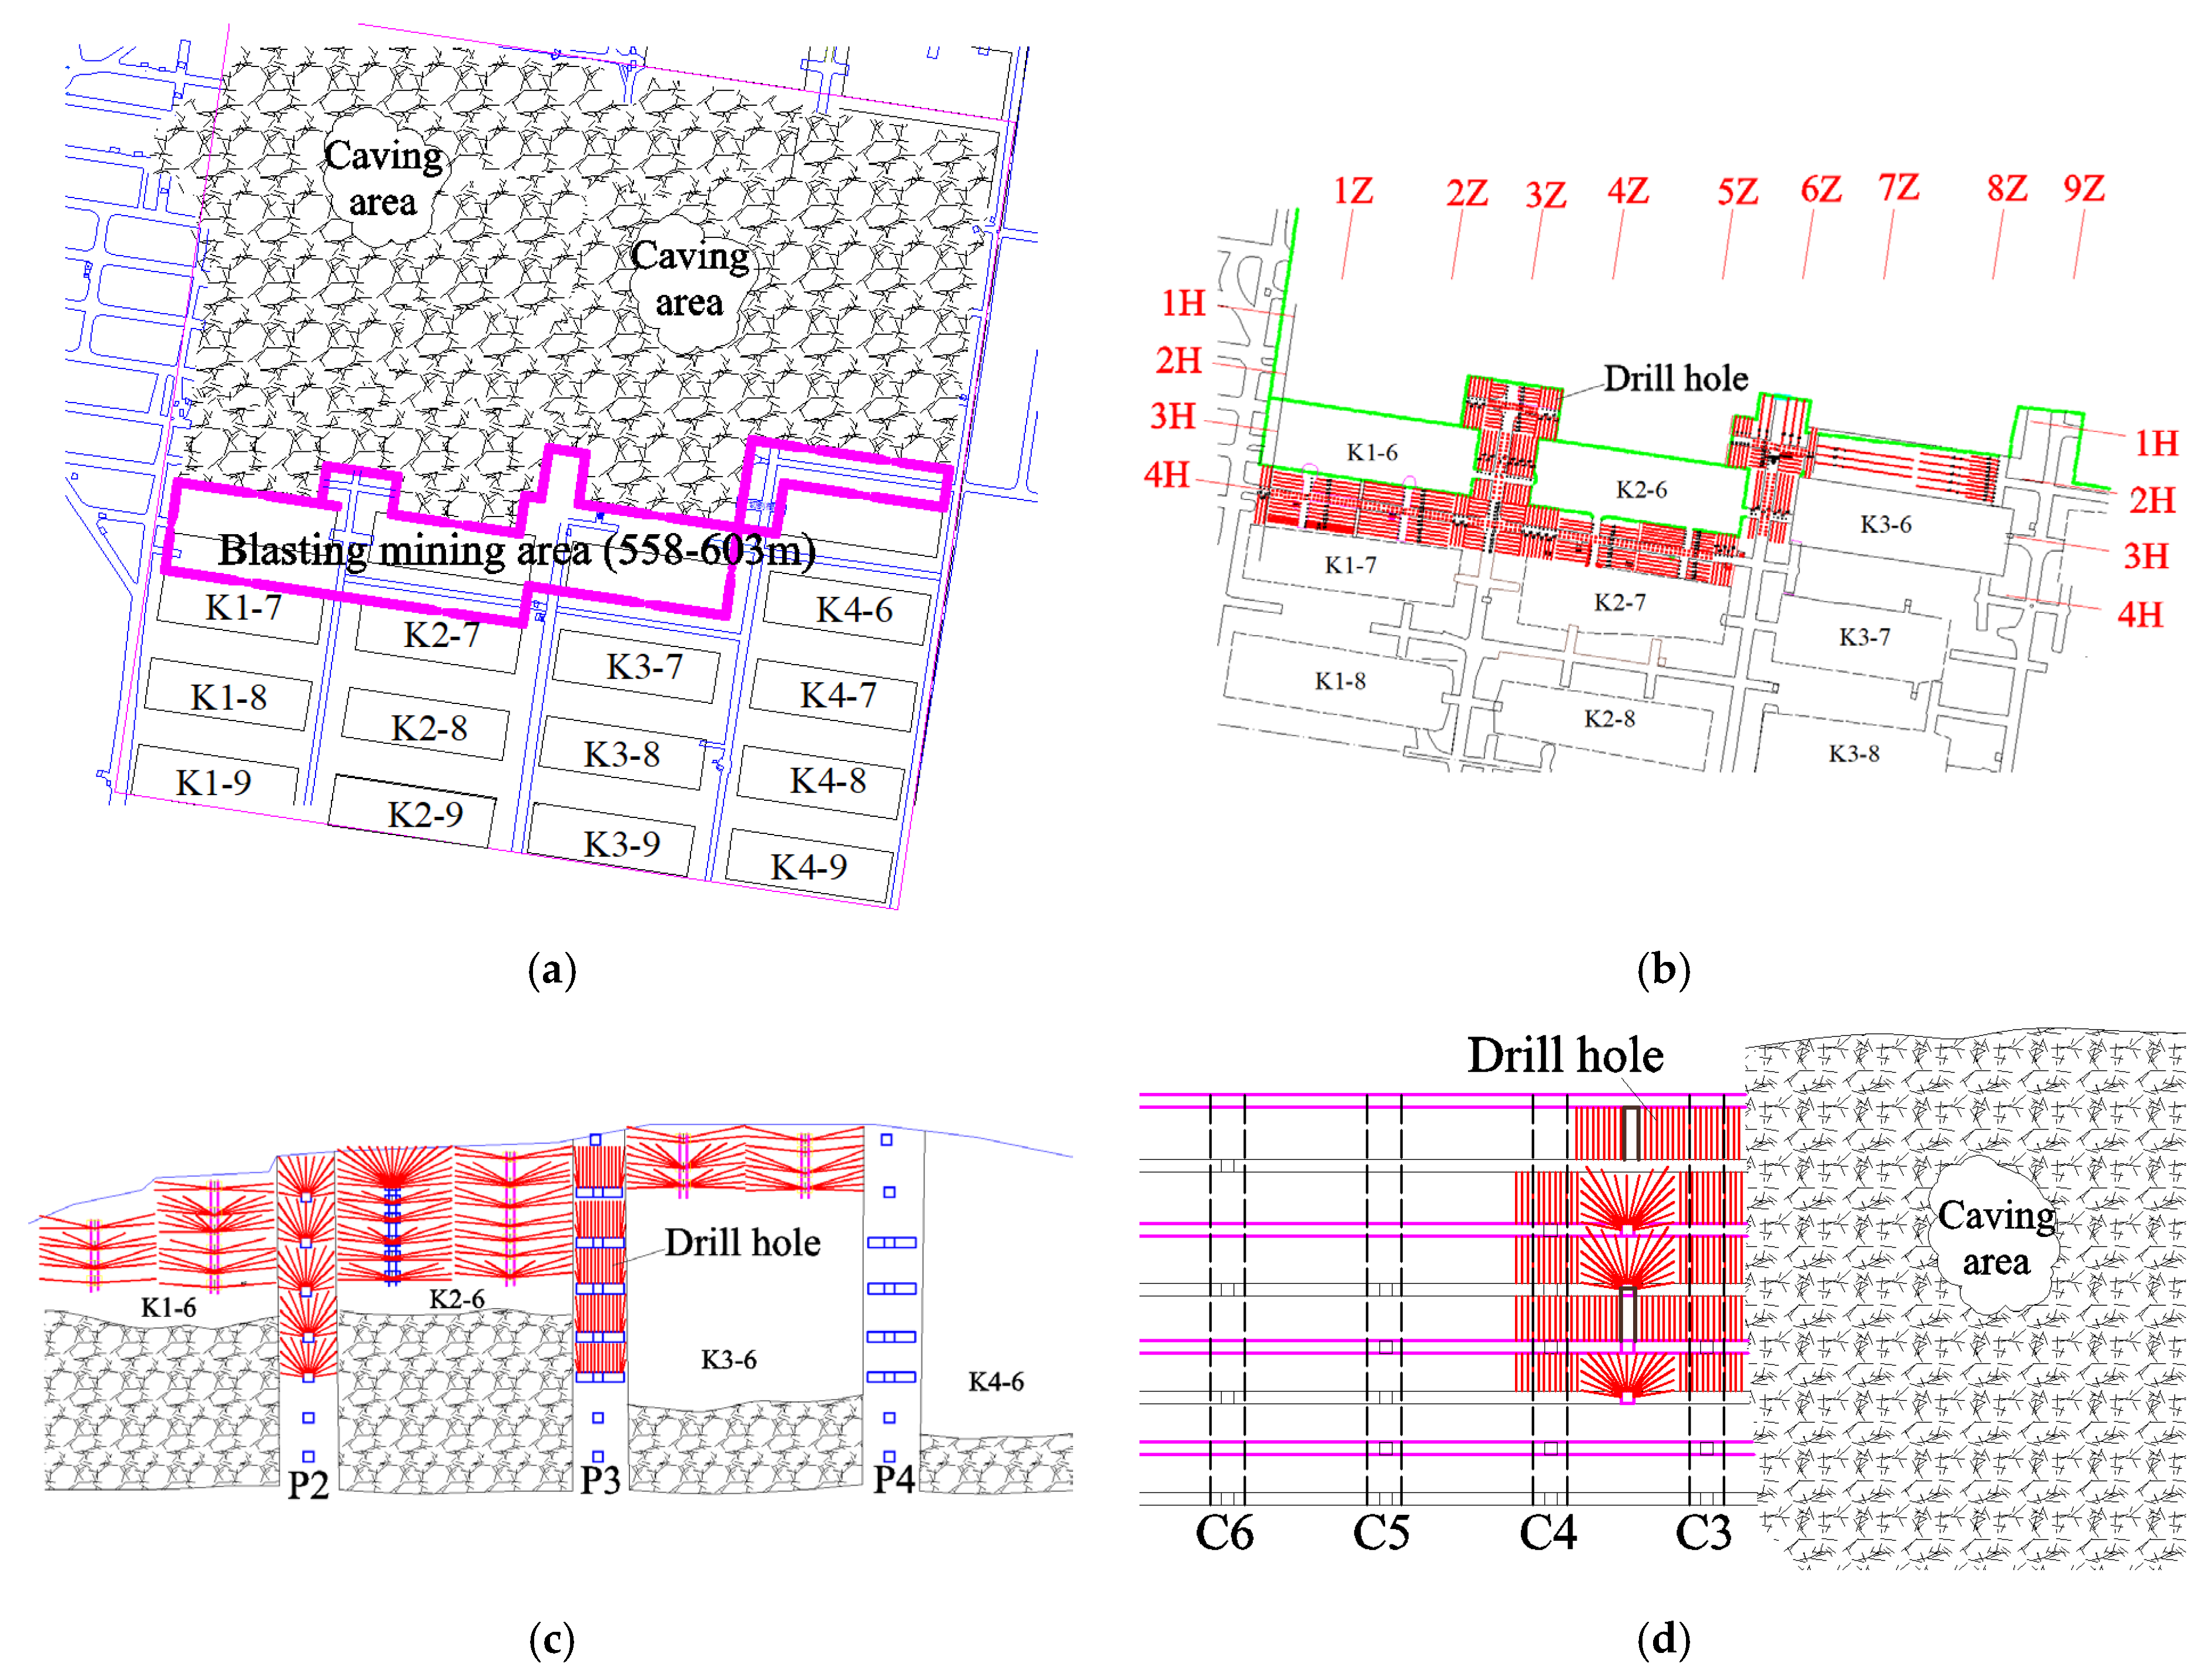
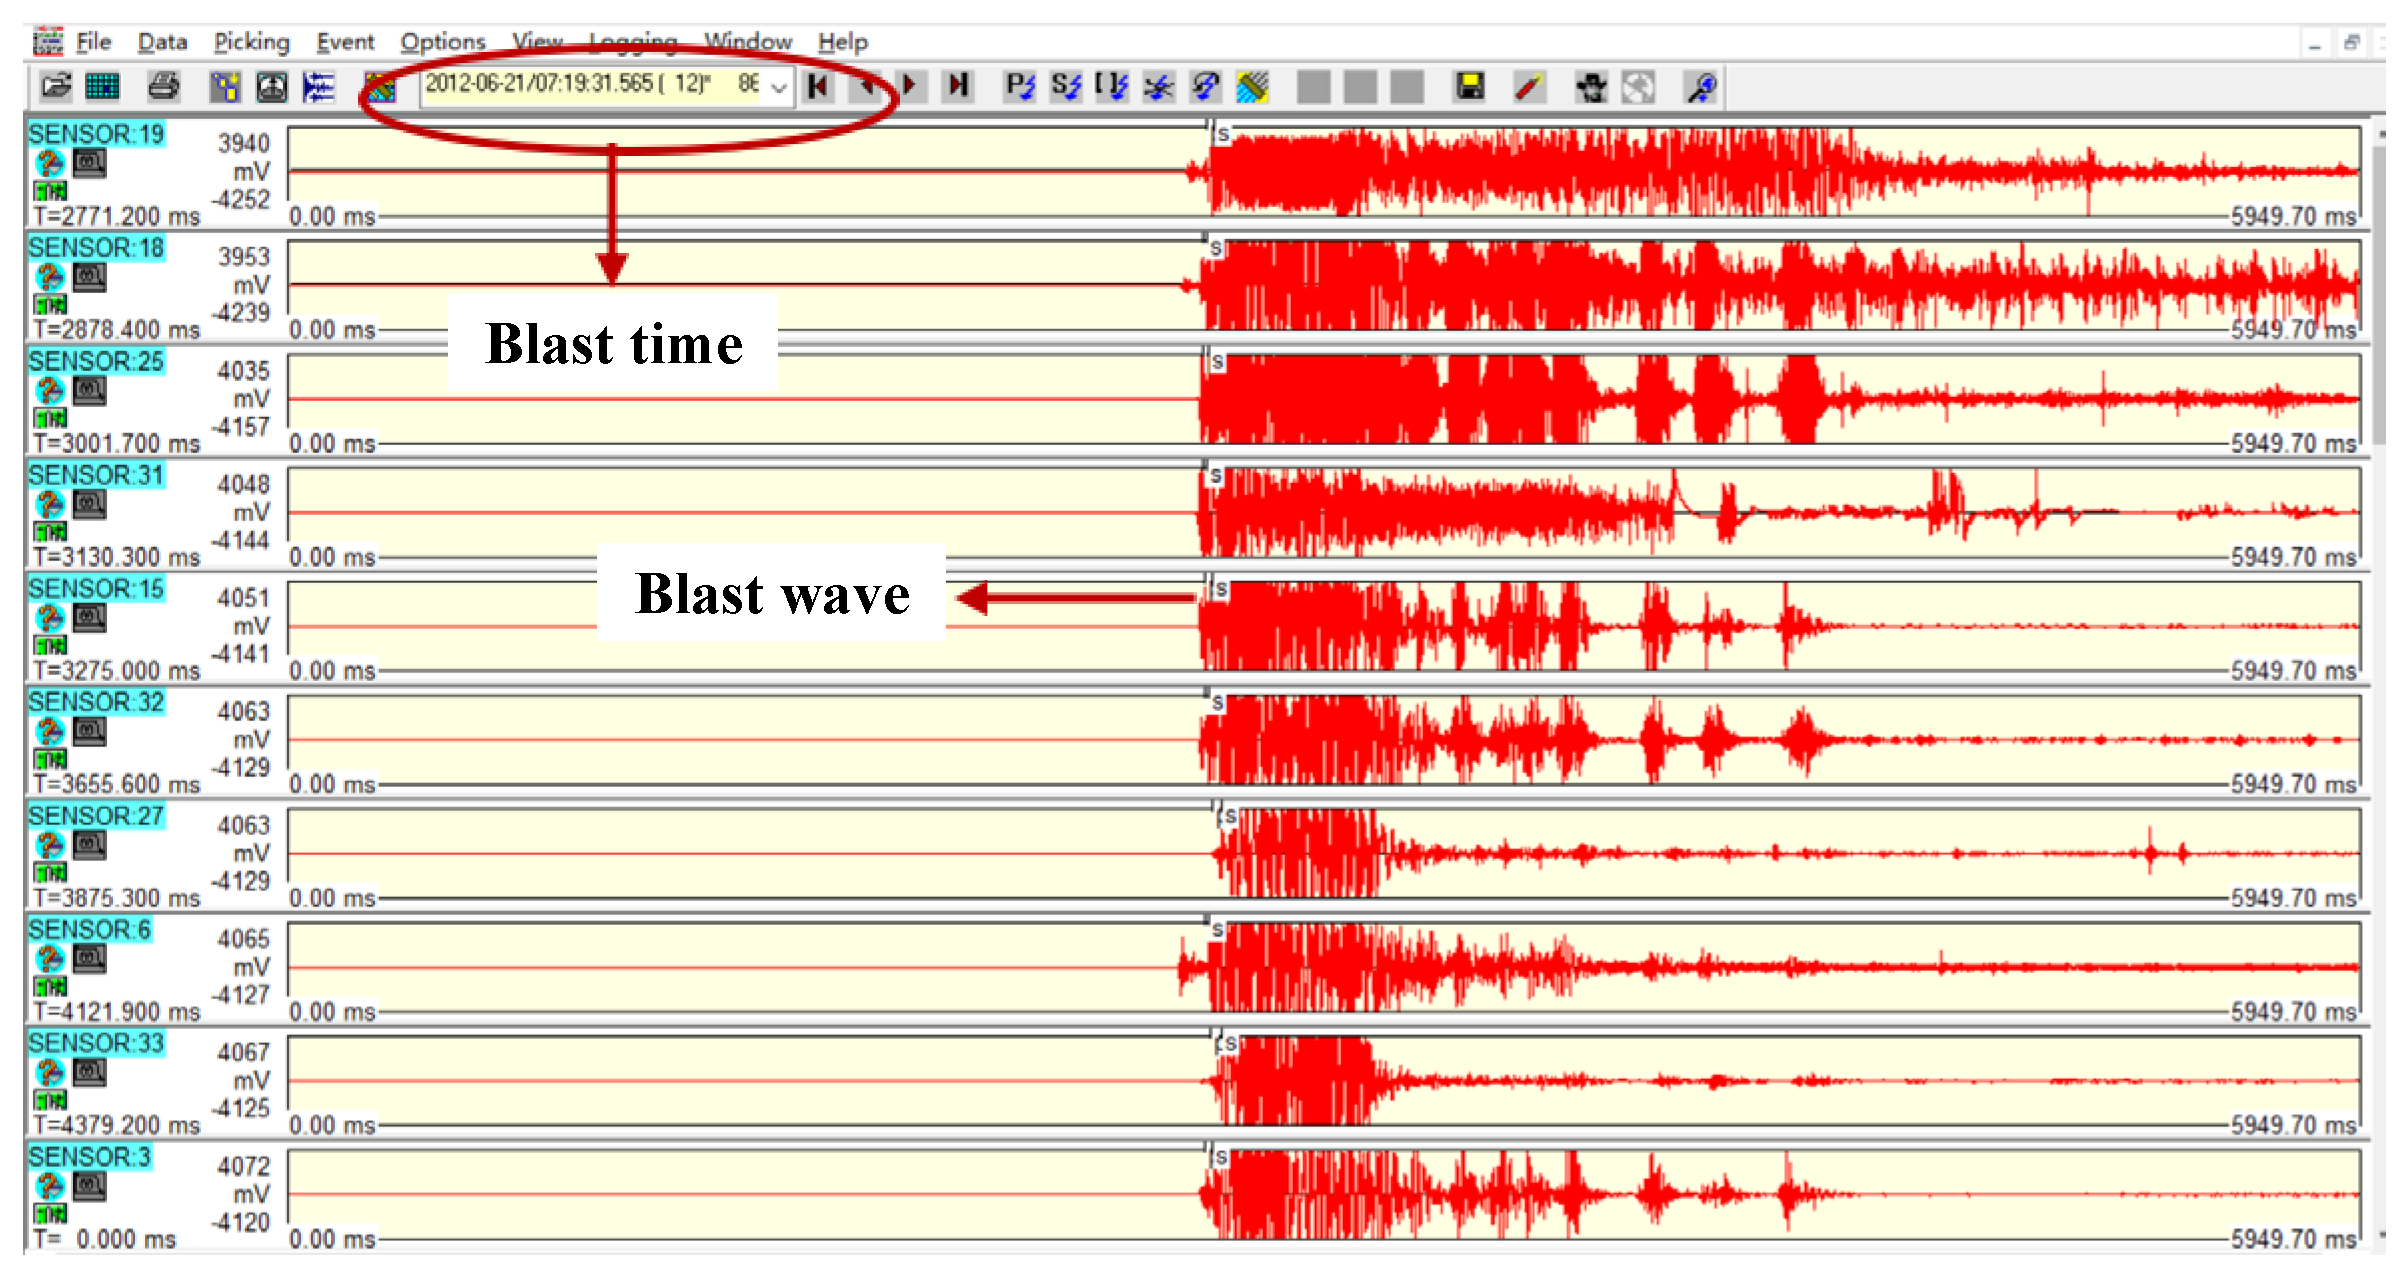
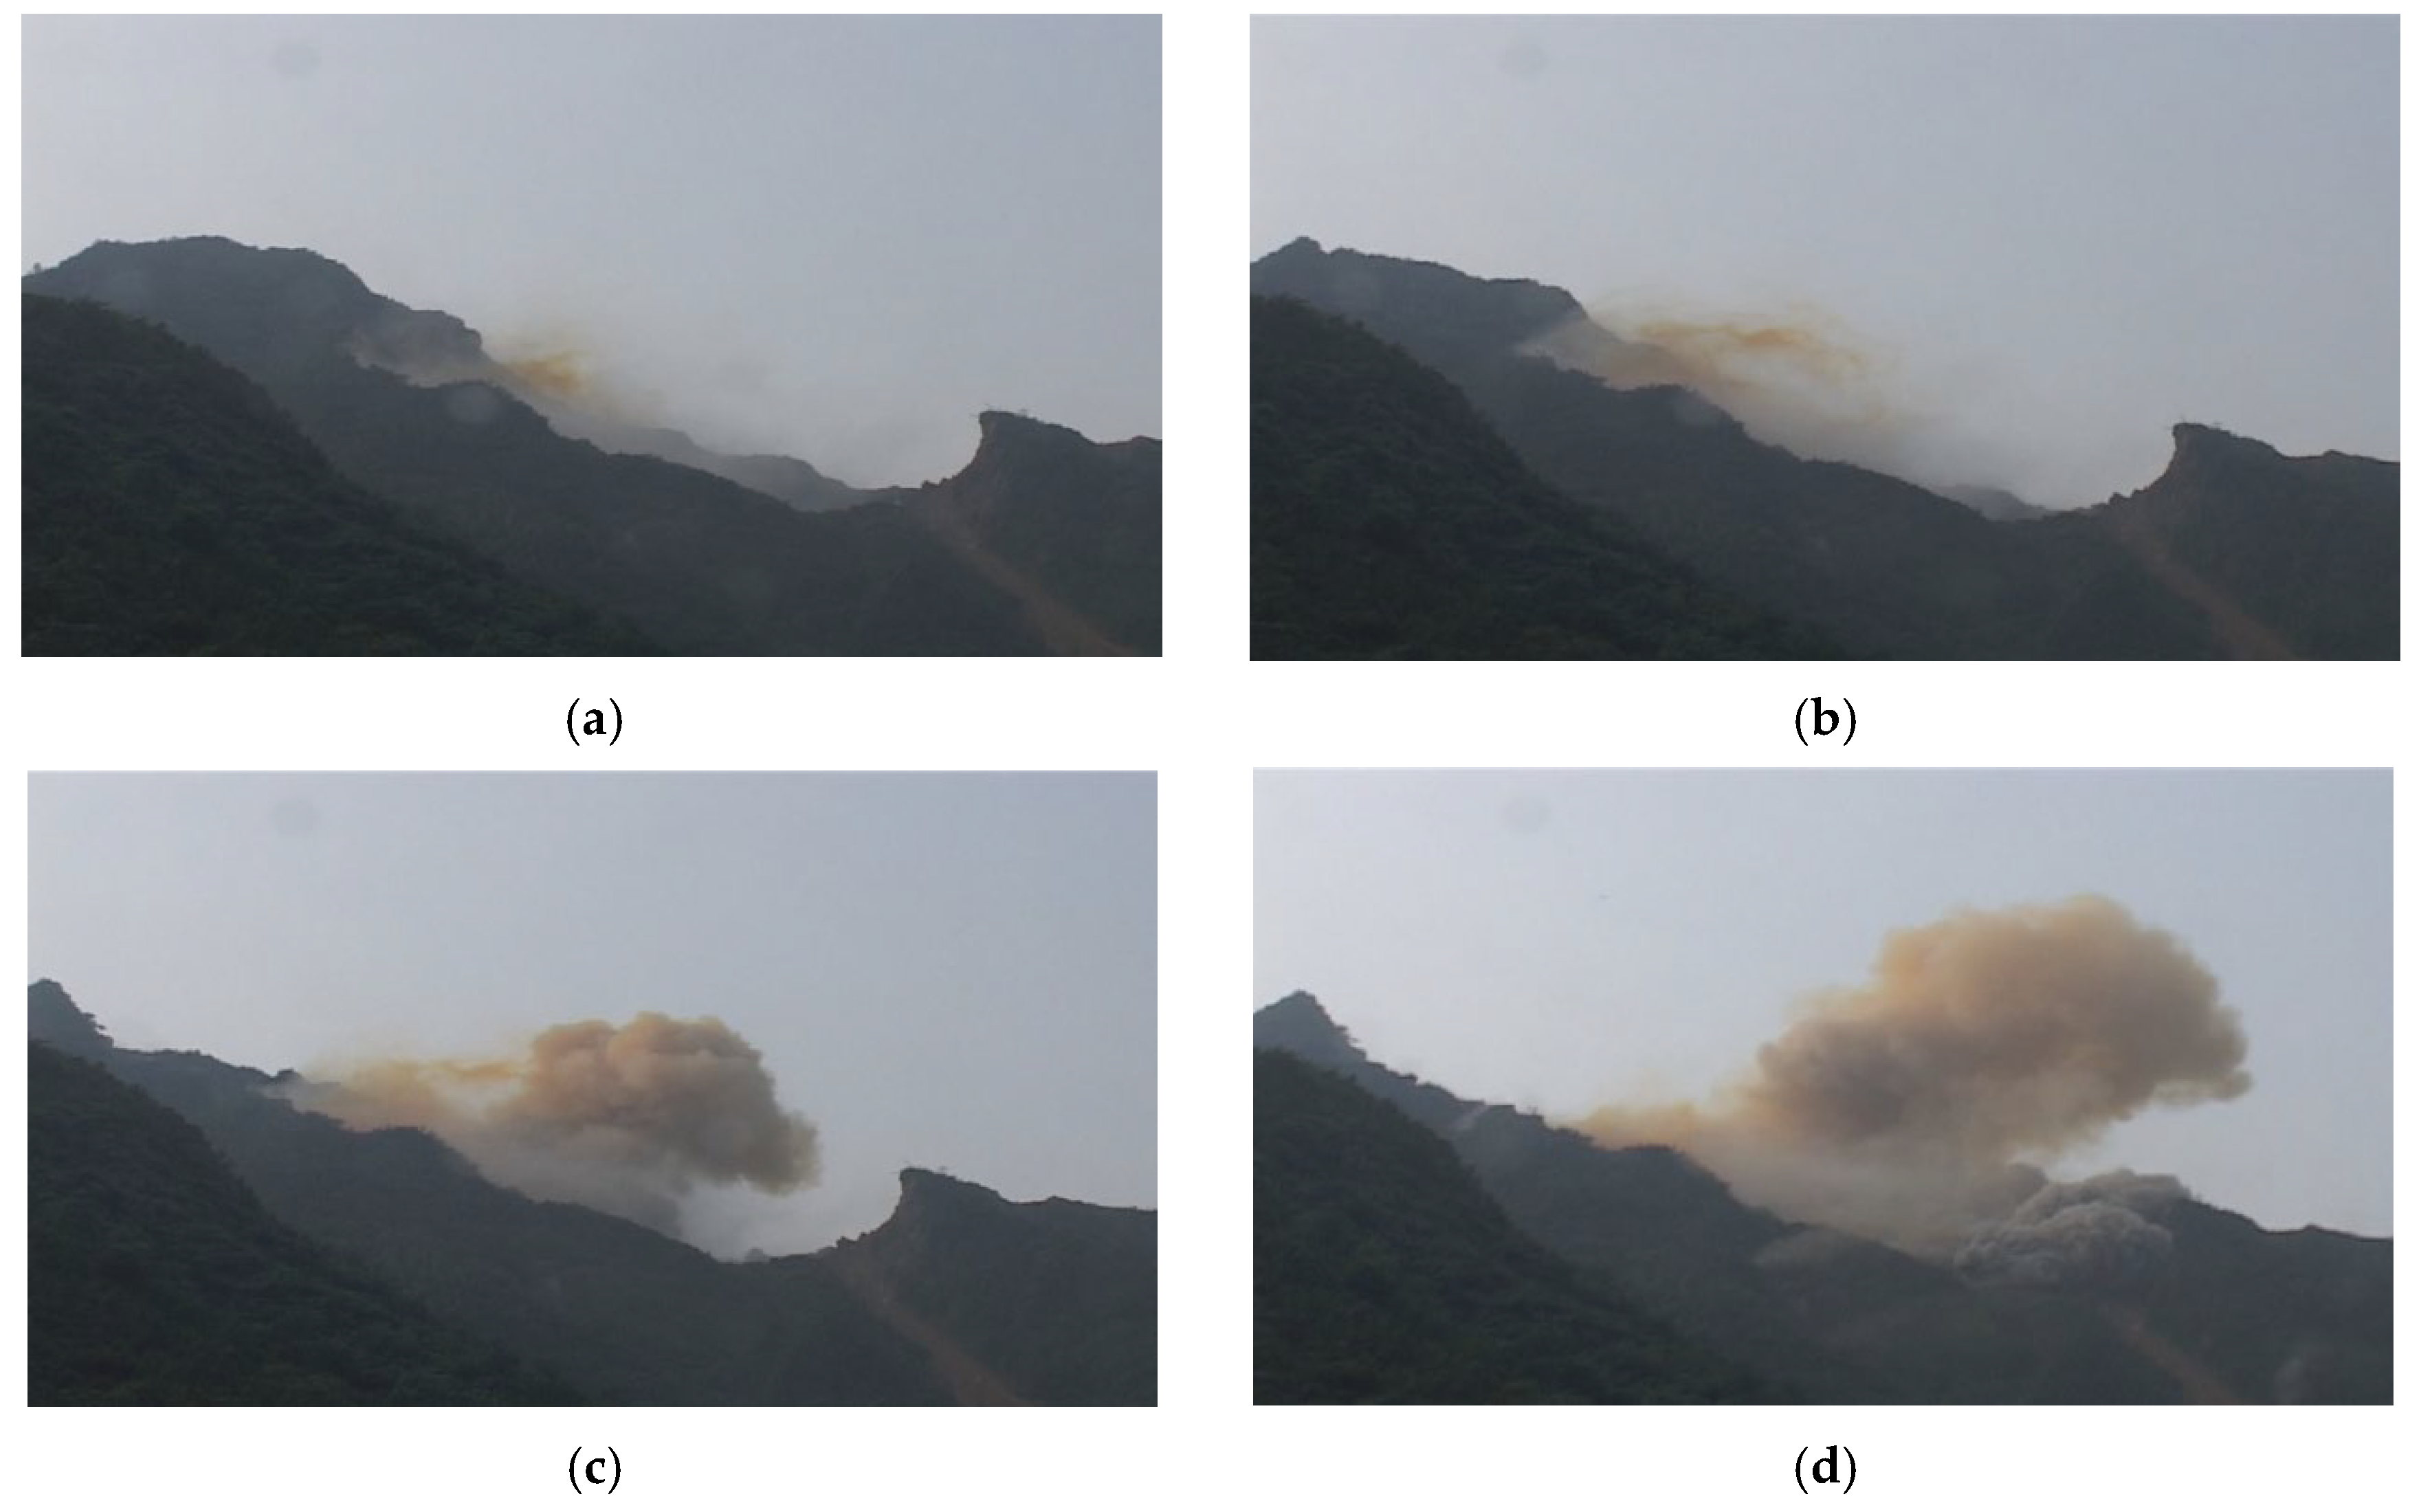
3.1. Blasting Operations

The Shizhuyuan polymetallic mine conducted multiple large-scale ore pillar recovery blasting operations starting in 2006. By 2012, over half of the ore pillars had been recovered, and the goaf was filled with caved ore and surrounding rock. Following the planned mining sequence, a 419-ton underground blasting operation was carried out on 21 June 2012. This major blasting event employed medium-depth open-stope blasting, targeting the K1-6, K2-6, K3-6, and K4-5 hanging wall ore bodies and pillar zones. Figure 5 shows the drilling layout of the blasting.
Figure 5. Drilling layout of the blasting project: (a) plan of the blasting area, (b) plan view at the 558 m level, (c) 3H sectional view, (d) 3Z sectional view.
The “6.21” major blasting operation utilized large-scale directional stratified controlled blasting, with a designed total explosive consumption of 419,250 kg, including 417,085 kg of multi-hole granular ammonium nitrate fuel oil and 2165 kg of No. 2 rock emulsion explosive. A total of 12,318 non-electric delay detonators and 27,000 m of ordinary detonating cord were used to achieve a caving volume of 1.186 million metric tons of ore.

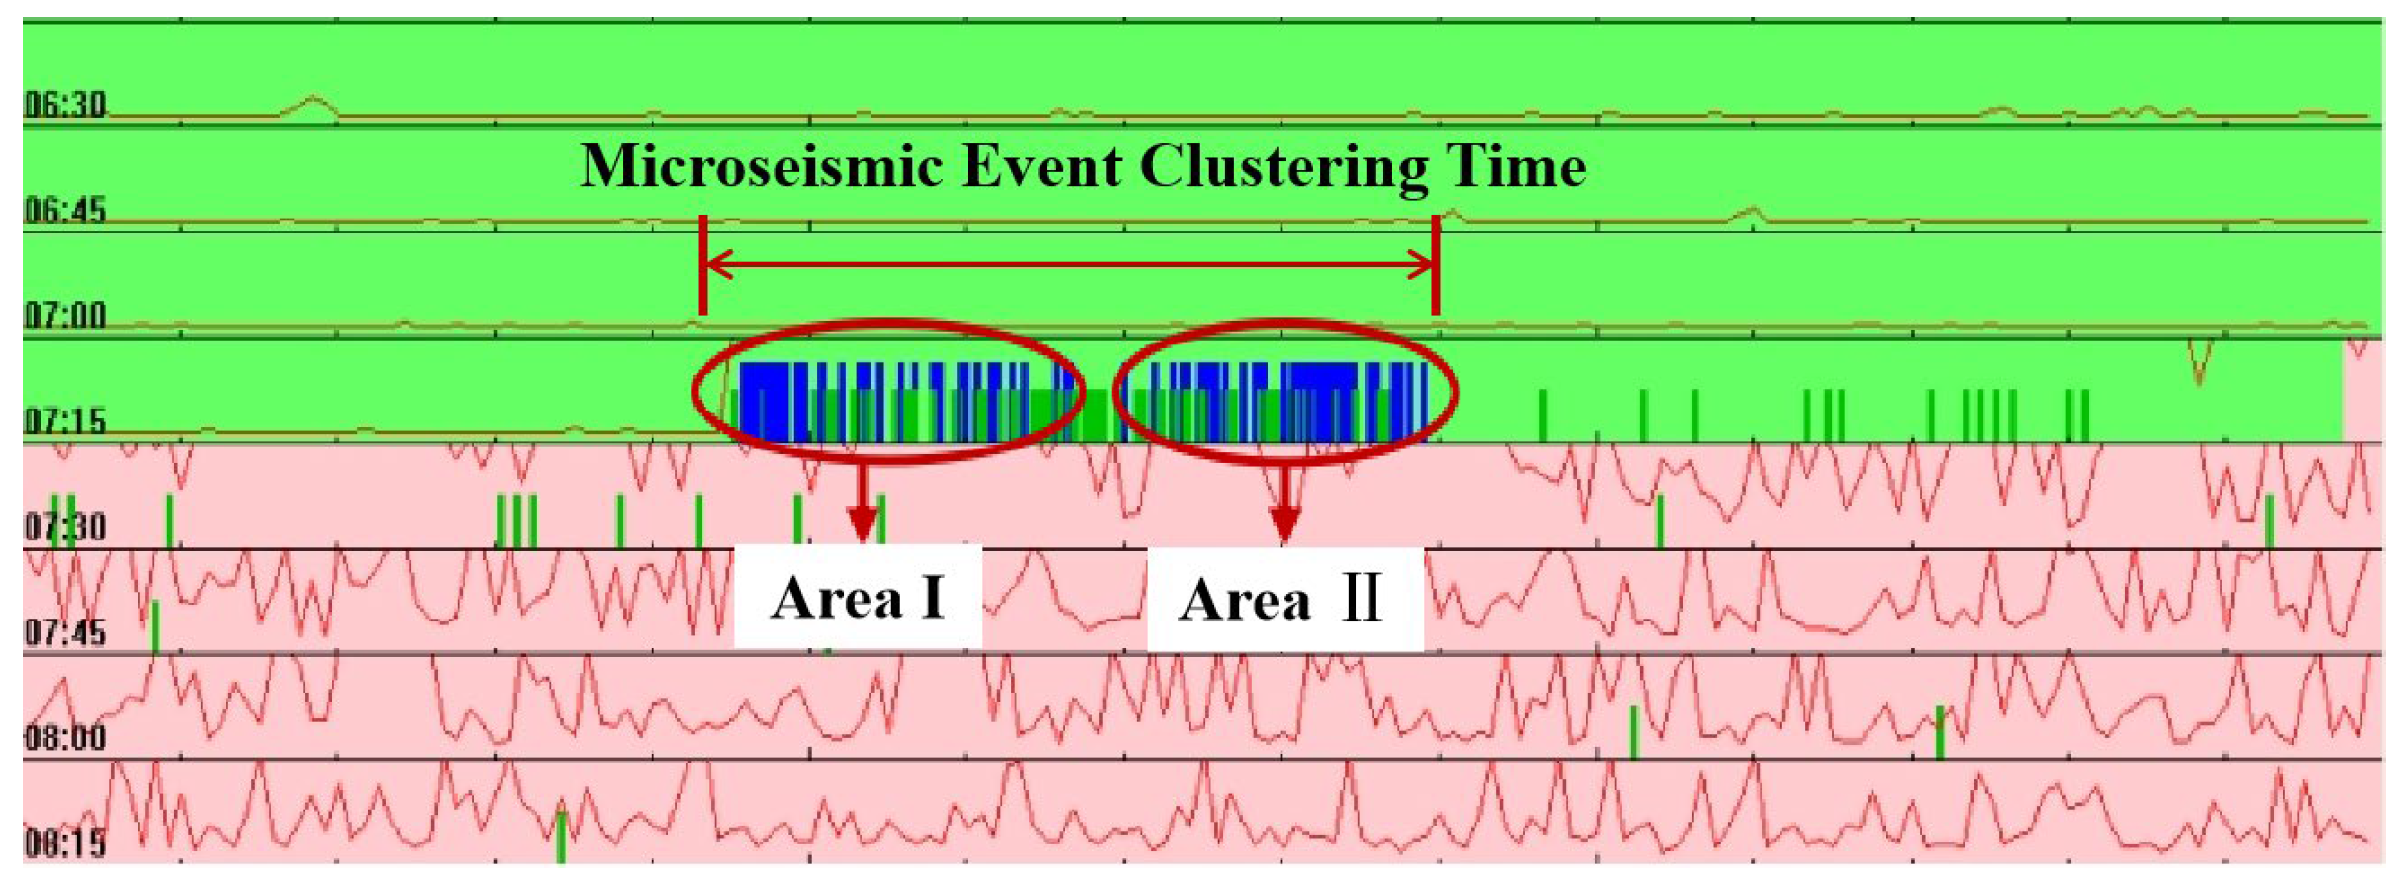
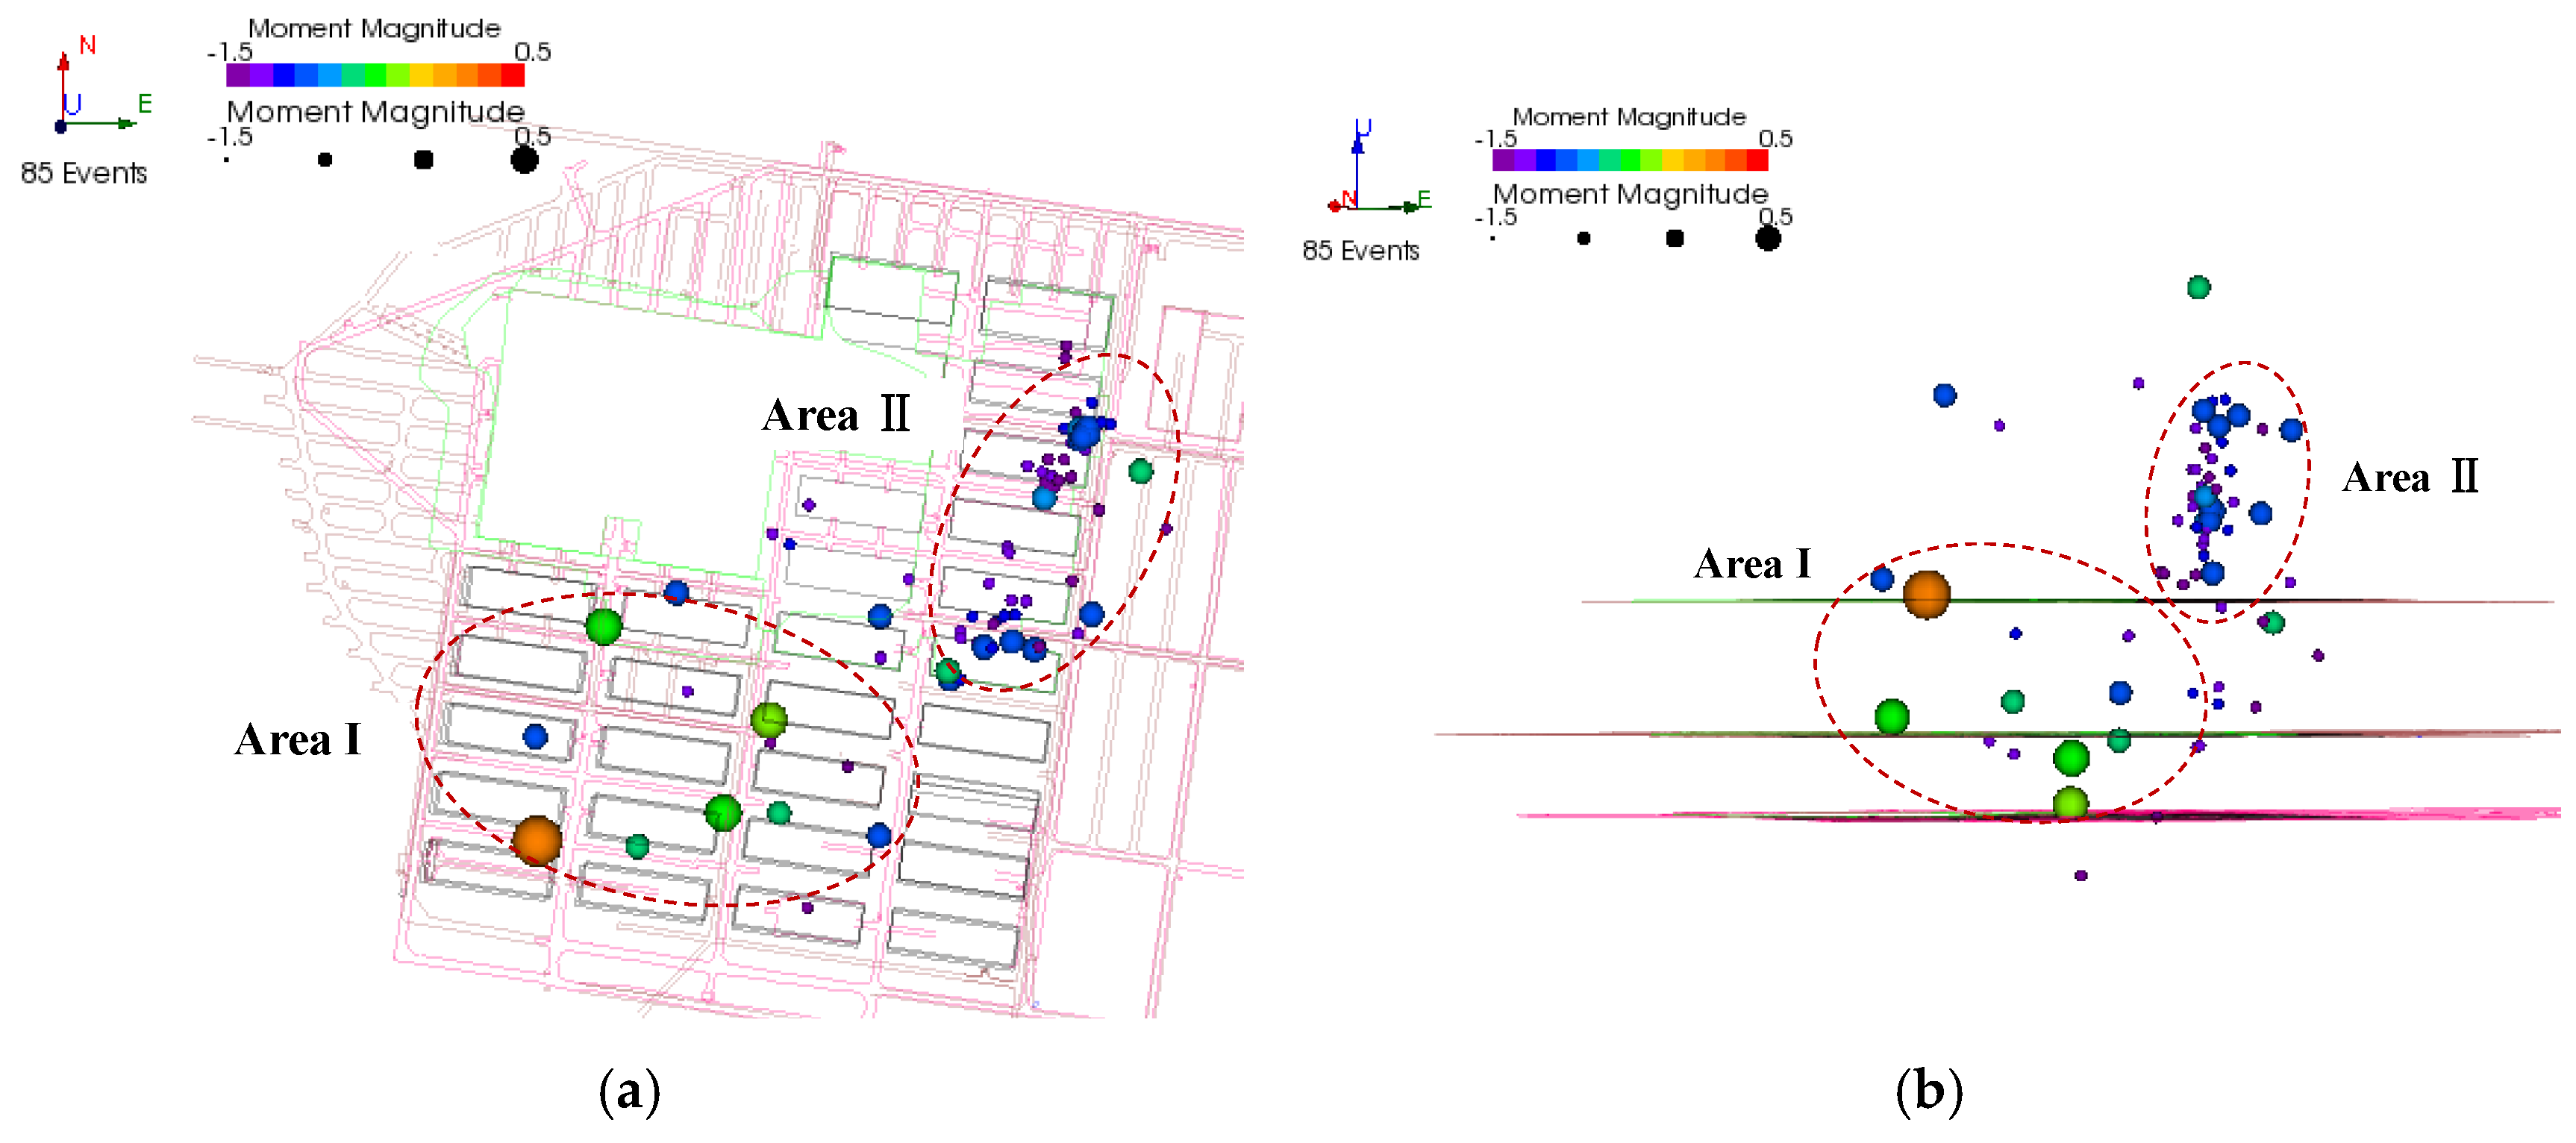
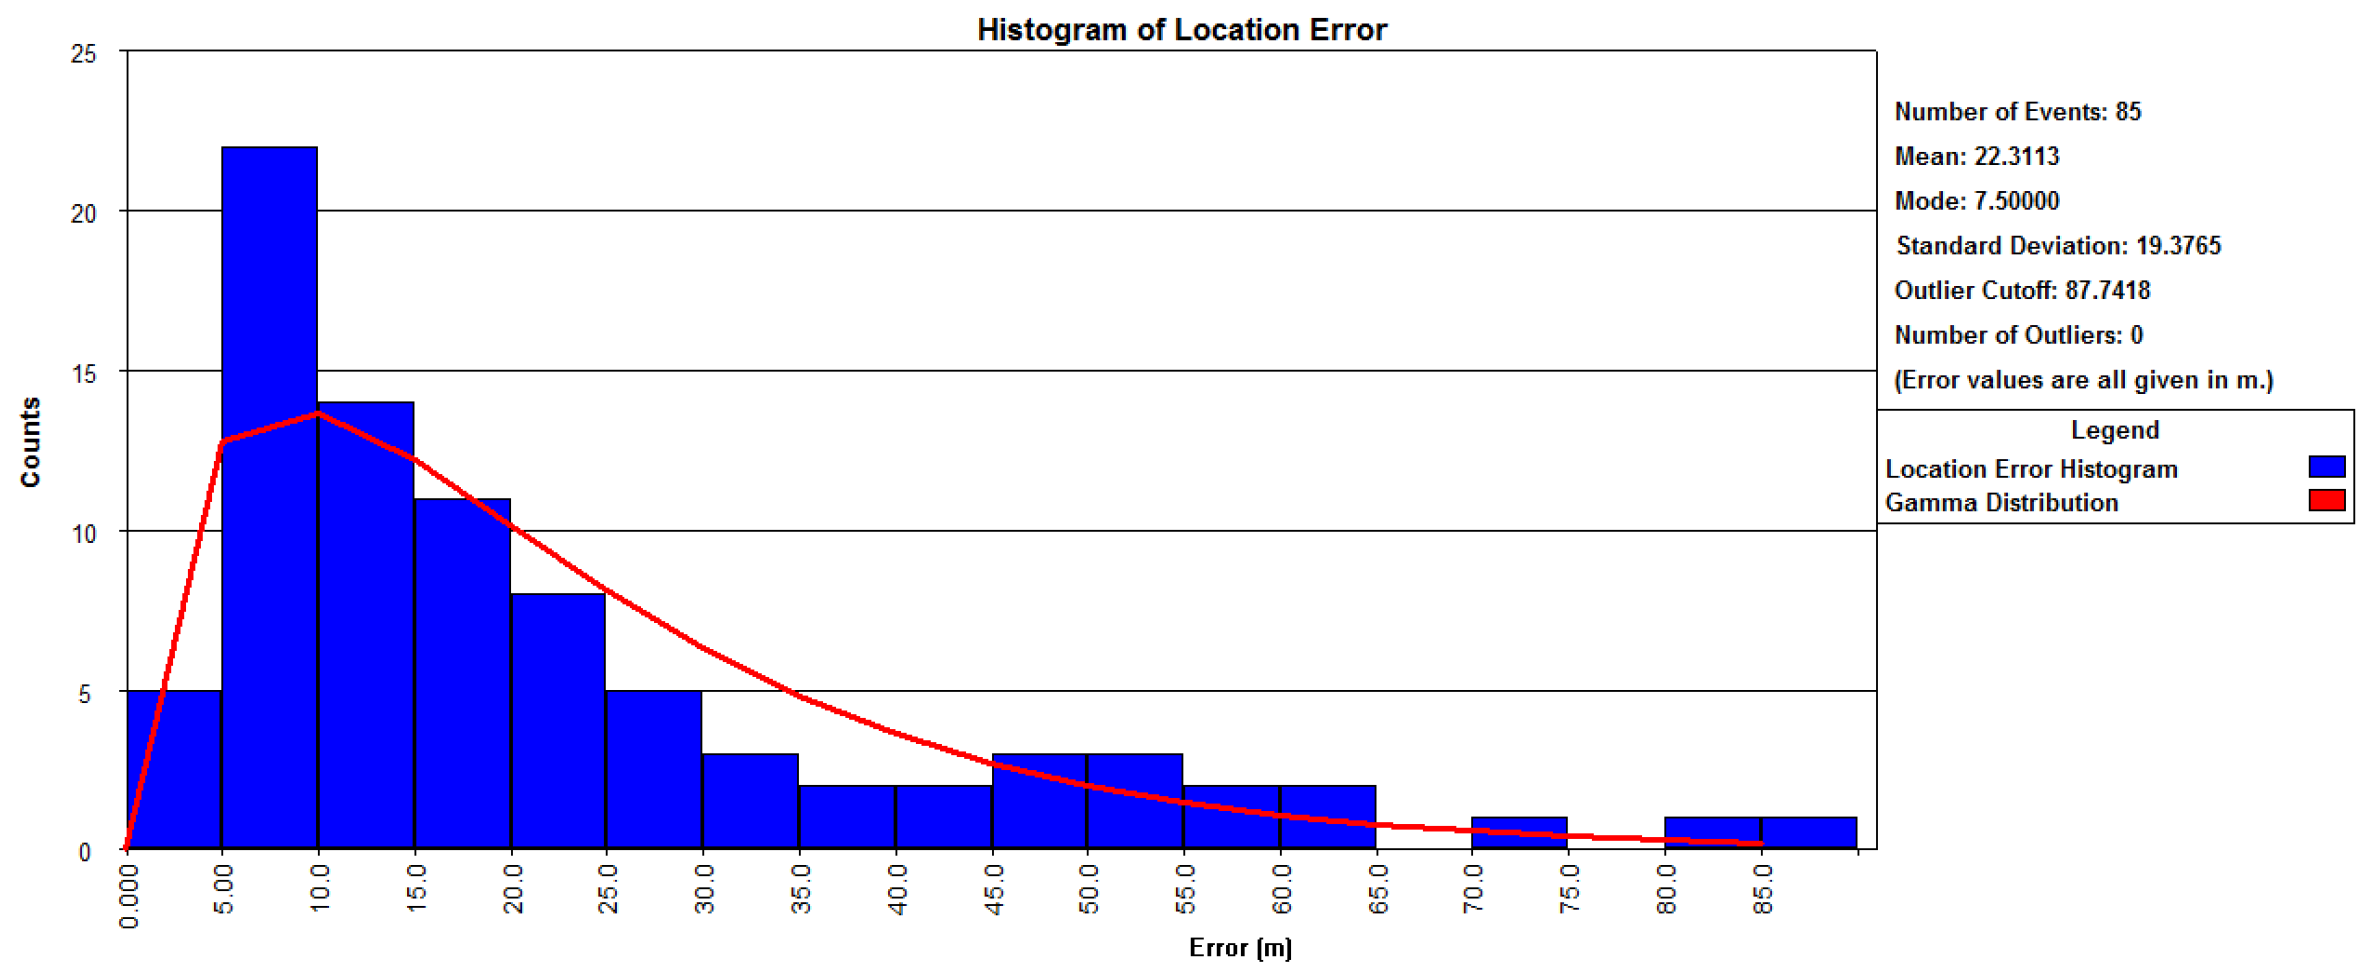
3.2. Microseismic Monitoring Results of the Major Blasting Event

The microseismic monitoring system recorded the precise blasting time as 21 June 2012, at 07:19:31.565. The waveforms of the major blasting event captured by the microseismic monitoring system are shown in Figure 6.
Figure 6. Microseismic monitoring waveforms of the major blasting event.
Within 5 min after the major blasting event, two clusters of densely located microseismic events (blue stripes) were recorded by the microseismic monitoring system (see Figure 7), totaling 85 microseismic events. The first cluster occurred within 3 min post-blasting, with spatial distribution primarily concentrated in Zone I. The second cluster, observed between 3 and 5 min post-blasting, was mainly localized in Zone II, indicating that the major blasting induced two distinct phases of rock mass fracturing activity.
Figure 7. Real-time monitoring interface.
Spatially, the post-blasting located events were distributed across two primary regions (Figure 8):
Figure 8. Microseismic event location map: (a) plan view, (b) sectional view.
  • Zone I: Elevations below 630 m, covering the P1–P3 and C6–C8 zones.
  • Zone II: Elevations above 630 m, covering the P4–P5 and C1–C6 zones.
The location error statistics for the 85 microseismic events are presented in Figure 9. The average location error was 22.3 m, with a standard deviation of 19.3 m and a modal error of 7.5 m. These results confirm the high spatial accuracy of the microseismic event localization. Field observations revealed that 5 min after the blasting, a large-scale landslide occurred in the overlying mountain body above the blasting area. Cameras installed outside the warning zone recorded the entire landslide process triggered by the blasting. Sequential video frames from the event are shown in Figure 10, illustrating the temporal progression of the landslide.
Figure 9. Microseismic event location error statistics.
Figure 10. Photographs of the upper mountain body collapse process: (a) before landslide (time: 07:21:00), (b) onset of landslide (time: 07:23:13), (c) during landslide (time: 07:23:20), (d) after landslide (time: 07:24:23).

4. Microseismic Monitoring Analysis of Landslide

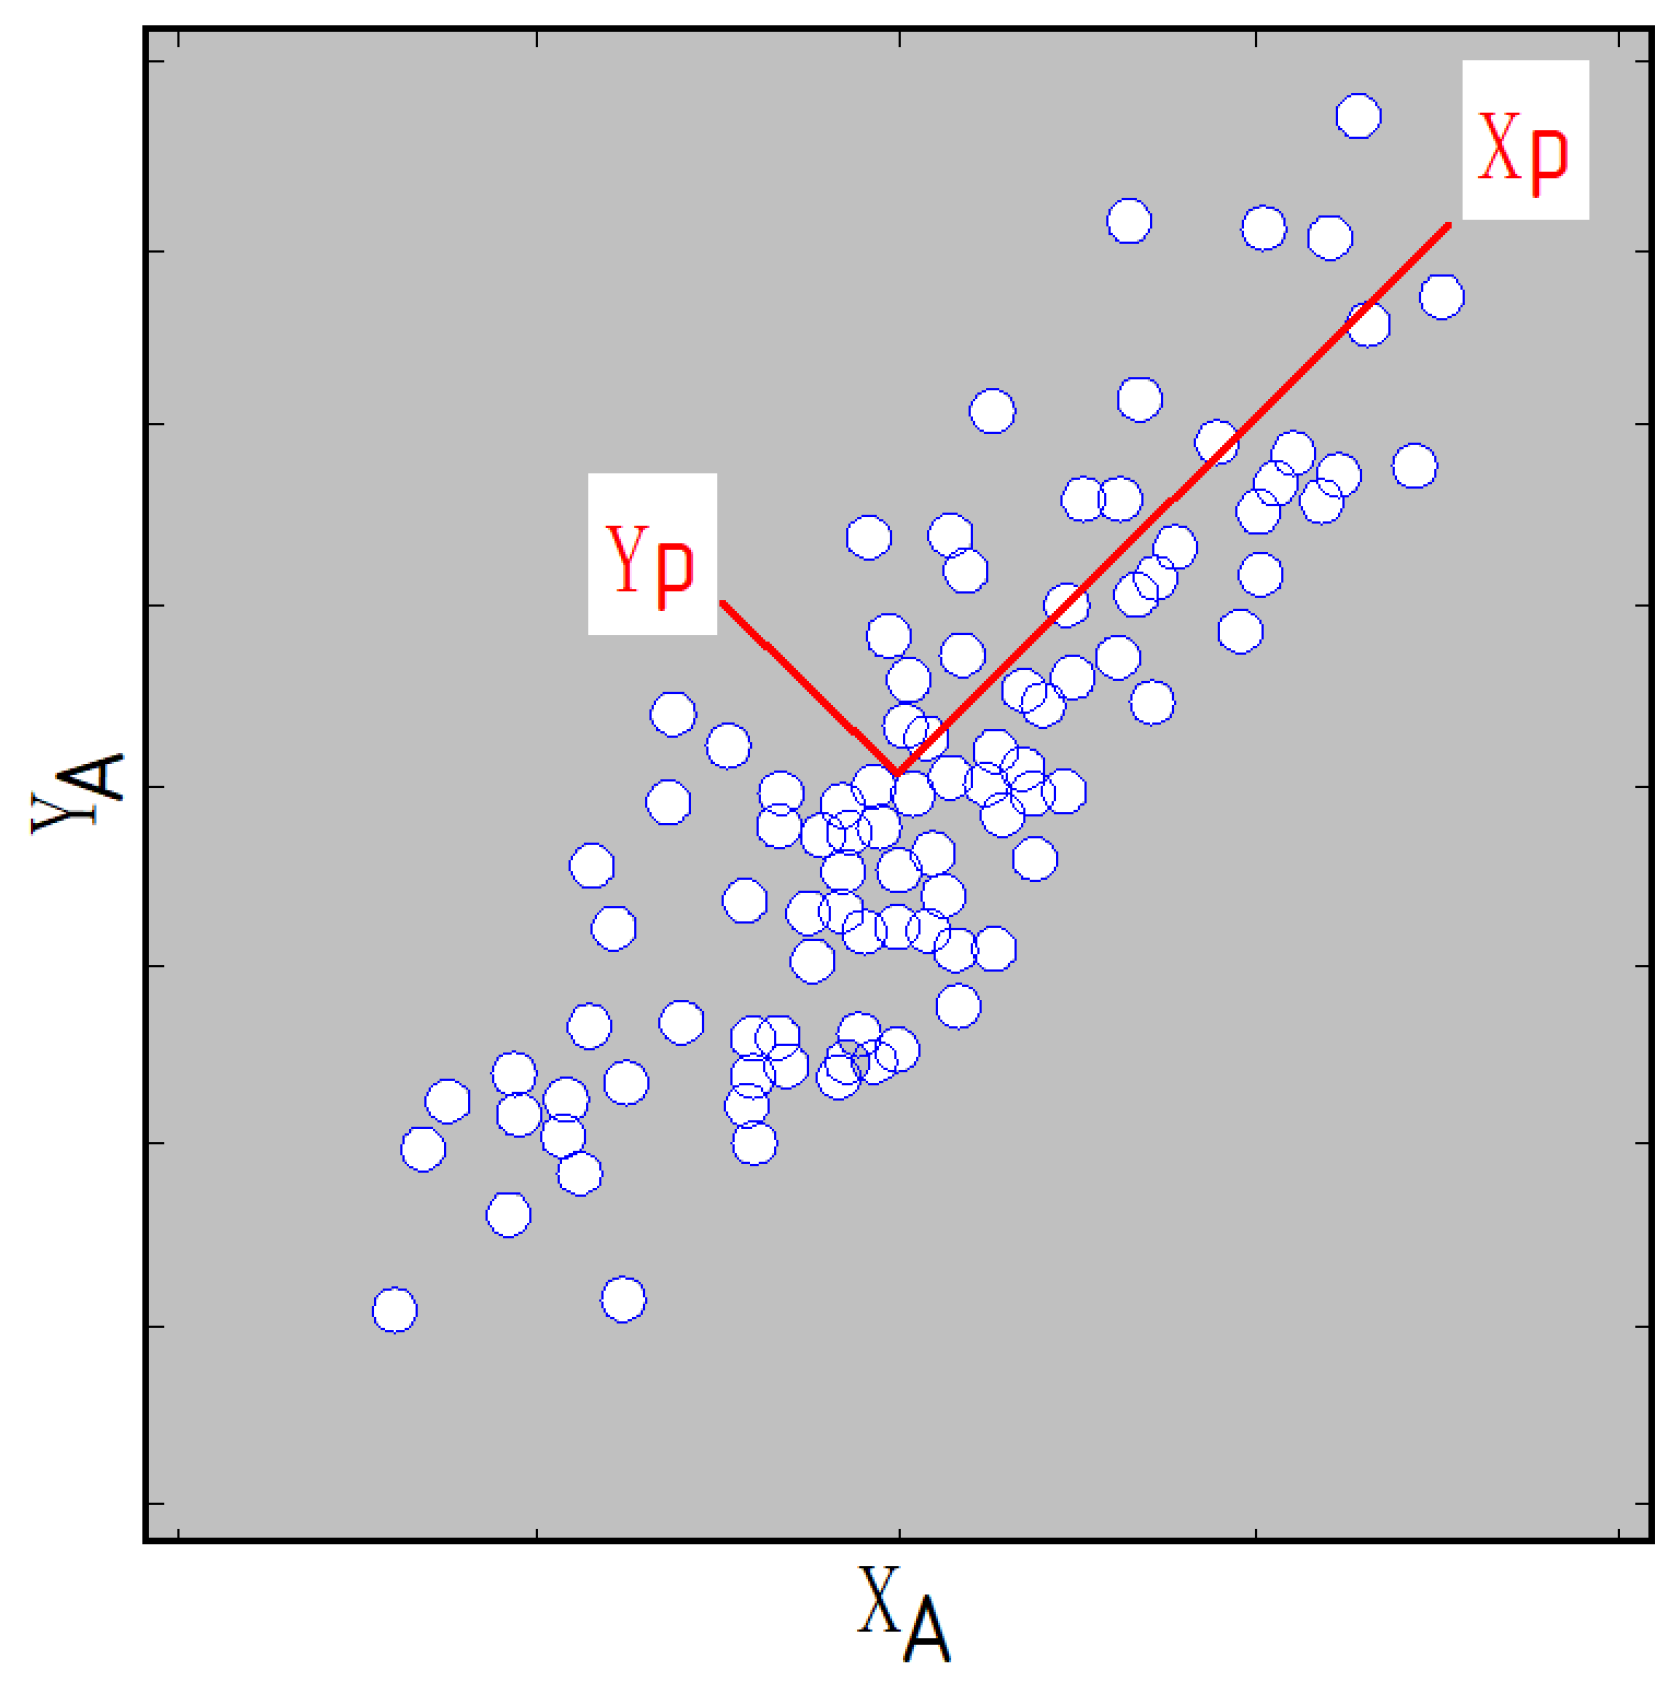
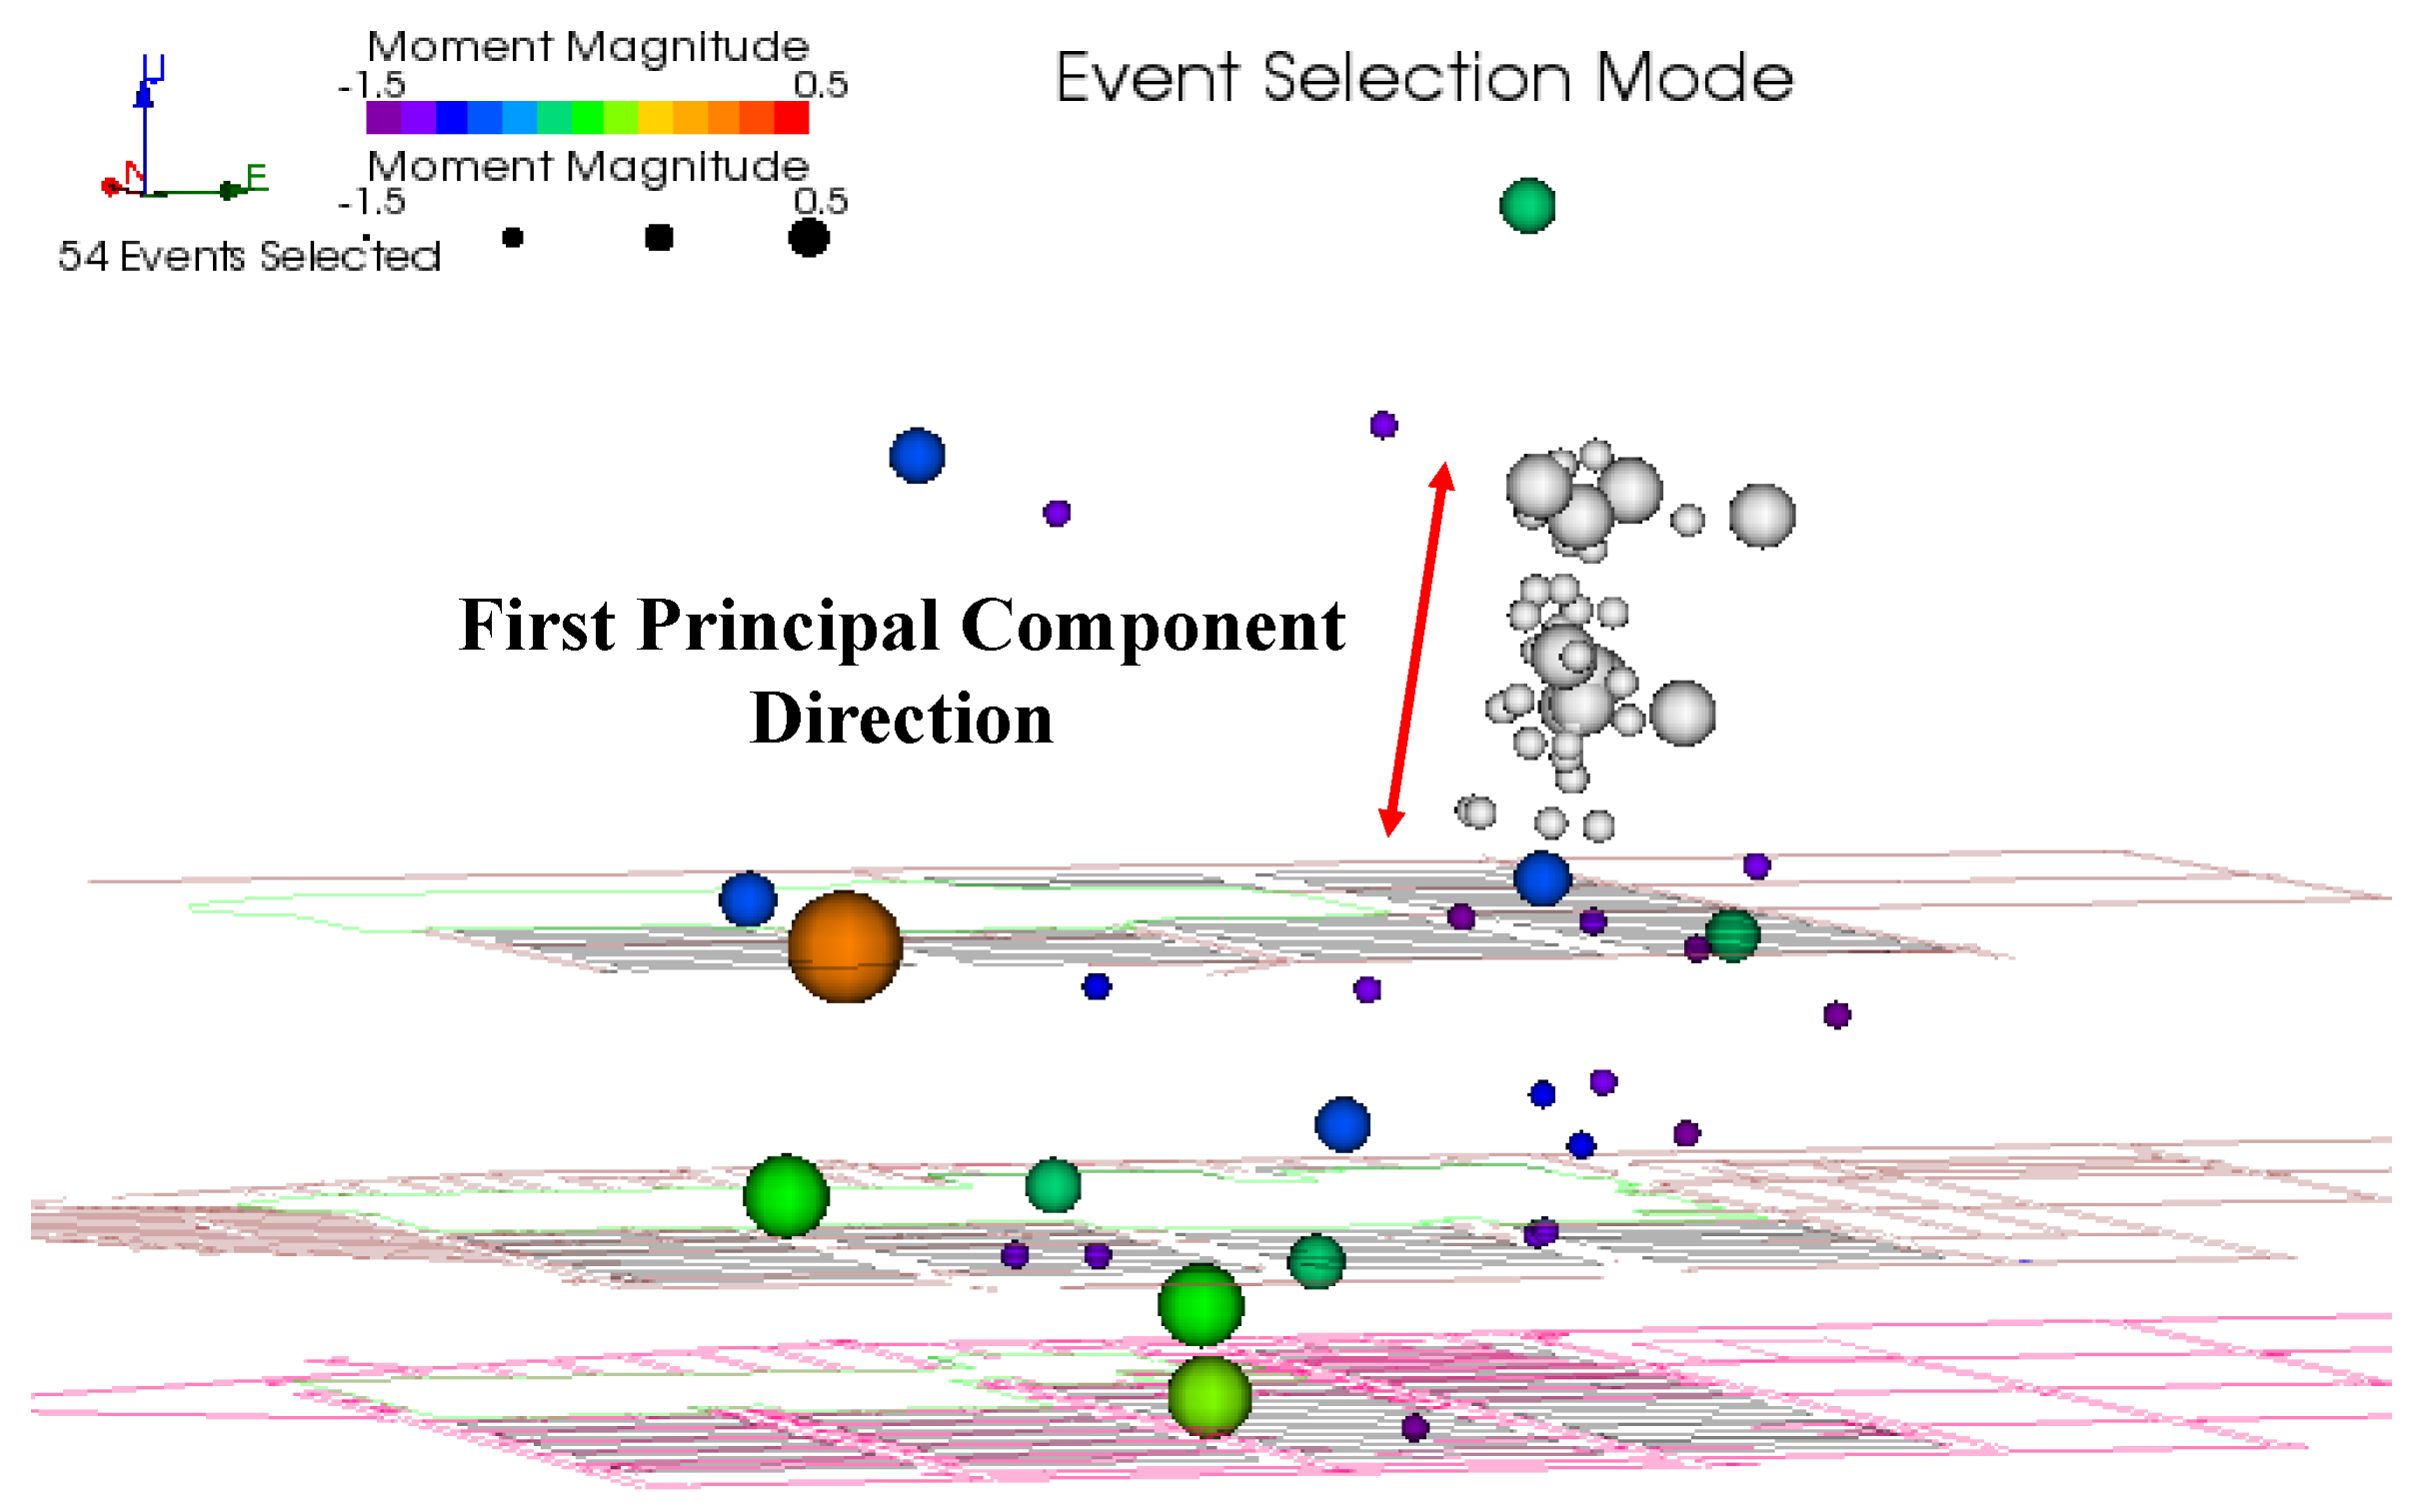
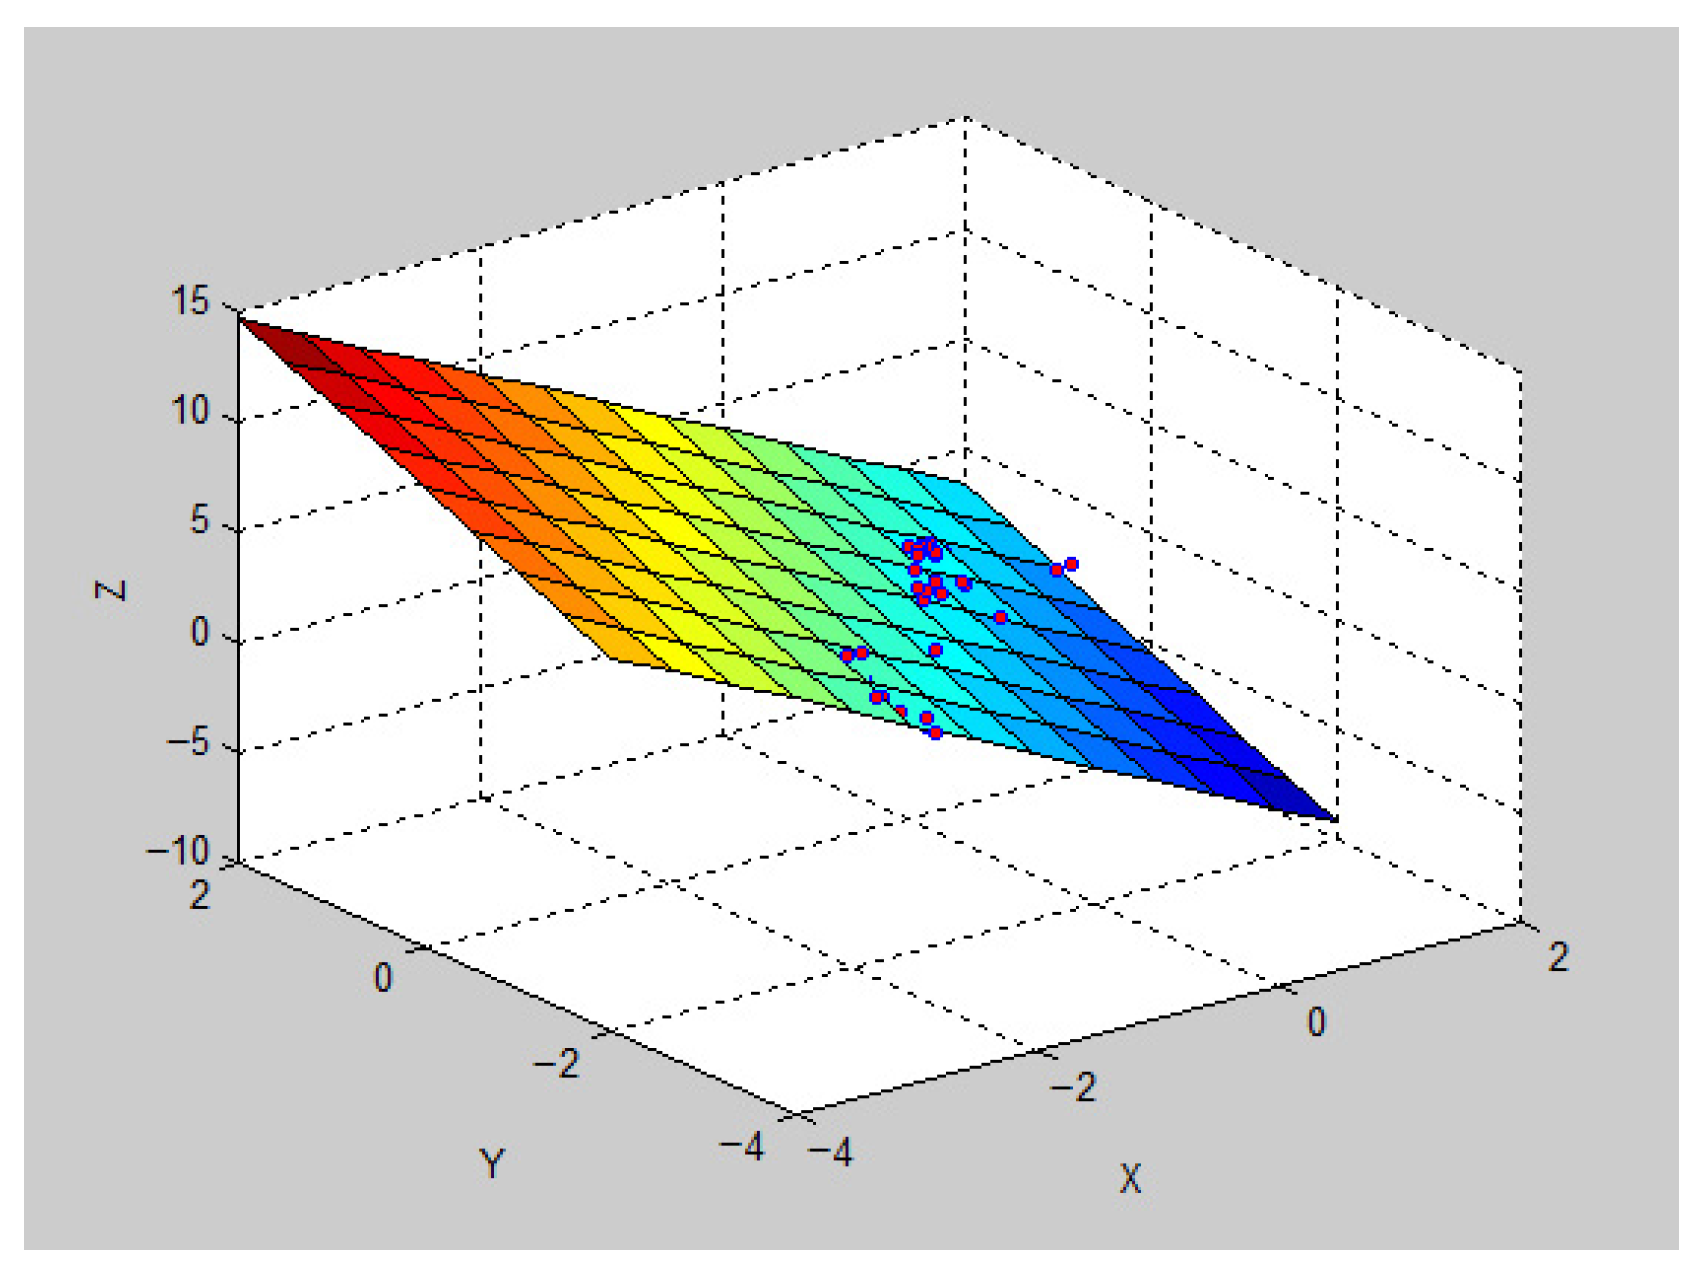
4.1. Principal Component Analysis of the Orientation of the Slip Surface

Principal Component Analysis (PCA) is a statistical method based on dimensionality reduction. It transforms multiple variables into a smaller set of synthetic variables (principal components), where each principal component is a linear combination of the original variables. These principal components are mutually uncorrelated, allowing them to capture most of the information contained in the original variables without redundancy [,].
The spatial distribution of clustered microseismic events forms a three-dimensional variable sample, with each event characterized by x, y, and z coordinates. By applying PCA to the 3D coordinate data of these clustered microseismic events, the first and second principal component directions can be extracted. The plane formed by the first and second principal components can determine the orientation of the plane defined by the clustered microseismic events. PCA effectively reduces the dimensionality of the spatial coordinates (from 3D to 2D), enabling precise characterization of the strike and dip angles of the slip surface formed by the spatial clustering of microseismic events. Figure 11 illustrates an example of randomly distributed microseismic events in a plane, where Xp represents the first principal component direction and Yp represents the second principal component direction.
Figure 11. Principal component directions of microseismic events within the plane.
Let x 1 , x 2 , , x m denote m microseismic location events, and let I 1 , I 2 , , I n represent n features used to evaluate the events. Each object x j has n feature observations, so the microseismic event x j can be expressed as an n-dimensional vector: x j = ( x j 1 , x j 2 , , x j n ) , since microseismic events are inherently three-dimensional, n = 3, the variables of microseismic events can be represented by the following feature matrix:
X = x 11 x 12 x 1 n x 21 x 22 x 2 n x m 1 x m 2 x m n = ( x i j ) m × n
Apply the Z-score method [] to standardize the original data, let
Z i j = ( x i j x ¯ j ) / s j
In the formula
x ¯ j = 1 m i = 1 m x i j ,   s j 2 = 1 m i = 1 m ( x i j x ¯ j ) 2 ,   j = 1 , 2 , , n
After the above transformation, the new data vector z i j = ( z 1 j , z 2 j , , z m j ) T , ( j = 1 , 2 , , n ) has a mean of 0 and a variance of 1. The transformed feature matrix is as follows:
Z = z 11 z 12 z 1 n z 21 z 22 z 2 n z m 1 z m 2 z m n = ( z i j ) m × n
Construct the covariance matrix of the standardized data vectors R:
R = ( r i k ) m × n , r i k = 1 m 1 j = 1 m ( z j i z j k ) , ( i , j = 1 , 2 , , n )
Here, r i k is the correlation coefficient between the vector of m transformed values for the i-th feature and the vector of m transformed values for the k-th feature. That is, r i k represents the correlation coefficient of the random variables formed by the i-th and k-th columns of matrix Z.
Solve for the eigenvalues λ 1 , λ 2 , , λ n of matrix R. Since R is an n × n real symmetric matrix, all its eigenvalues are real numbers. Arrange them in descending order as follows:
λ 1 λ 2 λ n
Since microseismic events are three-dimensional variables, to reduce their dimensionality to two dimensions, the first two principal components are primarily computed. Establish the principal component equations to determine the principal component values. Let the unit eigenvectors corresponding to the first two eigenvalues λ i be denoted as follows:
D = ( d i 1 , d i 2 , d i n ) ,   i = 1 , 2
The plane formed by the first and second eigenvectors corresponds to the slip surface defined by the spatial clustering of microseismic events. By determining the plane formed by the first and second eigenvectors in space, the strike and dip angle of the clustered microseismic event surface can be identified.
Following the large-scale blasting, the upper slip zone (Zone II) contains a total of 54 clustered microseismic events. These 54 events were selected as the dataset for analyzing the blasting-induced mountain body collapse, as shown in Figure 12 and Figure 13.
Figure 12. Side view of microseismic event clusters on the slip surface.
Figure 13. Plan view of microseismic event clusters on the slip surface.
The 54 clustered microseismic events in Zone II are selected as the study objects for the slip surface analysis. Their spatial coordinate distribution is shown in Table 1.
Table 1. Spatial coordinate data of microseismic events.
The original data are standardized using the Z-score method. The results are presented in Table 2.
Table 2. Standardized spatial coordinates of microseismic events.
Based on the aforementioned PCA analysis method, a MATLAB 8.0 computational program was developed to calculate the covariance matrix R = ( r i k ) 3 × 3 using Equation (4). The covariance matrix is as follows:
R = 1.0000 0.8544 0.75906 0.8544 1.0000 0.60758 0.7590 0.6075 1.0000
The eigenvalues and eigenvectors of the covariance matrix R = ( r i k ) 3 × 3 are shown as follows.
D = 0.1128 0 0 0 0.4018 0 0 0 2.4852
V = 0.7806 0.1375 0.6096 0.5545 0.6023 0.5742 0.2882 0.7863 0.5464
The non-zero values on the diagonal of matrix D represent the eigenvalues, arranged in ascending order. Each column in matrix V corresponds to the eigenvector of the respective eigenvalue in matrix D. In this example, the first two principal components are d1 = 2.4852, d2 = 0.4018, with their corresponding eigenvectors as follows:
v 1 = 0.6096 0.5742 0.5465 v 2 = 0.1375 0.6023 0.7863
The vectors v 1 and v 2 are not collinear and span a plane. The normal vector of this plane is:
n = v 1 × v 2 = 0.7807 0.5545 0.2882
By setting the z component of the normal vector n = x , y , z to zero, the projection vector t = 0.7807 0.5545 0 of n onto the horizontal plane defined by the xy axes can be obtained. Let the direction vector of the x = ( 1 , 0 , 0 ) , The cosine of the angle between the projection vector t and the x axis is:
cos α = t · x t x = - 0.7807 × 1 + 0.5545 × 0 + 0 × 0 - 0.7807 2 + 0.5545 2 + 0 2 × 1 2 + 0 2 + 0 2 =   0 . 8153
The angle between vector t and the x axis corresponds to the dip direction of the plane formed by v 1 and v 2 , the value is:
α = arccos ( 0.8153 ) + 180 = 324.6
Thus, the dip direction of the plane is 324.6°. Similarly, the cosine of the angle between the normal vector n and its projection vector t onto the horizontal plane can be calculated:
cos β = t · n t n = - 0.7807 × 0.7807 + 0.5545 × 0.5545 + 0 × 0.2882 - 0.7807 2 + 0.5545 2 + 0 2 + - 0.7807 2 + 0.5545 2 + 0.2882 2 =   0 . 9576
Thus, the dip angle of the plane is γ = 90 ° β = 90 ° 16.8 ° = 73.2 ° . Based on the aforementioned microseismic principal component analysis method, by analyzing the first and second principal components of the spatial locations of the 54 events, the attitude of the slip surface is determined as follows: the dip direction of the collapse slip surface is 324.6°, and the dip angle is 73.2°.

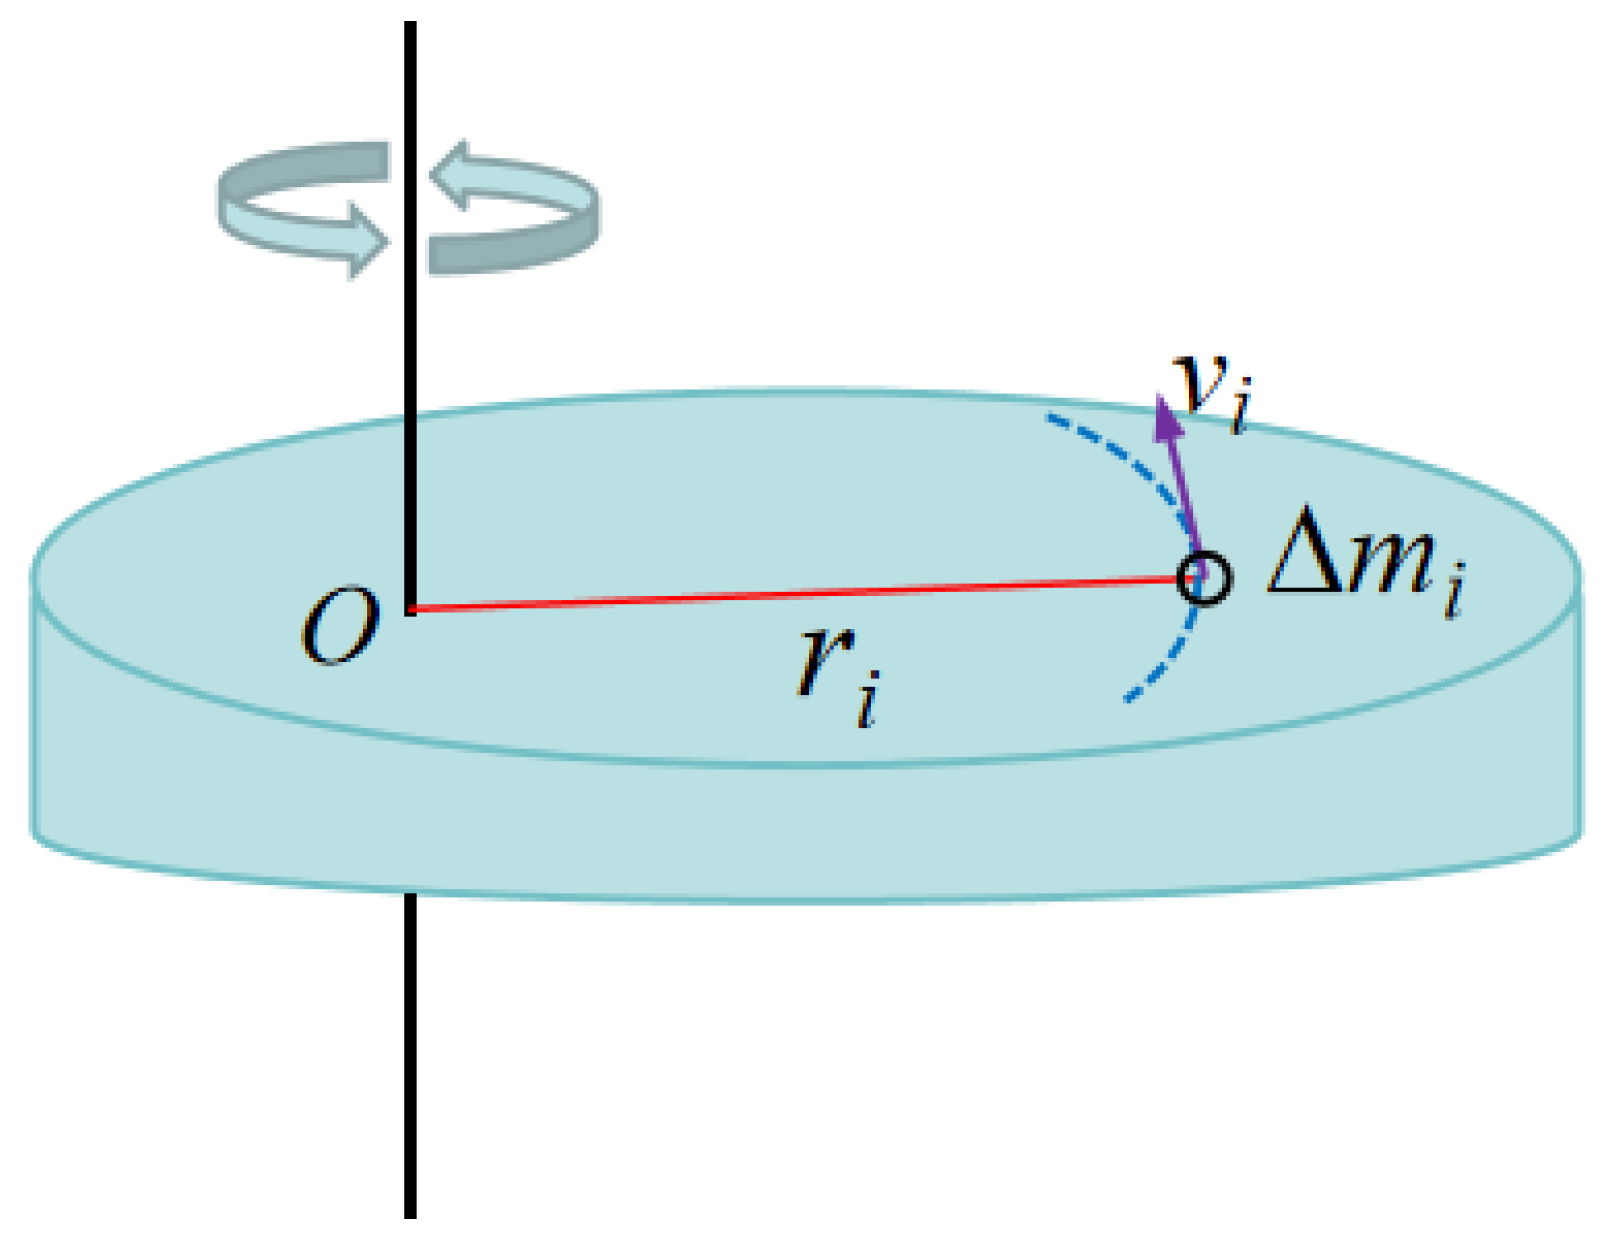
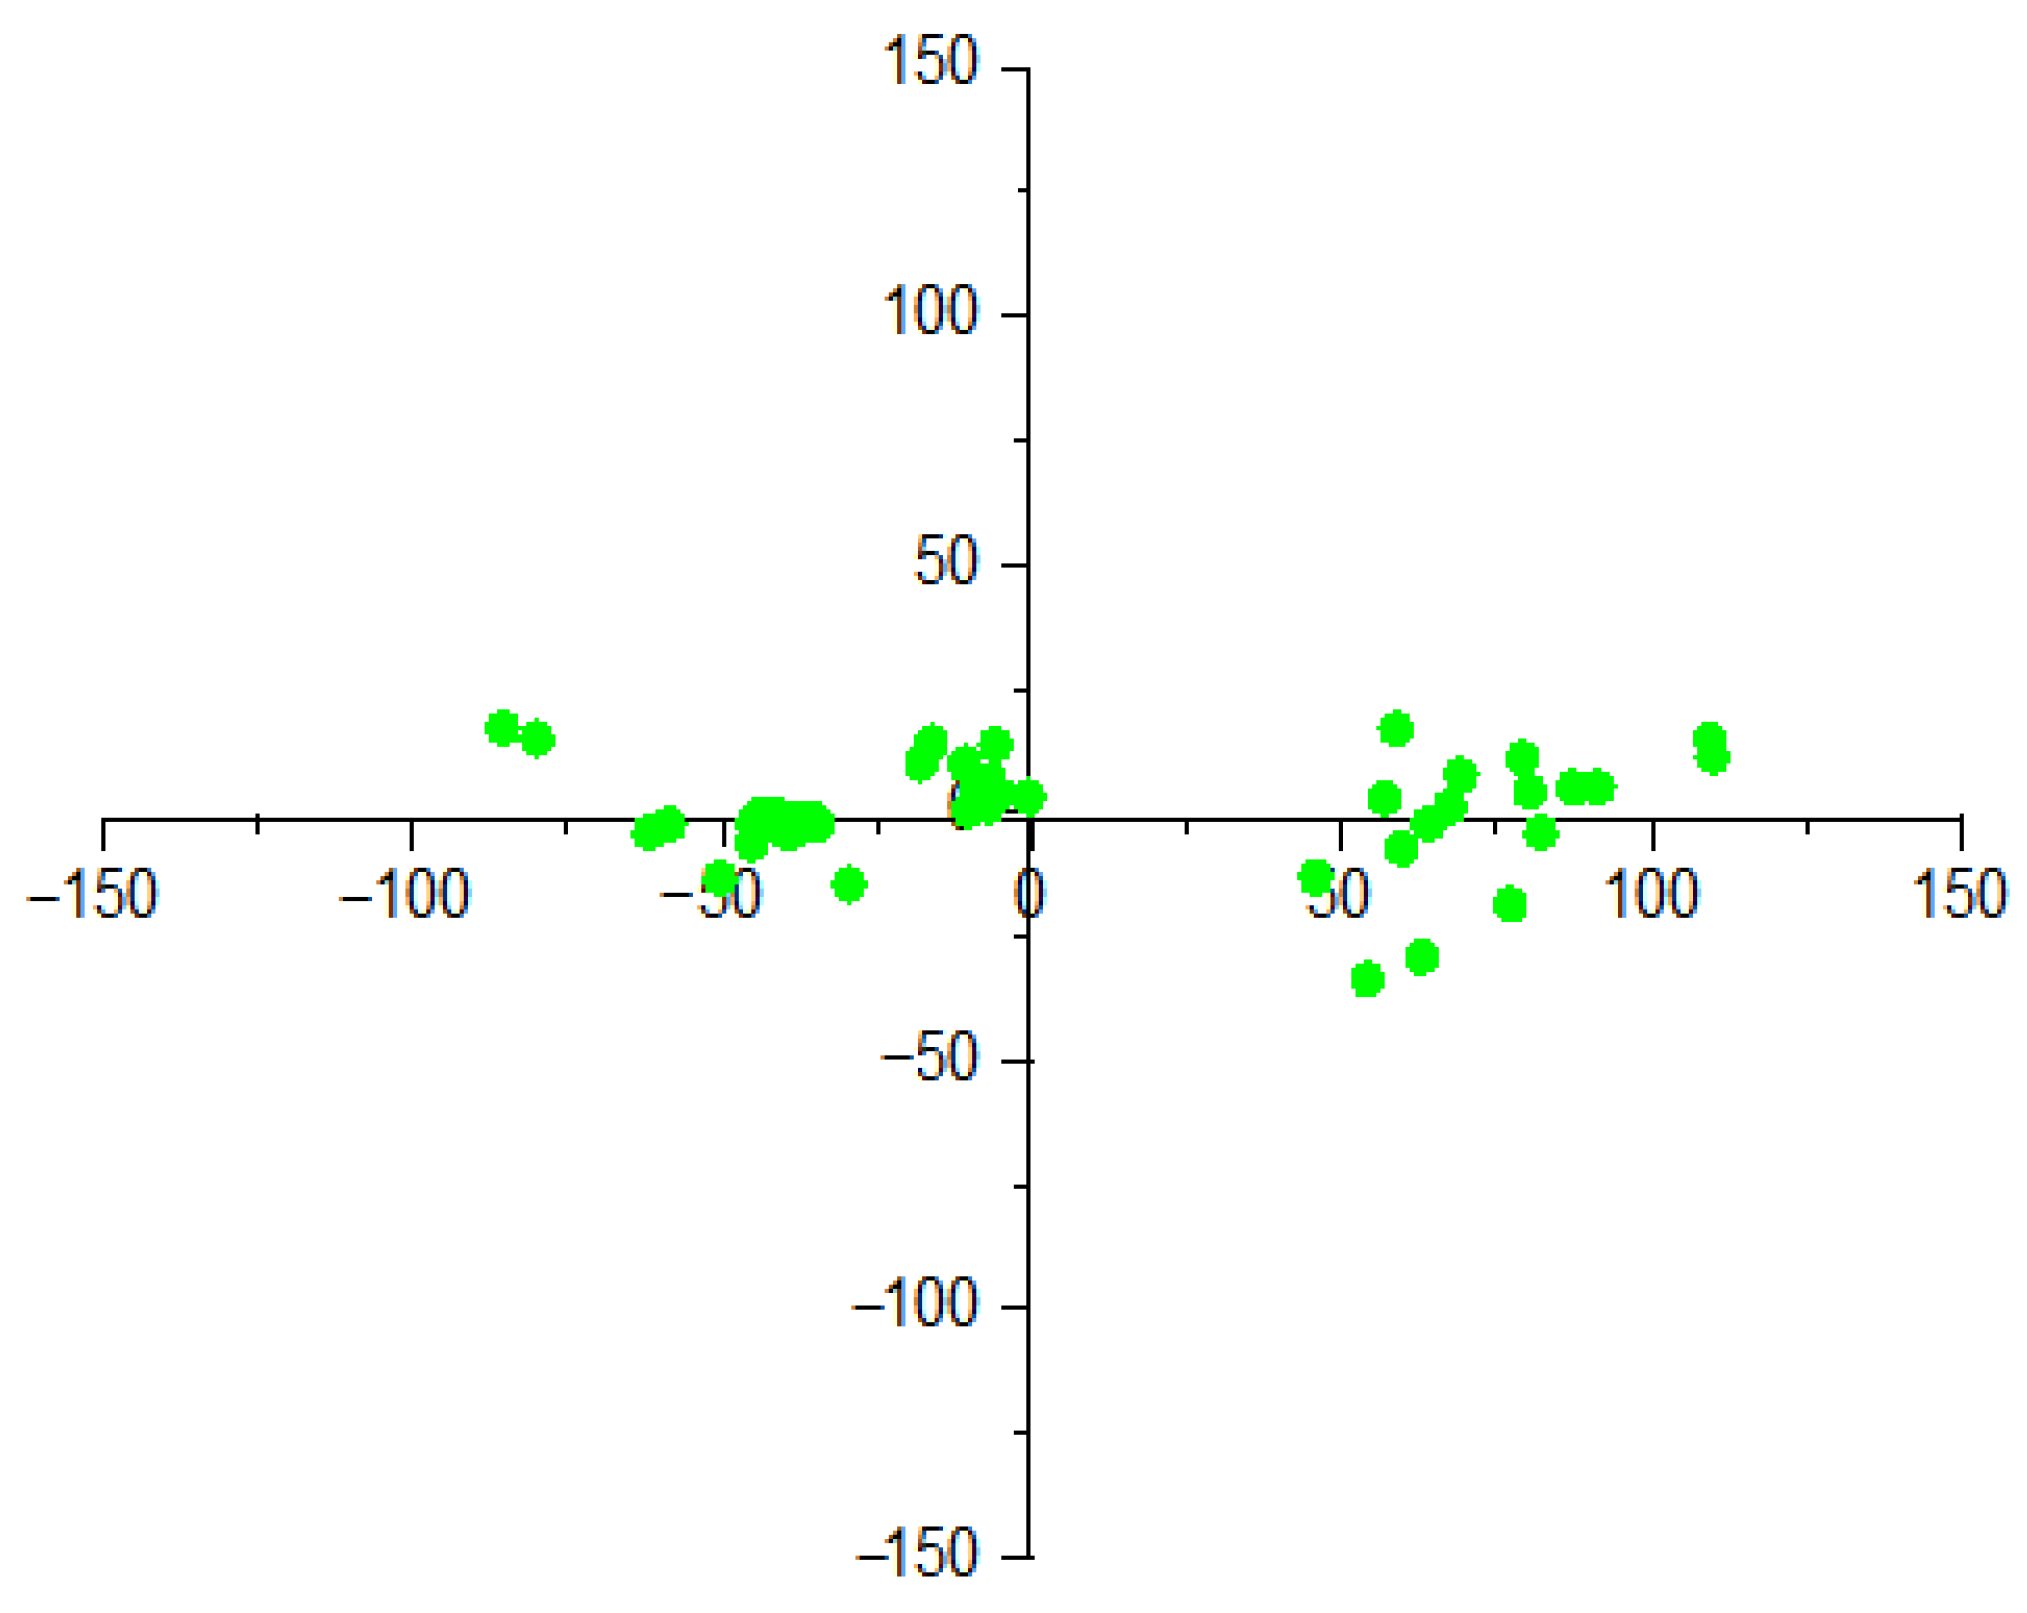
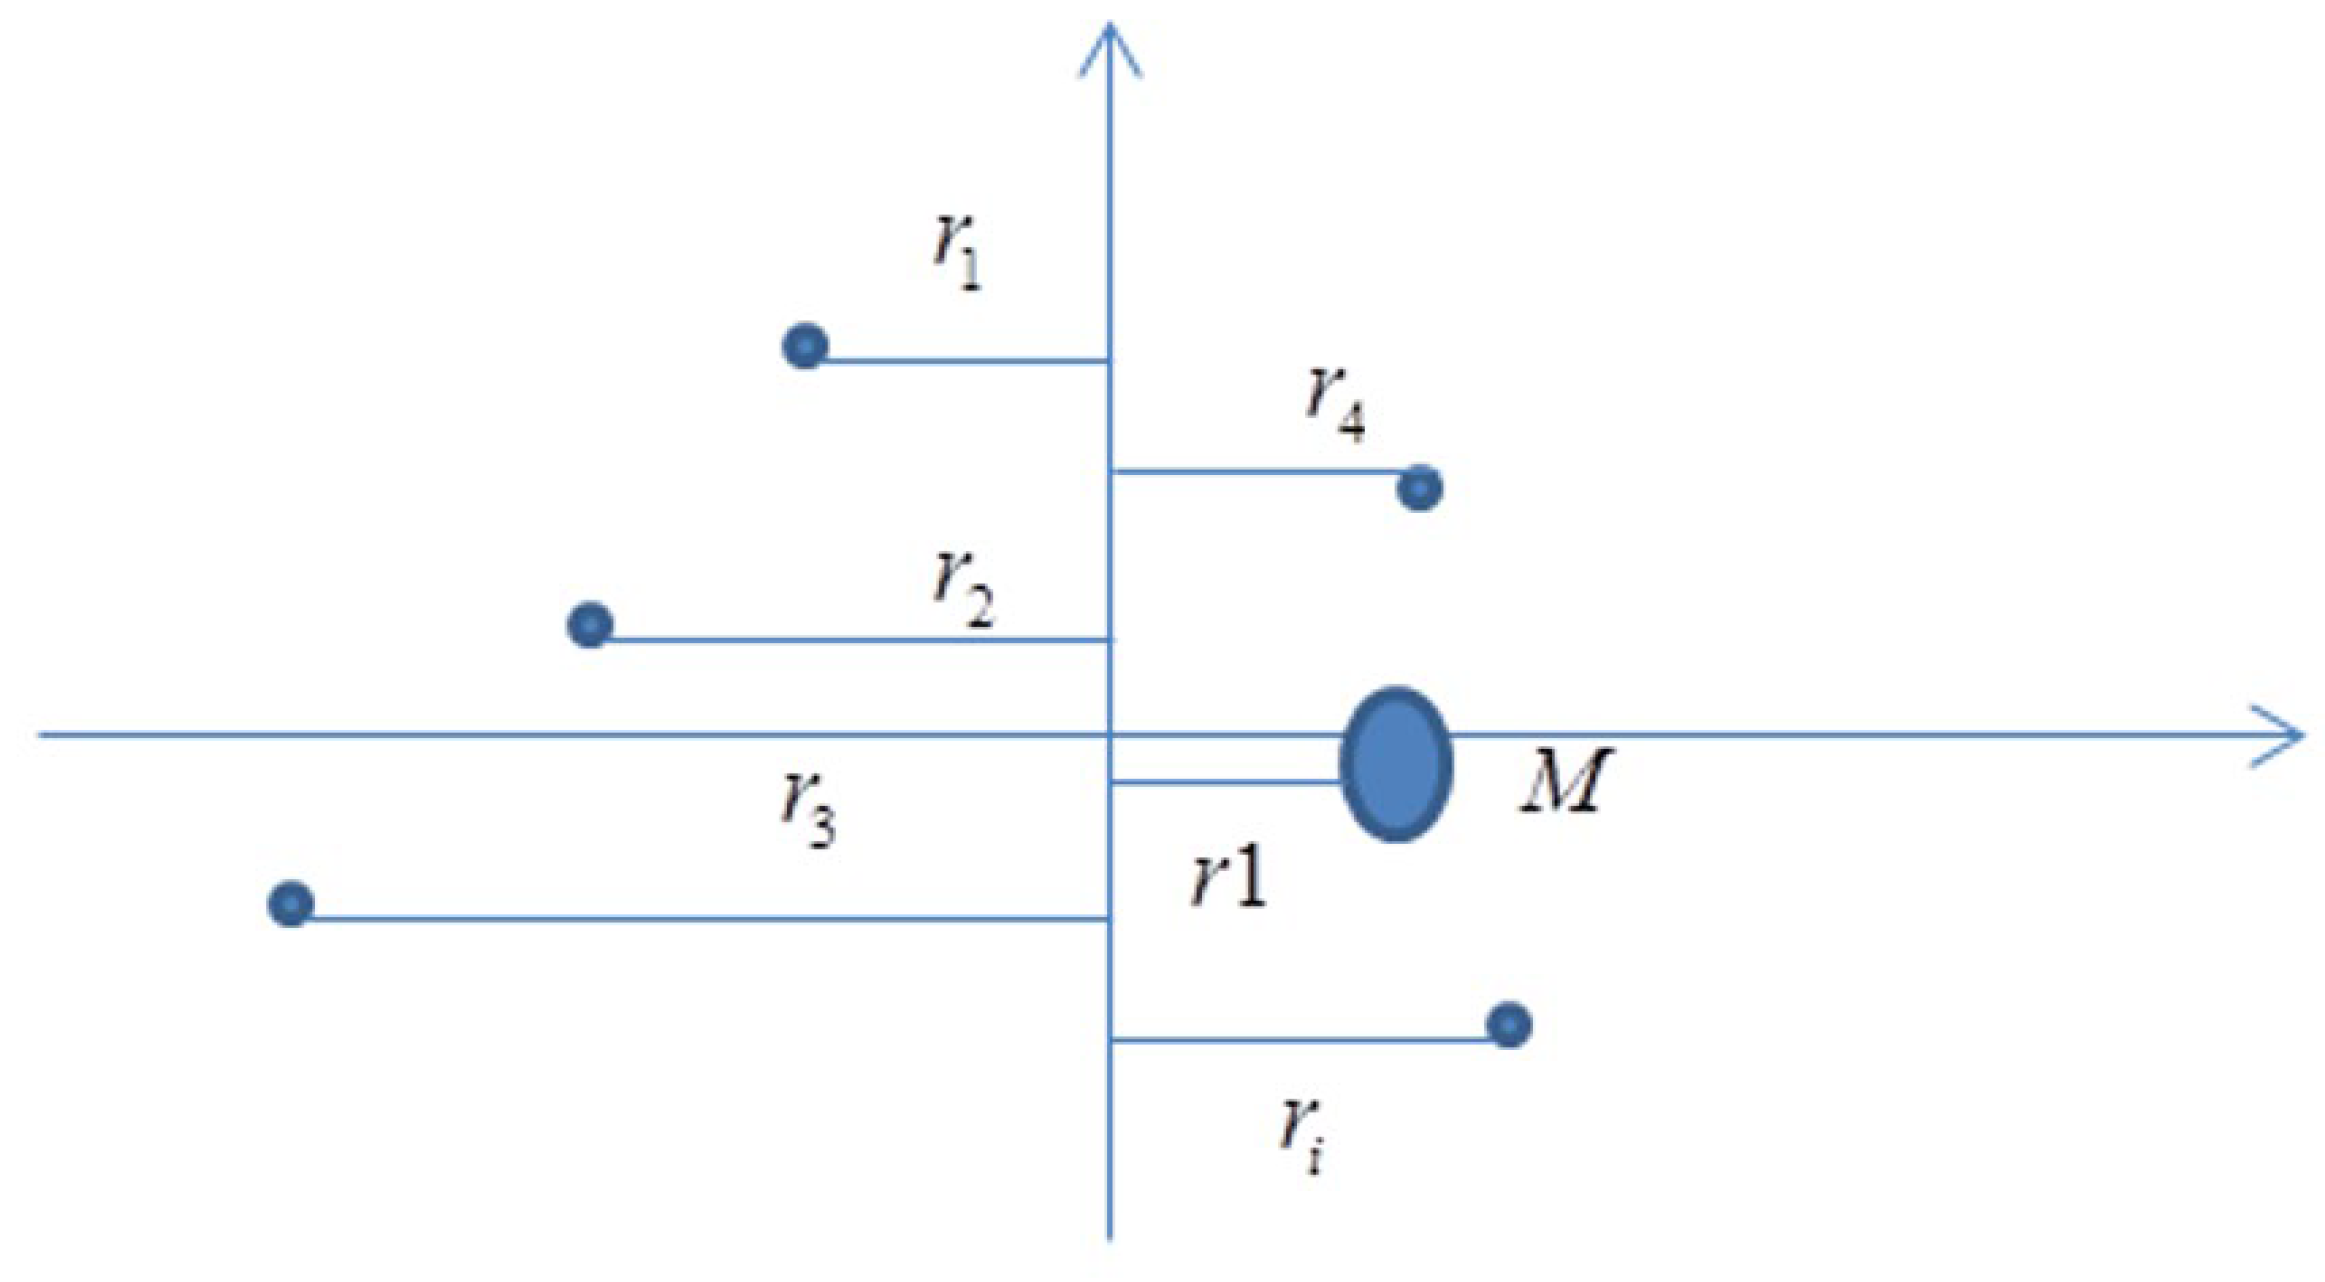
4.2. Principal Component Plane Ellipticity Analysis

Theoretically, the principal component method can identify the corresponding clustering plane for any aggregated event, whether the events are randomly dispersed or exhibit a distinct clustering tendency. Consequently, the principal component plane derived from microseismic event analysis does not entirely represent the true slip plane of the microseismic event cluster. When microseismic events are in a relatively random and dispersed state, the principal component plane merely reflects the mathematical clustering tendency of the event distribution. In contrast, when microseismic events form a clear clustering pattern, the principal component plane corresponds to the slip plane. The clustering degree of microseismic event clusters is generally quantified using the ellipticity ratio of the principal component ellipsoid. Figure 14 is relationship between the clustering degree of microseismic events (red dots) and the ellipticity ratio (blue dotted circle). The more dispersed the distribution of microseismic events is, the smaller the ellipsoid rate will be, conversely, the more concentrated the distribution of microseismic events is, the larger the ellipsoid rate will be.
1
Moment of Inertia Method []
Figure 14. Relationship between the clustering degree of microseismic events and the ellipticity ratio: (a) low ellipticity: random distribution of microseismic events, (b) high ellipticity: clustered activity along the fault plane.
By applying principal component analysis (PCA), the principal plane is defined by the first and second principal components. All microseismic events are projected onto this principal plane. Consequently, the key step in the calculation involves determining the size and shape of the ellipse that encloses the spatial distribution of all microseismic events. This requires simultaneous consideration of the spatial distribution distances from the center of mass and the weighted contributions of each event. To address this, the concept of moment of inertia from physics is introduced to compute the ellipticity of dispersed microseismic events.
The moment of inertia quantifies the resistance of a rigid body to rotational motion about an axis, representing the tendency of an object to maintain uniform circular motion or remain stationary. It is denoted by the symbol II and is determined solely by the shape, mass distribution, and the position of the axis of rotation. A schematic illustration is provided in Figure 15.
Figure 15. Schematic diagram of moment of inertia calculation.
The expression for the moment of inertia is:
I = i n m i r i 2
2
Determination of Ellipse Major and Minor Axes
Taking 54 microseismic events clustered on the slip plane after a large-scale blasting as in the case study, the ellipticity of this cluster is analyzed. In Figure 16, the plane is defined by the first and second principal component eigenvectors obtained through principal component analysis (PCA).
Figure 16. Schematic illustration of microseismic event clusters and fault plane relationship using MATLAB software.
By applying the coordinate transformation formula (Equation (2)), spatial points are dimensionally reduced and projected onto the two-dimensional plane formed by the first and third principal component eigenvectors. This results in a new set of spatial coordinates along the directions of the first and third principal components, as illustrated in Figure 17. By solving for the spatial orientation of the principal component plane, all events are projected onto this plane, transforming the problem into calculation of the ellipticity ratio within a single planar domain.
Figure 17. The distribution of spatial points.
To quantitatively evaluate the clustering degree of these events, a conventional method involves constructing an ellipse based on the spatial distribution of points, then calculating the ellipticity e using the major and minor axes of the ellipse. The expression is defined as:
e = a 2 c 2 a 2 c < a c 2 a 2 a 2 c > a   ( 0 < e < 1 )
Based on the concept of moment of inertia, we can assume each point has a mass of m = 1, calculate the moments of inertia of these points about the x and y axes, and then assume a total mass of M = i = 1 n m i = n m = n . By applying the equivalent moment of inertia method, the equivalent radius of rotation r 1 = i = 1 n m i r i 2 M = i = 1 n r i 2 n is derived, as illustrated in Figure 18.
Figure 18. Schematic diagram of equivalent solution method.
The equivalent rotational radius is used as the major and minor axes of the ellipse to calculate the ellipticity e. Based on the transformed scatter coordinates in Table 3, the length of the major axis is:
a = x 1 2 + x 2 2 + + x n 2 n = 10.8765 2 + 0.59293 2 + + 54.13869 2 54 = 155103.8 54 = 2872.292
Table 3. Coordinate values of spatial points after dimensionality reduction transformation.
Similarly, the minor axis can be calculated as:
c = y 1 2 + y 2 2 + + y n 2 n = 9.95176 2 + 3.109964 2 + + 33.6491 2 54 = 5207.096 54 = 96.4277
so , e = a 2 c 2 a 2 = 2926.5 98.5 2926.5 = 0.9663
This indicates that the microseismic event cluster exhibits a high degree of clustering tendency, and in this case, the principal component plane corresponds to the slip plane.
We know that there are tiny fractures, namely microseismic events, before a macroscopic landslide occurs in a mountain. These microseismic events occur earlier than the landslide, sometimes just a few minutes, several hours, several days or even longer before the landslide. Therefore, we can monitor the microseismic events before the landslide and analyze the occurrence of the potential sliding surface formed by the microseismic events according to the above method. We can also analyze the aggregation degree of these microseismic events on this potential sliding surface. If the microseismic events can form a distinct sliding surface and the aggregation degree is very high, it means that the possibility of a landslide is very high, thereby providing early warnings for landslides.

4.3. Microseismic Moment Tensor Analysis for Types of Mountain Body Slide

By applying moment tensor theory [,] to the microseismic events monitored during this mountain body slide, the source mechanism is inverted. The moment tensors of the monitored microseismic events are computed and decomposed. Using the moment tensor rupture criteria proposed by B. Feigner and R. P. Young [], the types of internal rock mass failure prior to the mountain body slide are determined.
R = t r ( M ) t r ( M ) + m i × 100
In this equation: R is the ratio of the volumetric component to the shear component, t r ( M ) is the trace of the moment tensor, and m i * are the eigenvalues of the deviatoric tensor, m i * = M i t r ( M ) / 3 . Depending on the value of RR, the following criteria apply:
R > 30 ( The   seismic   source   is   dominated   by   tensile   rupture ) 30 R 30 ( The   seismic   source   is   dominated   by   shear   rupture ) R < 30 ( The   seismic   source   is   dominated   by   compaction   rupture )
This section focuses on the processing of 39 microseismic location events with concentrated source distributions in the area of mountain body failure. Based on energy levels and proximity to the landslide position, these events are uniformly numbered from Event 1 to Event 39 (from top to bottom). Specific data processing is conducted by solving the moment tensor using the maximum P-wave amplitude of each monitored microseismic event to invert the source mechanism. The coordinate parameters of the 39 extracted microseismic location events are detailed in Table 4. According to the moment tensor theory and source mechanism inversion method, the final R values of the 39 microseismic events are presented in Table 4.
Table 4. Microseismic event data for moment tensor analysis.
Based on the distribution of R values (see in Table 5) calculated from the moment tensor solutions of the 39 microseismic location events in Table 4, 20 events exhibit R values within the range of [−30, 30]. According to the corresponding criteria, these events correspond to shear rupture, accounting for 51%. Further analysis of the tabulated data reveals that a significant portion of the R values associated with tensile or compaction rupture are close to the critical threshold for classification (Events 1, 4, 8, 9, 11, 13, 17, 20, 21, and 36). Therefore, based on the R values, the type of mountain body slide failure induced by the large-scale blasting is most likely to be shear-dominated. By integrating the event numbering sequence in Table 4 with the spatial coordinates of the microseismic events, it is evident that in the upper portion (700–755 m) of the failed mass, no clear dominance of any single failure type is observed, with all three types (tensile, shear, and compaction) coexisting. In contrast, the lower portion (645–700 m) predominantly exhibits shear rupture as indicated by the R values. This pattern of complex failure types in the upper region and predominantly shear rupture in the lower region is consistent with the observed macroscopic failure behavior.
Table 5. R parameters and rupture type classification.
Field investigations indicate that blasting-induced failure resulted in the formation of a hanging wall structure in the upper region, with an area exceeding 20,000 m2. A well-developed fault was identified within the hanging wall rock mass, with a measured dip direction of 327° and a dip angle of 76°. The hanging wall rock mass underwent massive sliding along this fault, forming a relatively smooth sliding surface, which is characteristic of shear failure. The total volume of the landslide rock mass induced by blasting is approximately 4.47 million m3, as shown in Figure 19.
Figure 19. Aerial photo of landslide: (a) measurement of the inclination angle of the sliding surface; (b) measurement of the tendency of the sliding surface.

5. Conclusions

This study utilizes microseismic event data collected prior to the blasting-induced mountain body slide failure. The attitude of the sliding surface is analyzed using principal component analysis (PCA), and the source mechanism of precursor events is investigated through moment tensor theory. By solving and inverting the moment tensors of microseismic events, the rupture mechanisms and failure types are determined. The following key conclusions are drawn:
(1)
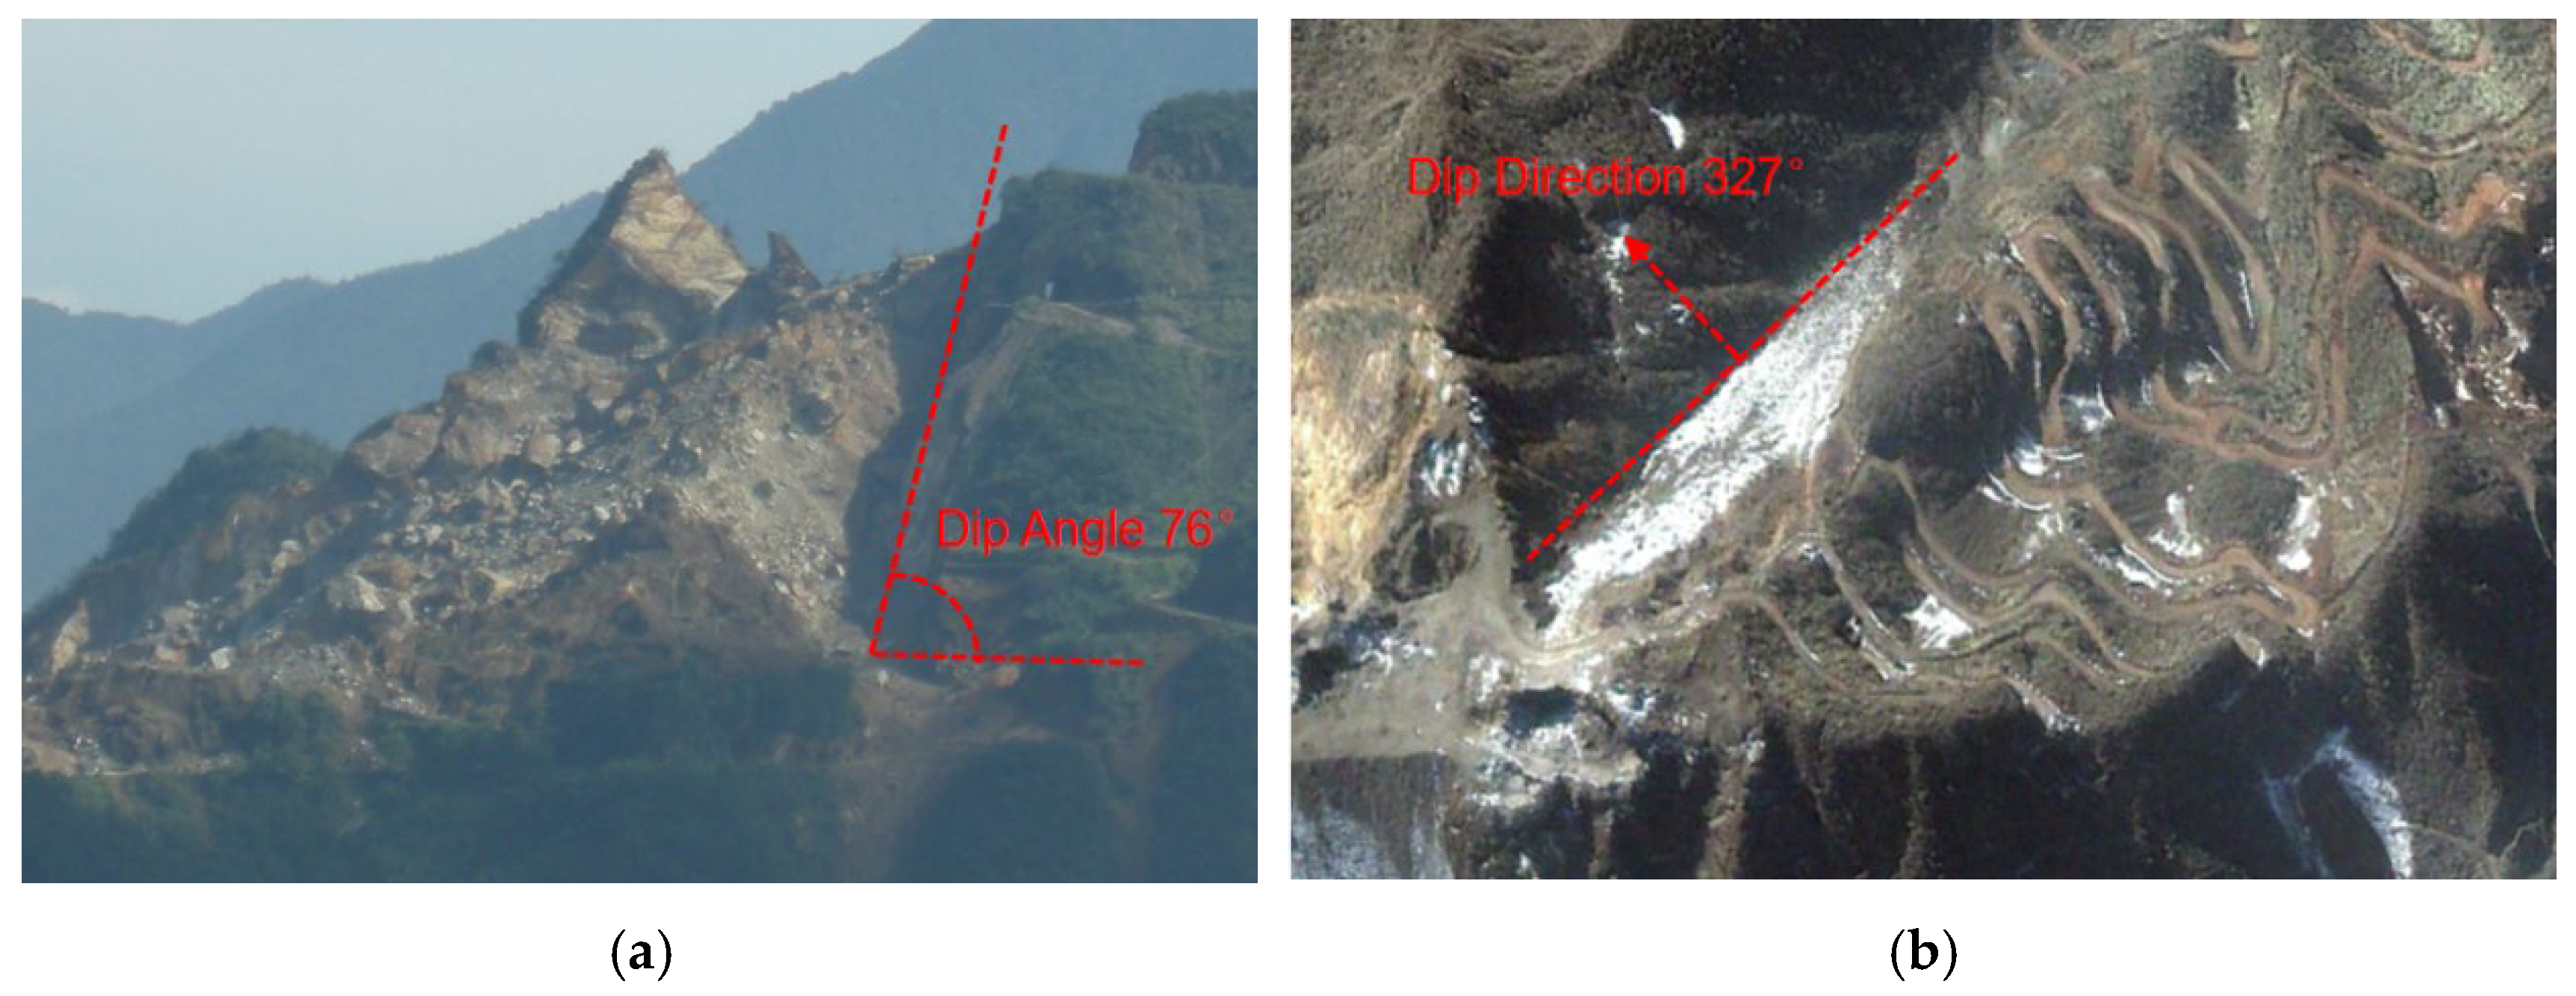
The PCA-derived attitude of the sliding surface aligns closely with the field-measured attitude, with a dip angle difference of 2.8° and a dip direction difference of 2.4°. This demonstrates that the PCA method can effectively analyze the clustering of microseismic events and determine the spatial orientation of clustered events. It provides a reliable technical basis for identifying potential sliding surfaces and monitoring early warnings of mountain body slides.
(2)
The moment tensor analysis of the blasting-induced mountain body slide failure reveals that the method accurately classifies rock mass rupture types. The results are consistent with the observed macroscopic shear sliding failure along the fault plane in the field. This confirms the validity and applicability of microseismic source mechanism analysis in engineering rock mass rupture studies.
(3)
Microseismic monitoring technology can detect precursor rock mass rupture events before a mountain body slide. By analyzing the clustering degree of microseismic events, the attitude and rupture type of potential sliding surfaces can be determined. This enables effective monitoring and early warning of potential mountain body failures, offering a novel approach for studying mining-induced mountain body slides.

Author Contributions

F.P.: Funding acquisition, investigation, data curation, methodology, writing—original draft. W.W.: Project administration, conceptualization, review and editing. All authors have read and agreed to the published version of the manuscript.

Funding

This Project was supported by the National Natural Science Foundation of China (No. 52374088), and the National Key Research and Development Program Project of China (2022YFC2904002).

Institutional Review Board Statement

Not applicable.

Data Availability Statement

All the data, models, and codes generated or used during the study appear in the submitted article.

Acknowledgments

We would like to express our sincere gratitude to The Shizhuyuan Polymetallic Mine for providing valuable monitoring data.

Conflicts of Interest

The authors declare no conflict of interest.

References

  1. Huang, R.Q. Large-scale landslides and their sliding mechanisms in China since the 20th century. Chin. J. Rock Mech. Eng. 2007, 26, 433–454. [Google Scholar]
  2. Li, H.J. Slope Deformation and Stability Research Induced by Typical Human Activities. Ph.D. Thesis, Graduate University of Chinese Academy of Sciences, Beijing, China, 2008. [Google Scholar]
  3. Li, J.; Zhao, Z.L. Analysis on the control methods and strategies of geological disaster and slope landslide in mine engineering. World Nonferr. Met. 2020, 22, 200–201. [Google Scholar]
  4. Pankow, K.L.; Moore, J.R.; Mark, H.J.; Koper, K.D.; Kubacki, T.; Whidden, K.M.; McCarter, M.K. Massive landslide at Utah copper mine generates wealth of geophysical data. Gsa Today 2014, 24, 4–9. [Google Scholar] [CrossRef]
  5. Zhou, G. Analysis of the major “12.25” goaf collapse accident in Wanzhuang Gypsum Mining Area, Pingyi County, Linyi City, Shandong Province: Huge mining tremor triggered adjacent mine collapse, rescue of over a thousand miners lasted 44 days. Jilin Labor Prot. 2018, 11, 34–36. [Google Scholar]
  6. Krahn, J.; Morgenstern, N.R. Mechanics of the Frank slide. In Rock Engineering for Foundation & Slopes; ASCE: Reston, VA, USA, 1976; Volume 309. [Google Scholar]
  7. Evans, I.S.; Evans, D.J. The Aberfan Disaster: A Case Study in Slope Instability. Eng. Geol. 1992, 33, 211–225. [Google Scholar]
  8. Jin, D.S. Laojinshan landslide in Yuanyang county, Yunnan province. Chin. J. Geol. Hazard Control 1998, 9, 98–101. [Google Scholar]
  9. Su, H.; Lu, N.D.; Fu, X.S.; Li, Q. Analysis on the influencing factors of geological disasters and causes of landslide in Yuanyang terraced fields based on geographical detectors. Geol. Surv. China 2024, 11, 92–100. [Google Scholar]
  10. Zhu, S.N.; Yin, Y.P.; Li, B. Evolution characteristics of weak intercalation in massive layered rockslides-A case study of Jiweishan rockslide in Wulong, Chongqing. J. Eng. Geol. 2018, 26, 1638–1647. [Google Scholar]
  11. Feng, Z.; Yin, Y.P.; Li, B.; Zhang, M. Mechanism analysis of apparent dip landslide of Jiweishan in Wulong, Chongqing. Rock Soil Mech. 2012, 33, 2704–2712. [Google Scholar]
  12. Yin, Y.P.; Liu, C.Z.; Chen, H.Q. Investigationon catastrophic landslide of January 11, 2013 at Zhaojiagou, Zhenxiong county, Yunnan province. J. Eng. Geol. 2013, 21, 6–15. [Google Scholar]
  13. Yin, Z.Q.; Xu, Y.Q.; Jian, X.W. The key triggering factor and its mitigation implication of Zhaojiagou catastrophic landslide in Zhenxiong County, Yunnan province. Chin. J. Geol. Hazard Control. 2015, 26, 36–42. [Google Scholar]
  14. Qing, L.; Xu, L.; Huang, J.; Fu, X.; Chen, J. Intelligent prediction and numerical simulation of landslide prediction in open-pit mines based on multi-source data fusion and machine learning. Sensors 2025, 25, 3131. [Google Scholar] [CrossRef]
  15. Yawar, H.; Martin, C.S.; Salvatore, M. Multiple geophysical techniques for investigation and monitoring of sobradinho landslide, Brazil. Sustainability 2019, 11, 6672. [Google Scholar] [CrossRef]
  16. Luo, R.; Li, G.; Chen, L.; Zeng, L.; Pei, K.; Yu, X. Rock slope instability mechanism induced by repeated mining in mountain mining areas. Appl. Sci. 2024, 14, 9634. [Google Scholar] [CrossRef]
  17. Jones, D.B.; Reddish, D.J.; Siddle, H.J.; Whittaker, B.N. Landslides and undermining: Slope stability interaction with mining. In Proceedings of the 7th International Society of Rock, Mechanics Congress, Aachen, Germany, 16–20 September 1992. [Google Scholar]
  18. Boris, B. Numerical Modelling of Complex Slope Deformations. Ph.D. Thesis, University of Saskatchwan, Saskatoon, SK, USA, 1997. [Google Scholar]
  19. Mu, C.L.; Pei, X.Q.; Wang, R. Analysis on deformation characteristics of a cutting high bedding rock slope with multiple weak layers based on physical model tests. Chin. J. Geol. Hazard Control 2022, 33, 61–67. [Google Scholar]
  20. Yin, Y.P. Mechanism of apparent dip slide of inclined bedding rockslide-a case study of Jiweishan rockslide in Wulong, Chongqing. Chin. J. Rock Mech. Eng. 2010, 29, 217–226. [Google Scholar]
  21. Liu, C.; Jiang, A.M.; Dong, Y.C. Mechanism analysis and numerical simulation for landslide of mountain slope with underground complex goaf. Min. Metall. Eng. 2022, 42, 35–42. [Google Scholar]
  22. Liu, H.F.; Luo, H.Y.; Liu, Z.Q. Study on the ore pillar remining scheme during the transition from underground to open-pit mining at Shizhuyuan Polymetallic Mine. Min. Technol. 2024, 24, 13–18. [Google Scholar]
  23. He, B.Q.; Li, Z.Z.; Cheng, G.H. Analysis on safety and stability of open-pit and underground collaborative mining in Shizhuyuan Polymetallic Mine. Min. R&D 2023, 43, 1–10. [Google Scholar]
  24. Xie, Y.H.; Yang, T.; Jia, D.N. Minor fault detection based on PCA and moving window cumlative sum. Comput. Appl. Softw. 2023, 40, 60–66. [Google Scholar]
  25. Gao, X. Industrial Process Monitoring Based on Big Data Multivariate Statistics; Publishing House of Electronics Industry: Beijing, China, 2017. [Google Scholar]
  26. Yue, B.; Min, Y.Z.; Ma, H.F.; Xiao, B.Y. Research on image enhancement preprocessing method in rail surface defects detection system. J. Railw. Sci. Eng. 2018, 15, 3248–3256. [Google Scholar]
  27. Xu, C.H.; Wu, H. Application of the moment of interia method in predicting the constitutive relationship of multiaxial fatigue. Chin. Q. Mech. 2021, 42, 517–527. [Google Scholar]
  28. Ohtsu, M. Acoustic emission theory for moment tensor analysis. Res. Nondestruct. Eval. 1995, 6, 169–184. [Google Scholar] [CrossRef]
  29. Li, H.; Chang, X.; Hao, J. Hydraulic fracturing shear/tensile/compressive crack investigation using microseismic data. Remote Sens. 2024, 16, 1902. [Google Scholar] [CrossRef]
  30. Li, S.L.; Lin, K.F.; Zhou, M.J. Study on failure precursors and seismogenic mechanisms of a large landslide based on moment tensor analysis. Chin. J. Rock Mech. Eng. 2019, 38, 2000–2009. [Google Scholar]
Disclaimer/Publisher’s Note: The statements, opinions and data contained in all publications are solely those of the individual author(s) and contributor(s) and not of MDPI and/or the editor(s). MDPI and/or the editor(s) disclaim responsibility for any injury to people or property resulting from any ideas, methods, instructions or products referred to in the content.

Article Metrics

Citations

Article Access Statistics

Multiple requests from the same IP address are counted as one view.