Article

Strength Deterioration Pattern and Stability Evaluation of Open−Pit Mine Slopes in Cold Regions Under Freeze–Thaw Cycles

1
School of Resources and Civil Engineering, Northeastern University, Shenyang 110819, China
2
Changchun Gold Research Institute Co., Ltd., Changchun 130012, China
*
Authors to whom correspondence should be addressed.
Appl. Sci. 2025, 15(9), 4853; https://doi.org/10.3390/app15094853
Submission received: 20 March 2025 / Revised: 19 April 2025 / Accepted: 24 April 2025 / Published: 27 April 2025
(This article belongs to the Special Issue Rock Mechanics and Mining Engineering)

Abstract

:
With the gradual depletion of mineral resources in temperate regions, cold regions have become primary areas for mineral extraction. However, the freeze–thaw phenomena induced by temperature fluctuations pose significant threats to the stability of rock masses on open−pit mine slopes, further affecting normal mining operations. To investigate the strength degradation and stability evolution patterns of freeze–thaw slope rock masses, this study takes the Wushan Open−Pit Mine as its engineering context. We analyzed the relationship between rock temperature and burial depth, conducted freeze–thaw cyclic tests under realistic temperature ranges, and developed a mechanical parameter characterization model for freeze–thaw rock masses by integrating the generalized Hoek–Brown strength criterion. Slope safety factors and potential landslide mechanisms were determined through numerical simulations and the strength reduction method. Key findings include the following: (1) Shallow rock temperatures exhibit high synchronization with atmospheric temperature, characterized by large fluctuations and rapid variation rates, whereas deep rock demonstrates opposite trends. (2) As freeze–thaw cycles increase and burial depth decreases, the internal friction angle and cohesion of slope rock masses follow negative exponential decay functions. After 20 freeze–thaw cycles, the internal friction angle and cohesion of rock at a 5.27 m depth decreased by 18.36% and 33.92%, respectively. In contrast, rock at a 0.10 m depth showed more severe reductions of 31.81% and 50.14%. (3) Increasing freeze–thaw cycles progressively lower the safety factors of slope benches, with potential slip surfaces displaying reduced average depths and curvature, alongside elevated dip angles. These findings provide critical insights for preventing freeze–thaw−induced landslide hazards in cold−region open−pit mine slopes.

1. Introduction

Freeze–thaw cycling is recognized as one of the primary natural factors triggering landslides in rock slopes of open−pit mines in cold regions [1]. Research on the damage characteristics of rock masses in freeze–thaw environments can deepen our understanding of frost−induced hazards in alpine and seasonally frozen areas.
In recent years, extensive experimental studies have been conducted to explore changes in rock mechanical properties under freeze–thaw conditions. Kodama et al. [2] investigated the effects of moisture content, temperature, and loading rate on the mechanical strength and failure modes of frozen–thawed rocks in alpine regions. Zhang et al. [3] studied the influence of freeze–thaw cycles and confining pressure on the mechanical performance of red sandstone, noting that the longitudinal wave velocity, static elastic modulus, compressive strength, and fracture toughness gradually decrease with increasing freeze–thaw cycles. They also developed a damage model capturing the full deformation process of rocks. Li et al. [4] analyzed variations in mechanical parameters of granite specimens subjected to freeze–thaw cycles and uniaxial compression tests, revealing freeze–thaw degradation mechanisms and applying their findings to slope stability assessments in open−pit mines. Zhang and Yang [5] compared the tensile strength of red sandstone and shale after freeze–thaw cycles, demonstrating that tensile strength is more sensitive to freeze–thaw effects. Walbert et al. [6] explored the frost weathering and thermodynamic behavior of three types of limestone during freeze–thaw cycles, while Bayram et al. [7] established a statistical model predicting percentage loss in uniaxial compressive strength using limestone subjected to freeze–thaw tests. Zhang et al. [8] found that chemical erosion coupled with freeze–thaw cycles significantly deteriorate the physical–mechanical properties of intact sandstone. Ren et al. [9] conducted triaxial compression tests on freeze–thawed fractured sandstone, reporting reductions in peak strength and the elastic modulus, with peak strength decreasing progressively as fracture inclination angles increased. Yu et al. [10,11] investigated the effects of freeze–thaw cycles and confining pressure on sandstone’s mechanical behavior and permeability through triaxial tests. Chen et al. [12] performed conventional and creep triaxial tests on quartz sandstone after varying freeze–thaw cycles, analyzing short− and long−term mechanical responses and discussing time−dependent degradation mechanisms in steep rock slopes in cold regions. Gao et al. [13] and Wang et al. [14] examined fracture evolution, energy dissipation, and damage characteristics in sandstone and marble post−freeze–thaw cycles, highlighting the significant impact of initial freeze–thaw treatments on rock fracturing. To date, in situ testing of freeze–thawed rock mass mechanical properties remains unreported. However, scholars have indirectly estimated freeze–thaw impacts using rock mass quality evaluations or the Hoek–Brown criterion based on laboratory tests and field surveys of weathering. Wen et al. [15] determined the degradation of RMR values and rock mass quality at the Yulong Copper Mine slope in Tibet under freeze–thaw cycles by integrating fracture spacing, condition, and RQD data. Zhang et al. [16] proposed the TSMR system for slope rock mass quality assessment in the Tianshan Highway area, incorporating freeze–thaw coefficients derived from experiments, rock hardness, and field investigations into the RMR, SMR, and CSMR frameworks. Tan et al. [17] quantified freeze–thaw disturbance factors and GSI values using ultrasonic wave velocities of freeze–thawed samples, enabling the estimation of slope rock mass mechanical parameters via the Hoek–Brown criterion. Their work revealed exponential decay patterns in uniaxial compressive strength and the elastic modulus. Xiao [18] developed a freeze–thaw damage strength criterion by modifying Hoek–Brown parameters to account for degradation, enabling the quantification of strength parameter deterioration with freeze–thaw cycles. In Youssef Zerradi et al.’s research [19], the maximum safe slope angle of fractured rock masses was optimized by eliminating slope angles inducing unstable blocks (key blocks) and by using the stereographic projection method of the key block theory. Olena Sdvyzhkova et al. [20] numerically modelled pit wall stability using finite element analysis, optimizing boundaries for complete ore excavation, and identified safety factor distribution, potential sliding surfaces, and the influence of wall slope and ore completeness on the stripping ratio in a super−deep open pit.
Traditional indoor freeze–thaw tests typically use temperature settings based on ambient air conditions, which effectively capture the response of shallow rock masses. However, as burial depth increases, significant discrepancies arise between rock mass temperatures and atmospheric fluctuations. These standardized temperature protocols fail to simulate true freeze–thaw responses in deep rock masses, compromising the accuracy of slope stability evaluations and physical–mechanical parameter estimations.
To address these limitations, this study focuses on the Wushan Open−Pit Mine in a typical cold region. We analyze the correlation between extreme rock temperatures and burial depth, conduct freeze–thaw experiments across varying temperature ranges, and assess the evolution of mechanical properties and slope stability under freeze–thaw conditions.

2. Technical Approach for Strength Degradation and Stability Evaluation of Slope Rock Mass Under Freeze–Thaw Cycles

The technical roadmap for characterizing mechanical parameters and evaluating the stability of slope rock mass under freeze–thaw cycles is shown in Figure 1. First, based on the actual extreme temperature values within the slope over one year, the freeze–thaw cycle test temperatures were set. Through conducting freeze–thaw cycle experiments, the attenuation patterns of the uniaxial compressive strength and tensile strength of rocks under different numbers of freeze–thaw cycles and burial depths were obtained. Subsequently, the mi value (rock hardness/softness index) was calculated based on experimental results. Coupled with the Geological Strength Index (GSI) and the generalized Hoek–Brown strength criterion, the cohesion and internal friction angle of the rock mass were determined. Finally, the effects of burial depth and the number of freeze–thaw cycles on rock mass cohesion and the internal friction angle were analyzed, and a spatially variable characterization model of mechanical parameters for freeze–thaw−affected slopes was developed. The safety factor and potential landslide patterns of the slope were quantitatively assessed by integrating numerical simulations and the strength reduction method.

3. Engineering Overview and Rock Mass Temperature Variation Characteristics with Depth

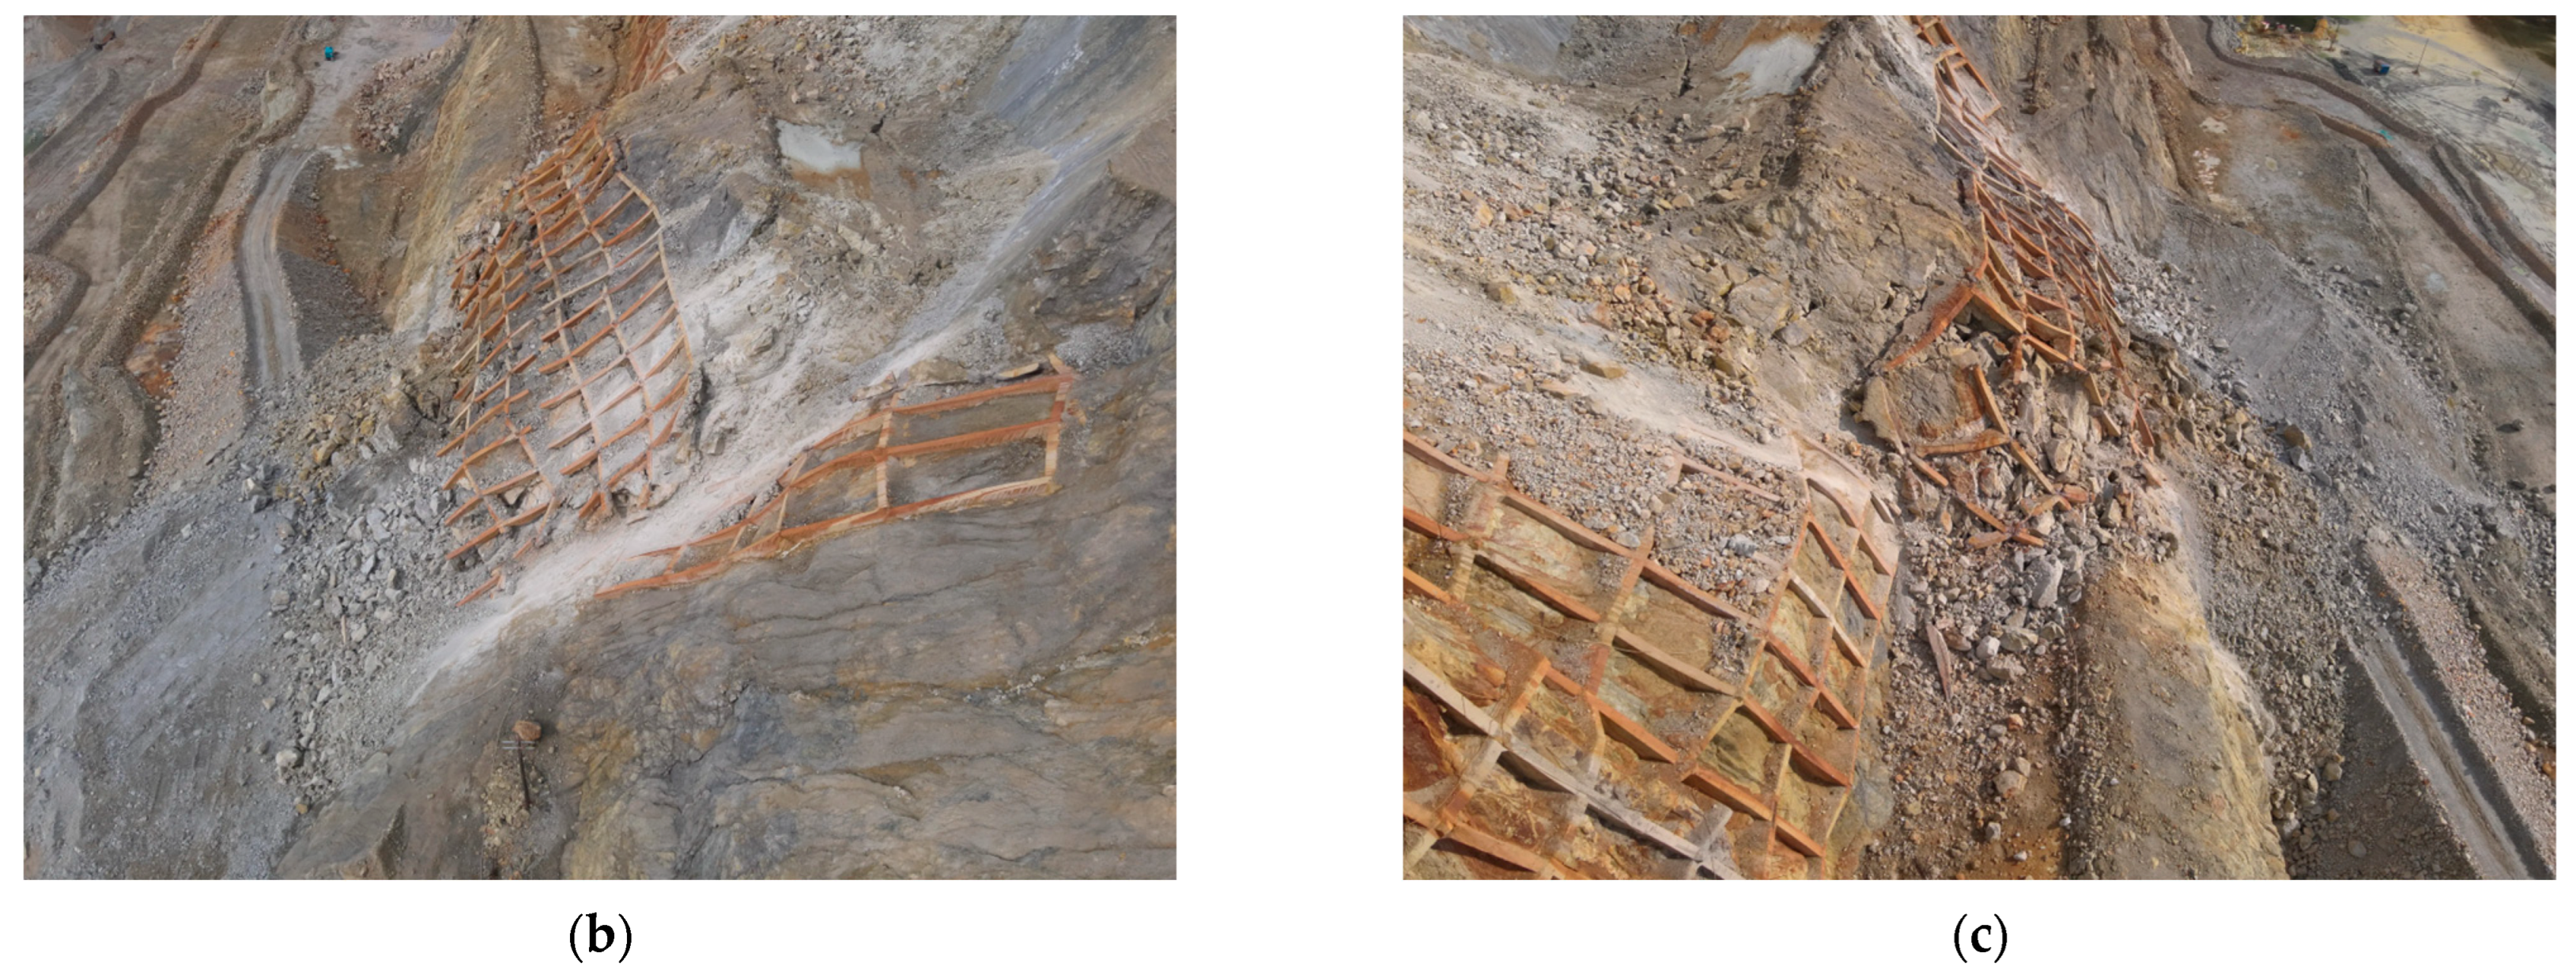
3.1. Engineering Overview

The Wushan Open−Pit Mine, operated by China National Gold Group Inner Mongolia Mining Co., Ltd. in Hulunbuir City, Inner Mongolia Autonomous Region, China, holds the distinction of being the first modernized large−scale non−ferrous deep open−pit mine in China’s alpine/permafrost regions. The mining area covers 9.84 square kilometers and is characterized by low resource grades (average copper grade of 0.29%, molybdenum grade of 0.039%), high mining intensity (daily ore processing capacity of 75,000 tons, annual ore volume of 24.75 million tons), substantial mining depth (current slope height exceeding 200 m, designed final slope elevation difference reaching approximately 510 m), steep slope angles (overall slope angle 43–45°, bench slope angle 65°), high clay mineral content in surrounding rocks (locally up to 60%), and pronounced freeze–thaw effects (annual temperature variation exceeding 80 °C).
Prolonged intensive mining operations combined with structural discontinuities, jointing, water infiltration, and cyclic freeze–thaw actions have led to progressive deterioration of rock mass stability, with consequent geohazard escalation. Multiple localized slope failures have been documented across western and southern mining benches (Figure 2). Notably, the western and southern slopes accommodate critical conveyor and haul truck infrastructure, respectively. Slope instability at these strategic locations poses direct threats to material transport systems, potentially disrupting mining production continuity. Consequently, rigorous stability assessment of open−pit slopes under freeze–thaw cycling constitutes an essential prerequisite for operational safety assurance.

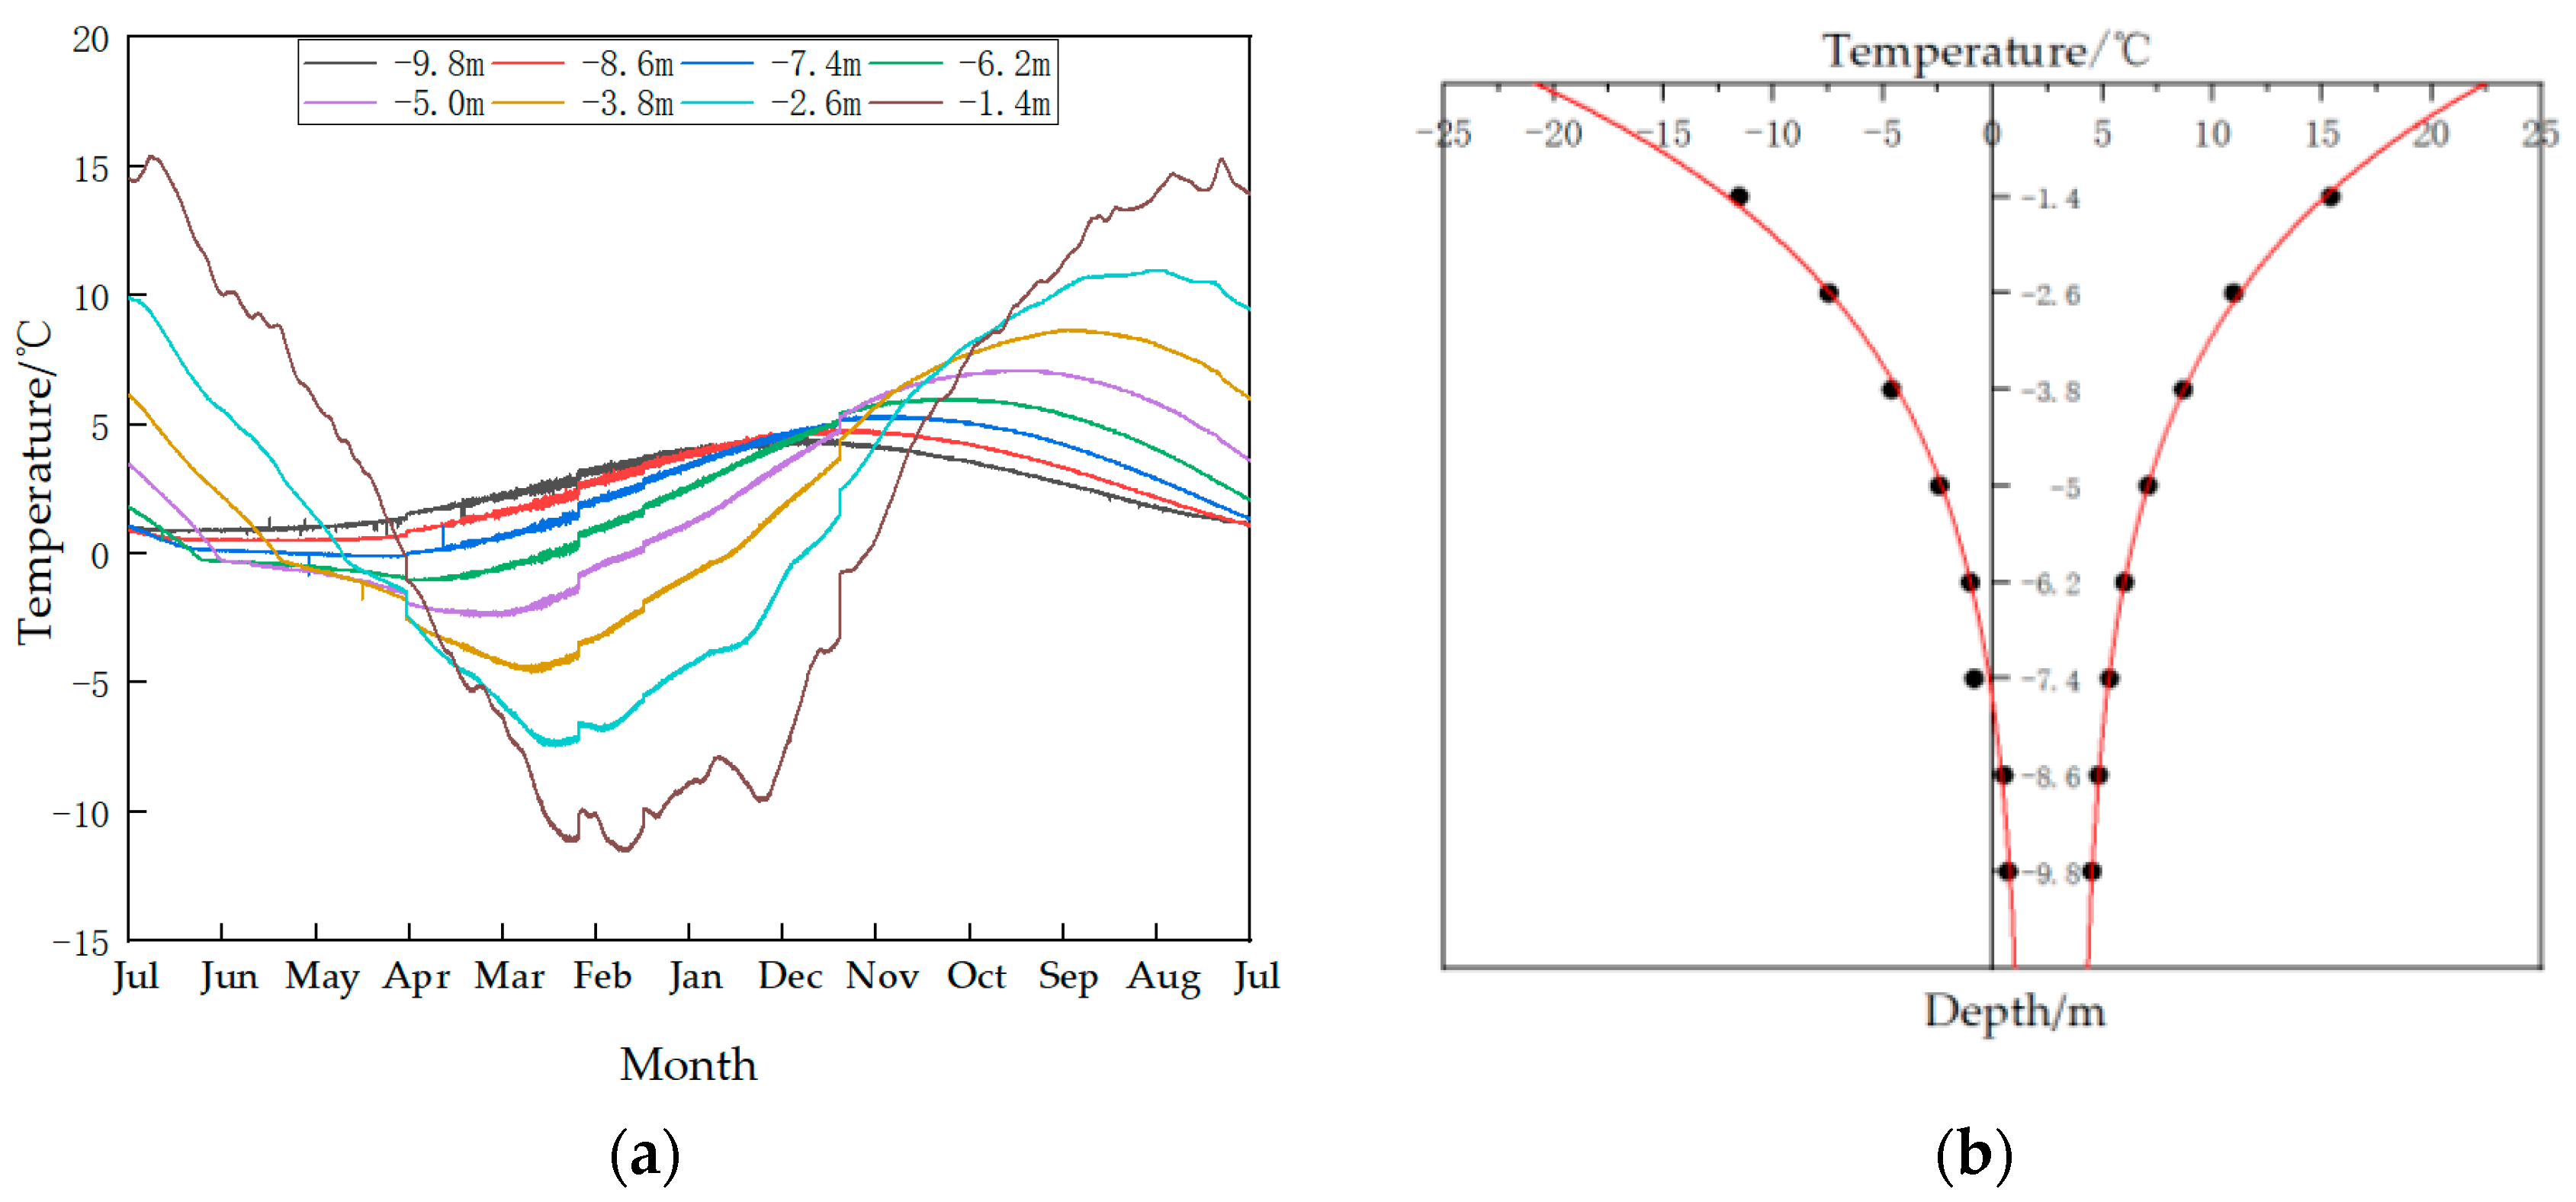
3.2. The Relationship Between the Temperature of the Rock Mass and Its Burial Depth

As shown in Figure 3a (the temperature data were acquired from the monitoring boreholes at the 645 m bench platform), the temperature variation curves at different depths within the Wushan Open−Pit Mine slope reveal that the rock mass temperature follows a sinusoidal pattern in response to seasonal cycles. However, distinct thermal response characteristics exist between shallow and deeper layers: Shallow rock layers exhibit higher sensitivity to atmospheric temperature variations due to their proximity to the atmospheric environment, manifesting as larger temperature fluctuation amplitudes and faster change rates. In contrast, deeper rock layers experience less influence from atmospheric temperature, resulting in smaller temperature variation ranges and slower change rates.
The relationship between temperature extremes and depth plotted from the temperature variation curves is shown in Figure 3b. As depth increases, positive and negative temperature extremes progressively converge with decreasing convergence rates, reaching a depth where the negative temperature extreme equals 0 °C (maximum freezing depth) at approximately 7.5 m.

4. Impact of Burial Depth and Freeze–Thaw Cycles on Rock Mechanical Properties

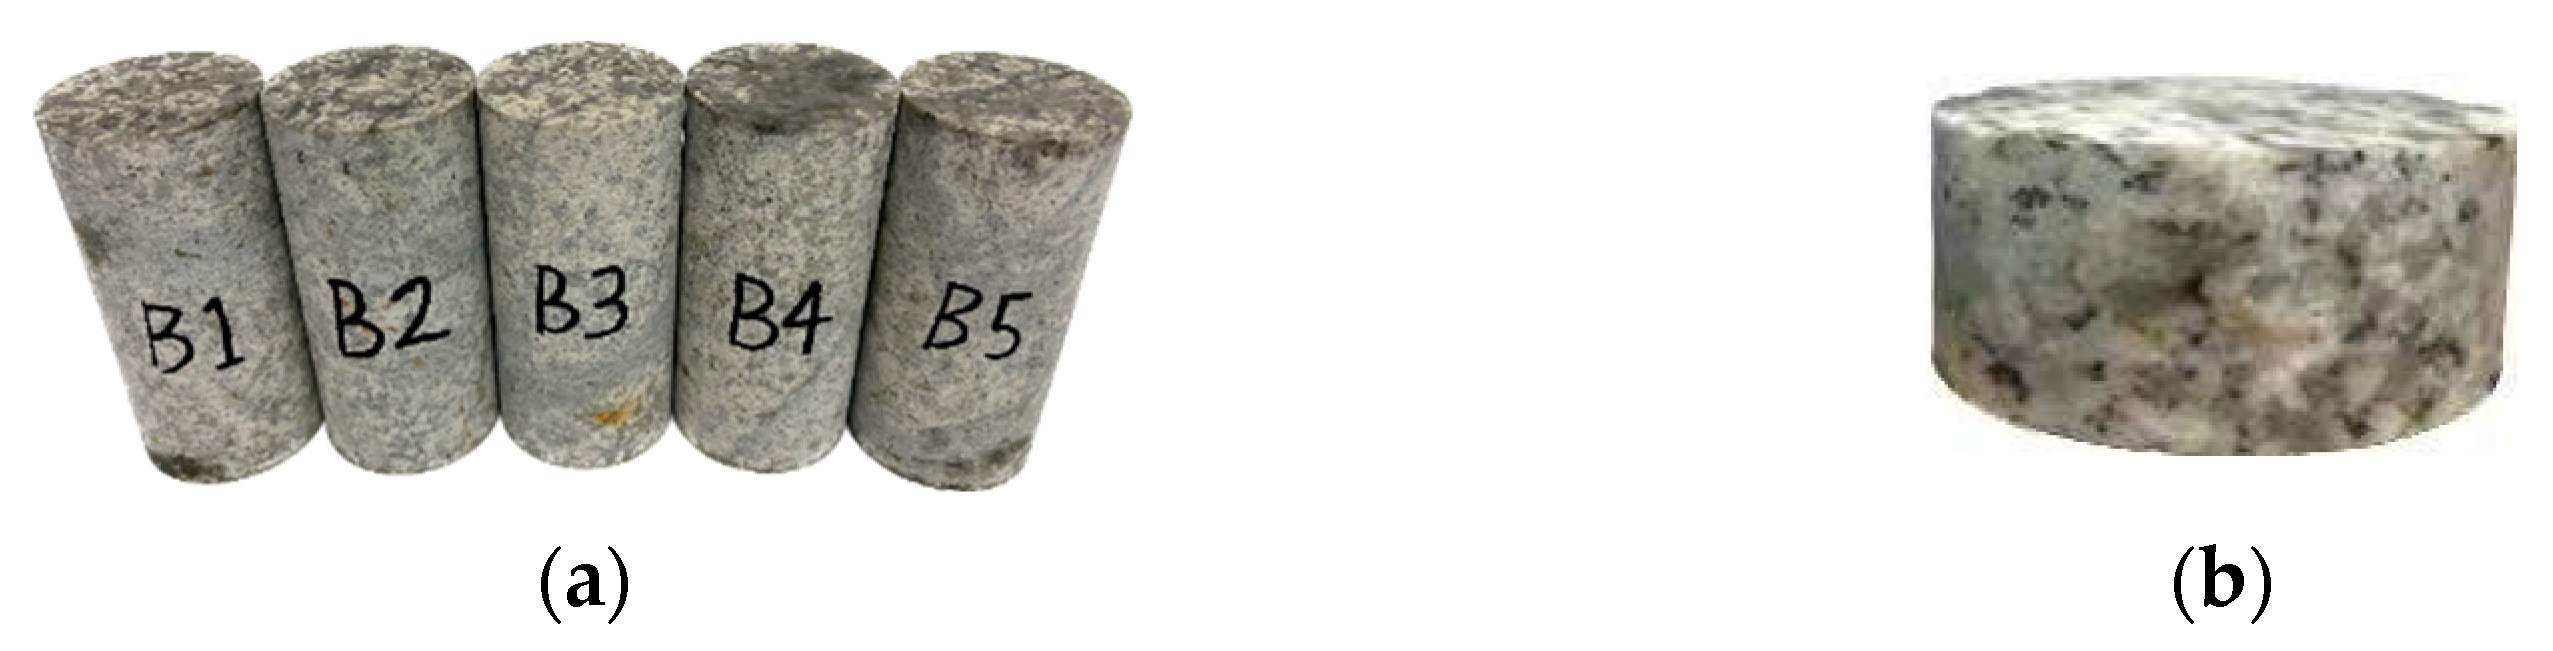
4.1. Specimen Preparation and Testing Protocol

In accordance with the International Society for Rock Mechanics (ISRM) testing standards, granite specimens collected from the 645 m platform of the Wushan Open−Pit Mine were processed into standard cylindrical samples (Φ50 mm × 100 mm) and Brazilian disc samples (Φ50 mm × 25 mm) with dimensional tolerances (diameter/height deviation ≤ ±0.3 mm) and end flatness ≤ ±0.5 mm. Post−processing, ultrasonic wave velocity was measured using a sonic velocity tester to screen specimens, discarding those with velocity deviations exceeding ±100 m/s, as illustrated in Figure 4.
This study employed freeze–thaw temperature intervals aligned with actual temperature variation ranges of rock masses at different burial depths. Each freeze–thaw cycle comprised a 4 h freezing phase and a 4 h thawing phase, with cycle counts set to 0, 5, 10, 15, and 20 cycles. The rock samples were immersed in water for 48 h to achieve saturation. Specific test parameters are detailed in Table 1. Upon completing the specified number of cycles, uniaxial compression and Brazilian splitting tests were conducted under displacement control at a loading rate of 0.002 mm/s.

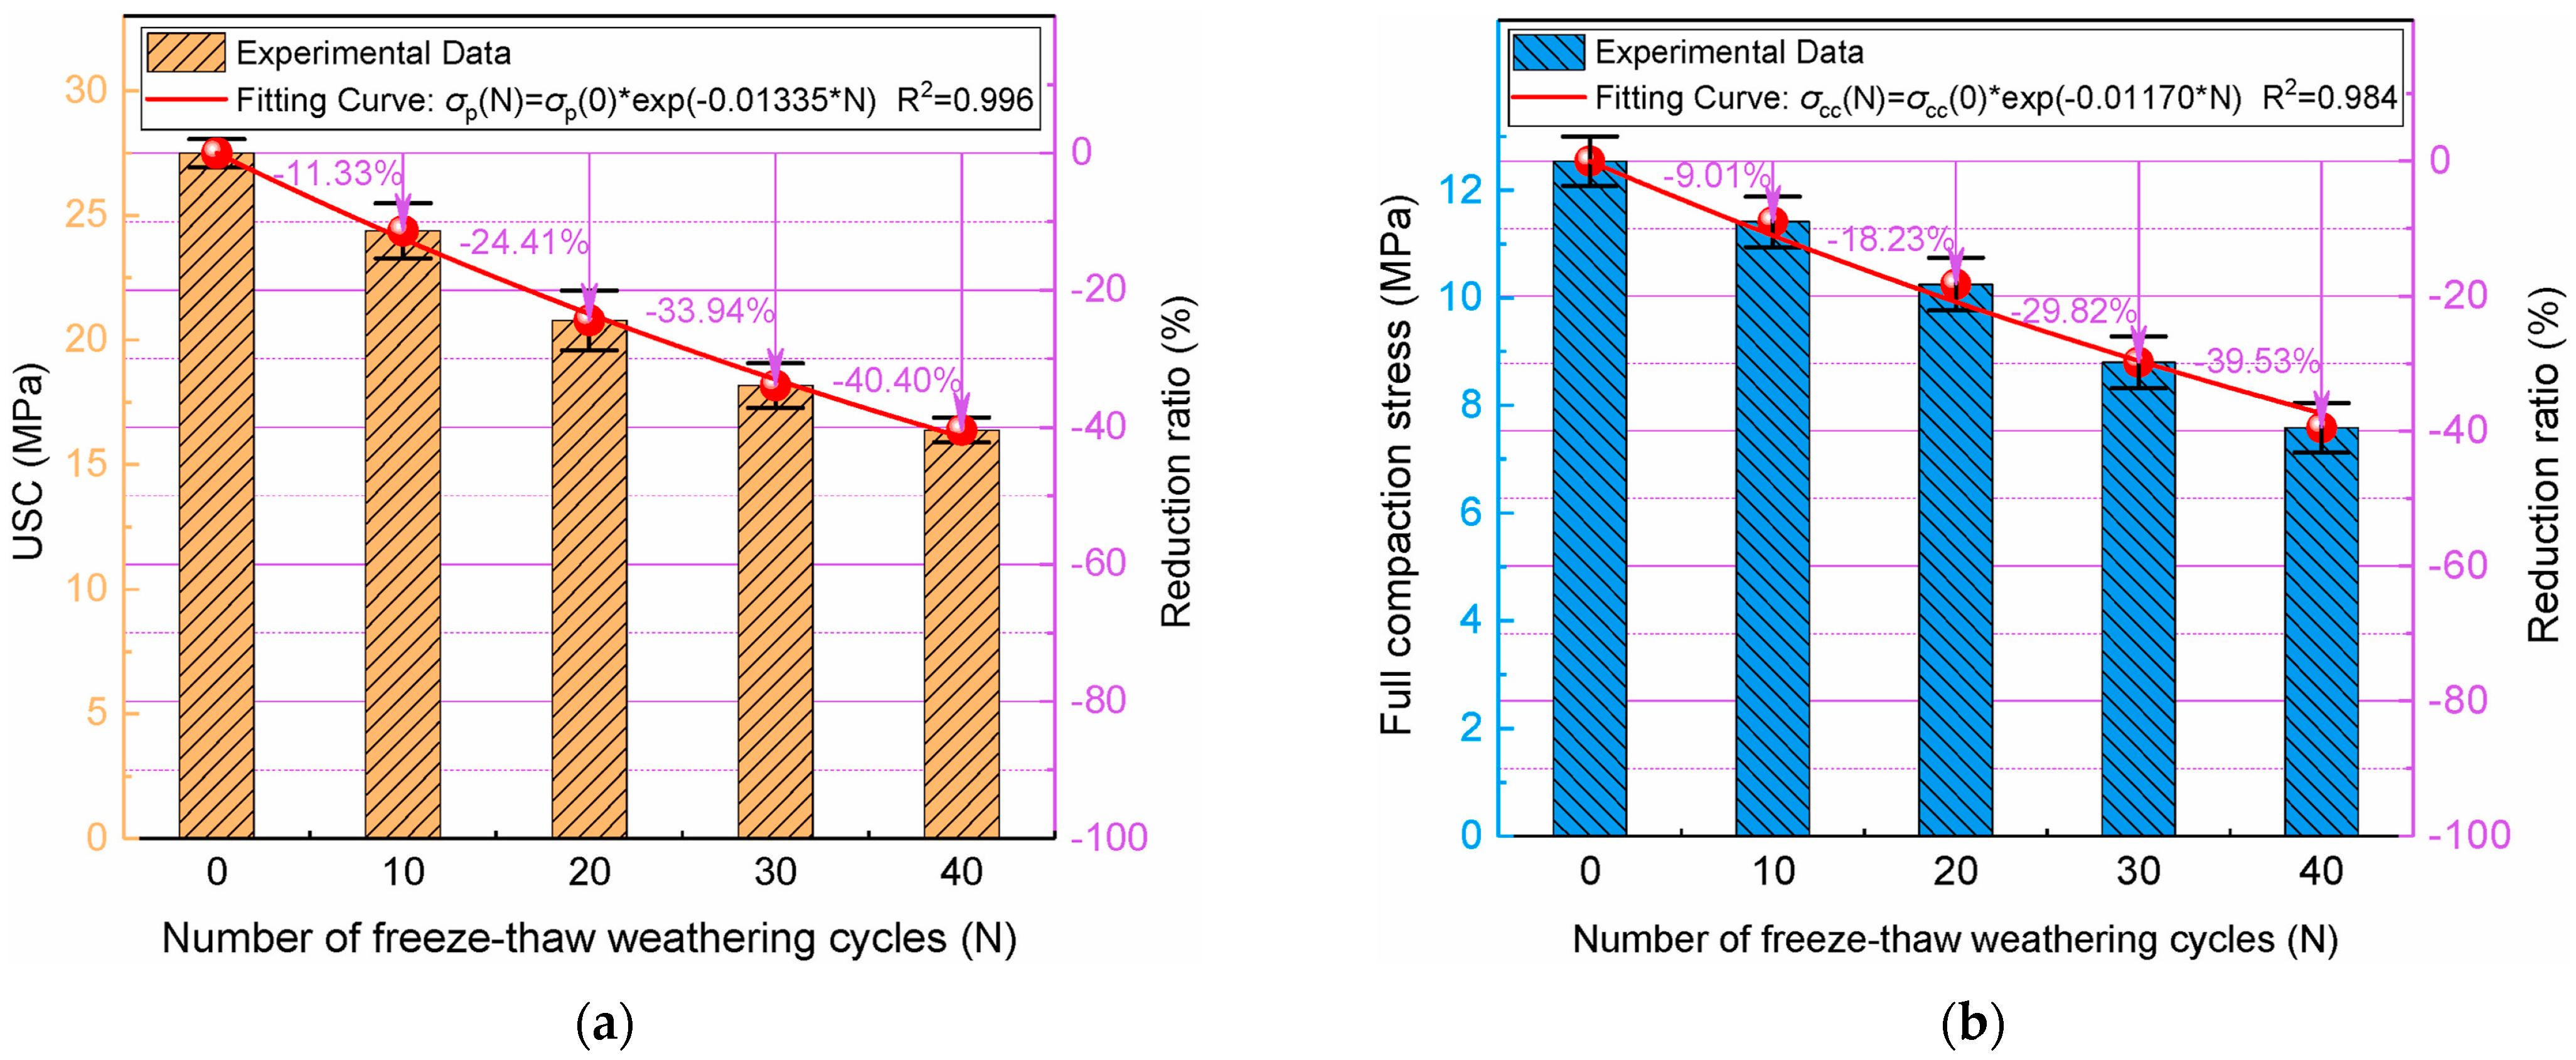
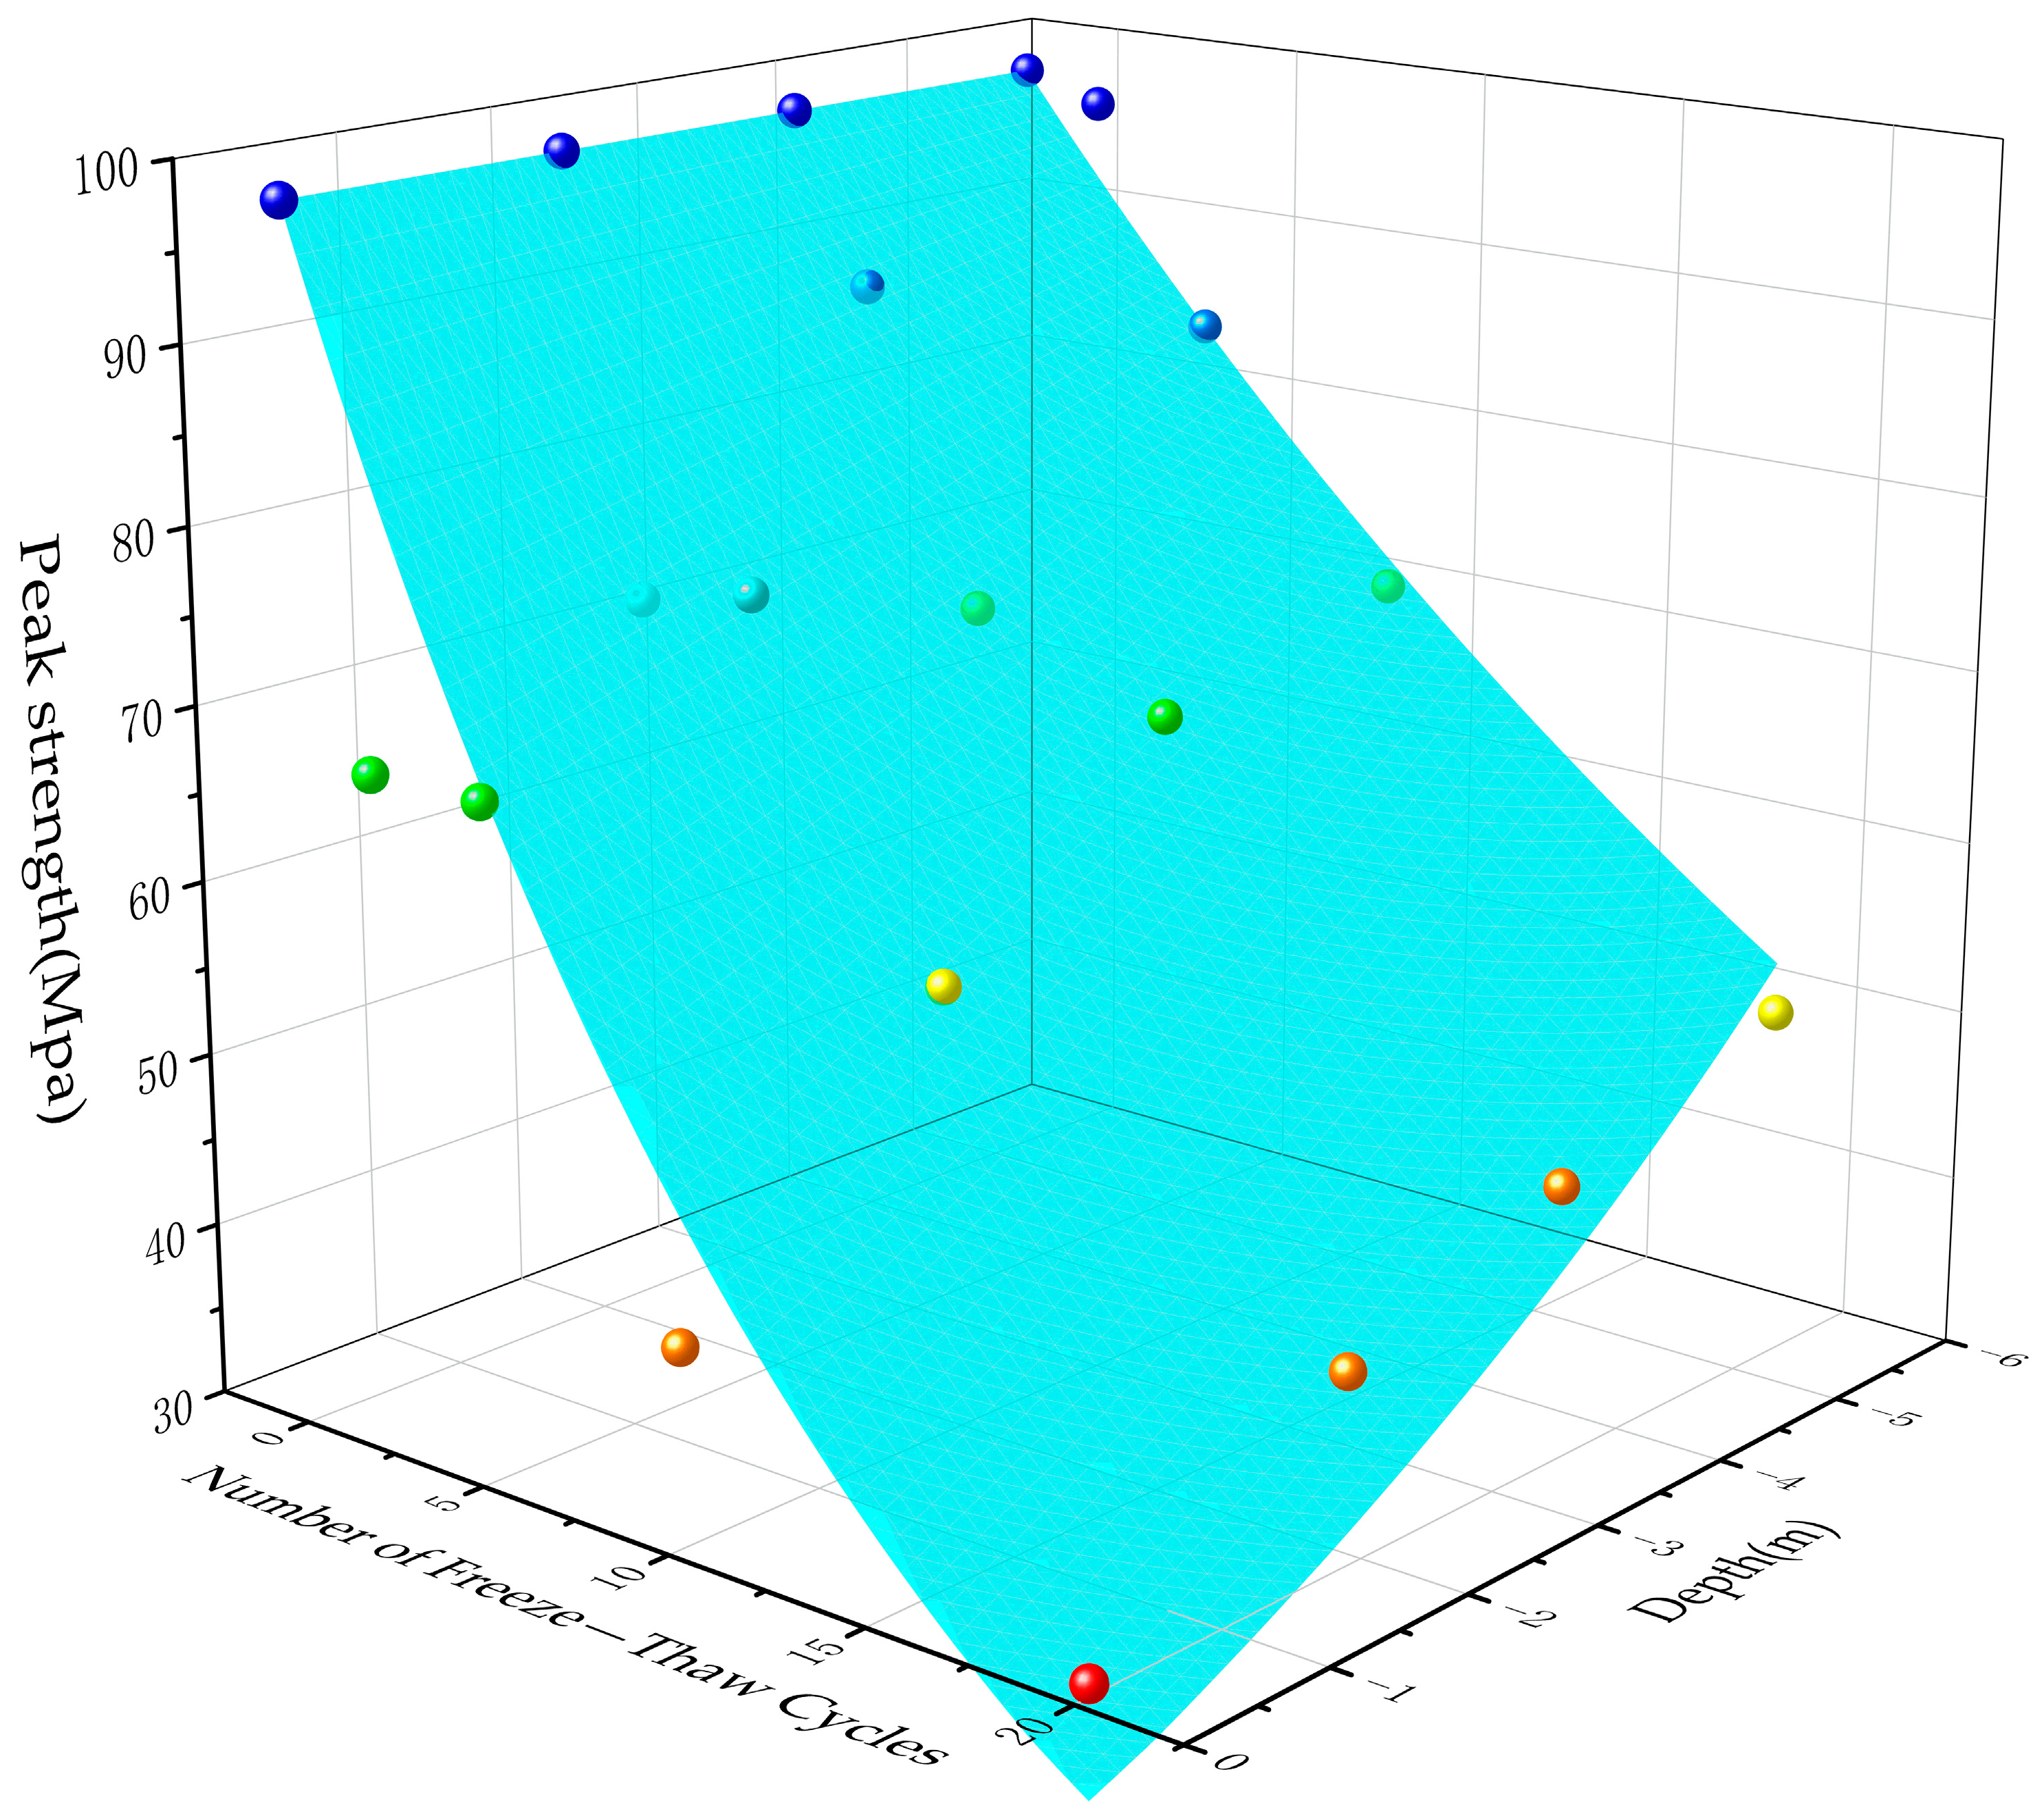
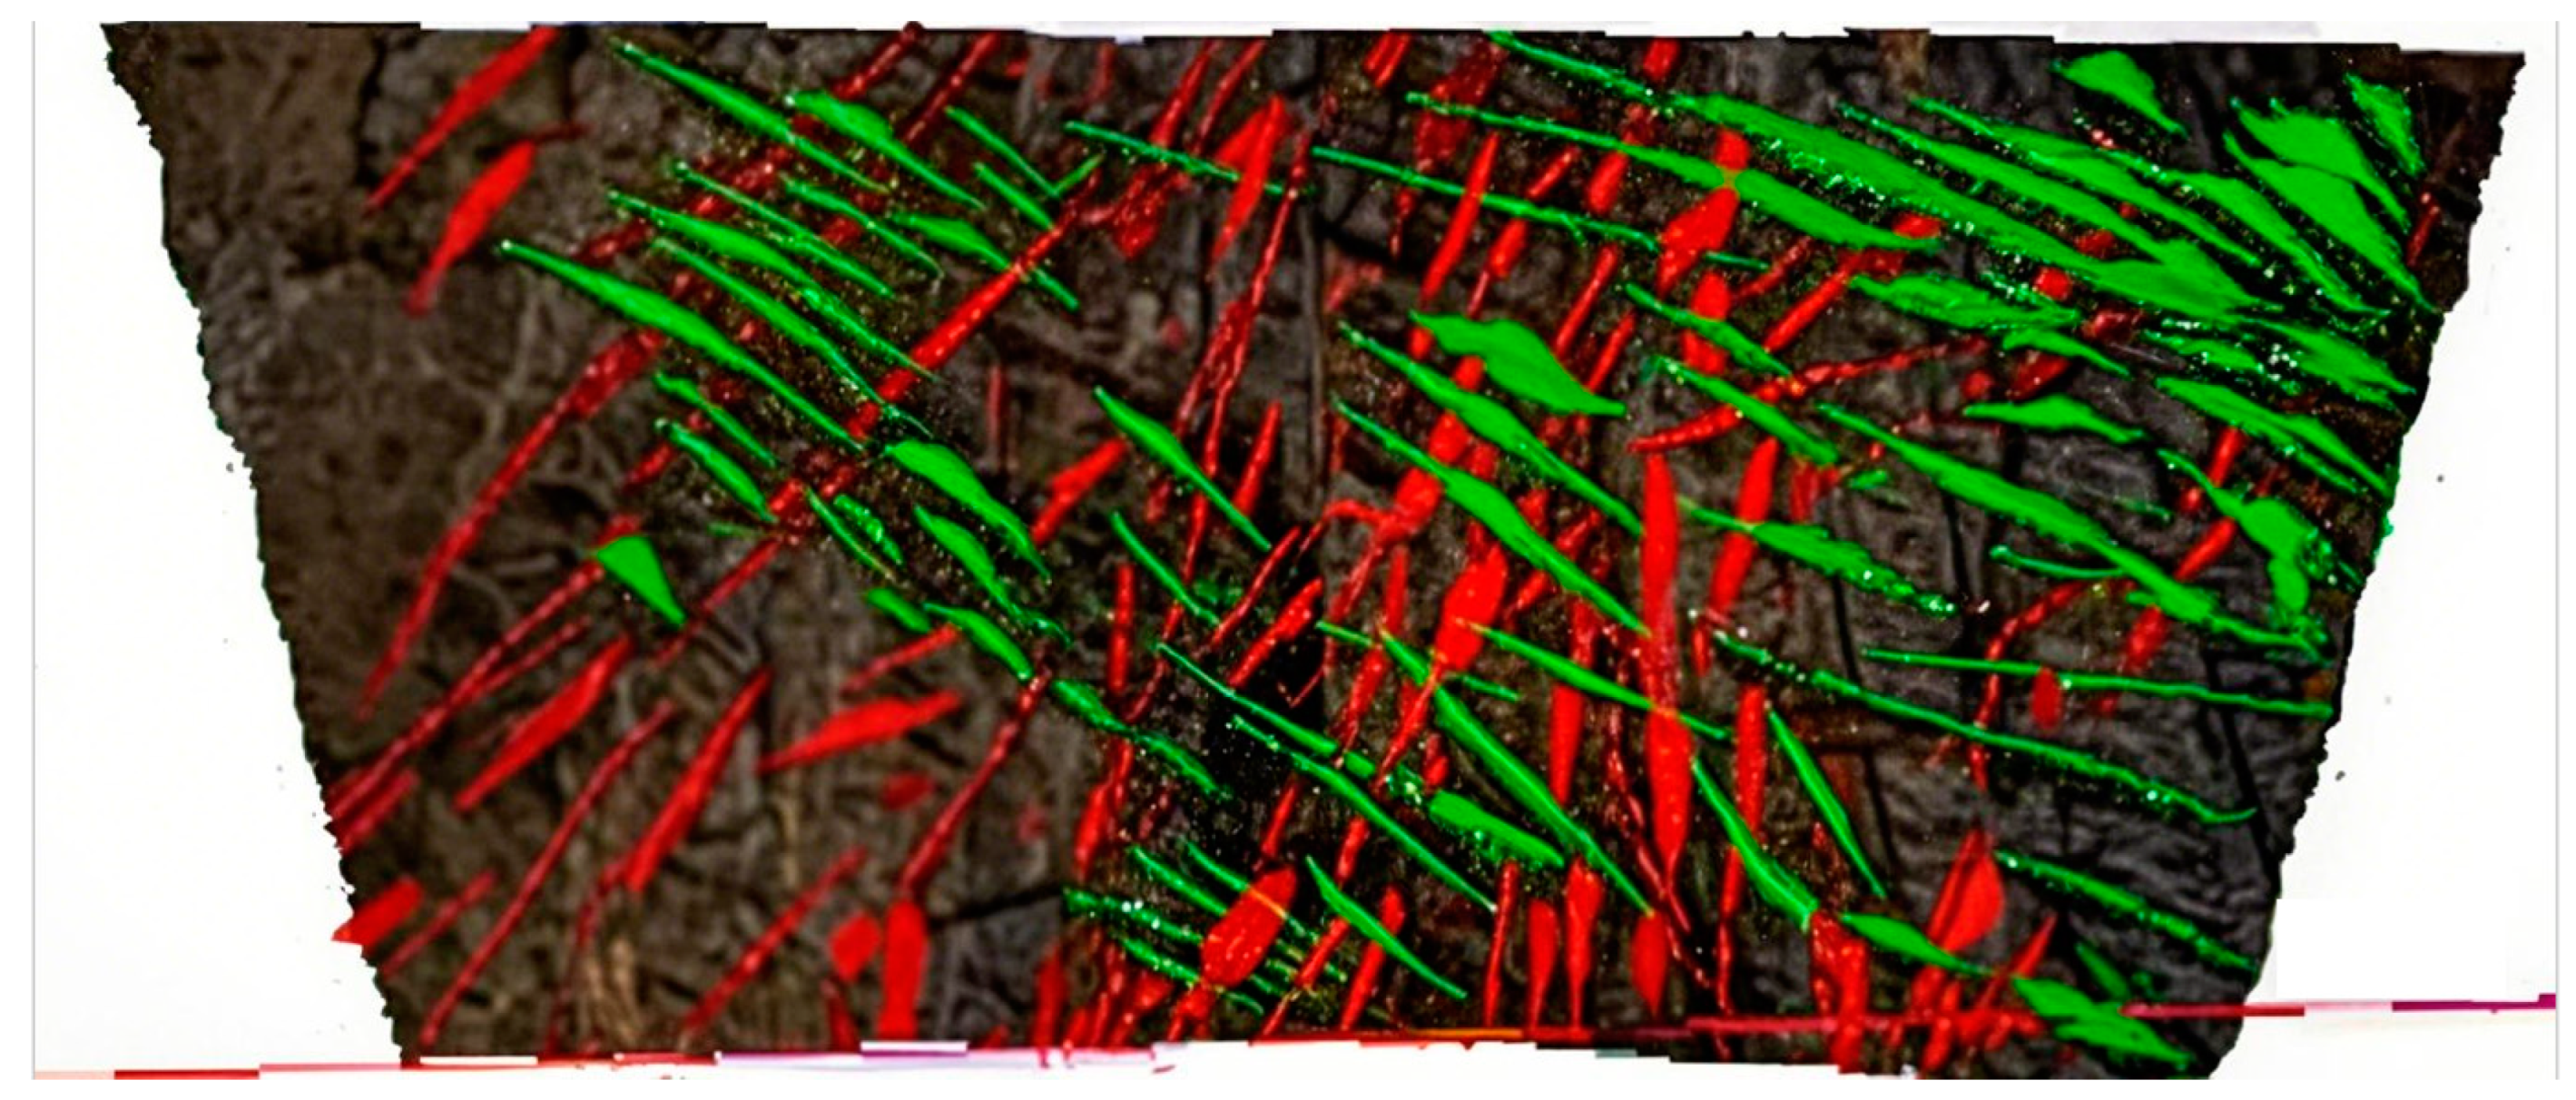
4.2. Experimental Results and Analysis

As shown in Figure 5, the uniaxial compressive strength of rocks decreased significantly with increasing freeze–thaw cycles and decreasing burial depth, albeit at a progressively reduced rate. For unfrozen granite, the compressive strength was 98.44 MPa. After 20 freeze–thaw cycles, specimens at 5.27 m and 0.10 m burial depths exhibited compressive strengths of 45.87 MPa (53.40% reduction) and 30.72 MPa (68.79% reduction), respectively.
A three−dimensional exponential fitting (Equation (1), fitness coefficient: 0.908) was applied to describe the uniaxial compressive strength ( σ c ) of rocks at varying burial depths post−freeze–thaw cycles. The fitness coefficients confirm that the freeze–thaw cycles exerted a far greater influence on strength degradation compared to burial depth (i.e., low−temperature extremes).
σ c = 98.44 e 0.00772 Y 0.07115 N
where Y is the depth of the rock mass (m, positive values indicate burial depth) and N is the number of freeze–thaw cycles.
As indicated in Figure 6, the tensile strength variation of rocks with freeze–thaw cycles and burial depth paralleled compressive strength trends, though the magnitude of strength reduction was slightly smaller. Unfrozen granite exhibited a tensile strength of 7.06 MPa. After 20 freeze–thaw cycles, specimens at 5.27 m and 0.10 m burial depths experienced tensile strengths of 3.91 MPa (44.60% reduction) and 3.30 MPa (53.25% reduction), respectively. Strength losses for compressive and tensile properties at 0.10 m depth exceeded those at 5.27 m by 15.39% and 8.65%, respectively.
A three−dimensional exponential fitting (Equation (2), fitness coefficient: 0.956) quantified tensile strength ( σ t ) dependence on burial depth and freeze–thaw cycles. Analogous to compressive behavior, freeze–thaw cycles dominated strength degradation over burial depth effects (low−temperature extremes).
σ t = 7.059 e ( 0.00348 Y 0.04739 ) N

5. Evolution of Rock Mass Mechanical Parameters Under Freeze–Thaw Cycles

5.1. Structural Geometry Parameters and Rock Mass Quality Quantification

The Geological Strength Index (GSI), a critical parameter in the Hoek–Brown criterion, serves both as a rock mass quality classification metric and a determinant of mechanical properties, based on rock structure and structural surface characteristics [21]. Rock structure and structural surfaces are quantified via Structure Rating (SR) and Structural Surface Rating (SCR), respectively. SR correlates with volume joints (Jv), while SCR integrates assessments of surface roughness (Rr), weathering degree (Rw), and the filling state (Rf) of discontinuities. These parameters are derived using the following equations:
S R = 17.5 ln J v + 79.8
S C R = R r + R w + R f
Through field measurements, the geometric parameters of structural planes exposed on the slope surface of the 645 m bench (including trace length, strike, dip direction, dip angle, spacing, and volumetric joint count Jv) were obtained. The measurement results are shown in Figure 7. Based on Equations (3) and (4) and referencing literature [22], the average Geological Strength Index (GSI) for the 645 m bench was determined as 41.

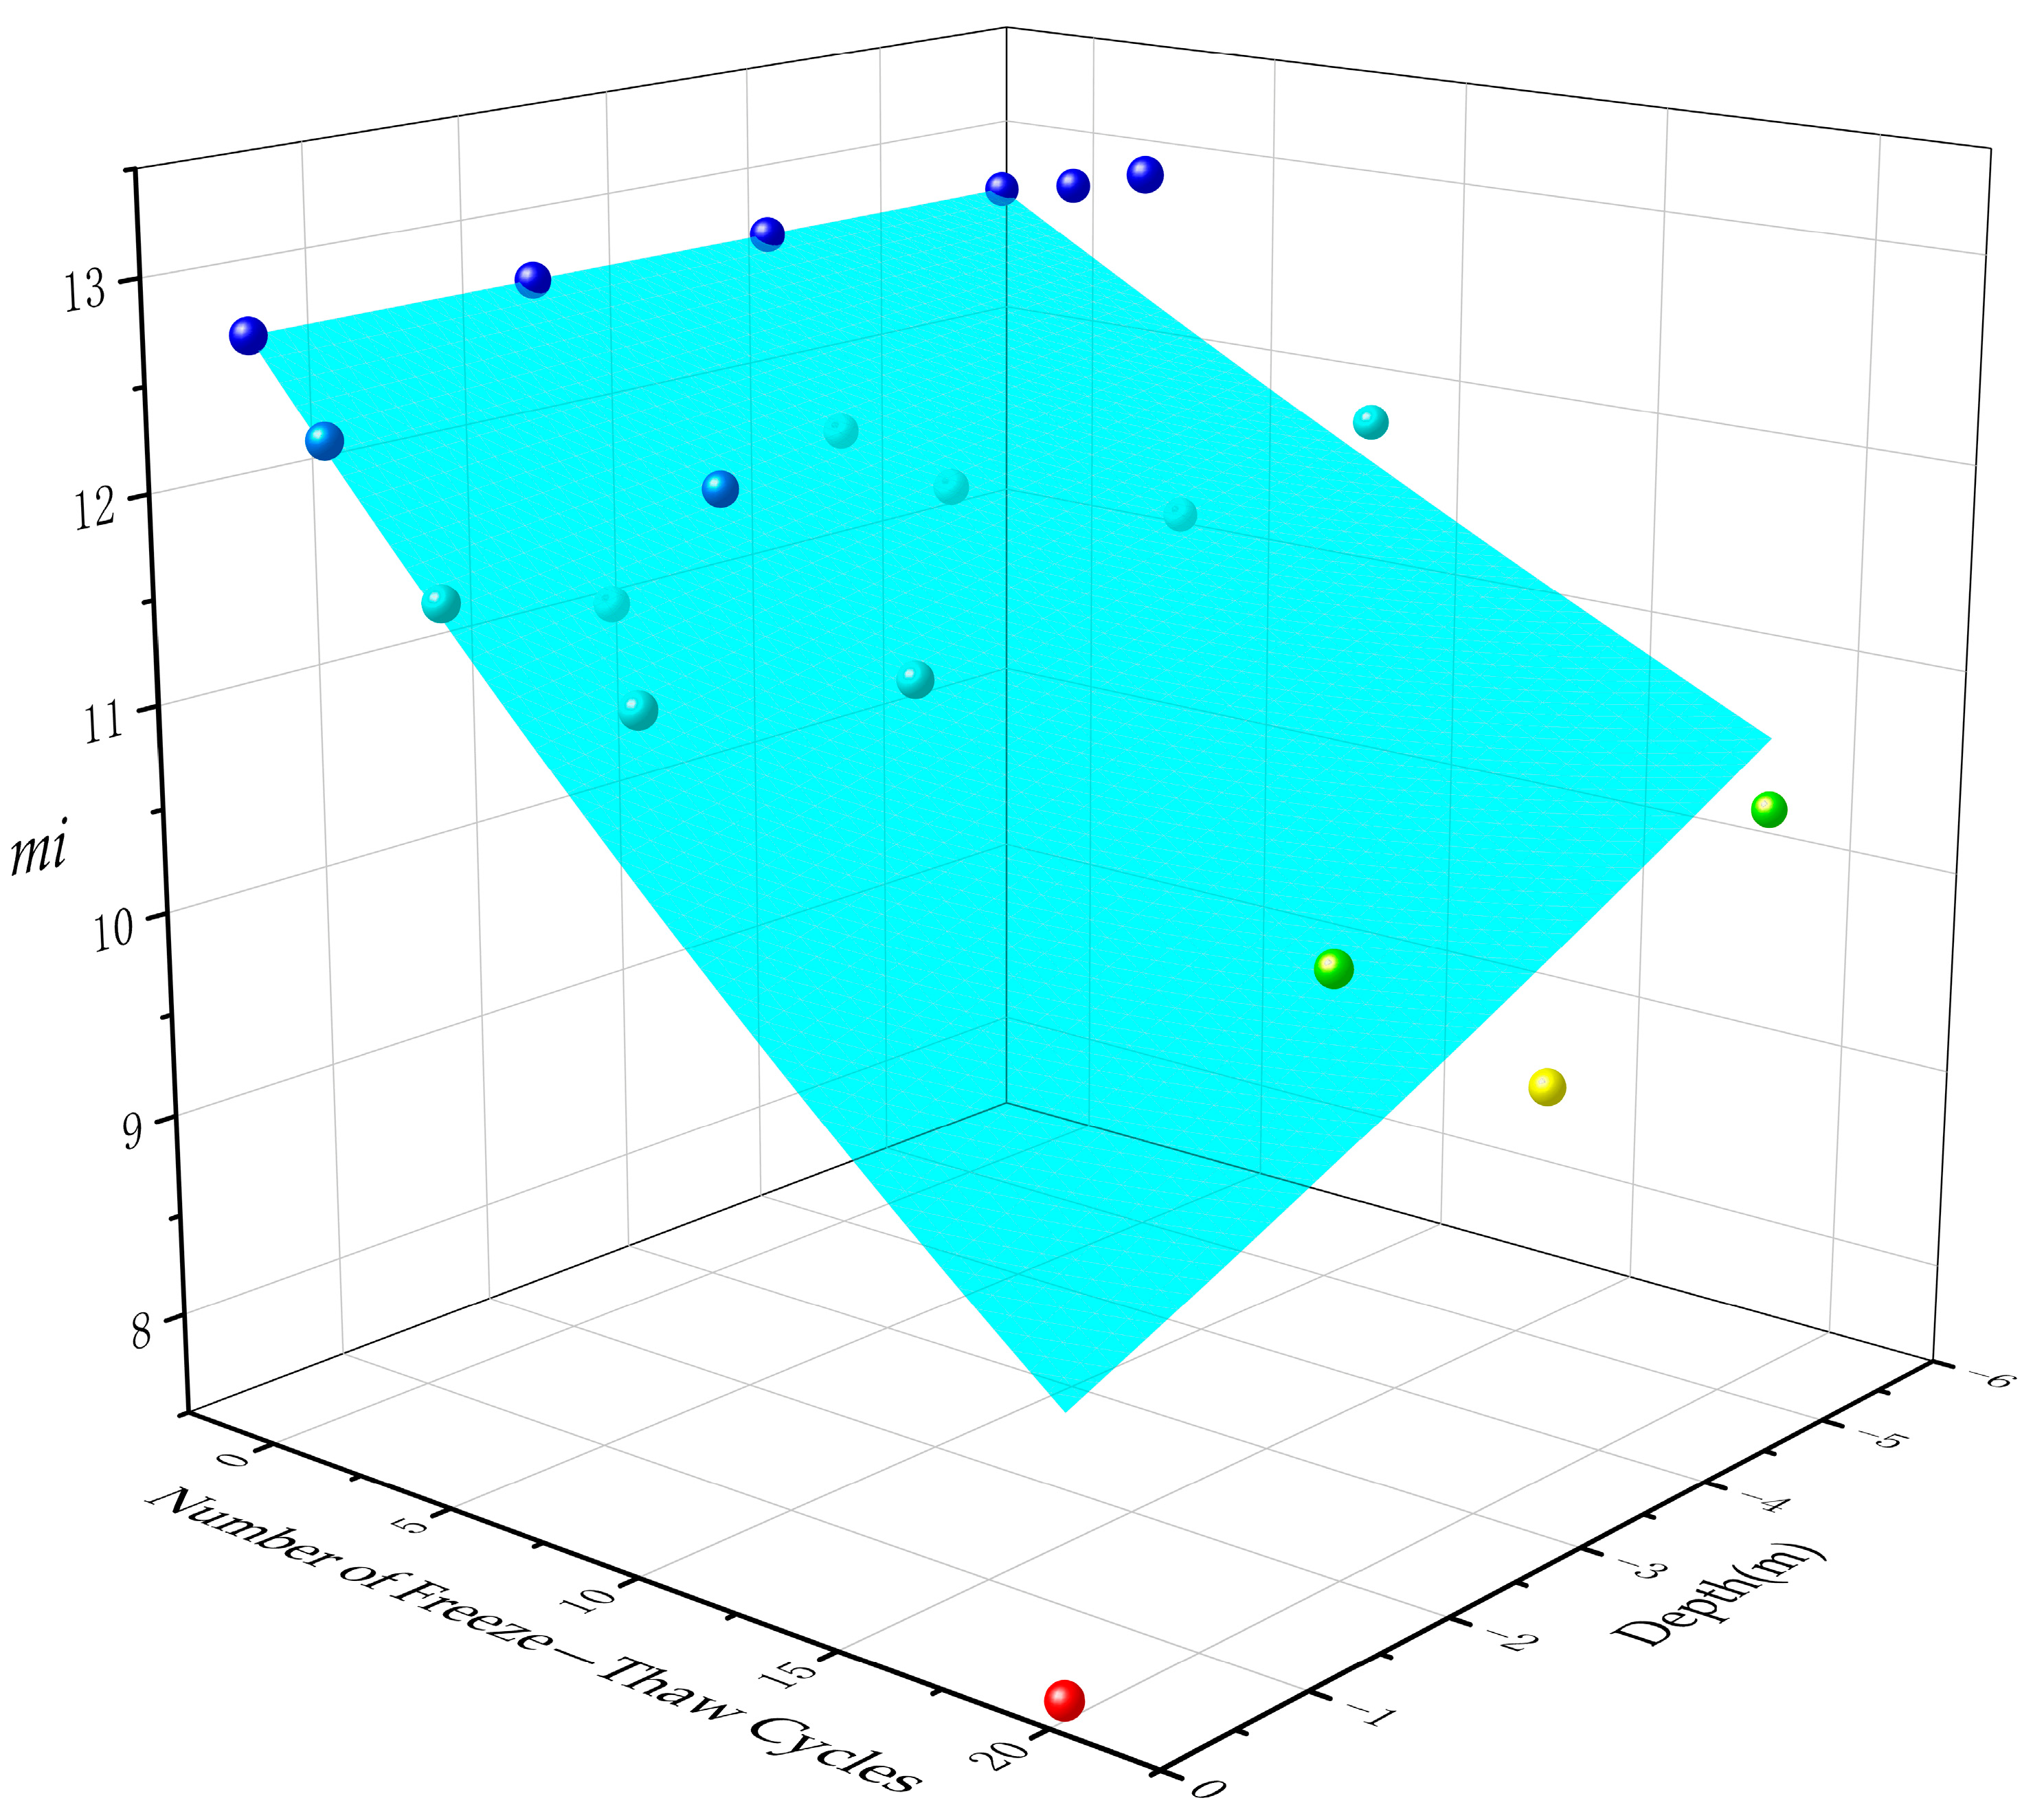
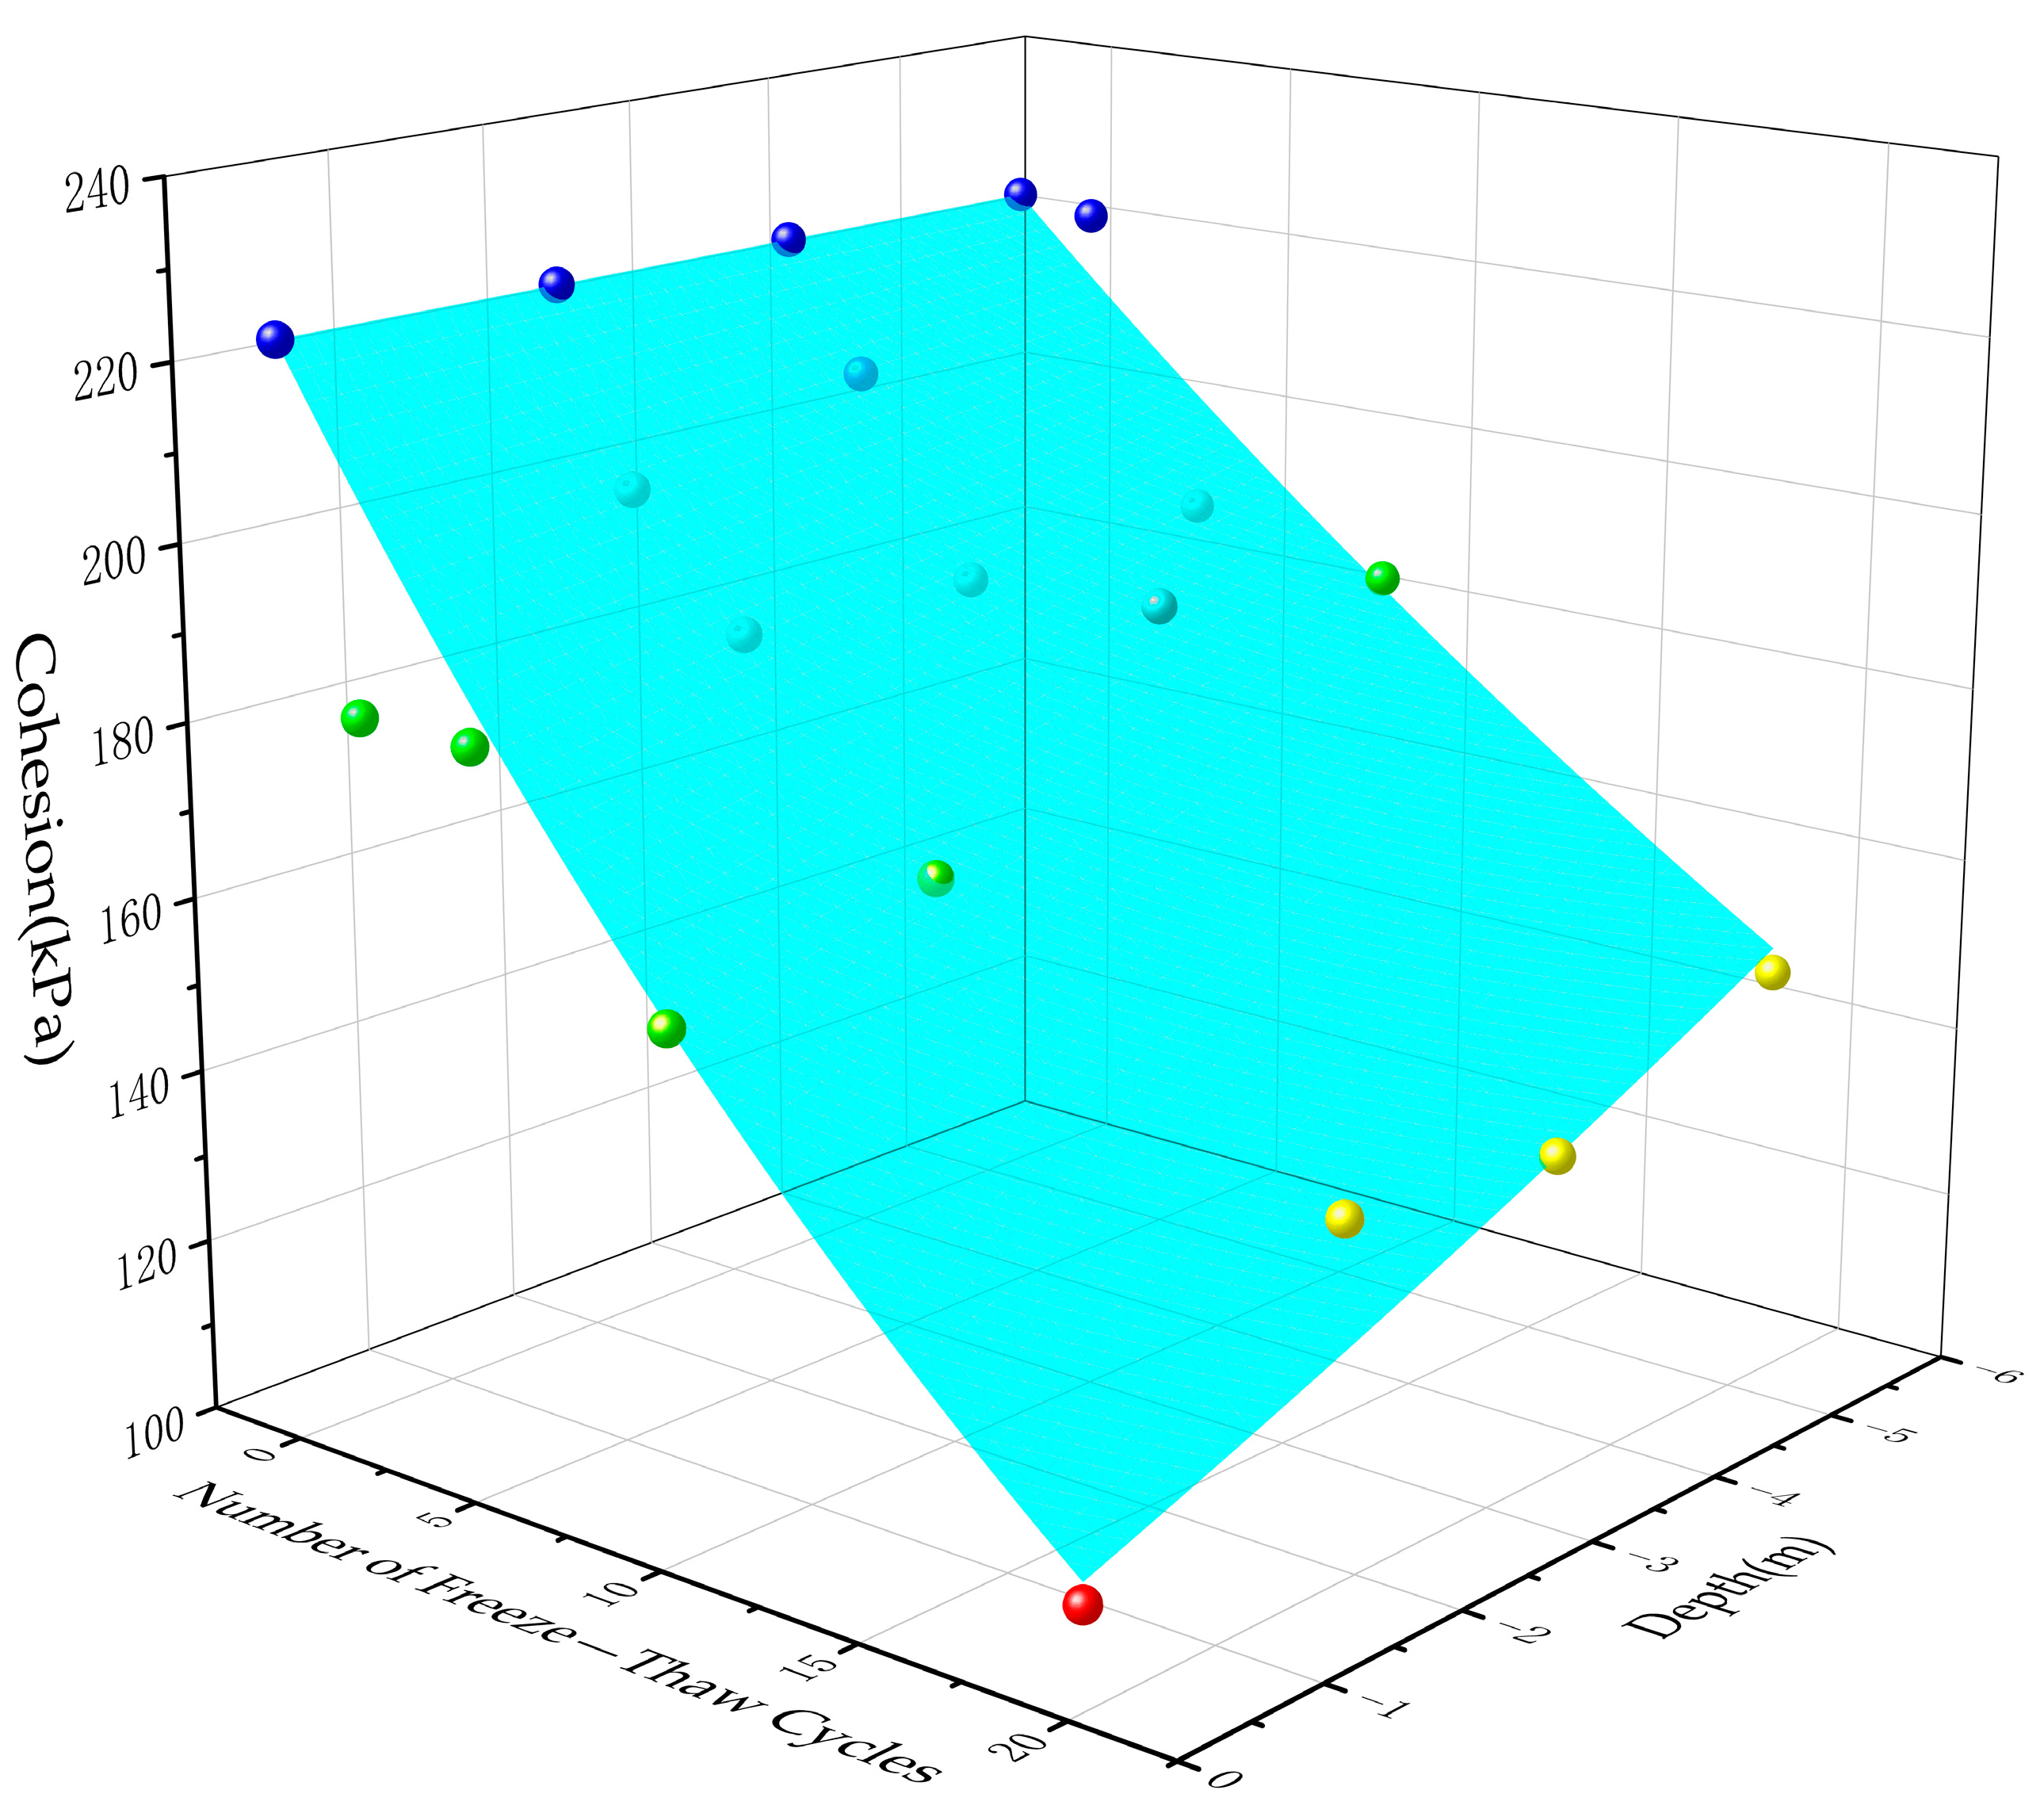
5.2. Quantification of Rock Mass Mechanical Parameters Under Freeze–Thaw Cycles

The mi of the rock can be calculated according to the following equation [23]:
m i = 16 σ t σ c σ c σ t
By substituting the uniaxial compressive strength and indirect tensile strength of the rock after freeze–thaw cycles into Equation (5), the variation in the hardness–softness degree of the rock with burial depth and freeze–thaw cycles can be obtained (Figure 8). Its variation pattern can still be fitted by the following exponential function (fitting coefficient: 0.70):
m i = 12.80 e ( 0.00181 Y 0.0184 ) N
The values of mb, s, a, the rock mass strength σcm, and the ratio of the maximum confining pressure to the uniaxial compressive strength of the rock block (σ3n) are determined by the following equations:
m b = m i exp ( G S I 100 28 14 D )
s = exp ( G S I 100 9 3 D )
α = 1 2 + 1 6 ( e G S I 15 e 20 3 )
σ c m = σ c m b + 4 s a m b 8 s m b 4 + s a 1 2 1 + a 2 + a
σ 3 n = σ 3 m a x σ c
where D is the coefficient representing the disturbance to the rock mass caused by blasting or stress release, taken as 1.0 in this study. The σ 3 n term denotes the ratio of the maximum confining pressure to the uniaxial compressive strength of the rock block. The σ 3 m a x term represents the upper limit of the constrained stress under the relationship between the Hoek–Brown criterion and the Mohr–Coulomb criterion, determined by the following equation:
σ 3 m a x σ c m = 0.72 ( σ c m ρ g H ) 0.91
where ρ is the density of the rock mass (kg/m3), g is the gravitational acceleration, taken as 9.8 m/s2, and H is the slope height (m).
By inserting σ3n into Equations (13) and (14), the internal friction angle and cohesion value of the rock mass can be calculated:
ϕ = s i n 1 [ 6 α m b ( s + m b σ 3 n ) α 1 2 ( 1 + α ) ( 2 + α ) + 6 α m b ( s + m b σ 3 n ) α 1 ]
c = σ c i [ ( 1 + 2 α ) s + ( 1 α ) m b σ 3 n ] ( s + m b σ 3 n ) α 1 ( 1 + α ) ( 2 + α ) 1 + 6 α m b ( s + m b σ 3 n ) α 1 ( 1 + α ) ( 2 + α )
As shown in Figure 9 and Figure 10, the internal friction angle (φ) and cohesion (c) of granite at different burial depths in the 645 m bench of the northern slope of the Wushan Open−pit Mine showed significant decreases with the increase in the number of freeze–thaw cycles and the decrease in burial depth. The decrease in cohesion was more pronounced than that in the internal friction angle. The internal friction angle and cohesion of the rock mass without freeze–thaw cycles were 40.73° and 223.89 kPa, respectively. At a burial depth of 5.27 m, after 20 freeze–thaw cycles, the internal friction angle decreased to 33.25°, and the cohesion decreased to 147.95 kPa, corresponding to reductions of 18.36% and 33.92%, respectively. In contrast, at a burial depth of 0.10 m, after 20 freeze–thaw cycles, the internal friction angle and cohesion reached only 27.77° and 111.64 kPa, with reduction percentages as high as 31.81% and 50.14%, respectively. The degradation patterns of both the internal friction angle and cohesion still followed exponential functions, with a goodness−of−fit R2 of 0.94 and 0.92, respectively (For other rock strength degradation curves with the number of freeze-thaw cycles, please refer to Appendix B).
ϕ = 40.81 e 0.00144 Y 0.01697 N
c = 223.885 e ( 0.0027 Y 0.034 ) N

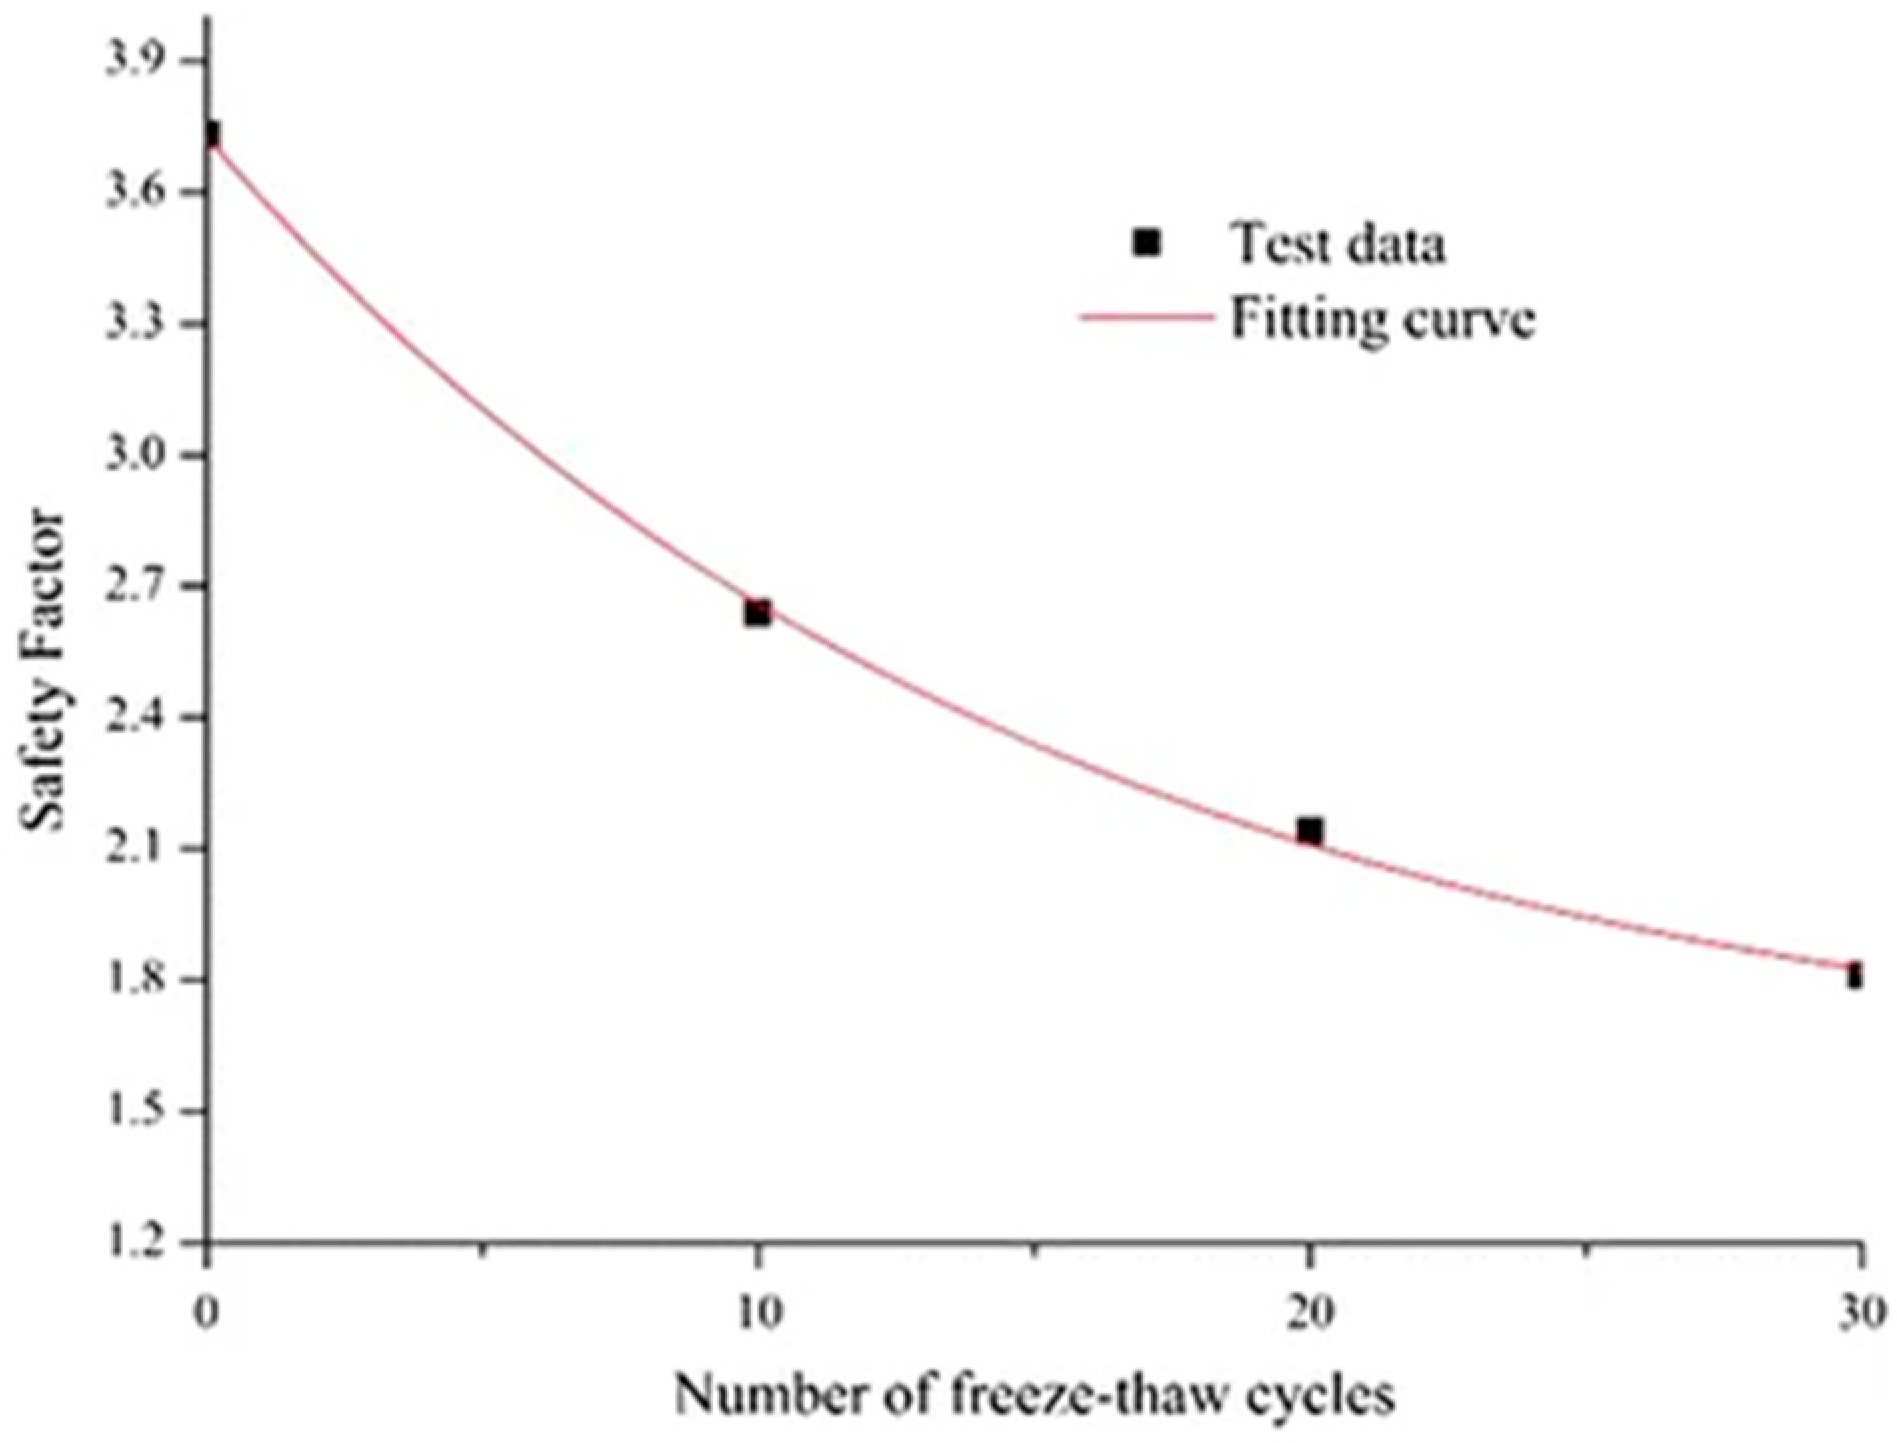
6. Variation in Slope Safety Factor Under Freeze–Thaw Cycles

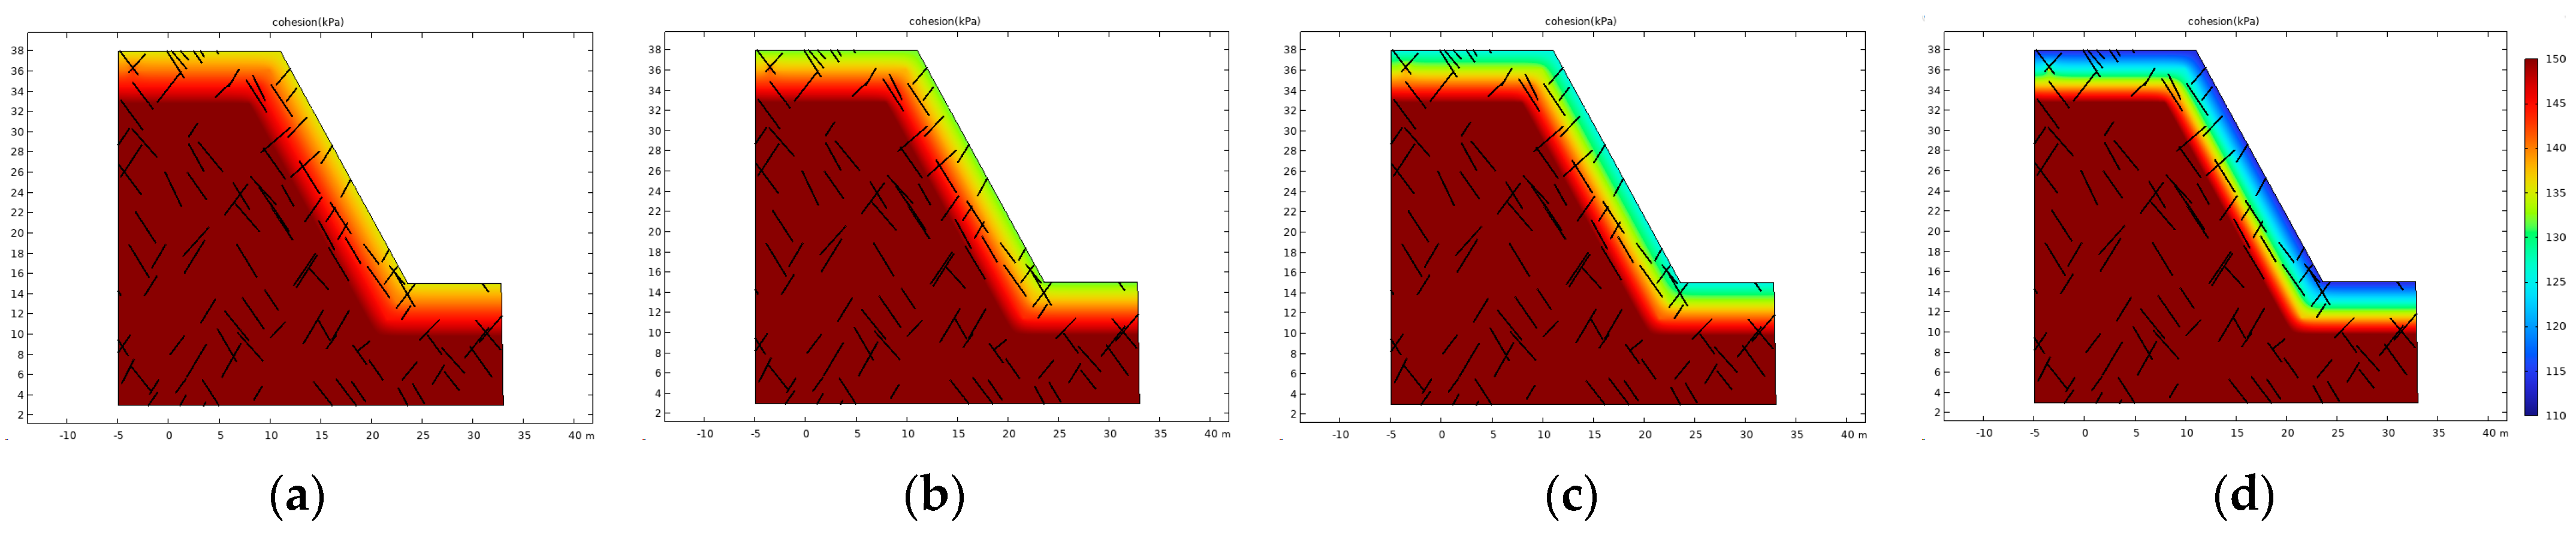
6.1. Variation Pattern of Safety Factor in Slopes with Weak Joints Under Freeze–Thaw Cycles—Jinbao Open−Pit Mine

A COMSOL6.0 numerical model was established based on a typical cross−section of the Jinbao Open−Pit Mine, with a model height of 38 m and bench slope angle of 61°. Displacement constraints perpendicular to boundaries were applied to vertical and lower horizontal boundaries, while only considering gravitational effects of the rock mass.
As shown in Figure 11 and Figure 12, the spatial distributions of internal friction angle and cohesion in the step section under different freeze-thaw cycles reveal that the mechanical parameters (e.g., strength) of surface rock mass within the maximum frozen depth of the slope continuously degrade with increasing number of freeze-thaw cycles (equivalent to excavation exposure time). Due to the higher degradation rate of mechanical parameters in shallow rock layers compared to deeper strata, the stratified characteristics of slope mechanical properties become increasingly prominent as freeze-thaw cycles intensify.
Numerical simulations incorporating the equal−proportional reduction method for cohesion and internal friction angle were conducted to evaluate the safety factor (FOS) and potential slip surfaces of the bench under varying freeze–thaw cycles (Figure 13). The results reveal an inverse correlation between FOS and cycle frequency: the bench exhibits an initial FOS of 2.22 under non−frozen conditions, decreasing to 1.7 after 20 cycles. This degradation process follows the empirical relationship below (goodness−of−fit R2 = 0.97) (To optimize the goodness of fit, an exponential function was adopted for curve fitting in this study.):
F O S = 2.12403 e 0.01339 N + 0.04839

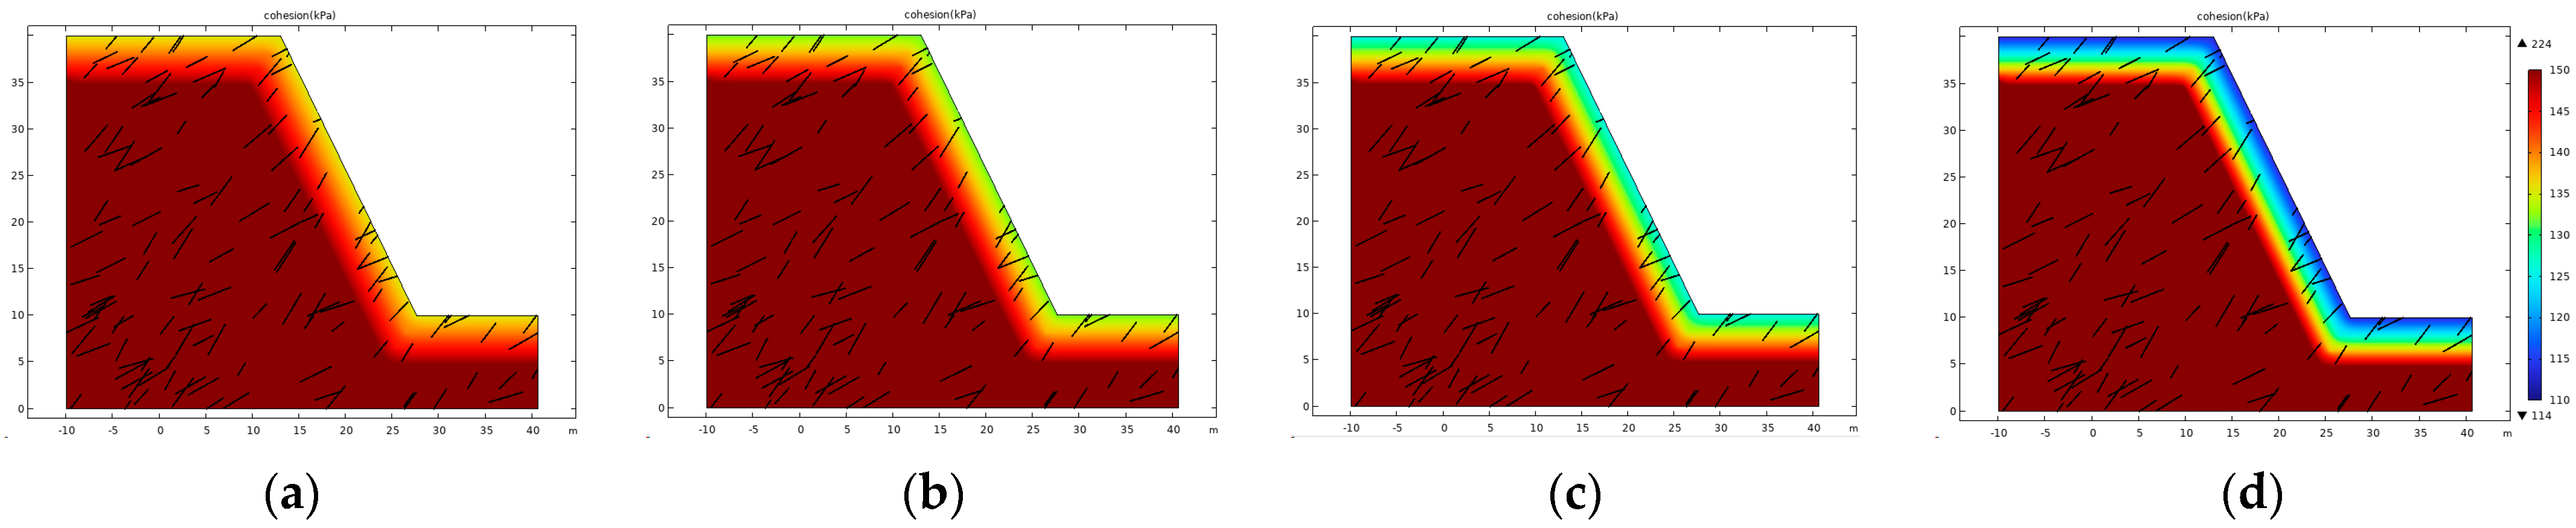
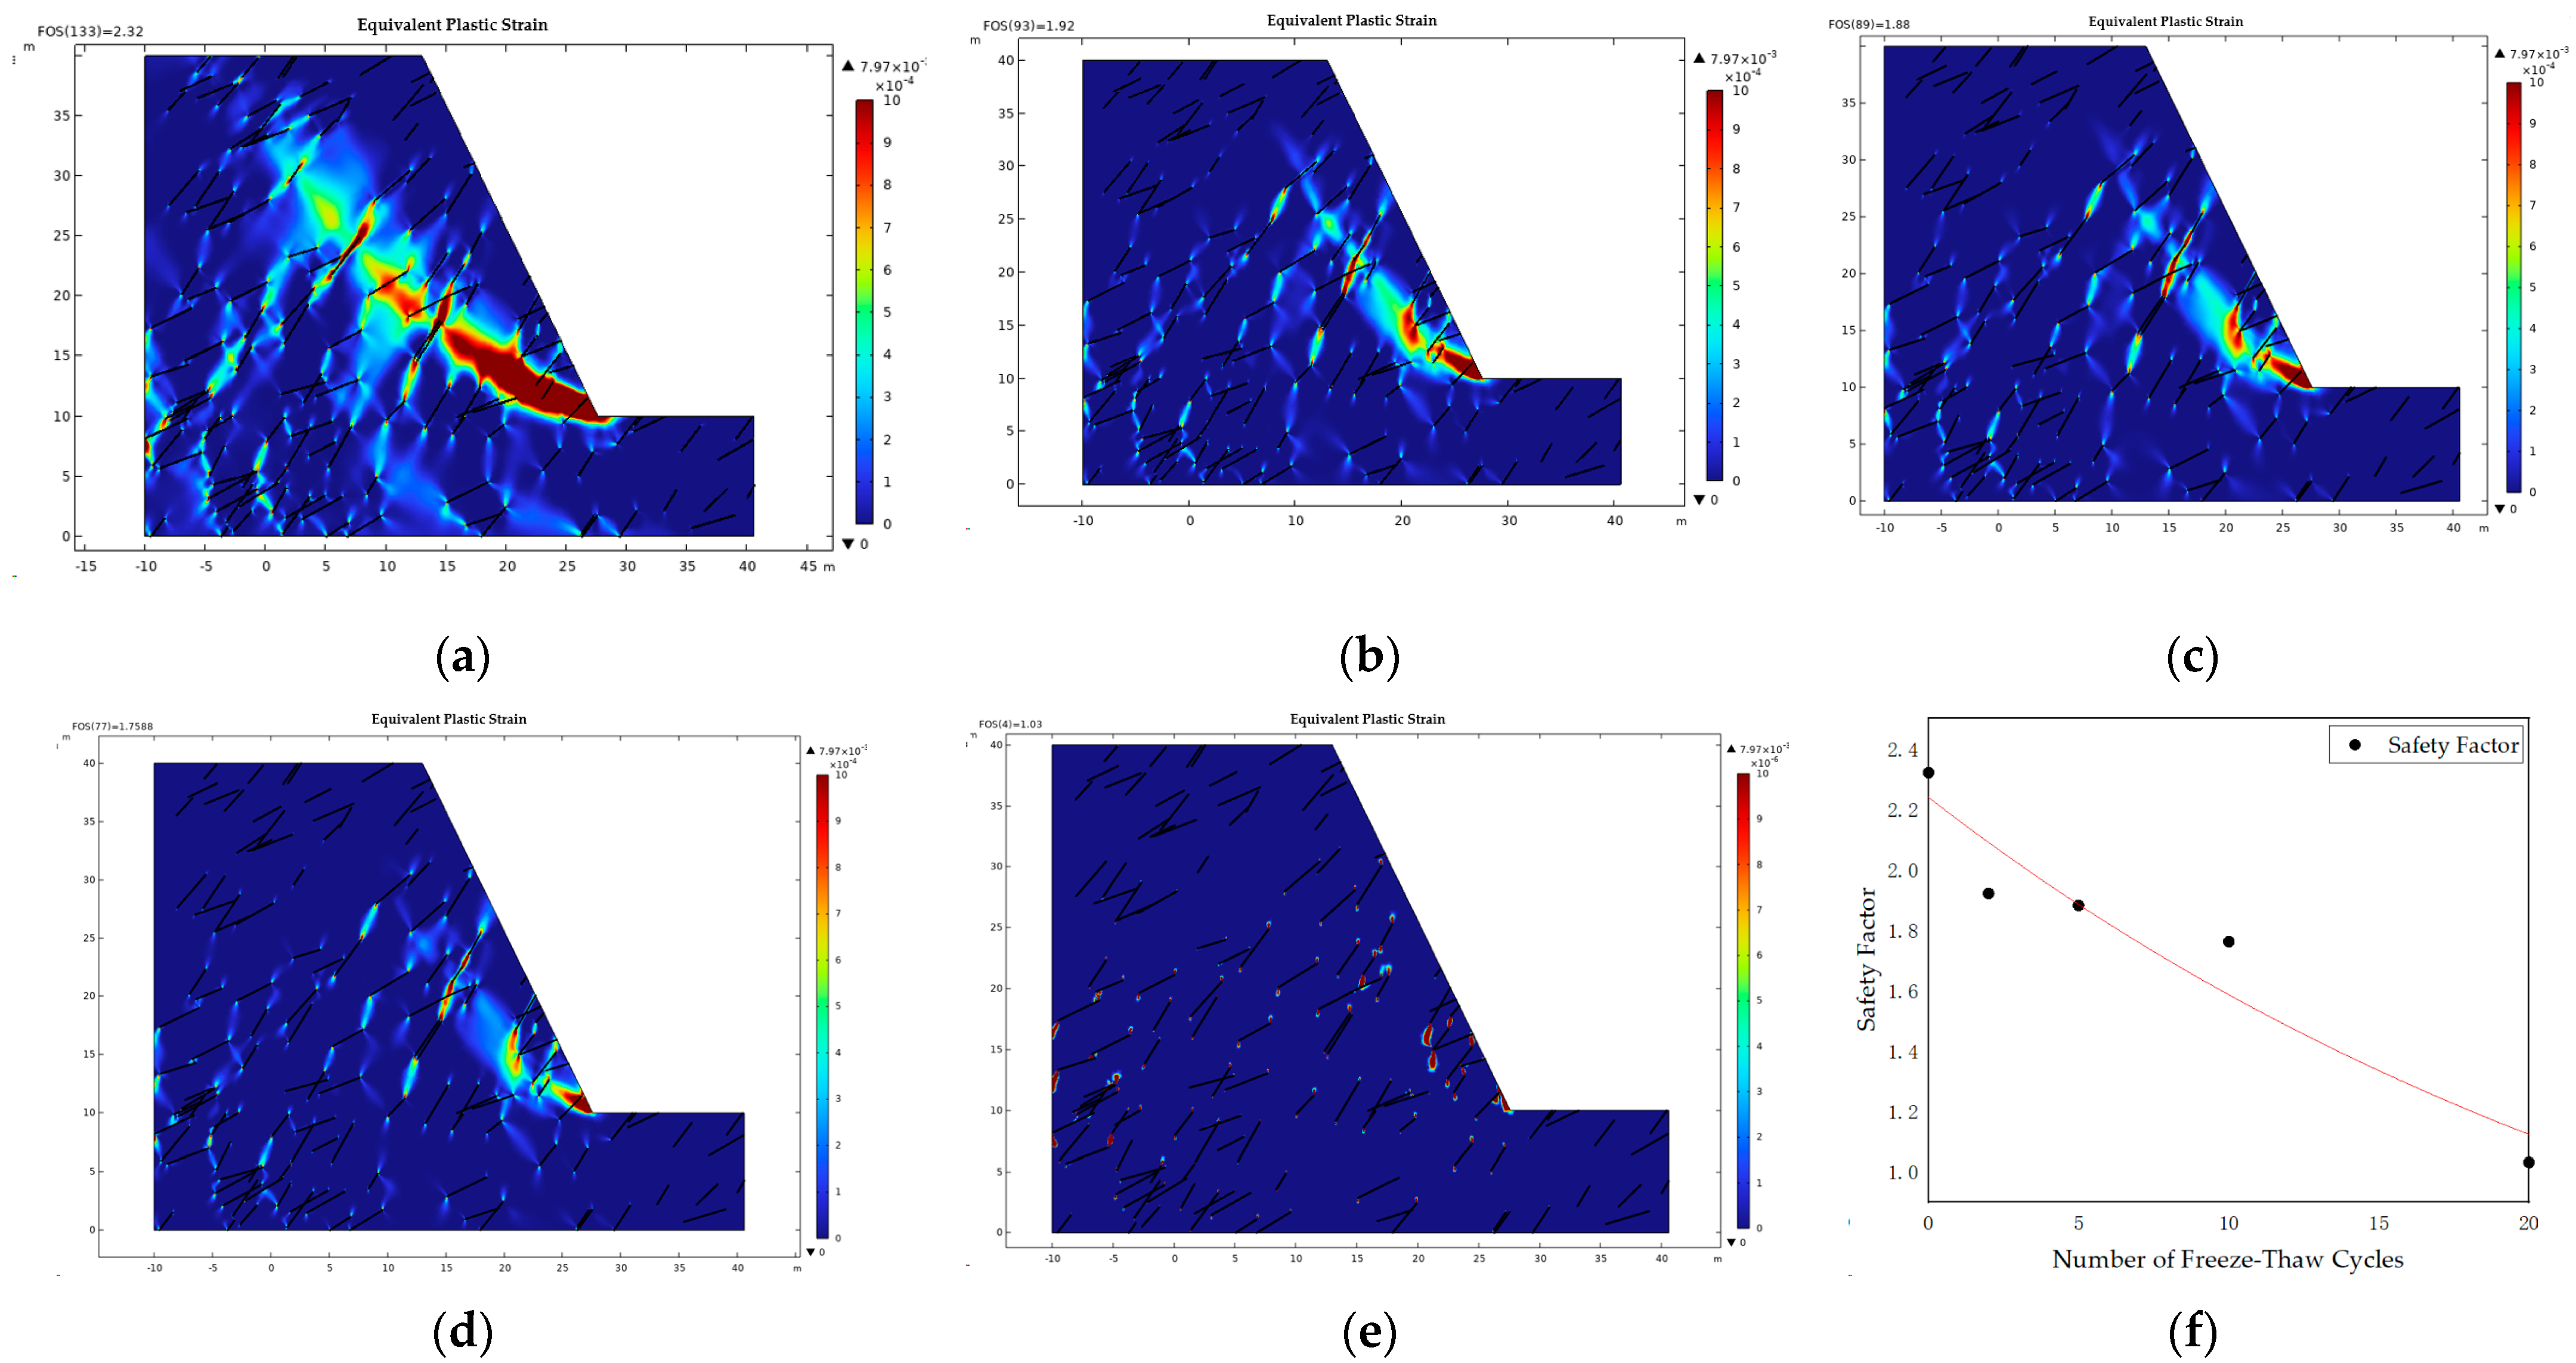
6.2. Variation Pattern of Safety Factor in Slopes with Weak Joints Under Freeze–Thaw Cycles—Wushan Open−Pit Mine

A COMSOL numerical model was established based on the typical cross−section of the 645 m bench in the Wushan Open−Pit Mine. The model has a height of 40 m, featuring a bench slope angle of 65°, a bench height of 30 m, and upper/lower platform widths of 13 m each. Displacement constraints perpendicular to boundaries were applied to vertical and lower horizontal boundaries, with only the gravitational load of the rock mass considered.
Similar to the Jinbao Open-pit Mine, the spatial distributions of internal friction angle and cohesion in stepped profiles under varying freeze-thaw cycles are illustrated in Figure 14 and Figure 15. These results demonstrate that mechanical parameters (e.g., strength) of the surface rock mass within the maximum freeze depth of the slope exhibit progressive degradation with increased freeze-thaw cycles (equivalent to prolonged excavation exposure time).
Numerical simulations incorporating the equal−proportional reduction method for cohesion and internal friction angle were conducted to evaluate the safety factor (FOS) and potential slip surfaces of the bench under varying freeze–thaw cycles (Figure 16). The results reveal an inverse correlation between FOS and cycle frequency: the bench exhibits an initial FOS of 2.32 under non−frozen conditions, decreasing to 1.03 after 20 cycles. This degradation process follows the empirical relationship below (goodness−of−fit R2 = 0.92) (For other safety factor fitted curves, please refer to Appendix A):
F O S = 1.98971 e 0.03456 N + 0.11777
The comparative analysis of the Jinbao and Wushan Open−Pit Mines demonstrates that as the number of freeze–thaw cycles increases, the slope stability shifts from initial control by the bulk strength of the rock mass to progressive dominance by the degradation of latent weak structural planes. This transition reveals the driving mechanism of cumulative damage at structural interfaces under freeze–thaw conditions on the failure modes of rock slopes. Furthermore, detailed numerical simulations from the Wushan Open−Pit Mine indicate that weak structural planes exert a more pronounced influence on the destabilization of slope rock masses.
As shown in Figure 17, with the increase in freeze–thaw cycles, the depth of the potential sliding surface becomes progressively shallower. The average depth of the potential sliding surface under non−freeze–thaw conditions is 12.04 m, while after 20 freeze–thaw cycles, it decreases to 5.14 m. This depth reduction process can be expressed by the following equation (goodness−of−fit R2 = 0.9486):
Y = 12.1476 e 0.0469 N
As shown in Figure 18, with the increase in freeze–thaw cycles, the curvature of the potential sliding surface progressively decreases, indicating geometrical alteration of the failure plane, while simultaneously, the slope angle of the potential sliding surface demonstrates a continuous increase, suggesting the development of a steepening tendency in slip surface morphology.

7. Conclusions

(1) The temperature of rock masses at different burial depths follows a sinusoidal−like variation pattern with seasonal cycling. Shallow rock exhibits higher synchronization with atmospheric temperature, characterized by larger temperature fluctuation amplitudes and faster change rates, while deep rock shows opposite trends. The maximum freezing depth of the slope is approximately 7.5 m.
(2) Both compressive and tensile strengths of rocks show significant declines with increasing freeze–thaw cycles and decreasing burial depth, following negative exponential functions with freeze–thaw cycle count and burial depth as independent variables. The number of freeze–thaw cycles has a much greater impact on uniaxial compressive strength than burial depth (minimum temperature extremes). After 20 freeze–thaw cycles, the reduction percentages of the compressive and tensile strengths for rocks at a 0.10 m depth are 15.39% and 8.65% higher than those at a 5.27 m depth, respectively.
(3) The reduction patterns of the internal friction angle and cohesion in slope rock masses also conform to negative exponential functions with increasing freeze–thaw cycles and decreasing burial depth. Cohesion demonstrates greater reduction than the internal friction angle, with more severe strength deterioration in shallow rock masses. After 20 freeze–thaw cycles, rock masses at a 5.27 m depth show reductions of 18.36% in the internal friction angle and 33.92% in cohesion, while those at a 0.10 m depth exhibit significantly higher reduction percentages of 31.81% and 50.14%, respectively.
(4) Freeze–thaw cycles significantly affect slope stability and sliding surface morphology. With increasing freeze–thaw cycles, slope stability transitions from being governed by the global strength of the rock mass to being progressively dominated by the degradation of latent weak structural planes. This shift highlights the driving mechanism of cumulative damage at structural interfaces under freeze–thaw conditions on the failure modes of rock slopes.

Author Contributions

Conceptualization, P.Z.; Methodology, P.Z.; Validation, N.G. and W.Y.; Formal analysis, W.Y.; Investigation, N.G., W.Y. and J.H.; Resources, P.Z., J.H. and H.L.; Data curation, N.G. and W.Y.; Writing—original draft, W.Y.; Writing—review & editing, P.Z., N.G. and W.Y.; Visualization, N.G. and W.Y.; Supervision, P.Z. and H.L.; Project administration, P.Z., J.H. and H.L.; Funding acquisition, P.Z. All authors have read and agreed to the published version of the manuscript.

Funding

The work presented in this paper is financially supported by the National Key R&D Program of China (Grant No. 2022YFC2903903) and the National Natural Science Foundation of China (Grant No. 52174070).

Data Availability Statement

The raw data supporting the conclusions of this article will be made available by the authors on request.

Conflicts of Interest

Author Jun Hou was employed by Changchun Gold Research Institute Co., Ltd. The remaining authors declare that the research was conducted in the absence of any commercial or financial relationships that could be construed as a potential conflict of interest.

Appendix A

The research by Li [4] et al. demonstrated a decreasing trend in the safety factor with increasing freeze–thaw cycles, as illustrated in Figure A1. These findings align closely with the results of the present study, and the corresponding fitted curve derived from Li’s analysis can be expressed as
F O S = 2020 e N / 15.12 + 1.52
Figure A1. Relationship between the number of freeze–thaw cycles and the safety factor of the slope.
Applsci 15 04853 g0a1

Appendix B

Similarly, the study (Figure A2) of Gao [24] et al. observed a progressive reduction in both the compressive and tensile strength of rock specimens subjected to repeated freeze–thaw actions. This consistent pattern underscores the significant deterioration effect of cumulative freeze–thaw cycles on the mechanical integrity of rock materials.
Figure A2. (a) UCS and its reduction ratio for rock specimens treated with different numbers of freeze–thaw weathering cycles; (b) full compaction stress and its reduction ratio for rock specimens treated with different numbers of freeze–thaw weathering cycles.
Applsci 15 04853 g0a2

References

  1. Matsuoka, N.; Sakai, H. Rockfall activity from an alpine cliff during thawing periods. Geomorphology 1999, 28, 309–328. [Google Scholar] [CrossRef]
  2. Kodama, J.; Goto, T.; Fujii, Y.; Hagan, P. The effects of water content, temperature and loading rate on strength and failure process of frozen rocks. Int. J. Rock Mech. Min. Sci. 2013, 62, 1–13. [Google Scholar] [CrossRef]
  3. Zhang, H.; Meng, X.; Yang, G. A study on mechanical properties and damage model of rock subjected to freeze−thaw cycles and confining pressure. Cold Reg. Sci. Technol. 2020, 174, 103056. [Google Scholar] [CrossRef]
  4. Li, J.; Zhou, K.; Liu, W.; Zhang, Y. Analysis of the effect of freeze–thaw cycles on the degradation of mechanical parameters and slope stability. Bull. Eng. Geol. Environ. 2018, 77, 573–580. [Google Scholar] [CrossRef]
  5. Zhang, H.M.; Yang, G.S. Experimental study on freeze−thaw cycles and tensile characteristics of rocks. J. Xi’an Univ. Sci. Technol. 2012, 32, 691–695. [Google Scholar]
  6. Walbert, C.; Eslami, J.; Beaucour, A.L.; Bourges, A.; Noumowe, A. Evolution of the mechanical behaviour of limestone subjected to freeze–thaw cycles. Environ. Earth Sci. 2015, 74, 6339–6351. [Google Scholar] [CrossRef]
  7. Bayram, F. Predicting mechanical strength loss of natural stones after freeze–thaw in cold regions. Cold Reg. Sci. Technol. 2012, 83, 98–102. [Google Scholar] [CrossRef]
  8. Zhang, J.; Deng, H.; Taheri, A.; Ke, B.; Liu, C.; Yang, X. Degradation of physical and mechanical properties of sandstone subjected to freeze−thaw cycles and chemical erosion. Cold Reg. Sci. Technol. 2018, 155, 37–46. [Google Scholar] [CrossRef]
  9. Ren, J.X.; Zhang, L.; Zhang, K. Macro−meso experimental study on triaxial compression failure characteristics of freeze−thaw fractured sandstone. Sci. Technol. Eng. 2023, 23, 7056–7063. [Google Scholar]
  10. Yu, J.; Chen, X.; Li, H.; Zhou, J.W.; Cai, Y.Y. Effect of freeze−thaw cycles on mechanical properties and permeability of red sandstone under triaxial compression. J. Mt. Sci. 2015, 12, 218–231. [Google Scholar] [CrossRef]
  11. Yu, J.; Fu, G.F.; Chen, X.; Guo, X. Experimental study on mechanical properties of sandstone under triaxial unloading confining pressure after freeze−thaw cycles. Chin. J. Rock Mech. Eng. 2015, 34, 2001–2009. [Google Scholar]
  12. Chen, G.Q.; Guo, F.; Wang, J.C.; Zhou, Y.X. Experimental study on triaxial creep characteristics of quartz sandstone after freeze−thaw cycles. Rock Soil Mech. 2017, 38, 203–210. [Google Scholar]
  13. Gao, F.; Cao, S.; Zhou, K.; Lin, Y.; Zhu, L. Damage characteristics and energy−dissipation mechanism of frozen–thawed sandstone subjected to loading. Cold Reg. Sci. Technol. 2020, 169, 102920. [Google Scholar] [CrossRef]
  14. Wang, Y.; Gao, S.H.; Li, C.H.; Han, J.Q. Energy dissipation and damage evolution for dynamic fracture of marble subjected to freeze−thaw and multiple level compressive fatigue loading. Int. J. Fatigue 2021, 142, 105927. [Google Scholar] [CrossRef]
  15. Wen, L.; Li, X.B.; Su, W. Study on physico−mechanical properties of hard rocks in metal mine slopes under freeze−thaw cycles. J. Min. Saf. Eng. 2015, 32, 689–696. [Google Scholar]
  16. Zhang, Y.; Huang, R.; Zhao, L.; Fu, R.; Pei, X. Study on TSMR system for rock mass quality evaluation of Tianshan highway slopes. Chin. J. Rock Mech. Eng. 2010, 29, 617–623. [Google Scholar]
  17. Tan, H.H.; Li, B.; Li, J.X.; Yuan, W.; Li, Z.H. Stability analysis of dolomite slopes under freeze−thaw cycles. Sci. Technol. Eng. 2020, 20, 13825–13832. [Google Scholar]
  18. Xiao, Y.G. Study on Mining−Induced Response and Multi−Field Coupled Time−Dependent Disaster Process of High−Altitude Slope Rock Mass. Doctoral dissertation, University of Science and Technology Beijing, Beijing, China, 2021.
  19. Zerradi, Y.; Souissi, M.; Larabi, A. Application of the deterministic block theory to the slope stability design of an open−pit mine in Morocco. Min. Miner. Depos. 2023, 17, 53–60. [Google Scholar] [CrossRef]
  20. Sdvyzhkova, O.; Moldabayev, S.; Babets, D.; Başçetin, A.; Asylkhanova, G.; Nurmanova, A.; Prykhodko, V. Numerical modelling of the pit wall stability while optimizing its boundaries to ensure the ore mining completeness. Min. Miner. Depos. 2024, 18, 1–10. [Google Scholar] [CrossRef]
  21. Russo, G. A new rational method for calculating the GSI. Tunn. Undergr. Space Technol. 2009, 24, 103–111. [Google Scholar] [CrossRef]
  22. Hoek, E.; Brown, E.T. The Hoek–Brown failure criterion and GSI–2018 edition. J. Rock Mech. Geotech. Eng. 2019, 11, 445–463. [Google Scholar] [CrossRef]
  23. Sonmez, H.; Ulusay, R. Modifications to the geological strength index (GSI) and their applicability to stability of slopes. Int. J. Rock Mech. Min. 1999, 36, 743–760. [Google Scholar] [CrossRef]
  24. Gao, F.; Xiong, X.; Xu, C.; Zhou, K. Mechanical property deterioration characteristics and a new constitutive model for rocks subjected to freeze−thaw weathering process. Int. J. Rock Mech. Min. Sci. 2021, 140, 104642. [Google Scholar] [CrossRef]
Figure 1. Technical roadmap diagram.
Applsci 15 04853 g001
Figure 2. Landslide in the Wushan Open−Pit Mine slope: (a) 645 m platform schematic; (b) western slope wedge; (c) southern slope landslide.
Applsci 15 04853 g002aApplsci 15 04853 g002b
Figure 3. Internal temperature variation process of the Wushan Open−Pit Mine slope: (a) temperture changes at different depths over time; (b) depth−dependent variation in temperature range.
Applsci 15 04853 g003
Figure 4. Granite specimens after cutting and polishing: (a) uniaxial compression specimens; (b) Brazilian discs.
Applsci 15 04853 g004
Figure 5. Compressive strength in rocks at different burial depths under freeze–thaw cycling.
Applsci 15 04853 g005
Figure 6. Tensile strength in rocks at different burial depths under freeze–thaw cycling.
Applsci 15 04853 g006
Figure 7. Identification of step−like structural features at a depth of 645 m (bench height). The green areas represent transverse cracks, while the red areas correspond to longitudinal cracks.
Applsci 15 04853 g007
Figure 8. The variation in rock hardness and softness with the number of freeze–thaw cycles (mi—a key parameter in the Hoek–Brown strength criterion).
Applsci 15 04853 g008
Figure 9. The variation in the internal friction angle of the rock mass with burial depth and the number of freeze–thaw cycles.
Applsci 15 04853 g009
Figure 10. The variation in the cohesion of the rock mass with burial depth and the number of freeze–thaw cycles.
Applsci 15 04853 g010
Figure 11. Spatial distribution of internal friction angle in slope rock mass of Jinbao Open−Pit Mine under freeze–thaw cycles: (a) 2 freeze–thaw cycles; (b) 5 freeze–thaw cycles; (c) 10 freeze–thaw cycles; (d) 20 freeze–thaw cycles.
Applsci 15 04853 g011
Figure 12. Spatial distribution of cohesion in slope rock mass of Jinbao Open−Pit Mine under freeze–thaw cycles: (a) 2 freeze–thaw cycles; (b) 5 freeze–thaw cycles; (c) 10 freeze–thaw cycles; (d) 20 freeze–thaw cycles.
Applsci 15 04853 g012
Figure 13. Plastic strain distribution and safety factor of Jinbao Open−Pit Mine under different numbers of freeze–thaw cycles: (a) 0 freeze–thaw cycles; (b) 2 freeze–thaw cycles; (c) 5 freeze–thaw cycles; (d) 10 freeze–thaw cycles; (e) 20 freeze–thaw cycles; (f) variation patterns of safety factor (FOS) with freeze–thaw cycle counts.
Applsci 15 04853 g013
Figure 14. Spatial distribution of internal friction angle in slope rock mass of Wushan Open−Pit Mine under freeze–thaw cycles: (a) 2 freeze–thaw cycles; (b) 5 freeze–thaw cycles; (c) 10 freeze–thaw cycles; (d) 20 freeze–thaw cycles.
Applsci 15 04853 g014
Figure 15. Spatial distribution of cohesion in slope rock mass of Wushan Open−Pit Mine under freeze–thaw cycles: (a) 2 freeze–thaw cycles; (b) 5 freeze–thaw cycles; (c) 10 freeze–thaw cycles; (d) 20 freeze–thaw cycles.
Applsci 15 04853 g015
Figure 16. Plastic strain distribution and safety factor of Wushan Open−Pit Mine under different numbers of freeze–thaw cycles: (a) 0 freeze–thaw cycles; (b) 2 freeze–thaw cycles; (c) 5 freeze–thaw cycles; (d) 10 freeze–thaw cycles; (e) 20 freeze–thaw cycles; (f) variation patterns of safety factor (FoS) with freeze–thaw cycle counts.
Applsci 15 04853 g016
Figure 17. Variation in sliding surface depth with the number of freeze–thaw cycles.
Applsci 15 04853 g017
Figure 18. Variation in the curvature and slope of the sliding surface with the number of freeze–thaw cycles.
Applsci 15 04853 g018
Table 1. Experimental scheme.
No.Freeze–Thaw Temperature (°C)Corresponding Burial Depth (m)Freeze–Thaw CyclesNo. of Specimens
Uniaxial CompressionBrazilian Splitting
1−2~70.100, 2, 5, 10, 2055
2−5~101.8855
3−10~143.5055
4−20~225.2755
Disclaimer/Publisher’s Note: The statements, opinions and data contained in all publications are solely those of the individual author(s) and contributor(s) and not of MDPI and/or the editor(s). MDPI and/or the editor(s) disclaim responsibility for any injury to people or property resulting from any ideas, methods, instructions or products referred to in the content.

