Article

Stabilized Sewage Sludge as Fertilizer: Risks Related to the Presence of Microplastics

1
Faculty of Energy and Fuels, AGH University of Krakow, 30-059 Kraków, Poland
2
Faculty of Physics and Applied Computer Science, AGH University of Krakow, 30-059 Kraków, Poland
*
Author to whom correspondence should be addressed.
Appl. Sci. 2025, 15(13), 7420; https://doi.org/10.3390/app15137420
Submission received: 21 May 2025 / Revised: 29 June 2025 / Accepted: 29 June 2025 / Published: 2 July 2025

Abstract

Microplastics are an increasingly concerning environmental pollutant. Their presence in agricultural settings is particularly troubling due to their persistence and potential to infiltrate soil, groundwater, and the food chain. This study focused on analyzing fertilizer derived from stabilized sewage sludge collected in June and July. The average mass of microplastics isolated per 100 g of fertilizer was 461.28 mg in June and 458.92 mg in July. The analysis revealed a substantial quantity of microplastics, with fragments and fibers being the predominant forms. In the June samples, an average of 860 microplastic particles was detected, compared to 734 in July (507 fragments and 227 fibers). The most common particle sizes in June ranged from 1500 to 2000 µm and 2000 to 2500 µm, with a significant proportion also exceeding 4000 µm. In July, particles larger than 4000 µm were the most prevalent. Qualitative analysis using Raman microscopy identified polyethylene—a widely used, inexpensive, and chemically stable polymer—as one of the main types of plastic present.

1. Introduction

Microplastics are plastic particles no larger than 5 mm. Scientists classify them based on various criteria, such as size (nanoplastics, sub-microplastics, small microplastics, large microplastics), color (transparent, white, black, colored), shape (fragments, spheres, fibers, pellets, films, foams), and source—meaning the type of plastic from which they are made [1]. The primary sources of microplastics include hygiene products, tire and road marking abrasion, synthetic washing materials, and improper waste management [2].
Scientists have warned about the presence of microplastics in every ecosystem—and even in the human body [3]. Studies in rodents have demonstrated that inhalation of polypropylene dust, even at low concentrations, induces inflammation and respiratory disorders [4]. Research on the health effects of micro- and nanoplastics (MNPs) is challenged by the lack of standardization in exposure doses and forms. Many studies employ varying concentrations and measurement units, which complicates risk assessment. Most research focuses on spherical polystyrene particles, which represent only a small fraction of environmental microplastics [5].
In reality, micro- and nanoplastics come in diverse shapes (e.g., fibers, sheets) and have different physicochemical properties that may influence their toxicity. Additionally, particles used in studies are often surface-modified or contain solvents and dyes that can have toxic effects, potentially skewing results [5].
While there is evidence of cytotoxicity and genotoxicity from microplastics, including oxidative stress and DNA damage, further studies using more representative samples are necessary to accurately determine their impact on human health [5].
Moreover, experiments on the effects of polyethylene present in agricultural mulch on Lumbricus terrestris (Oligochaeta, Lumbricidae) showed increased mortality in these organisms and a significant reduction in their growth rate [6].
Studies have also examined the effects of polypropylene micro- and nanoplastics on soil microbiota [7]. The results showed that polypropylene particles decreased bacterial diversity, with particle size exerting a more decisive influence than concentration. Nanoplastics reduced the complexity and connectivity of both bacterial and fungal networks, with bacteria exhibiting greater sensitivity to plastic-induced stress than fungi. A shift was observed in the dominant ecological processes governing bacterial communities, from stochastic drift to deterministic selection. Nanoplastics disrupted interactions within the microbial community, as well as those between soil, microorganisms, and plants. These findings suggest that polypropylene nanoplastics represent a significant ecological threat to soil microbiota and their interactions with vegetation [7].
Fluorescent polystyrene microbeads (0.2 μm) were observed to accumulate in the root cap mucus of lettuce, appearing as a visible dark green tip. Confocal imaging revealed that the beads traversed the apoplastic pathway into the vascular system, ultimately reaching the stems and leaves via transpiration flow. In root and stem tissues, they formed grape-like clusters, while in leaves, they were more dispersed. This study provides clear evidence that submicrometer microplastics can be taken up, transported, and accumulated in edible plant tissues, highlighting a potential route of human exposure through contaminated crops [8].
Physical, chemical, and biological processes drive the degradation of polymers in soil. Mechanical forces, such as soil movement and organism activity, cause the fragmentation of larger particles. Chemical reactions, including oxidation and exposure to UV light, break down polymer chains. Additionally, soil microorganisms can biologically degrade certain plastics through enzymatic activity. Together, these processes fragment polymers into smaller micro- and nanoplastics, increasing their environmental impact [9].
Due to their physicochemical properties—such as hydrophobicity, structure, polarity, and interactions with the environment—microplastics can serve as carriers for chemical pollutants and pathogens, thereby increasing their potential risks to both health and ecosystems [10]. Therefore, it is essential to conduct detailed research on the presence of microplastics in the environment and take measures to reduce plastic usage.
Special attention should be given to products that may contain microplastics, thus serving as a source of these pollutants in the environment. One such example is fertilizers produced from sewage sludge. Current analyses of these products primarily focus on detecting parasite eggs, bacteria, and heavy metals as well as assessing the levels of elements essential for agriculture, such as nitrogen, phosphorus, magnesium, and calcium [11]. However, they do not include research on other potentially harmful pollutants, including microplastics.
Studies have shown that compost-based fertilizers contain microplastics, with concentrations ranging from 146 to 12 particles per kilogram of dry matter [12]. Additionally, significant amounts of microplastics were detected in recycled activated sludge, with a concentration of 113 ± 57 microplastics per gram of dry sludge. This suggests that approximately 3.4 billion microplastic particles may accumulate in the 30 tons of sludge produced daily by wastewater treatment plants [13].
These results underscore the need for more detailed analyses of sewage sludge for detecting microplastics and implementing measures to mitigate their potential transfer to the environment through effective treatment and waste management practices. Further research is needed to assess the impact of microplastics on human health and ecosystems and develop effective strategies for their removal from the environmental cycle.
Currently, there is increasing regulatory attention devoted to microplastics due to their environmental and health risks. The European Union, for example, has introduced regulations aimed at reducing microplastic pollution, including restrictions on the intentional addition of microplastics in products and guidelines for waste management. However, specific regulations addressing the presence of microplastics in fertilizers, especially those derived from sewage sludge, remain limited or underdeveloped at both the European Union (EU) and global levels. This regulatory gap underscores the importance of investigating microplastic contamination in sludge-derived fertilizers to inform future policy decisions.
This study aimed to demonstrate the presence of significant amounts of microplastics in fertilizers derived from sewage sludge and to evaluate their potential for re-emission into the environment, which could lead to secondary pollution and further adverse ecological effects. The study hypothesizes that fertilizers contain a variety of microplastic types, primarily originating from synthetic textiles and other polymer sources. It also examines the potential ecological risks associated with these microplastics, including the contamination of soil and water systems. Furthermore, this research addresses a gap in current knowledge regarding the behavior and fate of microplastics in sludge-derived fertilizers, which has been insufficiently studied in previous works.

2. Materials and Methods

2.1. Materials

The material for the study consisted of fertilizer samples produced from stabilized sewage sludge (SSS). The stabilized sewage sludge used had previously been analyzed for microplastics [14].
Stabilized sewage sludge samples were collected in June and July 2021 from a wastewater treatment plant located in southern Poland, serving approximately 62,000 inhabitants. These months represent the summer period characterized by stable operational conditions at the treatment plant and typical influent composition. They were selected to minimize seasonal variability and provide a consistent basis for evaluating microplastic content. The influent is primarily domestic wastewater, with typical variations in organic load and flow rate. Additionally, sewage sludge from these months has been previously analyzed for comparison purposes. This information helps to better understand the representativeness and variability of the sludge samples used in the study. Four subsamples (approx. 1.5 kg each) were taken over 12 h and combined into a single composite sample. The sludge was analyzed by an accredited laboratory (No. AB 213) according to the Polish standard [1]. No viable eggs of intestinal parasites or Salmonella bacteria were detected. The collected sludge, derived from methane fermentation and dewatered using screw presses, was then processed into fertilizer according to Polish patent No. Pat 233754, dated 7 October 2019 [15]. From each batch, 4 kg of material was weighed and transformed into a high-quality fertilizer product.
To the mixture, dolomitic flour was added to absorb moisture, alkalize the soil, and enrich the fertilizer with calcium and magnesium. Additionally, hydrated lime was included to ensure proper hygienization, and cellulose fiber was added to improve the physical durability of the pellets. The percentage composition of the individual components was as follows: sewage sludge (74%), dolomitic flour (20%), hydrated lime (5%), and microcellulose (1%).
All ingredients were thoroughly mixed in a counter-current dynamic mixer, then directed to a disc pelletizer, where the fertilizer particles were formed and solidified. The final pellets were dried at ambient temperature (approximately 25 °C) for about three weeks before further analysis.
To ensure consistency and accuracy in the microplastic content analysis, all fertilizer samples were initially subjected to freeze-drying (lyophilization). This process aimed to remove residual moisture and obtain a constant dry mass, which is critical for subsequent mass-based quantification of microplastic content. Samples were frozen and maintained under vacuum at –50 °C for seven consecutive days until a stable mass was achieved. The lyophilization was conducted using a laboratory-grade freeze-dryer (e.g., Labconco FreeZone or equivalent), with pre-cleaned, inert sample containers to minimize external contamination.

2.2. Separation and Digestion of Organic Matter

Following lyophilization, 5.00 g (±0.01 g) of homogenized fertilizer sample was weighed and transferred into sterile glass beakers. To each sample, 100 cm3 of 10% hydrogen peroxide (H2O2) solution was added to oxidatively digest organic matter and disrupt the compacted pellet structure commonly formed in sewage sludge-based fertilizers. The oxidation process was carried out in a horizontal shaker at 140 rpm for 48 h at room temperature (21 ± 1 °C), in covered containers to prevent atmospheric contamination. After digestion, the mixtures were allowed to settle undisturbed for 4 h, enabling the initial phase of physical separation. The resulting suspension was then carefully decanted, rinsed with deionized water (resistivity ≥ 18 MΩ·cm), and air-dried in a clean laboratory environment.

2.2.1. Density Separation

For microplastic isolation, the dried residue was mixed with a saturated calcium chloride (CaCl2) solution (density ~1.6 g/cm3), pre-cooled to room temperature. This density separation step utilized the buoyancy of the most common microplastic polymers, such as polyethylene and polypropylene, in the high-density salt solution. The samples were shaken gently at 140 rpm for 2 h to facilitate the release and suspension of lighter plastic particles. After mixing, the suspensions were left to stand undisturbed for 24 h. The supernatant layer, which potentially contained floating microplastic particles, was carefully decanted and filtered using a pre-weighed, cellulose nitrate membrane filter (pore size: 0.45 µm). All samples were thoroughly rinsed with deionized water to remove salt residues and stored in clean, covered Petri dishes until further spectroscopic or microscopic analysis was required.

2.2.2. Quality Control Measures

All procedures were carried out in a laminar flow cabinet to minimize airborne contamination. Laboratory surfaces and tools were thoroughly cleaned with ethanol and rinsed with filtered deionized water before and after each sample. Procedural blanks (controls with no sample) were prepared for each batch of analysis to monitor potential contamination. Cotton lab coats and nitrile gloves were worn during all stages of sample handling.

2.3. Sample Processing

2.3.1. Confocal Microscope

Analyses were conducted using a WiTec Alpha 300 R confocal microscope (WITec GmbH, Ulm, Germany), equipped with a 532 nm excitation laser module, a 100× air objective (Zeiss EC Epiplan-Neofluar, NA 0.9; Carl Zeiss AG, Oberkochen, Germany), a UHRS 300 spectrometer (600 lines/mm) (WITec GmbH, Ulm, Germany), and a highly efficient, thermoelectrically cooled CCD camera. Spectra were collected from road pollution particles placed on calcium fluoride (CaF2) slides, which were selected due to their low background level and distinctive peaks, which were easily distinguishable from microplastic spectra. The microscope settings were carefully optimized for this specific experiment to ensure high-quality spectral acquisition without damaging the sample. The laser power on the sample was 10 mW, the spectral integration time was set to 0.5 s, and 20 accumulations were recorded for each Raman spectrum.

2.3.2. Quality Control and Assurance

During the research, only metal and glass instruments were used. Cotton clothing was worn, and samples were carefully shielded from any environmental emissions. A control analysis was also performed using the same procedure but without the fertilizer sample. This control test confirmed the absence of microplastics.

2.4. Identification of Microplastic Polymers via Raman Spectroscopy

The identification of microplastic (MP) particles was performed using Raman spectroscopy based on the comparison of the characteristic Raman peaks of each particle with the reference spectra. This method allows for the differentiation of polymers based on their distinct vibrational modes, which are highly specific to their molecular structure.
To support the polymer classification process, a list of characteristic Raman peaks for the most commonly encountered microplastic types was compiled from the literature and spectral databases. These peaks served as the basis for identifying the types of polymers in the collected samples. Table 1 summarizes the leading Raman bands, their vibrational assignments, and the corresponding references for each polymer type analyzed in this study.

2.5. Statistical Analysis

Coefficient of variation (CV) and relative standard deviation (RSD) were used to analyze the measure of relative dispersion of the dataset to determine variability.
RSD = s x
where s is standard deviation and x is the average.
The coefficient of variation (CV) is as follows:
CV = R S D × 100 %
where RSD is the relative standard deviation.

3. Results and Discussion

3.1. Mass

The average microplastic mass in the samples collected in June was 461.28 mg per 100 g of lyophilized fertilizer. For the July samples, the microplastic mass was slightly lower, at 458.92 mg per 100 g of lyophilized fertilizer. Assuming a typical application rate of 500 g of fertilizer per square meter of agricultural land, the microplastic content in the fertilizer corresponds to approximately 2.3 g per square meter of land.
When considering an area of 100 square meters (1 ara), approximately 50 kg of fertilizer would be applied. Based on the average microplastic concentration in the fertilizer, this would result in the deposition of around 230 g of microplastics on 100 m2 of agricultural land. This emphasizes the potential for significant microplastic accumulation in soils, depending on the amount of fertilizer applied.

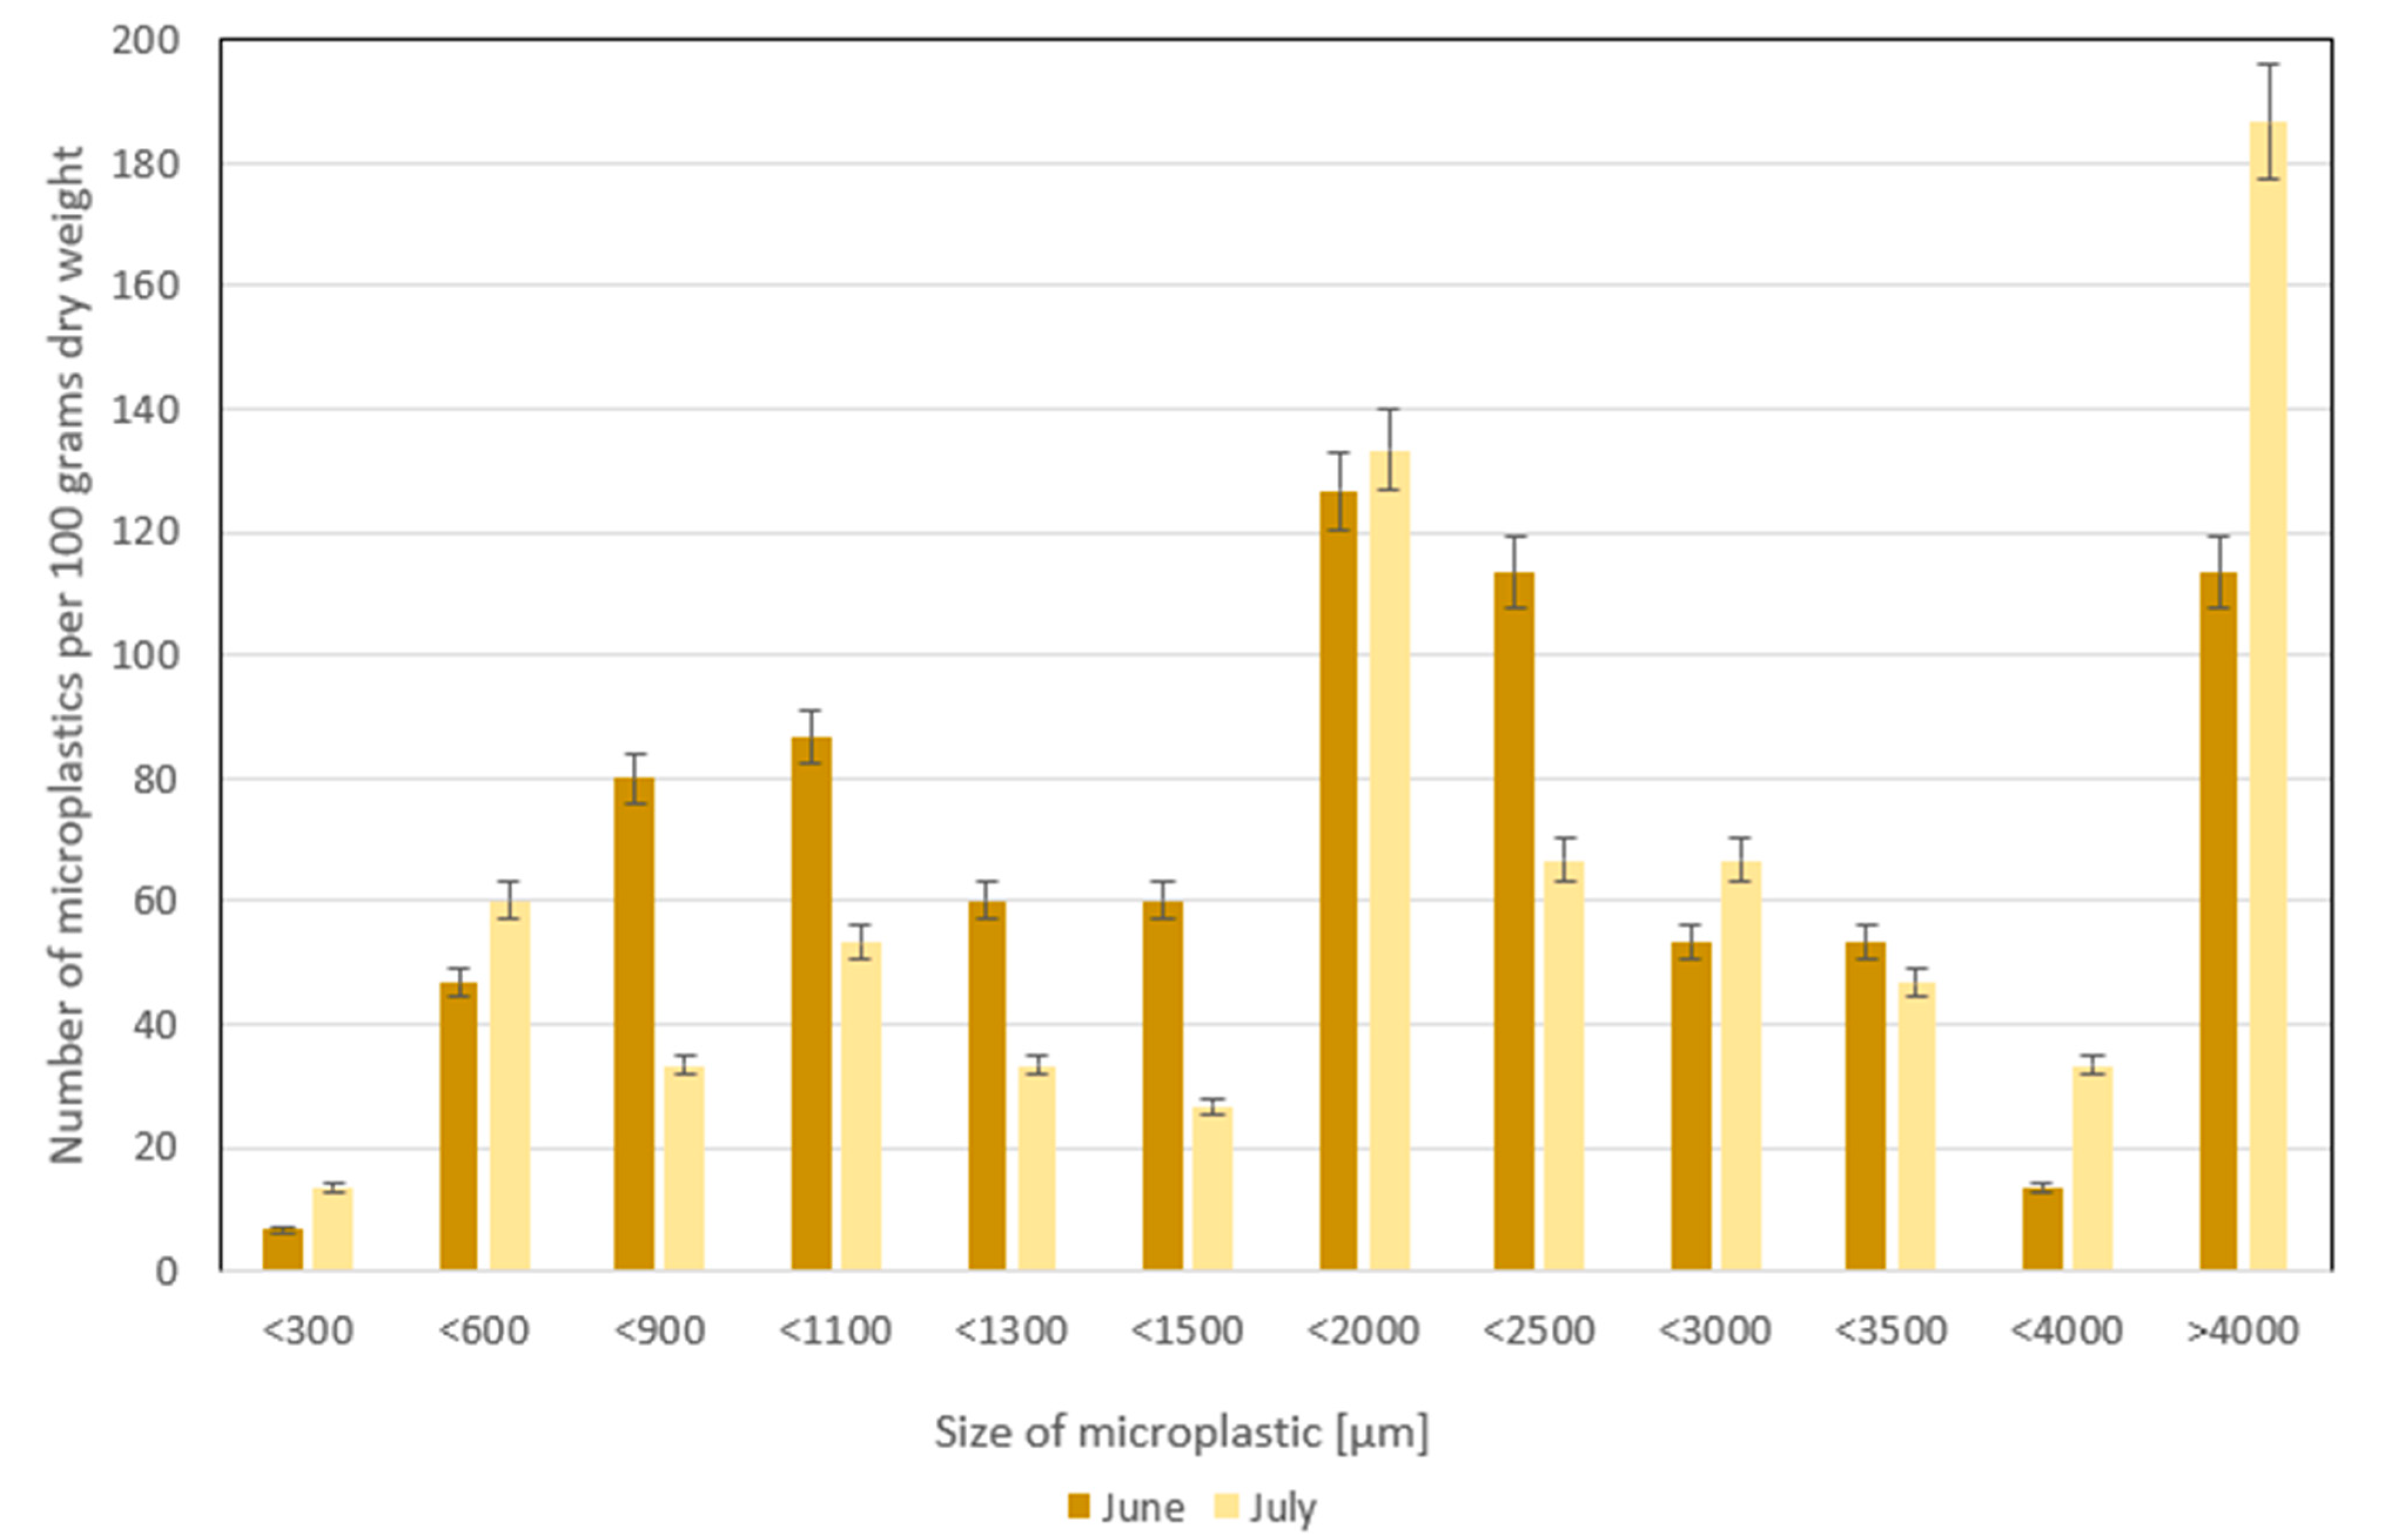
3.2. The Number of Microplastics

The samples exhibited a varied form of microplastics (Figure 1). The average fragment content in the June samples was 553 particles per 100 g of dry weight, while for fibers, this value was 327 particles per 100 g of dry weight, resulting in a total of 880 particles per 100 g of dry weight.
In the July samples (Figure 2), the average fragment content was 507 per 100 g of dry weight, and for fibers, this value was 227, resulting in an average of 734 particles per 100 g of dry fertilizer.
The June samples had, on average, 17% more microplastic content compared to the July samples. In the June samples, fragments accounted for 64% of the total microplastic content, while in the July samples, the proportion of fragments was 69%.
Research on microplastics in fertilizers is scarce, with the majority focusing on the analysis of MPs in sewage sludge and soil, where they eventually accumulate.
For comparison, earlier studies on organic fertilizers have reported microplastic concentrations averaging 325 ± 511 particles per kilogram, with microplastics detected in 80.4% of the samples. The highest levels were recorded in Beijing (758 particles/kg) and in fertilizers with complex organic matter, averaging 386 particles per kilogram. The dominant types were white or transparent particles (75.9%), primarily film-like fragments (39%) [19].
In the case of the samples analyzed in this study, significantly higher levels of contamination were observed, with differences reaching over an order of magnitude. In the June samples, the number of microplastic particles exceeded 8000 per kilogram of fertilizer, while in the July samples, the average particle count was slightly below this value. Similar to previous studies, fragments were the dominant shape. However, in contrast to the literature data, the color distribution differed: in our samples from both June and July, colored fragments were predominant.
The microplastic (MP) content in dewatered sludge and filter cake was reported to be 36.3 ± 5.7 and 46.3 ± 6.2 particles per gram of dry weight, respectively [20]. These values are lower compared to the fertilizers analyzed in this study, which contained, on average, 80% stabilized sewage sludge. Despite the lower concentrations, the data highlight the risk of secondary contamination through the application of materials such as fertilizers.
Researchers analyzed activated sludge and reported a concentration of 113 ± 57 MPs per gram of dry sludge [13]. The study highlighted the potential for wastewater treatment plants to emit microplastics into agroecosystems. This value is significantly higher than that of the fertilizer analyzed in our study. Additionally, the sewage sludge used for fertilizer production [14] was also examined, and in this case, the samples showed a lower concentration of microplastics. The results of the conducted analyses indicate a relatively high concentration of microplastics in the examined samples of fertilizer derived from stabilized sewage sludge. For comparison, other studies have reported the presence of approximately 113 microplastic particles per gram of sewage sludge, which represents a higher level of contamination compared to our findings [13]. In contrast, some studies have reported significantly lower concentrations—in the range of 370 to 950 particles per kilogram—indicating a markedly lower microplastic content than that found in the samples analyzed in this study [21]. Such considerable discrepancies may result from differences in sludge stabilization technologies, types of wastewater, environmental conditions, and the detection and isolation methods used for microplastic analysis.
Researchers analyzed microplastics in agricultural soils, and the study reported an average of 0.34 ± 0.36 particles of macroplastics and microplastics per kilogram of dry soil. Among macroplastics, plastic films were predominant, while microplastics were primarily composed of films and fragments. It is important to note, however, that the studied soil had not been exposed to materials likely to contain synthetic polymers. The authors emphasized that microplastic concentrations are likely to be significantly higher in areas where plastic-based agricultural practices are employed [22].
Quantitative analyses of microplastics (MPs) in soil revealed an increased abundance of MPs in soils fertilized with sewage sludge compost compared to unfertilized soils. The results showed 545.9 and 87.6 particles per kilogram in soils following one year of compost application, whereas only 5.00 particles per kilogram were detected in soils without compost treatment [23].
A comparative analysis was conducted to assess microplastic (MP) content across different agricultural fields subjected to various fertilization practices. The results indicated 1025 particles/kg in fields treated with inorganic fertilizers, 1000 particles/kg in fields receiving organic fertilizers, and 800 particles/kg in fields covered with plastic mulch. The most commonly observed colors among the microplastic particles were blue (37.71%) and pink (23.87%). Although direct comparison of MP quantities is challenging due to differences in sample matrices, the color distribution was comparable; in both cases, colored particles were predominant, accounting for more than 60% of the identified microplastics [24].
Differences in the number and size of microplastic particles observed across different months may result from various environmental and anthropogenic factors, such as precipitation variability, temperature fluctuations, seasonal agricultural activities, or changes in the sources of plastic pollution over time. For example, increased rainfall during certain months can lead to enhanced surface runoff, transporting larger amounts of plastic into the studied area. Additionally, seasonal patterns of plastic use (e.g., agricultural films) can affect both the quantity and degradation state of microplastic particles.
The relative standard deviation (RSD) and coefficient of variation (CV) were calculated to assess the variability in microplastic concentrations within each sampling month. For the June samples, the mean concentration was 220.0 particles per 100 g of dry sludge, with a standard deviation of 75.66, resulting in a relative standard deviation (RSD) or coefficient of variation (CV) of 0.344 (34.4%). In contrast, the July samples showed a mean concentration of 183.33 particles per 100 g, with a standard deviation of 17.56 and an RSD/CV of 0.096 (9.6%). These results indicate greater variability in the June samples compared to July.
In the case of the June samples, the dominant particle size ranges were 1500–2000 µm, 2000–2500 µm, and above 4000 µm (Figure 3). For the July samples, the vast majority of particles exceeded 4000 µm in size, followed by the 2000–2500 µm range (Figure 3).
The most common size of microplastic particles found in organic fertilizer was in the range of 1–3 mm, accounting for 55% of all identified particles [19]. The substantial presence of microplastics in organic fertilizers raises concerns about their potential ecological impacts.
The study suggests that microplastic contamination in agricultural environments may lead to unintended consequences, such as the uptake of microplastics by plants and their subsequent accumulation in the food chain.
Previous studies have demonstrated that the size distribution of microplastics in sewage sludge varies depending on the sampling location within the treatment plant. Reported particle sizes typically range from 0.002–0.1 mm up to 3–5 mm [20]. Among these, the most dominant size class across various sludge samples was found to be 500–1000 µm, suggesting a consistent prevalence of mid-sized particles within sludge matrices [25].
In soils fertilized with sewage sludge-based composts, the most abundant microplastic size fractions were observed within the 2–3 mm and 3–4 mm ranges [22]. These findings emphasize the potential for larger microplastic particles to persist and accumulate in agroecosystems following the application of treated sludge, particularly when sludge is used as a fertilizer.
Large microplastic particles, such as those exceeding 4000 µm, are generally less mobile in the environment compared to smaller particles due to their size and weight. These larger fragments tend to accumulate in soils, particularly in the upper soil layers, where they can persist for extended periods. However, physical, chemical, and biological processes in the soil, including mechanical abrasion, microbial degradation, and UV exposure, can contribute to further fragmentation of these particles into smaller sizes, potentially increasing their mobility and bioavailability.
Regarding food safety, the presence and potential fragmentation of large microplastic particles in agricultural soils raise concerns about their uptake by crops and subsequent entry into the food chain. While larger particles are less likely to be directly taken up by plants, their breakdown into smaller particles increases the risk of bioaccumulation in edible plant tissues and subsequent transfer to animals and humans.
Overall, these findings highlight the need for further research on the long-term fate of large microplastic particles in soils and their ecological and health implications.

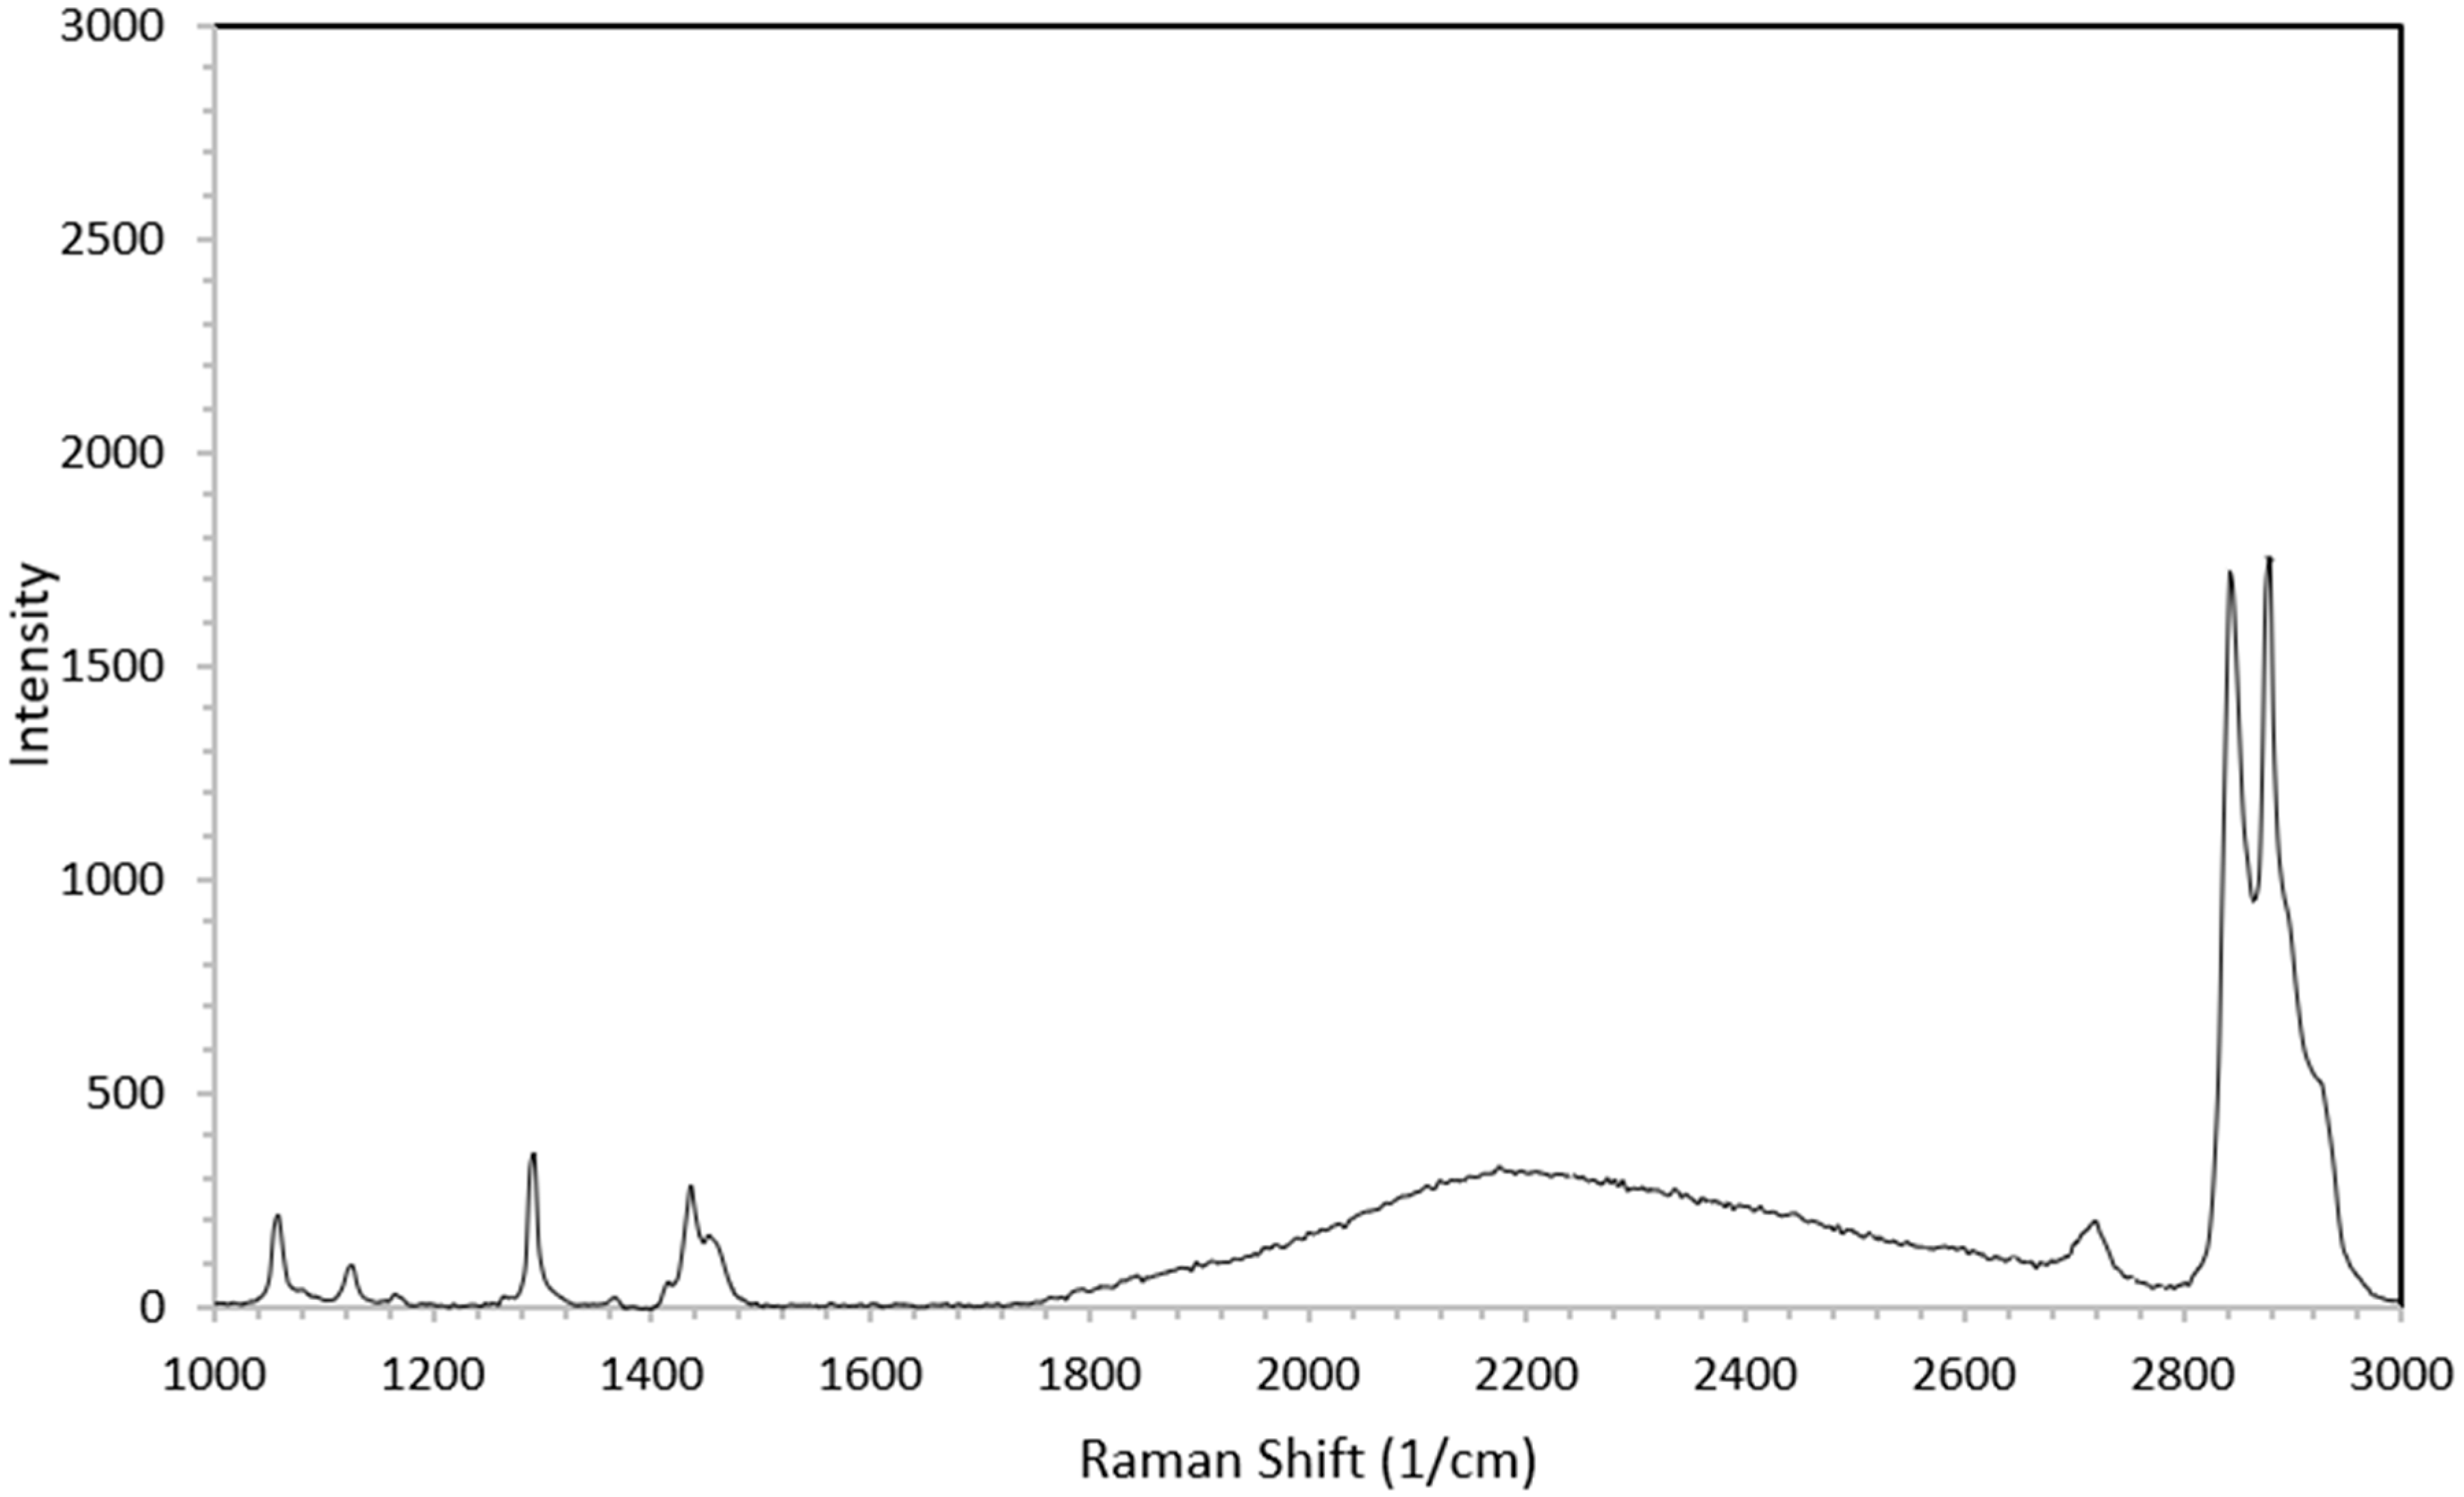
3.3. The Qualitative Analysis of Microplastics

The qualitative analysis of microplastics focused on identifying particles using Raman confocal microscopy. Polyethylene, a thermoplastic resin, can exist in either a transparent, solid, amorphous form or as a white crystalline material. Excellent insulating properties and high chemical stability characterize this material. Polyethylene is an incredibly versatile material and one of the most affordable plastics available.
Figure 4 presents the Raman spectrum of polyethylene, which shows peaks corresponding to different types of vibrations: the stretching of C–H bonds (around 3000 cm−1), the bending and twisting of these bonds (around 1300 and 1400 cm−1), and the stretching of C–C bonds (within the range of 1000–1200 cm−1).
The qualitative findings of this study are consistent with those previously published in the literature. Phiel et al. analyzed environmental samples and identified polyethylene as the dominant contaminant among microplastic particles, followed by polystyrene and polypropylene [22]. Similarly, another Raman spectroscopic study revealed that approximately 89.5% of the detected particles were plastic polymers, including polyesters, polyamide (PA), polyethylene terephthalate (PET), and polyethylene (PE). This polymeric composition suggests that the microplastic particles may originate from laundering processes and personal care products [20].
The qualitative results obtained in this study align closely with findings reported in the existing literature. Phiel et al. identified polyethylene (PE) as the most prevalent microplastic polymer in their samples, followed by polystyrene (PS) and polypropylene (PP) [22]. Similarly, Raman spectroscopic analysis in another study showed that approximately 89.5% of the particles were plastic polymers such as polyesters, polyamide (PA), polyethylene terephthalate (PET), and polyethylene (PE), suggesting that these microplastics may originate from laundry activities and personal care products [20,26,27,28,29].
In a separate investigation, polyethylene was again reported as the most commonly detected polymer type across all microplastic samples, highlighting its widespread occurrence in environmental matrices [24]. Furthermore, in an analysis of sewage sludge, the distribution of microplastics was dominated by PE (67.9%), followed by PET (16.1%) and polyester (PES) (10.7%), underscoring the predominance of polyethylene in wastewater treatment residues [25].

4. Conclusions

The analysis indicates that organic fertilizers derived from sewage sludge contain significant amounts of microplastics, both in terms of mass and particle count. The observed average—exceeding 2 g of microplastics per square meter of agricultural land—suggests a tangible risk of accumulation in soil and, in the long term, in crops and the food chain.
The morphological (e.g., fragments, fibers) and dimensional diversity of the particles implies complex sources of origin, as well as varied mechanisms of transport and retention in the organic matrix. The higher microplastic content observed in the June samples compared to those from July (approximately 17%) may indicate seasonal variations in fertilizer composition or differences in processing methods.
The detection of larger particles (>4000 µm) in both sample sets raises concerns about the limitations of current filtration and purification methods used in fertilizer production.
Polyethylene, identified as the most widely used plastic type, likely originates from commonly used packaging materials and agricultural films. This finding aligns with trends reported in other studies of agricultural microplastic pollution.
The obtained results are particularly significant for the management of sewage sludge intended for use as a fertilizer. The analysis confirmed a considerable presence of microplastics in fertilizer derived from stabilized sewage sludge, highlighting a serious environmental concern due to the persistence and potential effects of microplastics. Notably, current legislation—such as Regulation (EU) 2019/1009 on the marketing of EU fertilizing products—does not regulate or limit the microplastic content in such materials [30]. Our findings suggest a pressing need to revise existing regulations to include criteria related to microplastic contamination. This is especially important given the long environmental persistence of microplastic particles, their potential for bioaccumulation, and their ability to adsorb other pollutants.
In light of the widespread microplastic contamination and the continued use of sewage sludge as an organic fertilizer, it is crucial to develop effective purification methods. It is imperative to design technologies that allow for the selective removal of microplastics while preserving the fertilizing properties of the sludge. Such processes must not only be technically effective but also economically viable to ensure practical implementation on an industrial scale in wastewater treatment plants. Advancing such solutions could significantly reduce the introduction of microplastics into terrestrial ecosystems, thereby contributing to improved soil quality, the protection of water resources, and enhanced food safety.
The accumulation of polyethylene (PE), the dominant polymer identified in this study, can have adverse effects on soil health by altering soil structure and porosity, which may impact water retention and aeration. Moreover, PE particles may interfere with soil microbial communities, which play a crucial role in nutrient cycling and the decomposition of organic matter. Such disruptions could have downstream effects on soil fertility and the functioning of ecosystems.
The presence of microplastics in sewage sludge raises critical questions regarding its suitability for use in fertilizer production, particularly in the context of sustainable recycling of nutrients and organic matter into agricultural ecosystems. The implementation of circular economy (CE) strategies requires that secondary products be free from secondary contaminants that pose a threat to ecosystems and human health. The results of this study provide a basis for developing guidelines on environmental risk assessment and for adapting technological processes to reduce microplastic emissions.

Author Contributions

Conceptualization, J.W. and K.S.; methodology, J.W., J.C. and K.S.; formal analysis, J.W. and K.K.; investigation, J.W. and K.K.; writing—original draft preparation, J.W.; visualization, J.W. and K.K.; writing—review and editing J.W., K.S. and J.C. All authors have read and agreed to the published version of the manuscript.

Funding

This study was financed by grants to AGH UST within the framework of the “Excellence Initiative—Research University” program. The research was partially supported by Research Subsidy AGH 16.16.210.476.

Institutional Review Board Statement

Not applicable.

Informed Consent Statement

Not applicable.

Data Availability Statement

The data supporting the reported results were collected on a disc. They can be shared upon request.

Conflicts of Interest

The authors declare no conflict of interest.

Abbreviations

The following abbreviations are used in this manuscript:
MPMicroplastic
SSSStabilized Sewage Sludge
LDPELow-Density Polyethylene
PEPolyethylene
PAPolyamide
PETPolyethylene terephthalate
PPPolypropylene
PVCPolyvinyl chloride
PCPolycarbonate

References

  1. Worek, J.; Styszko, K. Comparative Study of Matrix Etching Methods for the Separation of Microplastics from Environmental Samples. Desalination Water Treat. 2025, 322, 101140. [Google Scholar] [CrossRef]
  2. Worek, J.; Badura, X.; Białas, A.; Chwiej, J.; Kawoń, K.; Styszko, K. Pollution from Transport: Detection of Tyre Particles in Environmental Samples. Energies 2022, 15, 2816. [Google Scholar] [CrossRef]
  3. Li, Y.; Chen, L.; Zhou, N.; Chen, Y.; Ling, Z.; Xiang, P. Microplastics in the Human Body: A Comprehensive Review of Exposure, Distribution, Migration Mechanisms, and Toxicity. Sci. Total Environ. 2024, 946, 174215. [Google Scholar] [CrossRef] [PubMed]
  4. Tomonaga, T.; Higashi, H.; Izumi, H.; Nishida, C.; Kawai, N.; Sato, K.; Morimoto, T.; Higashi, Y.; Yatera, K.; Morimoto, Y. Investigation of Pulmonary Inflammatory Responses Following Intratracheal Instillation of and Inhalation Exposure to Polypropylene Microplastics. Part. Fibre Toxicol. 2024, 21, 29. [Google Scholar] [CrossRef]
  5. Xu, J.-L.; Lin, X.; Wang, J.J.; Gowen, A.A. A Review of Potential Human Health Impacts of Micro- and Nanoplastics Exposure. Sci. Total Environ. 2022, 851, 158111. [Google Scholar] [CrossRef]
  6. Huerta Lwanga, E.; Gertsen, H.; Gooren, H.; Peters, P.; Salánki, T.; van der Ploeg, M.; Besseling, E.; Koelmans, A.A.; Geissen, V. Microplastics in the Terrestrial Ecosystem: Implications for Lumbricus terrestris (Oligochaeta, Lumbricidae). Environ. Sci Technol 2016, 50, 2685–2691. [Google Scholar] [CrossRef]
  7. Zhang, L.; Zhang, G.; Shi, Z.; He, M.; Ma, D.; Liu, J. Effects of Polypropylene Micro(Nano)Plastics on Soil Bacterial and Fungal Community Assembly in Saline-Alkaline Wetlands. Sci. Total Environ. 2024, 945, 173890. [Google Scholar] [CrossRef] [PubMed]
  8. Li, L.; Zhou, Q.; Yin, N.; Tu, C.; Luo, Y. Uptake and Accumulation of Microplastics in an Edible Plant. Chin. Sci. Bull. 2019, 64, 928–934. [Google Scholar] [CrossRef]
  9. Sajjad, M.; Huang, Q.; Khan, S.; Khan, M.A.; Liu, Y.; Wang, J.; Lian, F.; Wang, Q.; Guo, G. Microplastics in the Soil Environment: A Critical Review. Environ. Technol. Innov. 2022, 27, 102408. [Google Scholar] [CrossRef]
  10. Rafa, N.; Ahmed, B.; Zohora, F.; Bakya, J.; Ahmed, S.; Ahmed, S.F.; Mofijur, M.; Chowdhury, A.A.; Almomani, F. Microplastics as Carriers of Toxic Pollutants: Source, Transport, and Toxicological Effects. Environ. Pollut. 2024, 343, 123190. [Google Scholar] [CrossRef]
  11. Styszko, K.; Bolesta, W.; Worek, J.; Prus, Z.; Cwynar, K.; Pyssa, J.; Uchmanowicz, D.; Frydel, L.; Daso, A.P.; Kasprzyk-Hordern, B. Tracking Nonregulated Micropollutants in Sewage Sludge: Antimicrobials, OH-PAHs, and Microplastics—Environmental Risks, Fertilizer Implications and Energy Considerations. Energy Rep. 2025, 13, 4756–4768. [Google Scholar] [CrossRef]
  12. Weithmann, N.; Möller, J.N.; Löder, M.G.J.; Piehl, S.; Laforsch, C.; Freitag, R. Organic Fertilizer as a Vehicle for the Entry of Microplastic into the Environment. Sci. Adv. 2018, 4, aap8060. [Google Scholar] [CrossRef]
  13. Magni, S.; Binelli, A.; Pittura, L.; Avio, C.G.; Della Torre, C.; Parenti, C.C.; Gorbi, S.; Regoli, F. The Fate of Microplastics in an Italian Wastewater Treatment Plant. Sci. Total Environ. 2019, 652, 602–610. [Google Scholar] [CrossRef] [PubMed]
  14. Worek, J.; Kawoń, K.; Chwiej, J.; Berent, K.; Rego, R.; Styszko, K. Assessment of the Presence of Microplastics in Stabilized Sewage Sludge: Analysis Methods and Environmental Impact. Appl. Sci. 2024, 15, 1. [Google Scholar] [CrossRef]
  15. Głodniok, M.; Korol, J.; Zawartka, P.; Krawczyk, B.; Deska, M. Organic Fertilizer and Method for Obtaining It. Polish Patent 420420, 2017. [Google Scholar]
  16. Araujo, C.F.; Nolasco, M.M.; Ribeiro, A.M.P.; Ribeiro-Claro, P.J.A. Identification of Microplastics Using Raman Spectroscopy: Latest Developments and Future Prospects. Water Res. 2018, 142, 426–440. [Google Scholar] [CrossRef] [PubMed]
  17. Anger, P.M.; von der Esch, E.; Baumann, T.; Elsner, M.; Niessner, R.; Ivleva, N.P. Raman Microspectroscopy as a Tool for Microplastic Particle Analysis. TrAC Trends Anal. Chem. 2018, 109, 214–226. [Google Scholar] [CrossRef]
  18. Käppler, A.; Fischer, D.; Oberbeckmann, S.; Schernewski, G.; Labrenz, M.; Eichhorn, K.-J.; Voit, B. Analysis of Environmental Microplastics by Vibrational Microspectroscopy: FTIR, Raman or Both? Anal. Bioanal. Chem. 2016, 408, 8377–8391. [Google Scholar] [CrossRef]
  19. Zhang, S.; Li, Y.; Chen, X.; Jiang, X.; Li, J.; Yang, L.; Yin, X.; Zhang, X. Occurrence and Distribution of Microplastics in Organic Fertilizers in China. Sci. Total Environ. 2022, 844, 157061. [Google Scholar] [CrossRef]
  20. Jiang, J.; Wang, X.; Ren, H.; Cao, G.; Xie, G.; Xing, D.; Liu, B. Investigation and Fate of Microplastics in Wastewater and Sludge Filter Cake from a Wastewater Treatment Plant in China. Sci. Total Environ. 2020, 746, 141378. [Google Scholar] [CrossRef]
  21. Leslie, H.A.; Brandsma, S.H.; van Velzen, M.J.M.; Vethaak, A.D. Microplastics En Route: Field Measurements in the Dutch River Delta and Amsterdam Canals, Wastewater Treatment Plants, North Sea Sediments and Biota. Environ. Int. 2017, 101, 133–142. [Google Scholar] [CrossRef] [PubMed]
  22. Piehl, S.; Leibner, A.; Löder, M.G.J.; Dris, R.; Bogner, C.; Laforsch, C. Identification and Quantification of Macro- and Microplastics on an Agricultural Farmland. Sci. Rep. 2018, 8, 17950. [Google Scholar] [CrossRef] [PubMed]
  23. Zhang, L.; Xie, Y.; Liu, J.; Zhong, S.; Qian, Y.; Gao, P. An Overlooked Entry Pathway of Microplastics into Agricultural Soils from Application of Sludge-Based Fertilizers. Environ. Sci. Technol. 2020, 54, 4248–4255. [Google Scholar] [CrossRef]
  24. Karthika, S.; Sivasubramanian, K.; Dhevagi, P.; Thavamani, P.; Rajkishore, S.K.; Amrutha, V.M.; Sudhakaran, R.; Chitra, N.; Lakshmanan, A. Distribution Pattern and Risk Assessment of Microplastics Contamination in Different Agricultural Systems. Int. J. Environ. Anal. Chem. 2024, 1–20. [Google Scholar] [CrossRef]
  25. Kılıç, B.I.; Üstün, G.E.; Can, T. Characteristics, and Seasonal Change of Microplastics in Organized Industrial Zone Wastewater Treatment Plant. J. Environ. Chem. Eng. 2025, 13, 115516. [Google Scholar] [CrossRef]
  26. Militký, J.; Novotná, J.; Wiener, J.; Křemenáková, D.; Venkataraman, M. Microplastics and Fibrous Fragments Generated during the Production and Maintenance of Textiles. Fibers 2024, 12, 51. [Google Scholar] [CrossRef]
  27. Novotna, J.; Tunak, M.; Militky, J.; Kremenakova, D.; Wiener, J.; Novakova, J.; Sevcu, A. Release of Microplastic Fibers from Polyester Knit Fleece during Abrasion, Washing, and Drying. ACS Omega 2025, 10, 14241–14249. [Google Scholar] [CrossRef]
  28. Pirc, U.; Vidmar, M.; Mozer, A.; Kržan, A. Emissions of Microplastic Fibers from Microfiber Fleece during Domestic Washing. Environ. Sci. Pollut. Res. 2016, 23, 22206–22211. [Google Scholar] [CrossRef]
  29. Carney Almroth, B.M.; Åström, L.; Roslund, S.; Petersson, H.; Johansson, M.; Persson, N.-K. Quantifying Shedding of Synthetic Fibers from Textiles: A Source of Microplastics Released into the Environment. Environ. Sci. Pollut. Res. 2018, 25, 1191–1199. [Google Scholar] [CrossRef]
  30. European Parliament, C. of the E.U. Regulation (EU) 2019/1009 of the European Parliament and of the Council of 5 June 2019 Laying down Rules on the Making Available on the Market of EU Fertilising Products. Off. J. Eur. Union 2019, 25, 1–120. [Google Scholar]
Figure 1. Confocal microscope image of microplastic samples.
Applsci 15 07420 g001
Figure 2. Number of microplastics in the June and July samples per 100 g of dry weight (categorized by shape and color).
Applsci 15 07420 g002
Figure 3. Size distribution of microplastic particles by sampling month.
Applsci 15 07420 g003
Figure 4. Microplastic spectrum classified as LDPE.
Applsci 15 07420 g004
Table 1. Characteristic Raman peaks of selected microplastic polymers.
PolymerMain Raman Peaks (cm−1)Vibrational AssignmentReferences
Polystyrene (PS)~620, ~1000, ~1030, ~1600, ~2900Aromatic ring deformation, ring breathing, C=C stretching, C–H stretchingAraujo et al. (2018) [16]
Polyethylene (PE)~1060, ~1130, ~1295, ~1440, 2880–2950C–C stretching, CH2 twisting, CH2 scissoring, C–H stretchingAnger et al. (2018) [17]
Polypropylene (PP)~840, ~973, ~1165, ~1330, ~1450, 2880–2950CH3 rocking, C–C stretching, CH bending, and stretchingKäppler et al. (2015); Araujo et al. (2018) [16,18]
Polyvinyl chloride (PVC)~638, ~695, ~830, ~1430, ~2900C–Cl stretching, C–H deformation, skeletal vibrationsAnger et al. [17]
Polyethylene terephthalate (PET)~860, ~1000, ~1240, ~1615, ~1725, ~2900C–C, C–O stretching, aromatic C=C, ester C=O stretchingAraujo et al. (2018) [16]
Polyamide (PA, e.g., Nylon)~935, ~1200, ~1440, ~1640, ~2900C–N stretching, CH2 deformation, amide C=O stretchingKäppler et al. (2015); Araujo et al. (2018) [16,18]
Polycarbonate (PC)~640, ~1130, ~1600, ~1770C–O stretching, aromatic C=C, carbonate C=O stretchingAnger et al. [17]
Disclaimer/Publisher’s Note: The statements, opinions and data contained in all publications are solely those of the individual author(s) and contributor(s) and not of MDPI and/or the editor(s). MDPI and/or the editor(s) disclaim responsibility for any injury to people or property resulting from any ideas, methods, instructions or products referred to in the content.

