1. Introduction
During operation, diesel engine crankshafts experience significant torque fluctuations due to factors including periodic variations in cylinder pressure and the inherent characteristics of the crank-slider mechanism [
1,
2,
3]. These fluctuations induce torsional vibrations, a critical dynamic phenomenon that directly impacts the reliability, durability, and operational safety of the entire powertrain, particularly in demanding applications like marine propulsion [
4,
5]. Consequently, the accurate analysis of these vibrations is vital not only for design validation but also for the development of advanced intelligent systems for condition monitoring and fault diagnosis [
6,
7].
The predominant method for measuring crankshaft torsional vibration involves the analysis of instantaneous angular speed (IAS) [
8,
9]. This technique typically employs a toothed disc, such as the engine’s flywheel ring gear, in conjunction with a proximate sensor (e.g., magneto-electric, Hall-effect, or optical) to generate a pulse train corresponding to passing gear teeth [
10,
11]. By precisely processing the timing of these pulses, the engine’s IAS can be calculated, providing a rich data source for identifying torsional vibration characteristics and diagnosing malfunctions, such as injector faults or combustion anomalies [
12]. The efficacy of this entire process hinges on the fidelity of the acquired signal and the robustness of the analytical tools, like spectral analysis, used to interpret it [
13]. Therefore, significant research has focused on developing high-precision angular sensors and signal acquisition hardware capable of operating reliably in harsh engine environments [
14,
15].
Despite the method’s widespread use, its accuracy is severely compromised by the complex vibrational environment of an operating diesel engine. Parasitic vibrations, including crankshaft bending and lateral whirl, are inevitably transmitted to the measurement location [
16,
17]. These vibrations cause dynamic runout—a combination of radial and axial displacement—of the toothed disc relative to the stationary sensor. This issue is a primary and well-documented source of error in torsional vibration measurement [
18,
19]. This runout induces instantaneous changes in the air gap between the gear teeth and the sensor, which contaminates the output signal with modulation errors that are unrelated to the actual torsional dynamics, thereby hindering accurate analysis and diagnosis [
20,
21]. In severe cases, particularly during transient operation, this distortion can lead to missed pulses or spurious data points, rendering the derived speed data unusable [
22].
To mitigate the interference caused by toothed disc runout, several strategies have been proposed. One direct approach involves the mechanical reinforcement of the sensor bracket and other components to physically suppress the relative vibration [
23]. However, this method often requires significant modifications and may not be feasible in space-constrained applications. The usage of digital filters to remove noise is common, but this approach carries the significant risk of distorting the signal of interest or inadvertently removing valuable features within certain frequency bands, which can lead to incomplete or misleading results [
24]. The limitations of these existing methods highlight the need for a more robust approach to eliminate runout-induced errors at the source.
While previous studies have addressed runout through mechanical reinforcement, vibration-based level adjustment, or general digital filtering, these methods suffer from limitations such as invasive installation, demanding prerequisites, or potential signal distortion. This paper makes a distinct contribution by proposing a composite signal processing strategy that tackles the runout problem at both micro and macro levels. The key novelties are as follows:
- (1)
The dual-line approximation method, a robust algorithm specifically designed to counteract signal jitter near the zero-crossing, which conventional methods fail to handle effectively under high sampling frequencies.
- (2)
The synchronous sampling method, which, for the first time to our knowledge, combines the differential measurement principle with a time-domain reconstruction technique to actively cancel runout-induced errors in torsional vibration signals, avoiding the feature loss associated with filtering.
This integrated approach offers a practical, high-fidelity, and non-invasive solution, which is particularly valuable for large-bore, low-to-medium-speed diesel engines used in marine propulsion and power generation, where torsional vibrations are a major concern.
2. Analysis of the Runout Interference Mechanism During Sampling
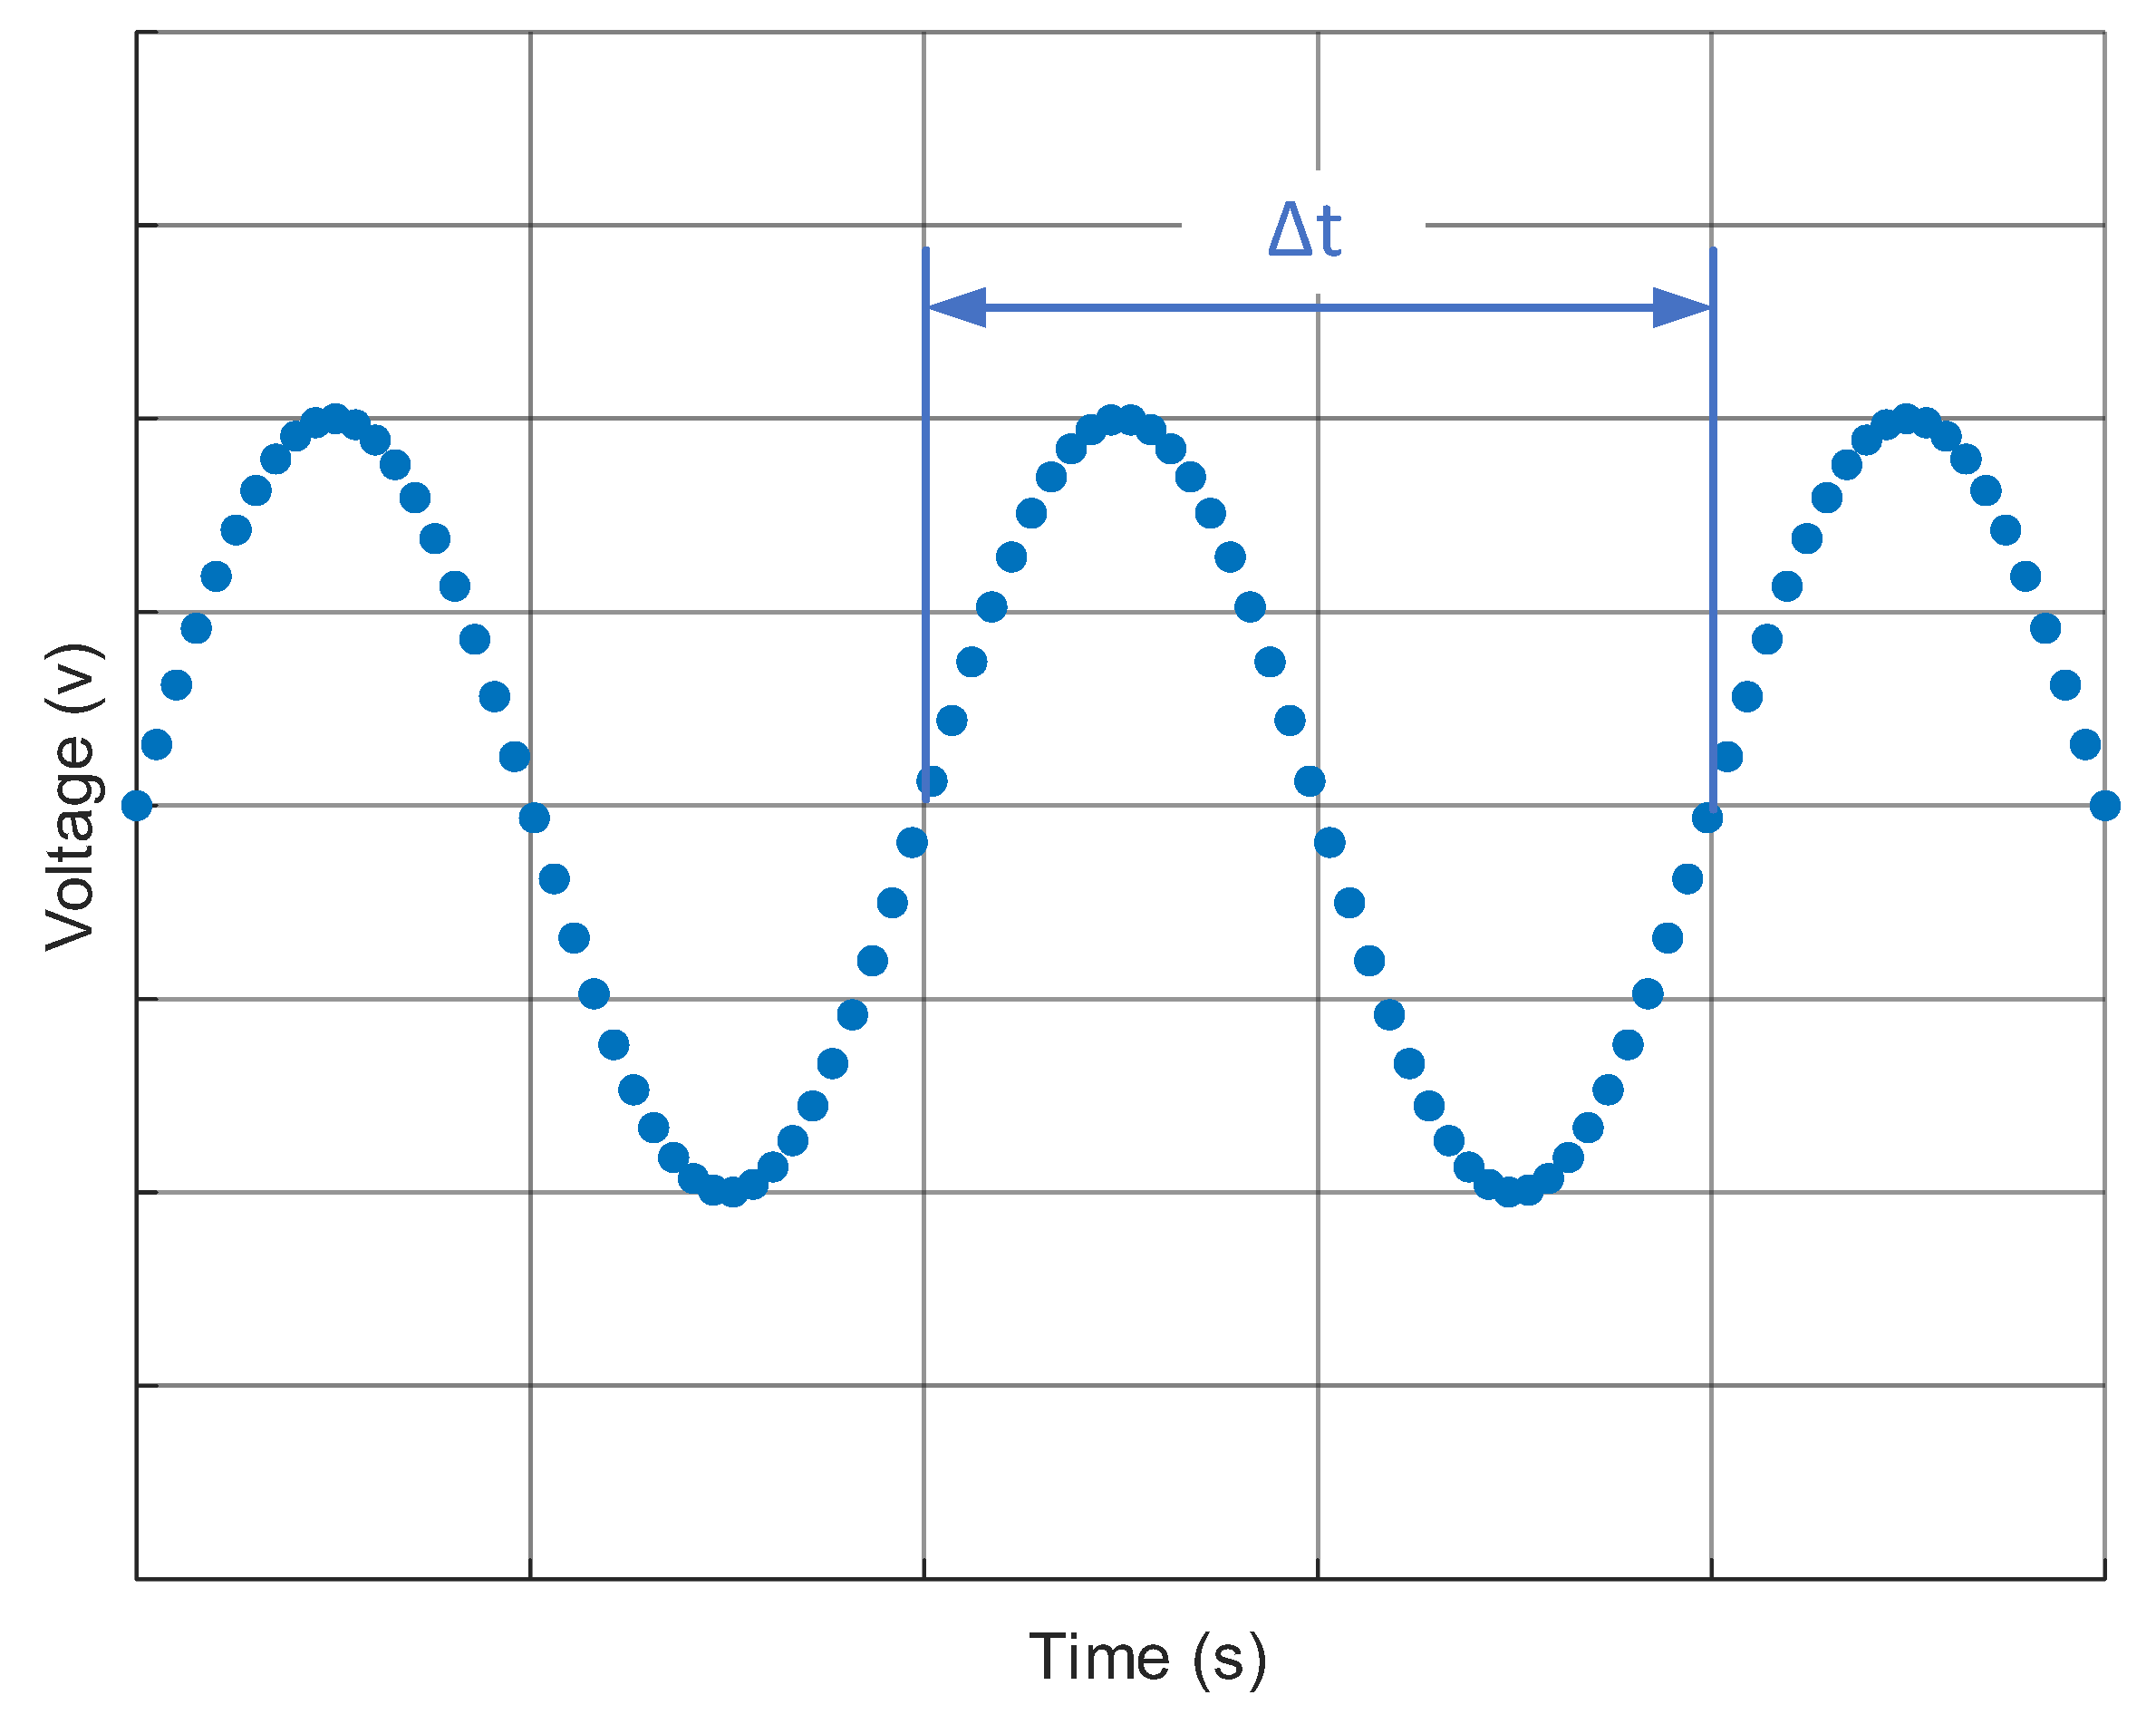
To eliminate the impact of random toothed disc runout on torsional vibration measurements, an analysis of the error generation mechanism is essential. The analysis begins with the measurement principle itself. Typically, the zero-crossing detection method is employed to obtain the fluctuating rotational speed, which embodies the torsional vibration characteristics. During the measurement process, the sensor detects the rotation of the toothed disc, and the output voltage waveform is as illustrated in
Figure 1. A periodic waveform is generated for each indexing interval traversed, and the time
taken to traverse this interval is used to calculate the rotational speed.
To precisely determine this period
, interpolation of sample points in the vicinity of zero voltage is required to accurately identify two adjacent zero-crossing instants. Let the two sample points immediately above and below the zero-voltage level be denoted
and
, with corresponding voltage values of
and
, respectively. Then, a zero-crossing instant
can be determined as follows:
Let the time difference between the zero-crossing instants of two consecutive rising edges be
:
In this formula,
represents the zero-crossing instant of the subsequent cosine wave’s rising edge. If the number of teeth on the toothed disc is
, then the indexing angle
is
The rotational speed for the i-th tooth on the toothed disc is calculated as
The average of two consecutive zero-crossing instants is taken as the recording time for the i-th rotational speed measurement, i.e.,
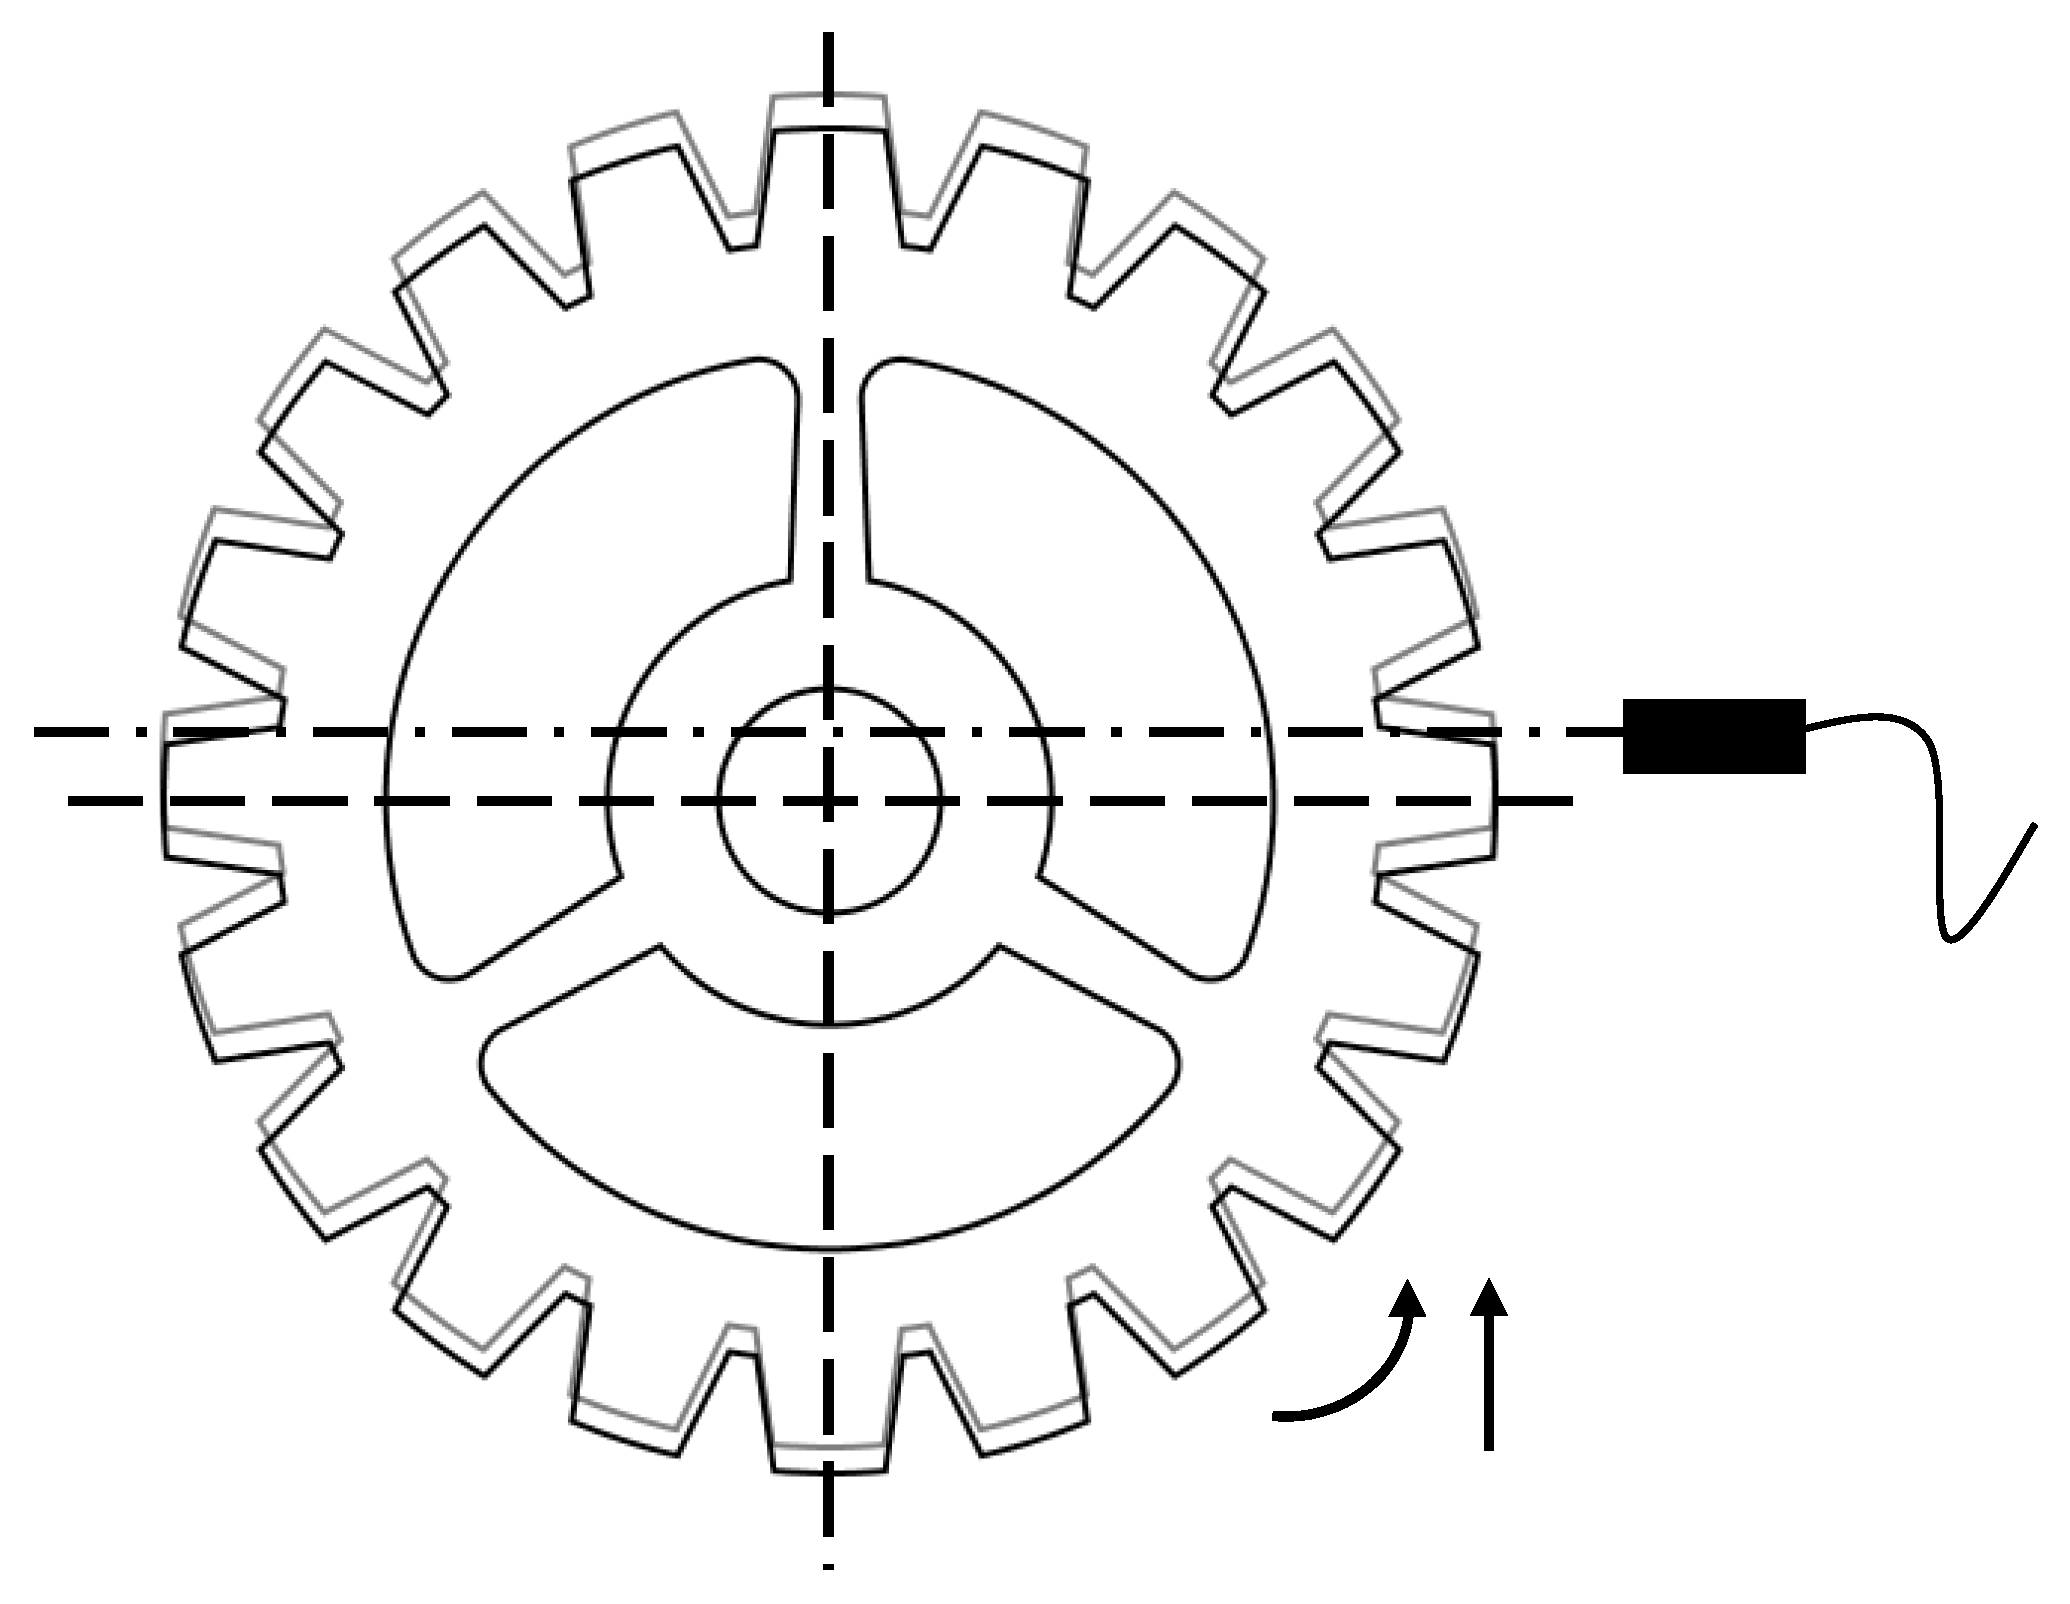
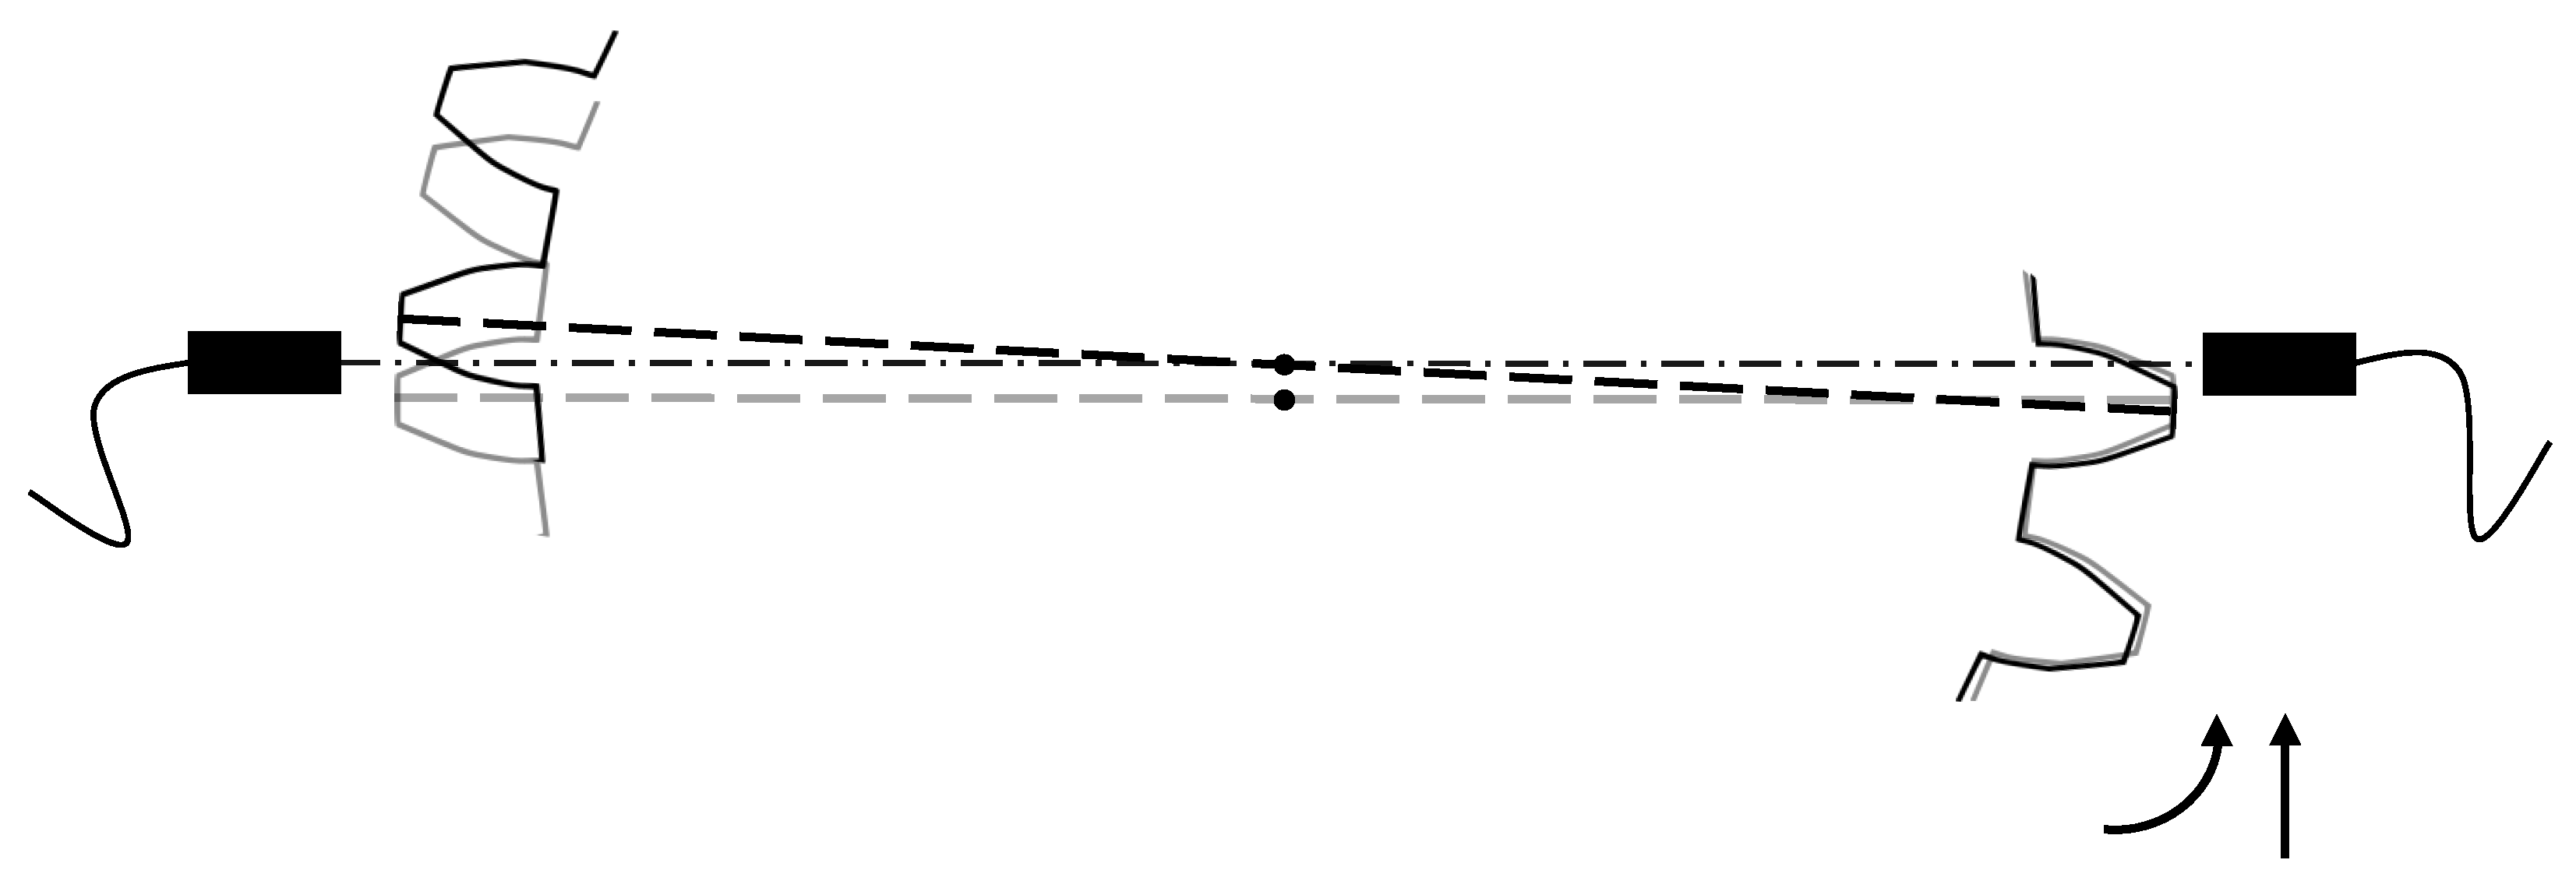
In practice, during the sampling process, the toothed disc undergoes a compound motion resulting from the combined effects of rotation and runout, as illustrated in
Figure 2. The frequency and amplitude of this runout are relatively random. Assuming its amplitude does not exceed the sensor’s detection range, the runout component primarily responsible for errors in speed measurement is that perpendicular to the sensor’s horizontal detection line. If the calculation relies solely on the time difference
and the toothed disc indexing angle
, the resultant rotational speed will contain spurious information introduced by the runout. In the following, a model is developed to analyze the mechanism by which runout introduces errors during the speed measurement process.
Assume the toothed disc rotates in the X-Y plane around the origin with an angular displacement
, accompanied by a small-amplitude random runout
:
Then, the time-varying coordinates of the k-th tooth in the plane can be expressed as
In this formula, R represents the pitch circle radius of the toothed disc. In this model, the instant the sensor records a tooth passing is considered equivalent to the tooth’s coordinate point crossing the positive
x-axis. Thus, when runout is present, the tooth coordinates must satisfy the following condition:
Consequently, when a tooth passes the
x-axis under the effect of this compound motion, the following equation holds:
In the absence of runout, this becomes
The relationship for the angle turned by a tooth is
That is, in the absence of runout, the angle turned between adjacent teeth
and
is
. When runout is present, the actual angle turned incurs an error due to
. Let the
x-axis crossing times for these teeth be
and
. Using a small perturbation approximation,
Subtracting the two equations yields the actual angle turned:
The angular displacement error is
Let the average rotational speed be
. Without runout, the time interval is
With runout, the actual angle turned is
, and the time interval is
The error contained in the time interval is
When
is such that
is non-zero, the time interval measured by the sensor includes errors caused by runout. The deviation between the calculated rotational speed
and the true rotational speed
is
Evidently, when the runout component is present and its value differs between two consecutive measurement instances that contribute to a speed calculation, it directly impairs the accuracy of the rotational speed measurement. In other words, toothed disc runout causes the tooth-passing times measured by the sensor to include uncertainties. This leads to deviations in the calculated rotational speed, which, in turn, affects the accuracy of assessing the system’s torsional vibration characteristics.
3. The Dual-Line Approximation Method for Mitigating Anomalous Rotational Speeds
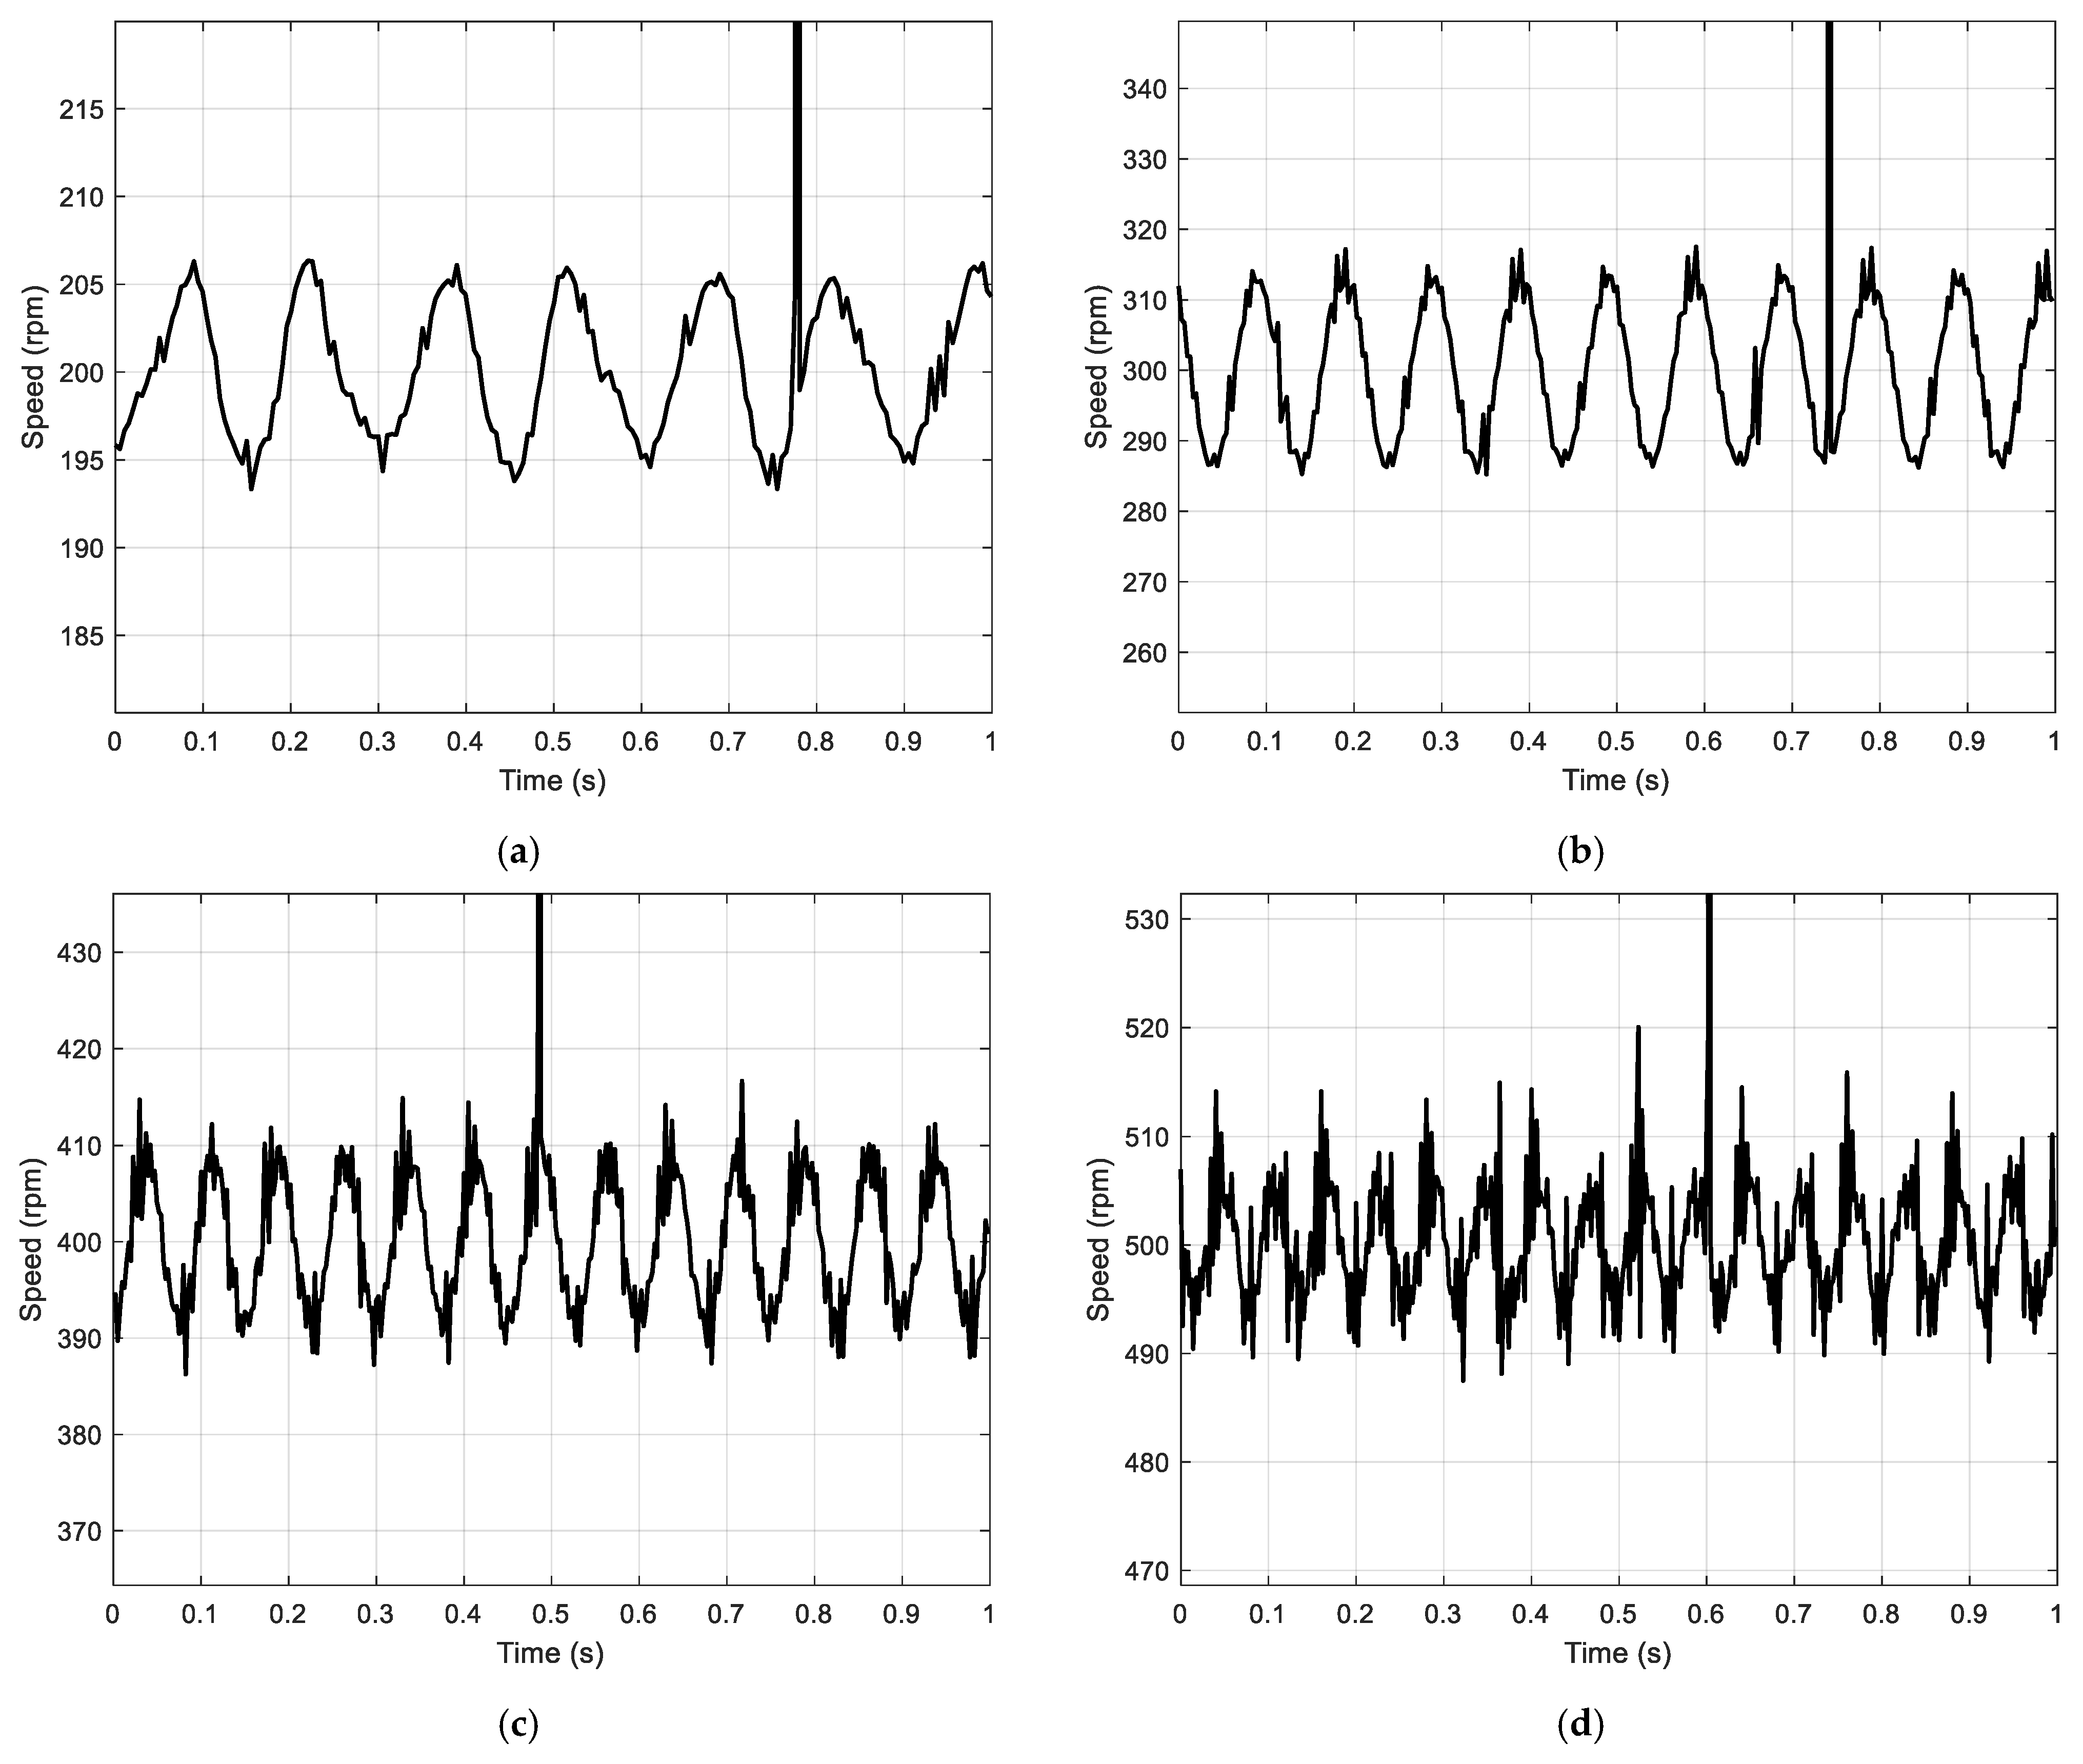
Concurrently, during the experimental process, anomalous rotational speeds, significantly exceeding the surrounding average speed, were observed in the recorded speed data, as depicted in
Figure 3. This indicates that random toothed disc runout, in addition to introducing macroscopic time-domain errors, also induces micro-level errors in the voltage signal, leading to the failure of the conventional zero-crossing detection method.
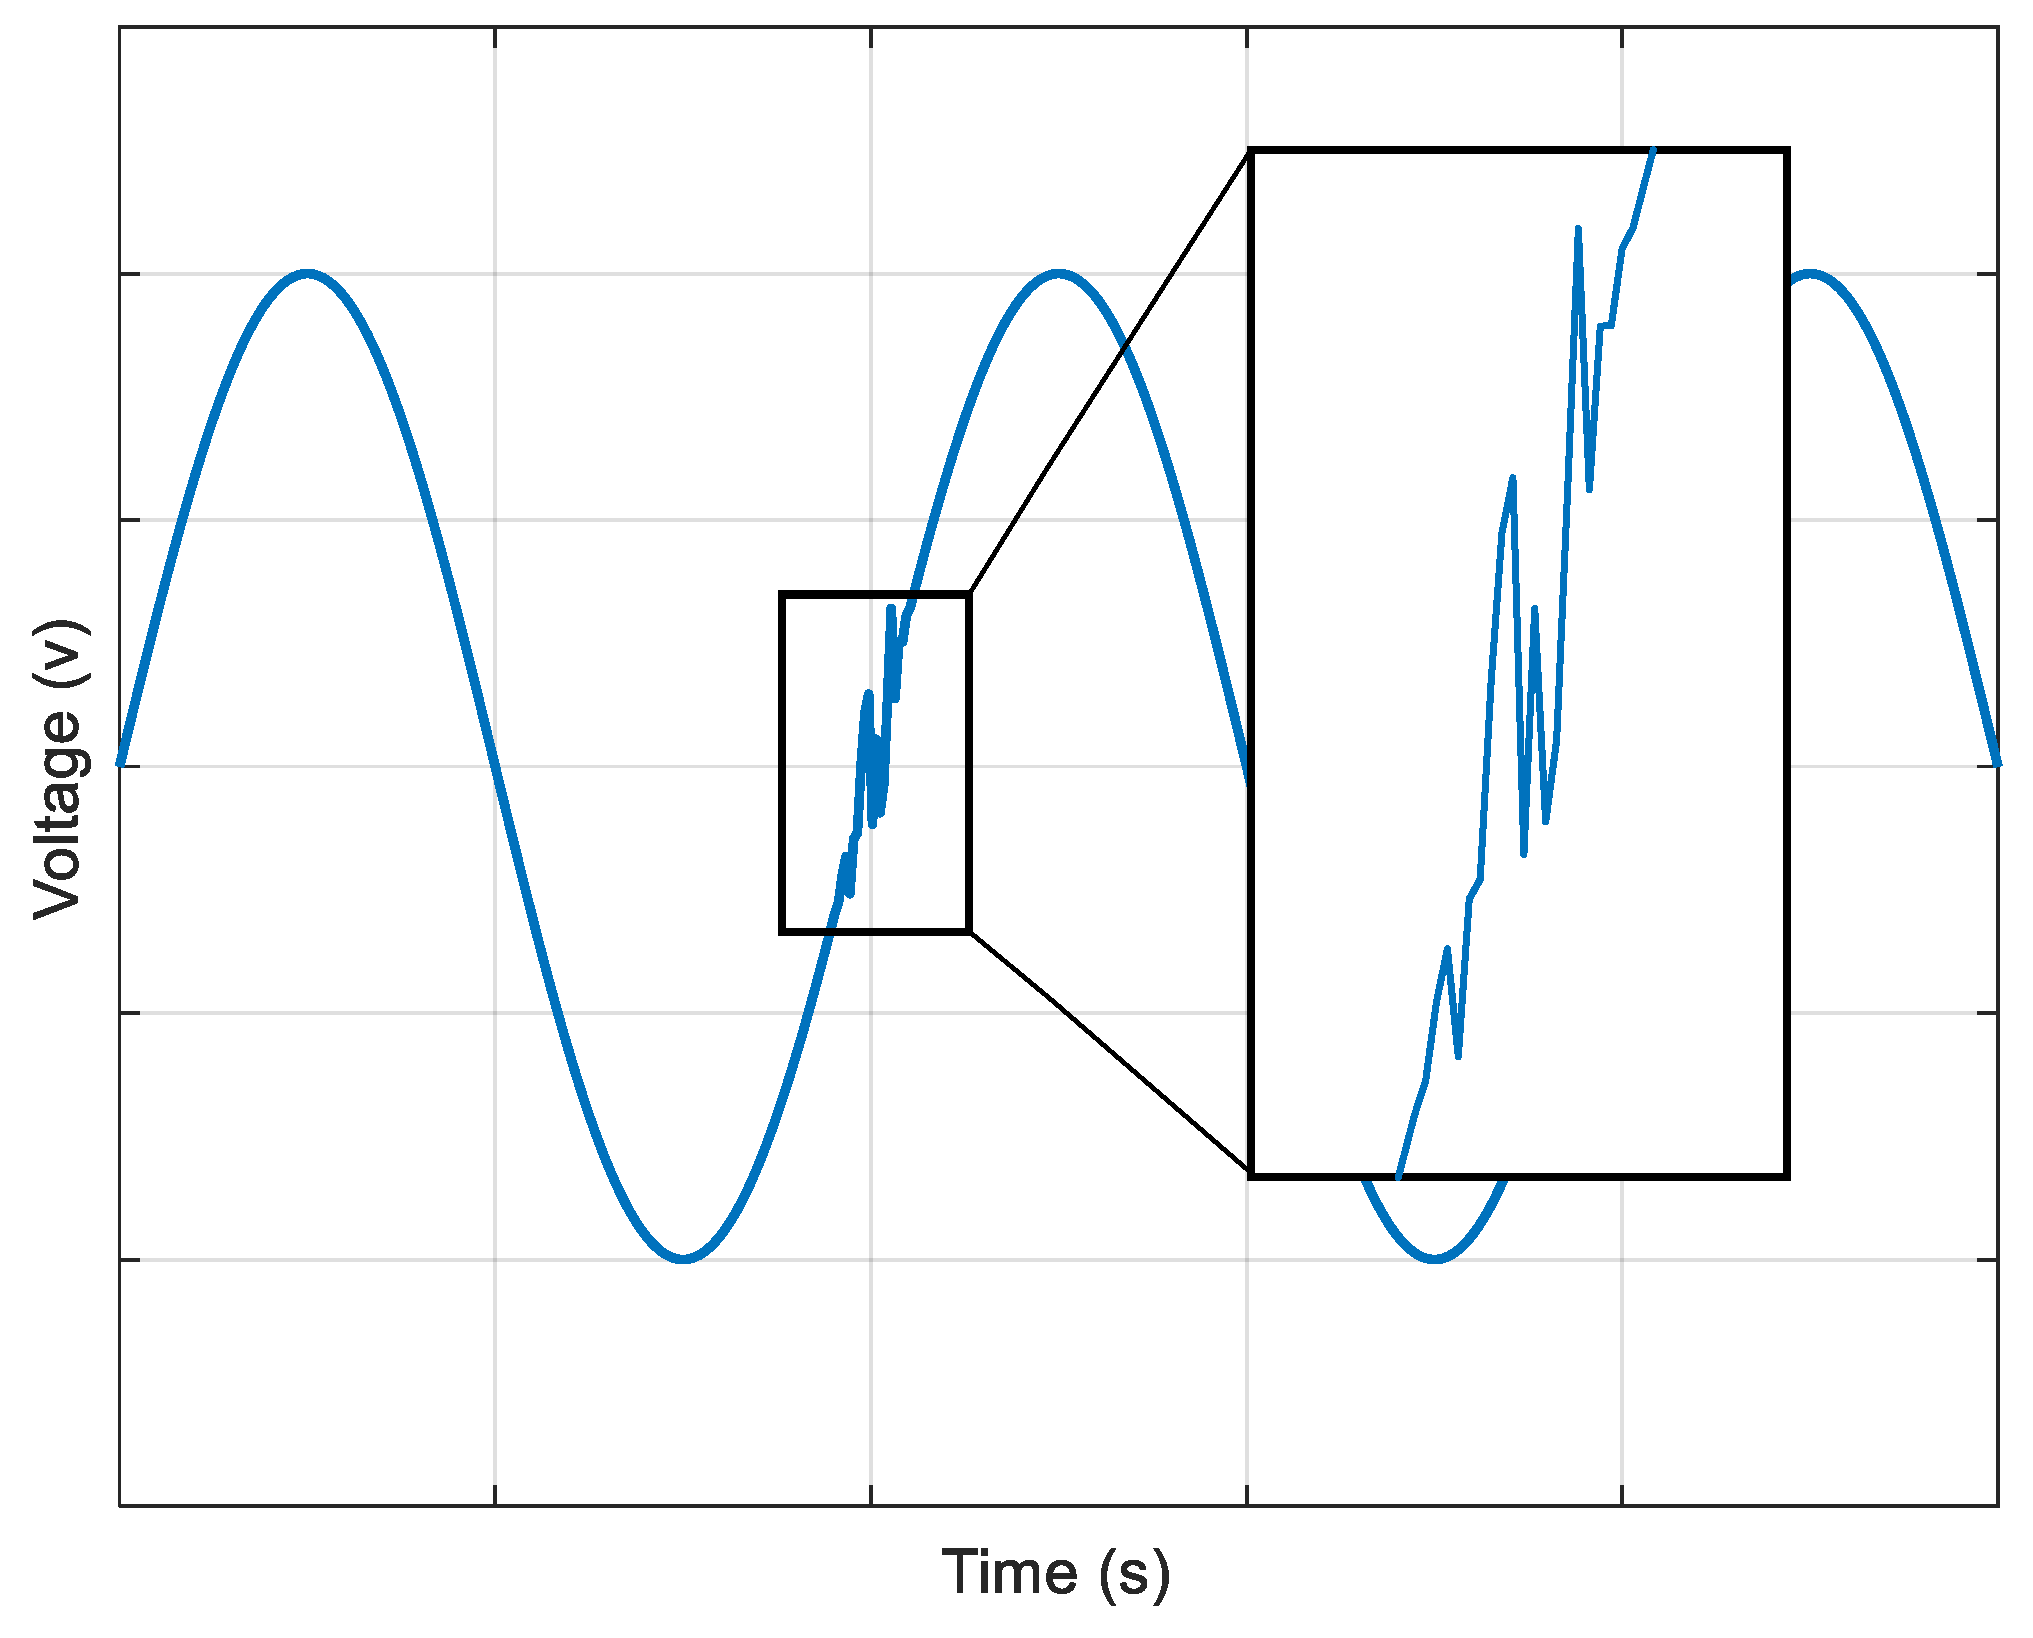
Observation of local voltage signals reveals that to ensure the precision of torsional vibration measurements, a high sampling frequency is required [
7,
9]. However, under the compound motion of rotation and runout of the toothed disc, the voltage acquired by the sensor frequently fluctuates around the zero-voltage level within very short time intervals, as illustrated in
Figure 4. Due to the brief duration between these anomalous points, the rotational speed calculated using the standard zero-crossing detection algorithm [
9] becomes severely distorted, consequently hindering the torsional vibration measurement process.
To overcome this issue of anomalous rotational speed calculation caused by toothed disc runout, this paper proposes a novel algorithm for extracting instantaneous rotational speed from the disturbed voltage signals. The dual-line approximation method, distinct from conventional zero-crossing sampling methods that strictly adhere to time-ordered calculations, differentiates data based on two parallel reference lines: a lower reference (base1) and an upper reference (base2). The principle of this partitioning is illustrated in
Figure 5.
During the processing, signals with potentials below the lower reference (base1) or above the upper reference (base2) are first filtered out. Subsequently, from the remaining data intended to capture a negative-to-positive zero-crossing, data points are monitored. The algorithm identifies the point immediately preceding the first detected transition from a negative to a positive potential; this preceding point is recorded as Point A. Similarly, for a positive-to-negative zero-crossing, data points are monitored, and the point immediately preceding the first detected transition from a positive to a negative potential is recorded as Point B. Lagrangian linear interpolation is then performed between Points A and B to determine Point C (the refined zero-crossing), thereby mitigating the influence of spurious data points between A and B. According to the interpolation theorem, this is given by
Thus, the algorithm achieves the extraction of zero-crossing time points from anomalous voltage signals, providing a reliable basis for rotational speed calculation. Compared to the traditional zero-crossing detection method, the dual-line approximation method effectively suppresses computational errors arising from voltage signal jitter around the zero-voltage level. This enhances the calculation precision of instantaneous rotational speed and exhibits superior computational efficiency when programmatically processing long sequences of voltage data.
4. Synchronous Sampling Method Based on the Differential Measurement Principle
Building upon the stable rotational speed calculation algorithm described previously, it is crucial to eliminate the interference in speed measurement caused by toothed disc runout, as analyzed in
Section 2. This paper develops an algorithm based on the differential measurement principle [
25,
26,
27], leveraging symmetry and the common-mode rejection characteristics of dual-channel signal acquisition to eliminate systematic errors [
6,
7,
9]. Based on the model described in
Section 2, an ideal speed measurement scenario is envisioned: the speed probe would no longer rely on time intervals and toothed disc indexing but could directly accumulate and record the angular displacement information of the rotating toothed disc. Rotational speed could then be expressed as the rate of change of angular displacement. Thus, at time t, the recorded angular displacement of the toothed disc on the positive
x-axis can be expressed as
Differentiating this yields the measured value of instantaneous rotational speed
, derived by
Under this hypothetical measurement condition, the measured instantaneous rotational speed consists of the true rotational speed
and an error term proportional to the rate of change of runout in the Y-direction. Now, consider simultaneous measurements on both the positive and negative x-axes. At the same instant t, based on geometric relationships, the angular displacement recorded on the negative
x-axis is
The instantaneous rotational speed
measured on the negative
x-axis is
Taking the average then yields
From the analysis above, it is evident that when the toothed disc moves in the positive y-direction,
The rotational speed perceived at the positive x-axis measurement point decreases , while that perceived at the negative x-axis measurement point increases , and vice versa. Evidently, irrespective of runout variations, the average of the instantaneous rotational speeds measured on both sides always equals the true rotational speed. Under actual sampling conditions, interpolation methods can be employed to approximate the aforementioned ideal speed measurement model by fitting an ideal rotational speed profile based on available speed information. By installing sensors on both sides of the toothed disc to synchronously acquire tooth-passing times and separately calculate instantaneous rotational speeds, the true rotational speed can be computed.
However, due to runout, a phenomenon occurs, as illustrated in
Figure 6; the recorded times for speeds acquired over the same measurement interval are not aligned between the two sensors, exhibiting a runout-induced time difference.
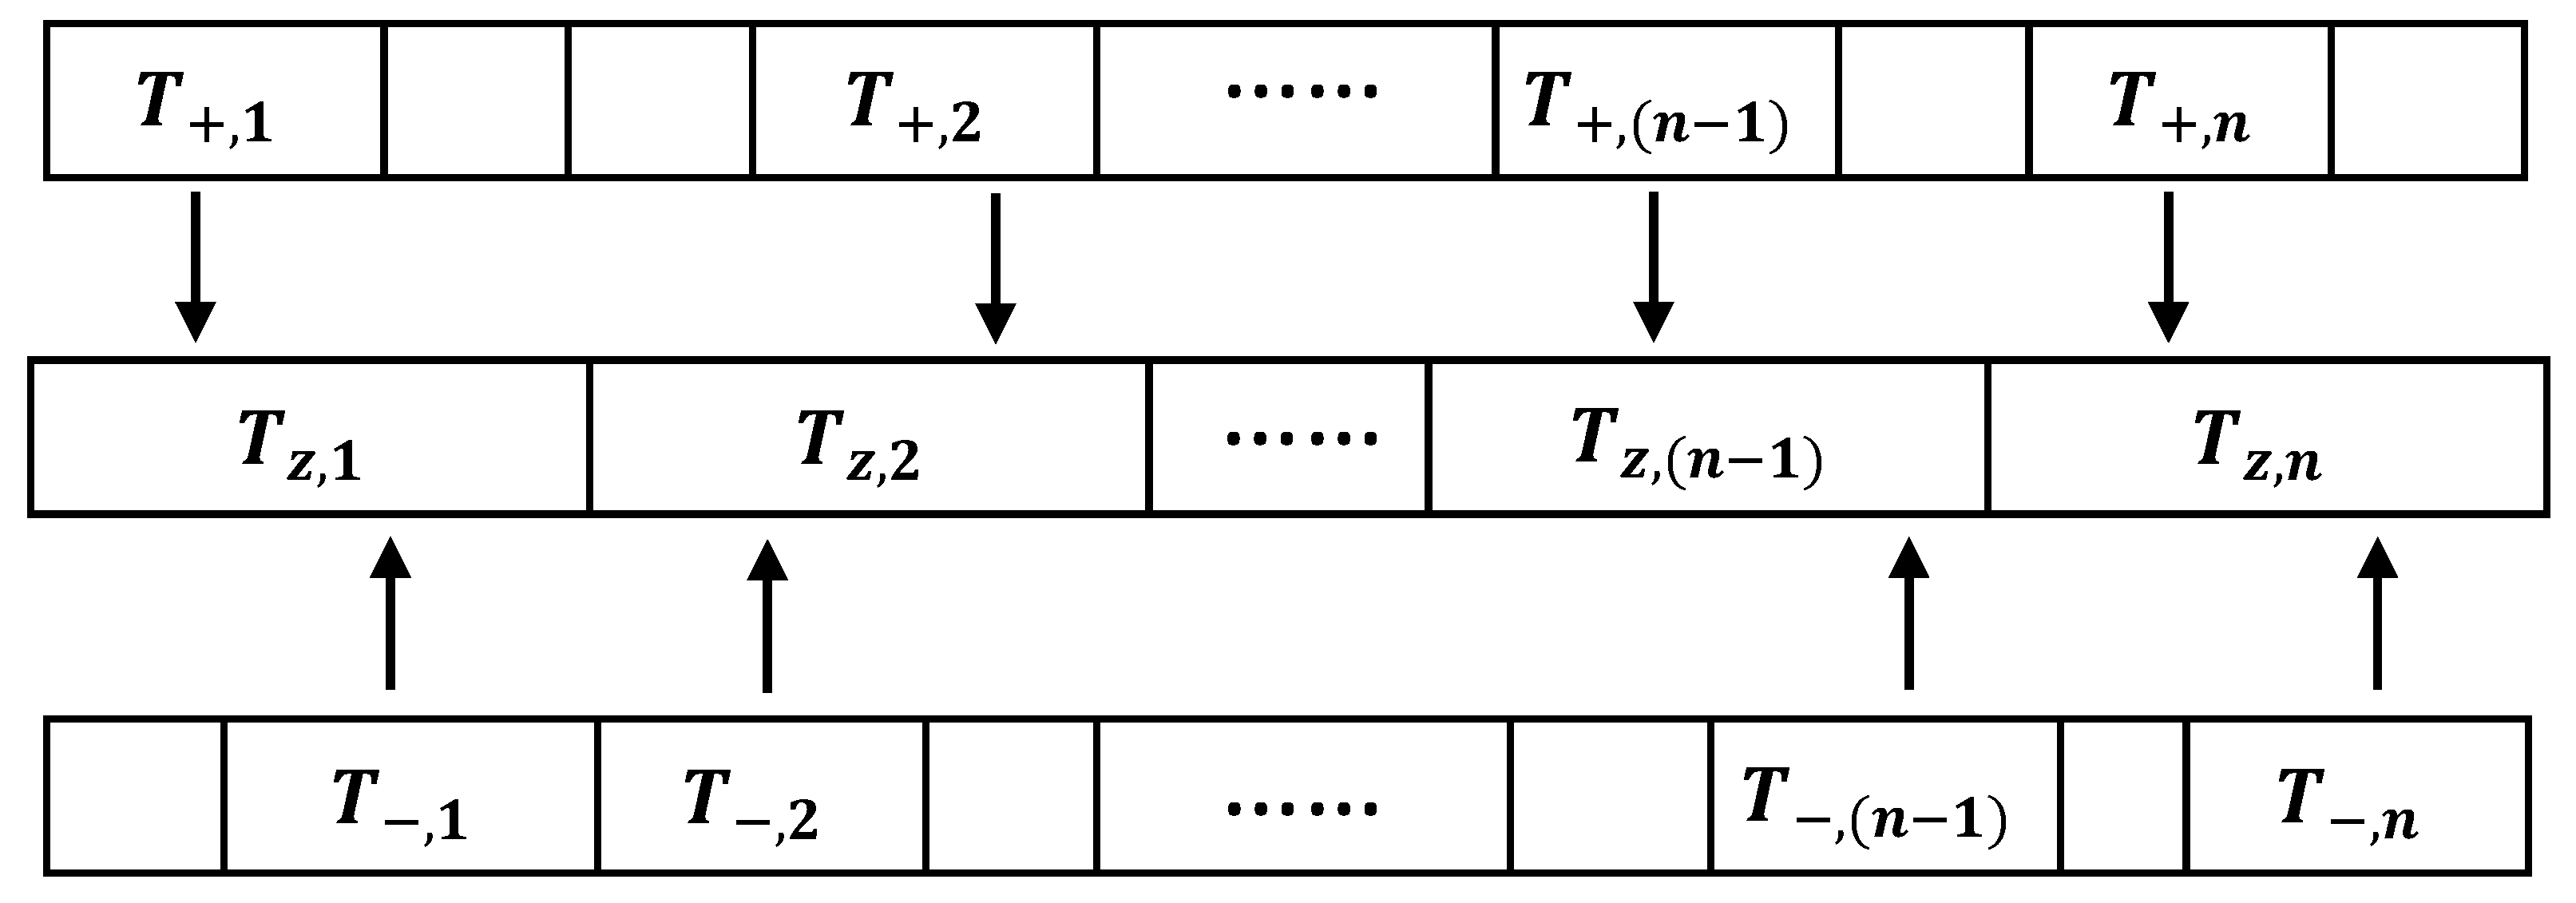
To enhance calculation accuracy, the two sets of rotational speed data must be time-aligned through mutually referenced interpolation. The midpoint of a pair of corresponding speed measurement times is taken as a new time point, and rotational speeds are interpolated with reference to these new common time points. Let the rotational speed–time series for the positive and negative x-axes be, respectively,
The midpoint time is taken as
A new common time series
is thus obtained. The process of creating a new time series is shown in
Figure 7.
Subsequently, the Lagrangian interpolation method is used to process rotational speeds from both sides. To interpolate the speed data from each sensor onto the new common time series
, appropriate original data points are selected based on the relative position of each new time point
with respect to its neighboring original time points in the series
or
. For instance, to interpolate the rotational speed for a new time point
that falls between original time points
and
(from one of the sensor’s original time series), the rotational speeds
and
corresponding to these original time points are used. This process is applied similarly for all other points, yielding the interpolated rotational speeds for each sensor,
and
, on the common time series
as follows:
The restored rotational speed is then calculated as
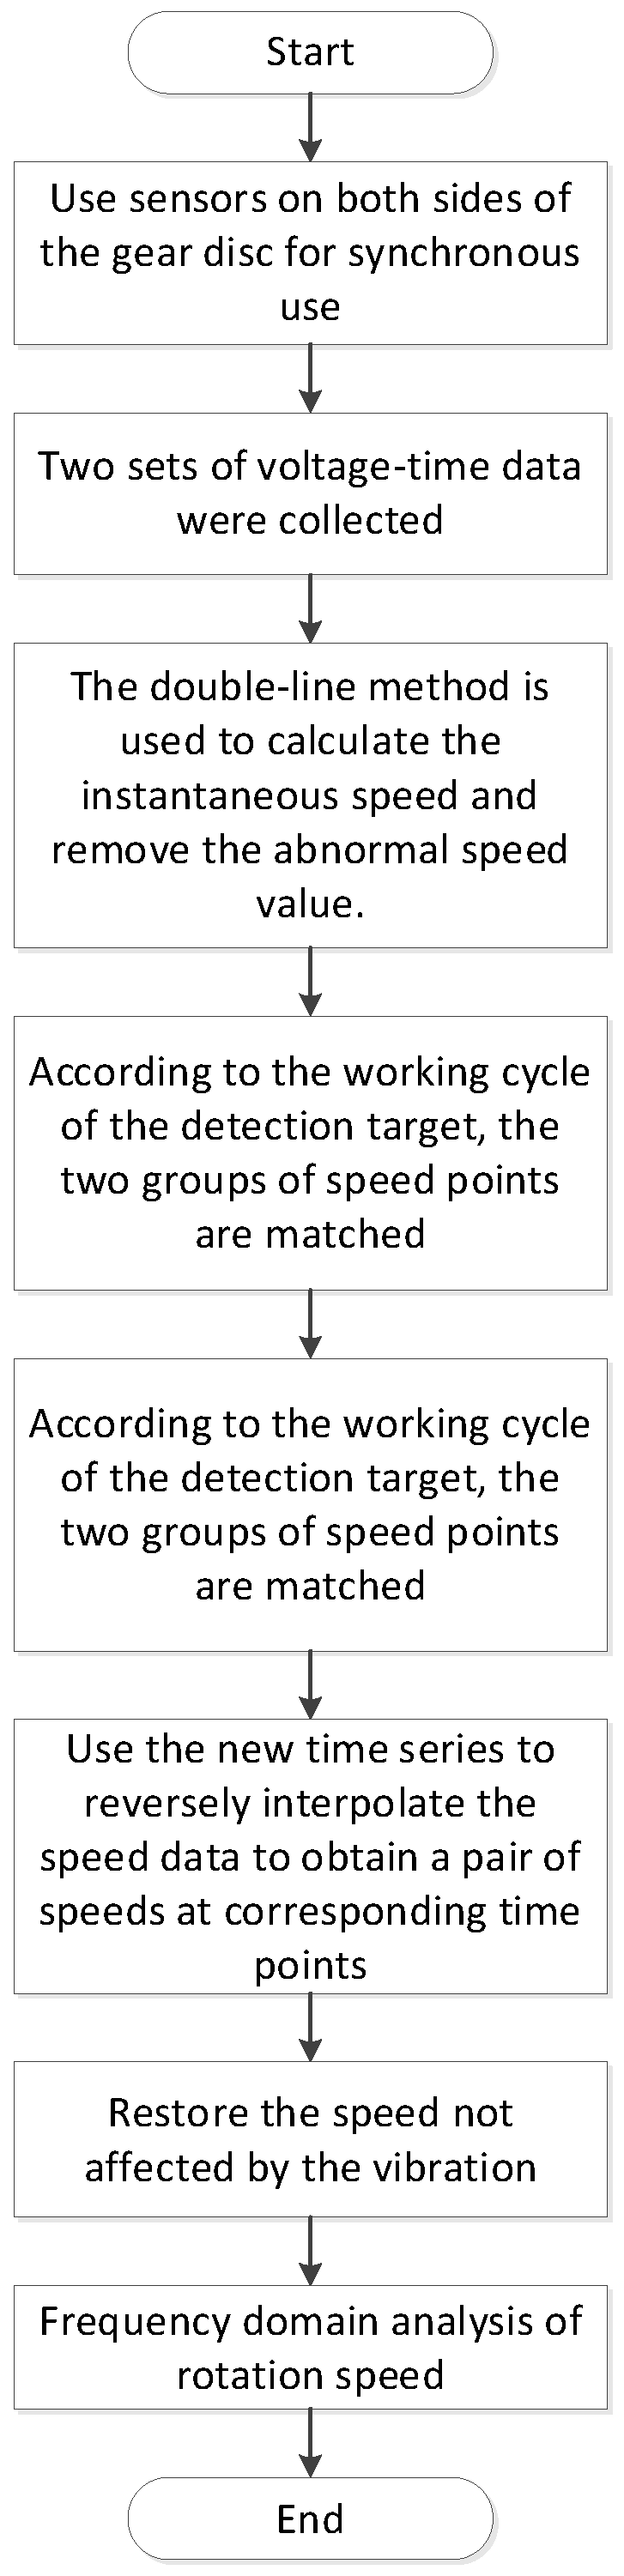
Thus, the algorithm completes the restoration of rotational speeds that were contaminated by errors due to toothed disc runout during the speed measurement process, effectively counteracting the errors introduced by runout into torsional vibration measurements. The complete workflow for mitigating runout interference in rotational speed processing is illustrated in
Figure 8. This flowchart clearly depicts the entire process, from the raw dual-channel voltage signals to the final optimized rotational speed signal. Compared to previous solutions, this method requires only the installation of one additional sensor and can be implemented using current high-performance data acquisition cards, making it more feasible. In terms of data processing, the method exclusively utilizes the acquired data for computation, thereby avoiding any loss of torsional vibration characteristics during the speed restoration process.
5. Experimental Validation and Analysis
5.1. Experimental Design
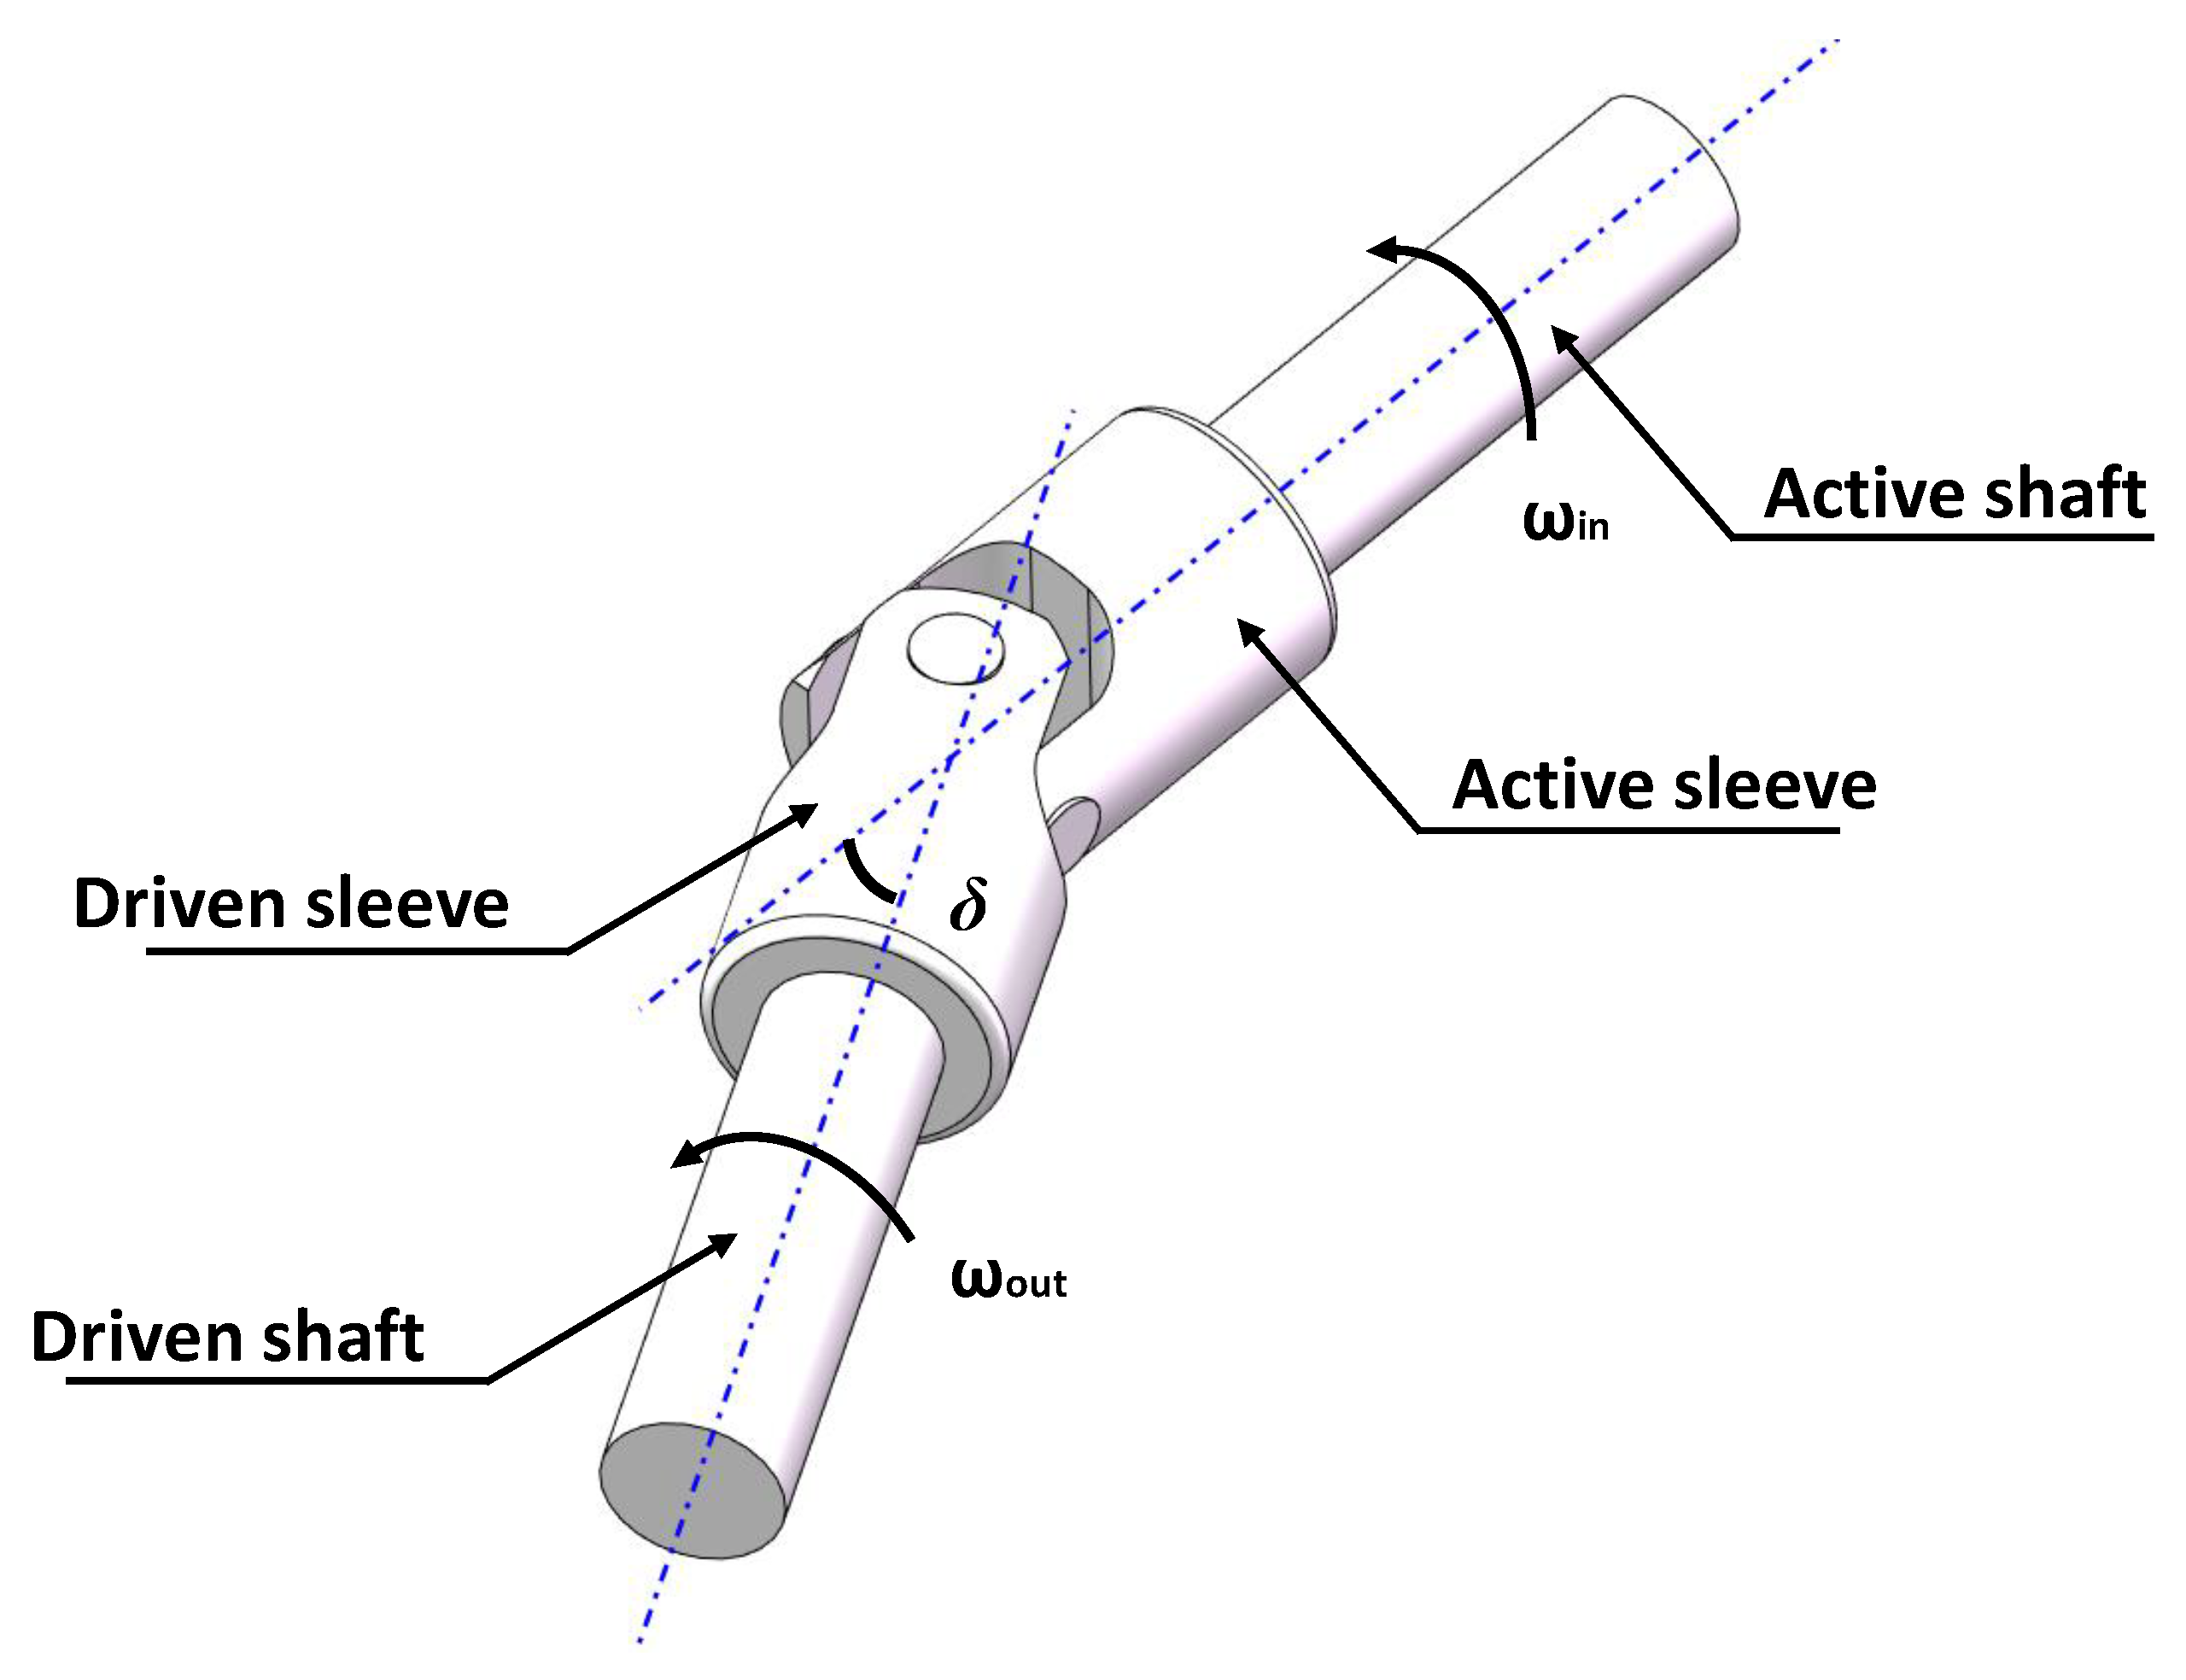
To validate the effectiveness of the algorithms described above, this study utilized a universal joint torsional vibration test rig. An experiment was designed to simulate the sampling conditions characterized by the rotational runout of the toothed disc. A universal joint enables the transmission of angular displacement between the input and output shafts [
28,
29]. The basic working principle of the universal joint is illustrated in
Figure 9.
The angle formed between the input and output shafts is defined as the joint angle
. Through theoretical analysis, the relationship between the input rotational speed of the driving shaft
and the output rotational speed of the driven shaft
can be obtained as follows [
30]:
According to Equation (33), given the preset driving shaft rotational speed and the universal joint angle, the theoretical output rotational speed curve can be calculated. This curve serves as a baseline in subsequent experiments to evaluate the effectiveness of the proposed algorithm in rotational speed restoration.
The schematic of the universal joint torsional vibration test rig is illustrated in
Figure 10. Its main components, including the motor, universal joint driving shaft, universal joint driven shaft, and sensors, are mounted on a base platform via vertical mounting plates, ensuring the planarity of the transmission axis. The test rig is driven by an electric motor, whose rotational speed is controlled by a servo controller. The motor’s output shaft is connected to the driving shaft of the universal joint via a flexible coupling. The driven shaft, following the universal joint, is connected to the speed-measuring toothed disc. Both the driving and driven shafts are supported by bearings mounted on their respective mounting plates. Each mounting plate is precisely positioned and vertically connected to the base platform using a pinhole fit to ensure alignment. A pair of eddy current sensors for torsional vibration measurement are installed on the final mounting plate. The mounting plate for the driven shaft and the sensor bracket mounting plate are affixed to a turntable. This turntable, situated on the base platform, can be rotated within a defined angular range and features an angular scale. By rotating the turntable to the desired scale marking, the joint angle of the Cardan universal joint can be quantitatively adjusted.
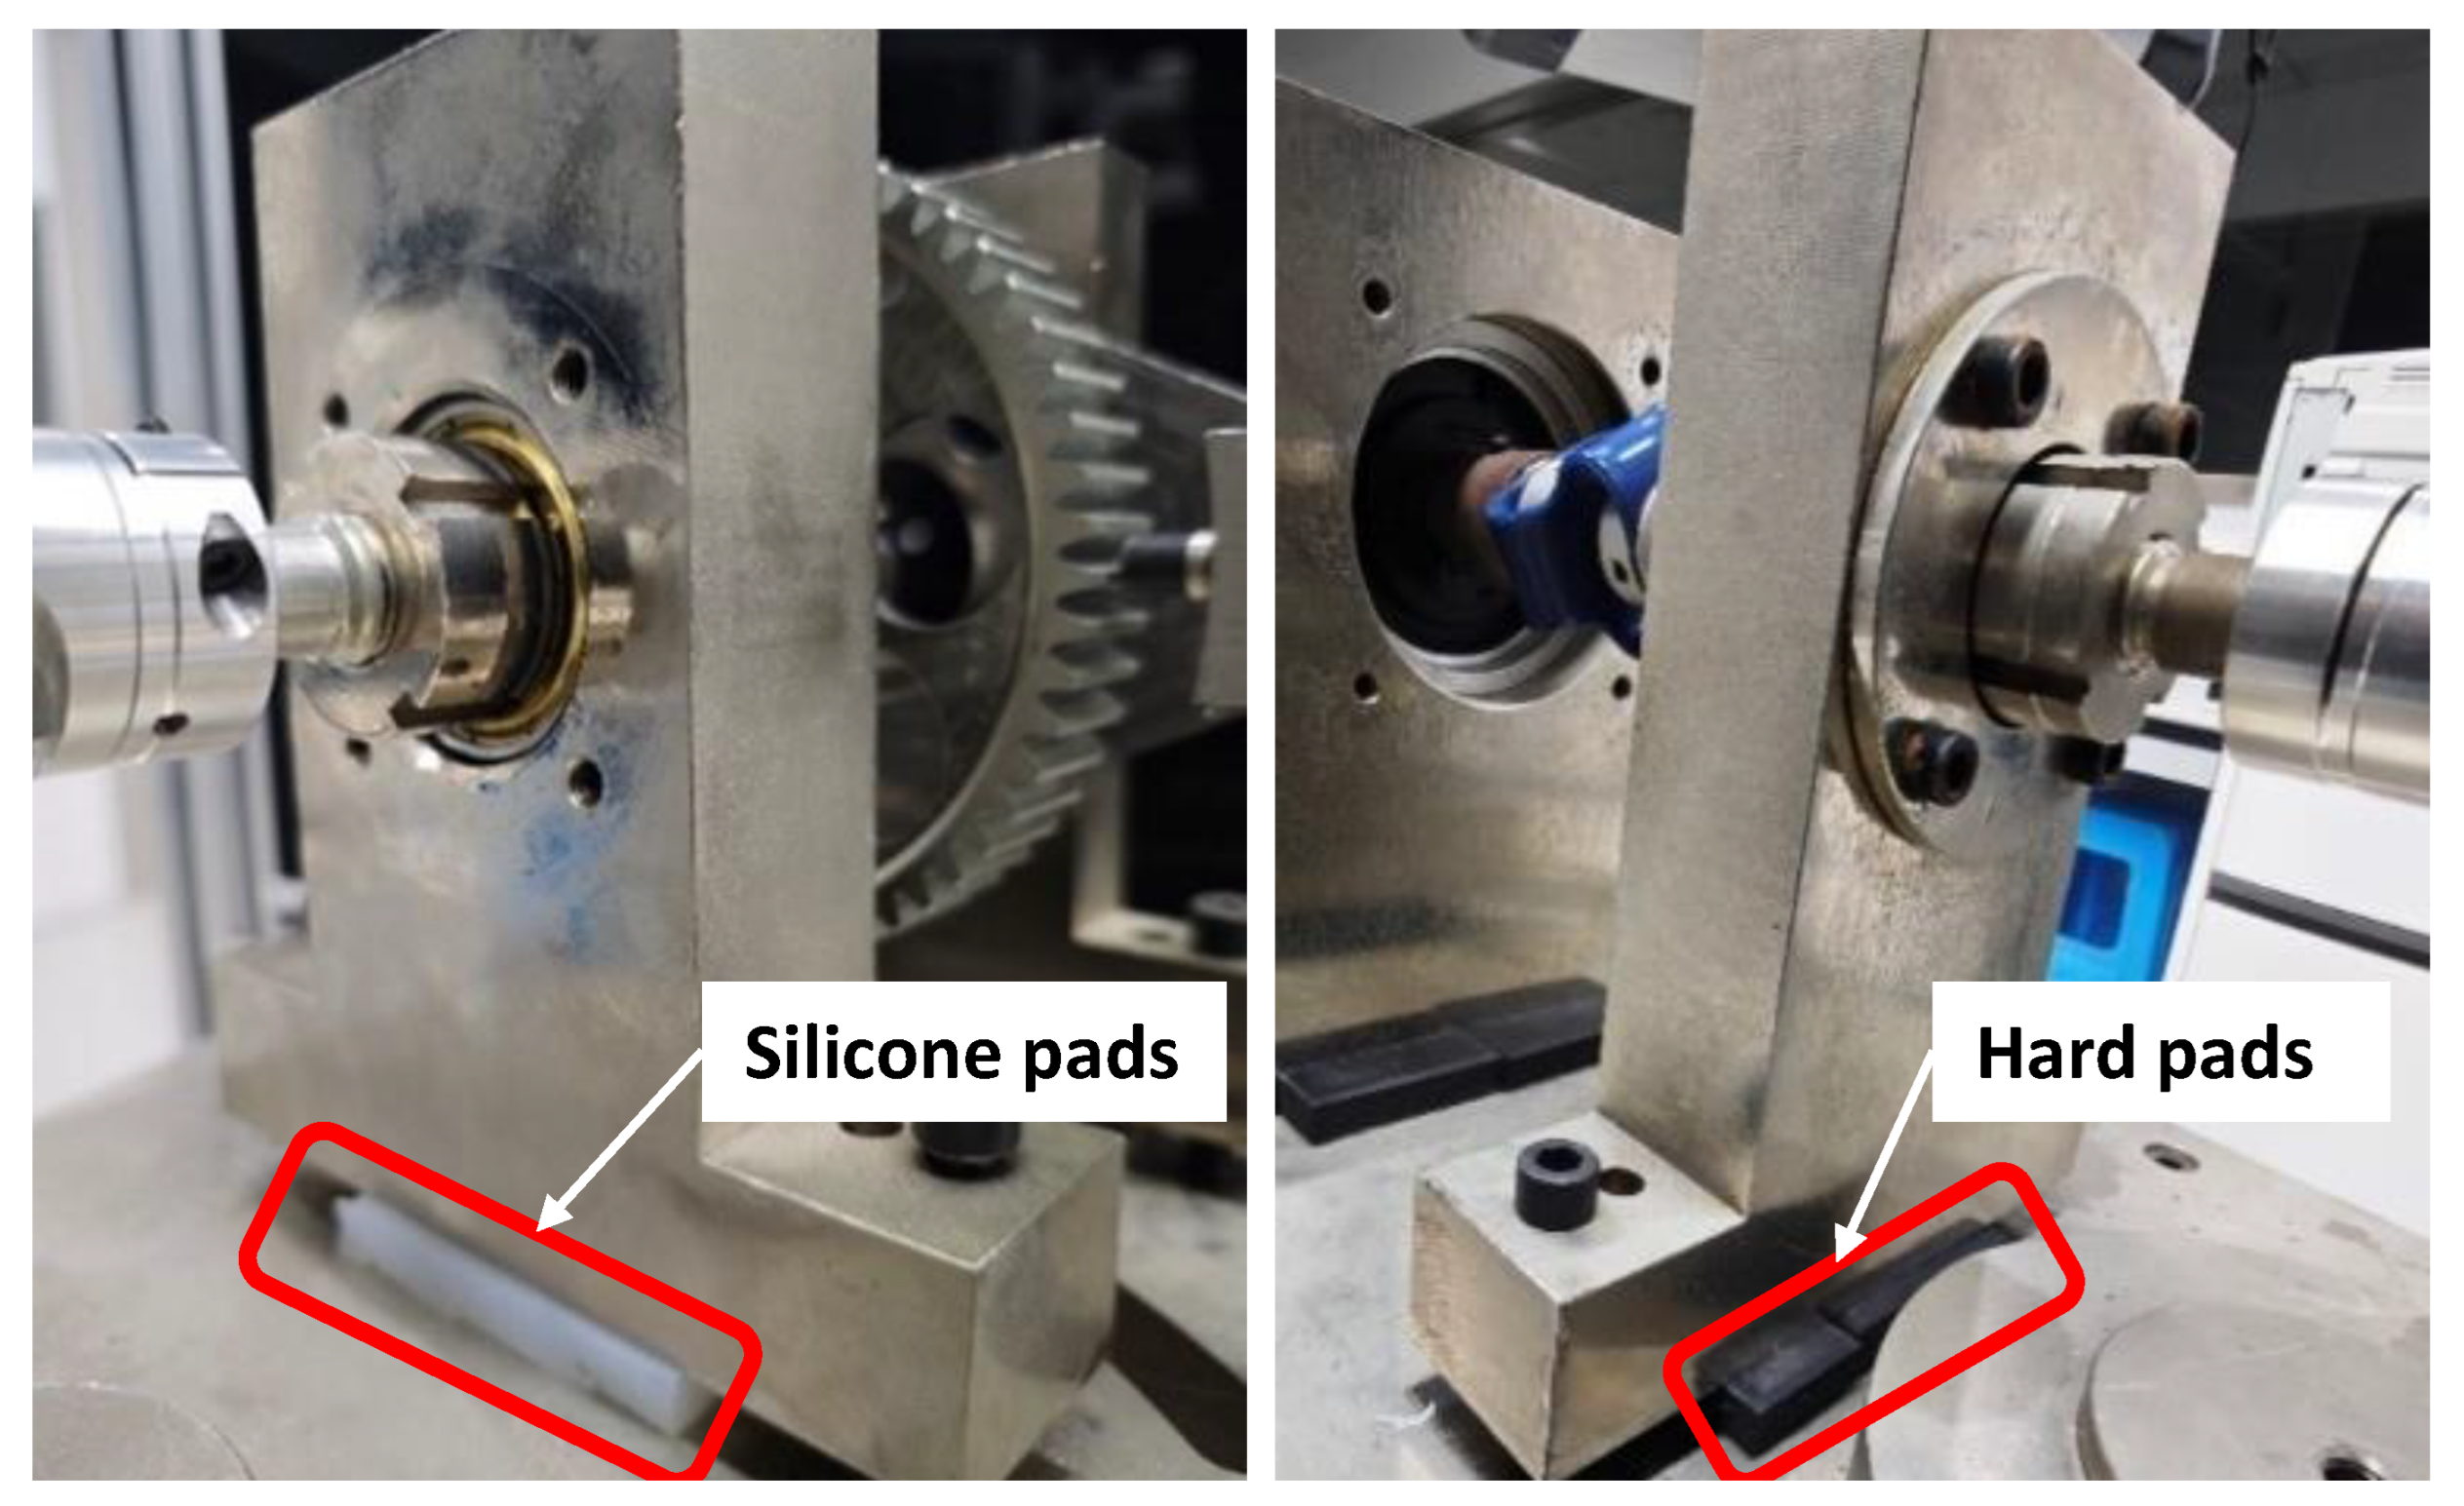
As illustrated in
Figure 11, to simulate the random runout phenomenon of the toothed disc, flexible silicone pads were placed beneath the driven shaft mounting plate. All other mounting plates and the shaft mounting plates were correspondingly shimmed to maintain alignment. Leveraging the elasticity of these silicone pads, the rotational motion of the shaft induced a simultaneous random micro-runout of the toothed disc in the vertical direction.
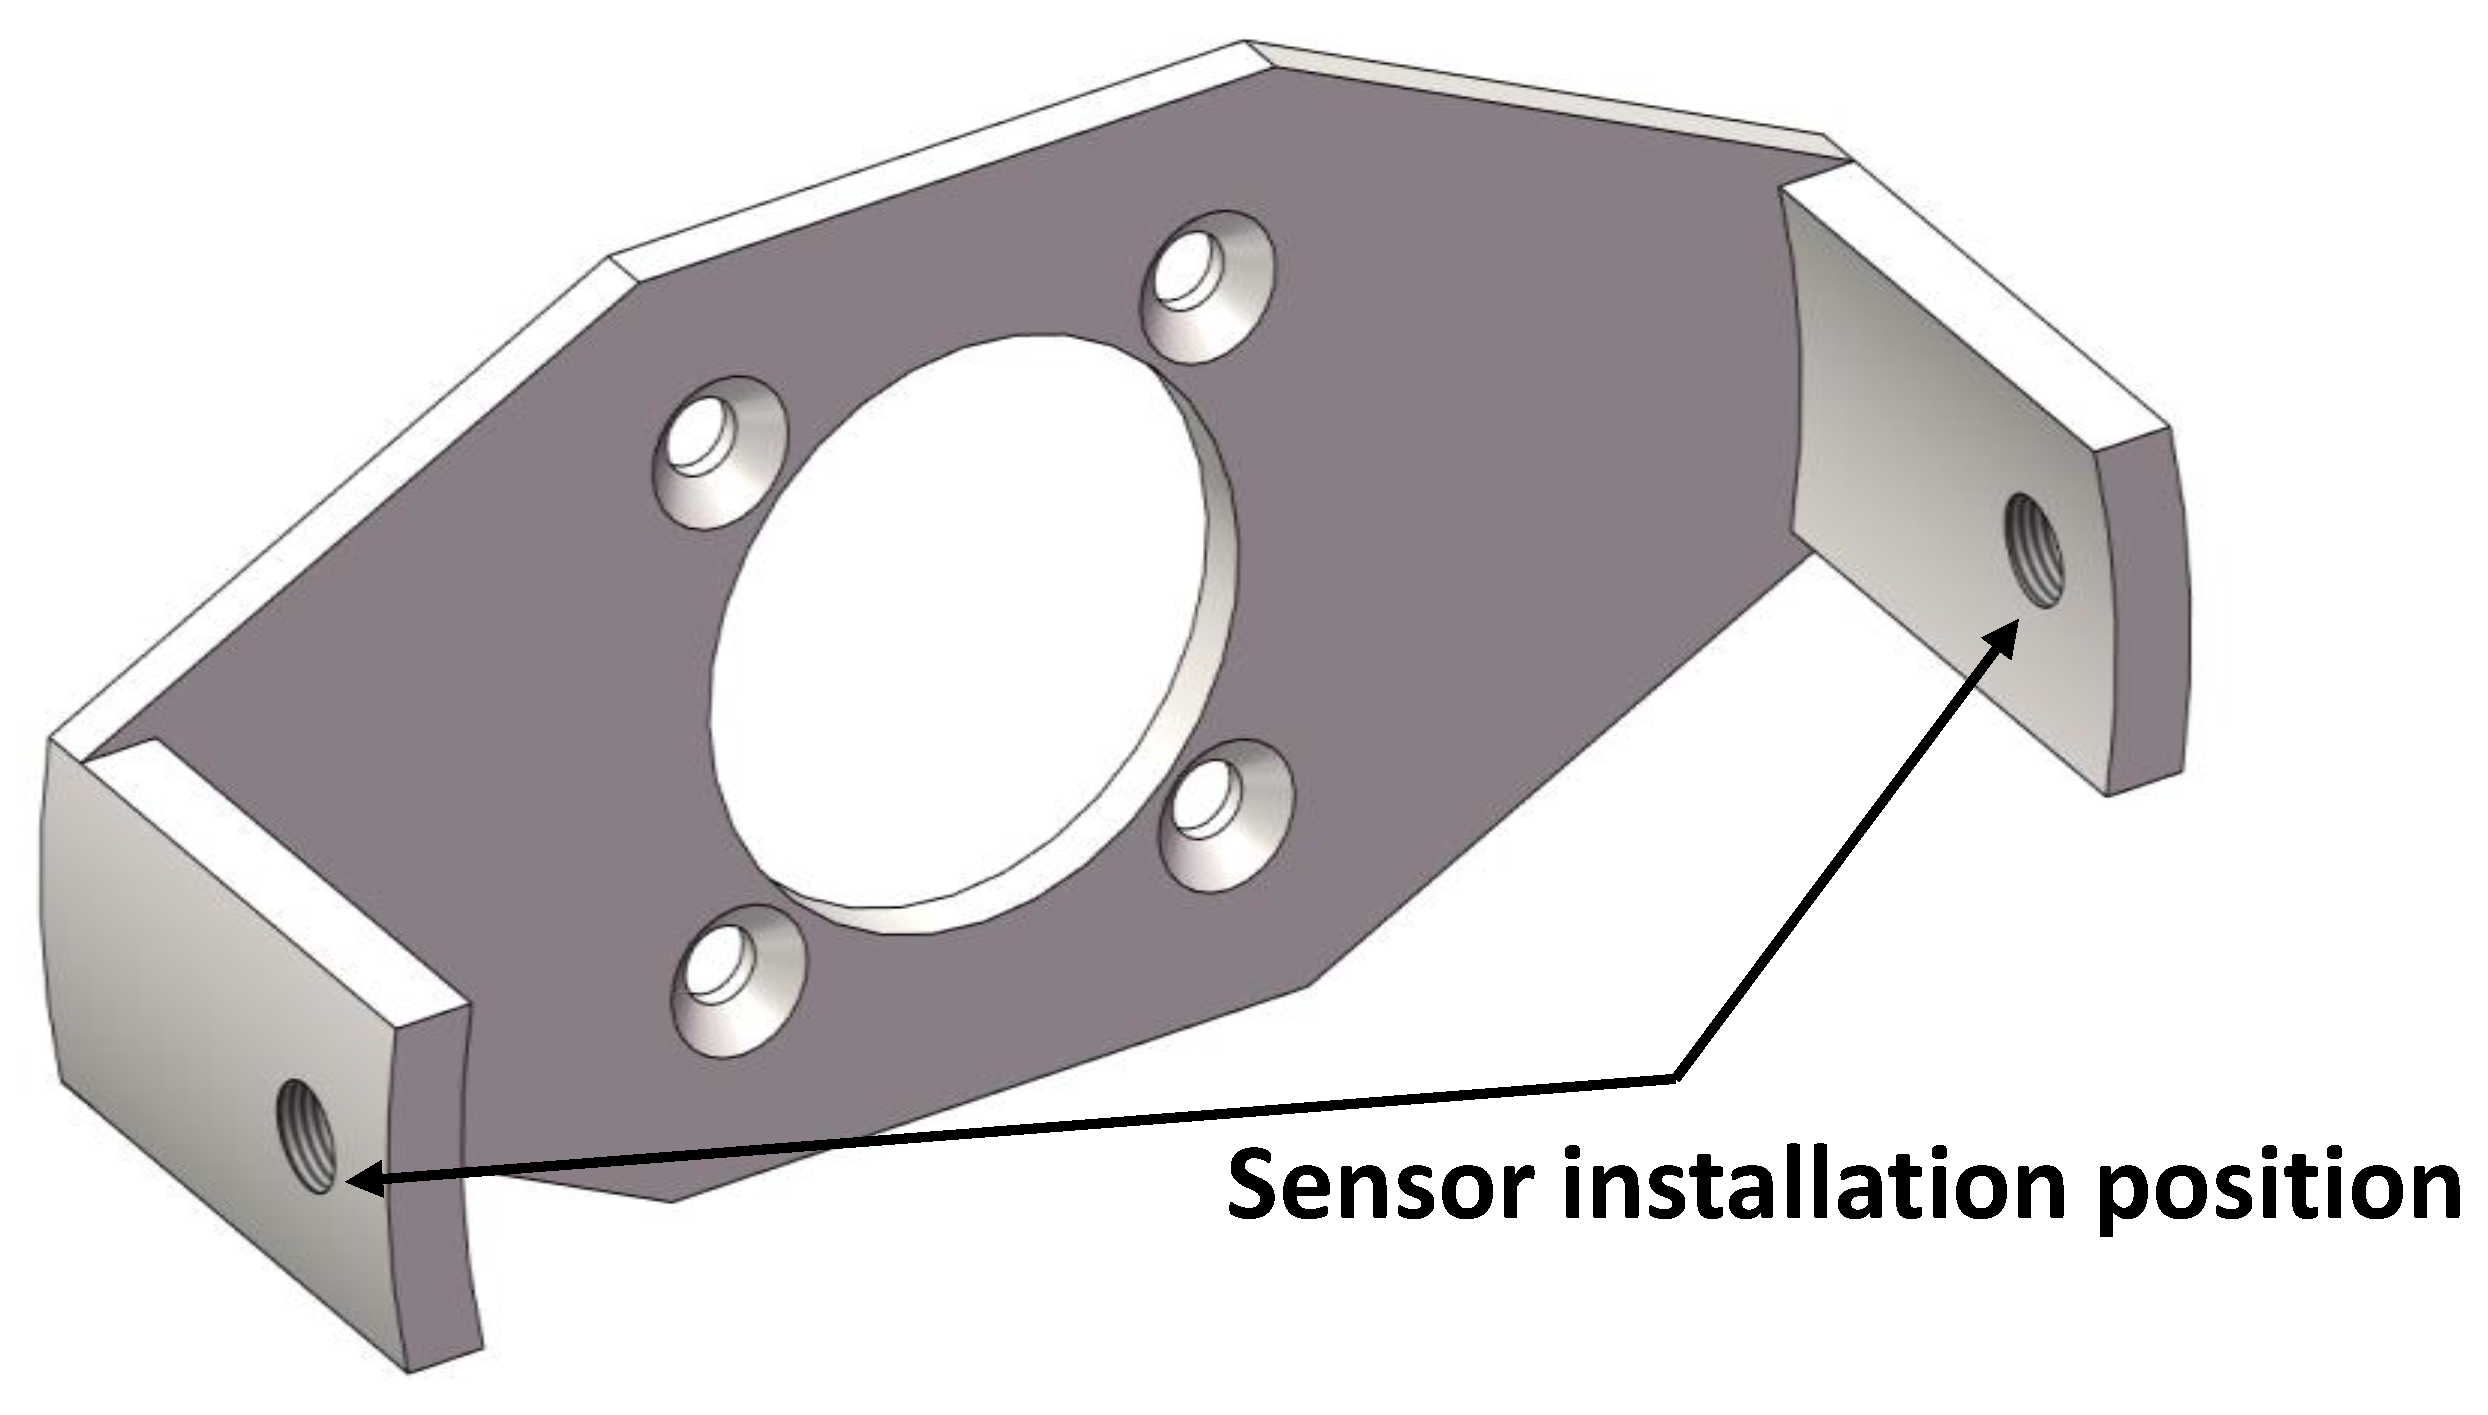
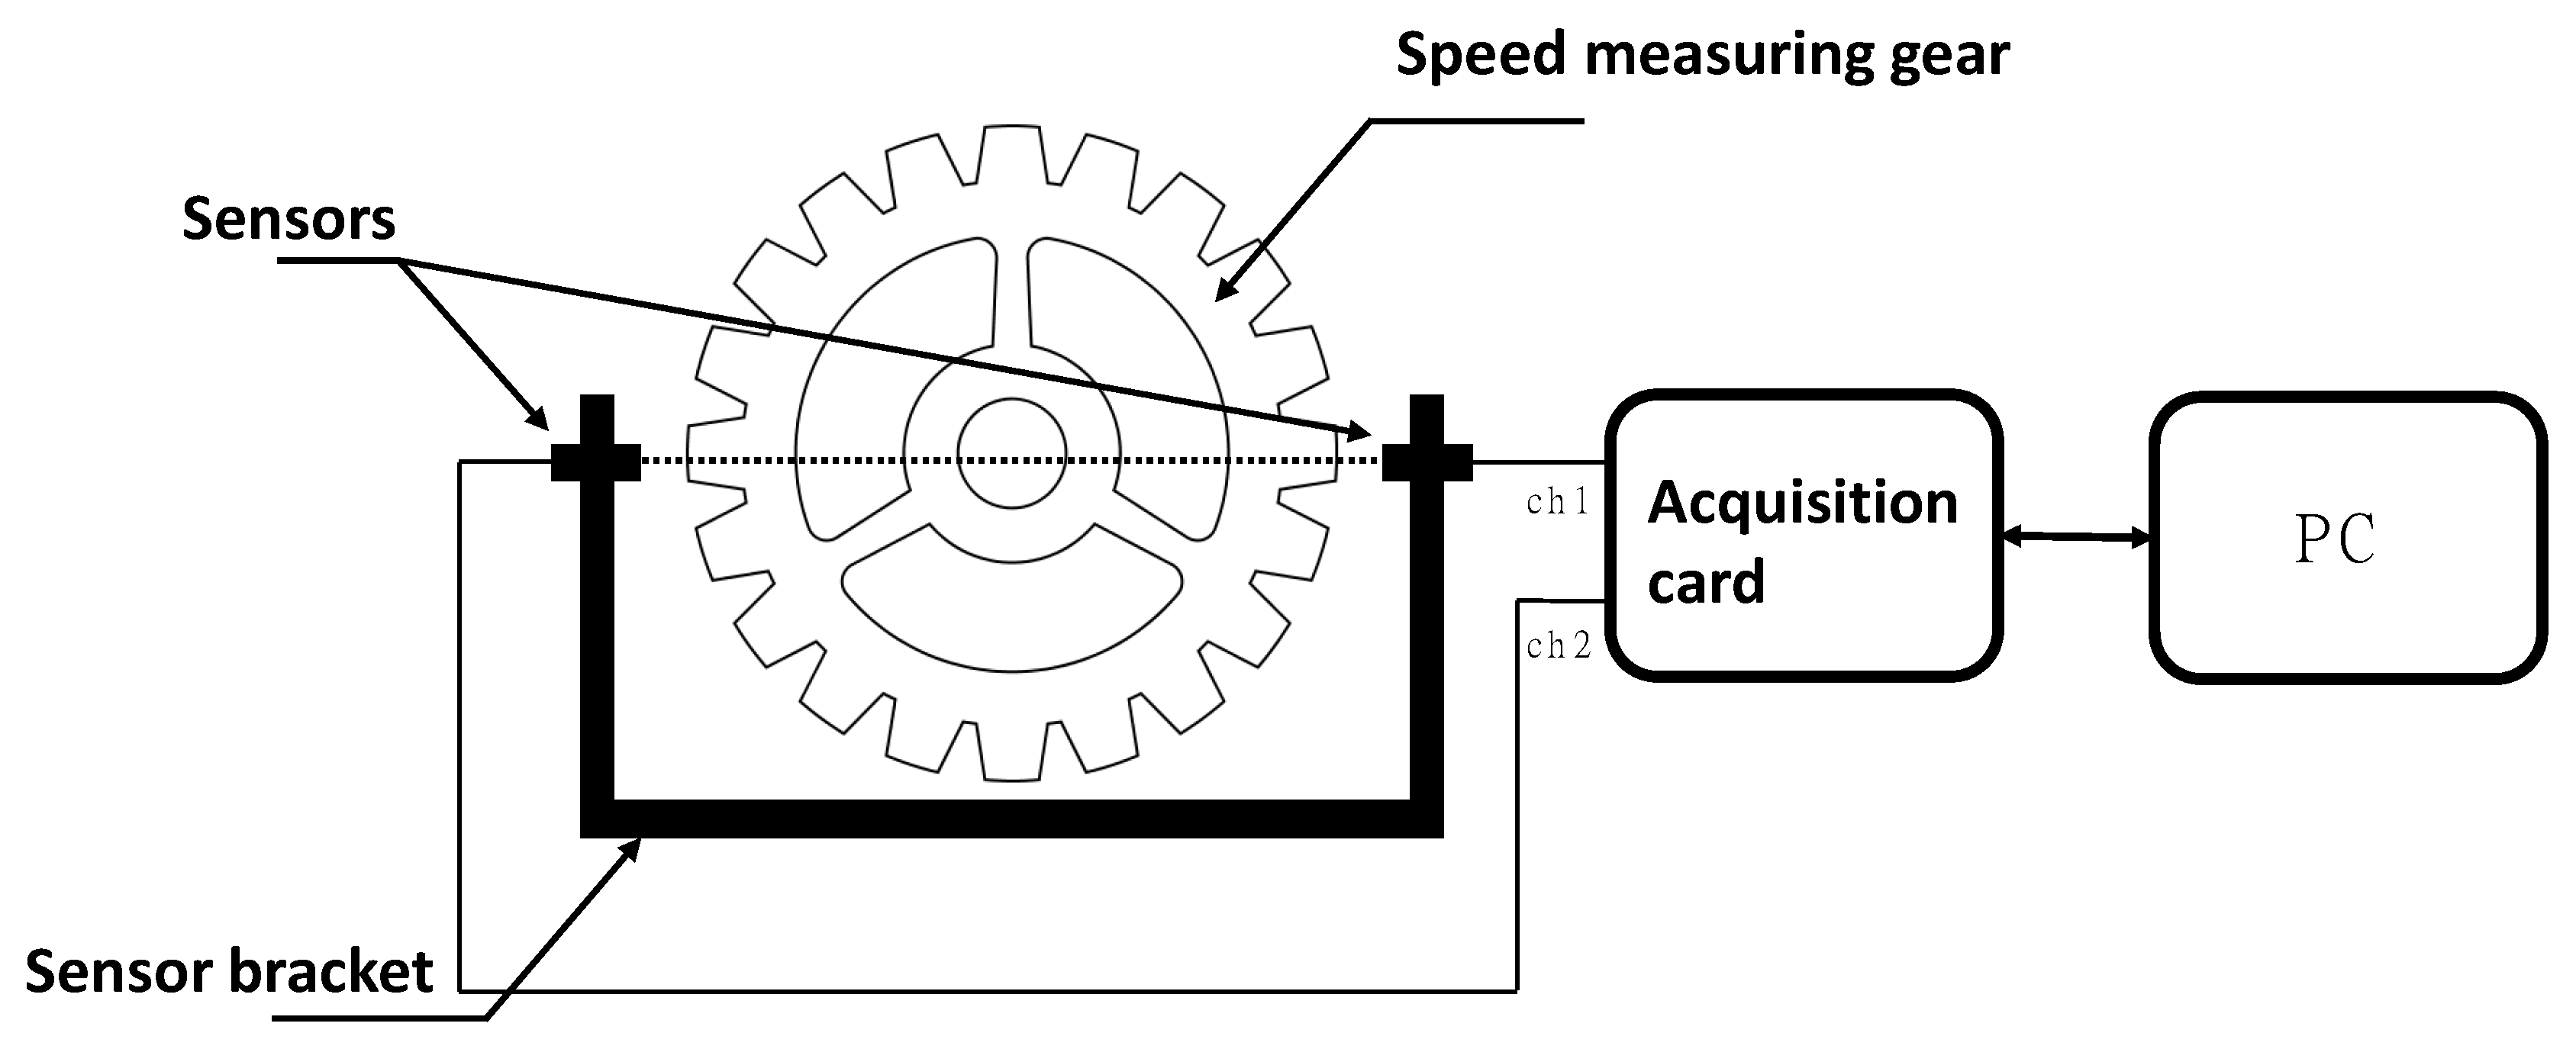
The mounting precision of the pair of sensors used for synchronous sampling is ensured by a custom-designed sensor bracket, whose coaxial accuracy is controlled through integral machining. A 3D model of the sensor bracket is depicted in
Figure 12. A data acquisition card records the voltage signals from the two sensor channels as digital information, which is then transmitted to a PC for subsequent processing using a dedicated program. The hardware architecture of the torsional vibration measurement system is illustrated in
Figure 13.
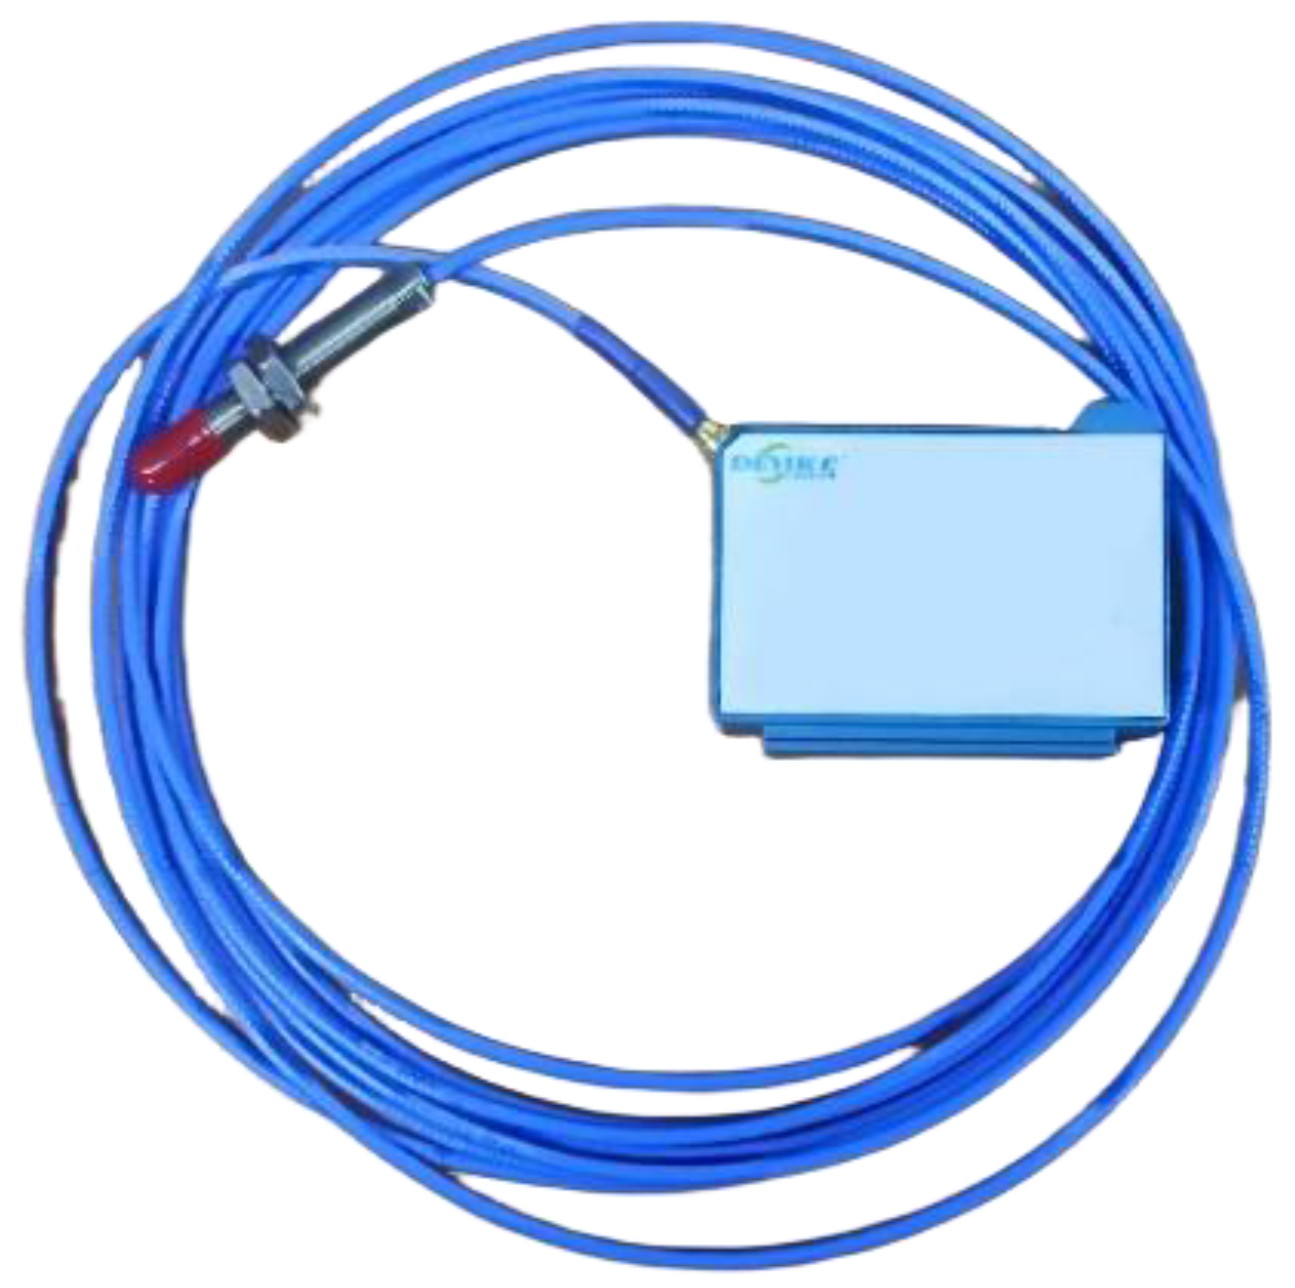
The key equipment and its specifications used in the experimental setup are listed in
Table 1 and
Table 2 and
Figure 14 and
Figure 15. The DK960 eddy current sensors (DEYIKE Sensing Instruments, Wuxi, China) were selected for their high-frequency response and precision in detecting small displacements. The ART-USB-2872C data acquisition card (Art Technology, Xi`an, China) provides high-speed, synchronized multi-channel sampling, which is essential for the synchronous sampling method.
To evaluate the algorithm’s robustness against interference under varying runout conditions, the universal joint angle was set to 15°, a typical value used in such test rigs to induce a clear second-order torsional vibration for analysis without causing excessive mechanical stress. To evaluate the algorithm’s robustness, the motor’s input speed was set to 200, 300, 400, and 500 RPM. This range represents typical low-to-medium operating speeds for the target applications (e.g., marine auxiliary engines). Moreover, testing across a range of speeds allows for the observation of how runout interference characteristics might change, particularly if certain speeds excite natural frequencies of the test rig structure, leading to varied runout severity as observed in our results.
Following the initialization of all electronic components of the test rig, the universal joint angle was adjusted and secured. The toothed disc was then slowly rotated to ensure the sensors were operational, and the zero-voltage offset of the two eddy current sensors was calibrated using the data acquisition software (ART Device Managerment & Configuration Tool v1.8.32). Once these preparatory steps were completed, data acquisition commenced. The recorded dual-channel voltage data files were saved for subsequent processing and analysis.
5.2. Time-Domain Analysis
First, the rotational speed was calculated directly from the tooth signals obtained in the torsional vibration measurement experiment using the zero-crossing detection method. This revealed anomalous fluctuations in the rotational speed, as illustrated in
Figure 3. The dual-line approximation method was then applied to calculate the rotational speed signal. The resulting rotational speed is shown in
Figure 16. It can be observed that the application of the dual-line approximation method successfully overcame the spurious data points in the signal and eliminated the anomalous rotational speed values.
An observational analysis of the rotational speed acquired from a single sensor revealed the following at various motor speeds:
- (a)
Under the same joint angle, different input speeds from the driving shaft resulted in distinct rotational speed fluctuation trends. These trends were broadly consistent with the theoretical rotational speeds calculated using Equation (33).
- (b)
Runout-induced fluctuations in rotational speed were evident in all cases. More severe runout of the toothed disc during the experiment corresponded to more pronounced rotational speed fluctuations.
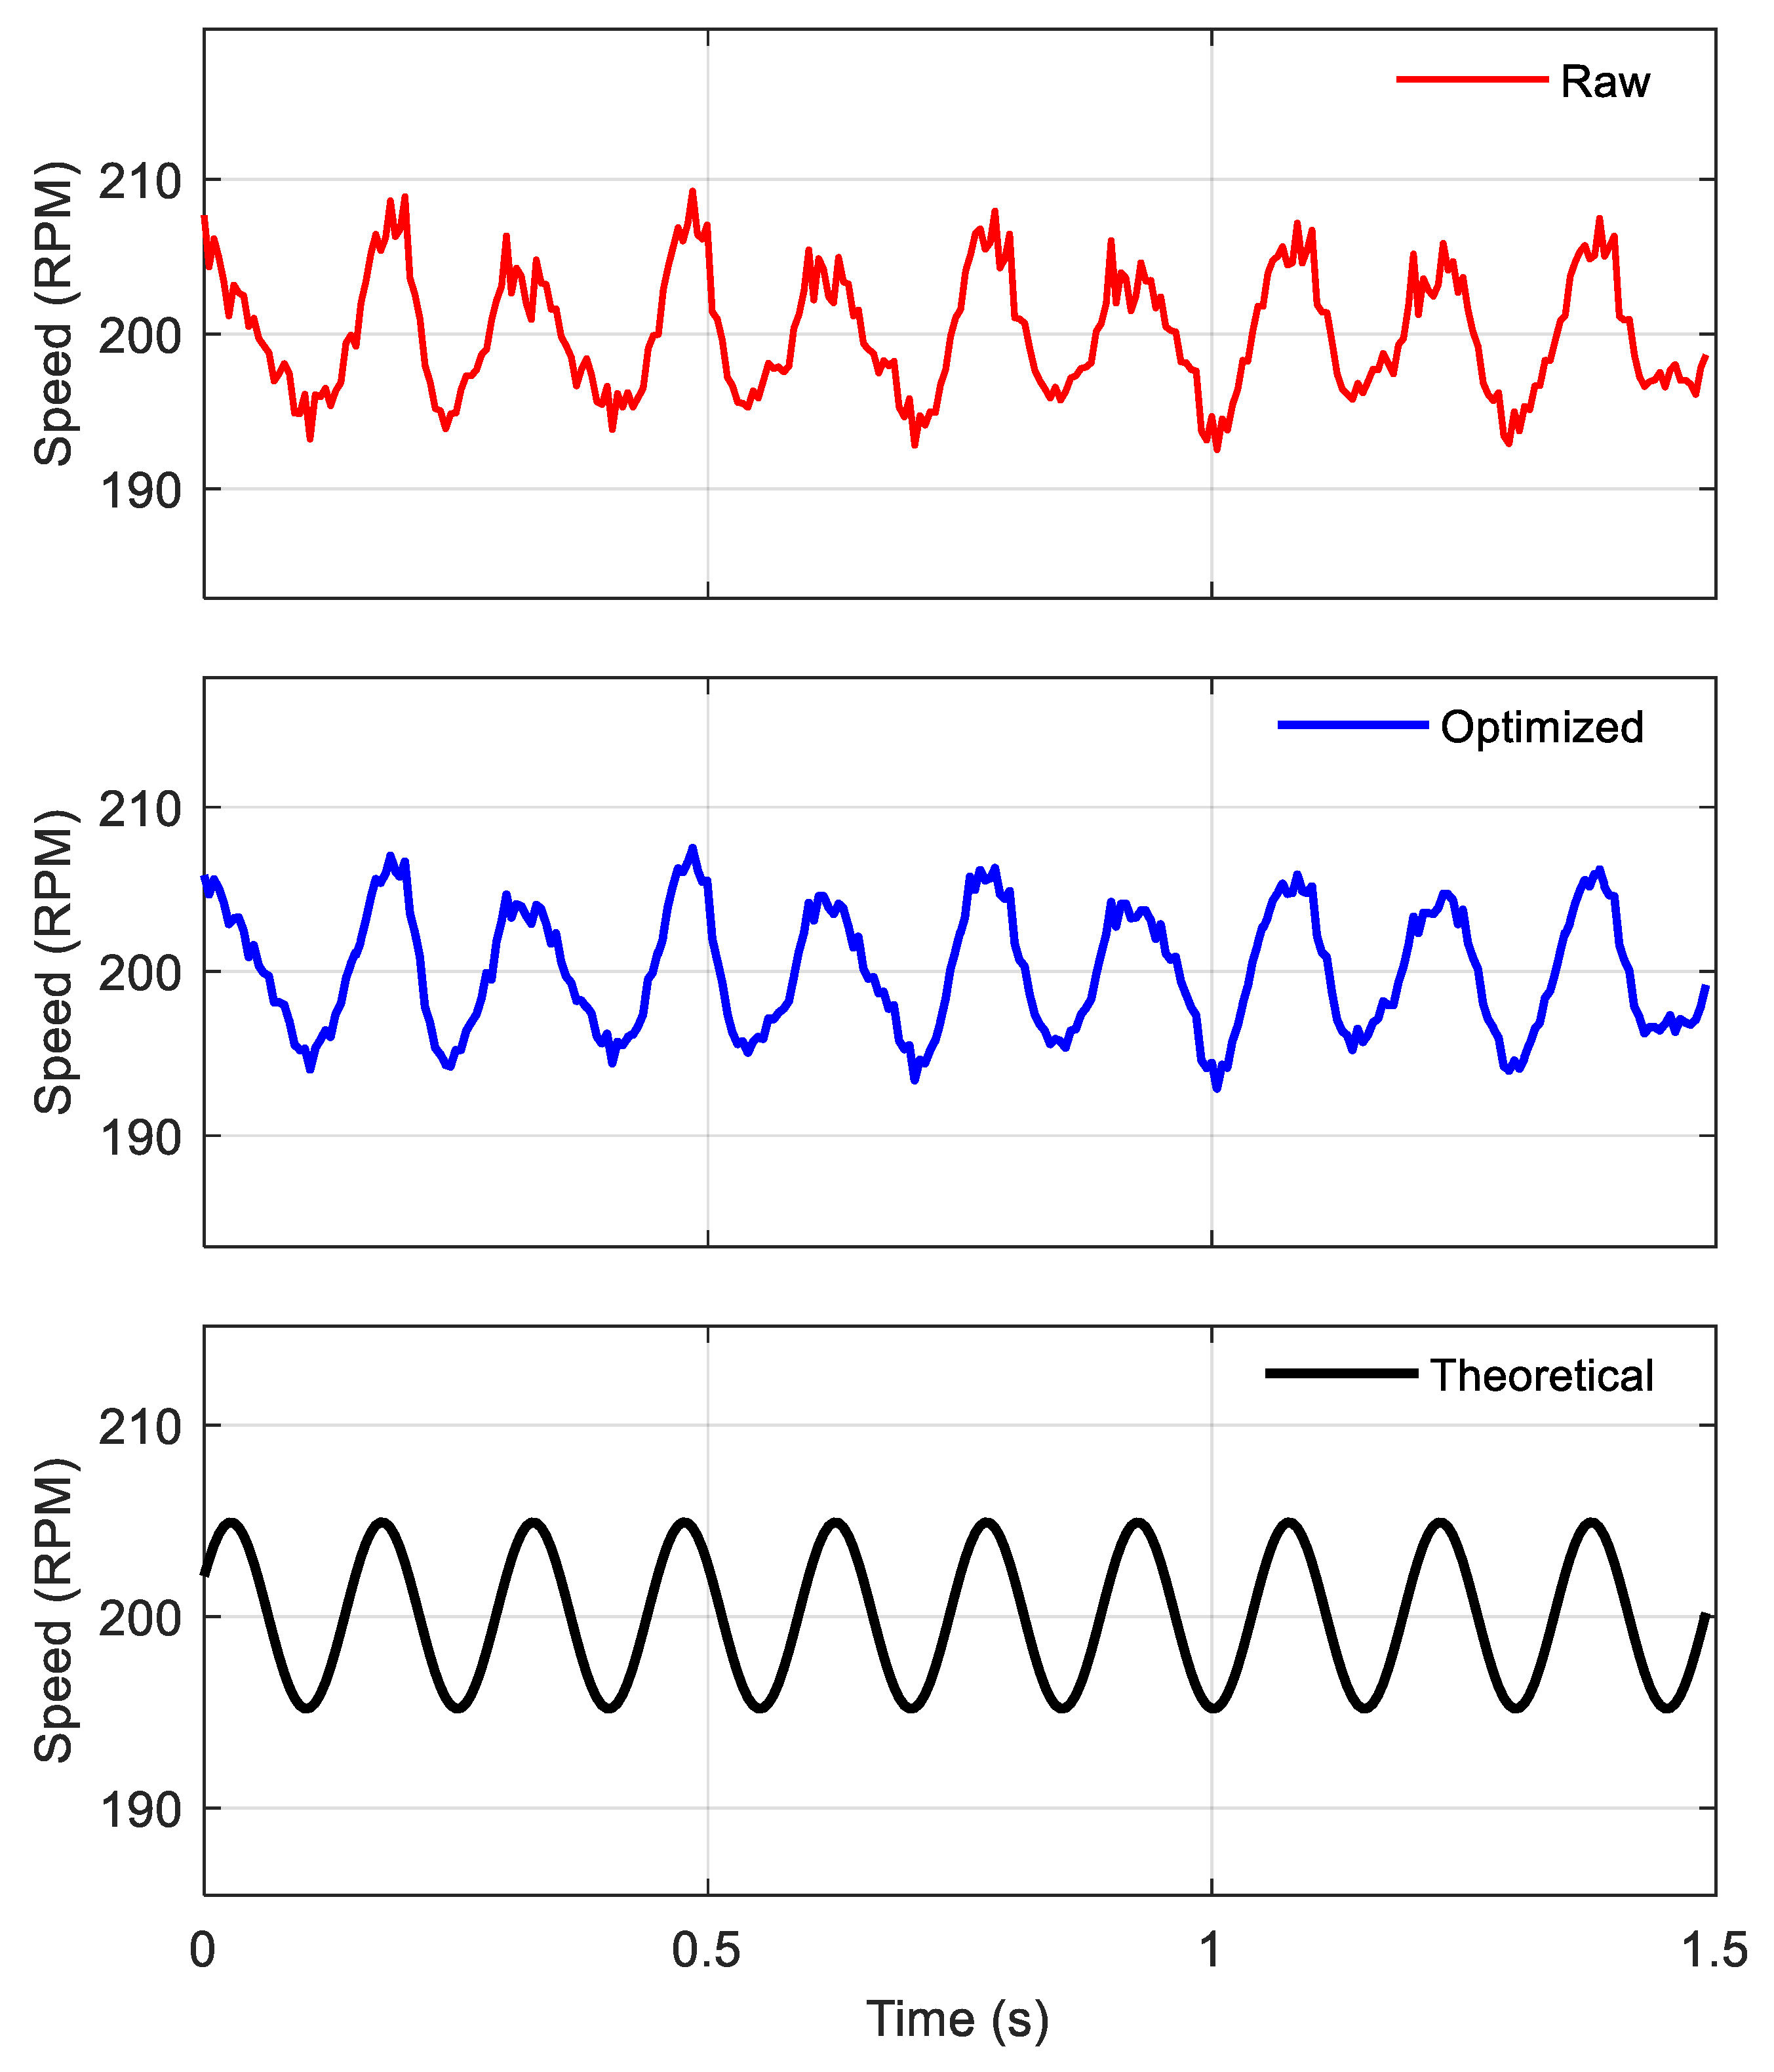
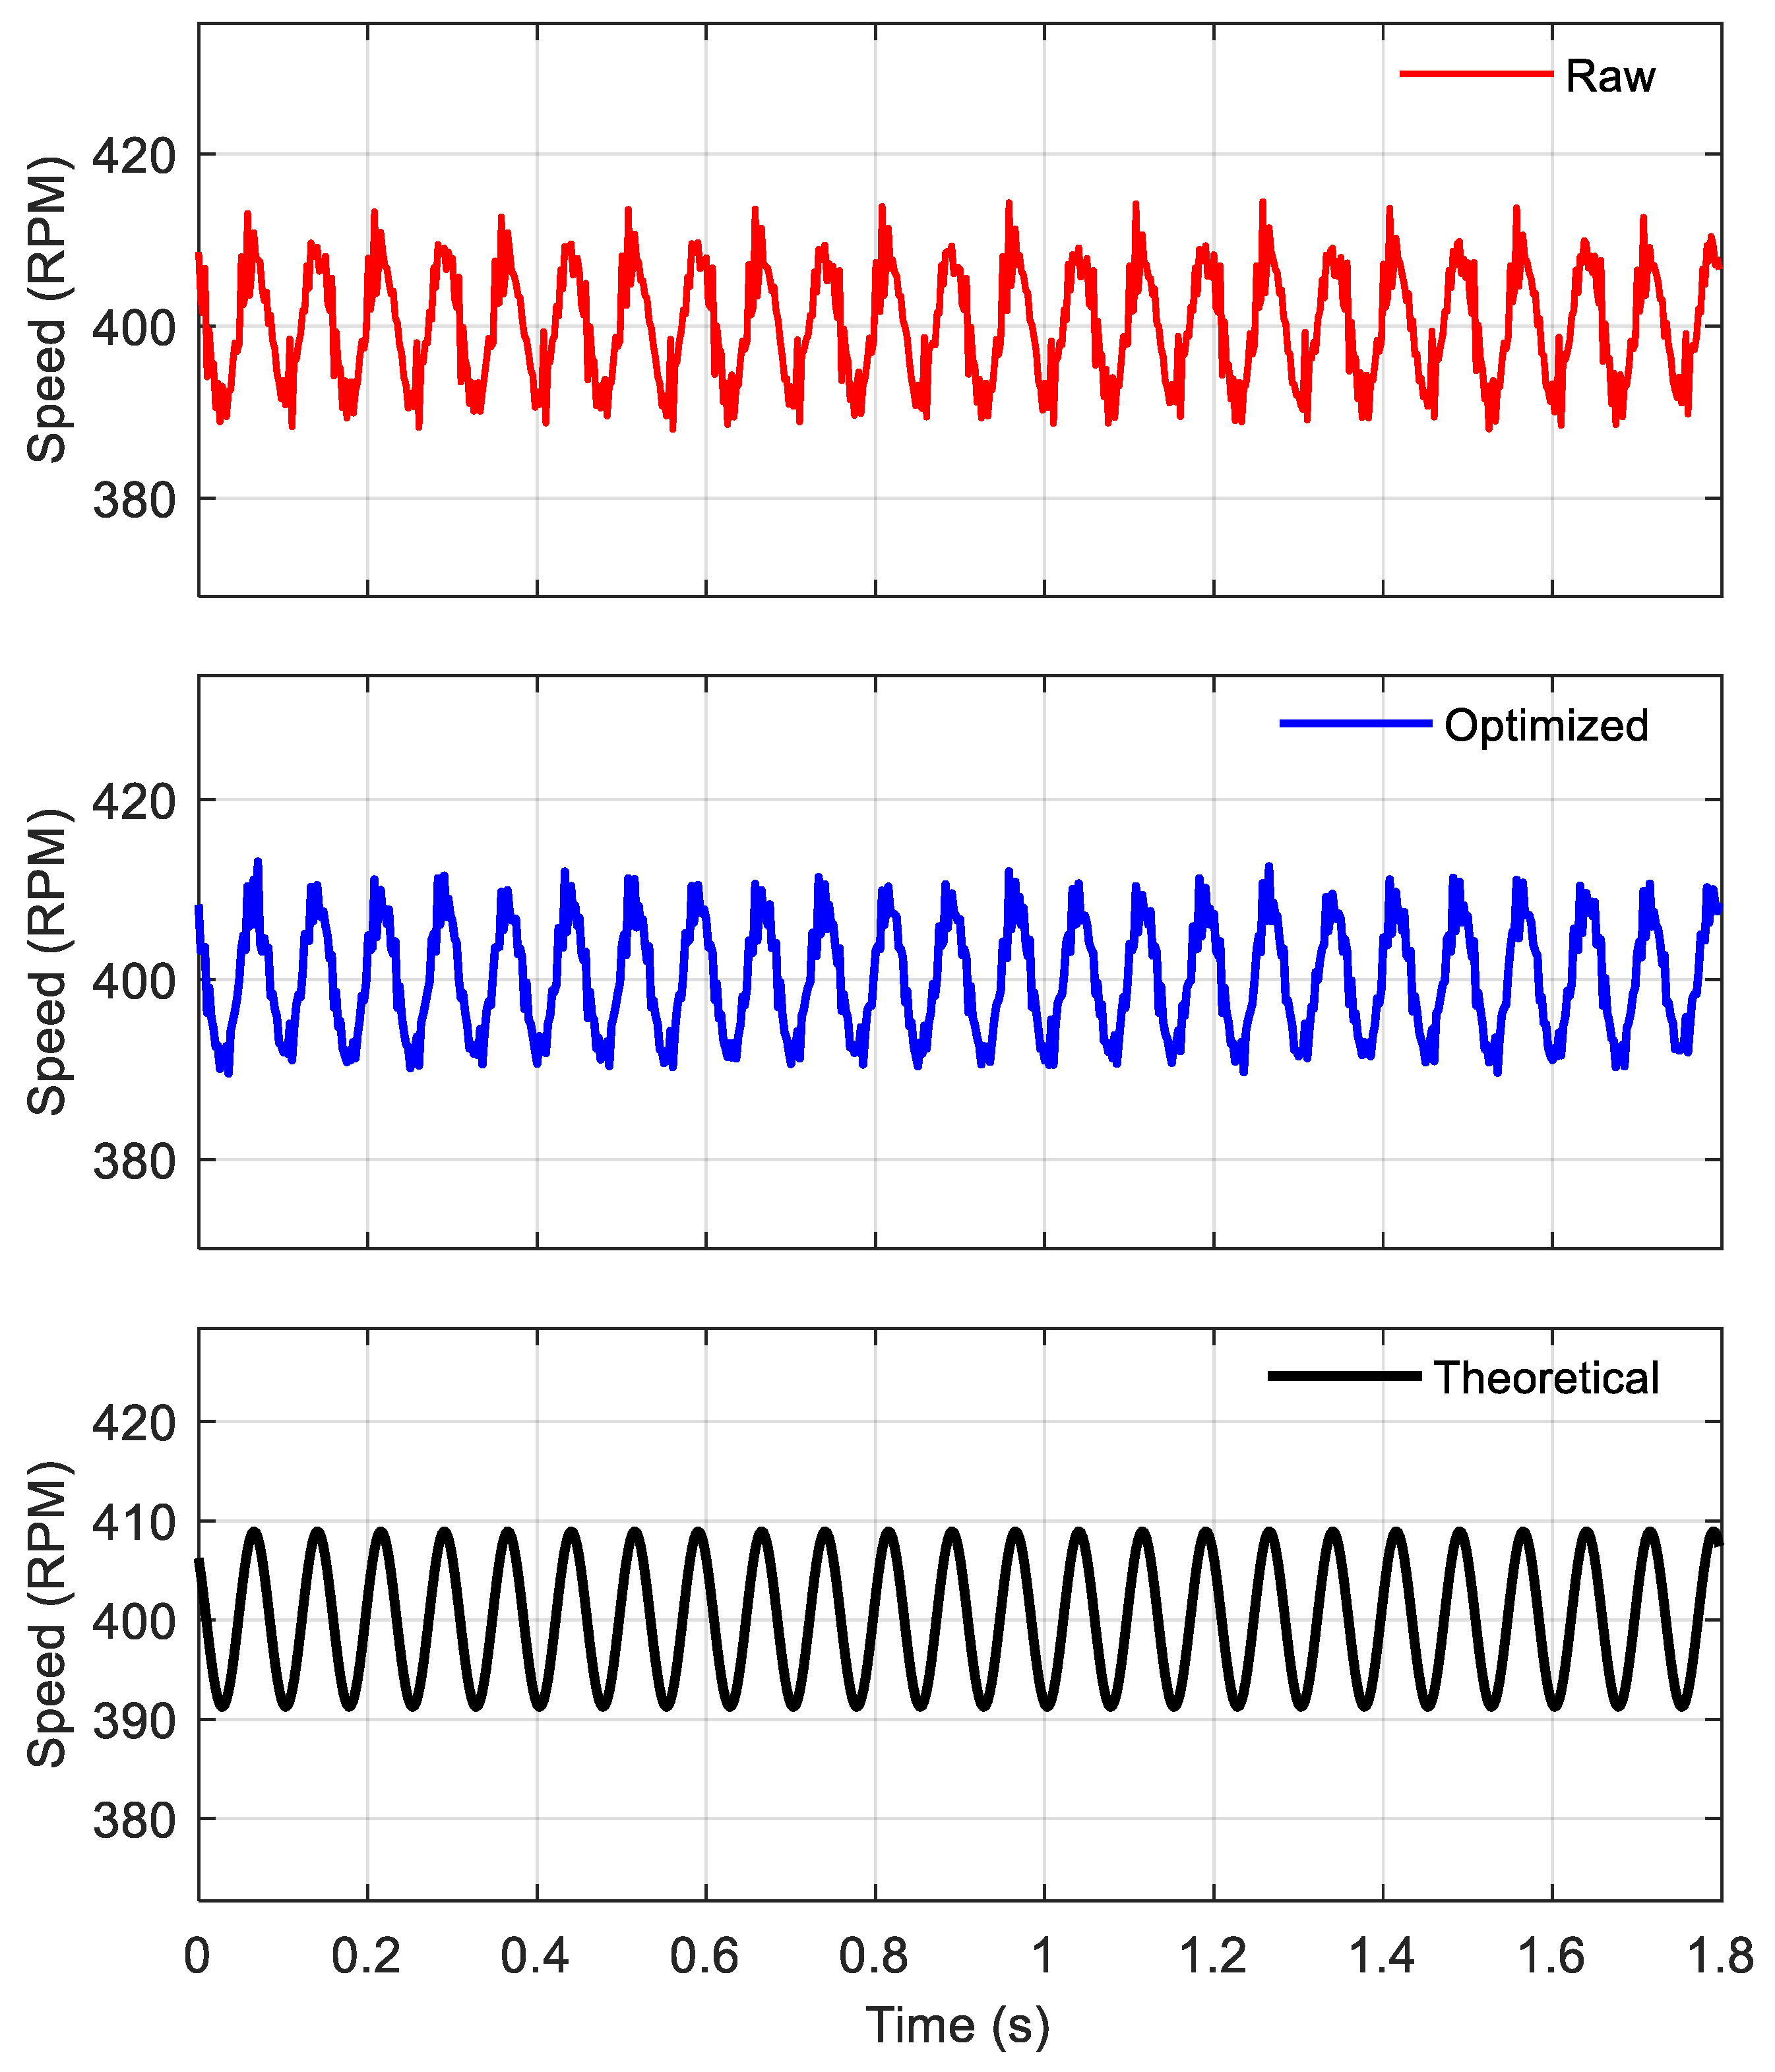
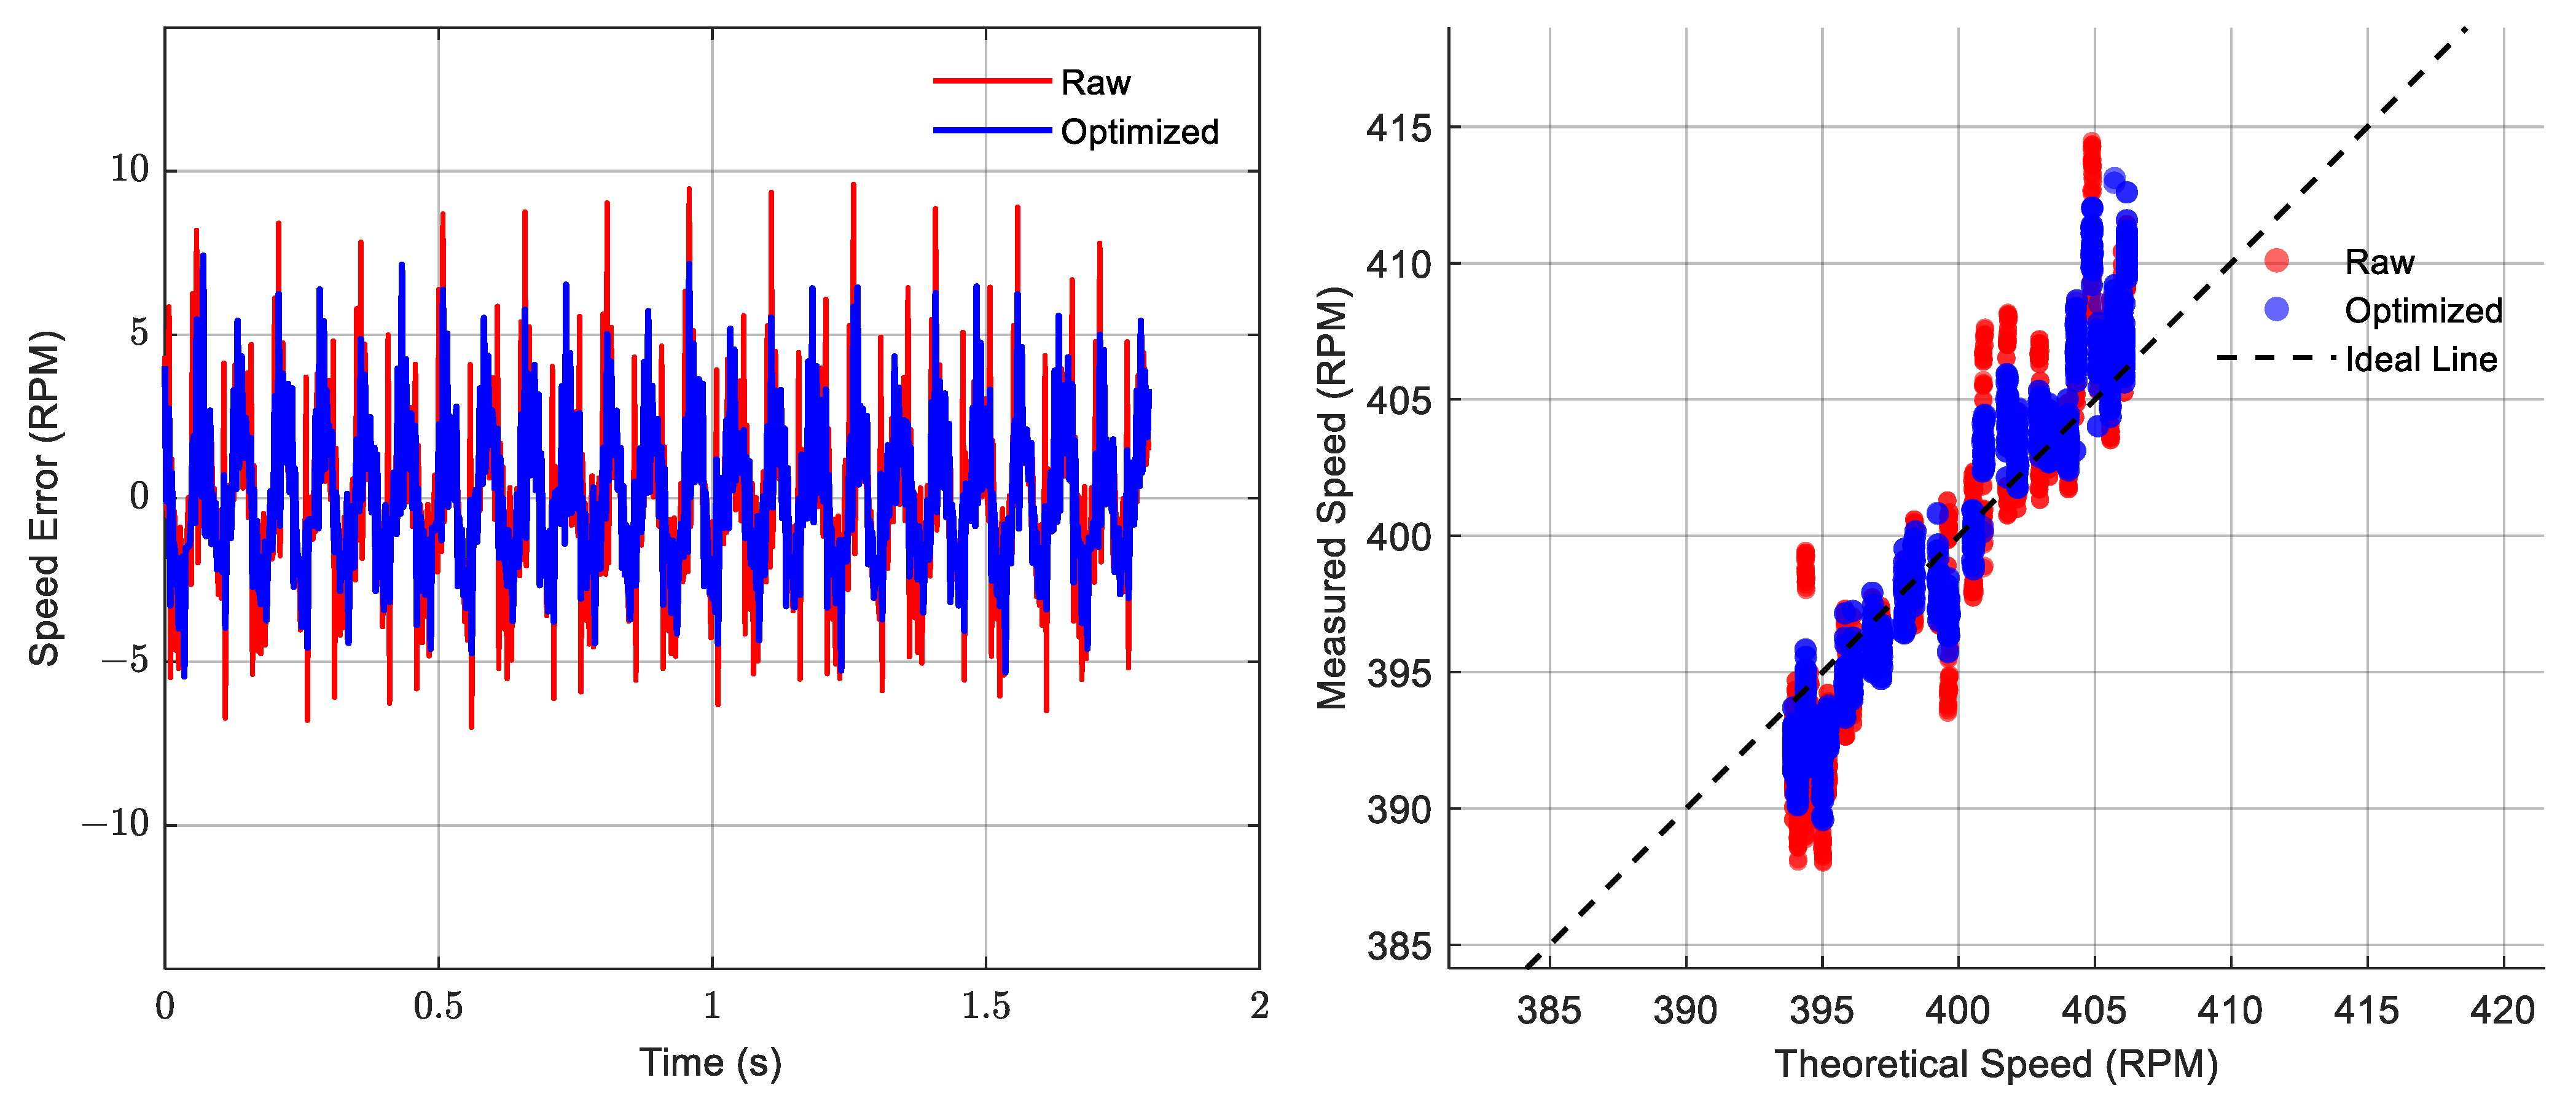
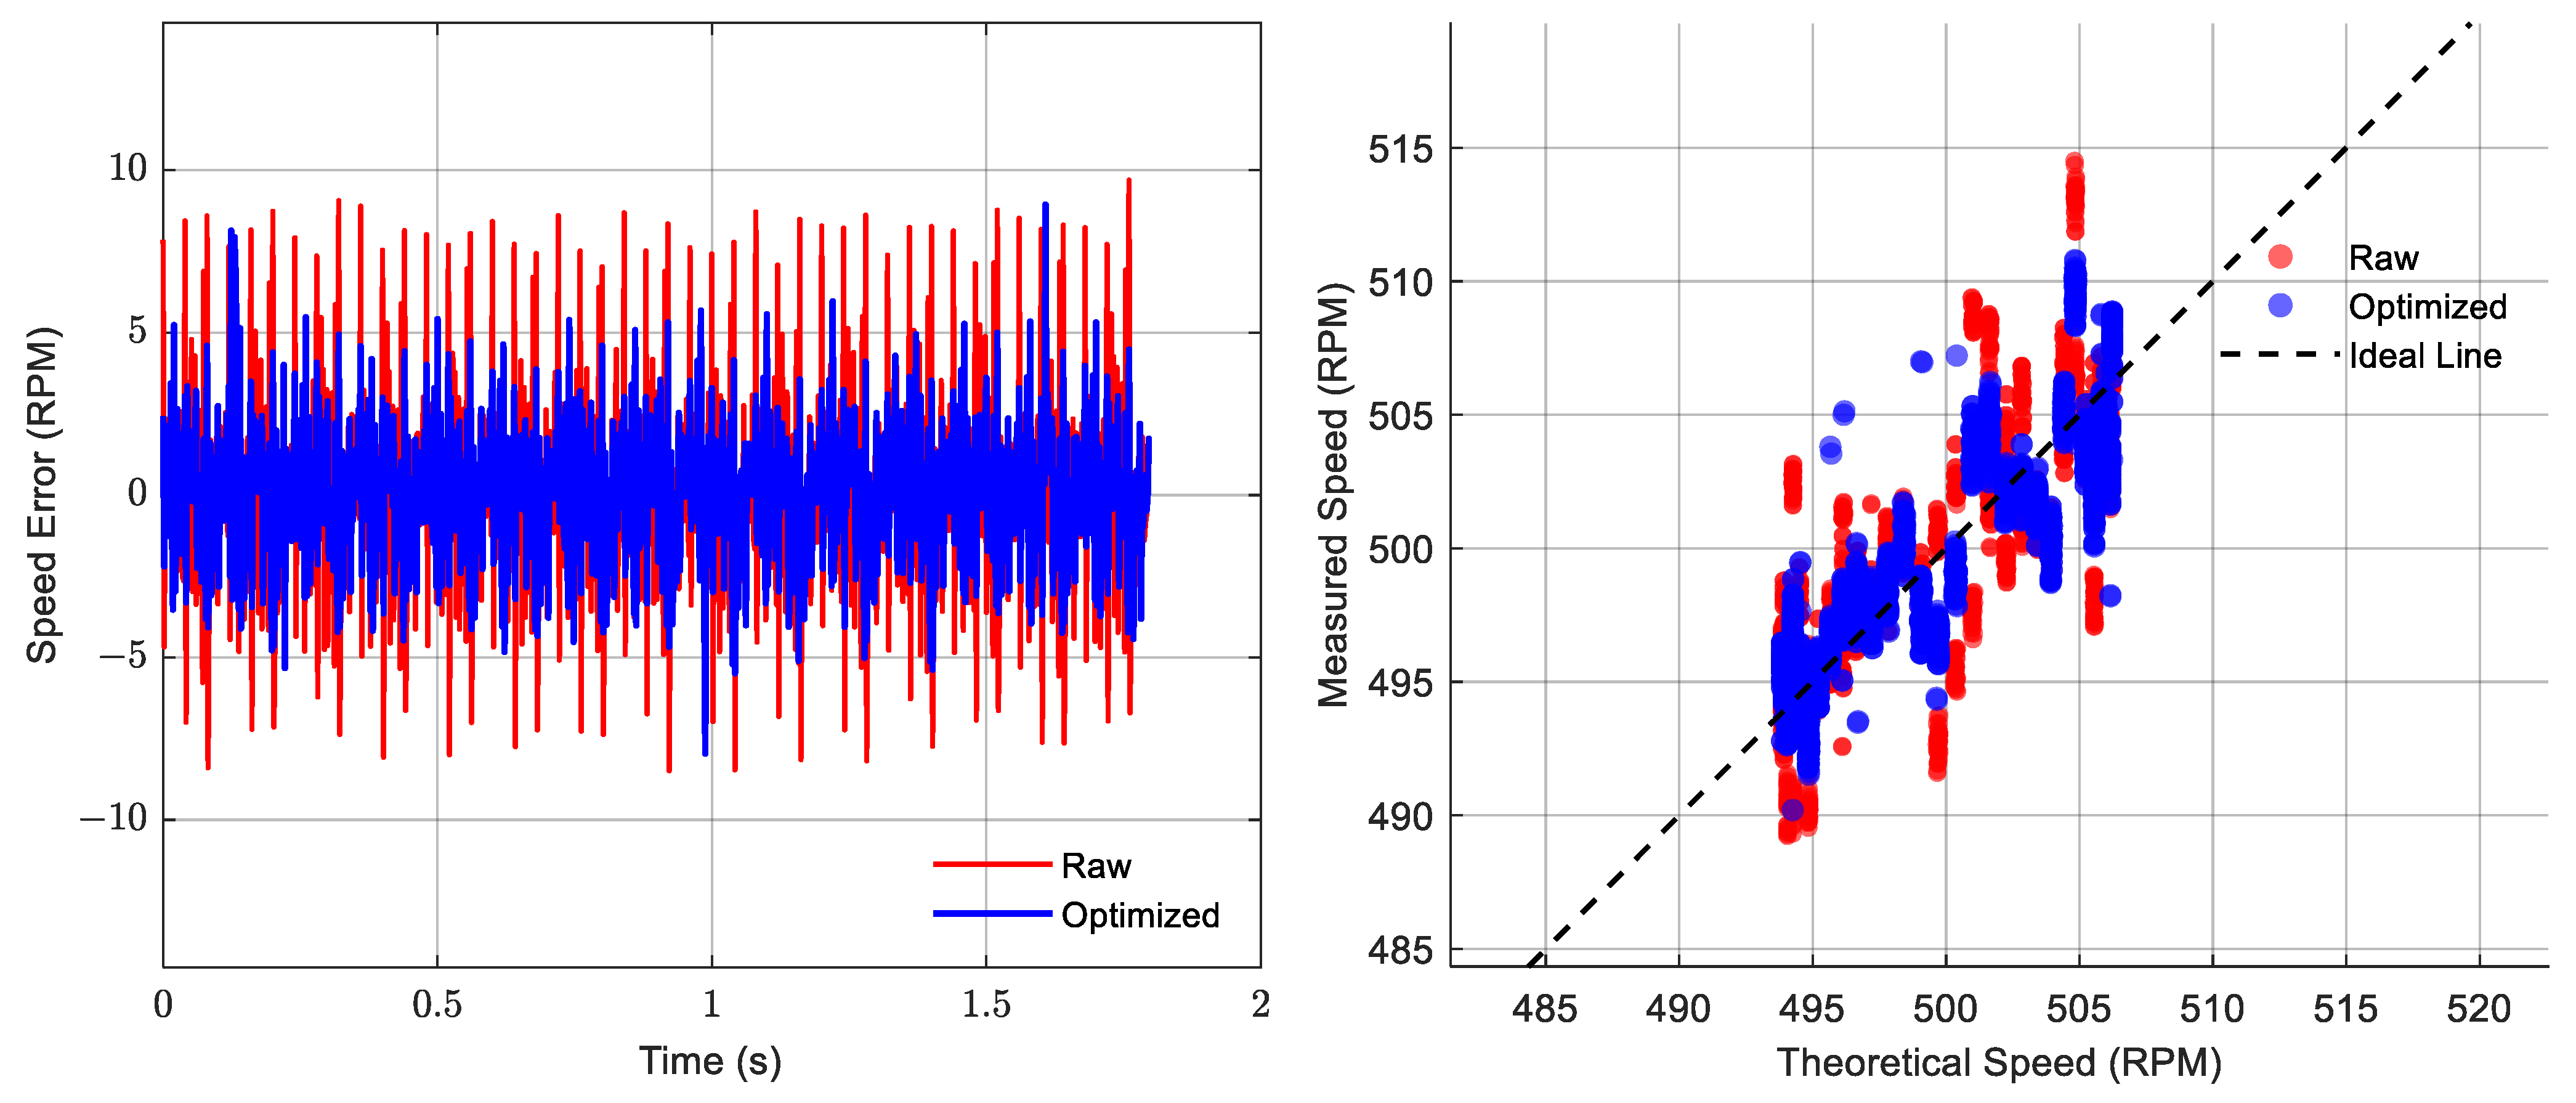
Subsequently, the synchronous sampling method was employed to fuse the data from the dual sensors and restore the rotational speed. In the subsequent time-domain and frequency-domain analyses, figures, and tables, the following designations are used: ‘Raw’ refers to the original rotational speed acquired by a single sensor prior to compensation. ‘Optimized’ denotes the reconstructed rotational speed after applying the synchronous sampling method. ‘Theoretical’ represents the theoretically calculated rotational speed derived from Equation (33), serving as the baseline. The Optimized speed was then compared with the Theoretical speed and the Raw speed. This comparative analysis aimed to quantitatively evaluate the anti-interference capability of the synchronous sampling method against runout. All calculation results are shown in
Figure 17,
Figure 18,
Figure 19,
Figure 20,
Figure 21,
Figure 22,
Figure 23 and
Figure 24. The comparison results are depicted in
Figure 17,
Figure 19,
Figure 21, and
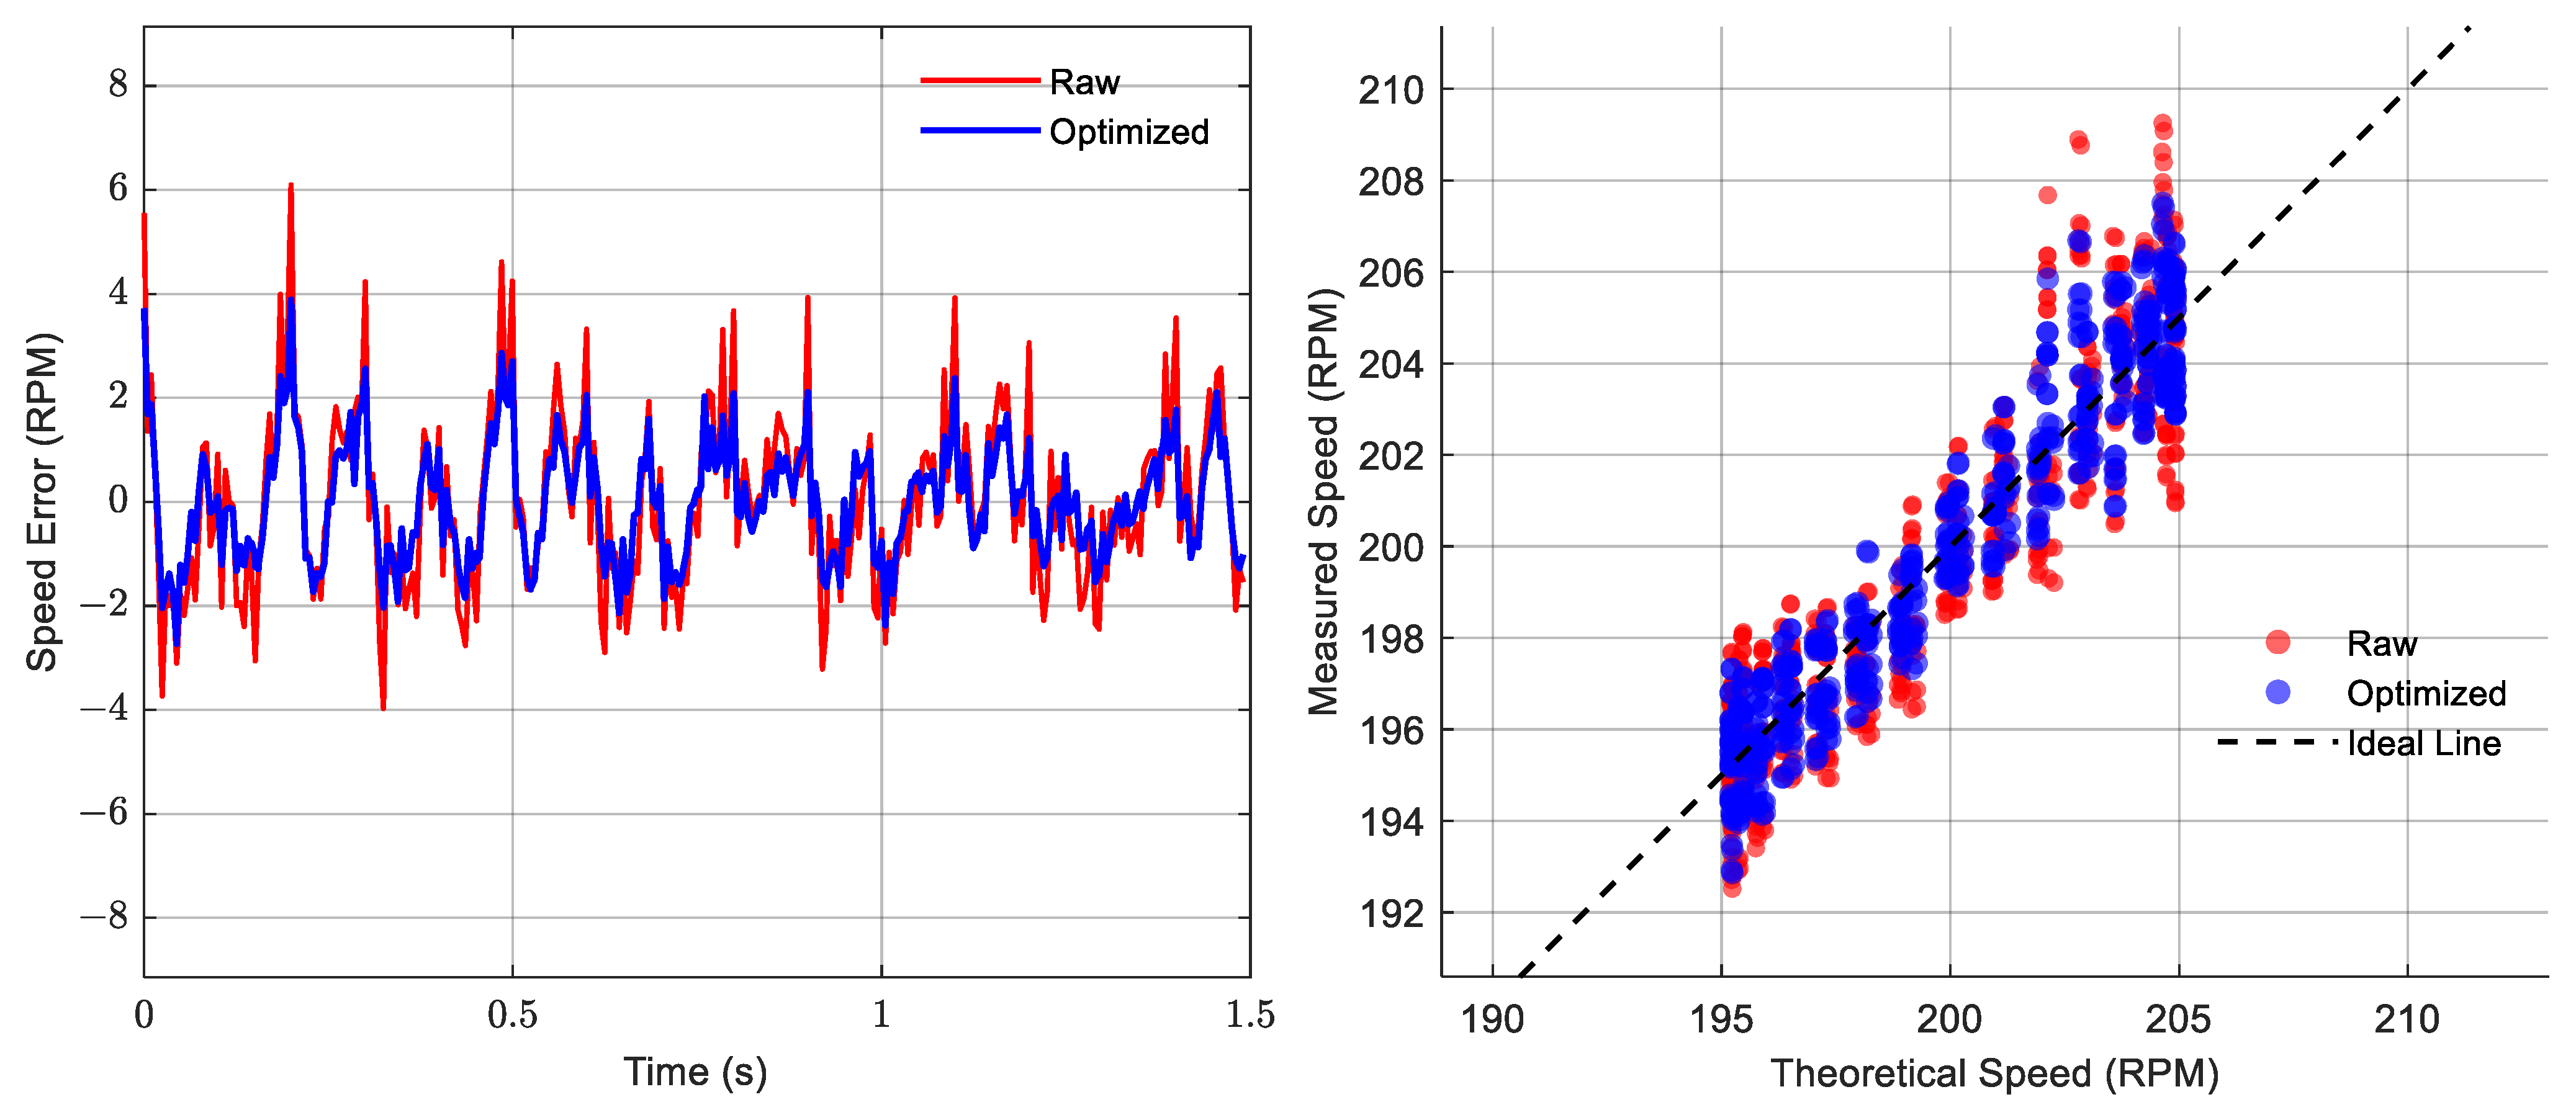
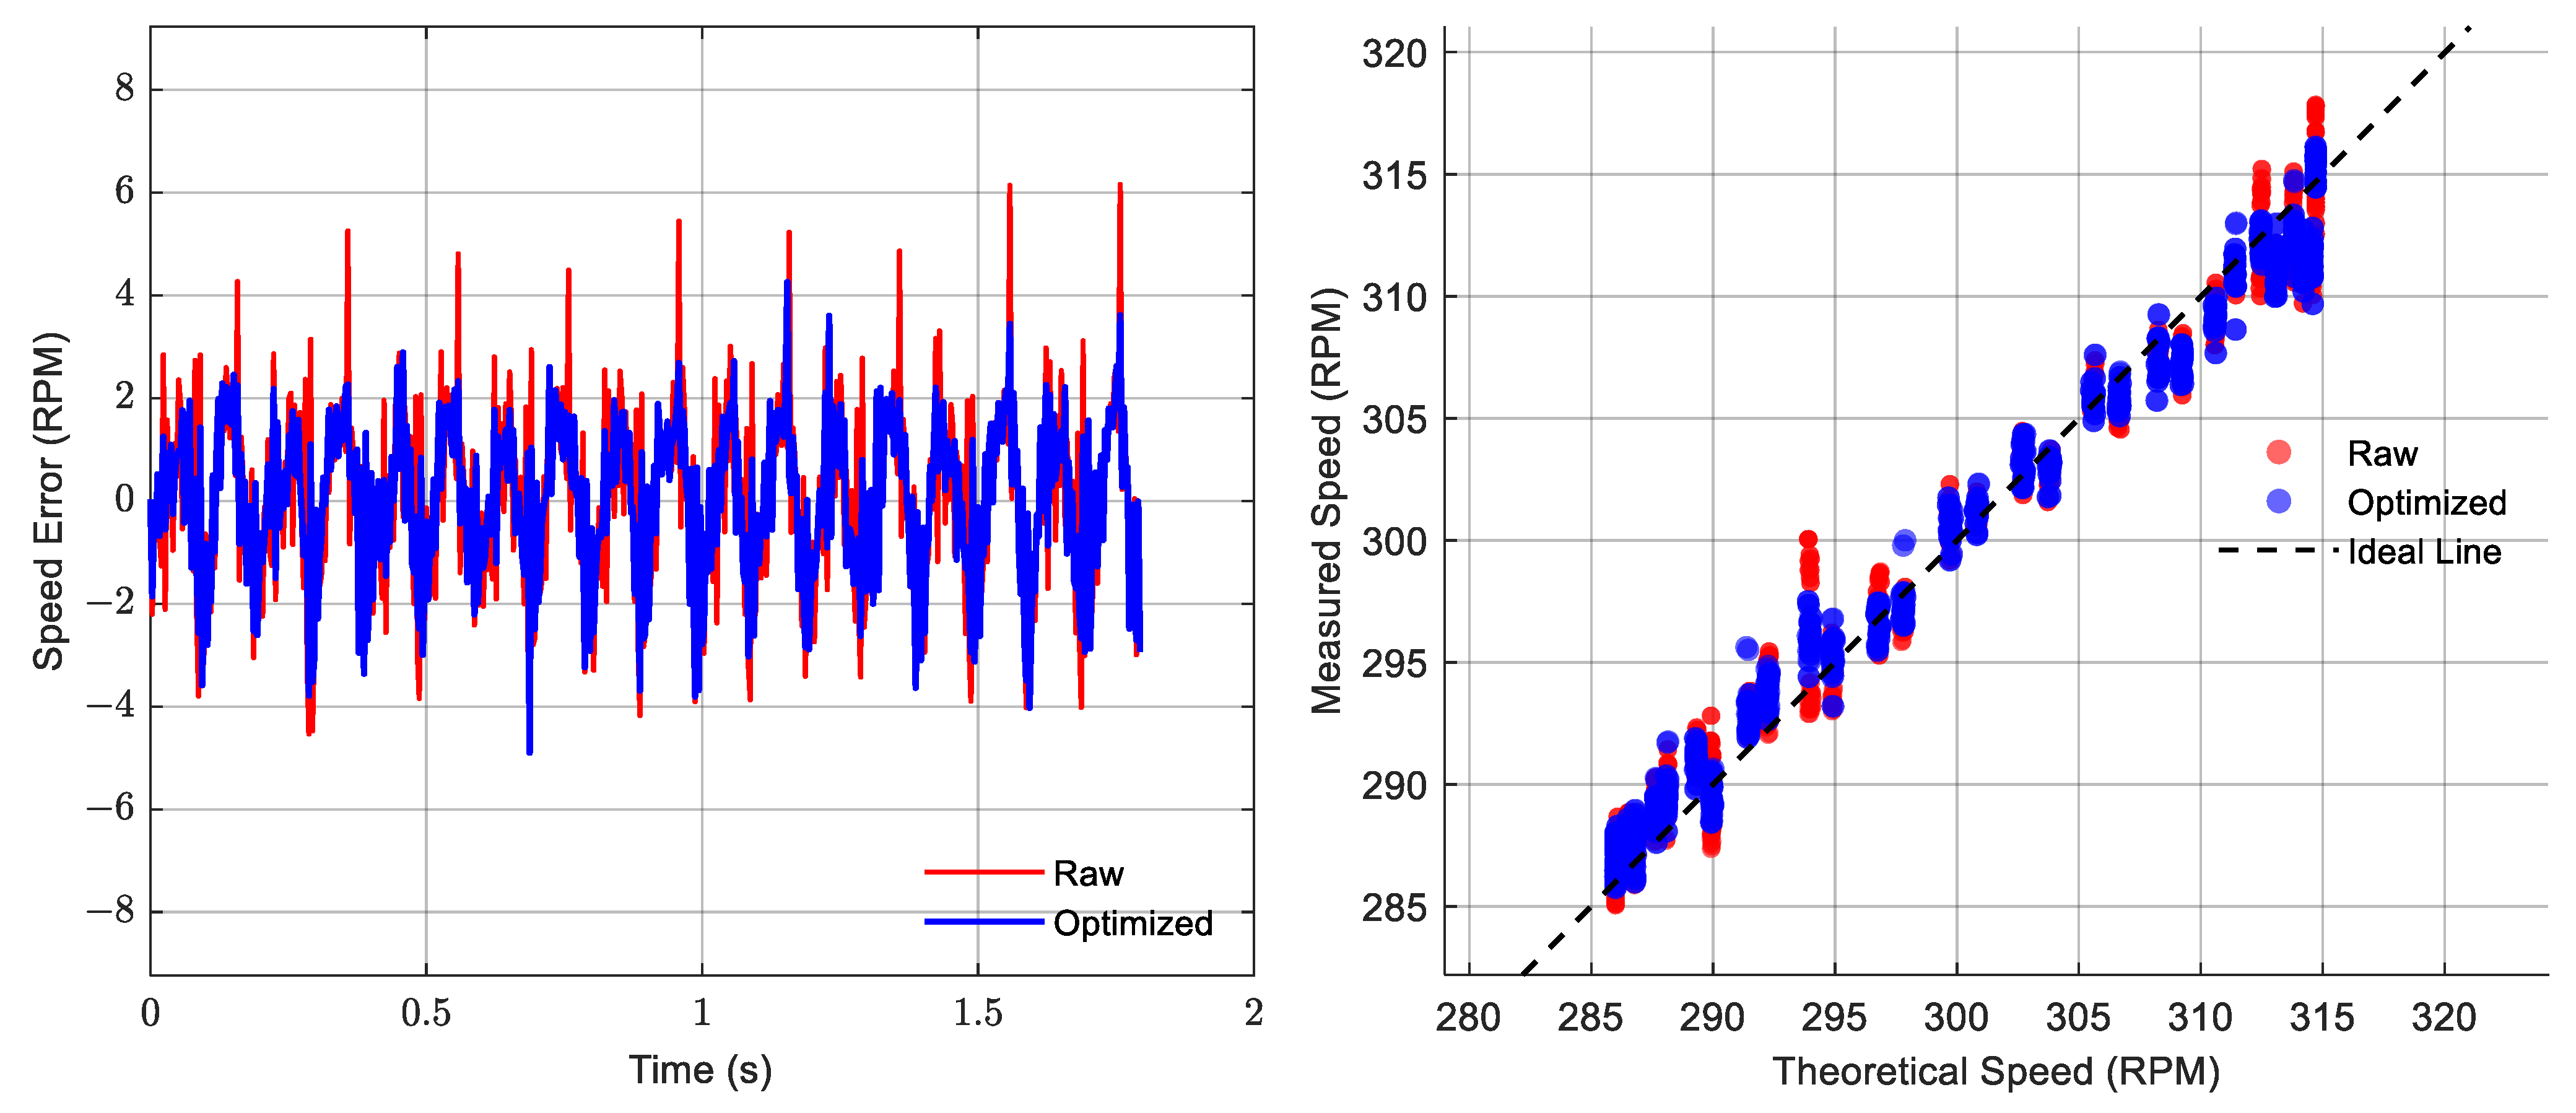
Figure 23. The error comparison and analysis of the two rotational speed datasets against the theoretical rotational speed are presented in
Figure 18,
Figure 20,
Figure 22, and
Figure 24. The theoretical rotational speed and quantitative analysis results are summarized in
Table 3.
- (a)
A comparison of the rotational speeds (as depicted in
Figure 17,
Figure 19,
Figure 21, and
Figure 23) demonstrates that, at all tested motor speeds, the reconstructed rotational speed obtained via the synchronous sampling method effectively mitigates runout-induced interference and aligns more closely with the theoretical rotational speed curve than the original rotational speed acquired from a single sensor.
- (b)
The error analysis plots (
Figure 17,
Figure 20,
Figure 22, and
Figure 24) indicate that, in comparison, the rotational speed errors associated with the synchronous sampling method are more tightly clustered around the zero-error level. Furthermore, the distribution of these reconstructed rotational speeds exhibits a closer agreement with the theoretical rotational speed.
Table 3 presents a quantitative evaluation of the synchronous sampling method’s capability to mitigate runout interference in the time domain. Parameters such as RMSE (root mean square error), MAE (mean absolute error), MAX (maximum error), and R (correlation coefficient) were calculated by comparing the Raw and Optimized datasets against the Theoretical baseline. An analysis of the data in
Table 3 indicates the following.
- (1)
Analysis of the original rotational speed signal from a single sensor shows that under the 300 RPM condition, the rotational speed fluctuation was the mildest, corresponding to the least severe runout phenomenon observed during the experiment. The correlation coefficient (R-value) with the theoretical rotational speed reached 0.9875. Conversely, under the 500 RPM condition, the rotational speed fluctuation was the most severe, as was the experimental runout, with the R-value decreasing to 0.7557. This observation validates conclusion (b) drawn from the rotational speed curves. It is also noted that the severity of rotational speed fluctuation does not exhibit a simple linear correlation with the input speed of the driving shaft. A preliminary inference is that this fluctuation characteristic is closely related to the proximity of the input excitation frequency to the natural modal frequencies of the test rig (i.e., resonance conditions).
- (2)
Under different runout conditions, the rotational speed reconstructed by the synchronous sampling method consistently demonstrated a high degree of restoration. The most significant improvement in the R-value was observed at 500 RPM, with an increase of 0.1085 (from 0.7557 to 0.8642), elevating the correlation level. At 200 RPM and 400 RPM, the R-values improved by 0.0455 (from 0.9104 to 0.9559) and 0.0341 (from 0.9324 to 0.9665), respectively. Even under the 300 RPM condition, where the initial R-value was already high at 0.9875, a further improvement to 0.9930 was achieved.
- (3)
A comparison of RMSE, MAE, and MAX parameters reveals varying degrees of improvement across all tested rotational speeds. This indicates that the proposed method demonstrates enhanced data fidelity across multiple statistical metrics.
The aforementioned analysis validates that the synchronous sampling method can effectively enhance the accuracy of the reconstructed rotational speed signal and its correlation with the true rotational speed under different operational speeds and fluctuation conditions. This demonstrates its good universality and robustness, exhibiting a strong capability to counteract the effects of runout in the time domain.
5.3. Frequency-Domain Analysis
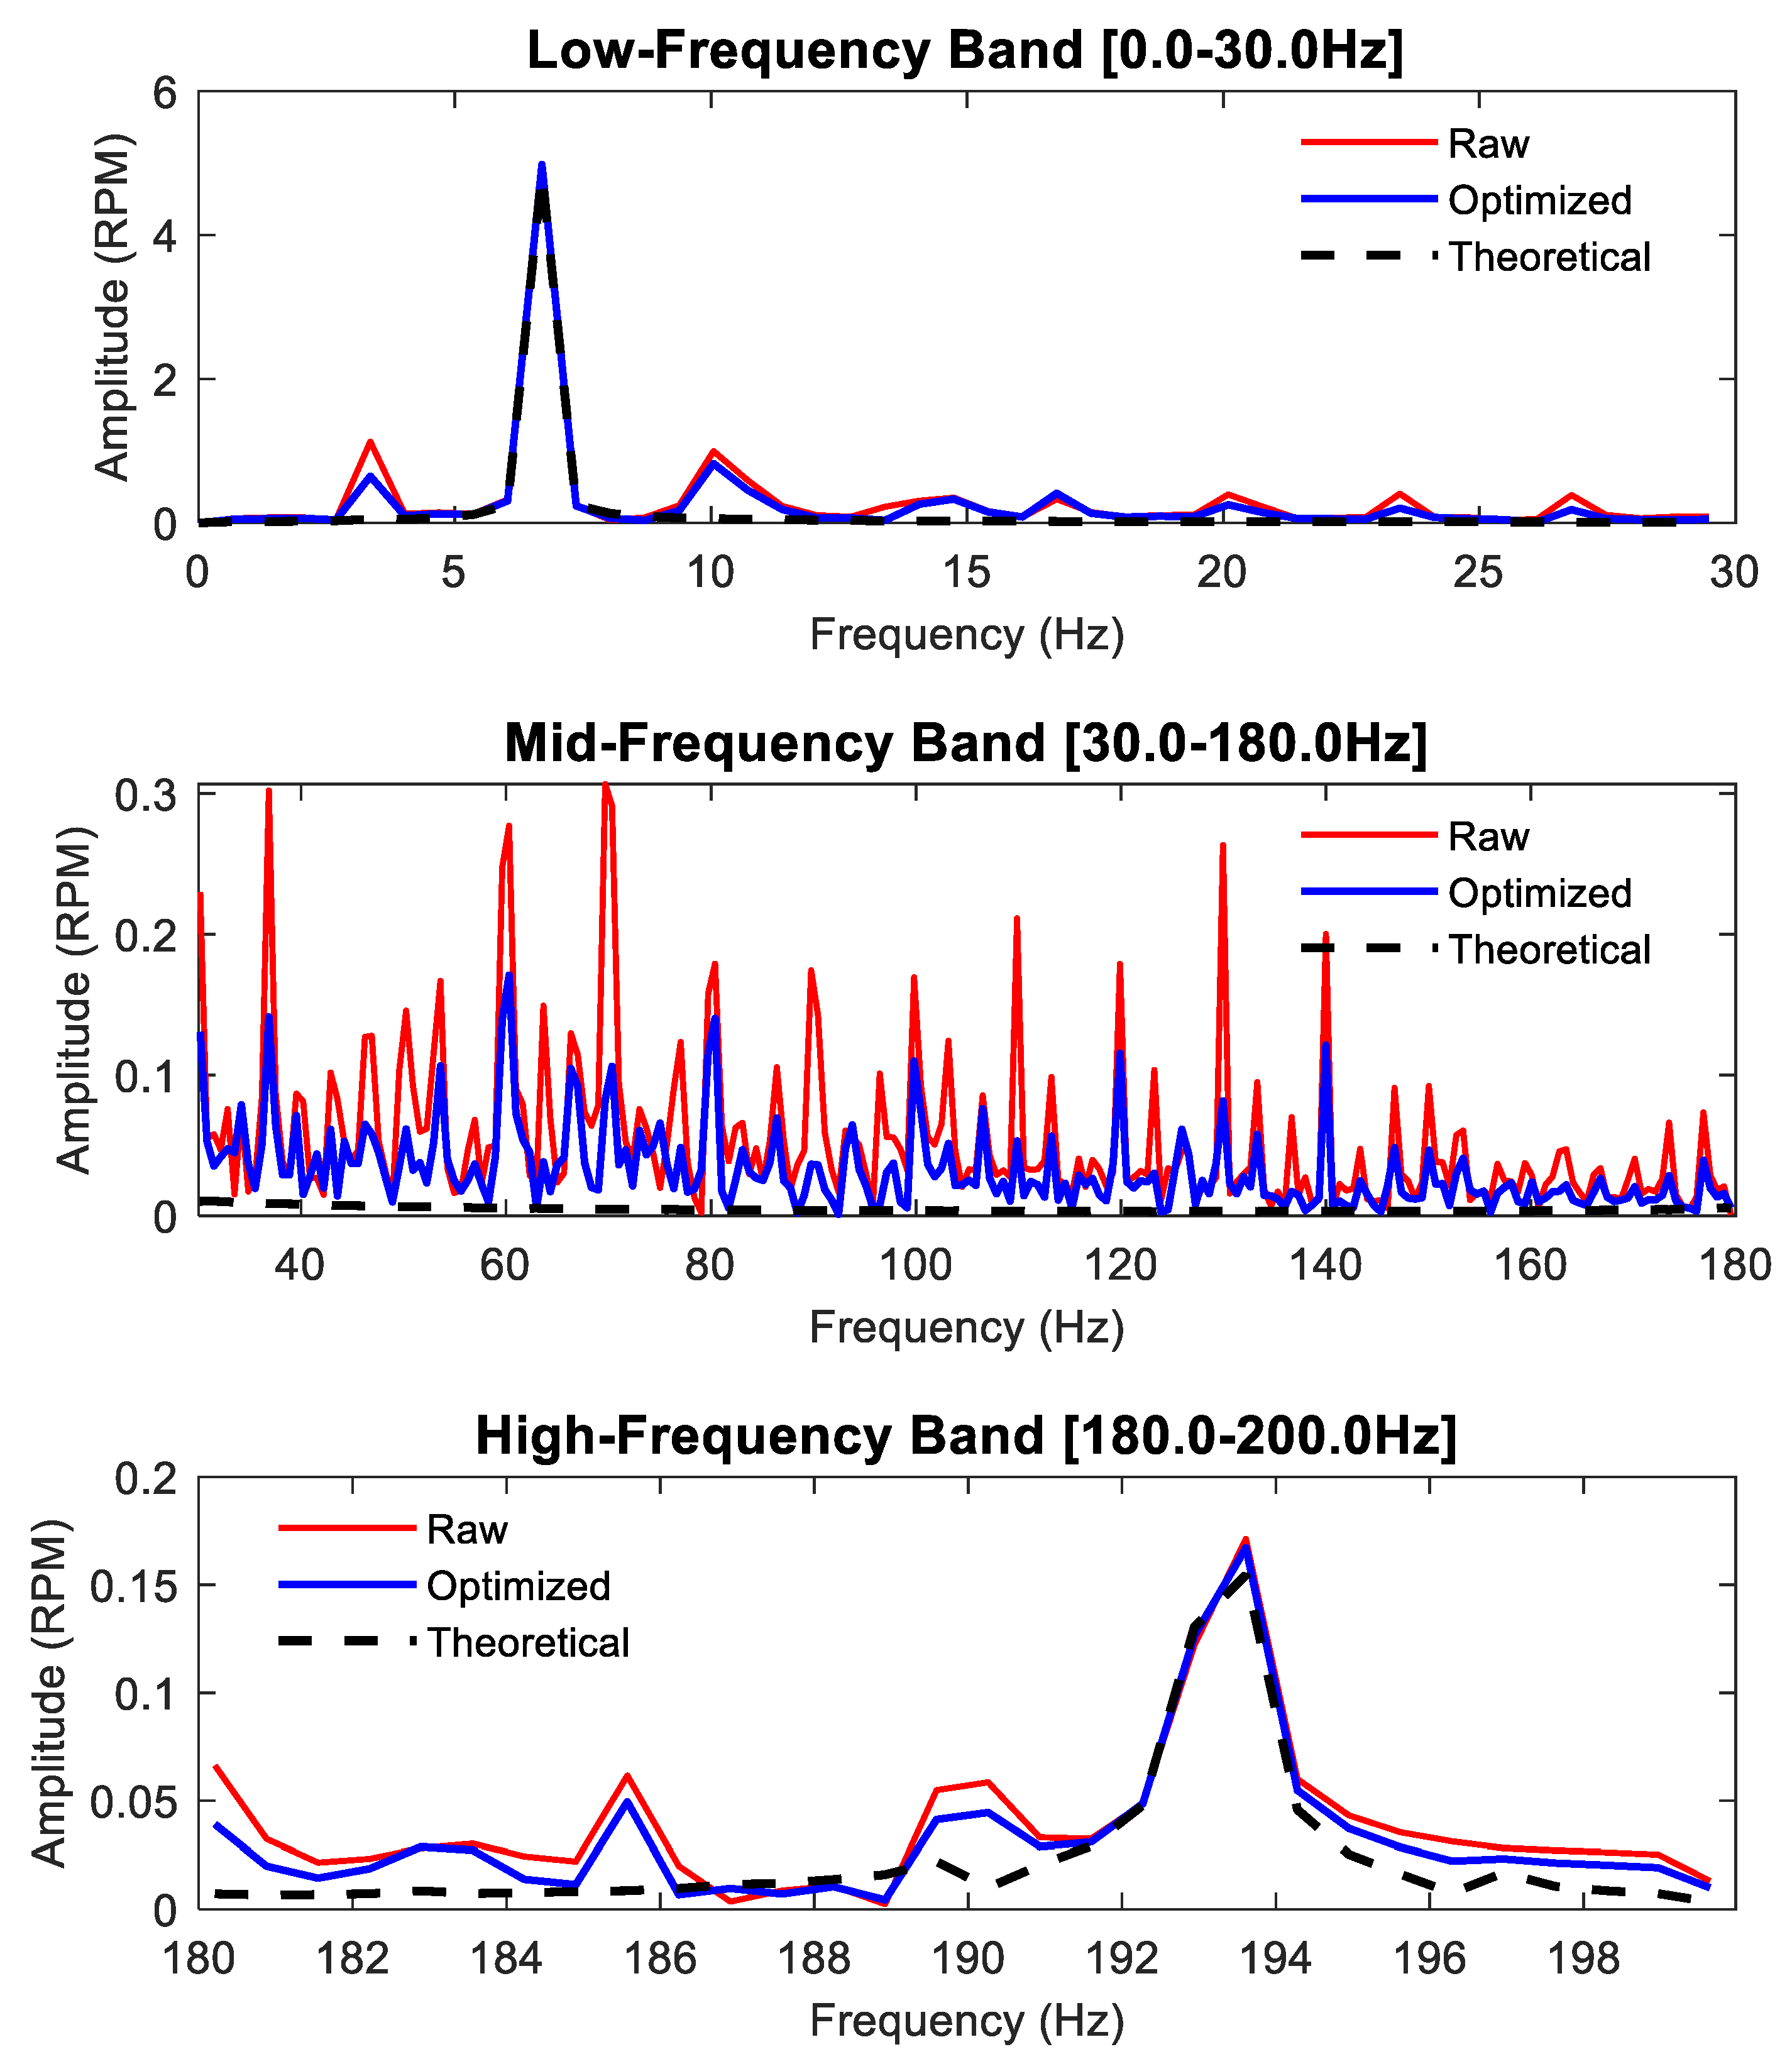
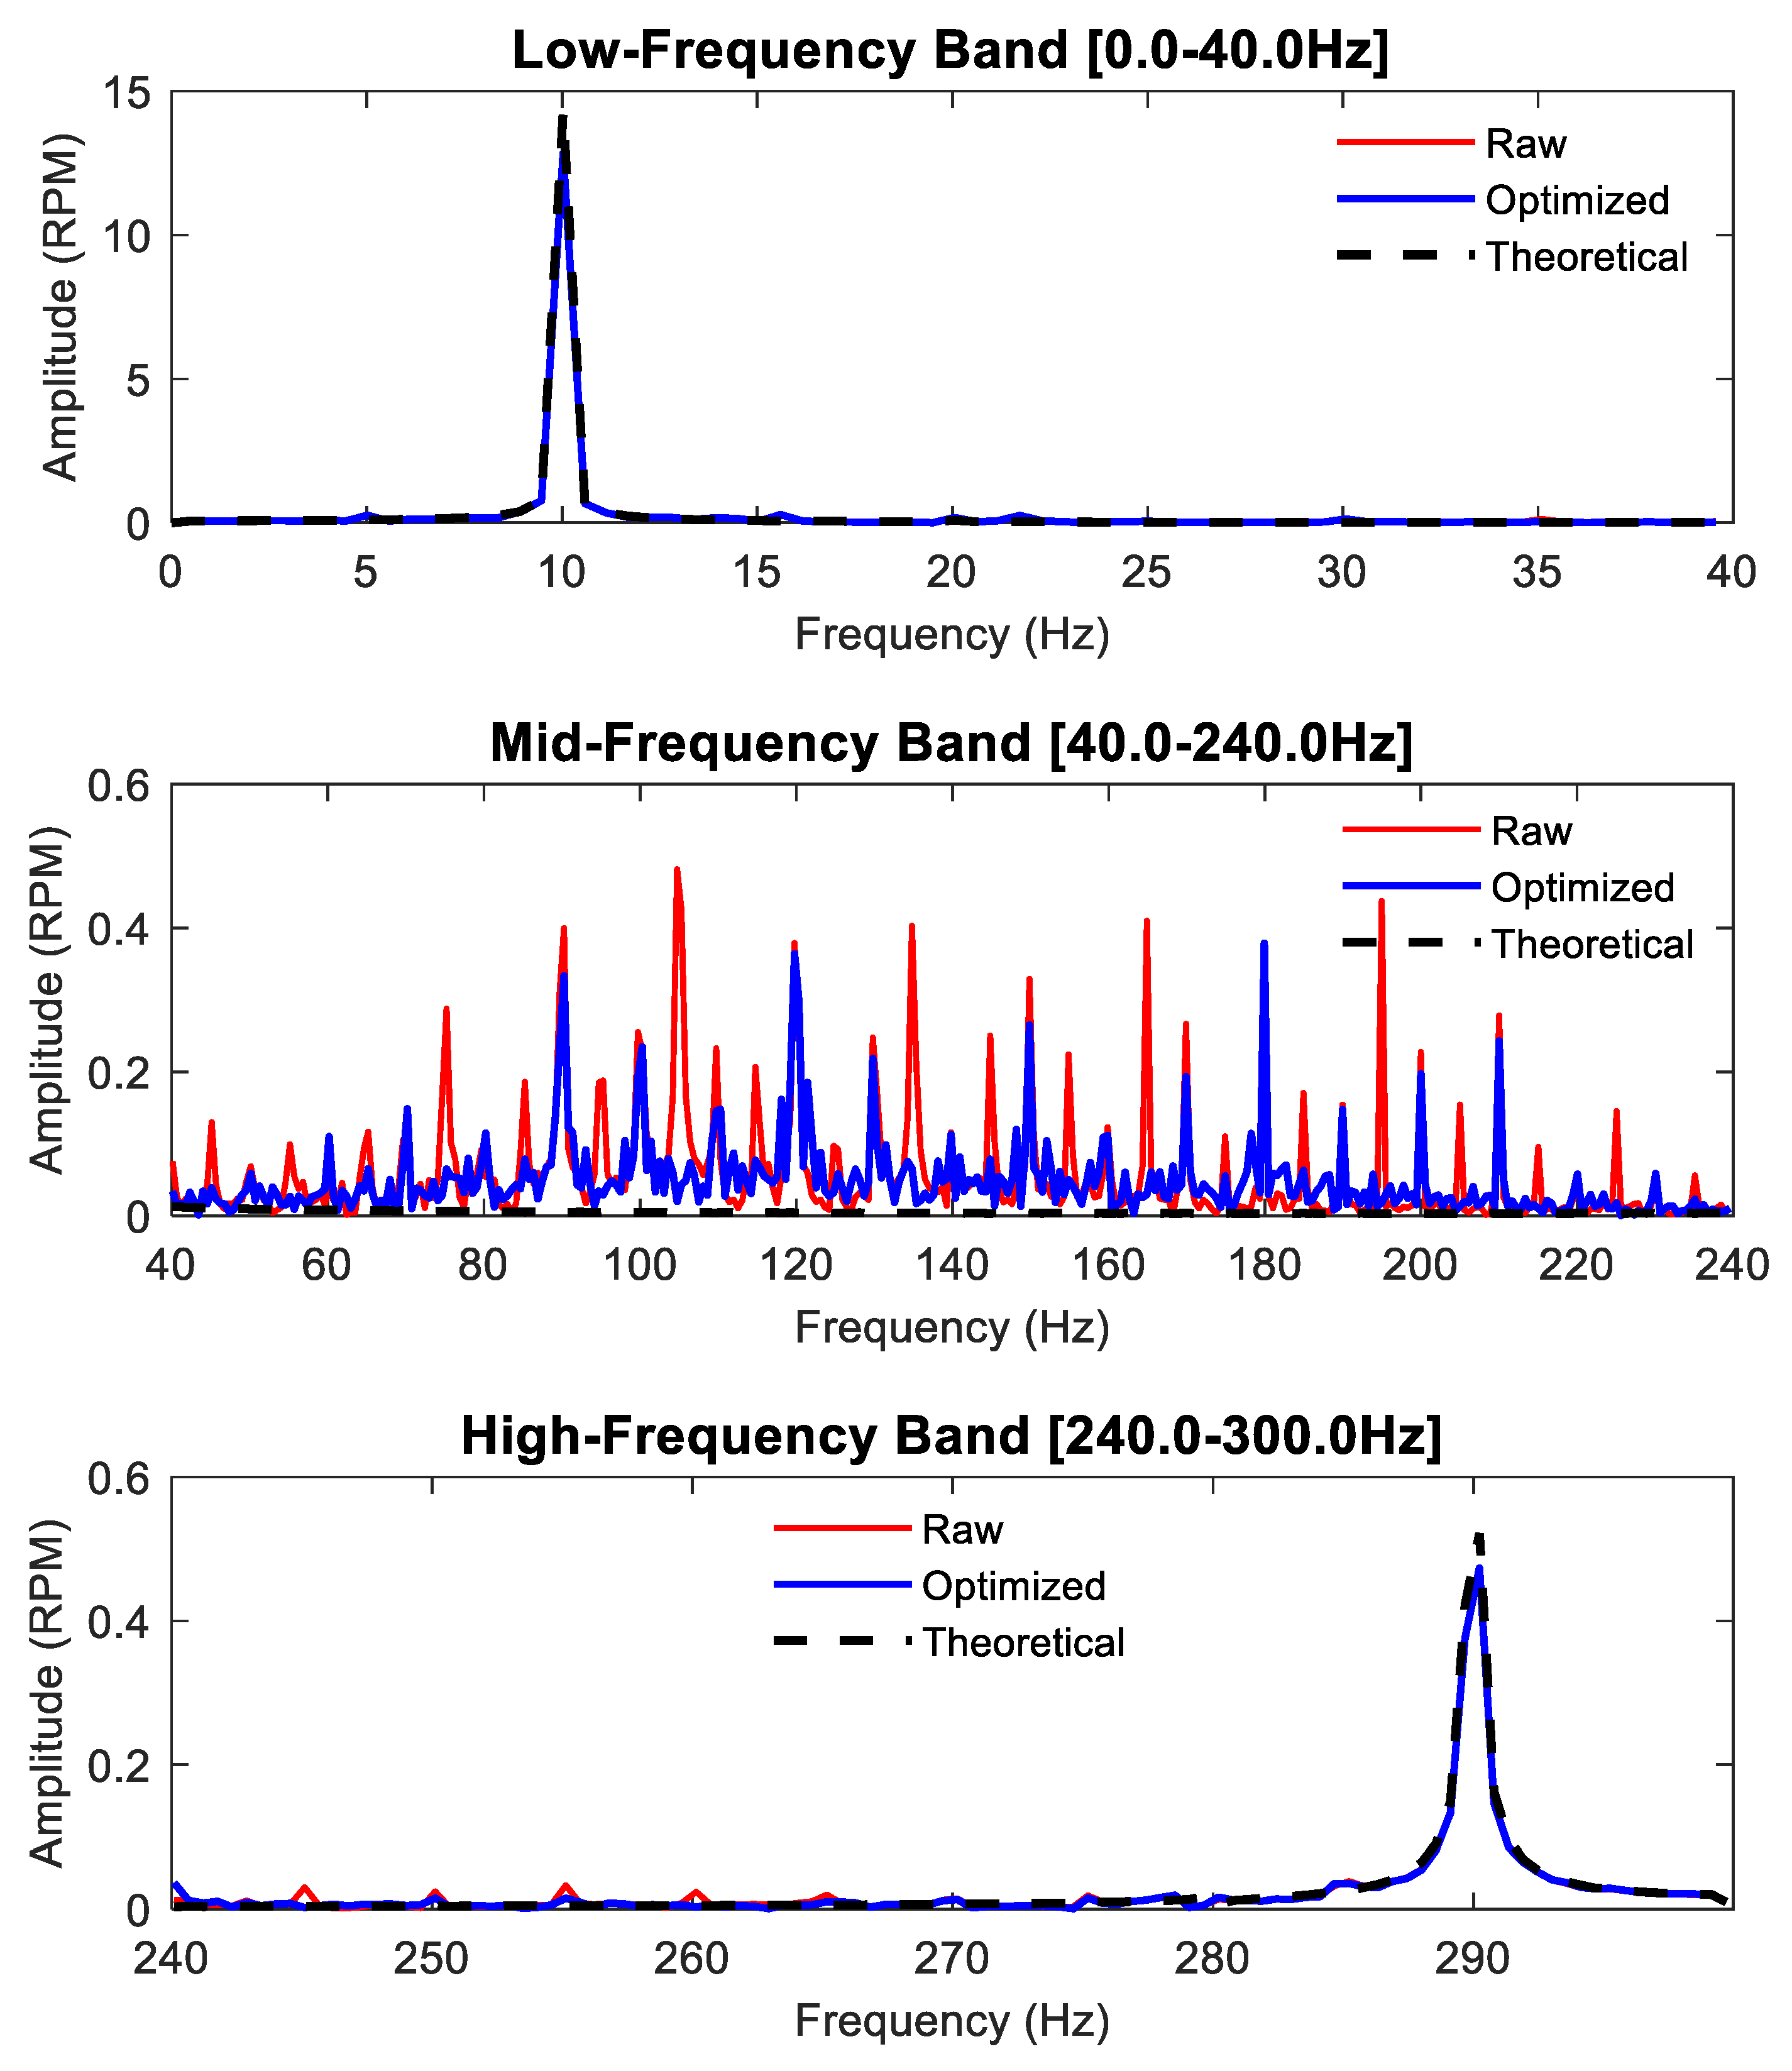
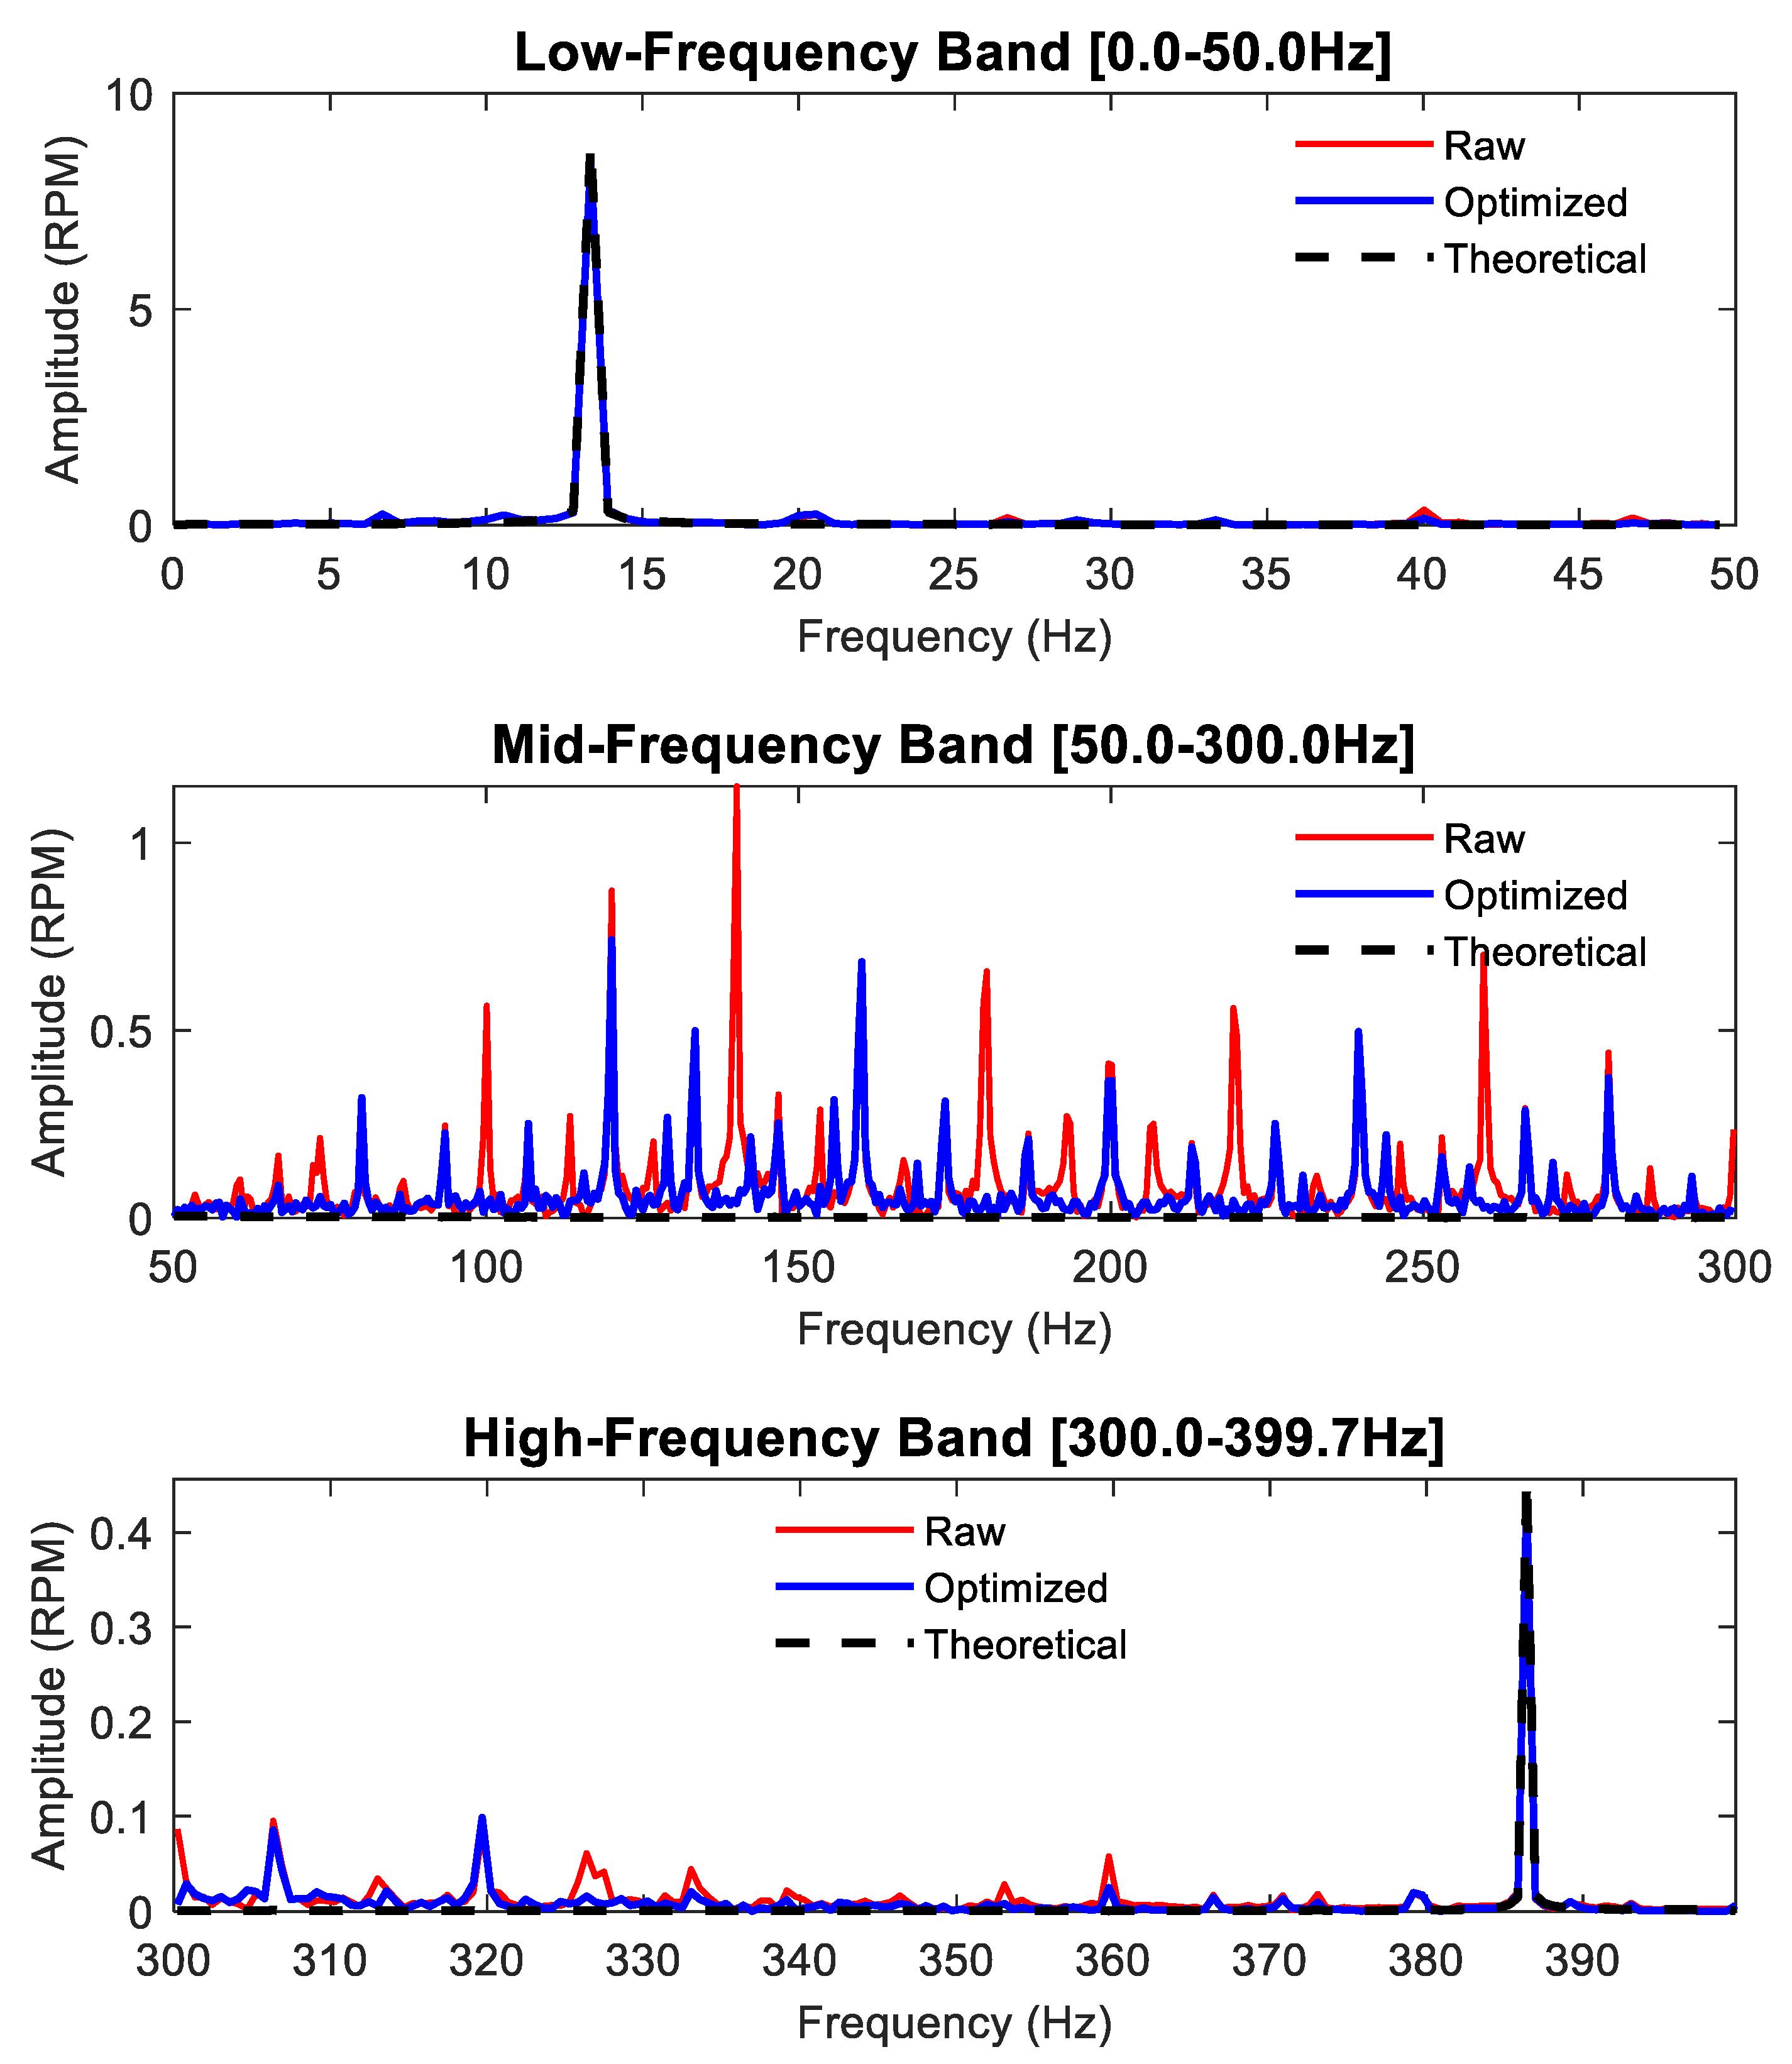
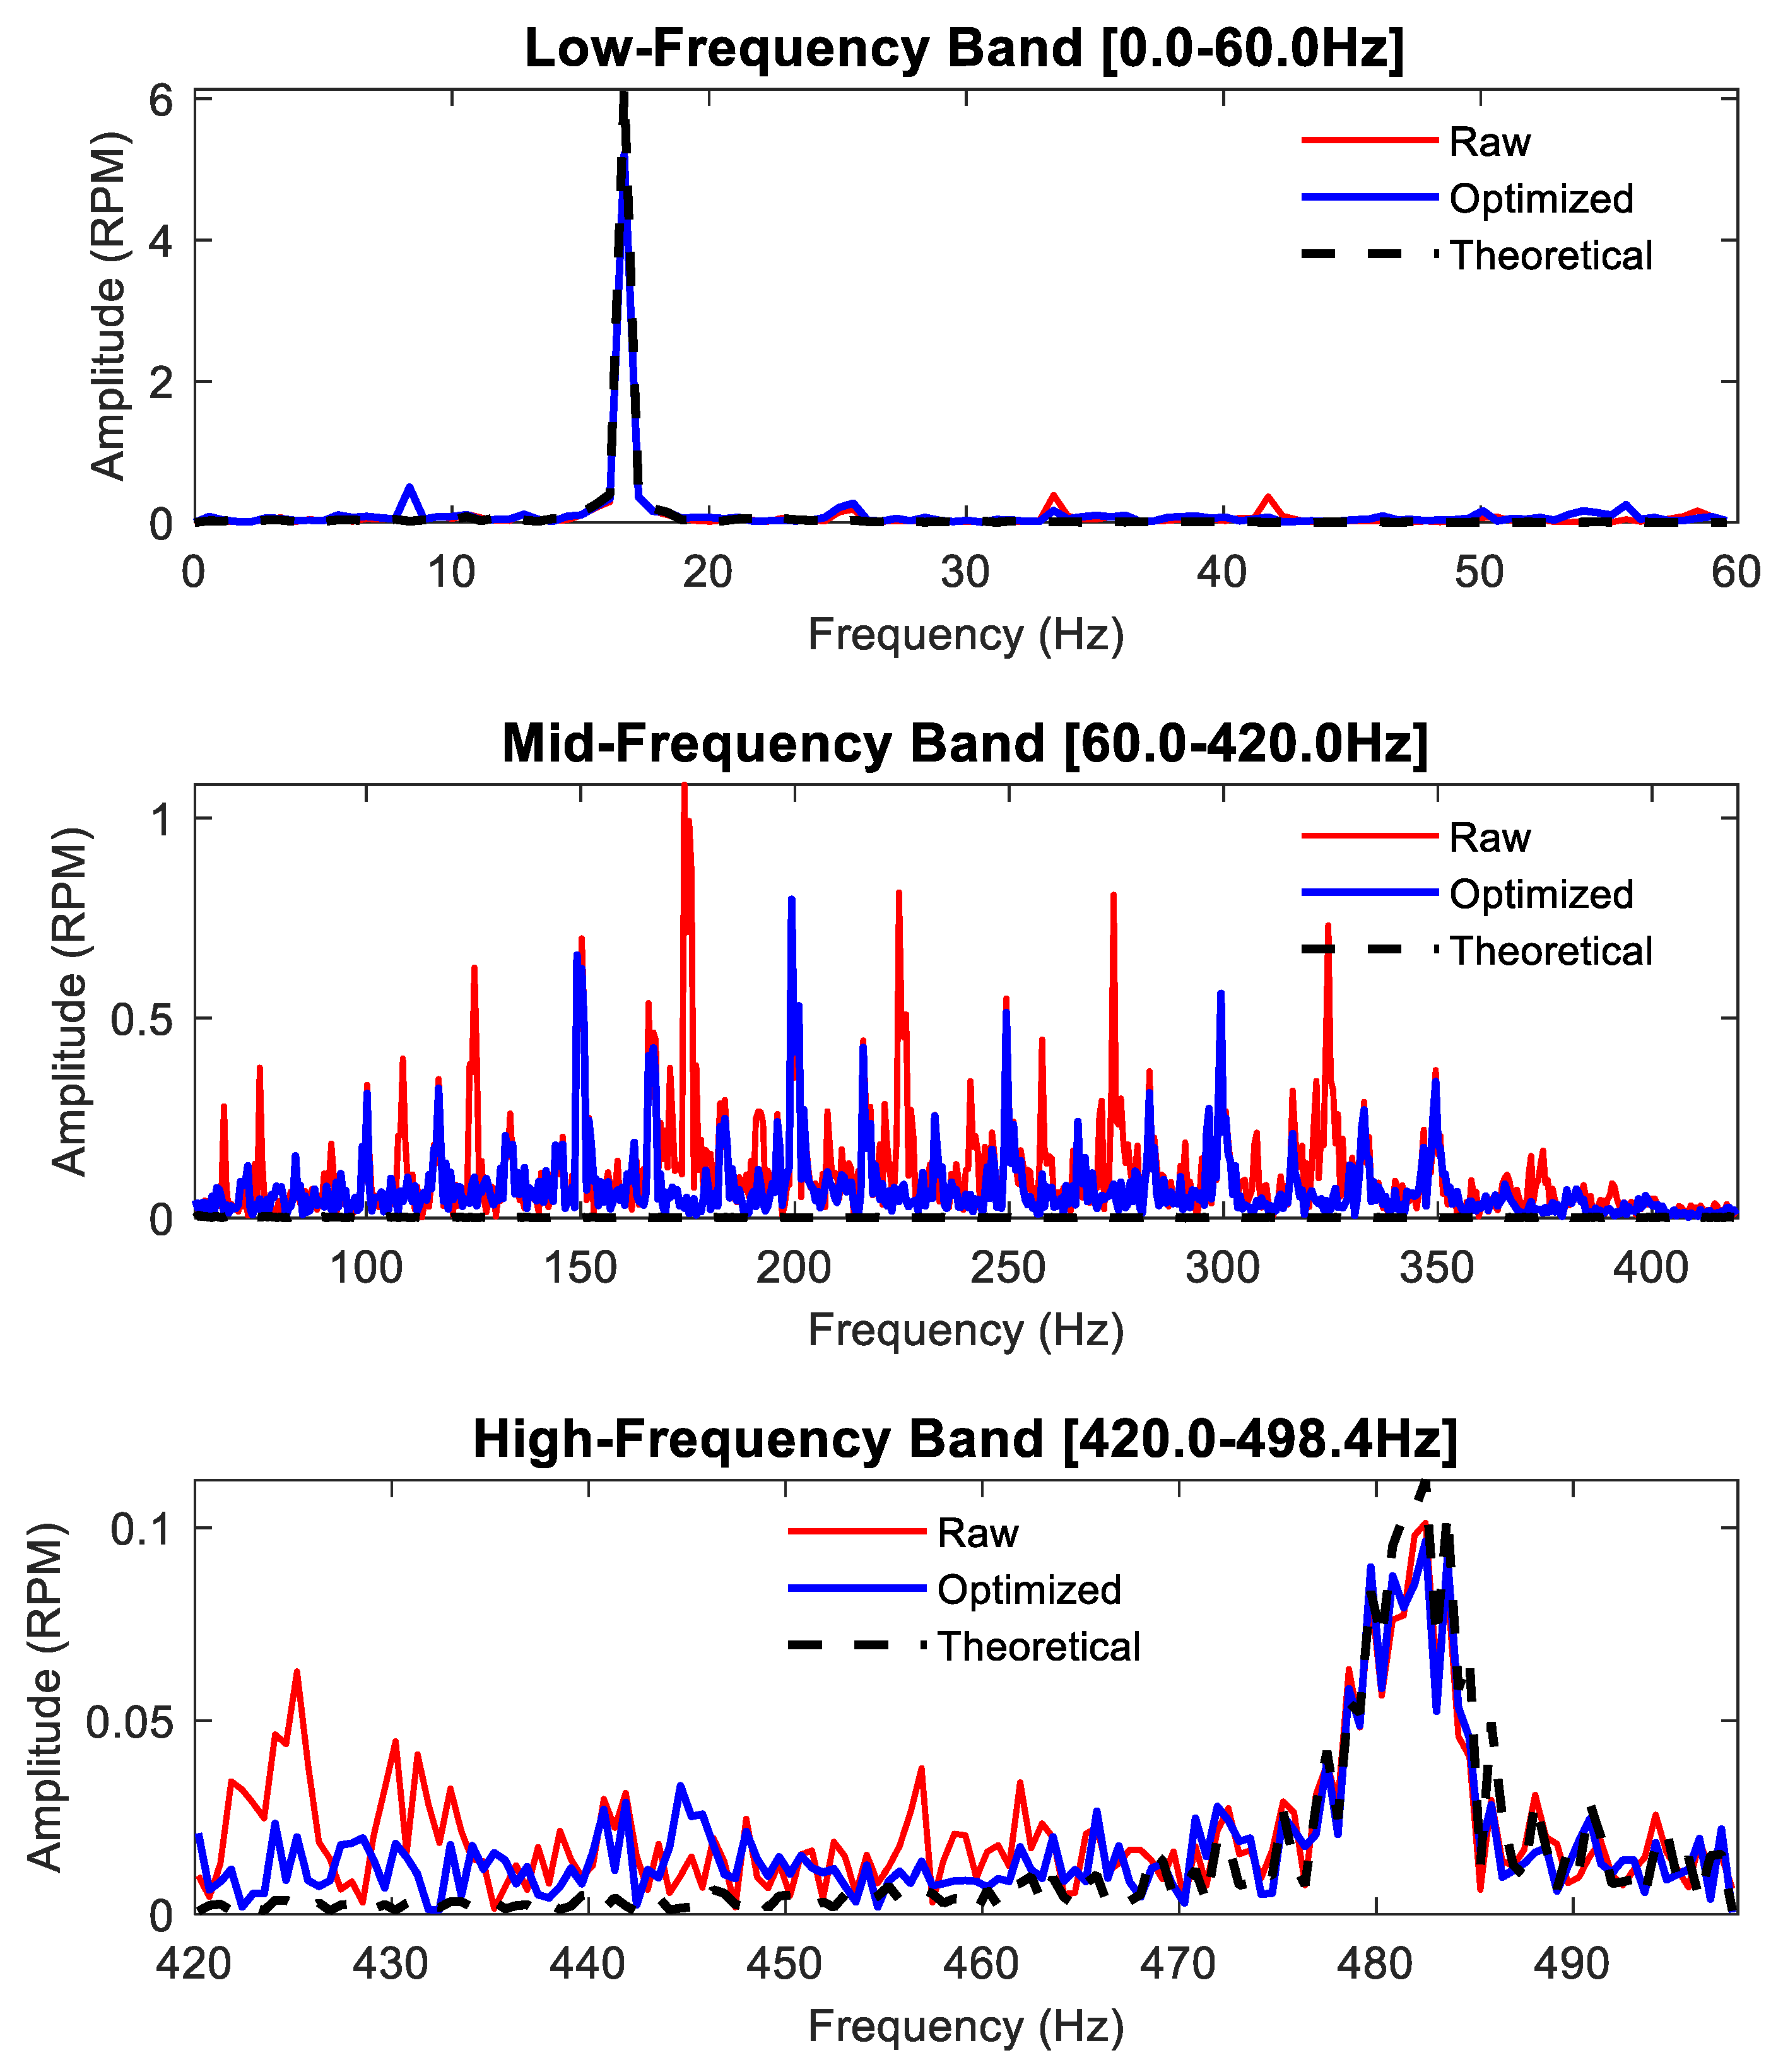
To investigate the effectiveness of the synchronous sampling method in mitigating runout interference in the frequency domain, a spectral analysis of the rotational speed signal was performed. To more clearly illustrate the interference of the runout phenomenon across different frequency bands and the algorithm’s restoration efficacy in these bands, the frequency-domain analysis of the rotational speed was segmented into low, medium, and high-frequency ranges. Consistent with the time-domain analysis, the theoretical rotational speed served as the baseline for comparison. The comparative results are depicted in
Figure 25,
Figure 26,
Figure 27 and
Figure 28, and the quantitative results are presented in
Table 4.
- (a)
The runout phenomenon induced during the experiments primarily interferes with the rotational speed signal in the medium and high-frequency bands, with relatively less interference observed in the low-frequency band.
- (b)
In the medium and high-frequency bands, the synchronous sampling method demonstrates commendable noise reduction capabilities, effectively mitigating the substantial noise introduced by the runout phenomenon in the medium-frequency range.
- (c)
In the high-frequency band, where noise frequencies overlap with the inherent rotational speed frequencies, the method achieves effective separation and reduction of noise. It successfully diminishes the impact of noise without compromising the original frequency components of the rotational speed.
Table 4 presents a comparative analysis of the deviation of the Raw and Optimized rotational speed datasets from the Theoretical rotational speed in the frequency domain. Key metrics, including the R-value and RMSE for each frequency band relative to the baseline and the RMSE improvement rate of the reconstructed rotational speed compared to the original rotational speed, were calculated. These metrics serve to quantitatively assess the capability of the synchronous sampling method to counteract runout interference in the frequency domain. An analysis of the data in
Table 4 indicates the following:
- (1)
Analysis of the R-values between the Raw rotational speed signals and the Theoretical rotational speed across different experimental groups generally shows the highest correlation in the low-frequency band, the lowest correlation in the medium-frequency band, and a relatively high correlation in the high-frequency band. This observation substantiates conclusion (a) drawn from the frequency-domain comparison plots.
- (2)
In the low-frequency band, despite being less affected by runout, the synchronous sampling method still achieves minor optimization. This is evident from the improvements in R-values and the RMSE improvement rates for all experimental groups.
- (3)
In the high-frequency band, runout introduces noise with frequency characteristics similar to the inherent frequencies of the rotational speed. The synchronous sampling method effectively reduces this noise while preserving the original frequency components. This is reflected by an increase in R-values, with notable improvements observed at 200 RPM and 500 RPM. The substantial RMSE improvements across all groups further corroborate this finding.
The aforementioned analysis demonstrates that the synchronous sampling method exhibits a significant capability to mitigate the interference of runout on torsional vibration measurements in the frequency domain under various experimental conditions.
6. Discussion
6.1. Interpretation of Findings
The experimental results provide compelling evidence for the efficacy of the proposed composite strategy. The time-domain analysis demonstrated that the synchronous sampling method consistently reduces the error between the measured and theoretical rotational speeds across all tested conditions. However, the most significant finding is the marked improvement in the correlation coefficient (R). This indicates that the method does more than simply reduce noise; it actively reconstructs the waveform, restoring the signal’s fidelity to the true torsional dynamics. The reduction in overall errors, quantified by lower RMSE and MAE values, corroborates this enhancement in data accuracy.
In the frequency domain, the analysis reveals the method’s nuanced effectiveness. The runout introduced during the experiments primarily generated interference in the medium and high-frequency bands. The synchronous sampling method showed superior anti-interference capabilities in these specific bands, significantly reducing noise where it was most dominant. Critically, this was achieved while preserving the primary low-frequency torsional vibration characteristics, which are often of greatest interest in powertrain analysis. This ability to selectively cancel interference without distorting the underlying signal addresses a key challenge that traditional low-pass filtering methods often fail to overcome, as they can inadvertently attenuate valuable high-frequency features or leave low-frequency noise untouched.
6.2. Comparison with Existing Methods
The proposed approach offers distinct advantages over the methods mentioned in the introduction. Compared to mechanical reinforcement strategies, which aim to physically suppress vibration by stiffening components like the sensor bracket, our method is significantly less invasive, lower in cost, and more practical to implement. It obviates the need for potentially complex and space-prohibitive mechanical modifications by addressing the error in the signal-processing domain.
Furthermore, while previous research such as that by Wang et al. has focused on compensating for errors arising from sensor bracket vibration [
23], our study targets the runout of the toothed disc itself. This is a more direct approach, as it addresses the error at its fundamental source—the dynamic change in the air gap between the sensor and the teeth—as modeled in our analysis. By using a symmetrically arranged dual-sensor structure to cancel this primary error component, the compensation mechanism is more direct and robust against the complex motion of the measurement target.
6.3. Limitations of the Study and Future Directions
Despite its demonstrated effectiveness, the proposed synchronous sampling method has several limitations. First, its performance is contingent on the proper functioning of both sensors; failure of one sensor renders the method inoperable. Second, the method assumes a relatively symmetrical runout pattern where the errors induced at opposite sensors are equal and opposite. In cases of highly complex or asymmetrical runout motion, the cancellation might be incomplete. Third, the accuracy is dependent on the precise symmetrical mounting of the sensors and assumes that both sensors have closely matched characteristics (e.g., sensitivity, phase response). Significant discrepancies could introduce residual errors. Finally, the random runout was simulated using elastic pads; applying and validating this method on in-service diesel engines under real-world load and thermal conditions would be a crucial next step.


