4.1. Design of Experiments
The frame structure is composed of interconnected components, and the size changes of each component have different effects on the modal and vibration response. Therefore, the thickness of the mounting plate P1, the inner diameter of the connecting tube P2, the outer diameter of the connecting tube P3, the height of the connecting tube P4, the outer diameter of the connection block P5, the thickness of the motor plate P6, and the width of the motor plate P7 were selected as the parameter variables of the design to study the correlation effects of each component parameter on the vibration characteristics. The range of the values is shown in
Table 5. The inner diameter of connecting tube P2 in the variables is always smaller than the outer diameter of connecting tube P3.
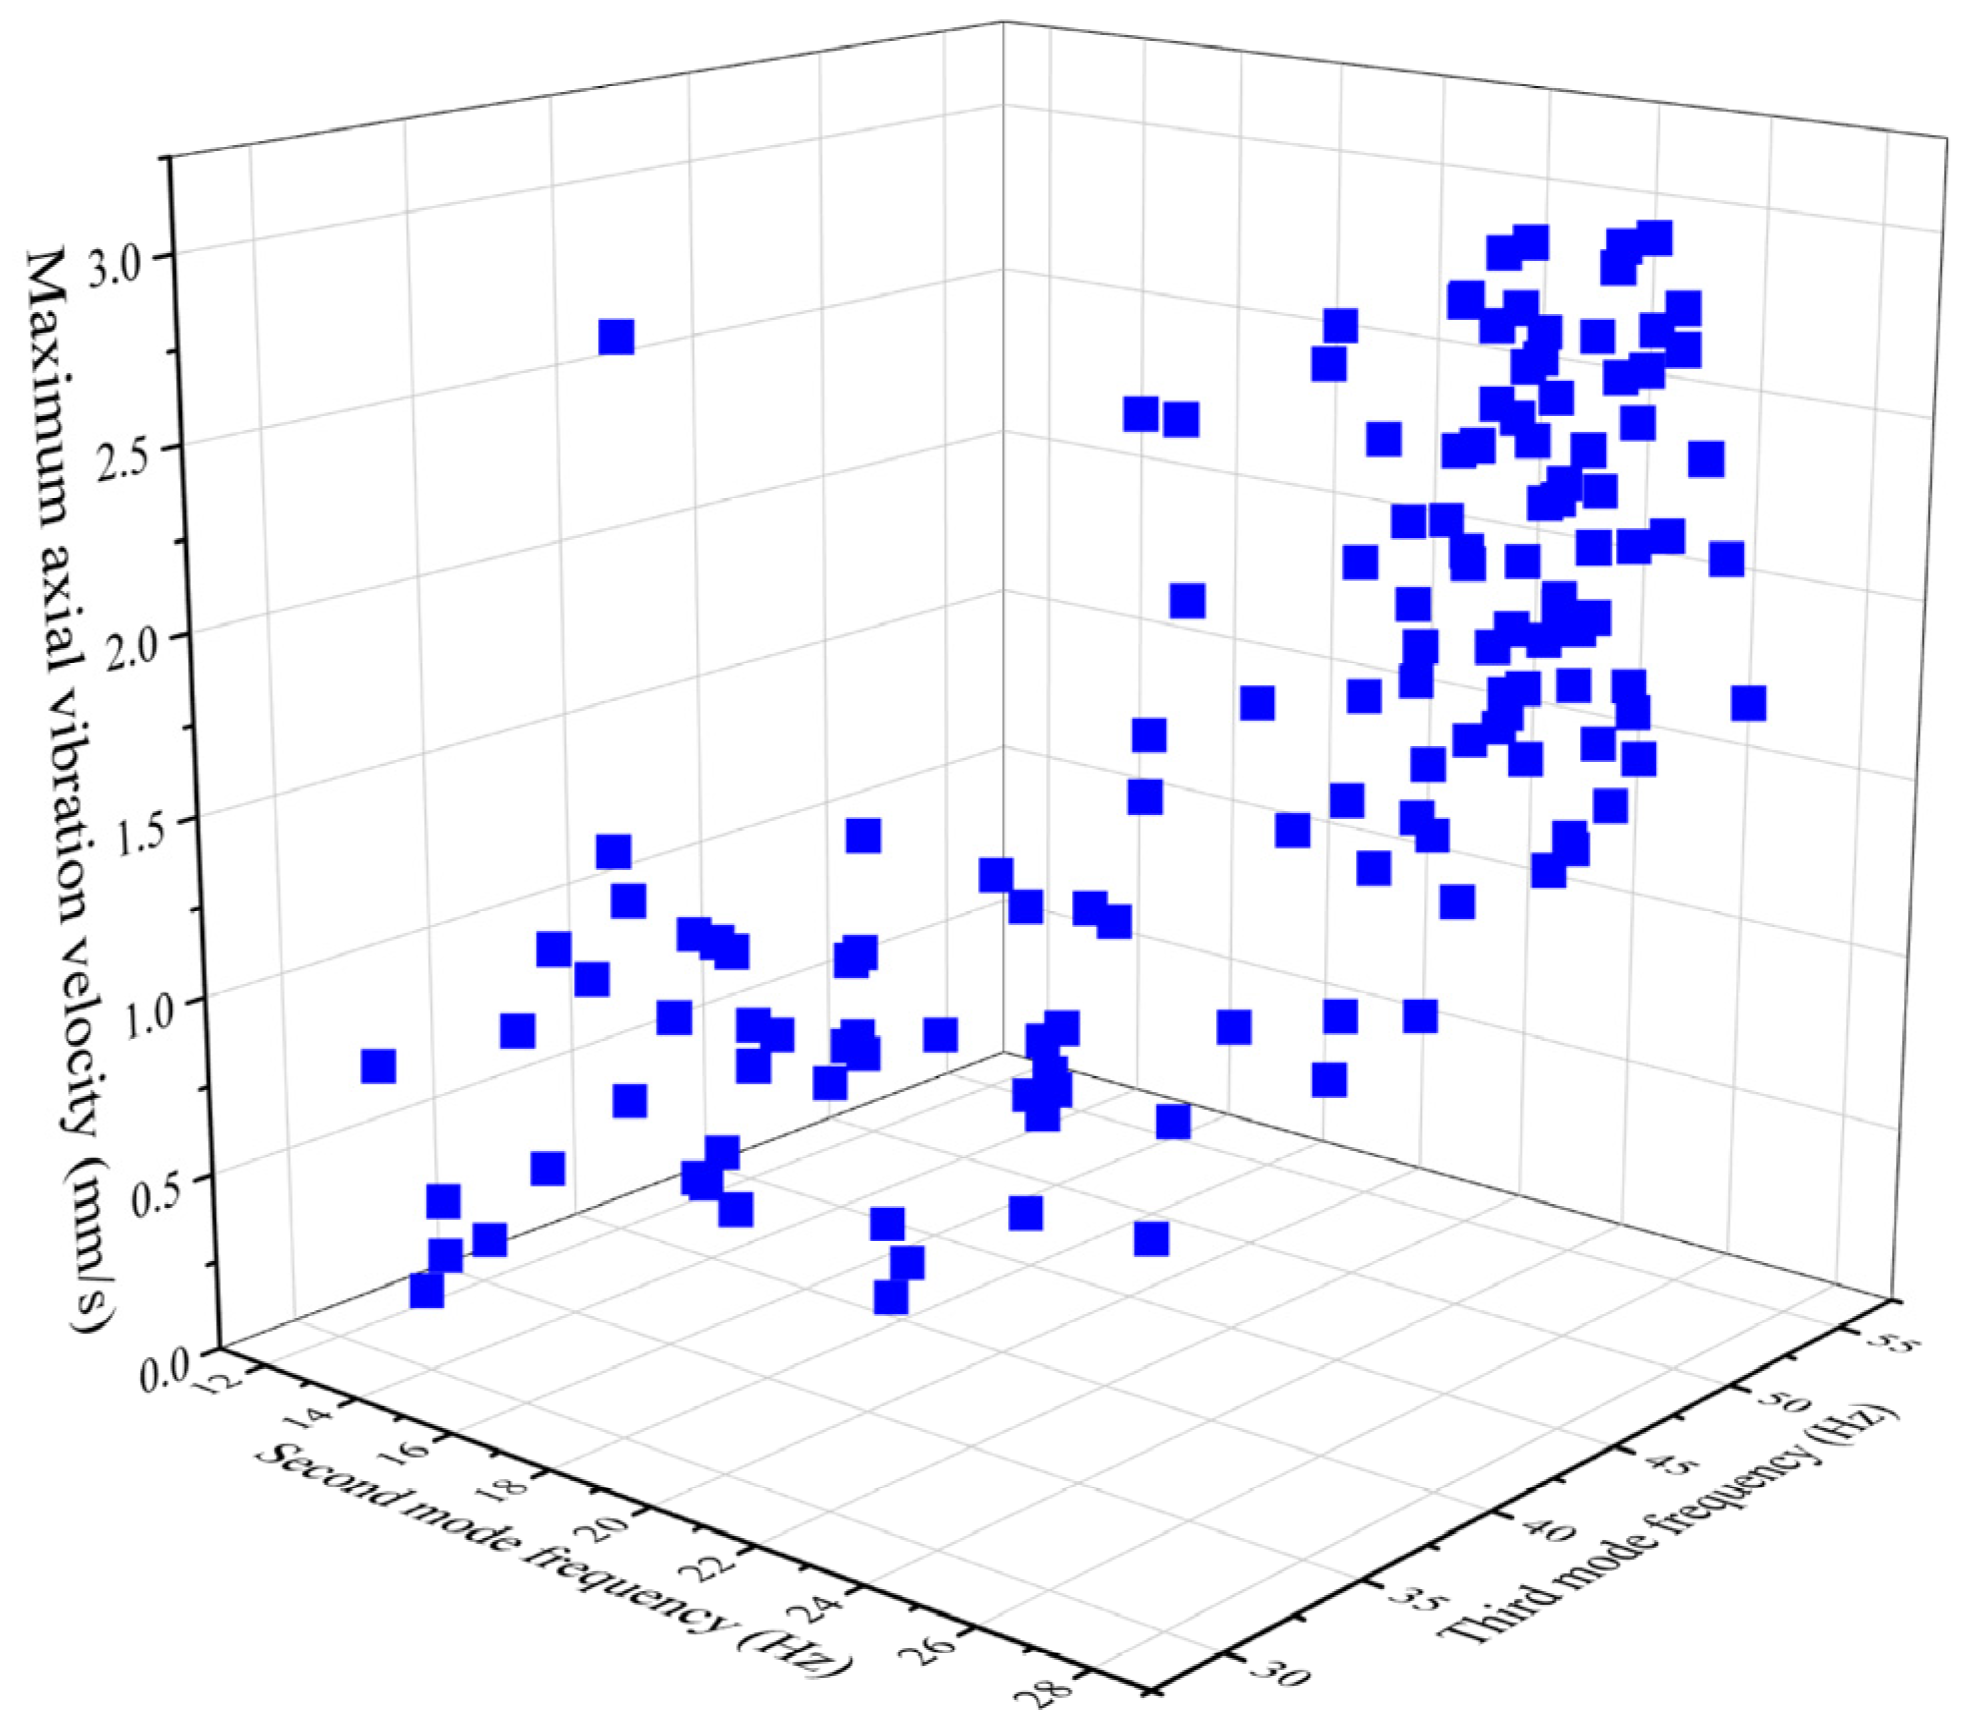
The selection of spatial sample points employs the optimal spatial filling design [
30,
31,
32] and is refined using Latin hypercube design [
33,
34]. Sample point sampling is shown in
Figure 12.
The response surface model uses the Kriging method [
35,
36]. This method uses a predictive regression algorithm that combines a polynomial model with the biased form of a specific Gaussian process and correlates covariance with spatial features.
In Equation (9), represents the predicted value, denotes the average predicted value, represents the mutation parameter, corresponds to the Gaussian kernel function, and represents the spatial point.
The analysis of variance to determine the lack of fit P between the design variables and the objectives, which are both less than 0.05, indicates that the fitting model has good fitness. The coefficient of determination
and relative root mean square error
determines the reliability of the Kriging response surface.
In Equations (11) and (12), is the value of the output parameter at the i-th sampling point, denotes the arithmetic mean of the values , signifies the value of the regression model at the i-th sampling point, and n is the number of sampling points. The closer the coefficient of determination is to 1, the higher that the fitting response surface accuracy is; the smaller the relative root mean square error , the better the response surface.
The response surface model is fitted based on experimental design data and analyzes the optimization objectives. The coefficients of different optimization objectives are shown in
Table 6. The coefficient of determination for all optimization objectives is greater than 0.9, and the relative root mean square error is within 10%, which indicates that the fitted response surface meets the accuracy requirements.
4.2. Response Surface Analysis
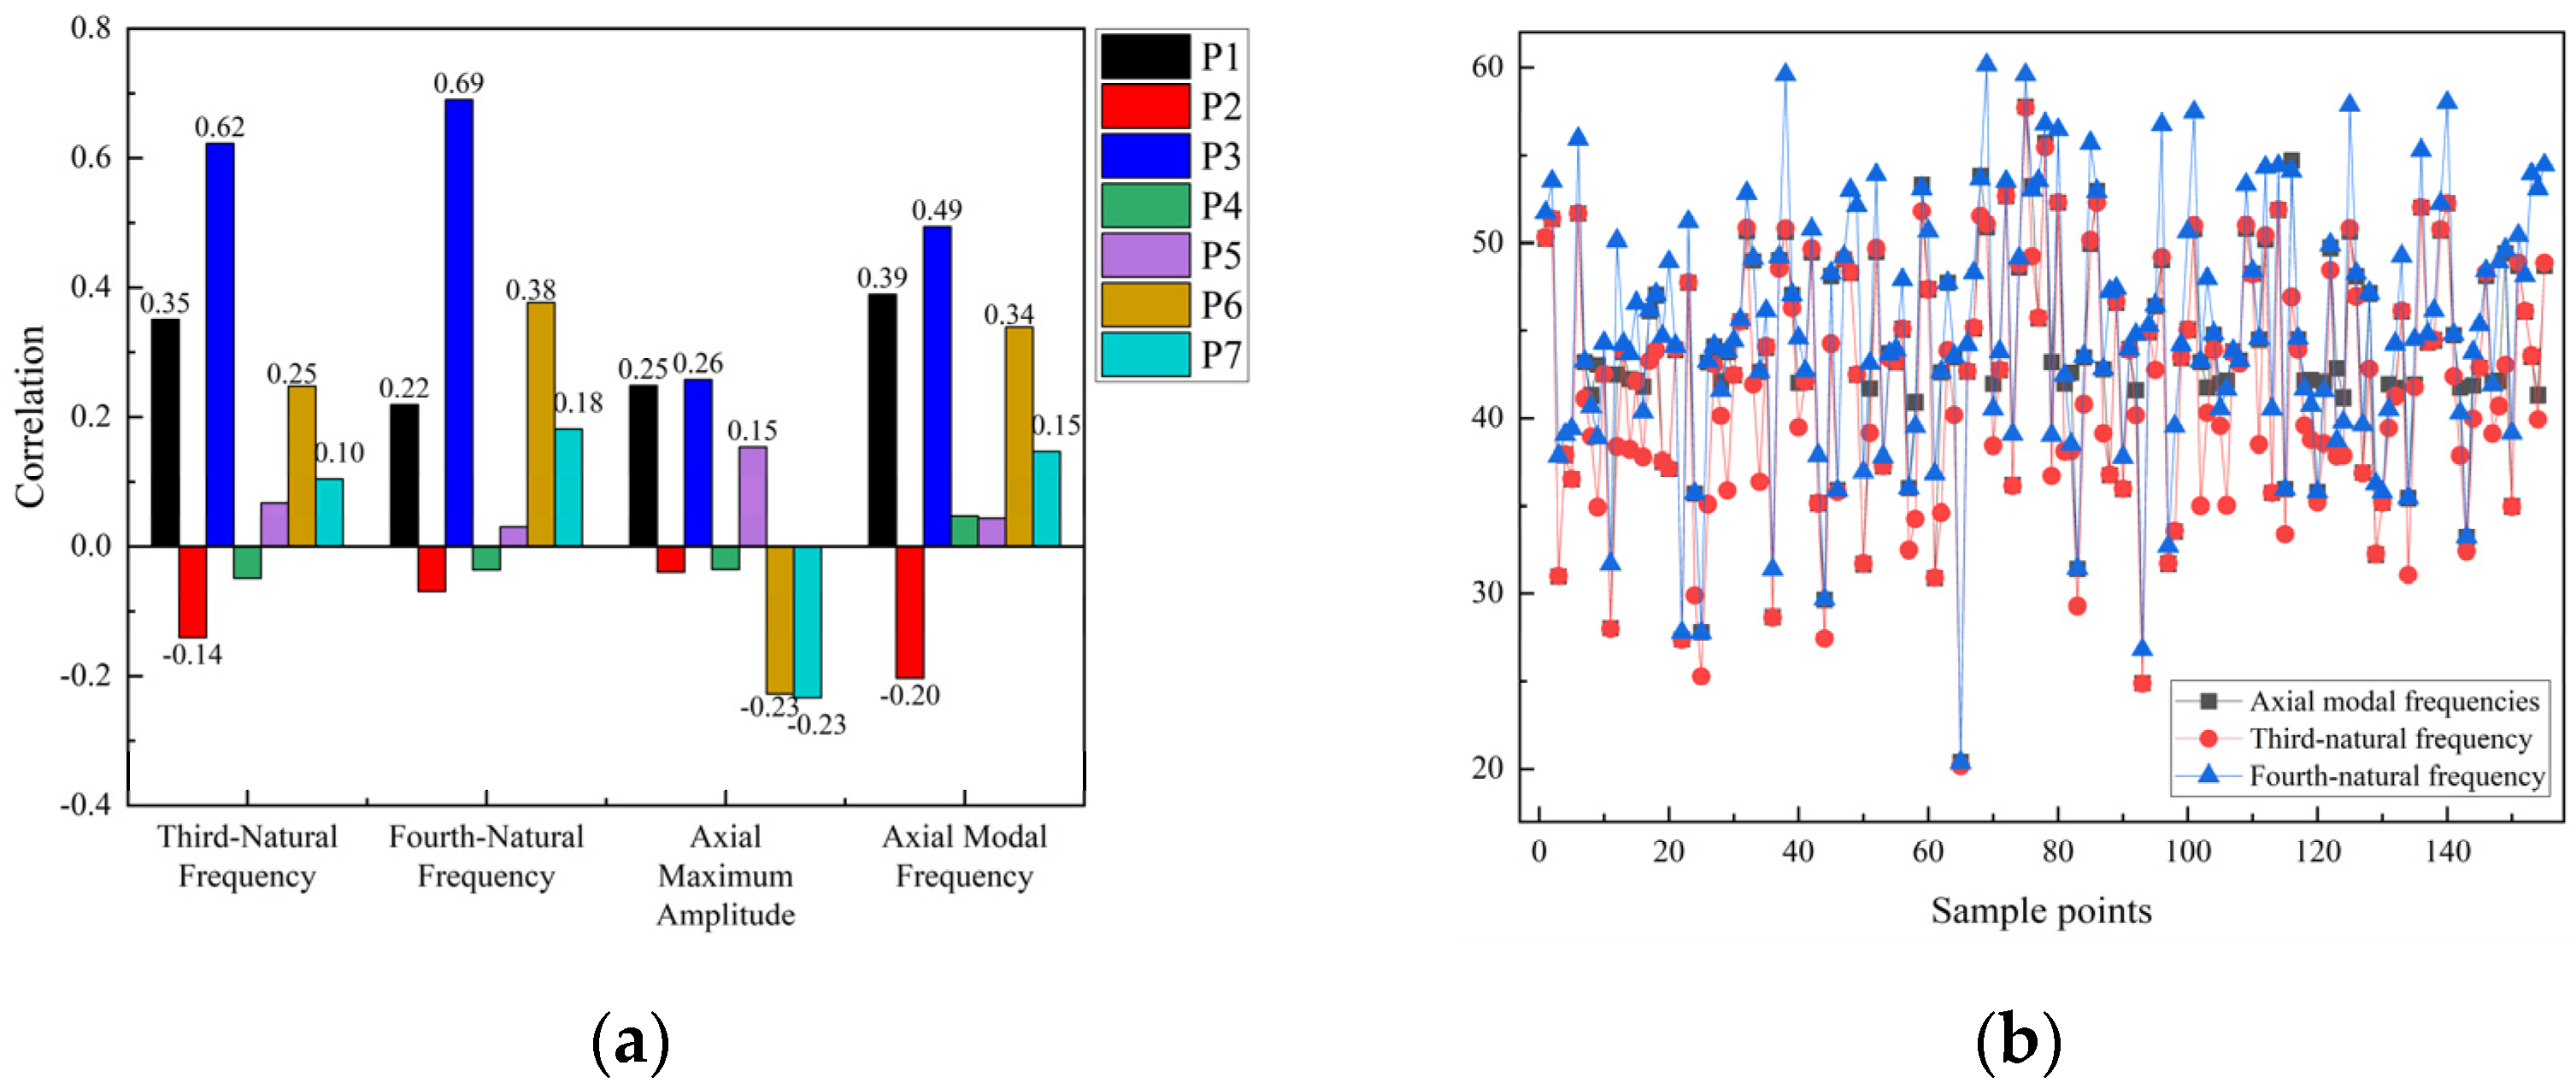
The results of the correlation analysis for the selected frame structure parameters, including their effects on the third-order modal frequency, fourth-order modal frequency, maximum axial amplitude, and corresponding axial modal frequency, are shown in
Figure 13. As shown in
Figure 13a, parameters P6 and P7 have a negative correlation with the maximum axial amplitude and a positive correlation with the axial modal frequency. It shows that increasing the thickness of the motor plate (P6) enhances the axial modal frequency and consequently reduces the axial vibration amplitude.
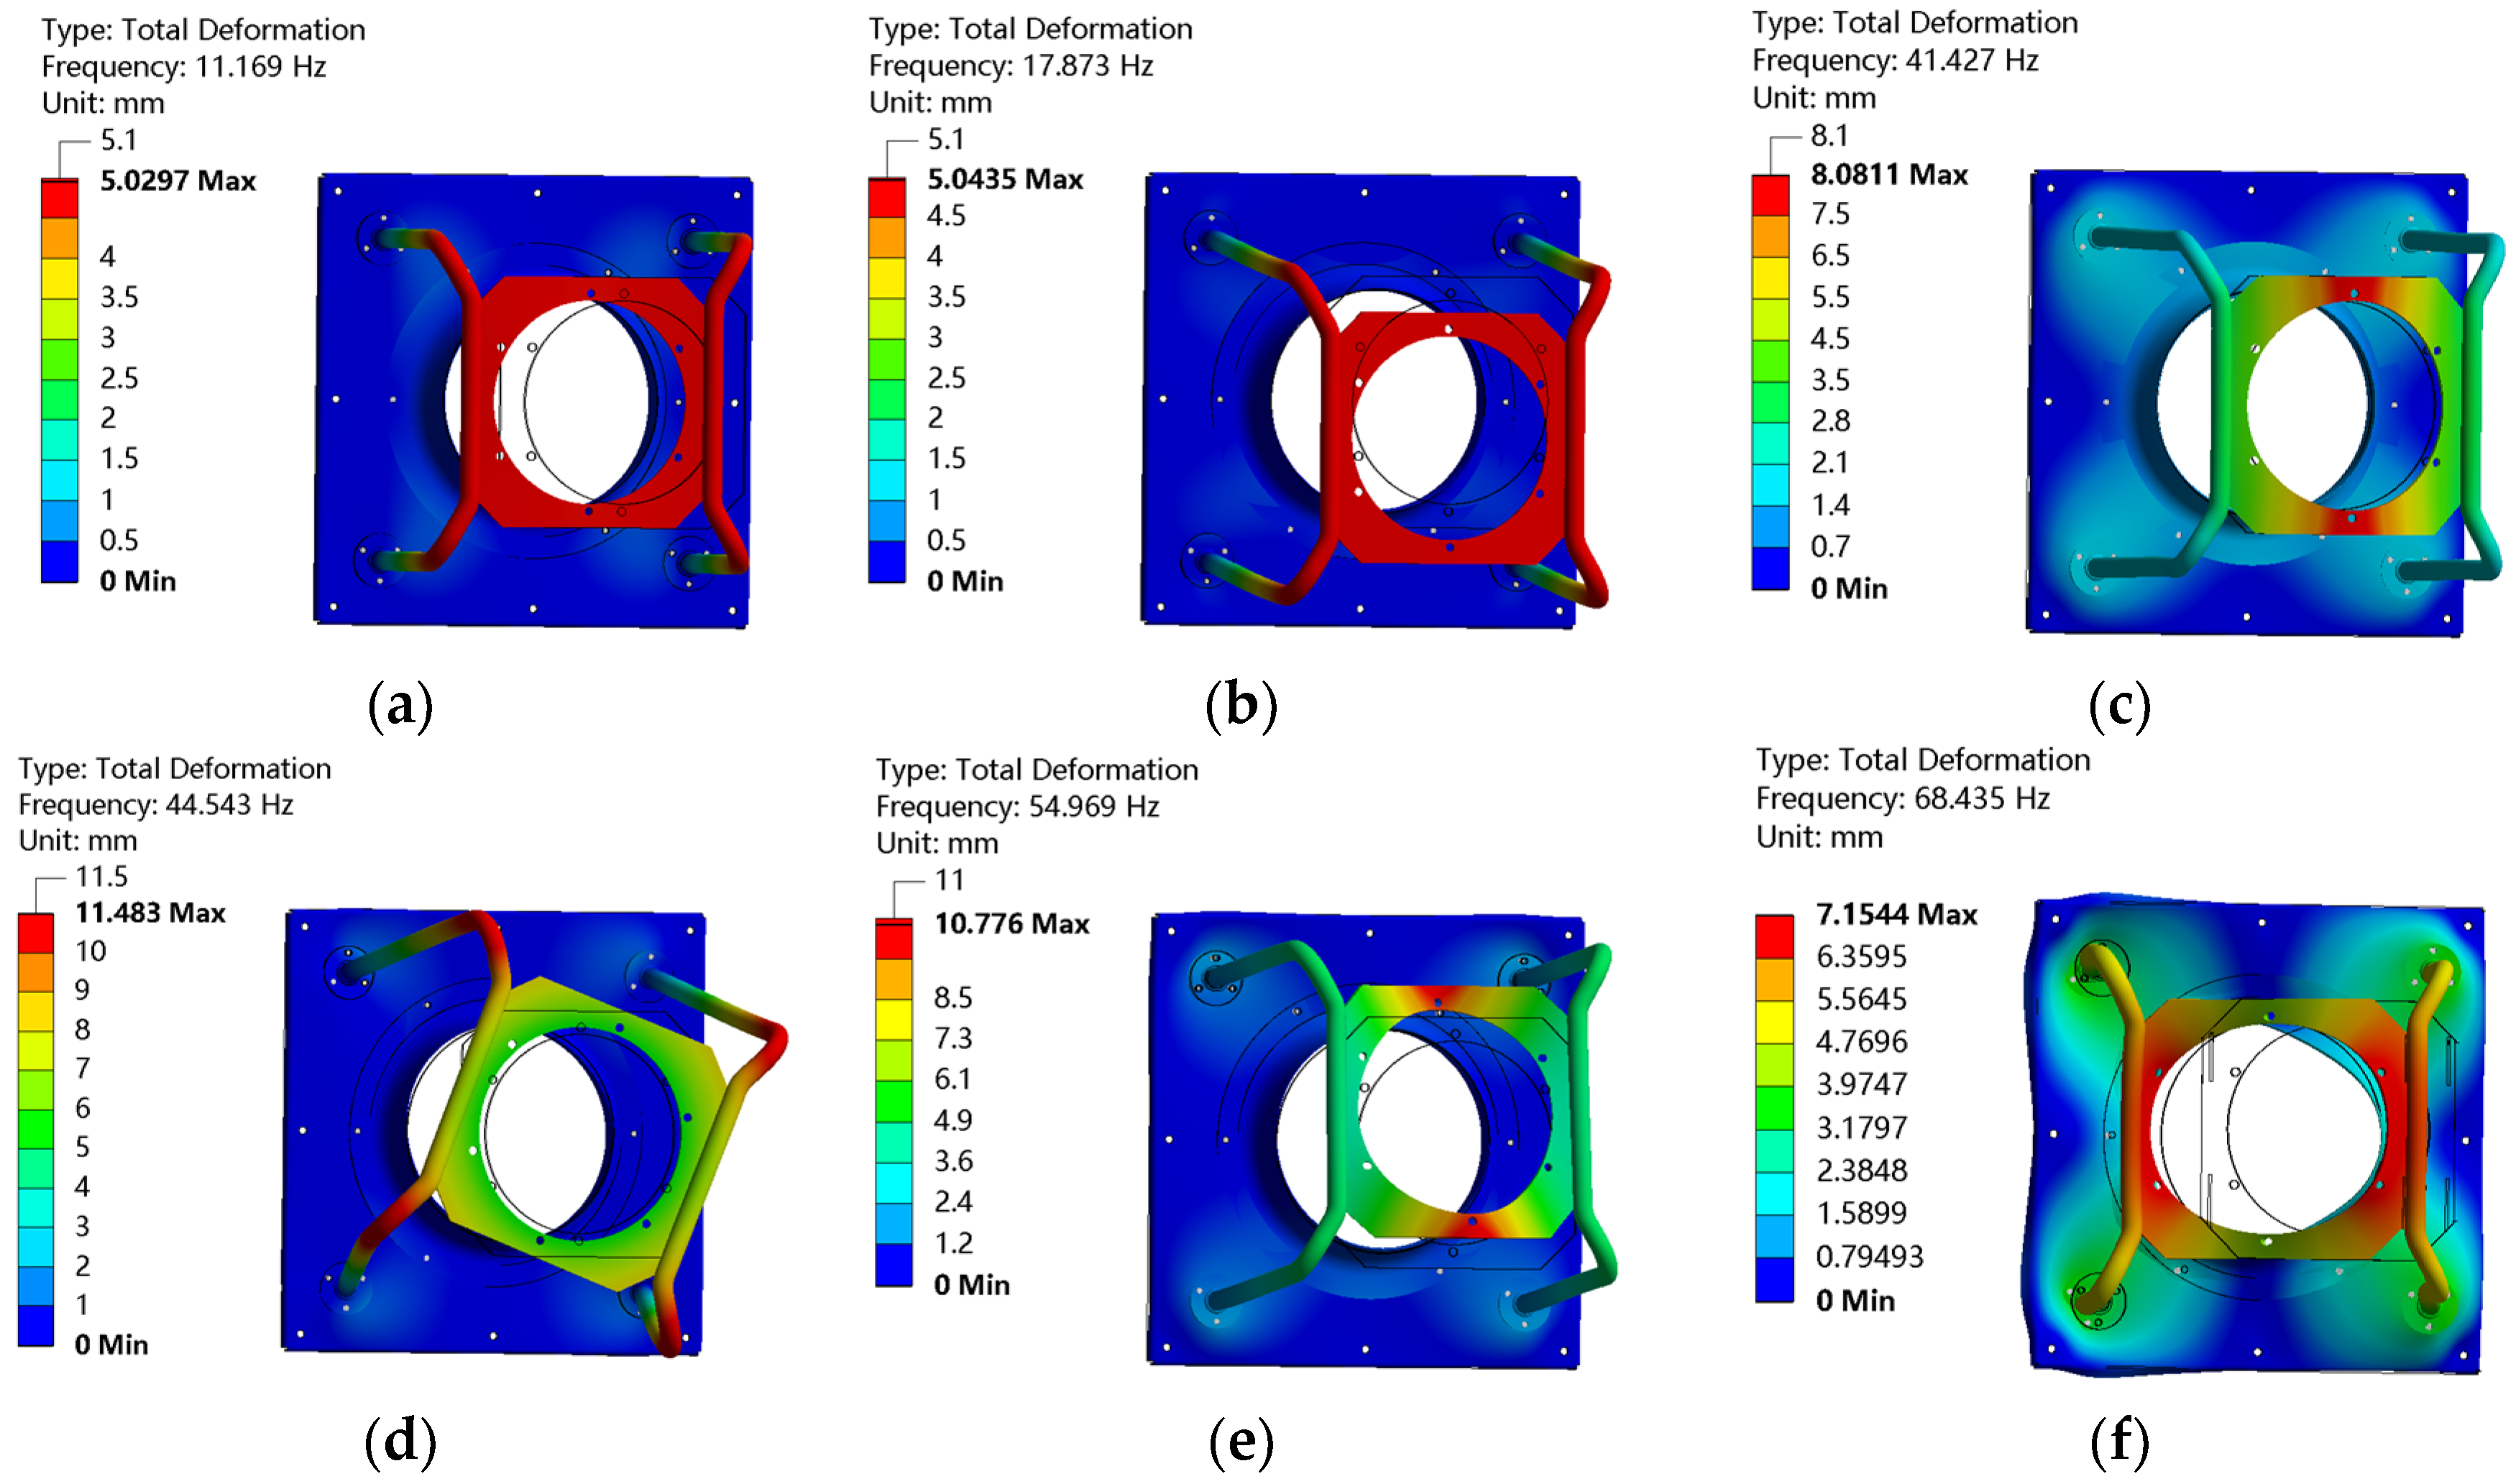
The test calculation shows that the axial modal frequencies are consistent with the third- or fourth-order modal frequencies, as shown in
Figure 13b. Since the axial wave modes of different structures are consistent with the third- or fourth-order modal frequencies, the third-order modal frequencies can be increased to avoid shaft frequency excitation and reduce vibration response.
From the correlation,
Figure 13a indicates that the mounting plate thickness P1, connecting tube inner diameter P2, connecting tube outer diameter P3, motor plate thickness P6, and motor plate width P7 are more correlated. So, four of them are selected for response surface analysis.
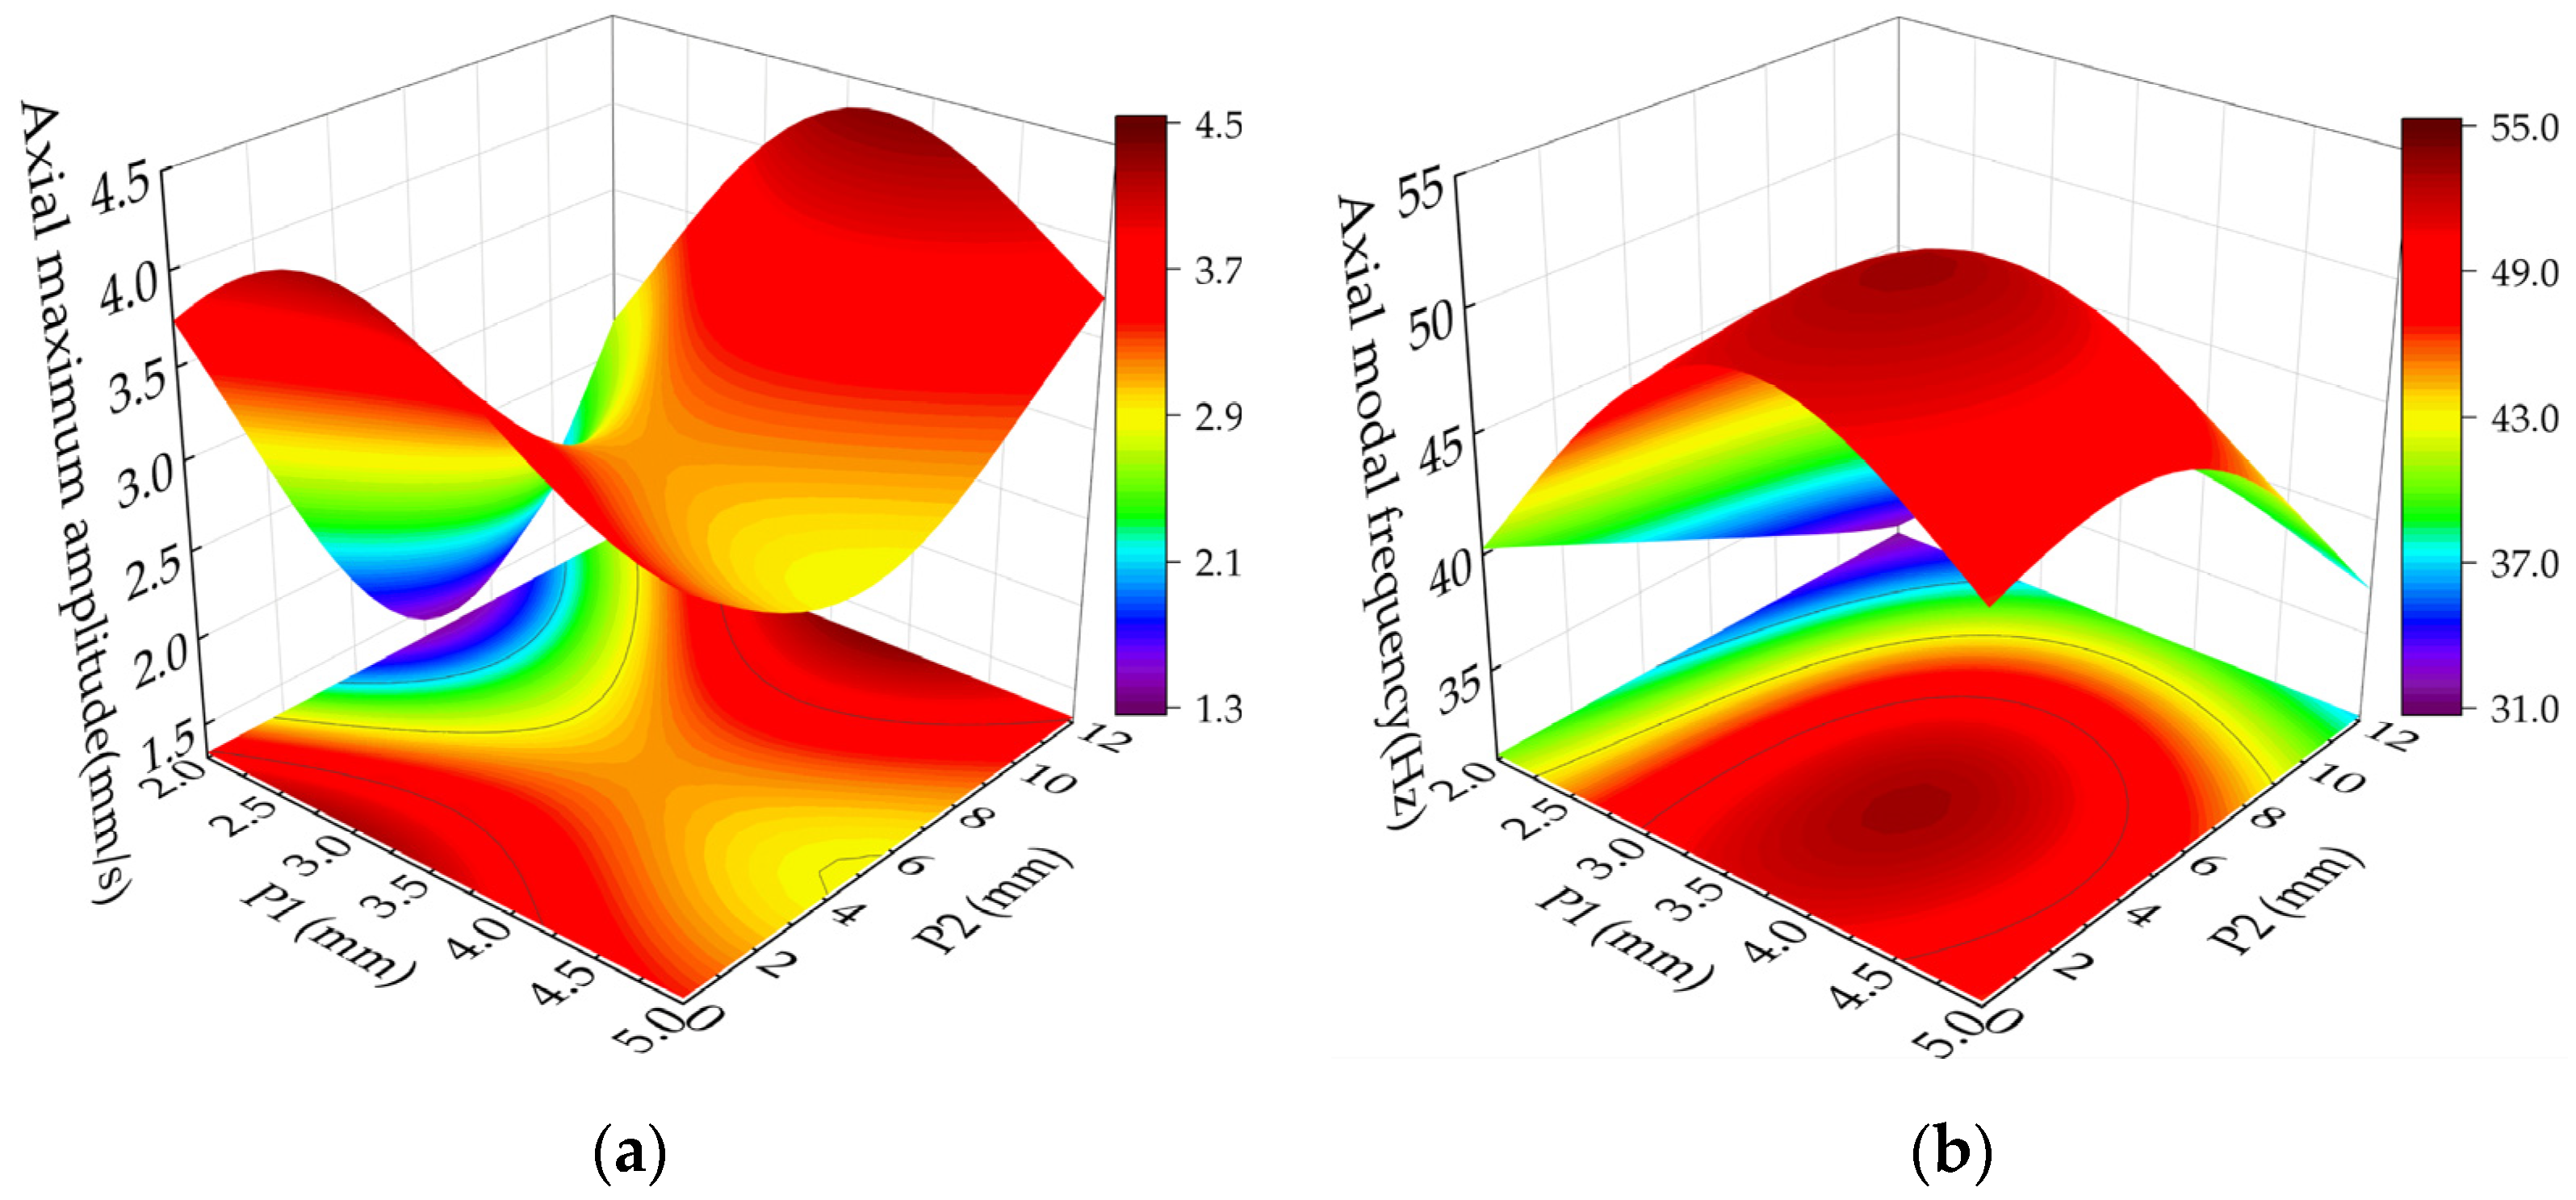
Figure 14 shows the response surface of the interaction between the mounting plate thickness P1 and the inner diameter of the connecting tube P2.
Figure 14a shows that the maximum axial amplitude increases first and then decreases with the increase in the installation plate thickness P1. That is because the mounting plate thickness P1 increases, and the axial modal frequencies approach the excitation frequency, resulting in resonance. As the thickness of the mounting plate P1 continues to increase, the axial modal frequencies increase, and the difference between the excitation frequency increases, thereby hindering the ability to stimulate the resonance.
The inner diameter of the connecting tube P2 increases, and the axial maximum amplitude first decreases and then increases. That is because the connecting tube’s inner diameter P2 changes in the connecting tube with the quality of weakening the structural rigidity of the impact of the increase, and the axial modal frequencies increase. The connecting tube inner diameter P2 continues to increase, the connecting tube thickness is too small, resulting in a lack of stiffness, and the axial modal frequency decreases, increasing the maximum amplitude of the axial component.
As shown in
Figure 14b, the axial modal frequencies first increase and then decrease with the increasing mounting plate thickness P1 and the inner diameter P2 of the connecting tube. That indicates that increasing the structure’s thickness has a limited effect on improving the rigidity.
Increasing the thickness of the components in the structure always increases the stiffness first, thus increasing the axial modal frequencies. Then, the influence of the mass on the structure increases so that the axial modal frequencies decrease.
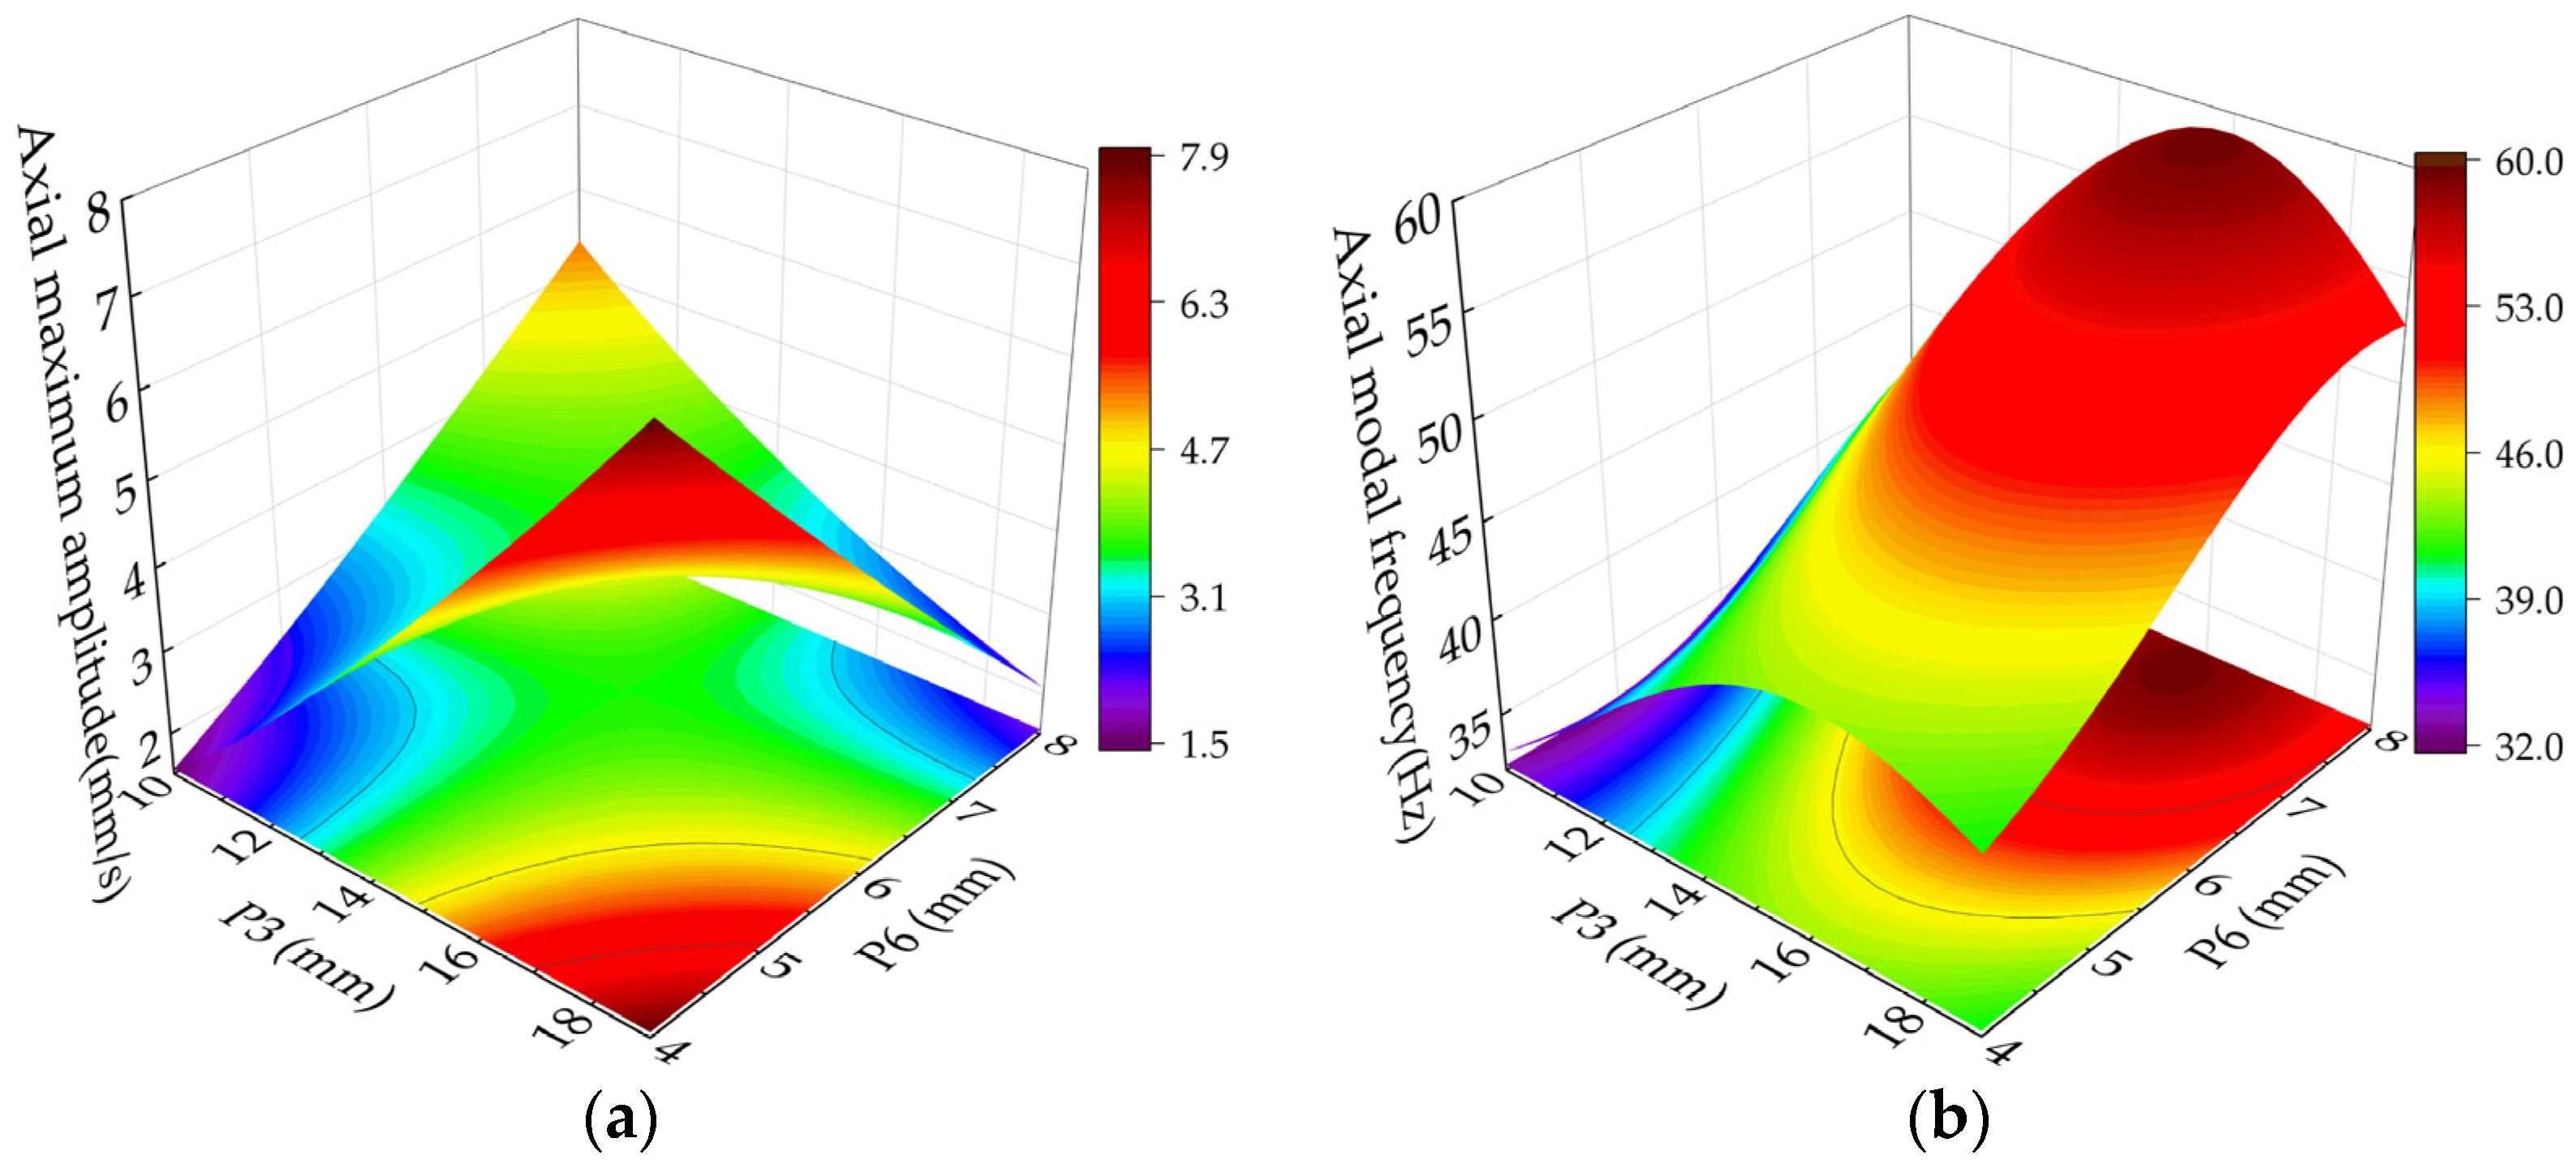
The relationship between the maximum axial amplitude with the outer diameter of the connecting tube (P3) and the thickness of the motor plate (P6) is illustrated in
Figure 15a. When the motor plate thickness (P6) is small, the maximum axial amplitude increases rapidly with the increasing outer diameter of the connecting tube (P3). It is attributed to two factors: firstly, the axial modal frequency range of the structure remains close to the excitation frequency, leading to resonance phenomena. Secondly, as the outer diameter of the connecting tube (P3) increases, the stiffness of the motor board relatively decreases, which helps to excite axial resonance. This effect diminishes as the thickness of the motor plate (P6) increases.
With a sufficiently large motor plate thickness (P6), an increase in the outer diameter of the connecting tube (P3) results in a further difference between the axial mode frequency and the excitation frequency, preventing resonance. Consequently, the maximum axial amplitude decreases under these conditions.
From
Figure 15b, the axial mode frequency increases initially and decreases as the connecting tube P3 increases. The thickness P6 of the motor plate increases, and the axial modal frequency increases monotonically. Compared with the outer diameter P3 of the connecting tube, the influence of the thickness P6 of the motor plate on the axial mode frequency is more visible. That is because the motor plate causes axial resonance.
From
Figure 14 and
Figure 15: (1) the contour curves in the axial modal frequency response surface diagram and axial maximum amplitude response surface diagram are elliptical, indicating that relevant parameters have strong interaction concerning the axial modal frequencies and the axial maximum amplitude. (2) Under interaction, the influence of any two variables on optimization objectives is nonlinear. (3) Resonance can be avoided if the difference between excited and modal frequencies outweighs 7 Hz.
4.3. Optimized Design
A multi-objective genetic algorithm (MOGA) [
37] is employed to design the dimensions of a frame structure. The goal is to reduce the structure’s maximum axial amplitude and enhance axial modal frequencies. Additionally, the algorithm considers the maximum equivalent stress and maximum deformation, ensuring that these objectives remain within a safe range.
The multi-objective optimization model is represented as follows:
In Equation (13), is the design variable; and are the range of values for the design variables; is the optimization objective; is the design space; and are the -th constraint inequality, which is used to determine the feasibility range of the optimal solution.
This paper constrains the structure size and provides an optimization target range. The priority of multi-objective optimization from top to bottom is vibration response, modal frequencies, maximum deformation, and maximum equivalent stress. The results show that both the maximum equivalent stress and maximum deformation are within the requirements for use. The Pareto solution set for maximum vibration response and modal frequency is shown in
Figure 16.
Three groups of solutions satisfying the multi-objective optimization of frame structures are selected from the Pareto solution set, and the first- and second-order modal frequencies are required not to be within the operating shaft frequency range. The structural design variables and corresponding optimization results are presented in
Table 7.
The comparison between the optimized predicted values and calculated verification values revealed that the maximum absolute error for the predicted maximum axial amplitude is 0.4872 mm/s, and the maximum absolute error for the predicted results axial modal frequency is 2.333 Hz. The results show that multi-objective optimization is effective for the vibration reduction design of fan frames. Both the maximum deformation and the maximum equivalent stress were increased, thus satisfying the structural strength requirements.
4.4. Optimization Results and Analysis
Considering the frame structure size, weight, and manufacturing cost, the third group of optimal solutions is selected for rounding processing, and the comparison results are shown in
Table 8. There is no significant change in vibration characteristics before and after rounding, and they are within a reasonable range.
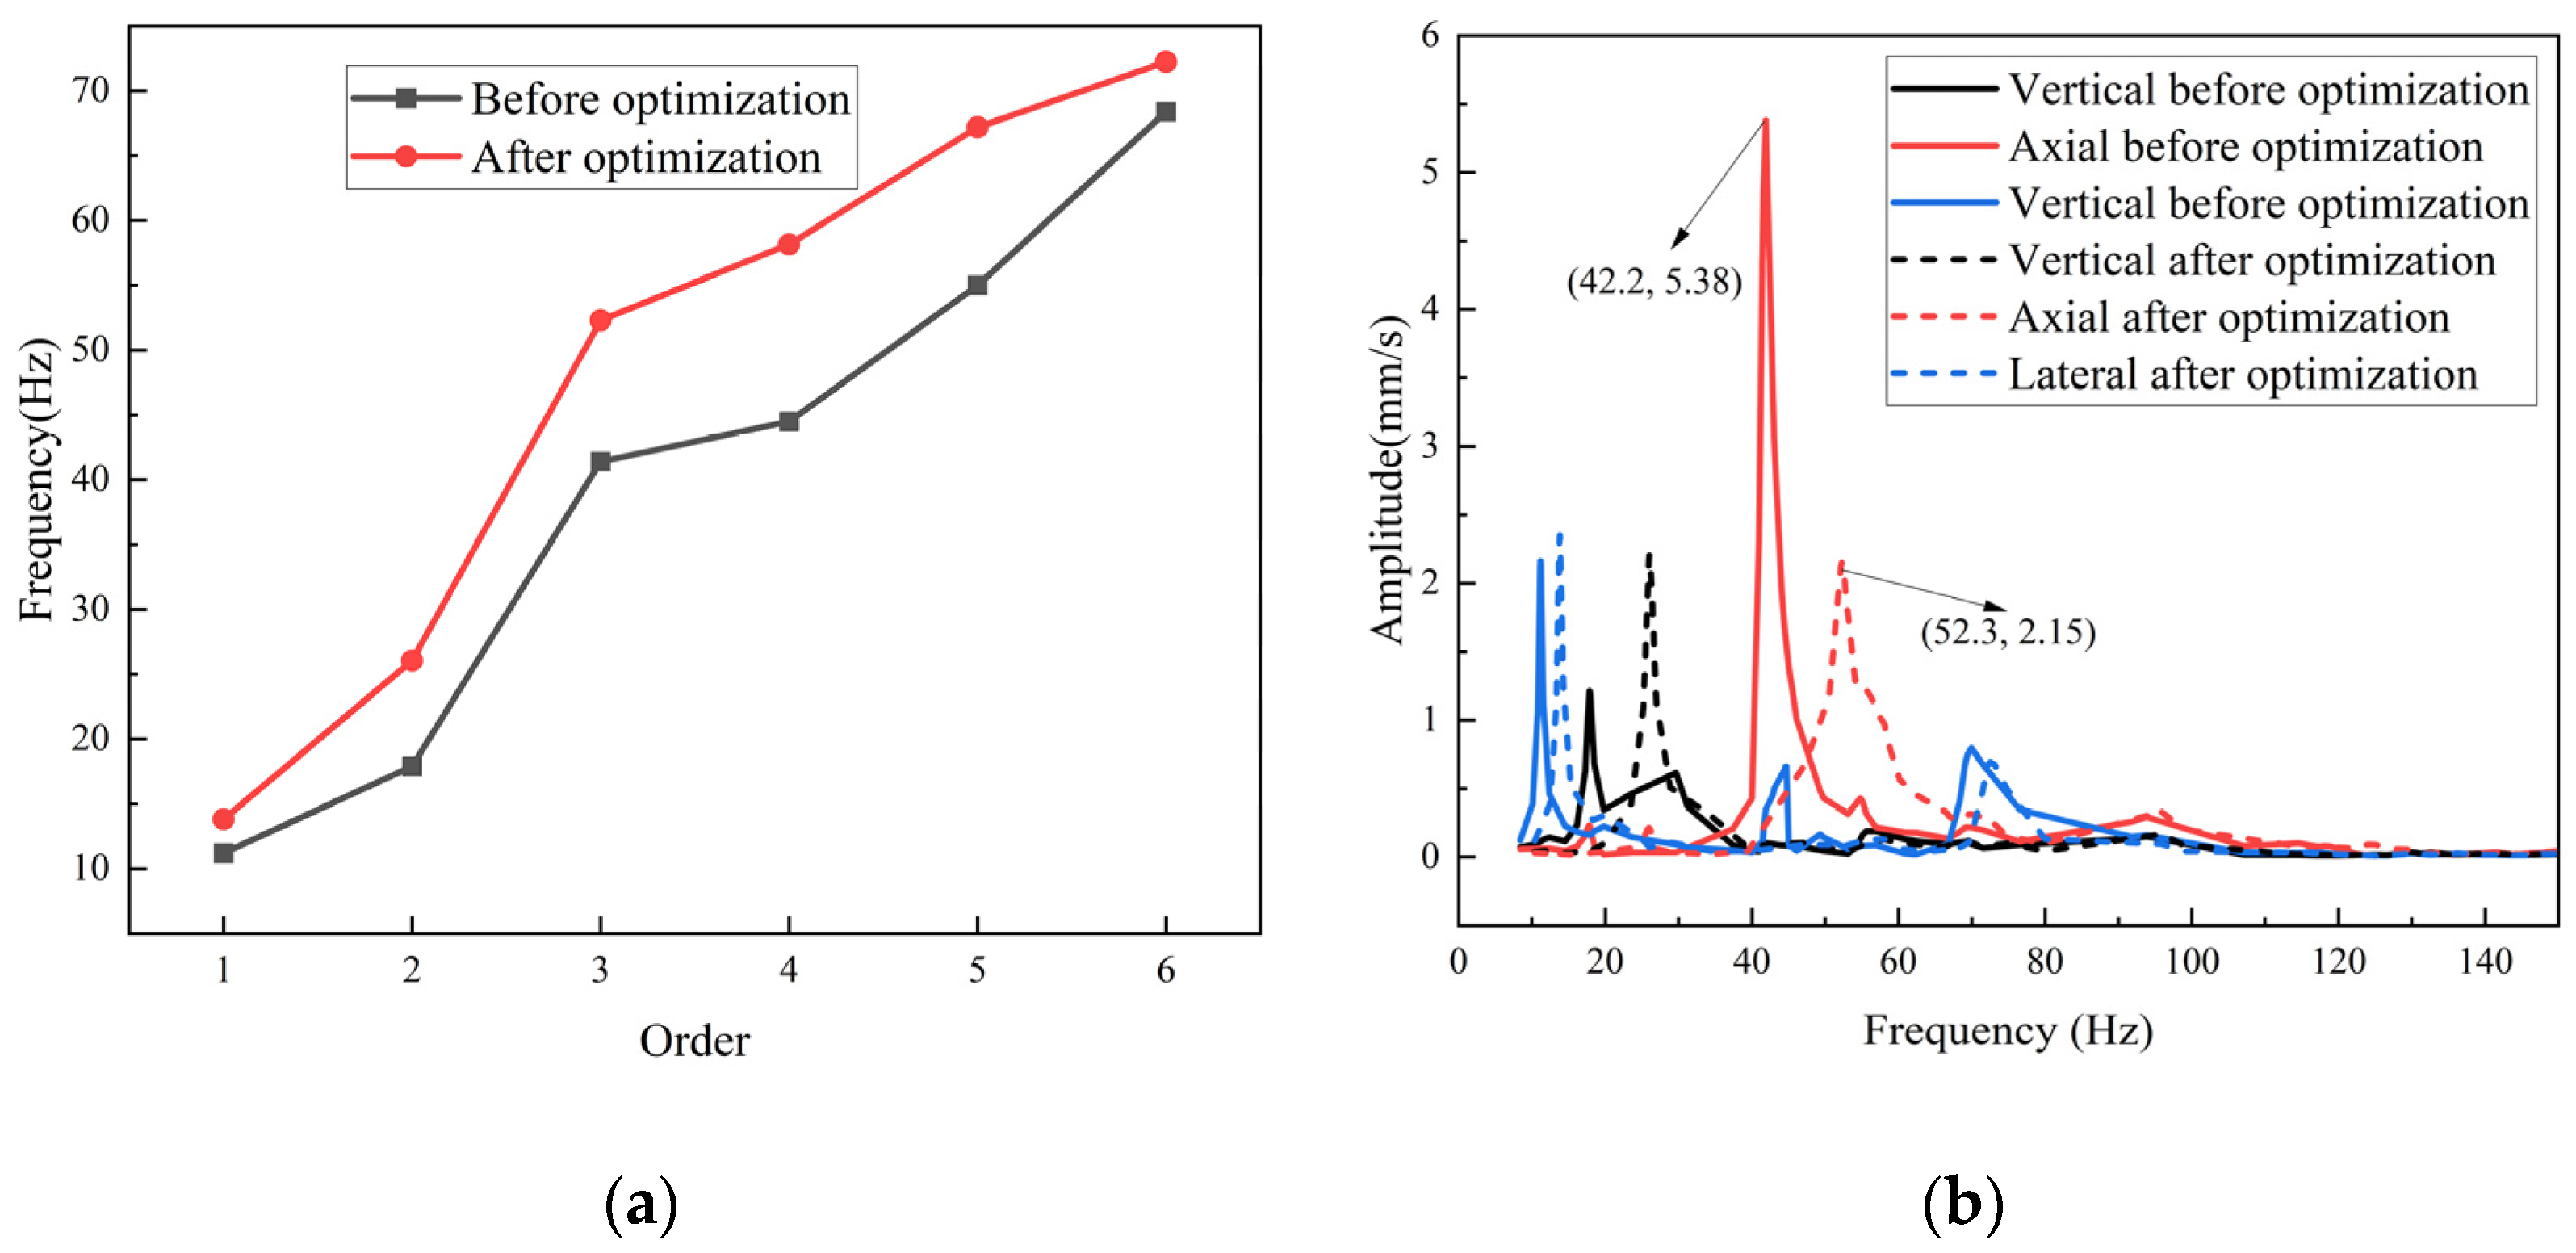
As can be seen from
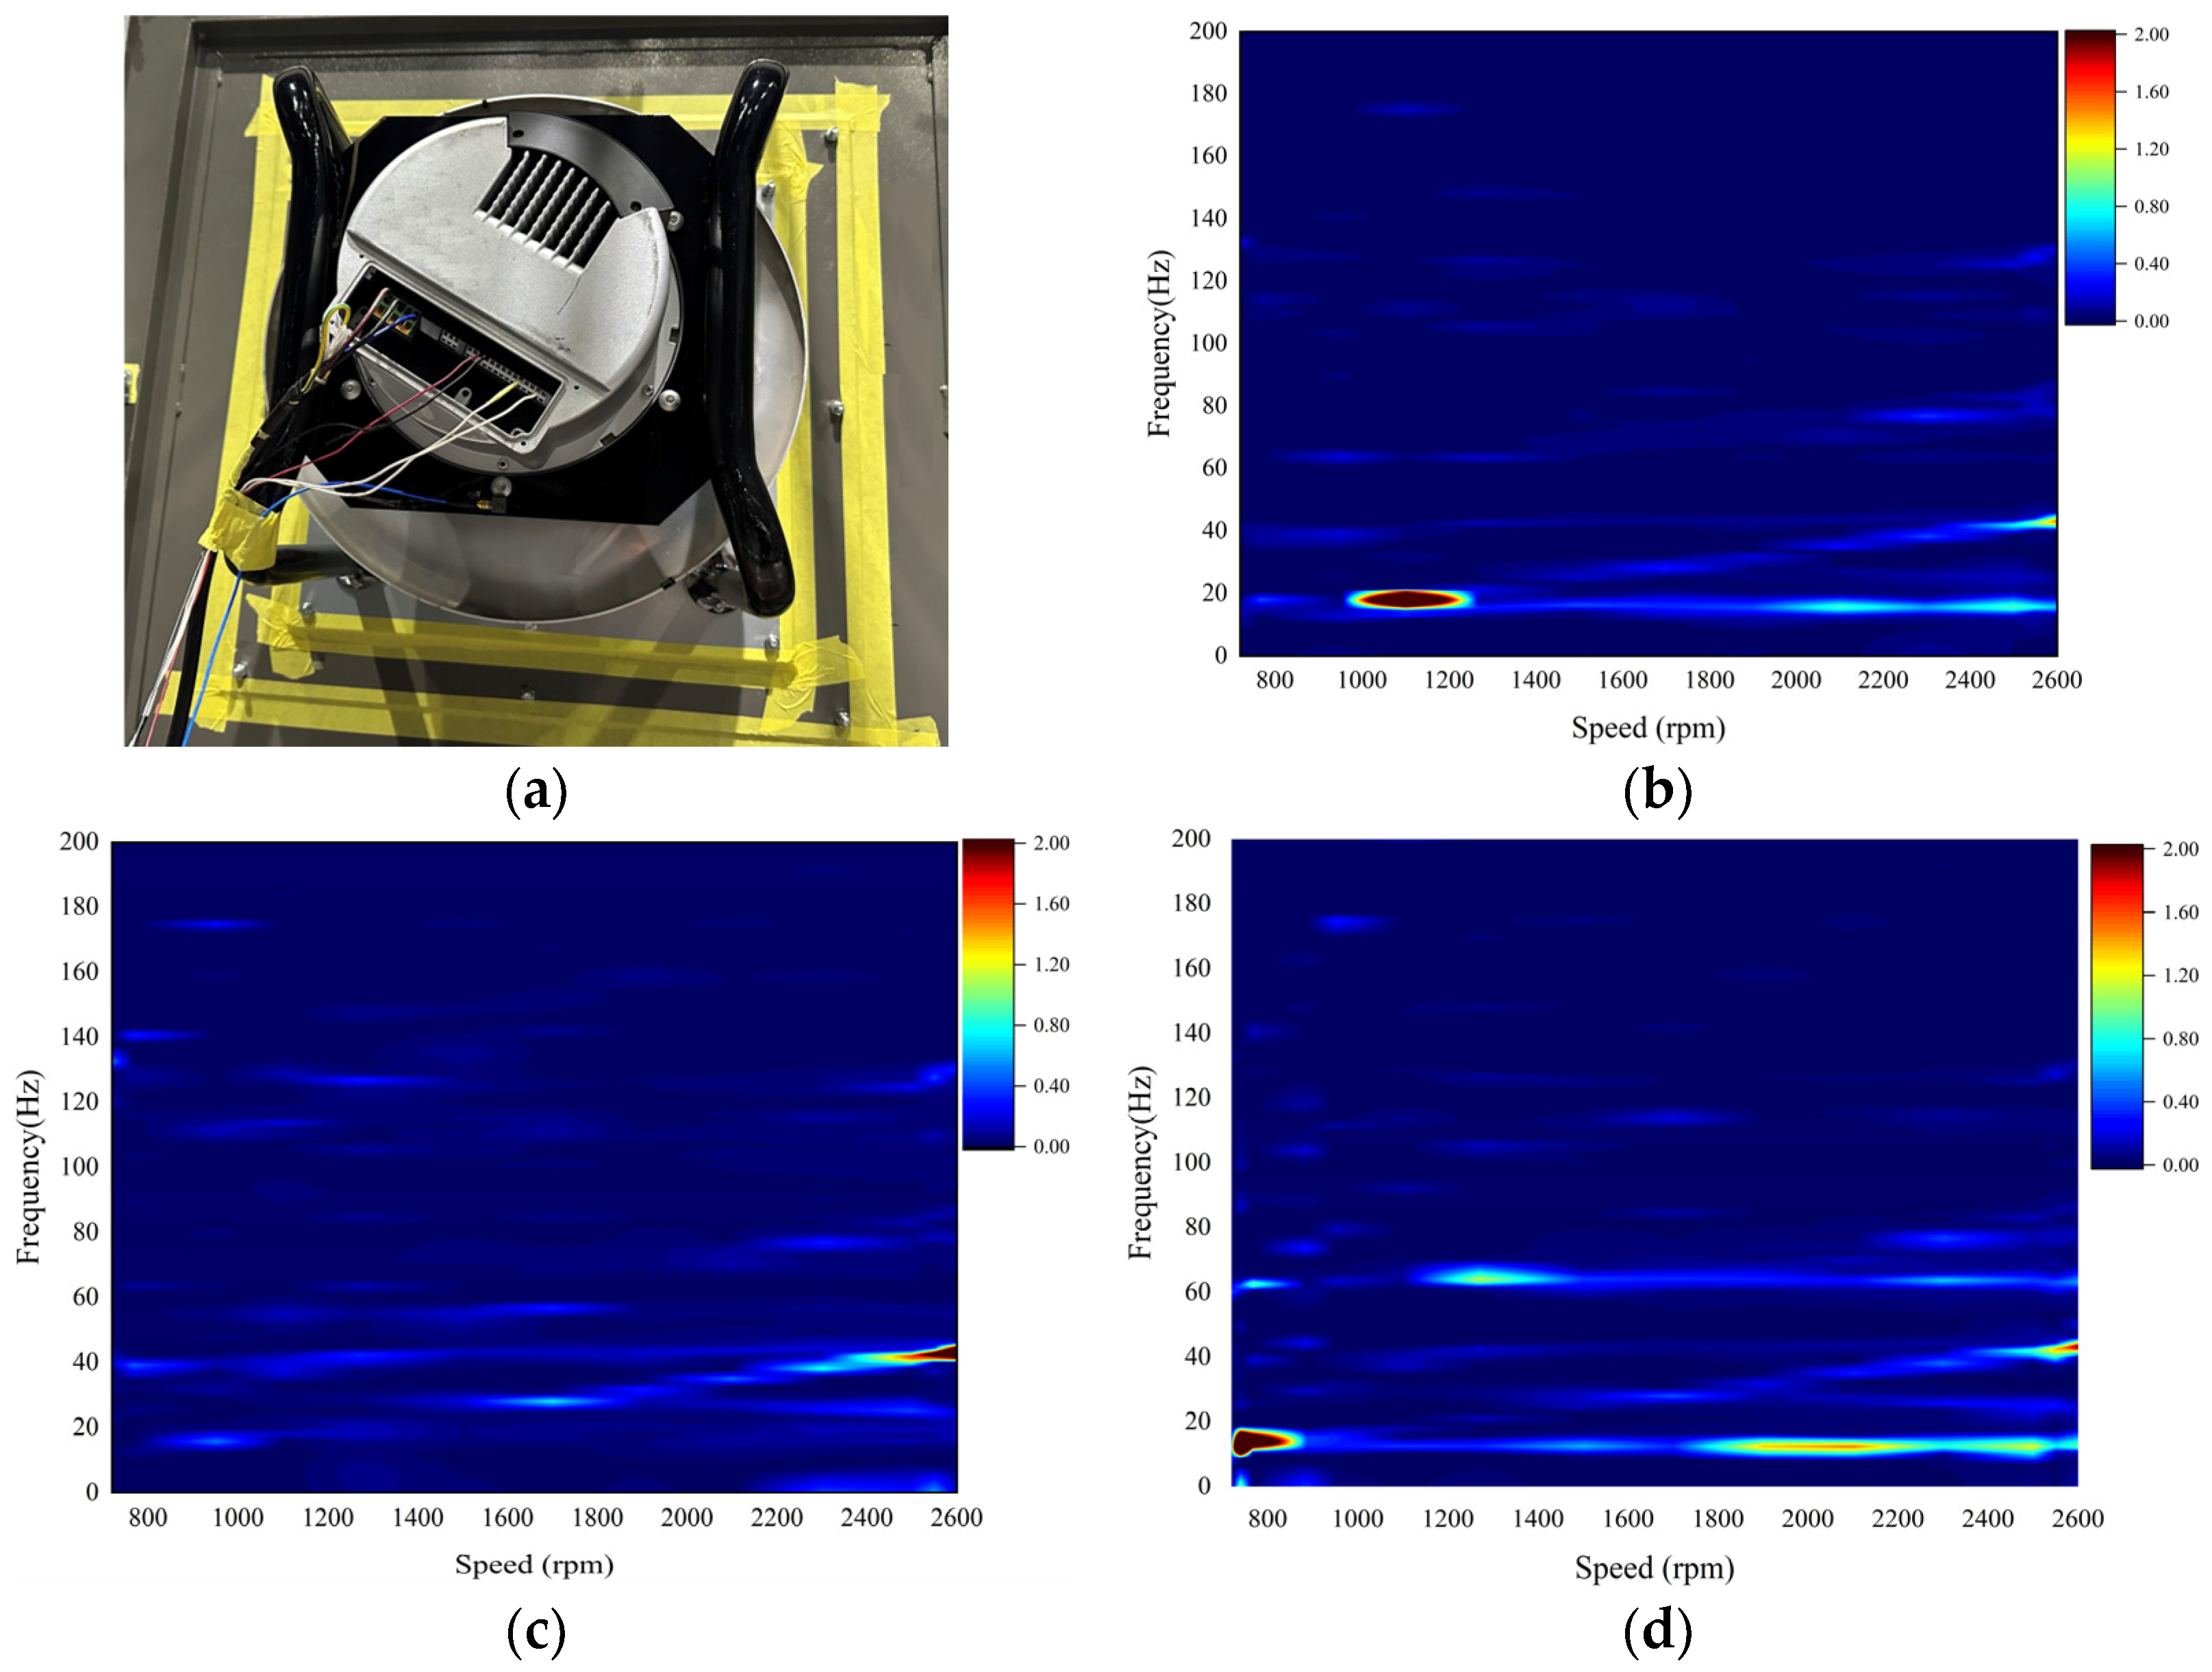
Figure 17, compared with the original model, the axial modal frequency and maximum axial amplitude of the frame structure after the round optimization are greatly optimized. The axial modal frequency (the third order) increased from 42.2 Hz to 52.3 Hz; at this time, the maximum axial amplitude decreased from 5.38 m/s to 2.15 mm/s, and the maximum three-way amplitude under this working condition is below 2.5 mm/s.
According to the “frequency ratio = modal frequency/excitation frequency” equation, the frequency ratio exceeds 1.2. Although the ideal vibration isolation condition is not reached, the amplitude can be effectively attenuated, indicating that structural optimization effectively improves the vibration characteristics of the frame. The maximum deformation and maximum equivalent stress vary greatly, and the structural strength meets the requirements.
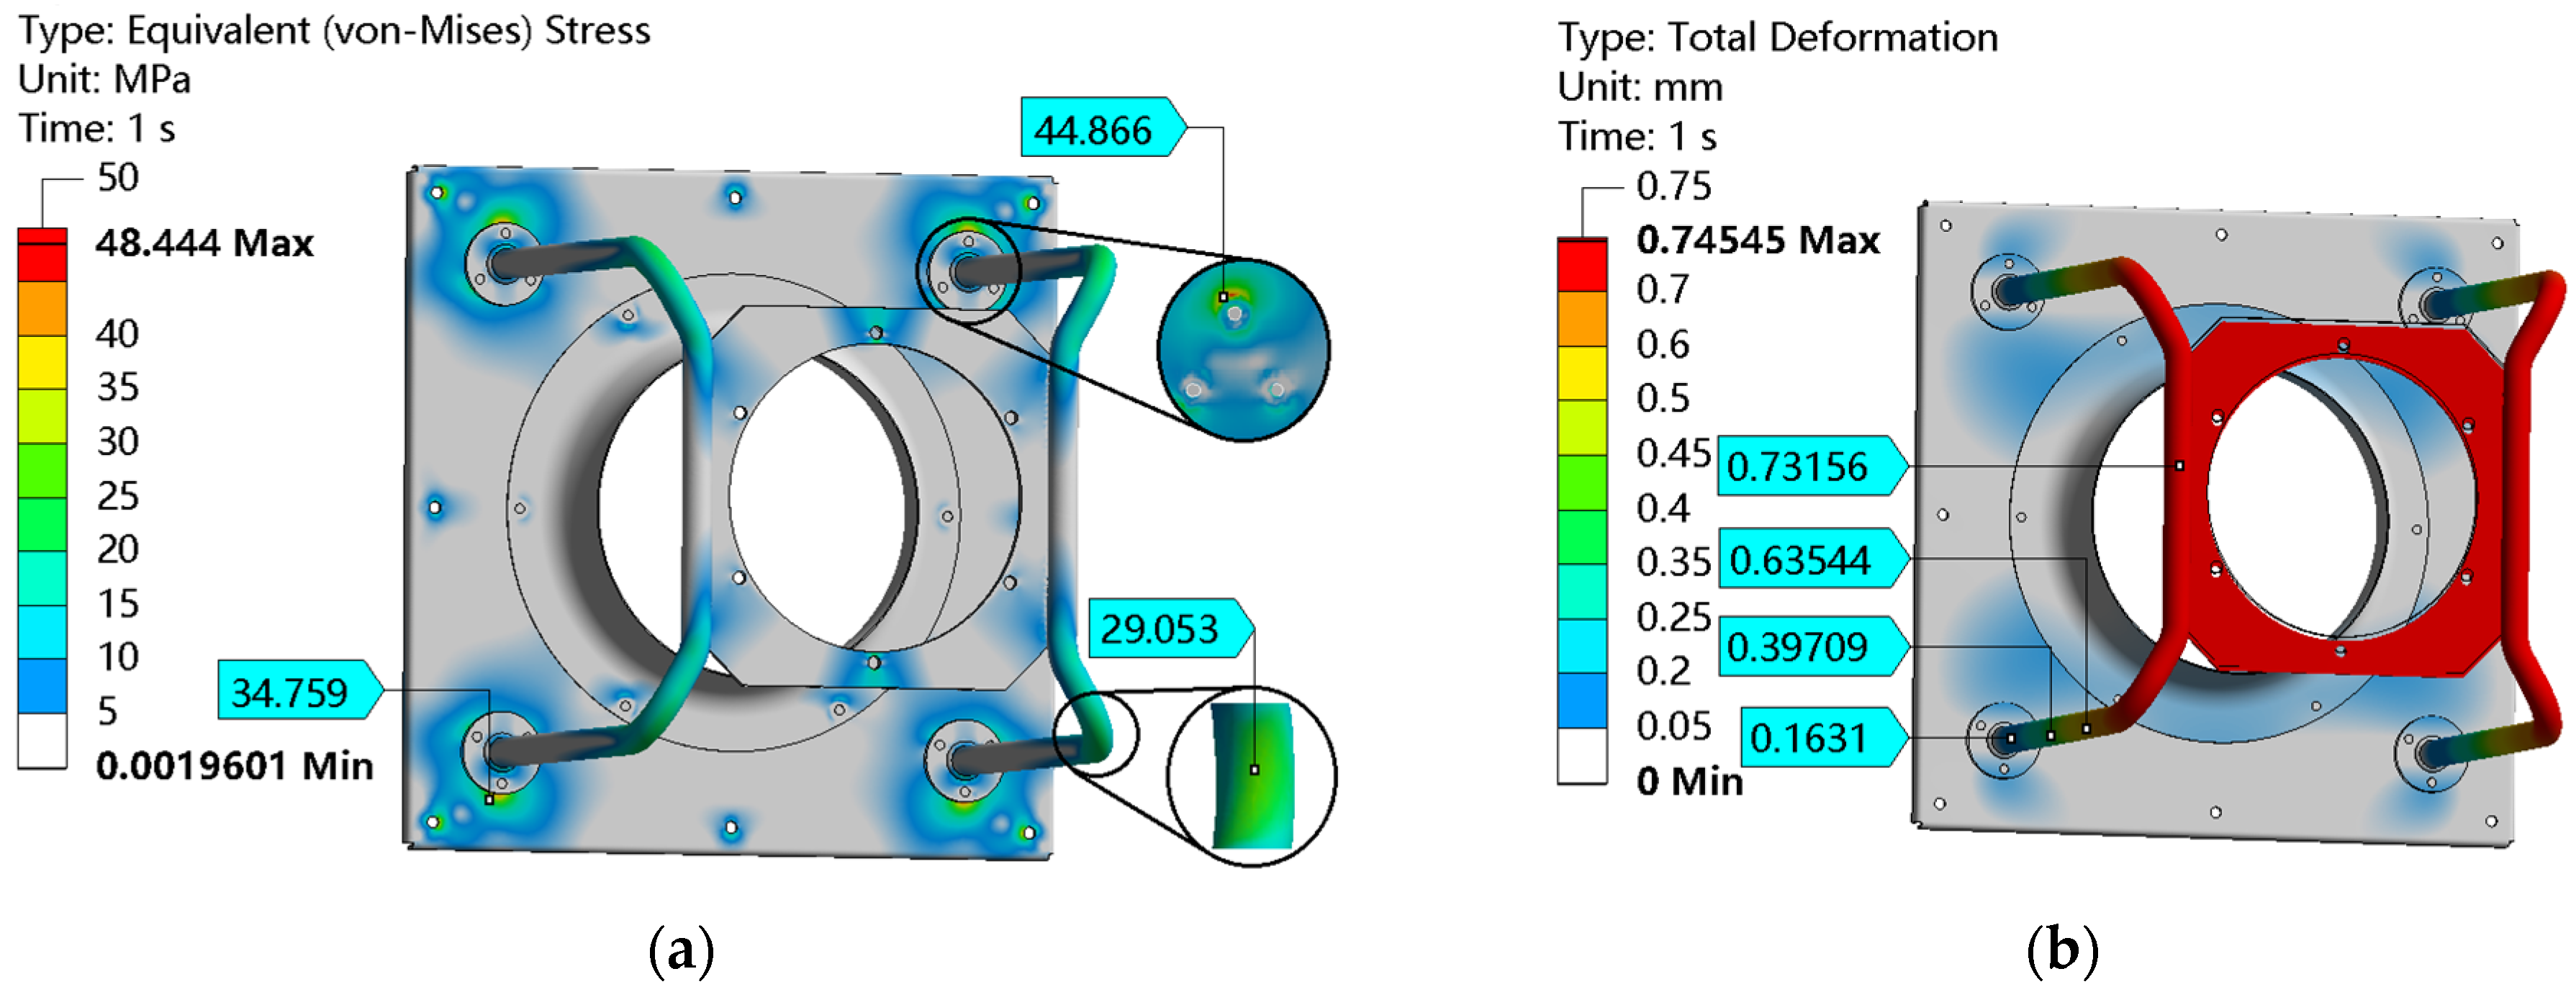
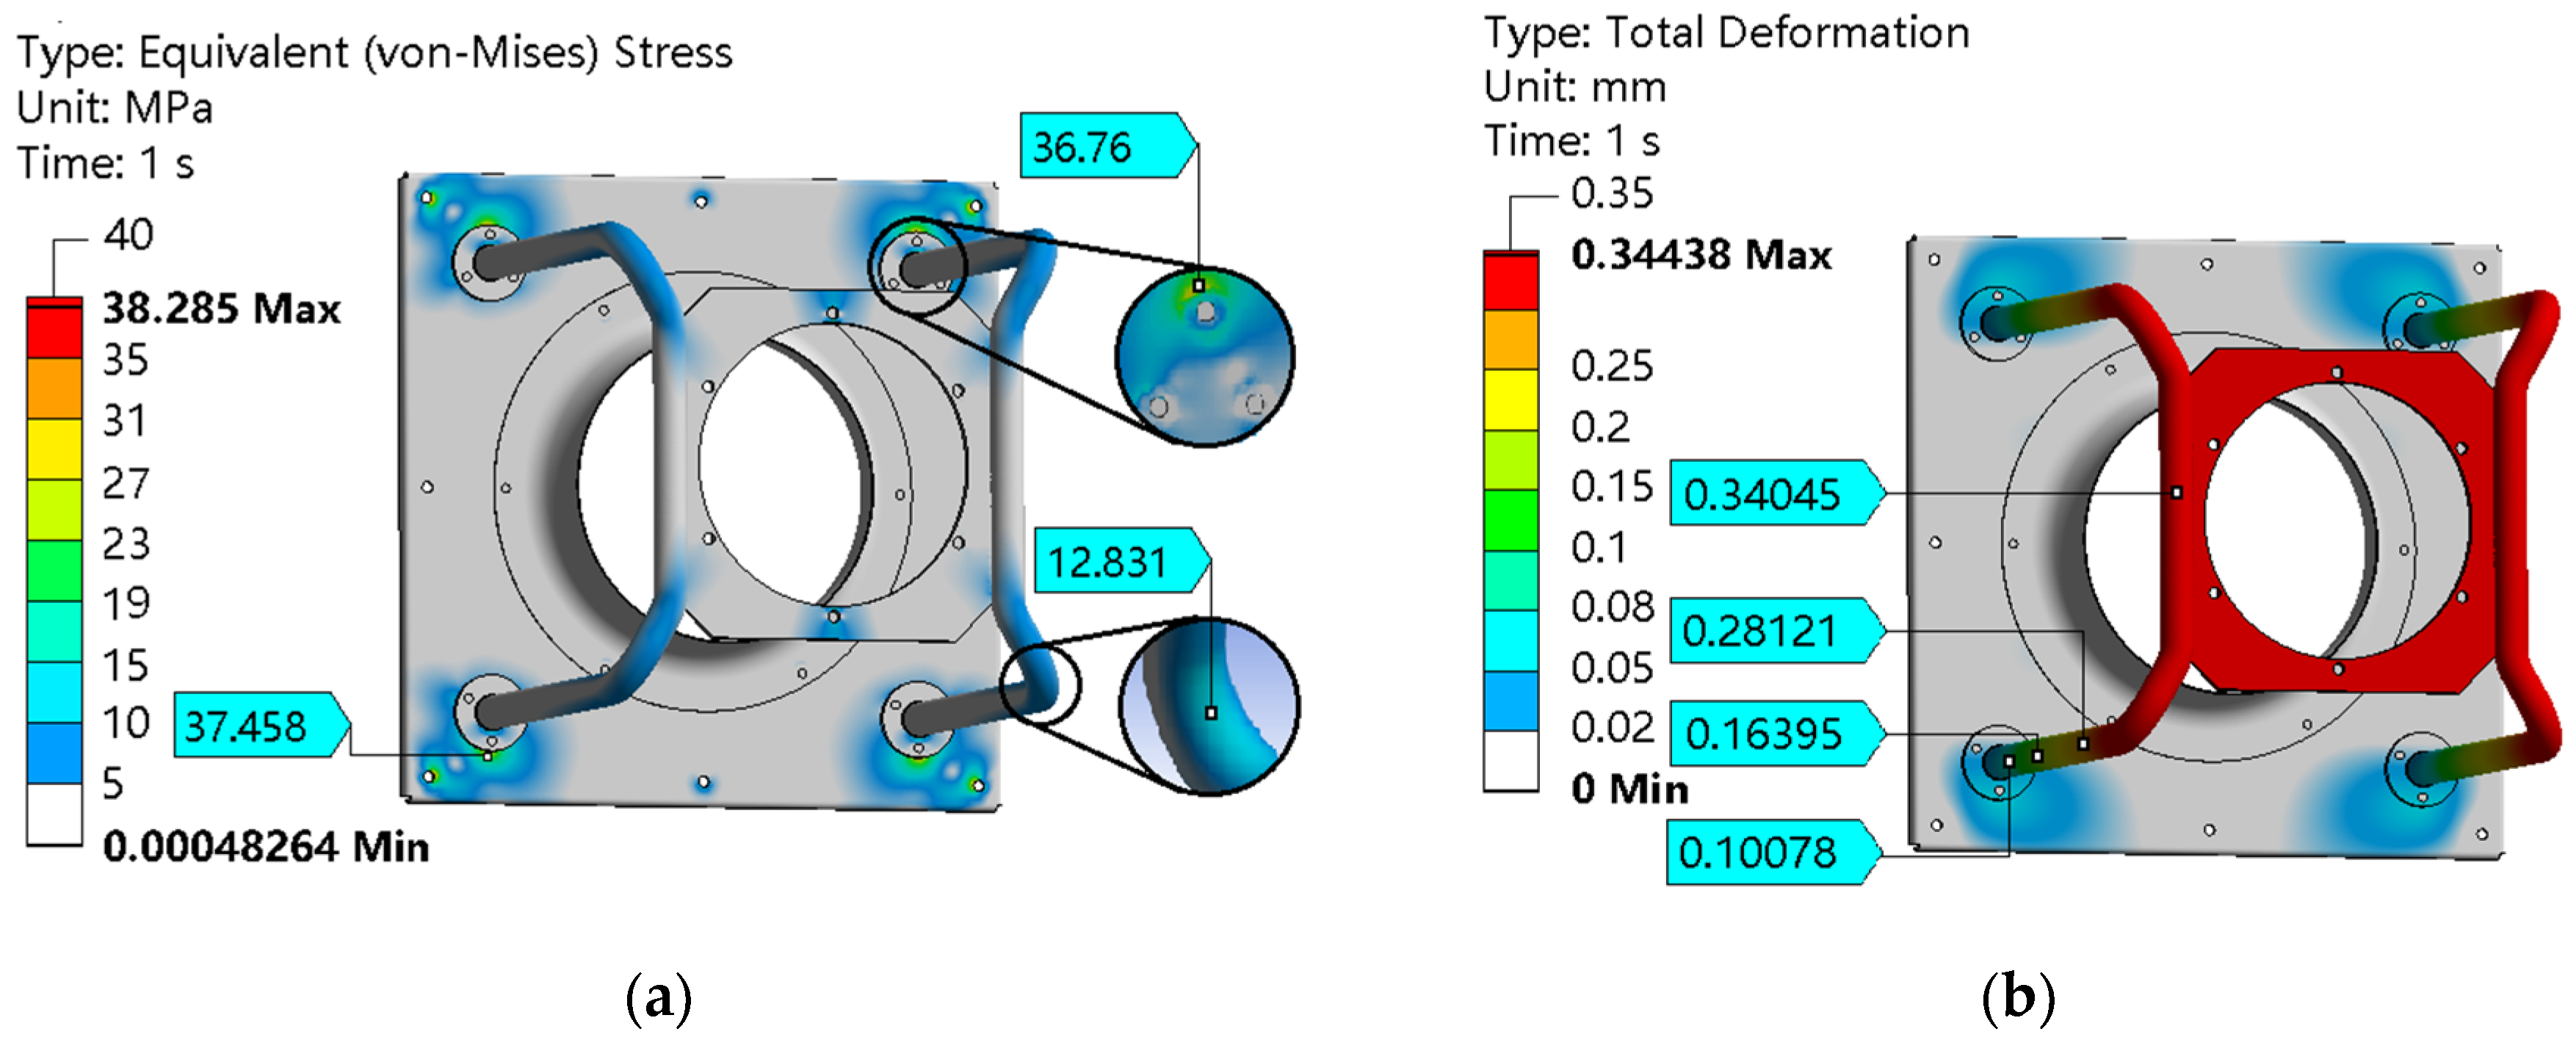
Figure 18 shows the deformation and stress results of the optimized structure. Compared with before optimization, the strength after optimization is more reliable. From
Figure 18a, since the fan frame is a cantilever structure, the place with the greatest deformation is at the free end, where the motor plate and the connecting tube are. Due to the increased thickness of the optimized connecting tubes and mounting plates, the strength of the cantilever structure has increased, resulting in a significant reduction in deformation from 0.73mm to 0.34mm.
Figure 18b shows that the stress after optimization was reduced from 48.44 MPa to 38.3 MPa, and the maximum equivalent stress of the structure always occurs on the mounting plate. That is because the mounting plate is a fixed end, and ultimately, all forces will transmit to the fixed installation position. The connecting tube is like an L-shaped beam, which resists deformation at the bend, and the connection is placed under the influence of moments, so the stress is relatively prominent.


