
Cross-Modal Behavioral Intelligence in Regard to a Ship Bridge: A Rough Set-Driven Framework with Enhanced Spatiotemporal Perception and Object Semantics


Abstract
1. Introduction
2. Literature Review
2.1. Multi-Object Tracking
2.2. Behavior Recognition
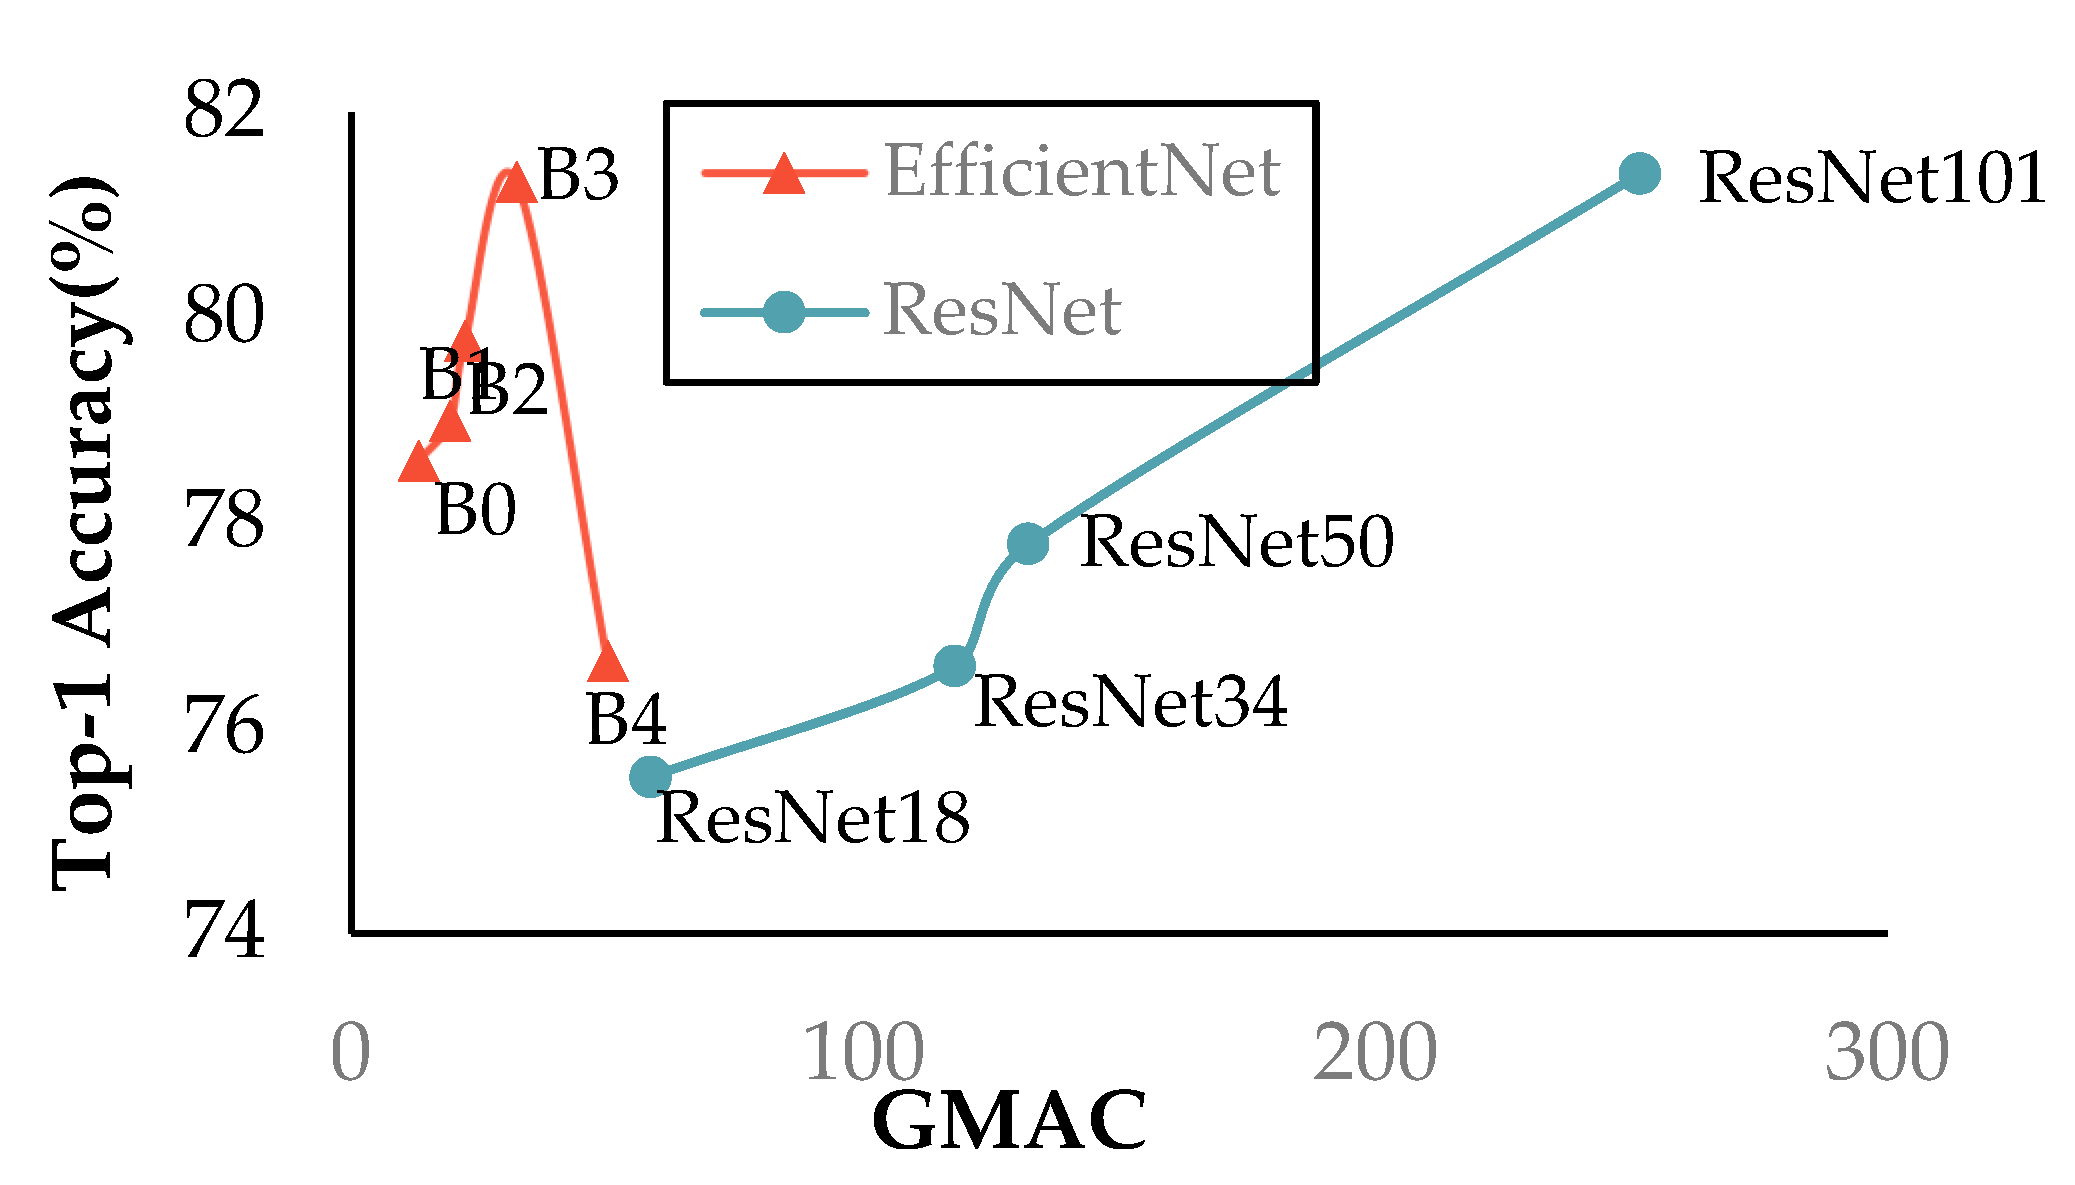
2.3. Feature Extraction Network
2.4. Rough Set
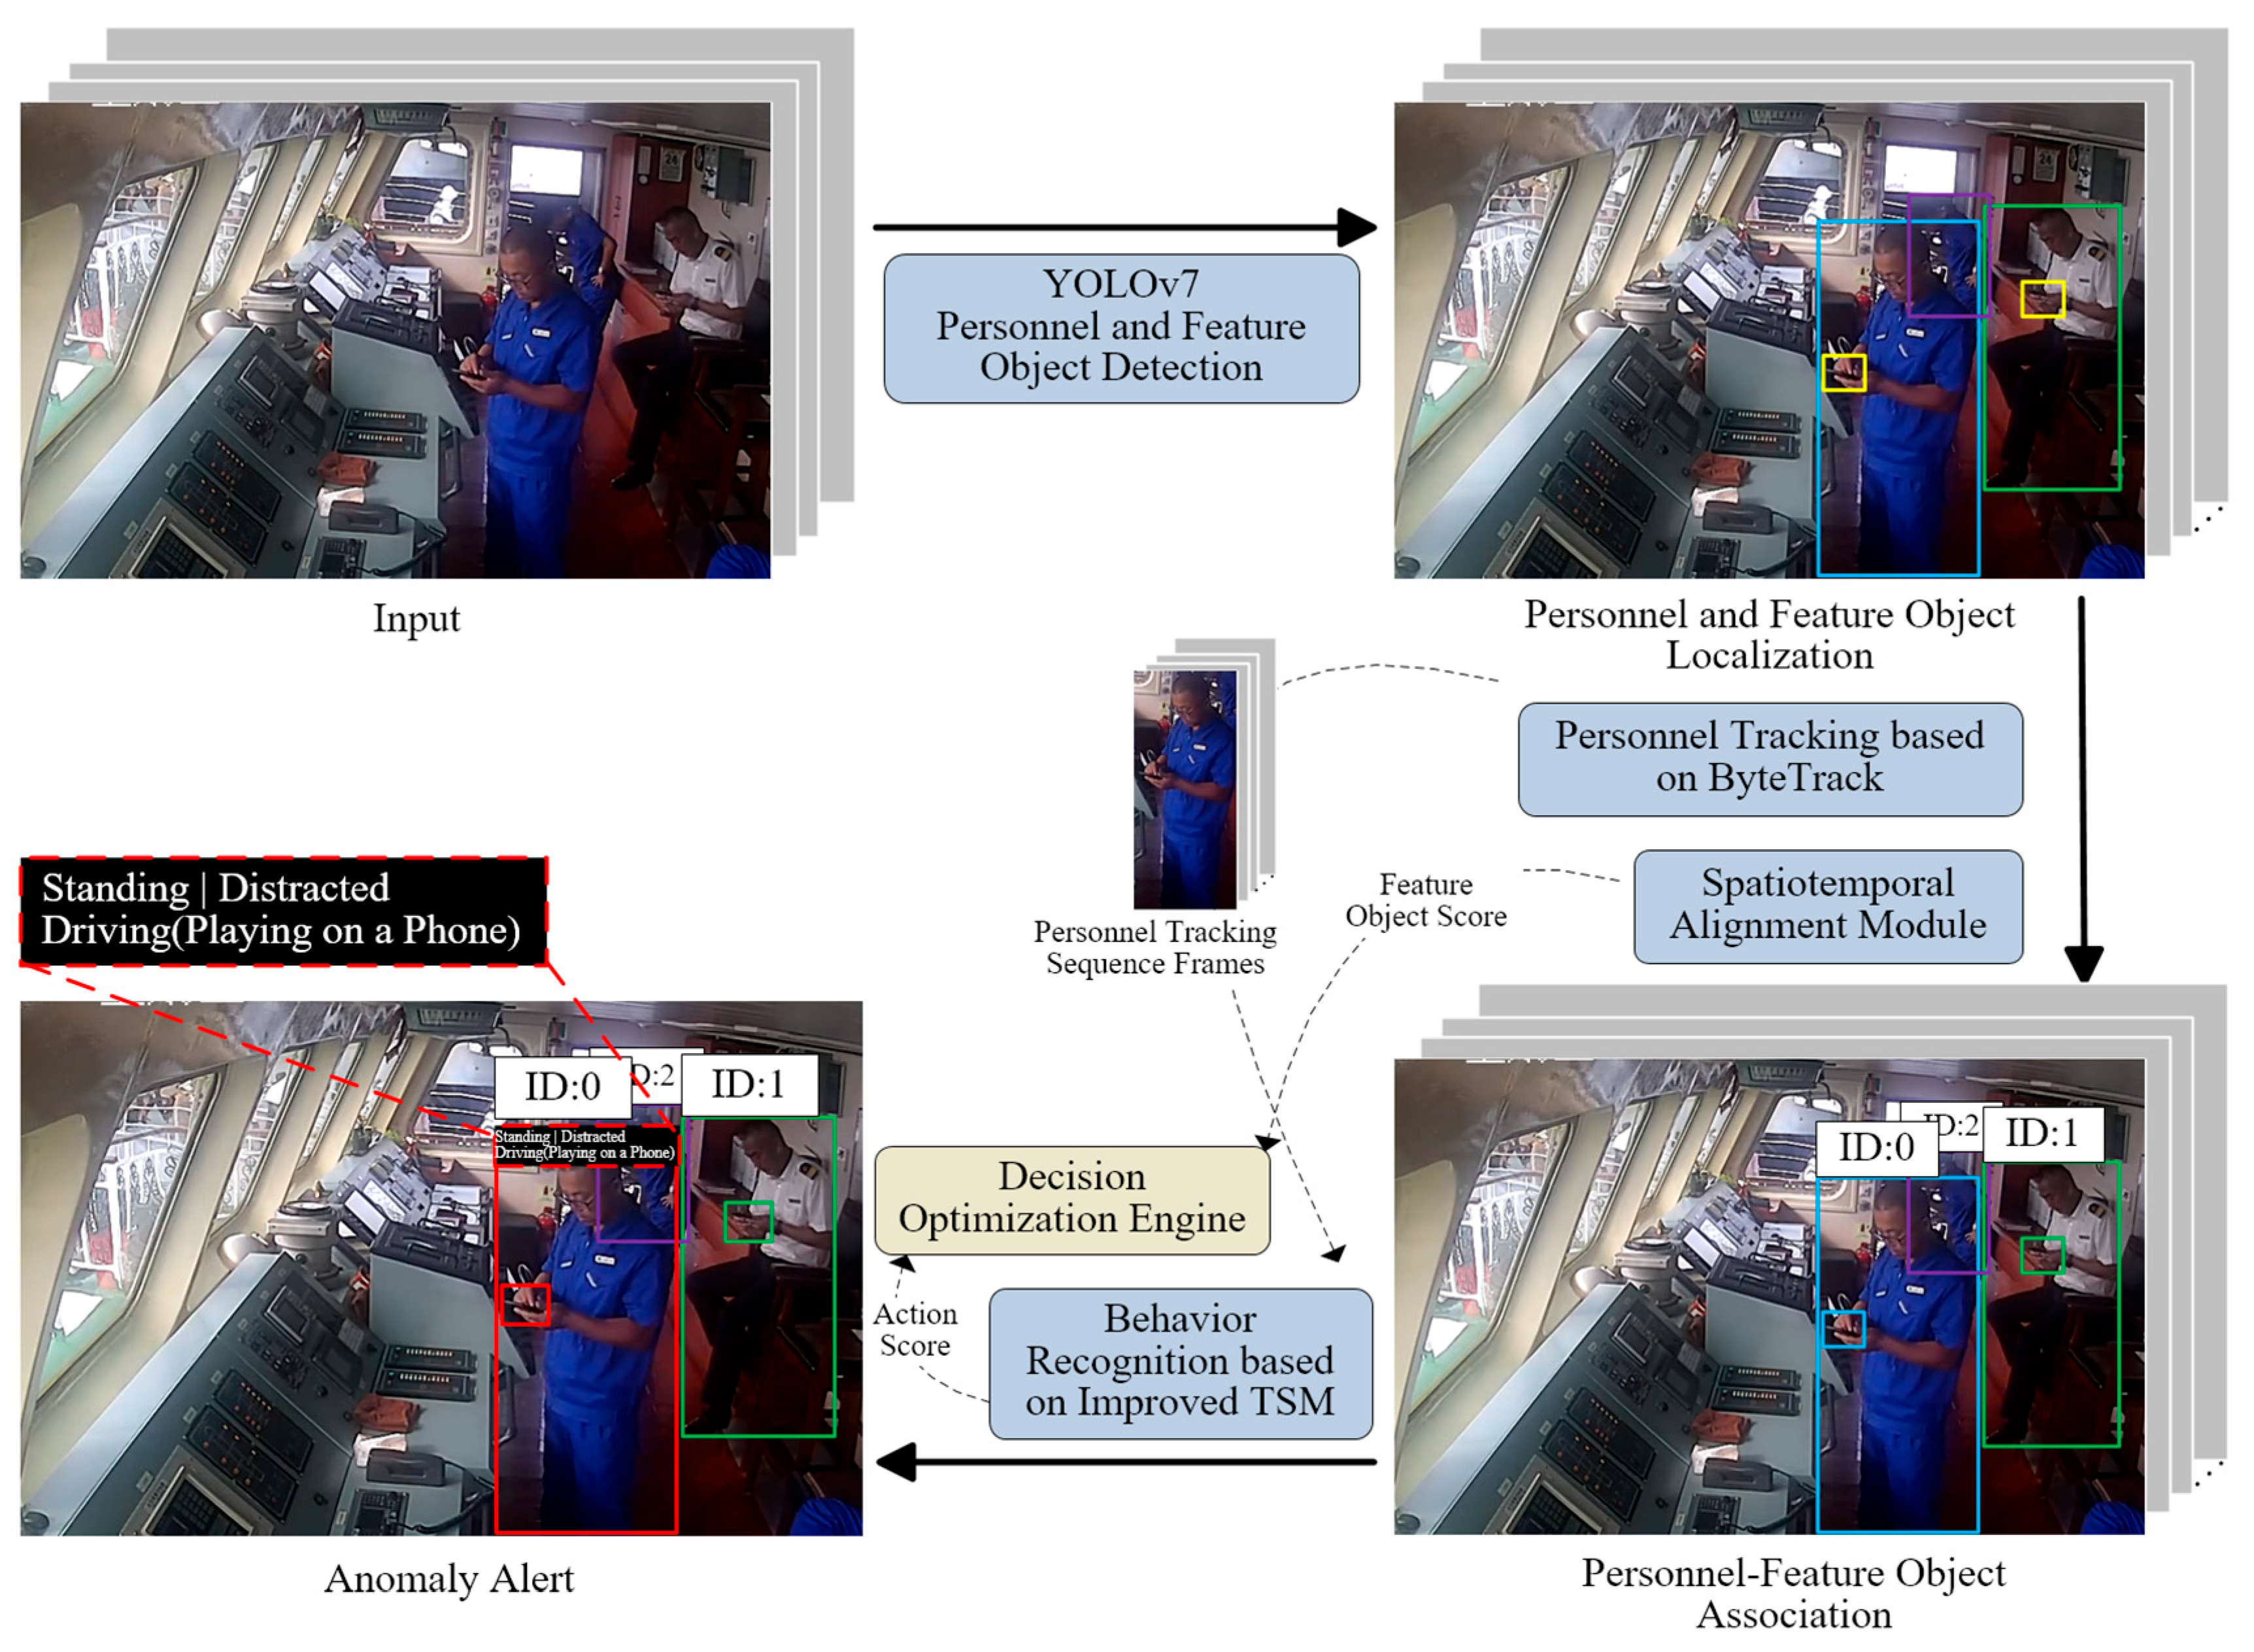
3. The Proposed Approach
| Algorithm 1 Multi-person behavior recognition algorithm |
| Input: Real-time video stream from ship bridge cameras Output: Anomaly alerts with behavior classification 1: Initialize YOLOv7 model, ByteTrack tracker, Improved TSM algorithm, Decision Optimization Engine 2: FOR each frame in video_stream DO 3: Perform Personnel and Feature Object Detection (frame) 4: Perform Personnel and Feature Object Localization (frame, YOLOv7) 5: IF Personnel detected THEN 6: Perform Personnel Tracking Support (frame, ByteTrack) 7: Assign Feature Object Scores (frame, YOLOv7) 8: ENDIF 9: Perform Spatiotemporal Alignment Module (frame) 10: Associate Personnel–Feature Object (frame, tracking results, feature scores) 11: Perform Behavior Recognition (frame, Improved TSM) 12: Calculate Action Score (behavior recognition results) 13: Generate Anomaly Alert (action score, Decision Optimization Engine) 14: END FOR 15: RETURN Anomaly Alerts |
3.1. Personnel and Feature Object Detection Based on YOLOv7
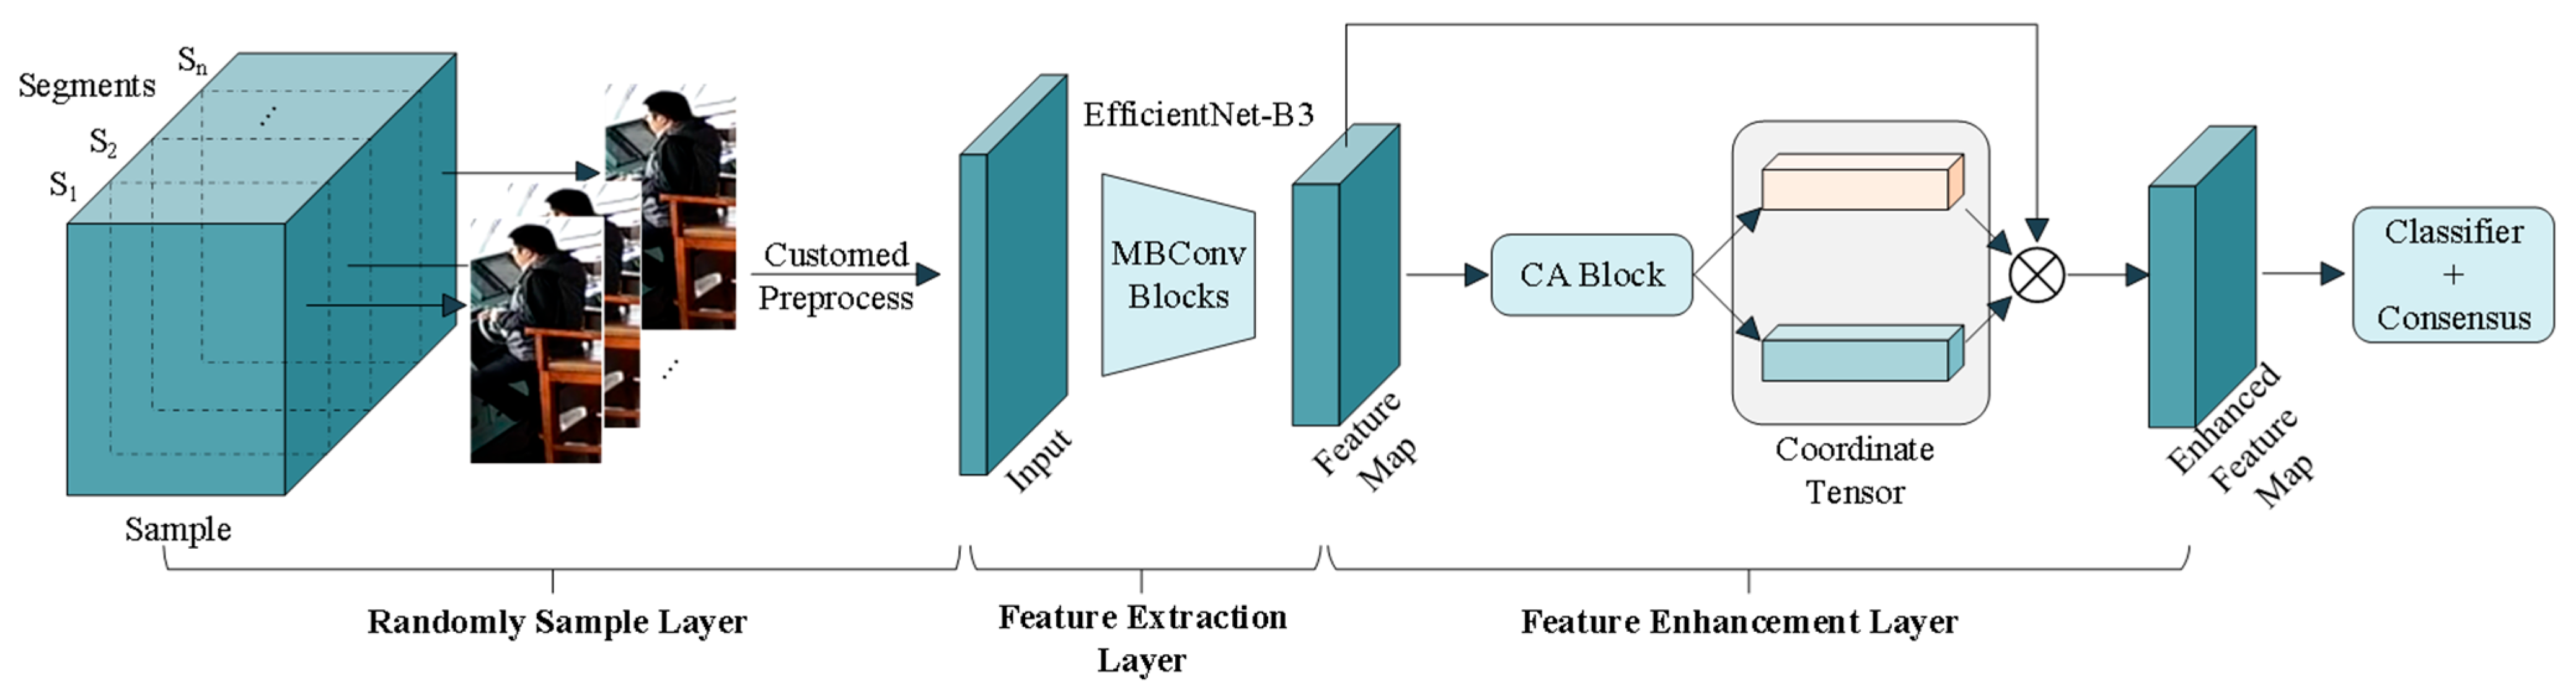
3.2. Improved TSM for Behavior Recognition
3.3. Multi-Source Feature Fusion Based on RS
4. Experiments
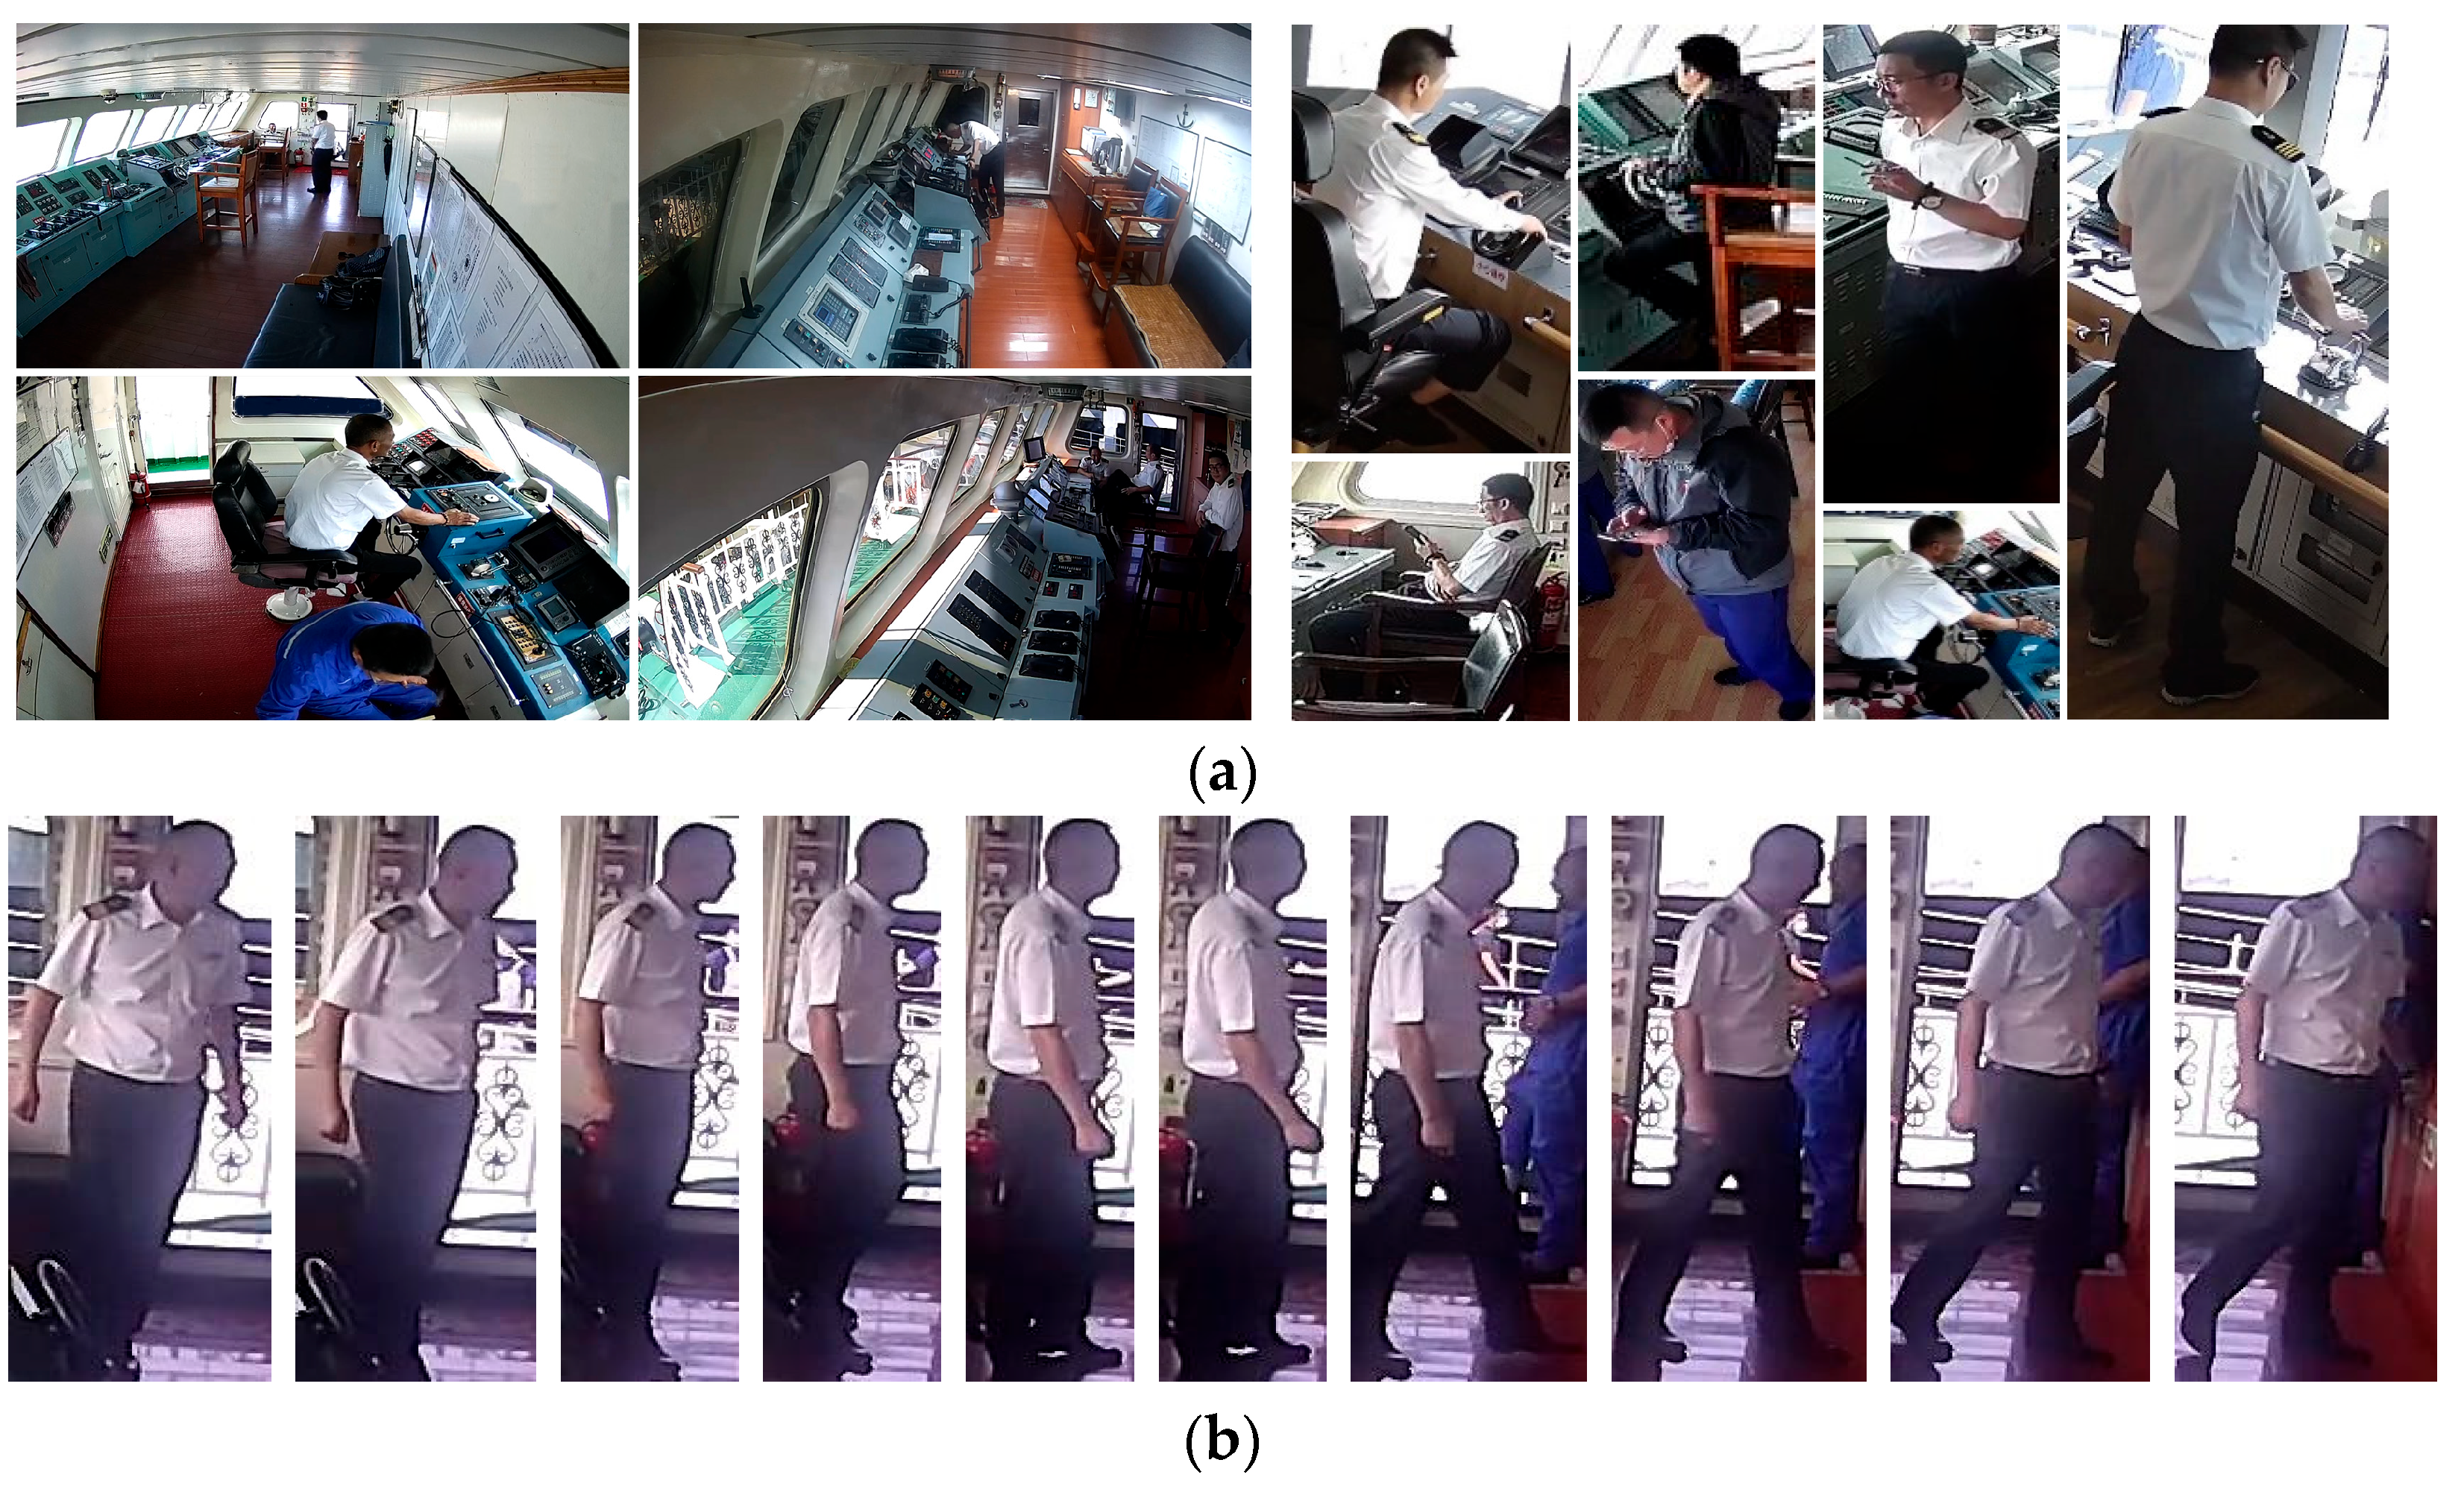
4.1. Datasets
4.2. Implementation Details
4.3. Results
4.3.1. Results of Personnel and Feature Object Detection
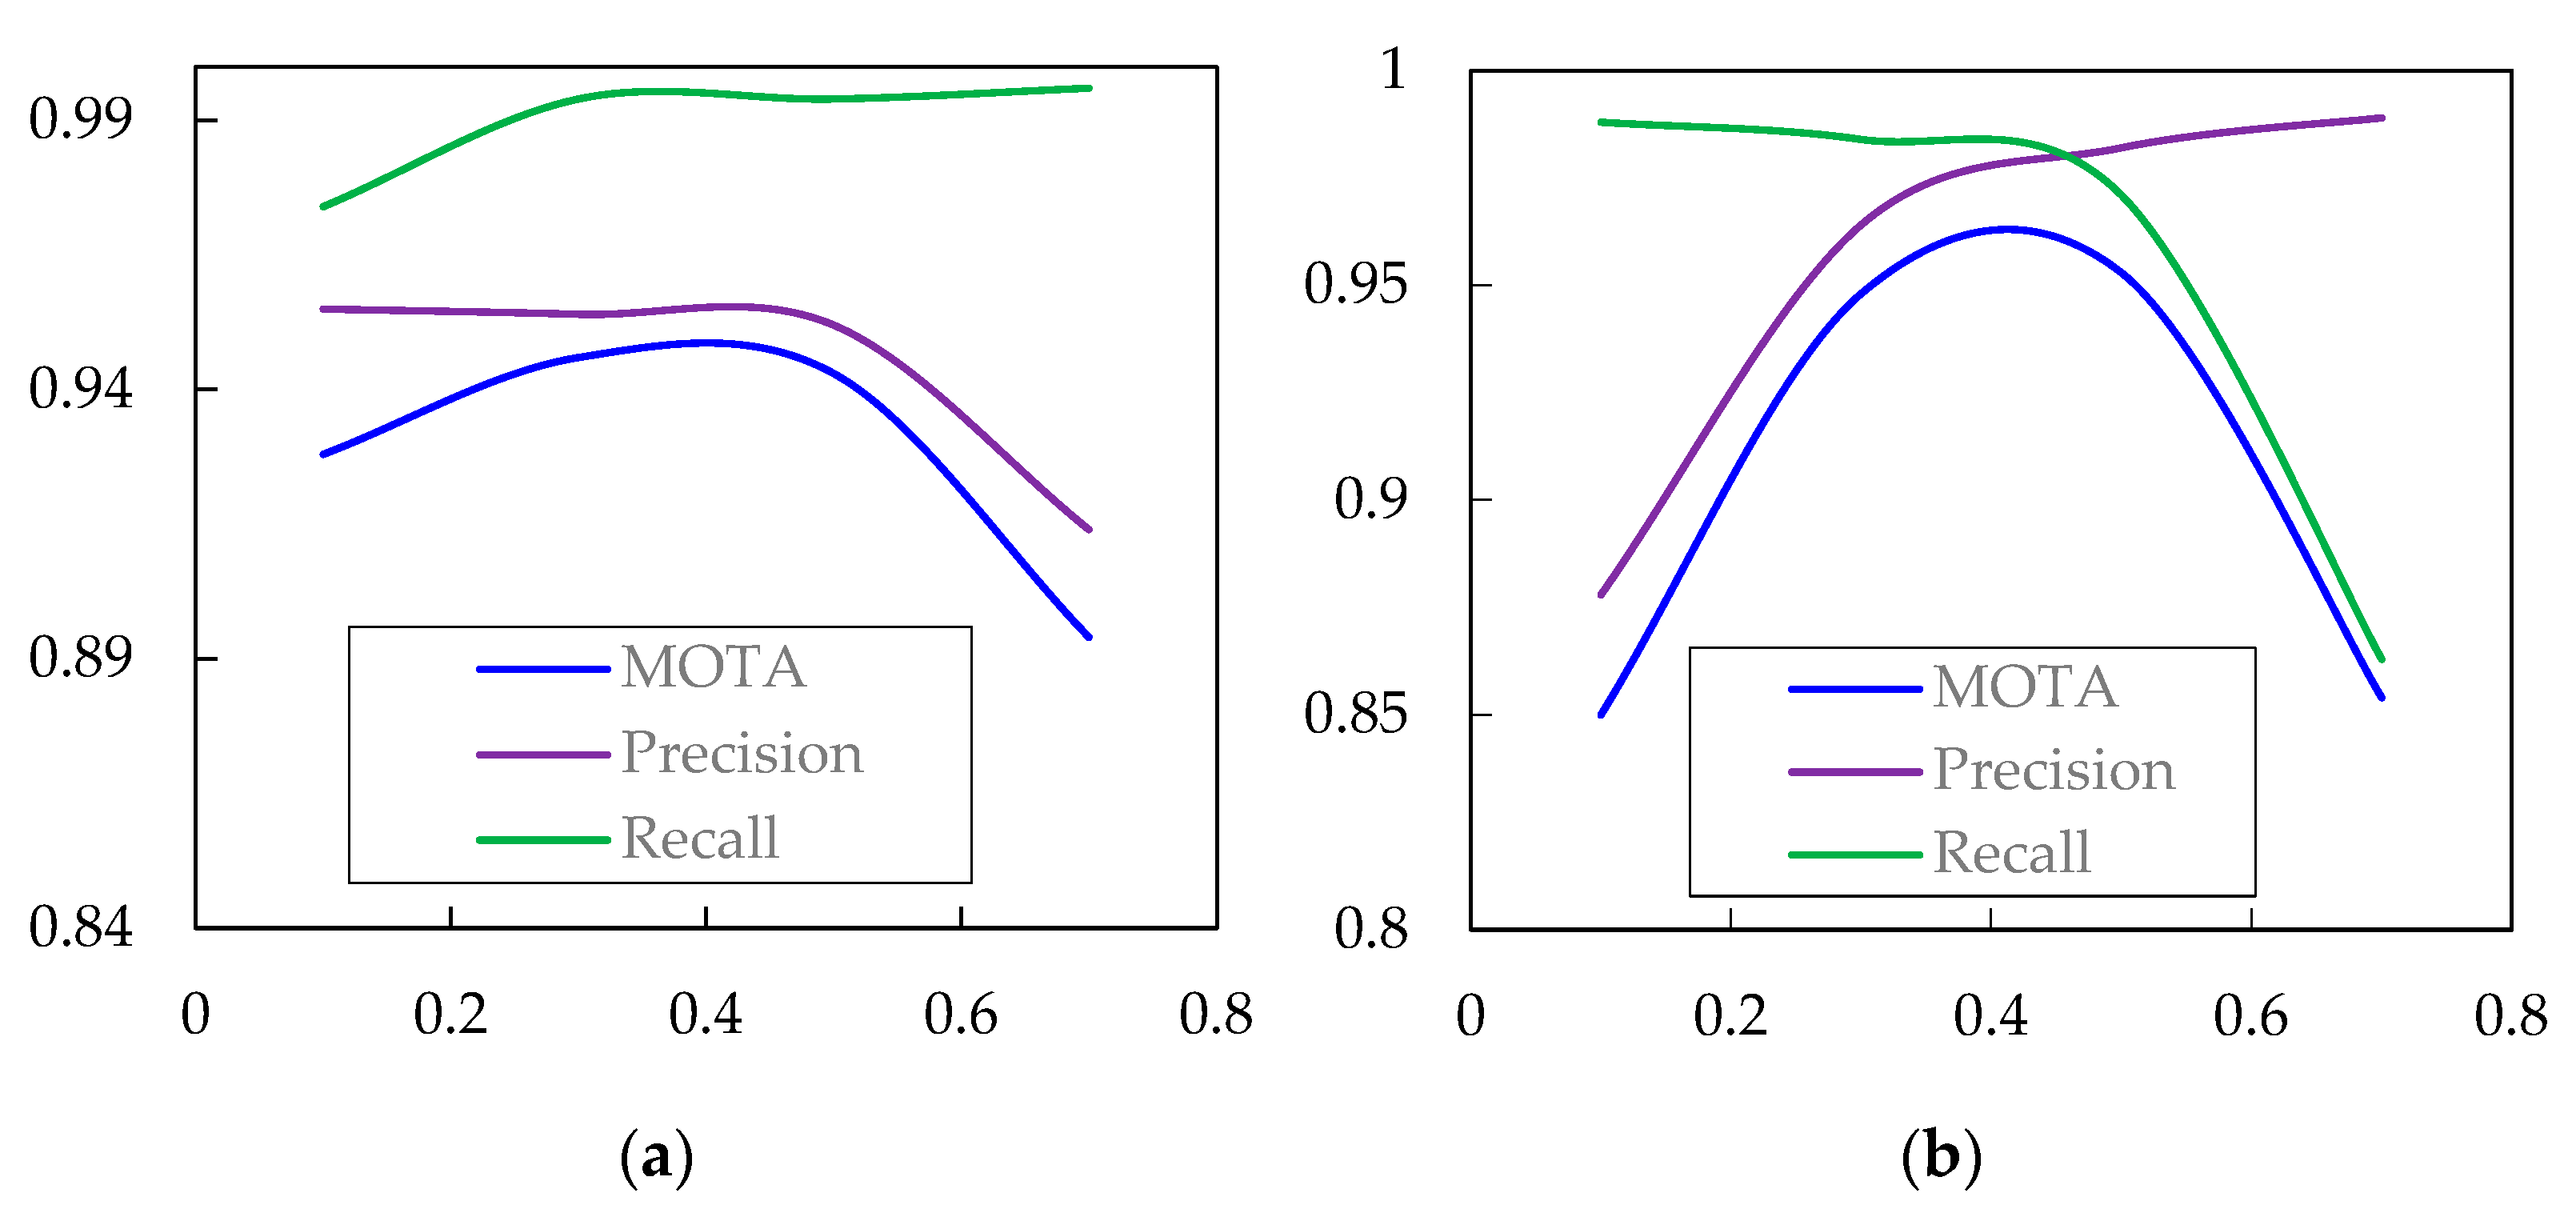
4.3.2. Results of Driver Tracking
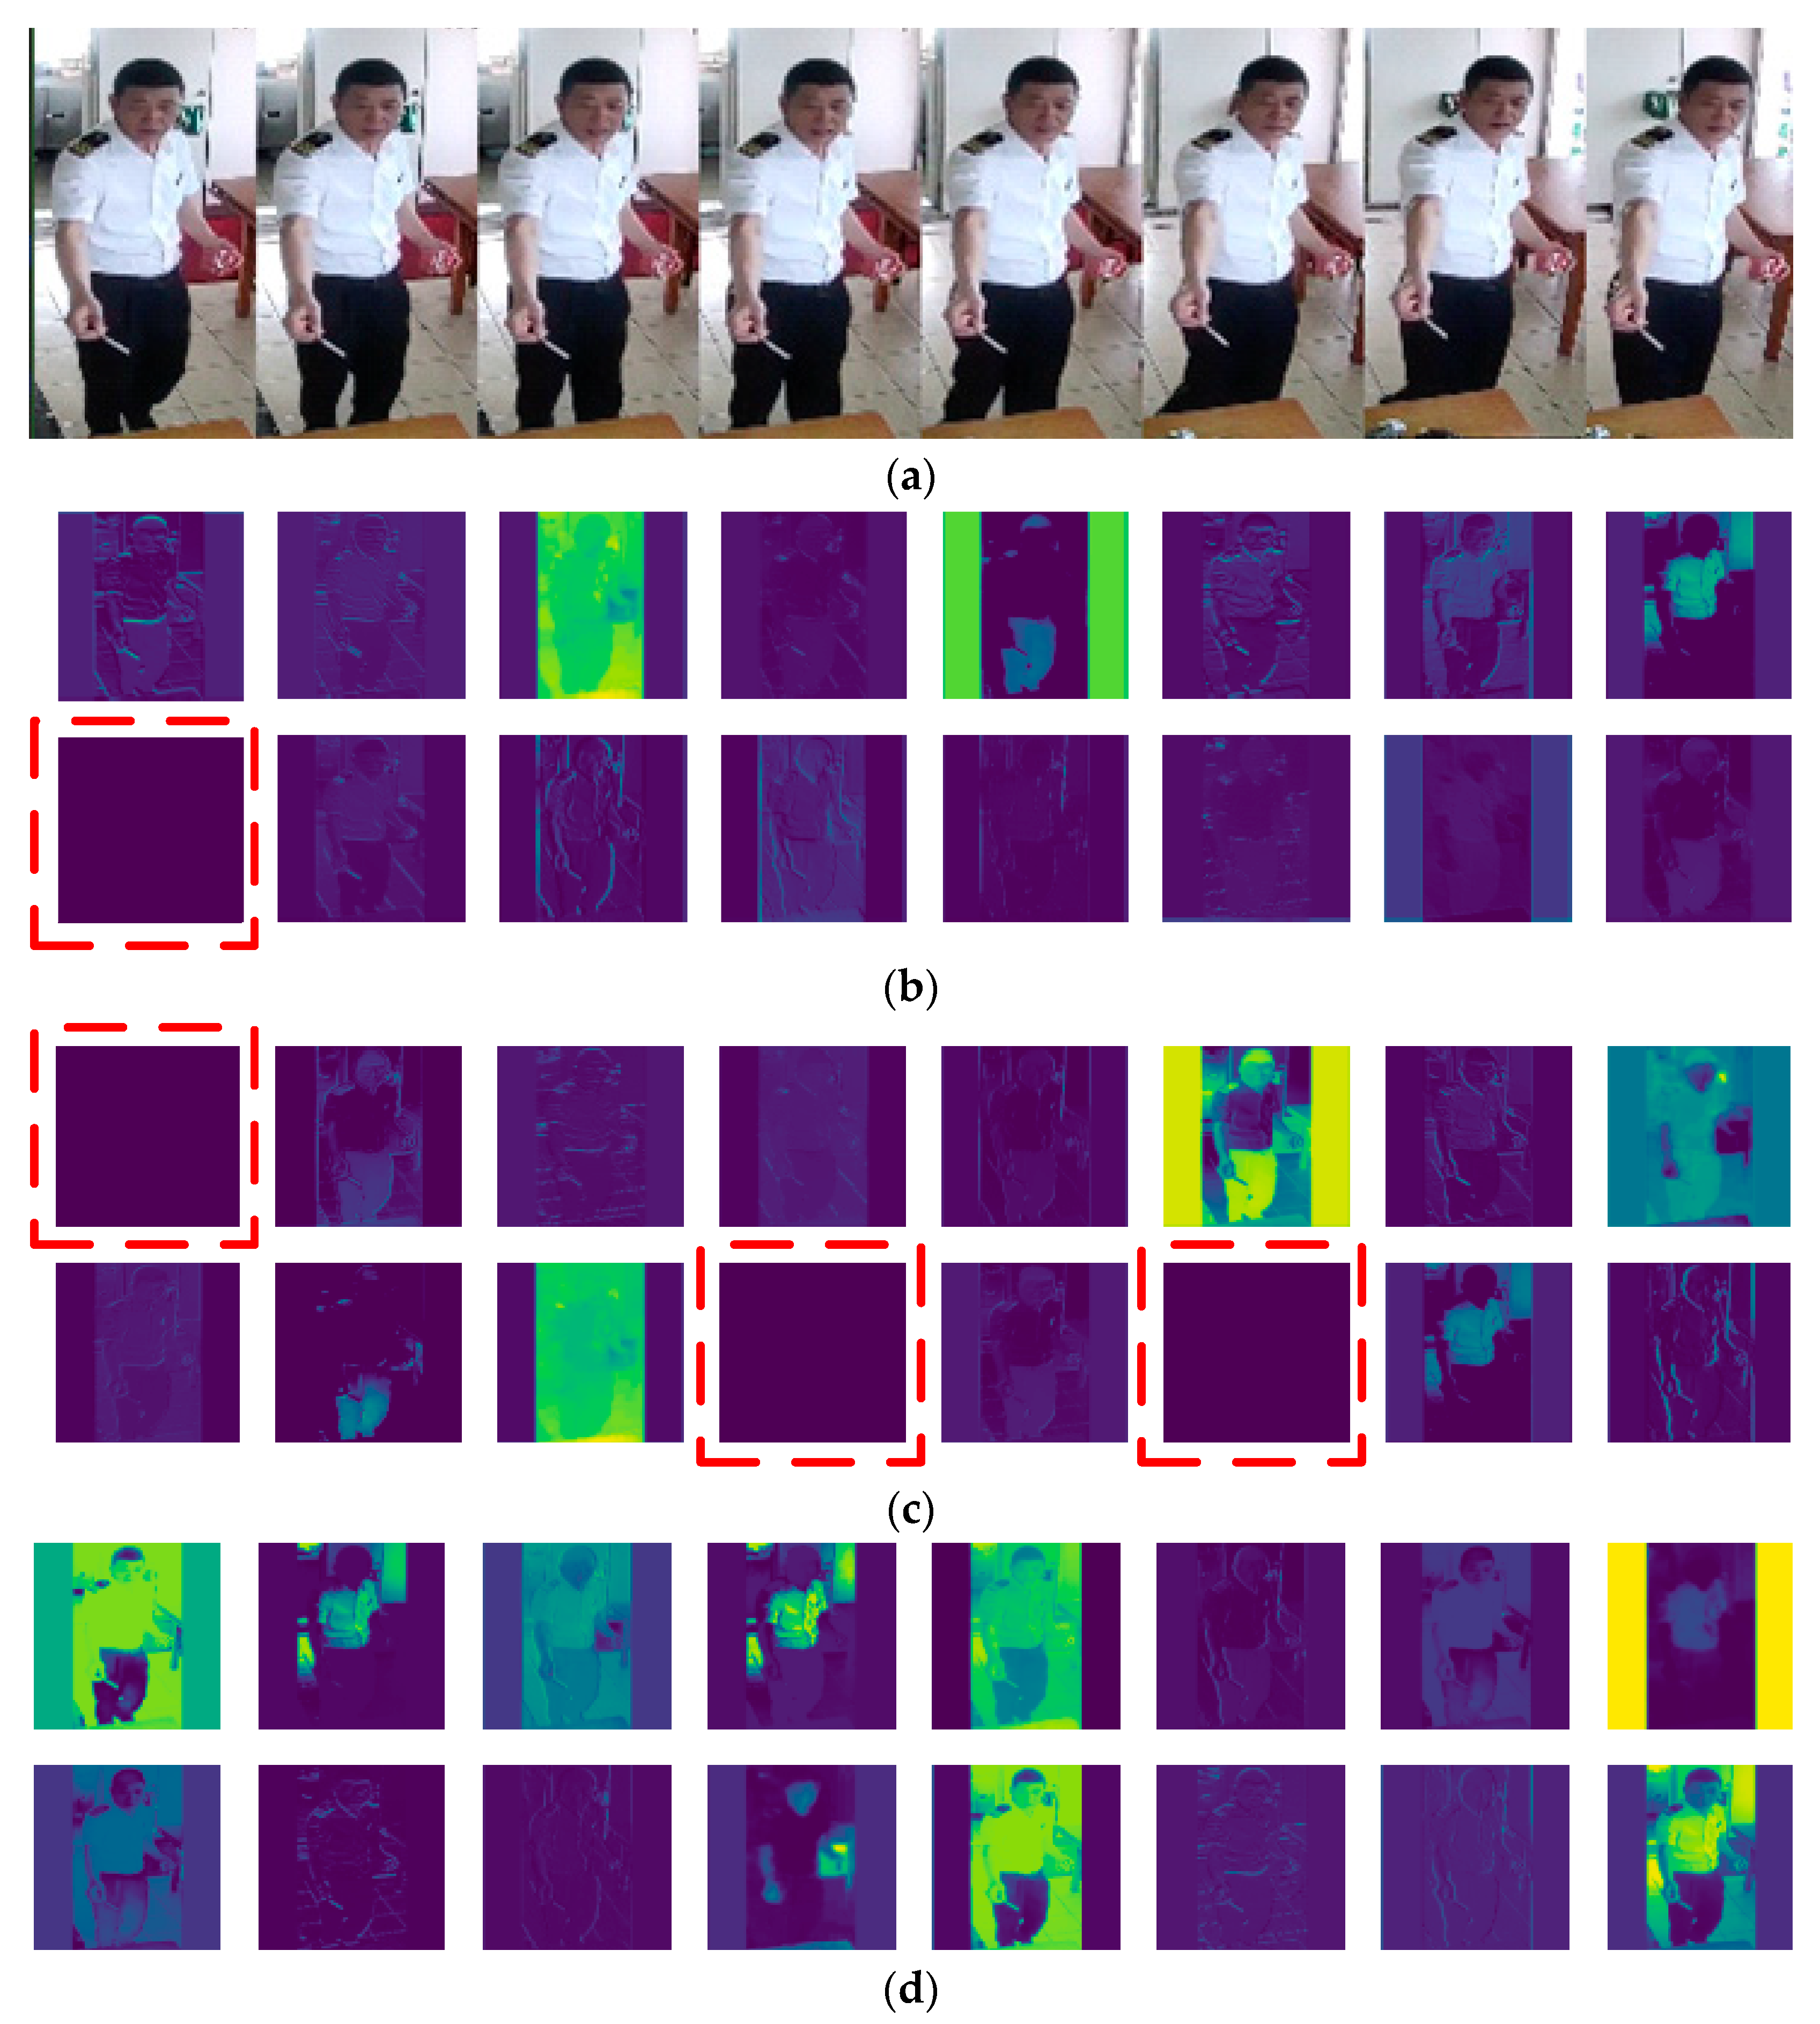
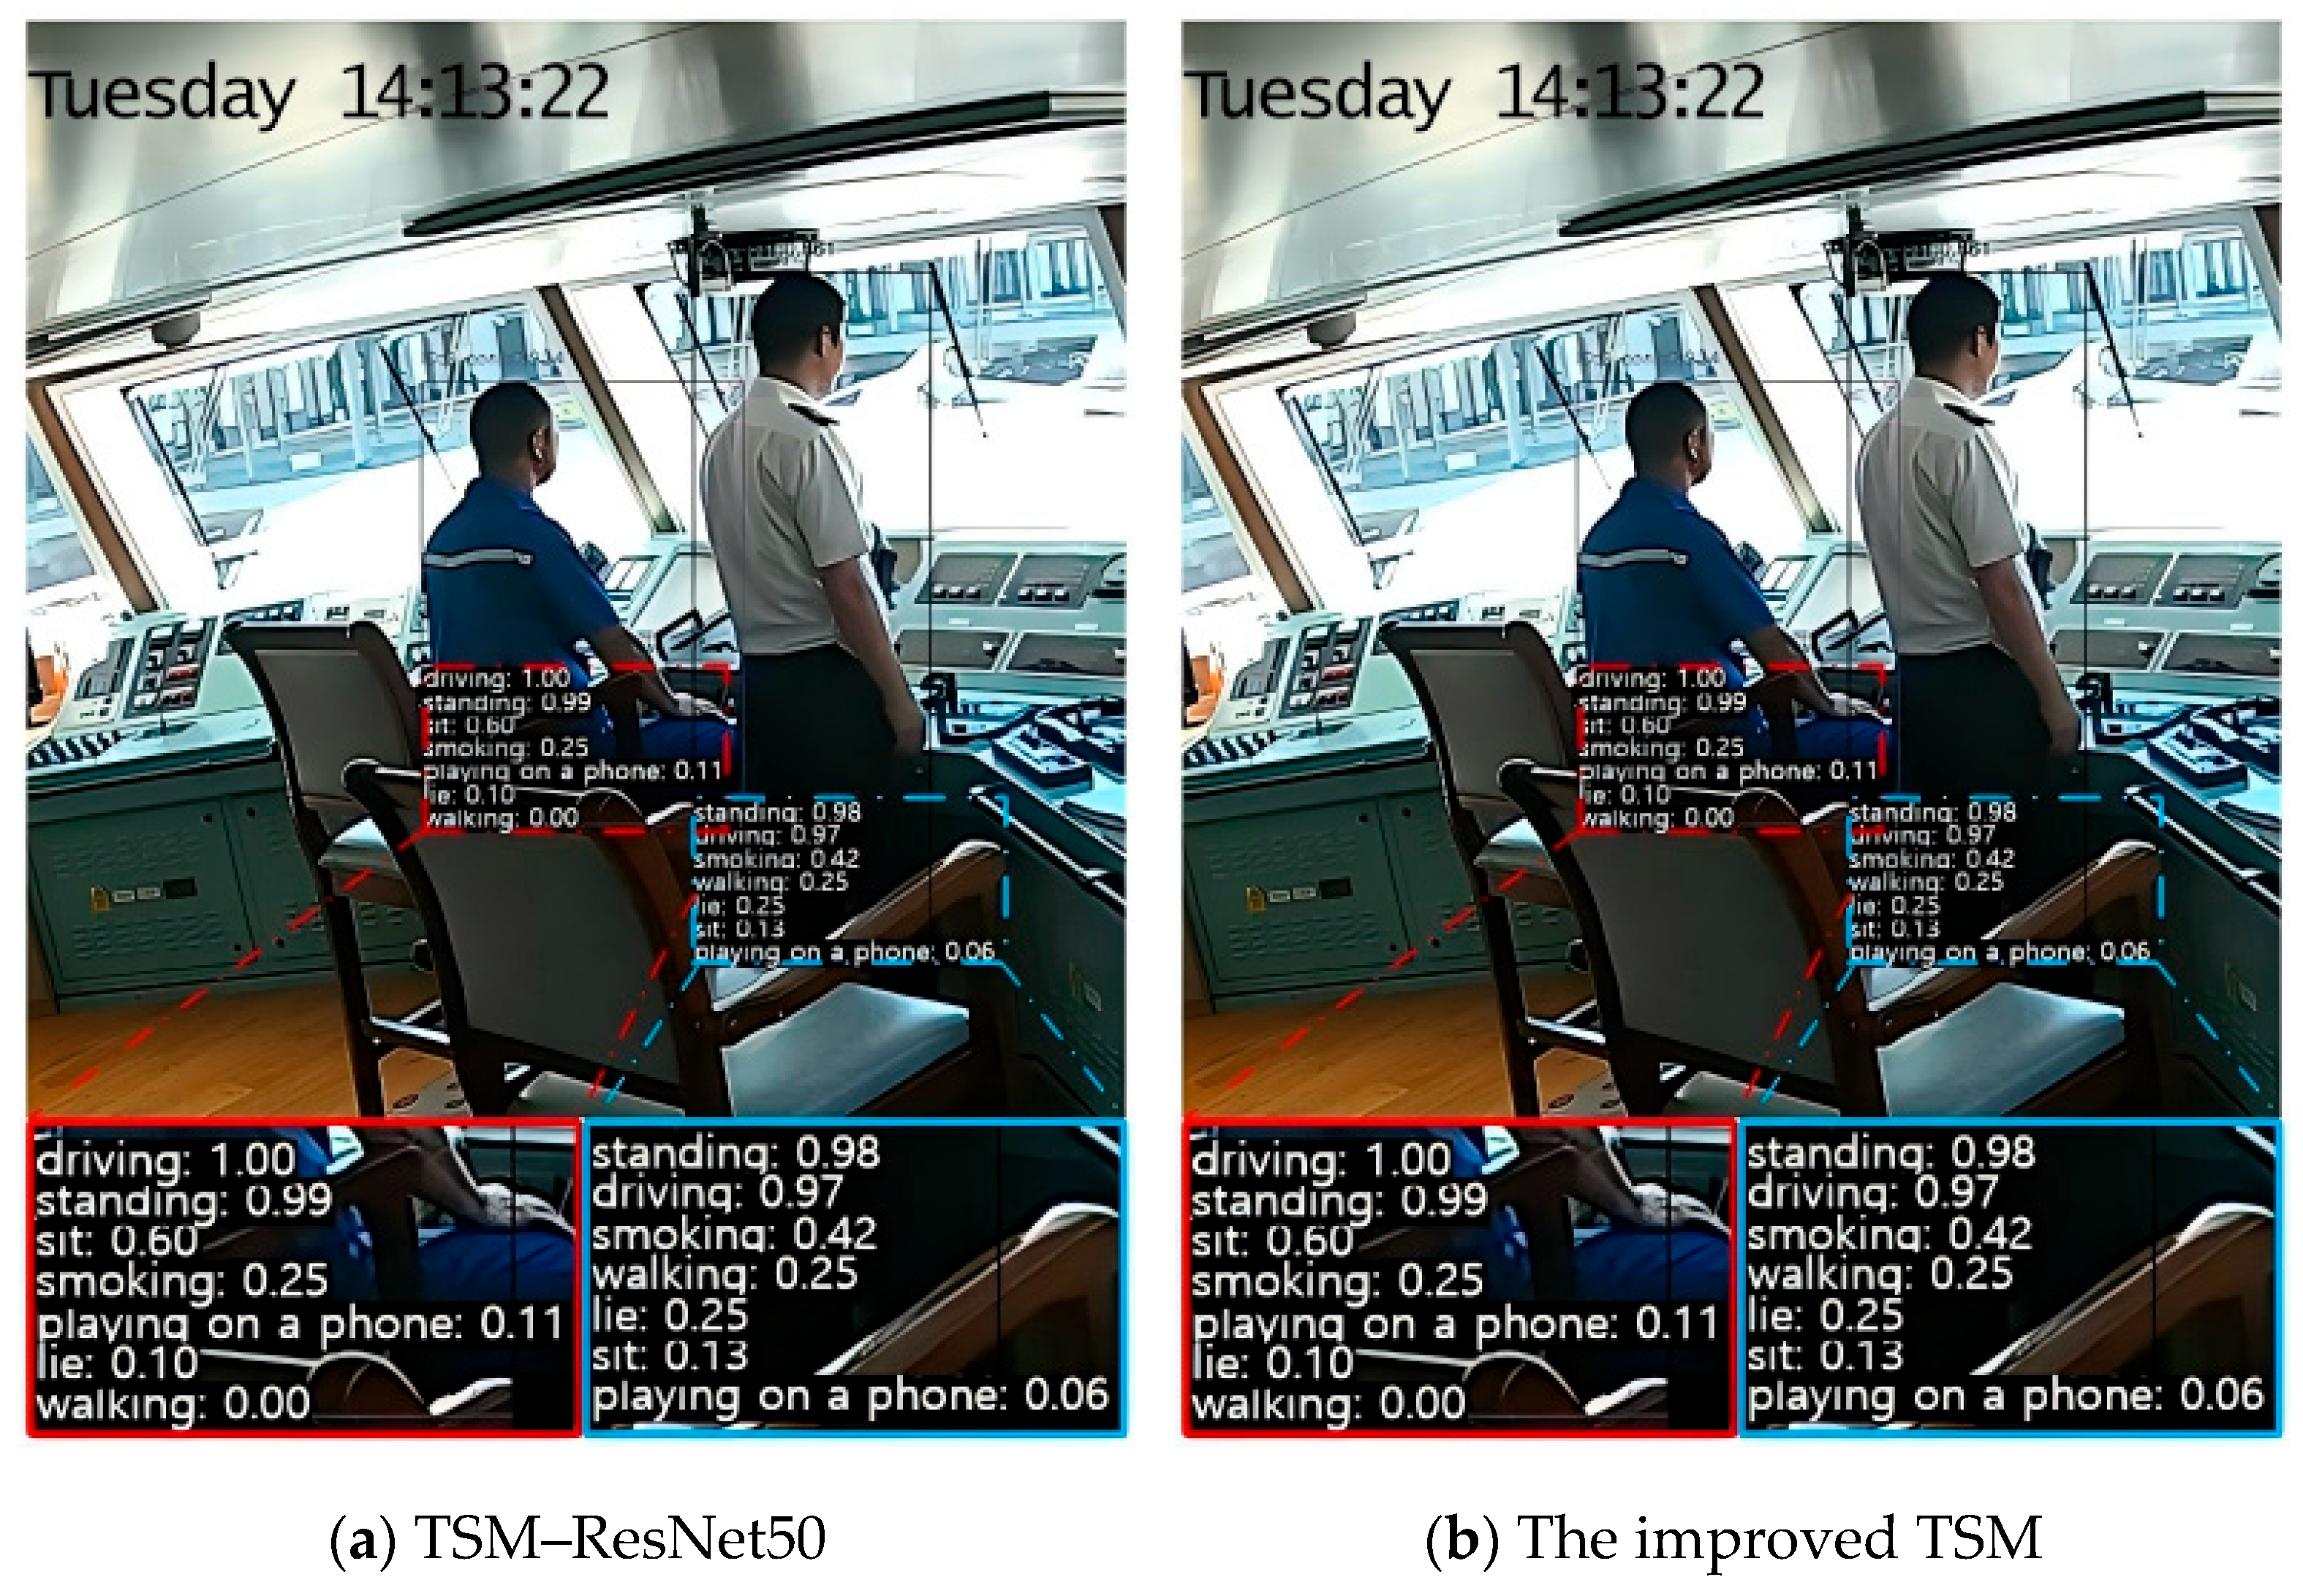
4.3.3. Results of Behavior Recognition
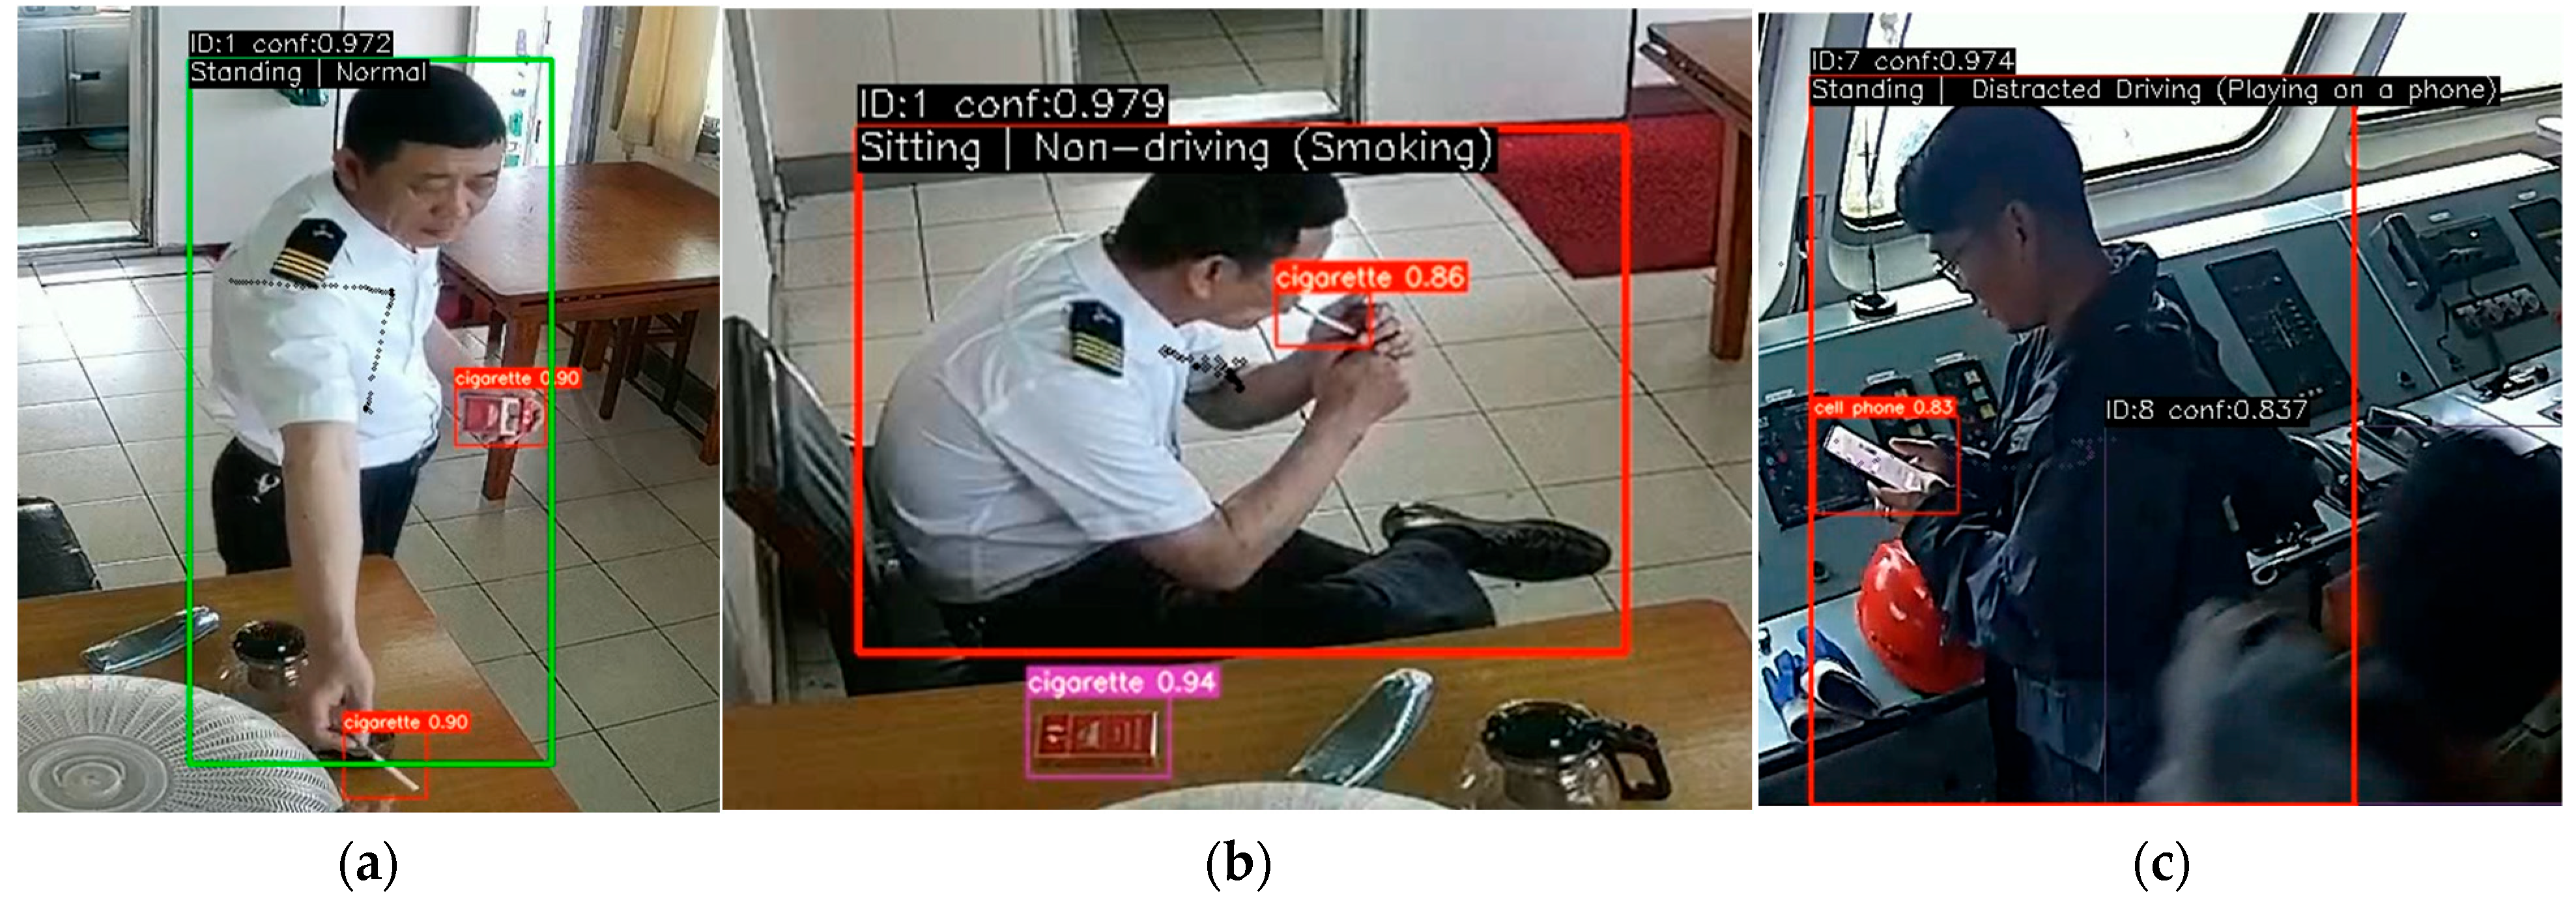
4.3.4. Multi-Source Feature Fusion Inference Results
5. Conclusions
Author Contributions
Funding
Institutional Review Board Statement
Informed Consent Statement
Data Availability Statement
Conflicts of Interest
References
- Marine Accident Investigation Branch. *Report on the collision between James 2 and Vertrouwen, Sussex Bay, 6 August 2017* (Report No. 3/2018). UK Government. 2018. Available online: https://www.gov.uk/maib-reports/collision-between-fishing-vessel-vertrouwen-and-motor-cruiser-james-2-resulting-in-motor-cruiser-sinking-with-loss-of-3-lives (accessed on 7 March 2018).
- Maritime and Coastguard Agency (MCA). *MGN 638 (M+F): Human Element Guidance—Part 3: Distraction—The Fatal Dangers of Mobile Phones and Other Personal Devices When Working*. UK Government. 2023. Available online: https://www.gov.uk/government/publications/mgn-638-mf-amendment-1-human-element-guidance-part-3-distraction/mgn-638-mf-amendment-1-human-element-guidance-part-3-distraction-the-fatal-dangers-of-mobile-phones-and-other-personal-devices-when-working (accessed on 13 March 2024).
- Zhang, J.; Wu, Z.; Li, F.; Luo, J.; Ren, T.; Hu, S.; Li, W.; Li, W. Attention-Based Convolutional and Recurrent Neural Networks for Driving Behavior Recognition Using Smartphone Sensor Data. IEEE Access 2019, 7, 148031–148046. [Google Scholar] [CrossRef]
- Feichtenhofer, C.; Fan, H.; Malik, J.; He, K. SlowFast Networks for Video Recognition. In Proceedings of the 2019 IEEE/CVF International Conference on Computer Vision (ICCV), Seoul, Republic of Korea, 27 October–2 November 2019; pp. 6201–6210. [Google Scholar]
- Luo, W.; Xing, J.; Milan, A.; Zhang, X.; Liu, W.; Kim, T.-K. Multiple Object Tracking: A Literature Review. Artif. Intell. 2021, 293, 103448. [Google Scholar] [CrossRef]
- Wojke, N.; Bewley, A.; Paulus, D. Simple Online and Realtime Tracking with a Deep Association Metric. In Proceedings of the 2017 IEEE International Conference on Image Processing (ICIP), Beijing, China, 17–20 September 2017; pp. 3645–3649. [Google Scholar]
- Zhang, Y.; Sun, P.; Jiang, Y.; Yu, D.; Weng, F.; Yuan, Z.; Luo, P.; Liu, W.; Wang, X. ByteTrack: Multi-Object Tracking by Associating Every Detection Box. In Proceedings of the Computer Vision—ECCV 2022; Avidan, S., Brostow, G., Cissé, M., Farinella, G.M., Hassner, T., Eds.; Springer Nature: Cham, Switzerland, 2022; pp. 1–21. [Google Scholar]
- Meinhardt, T.; Kirillov, A.; Leal-Taixé, L.; Feichtenhofer, C. TrackFormer: Multi-Object Tracking with Transformers. In Proceedings of the 2022 IEEE/CVF Conference on Computer Vision and Pattern Recognition (CVPR), New Orleans, LA, USA, 18–24 June 2022; pp. 8834–8844. [Google Scholar]
- Sun, P.; Jiang, Y.; Zhang, R.; Xie, E.; Cao, J.; Hu, X.; Kong, T.; Yuan, Z.; Wang, C.; Luo, P. TransTrack: Multiple-Object Tracking with Transformer. arXiv 2020, arXiv:2012.15460. [Google Scholar]
- Hong, S.; Zhan, W.; Dong, T.; She, J.; Min, C.; Huang, H.; Sun, Y. A Recognition Method of Bactrocera Minax (Diptera: Tephritidae) Grooming Behavior via a Multi-Object Tracking and Spatio-Temporal Feature Detection Model. J. Insect Behav. 2022, 35, 67–81. [Google Scholar] [CrossRef]
- Wang, H.; Jin, L.; He, Y.; Huo, Z.; Wang, G.; Sun, X. Detector–Tracker Integration Framework for Autonomous Vehicles Pedestrian Tracking. Remote Sens. 2023, 15, 208. [Google Scholar] [CrossRef]
- Sukkar, M.; Shukla, M.; Kumar, D.; Gerogiannis, V.C.; Kanavos, A.; Acharya, B. Enhancing Pedestrian Tracking in Autono-mous Vehicles by Using Advanced Deep Learning Techniques. Information 2024, 15, 104. [Google Scholar] [CrossRef]
- Zhao, H.; Wei, G.; Xiao, Y.; Xing, X. Multi-Ship Tracking by Robust Similarity Metric. In Proceedings of the 2023 IEEE International Conference on Mechatronics and Automation (ICMA), Harbin, China, 6–9 August 2023; pp. 2151–2156. [Google Scholar]
- Tran, D.; Bourdev, L.; Fergus, R.; Torresani, L.; Paluri, M. Learning Spatiotemporal Features with 3D Convolutional Networks. In Proceedings of the 2015 IEEE International Conference on Computer Vision (ICCV), Santiago, Chile, 7–13 December 2015; pp. 4489–4497. [Google Scholar]
- Carreira, J.; Zisserman, A. Quo Vadis, Action Recognition? A New Model and the Kinetics Dataset. In Proceedings of the 2017 IEEE Conference on Computer Vision and Pattern Recognition (CVPR), Honolulu, HI, USA, 21–26 July 2017; pp. 4724–4733. [Google Scholar]
- Qiu, Z.; Yao, T.; Mei, T. Learning Spatio-Temporal Representation with Pseudo-3D Residual Networks. In Proceedings of the 2017 IEEE International Conference on Computer Vision (ICCV), Venice, Italy, 22–29 October 2017; pp. 5534–5542. [Google Scholar]
- Tran, D.; Wang, H.; Torresani, L.; Ray, J.; LeCun, Y.; Paluri, M. A Closer Look at Spatiotemporal Convolutions for Action Recognition. In Proceedings of the 2018 IEEE/CVF Conference on Computer Vision and Pattern Recognition, Salt Lake City, UT, USA, 18–23 July 2018; pp. 6450–6459. [Google Scholar]
- Hao, F.-F.; Liu, J.; Chen, X.-D. A Review of Human Behavior Recognition Based on Deep Learning. In Proceedings of the 2020 International Conference on Artificial Intelligence and Education (ICAIE), Tianjin, China, 26–28 June 2020; pp. 19–23. [Google Scholar]
- Wang, L.; Xiong, Y.; Wang, Z.; Qiao, Y.; Lin, D.; Tang, X.; Van Gool, L. Temporal Segment Networks for Action Recognition in Videos. IEEE Trans. Pattern Anal. Mach. Intell. 2019, 41, 2740–2755. [Google Scholar] [CrossRef] [PubMed]
- Lin, J.; Gan, C.; Han, S. TSM: Temporal Shift Module for Efficient Video Understanding. In Proceedings of the 2019 IEEE/CVF International Conference on Computer Vision (ICCV), Seoul, Republic of Korea, 27 October–2 November 2019; pp. 7082–7092. [Google Scholar]
- Rodrigues, N.R.P.; Da Costa, N.M.C.; Melo, C.; Abbasi, A.; Fonseca, J.C.; Cardoso, P.; Borges, J. Fusion Object Detection and Action Recognition to Predict Violent Action. Sensors 2023, 23, 5610. [Google Scholar] [CrossRef] [PubMed]
- Xue, H.; Chen, D.; Fan, L.; Mao, Z.; Zhao, J.; Chen, Z. A Ship Pilot On-Duty State Recognition Model Based SlowFast Network and Attention Mechanism. In Proceedings of the 2023 7th International Conference on Transportation Information and Safety (ICTIS), Xi’an, China, 4–6 August 2023; pp. 147–151. [Google Scholar]
- He, K.; Zhang, X.; Ren, S.; Sun, J. Deep Residual Learning for Image Recognition. In Proceedings of the 2016 IEEE Conference on Computer Vision and Pattern Recognition (CVPR), Las Vegas, NV, USA, 27–30 June 2016; pp. 770–778. [Google Scholar]
- Howard, A.G.; Zhu, M.; Chen, B.; Kalenichenko, D.; Wang, W.; Weyand, T.; Andreetto, M.; Adam, H. MobileNets: Efficient Convolutional Neural Networks for Mobile Vision Applications. arXiv 2017, arXiv:1704.04861. [Google Scholar] [CrossRef]
- Tan, M.; Le, Q.V. EfficientNet: Rethinking Model Scaling for Convolutional Neural Networks. arXiv 2019, arXiv:1905.11946. [Google Scholar] [CrossRef]
- Luo, C.-Y.; Cheng, S.-Y.; Xu, H.; Li, P. Human Behavior Recognition Model Based on Improved EfficientNet. Procedia Comput. Sci. 2022, 199, 369–376. [Google Scholar] [CrossRef]
- Zhou, A.; Ma, Y.; Ji, W.; Zong, M.; Yang, P.; Wu, M.; Liu, M. Multi-Head Attention-Based Two-Stream EfficientNet for Action Recognition. Multimed. Syst. 2023, 29, 487–498. [Google Scholar] [CrossRef]
- Khan, T.; Choi, G.; Lee, S. EFFNet-CA: An Efficient Driver Distraction Detection Based on Multiscale Features Extractions and Channel Attention Mechanism. Sensors 2023, 23, 3835. [Google Scholar] [CrossRef] [PubMed]
- Pawlak, Z. Rough Set Theory and Its Applications to Data Analysis. Cybern. Syst. 1998, 29, 661–688. [Google Scholar] [CrossRef]
- Senthilnathan, C.R. Understanding Retail Consumer Shopping Behaviour Using Rough Set Approach. Int. J. Rough Sets Data Anal. 2016, 3, 38–50. [Google Scholar] [CrossRef]
- Henry, C. Reinforcement Learning in Biologically-Inspired Collective Robotics: A Rough Set Approach. Masters Abstr. Int. 2006, 45, 1663. [Google Scholar]
- Chu, X.; Sun, B.; Chu, X.; Wang, L.; Bao, K.; Chen, N. Multi-modal and Multi-criteria Conflict Analysis Model Based on Deep Learning and Domi-nance-based Rough Sets: Application to Clinical Non-parallel Decision Problems. Inf. Fusion 2025, 113, 102636. [Google Scholar] [CrossRef]
- Sanchez-Riera, J.; Hsiao, Y.; Lim, T.; Hua, K.-L.; Cheng, W.-H. A Robust Tracking Algorithm for 3D Hand Gesture with Rapid Hand Motion Through Deep Learning. In Proceedings of the 2014 IEEE International Conference on Multimedia & Expo Workshops, Chengdu, China, 14–18 July 2014. [Google Scholar] [CrossRef]
- Bell, D.A.; Beck, A.; Miller, P.; Wu, Q.X.; Herrera, A. Video Mining-Learning Patterns of Behaviour via an Intelligent Image Analysis System. In Proceedings of the Seventh International Conference on Intelligent Systems Design and Applications (ISDA 2007), Rio de Janeiro, Brazil, 20–24 October 2007; pp. 460–464. [Google Scholar] [CrossRef]
- Deng, J.; Dong, W.; Socher, R.; Li, L.-J.; Li, K.; Li, F.-F. ImageNet: A Large-Scale Hierarchical Image Database. In Proceedings of the 2009 IEEE Conference on Computer Vision and Pattern Recognition, Miami, FL, USA, 20–25 June 2009; pp. 248–255. [Google Scholar]
- Zhang, Y.; Li, X.; Liu, C.; Shuai, B.; Zhu, Y.; Brattoli, B.; Chen, H.; Marsic, I.; Tighe, J. VidTr: Video Transformer without Convolutions. In Proceedings of the 2021 IEEE/CVF International Conference on Computer Vision (ICCV), Montreal, QC, Canada, 10–17 October 2021; pp. 13557–13567. [Google Scholar]
- Zhao, Z.; Huang, B.; Xing, S.; Wu, G.; Qiao, Y.; Wang, L. Asymmetric Masked Distillation for Pre-training Small Foundation Models. In Proceedings of the 2024 IEEE/CVF Conference on Computer Vision and Pattern Recognition (CVPR), Seattle, WA, USA, 16–22 June 2024; pp. 18516–18526. [Google Scholar]
- Zhang, K.; Lyu, M.; Guo, X.; Zhang, L.; Liu, C. Temporal Shift Module-Based Vision Transformer Network for Action Recognition. IEEE Access 2024, 12, 47246–47257. [Google Scholar] [CrossRef]

| Stage | Operator | Resolution | Channels | Layers |
|---|---|---|---|---|
| 1 | Conv3 × 3 | 448 × 448 | 32 | 1 |
| 2 | MBConv1, k3 × 3 | 224 × 224 | 16 | 2 |
| 3 | MBConv6, k3 × 3 | 224 × 224 | 24 | 3 |
| 4 | MBConv6, k5 × 5 | 112 × 112 | 40 | 3 |
| 5 | MBConv6, k3 × 3 | 56 × 56 | 80 | 4 |
| 6 | MBConv6, k5 × 5 | 28 × 28 | 112 | 4 |
| 7 | MBConv6, k5 × 5 | 28 × 28 | 192 | 5 |
| 8 | MBConv6, k3 × 3 | 14 × 14 | 320 | 2 |
| 9 | Conv1 × 1 | 14 × 14 | 1280 | 1 |
| 10 | CA_Block | 14 × 14 | 1280 | 1 |
| 11 | Pooling&FC | 14 × 14 | 7 | 1 |
| Condition Attribute | Confidence of Associated Feature Objects | |
| Behavior Confidence | ||
| Coverage Rate of Anomalous Features | ||
| Decision Attribute | Anomalous Behavior | {non-driving (smoking), non-driving (playing on a phone), distracted driving (smoking), distracted driving (playing on a phone)} |
| Basic Mutually Exclusive Behavior |
| Behavior | Number of Samples |
|---|---|
| Sitting | 764 |
| Standing | 728 |
| Walking | 652 |
| Lying | 660 |
| Driving | 452 |
| Smoking | 920 |
| Playing on a phone | 612 |
| Category | Parameters | Value |
|---|---|---|
| Multi-object Tracking | Conf_thres | 0.1–0.7 |
| IOU_thres | 0.1–0.7 | |
| Behavior Recognition | Input_size | 448 px × 448 px |
| Num_segment | 8 | |
| Learning_rate | 2 × 10⁻⁵ | |
| Batch_size | 1 | |
| Dropout | 0.8 | |
| Epoch | 50 |
| Model | Image Size | Precision | Recall | mAP@0.5 | mAP@0.5:0.95 | Latency (ms) |
|---|---|---|---|---|---|---|
| YOLOv7 | 640 px × 640 px | 0.7454 | 0.6806 | 0.7029 | 0.4086 | 12.5 |
| YOLOv7-w6 | 1280 px × 1280 px | 0.812 | 0.726 | 0.78 | 0.503 | 30.9 |
| YOLOv7-e6 | 1280 px × 1280 px | 0.822 | 0.745 | 0.781 | 0.514 | 49.3 |
| YOLOv7-d6 | 1280 px × 1280 px | 0.827 | 0.7434 | 0.7964 | 0.5101 | 60.6 |
| YOLOv7-e6e | 1280 px × 1280 px | 0.838 | 0.703 | 0.776 | 0.513 | 71.6 |
| Model | Backbone | GMAC | Parameters/M | Top-1 Accuracy/% |
|---|---|---|---|---|
| TSM | ResNet50 | 132.17 | 23.52 | 77.79 |
| ResNet101 | 251.62 | 42.51 | 81.4 | |
| EfficientNet-B0 | 13.07 | 4.02 | 76.34 | |
| EfficientNet-B1 | 19.26 | 6.52 | 80.65 | |
| EfficientNet-B2 | 22.16 | 7.71 | 78.50 | |
| EfficientNet-B3 | 32.23 | 10.71 | 80.11 | |
| EfficientNet-B4 | 50 | 17.56 | 77.42 | |
| SlowFast | ResNet50 | 101.16 | 33.66 | 75.1 |
| ResNet101 | 163.88 | 52.87 | 76.66 | |
| Improved TSM | EfficientNet-B3 | 32.28 | 10.93 | 82.1 |
| Component | M1 | M2 | M3 |
|---|---|---|---|
| TSM–EfficientNet-B3 | √ | √ | √ |
| +Image Augmentation | √ | √ | |
| +CA Attention | √ | ||
| Computational Cost (GMAC) | 32.23 | 32.23 | 32.26 |
| Top-1 Accuracy (%) | 79.03 | 80.32 | 82.1 |
| Method | Backbone Network | Parameters/M | UCF101 /% | HMDB51 /% |
|---|---|---|---|---|
| TSN [19] | InceptionV2 | 10.7 | 84.4 | 53.3 |
| I3D [15] | InceptionV2 | 25 | 95.6 | 74.8 |
| TSM [20] | ResNet50 | 23.52 | 96.0 | 73.2 |
| VidTr [36] | VidTr-L | 86 | 96.7 | 74.4 |
| AMD [37] | ViT-B | 87 | 97.1 | 79.6 |
| Improved TSM | Improved EfficientNet-B3 | 10.93 | 96.7 | 75.1 |
| Behavior | SlowFast–ResNet50 (%) | TSM–ResNet50 (%) | Improved TSM (%) |
|---|---|---|---|
| Sitting | 83.24 | 84.53 | 89.27 |
| Standing | 82.45 | 85.08 | 88.63 |
| Walking | 81.03 | 83.47 | 87.15 |
| Lying | 84.12 | 85.62 | 88.29 |
| Driving | 80.58 | 82.14 | 91.35 |
| Playing on a phone | 58.31 | 62.08 | 65.42 |
| Smoking | 60.17 | 64.25 | 68.09 |
| Top-1 accuracy | 75.10 | 77.79 | 82.10 |
| Method | AFAR/% | CCA/% | ||
|---|---|---|---|---|
| All | Smoking | Playing on a Phone | ||
| TSM–ResNet50 | 74.46 | 76.55 | 71.3 | 80.36 |
| Improved TSM | 76.3 | 77.57 | 74.38 | 81.84 |
| Multi-Source Feature Fusion | 83.37 | 84.47 | 81.69 | 83.66 |
Disclaimer/Publisher’s Note: The statements, opinions and data contained in all publications are solely those of the individual author(s) and contributor(s) and not of MDPI and/or the editor(s). MDPI and/or the editor(s) disclaim responsibility for any injury to people or property resulting from any ideas, methods, instructions or products referred to in the content. |
© 2025 by the authors. Licensee MDPI, Basel, Switzerland. This article is an open access article distributed under the terms and conditions of the Creative Commons Attribution (CC BY) license (https://creativecommons.org/licenses/by/4.0/).
Share and Cite
Chen, C.; Wei, Y.; Ma, F.; Shu, Z. Cross-Modal Behavioral Intelligence in Regard to a Ship Bridge: A Rough Set-Driven Framework with Enhanced Spatiotemporal Perception and Object Semantics. Appl. Sci. 2025, 15, 7220. https://doi.org/10.3390/app15137220
Chen C, Wei Y, Ma F, Shu Z. Cross-Modal Behavioral Intelligence in Regard to a Ship Bridge: A Rough Set-Driven Framework with Enhanced Spatiotemporal Perception and Object Semantics. Applied Sciences. 2025; 15(13):7220. https://doi.org/10.3390/app15137220
Chicago/Turabian StyleChen, Chen, Yuenan Wei, Feng Ma, and Zhongcheng Shu. 2025. "Cross-Modal Behavioral Intelligence in Regard to a Ship Bridge: A Rough Set-Driven Framework with Enhanced Spatiotemporal Perception and Object Semantics" Applied Sciences 15, no. 13: 7220. https://doi.org/10.3390/app15137220
APA StyleChen, C., Wei, Y., Ma, F., & Shu, Z. (2025). Cross-Modal Behavioral Intelligence in Regard to a Ship Bridge: A Rough Set-Driven Framework with Enhanced Spatiotemporal Perception and Object Semantics. Applied Sciences, 15(13), 7220. https://doi.org/10.3390/app15137220