
Potential Associations Between Anthropometric Characteristics, Biomarkers, and Sports Performance in Regional Ultra-Marathon Swimmers: A Quasi-Experimental Study


Abstract
1. Introduction
1.1. Gender and Age
1.2. Identifying Ultra–Marathon Swimming
2. Materials and Methods
2.1. Participants
2.2. Measurements
2.2.1. Before Ultra Swimming
2.2.2. During the Swim
2.2.3. Post-Swim Measurements
2.3. Statistical Analysis
3. Results
4. Discussion
4.1. Anthropometrics
4.2. Body Composition
4.3. Cardiopulmonary Biomarkers
4.4. Nutrition and Recovery
5. Conclusions
Author Contributions
Funding
Institutional Review Board Statement
Informed Consent Statement
Data Availability Statement
Acknowledgments
Conflicts of Interest
Abbreviations
| BW | Body Weight |
| BF% | Body Fat Percentage |
| LL | Limb Lengths |
| C | Circumferences |
| LBM | Lean Body Mass |
| BMI | Body Mass Index |
| HR | Heart Rate |
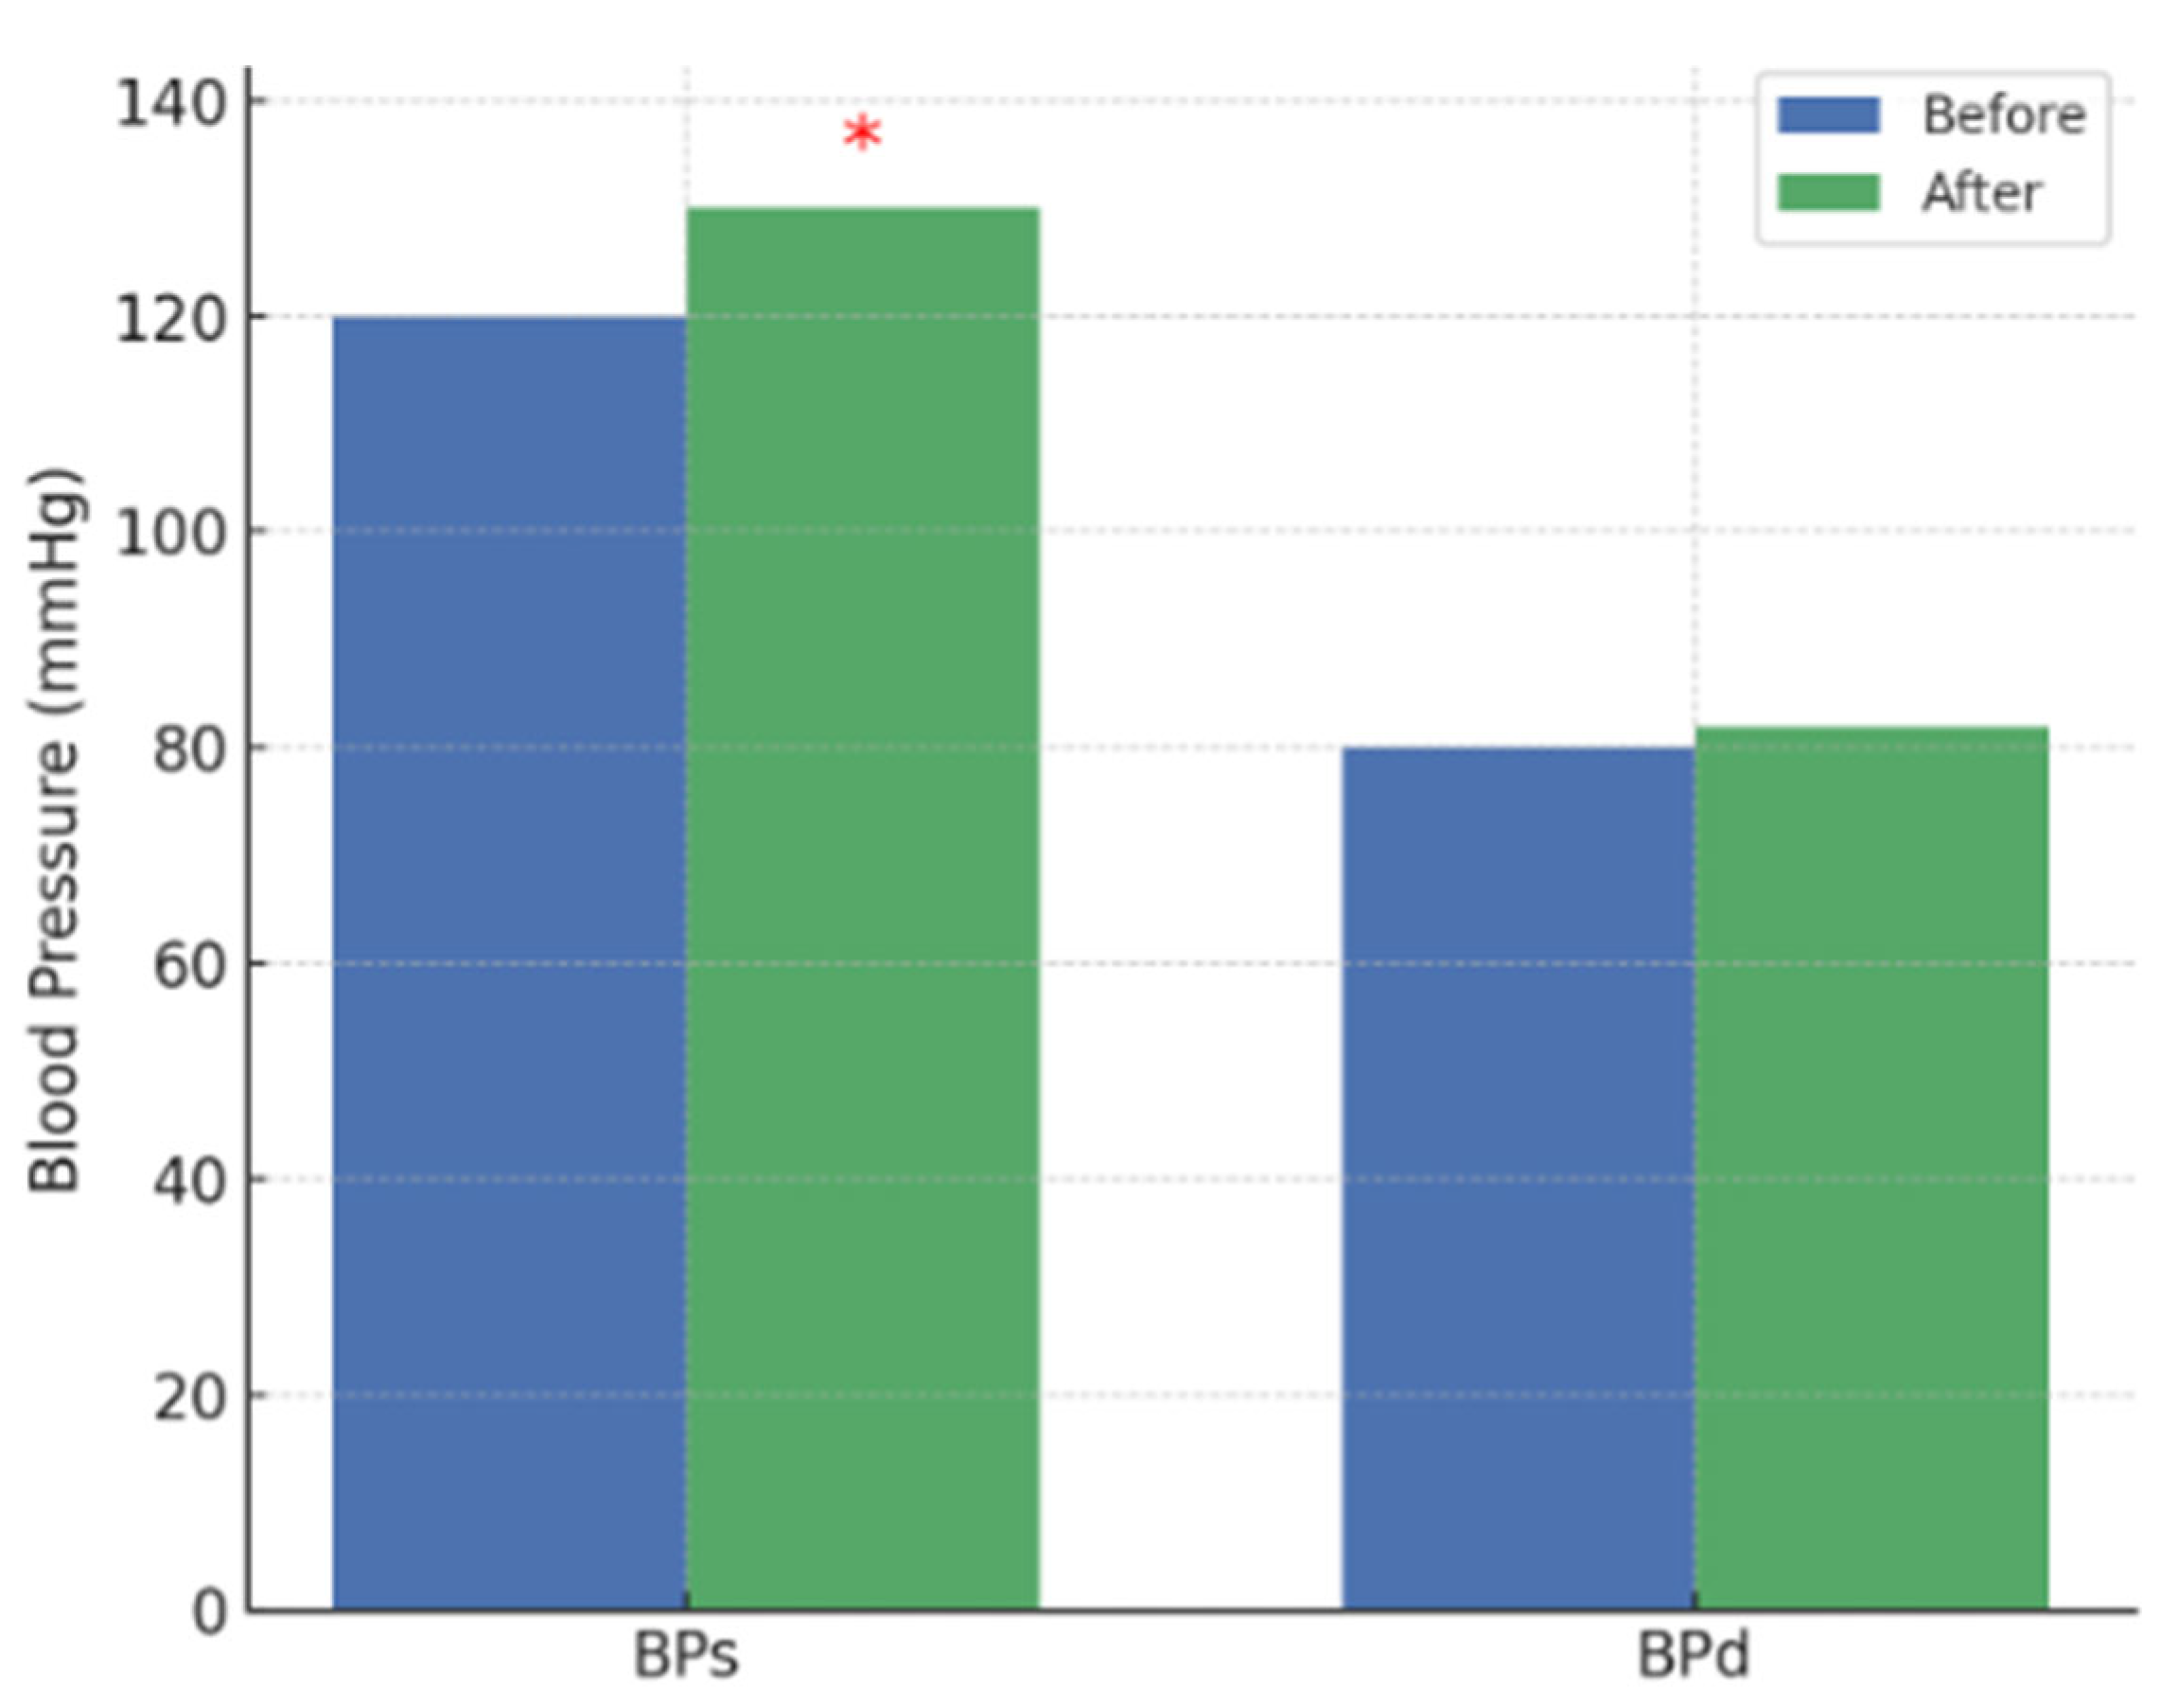
| BP | Blood Pressure |
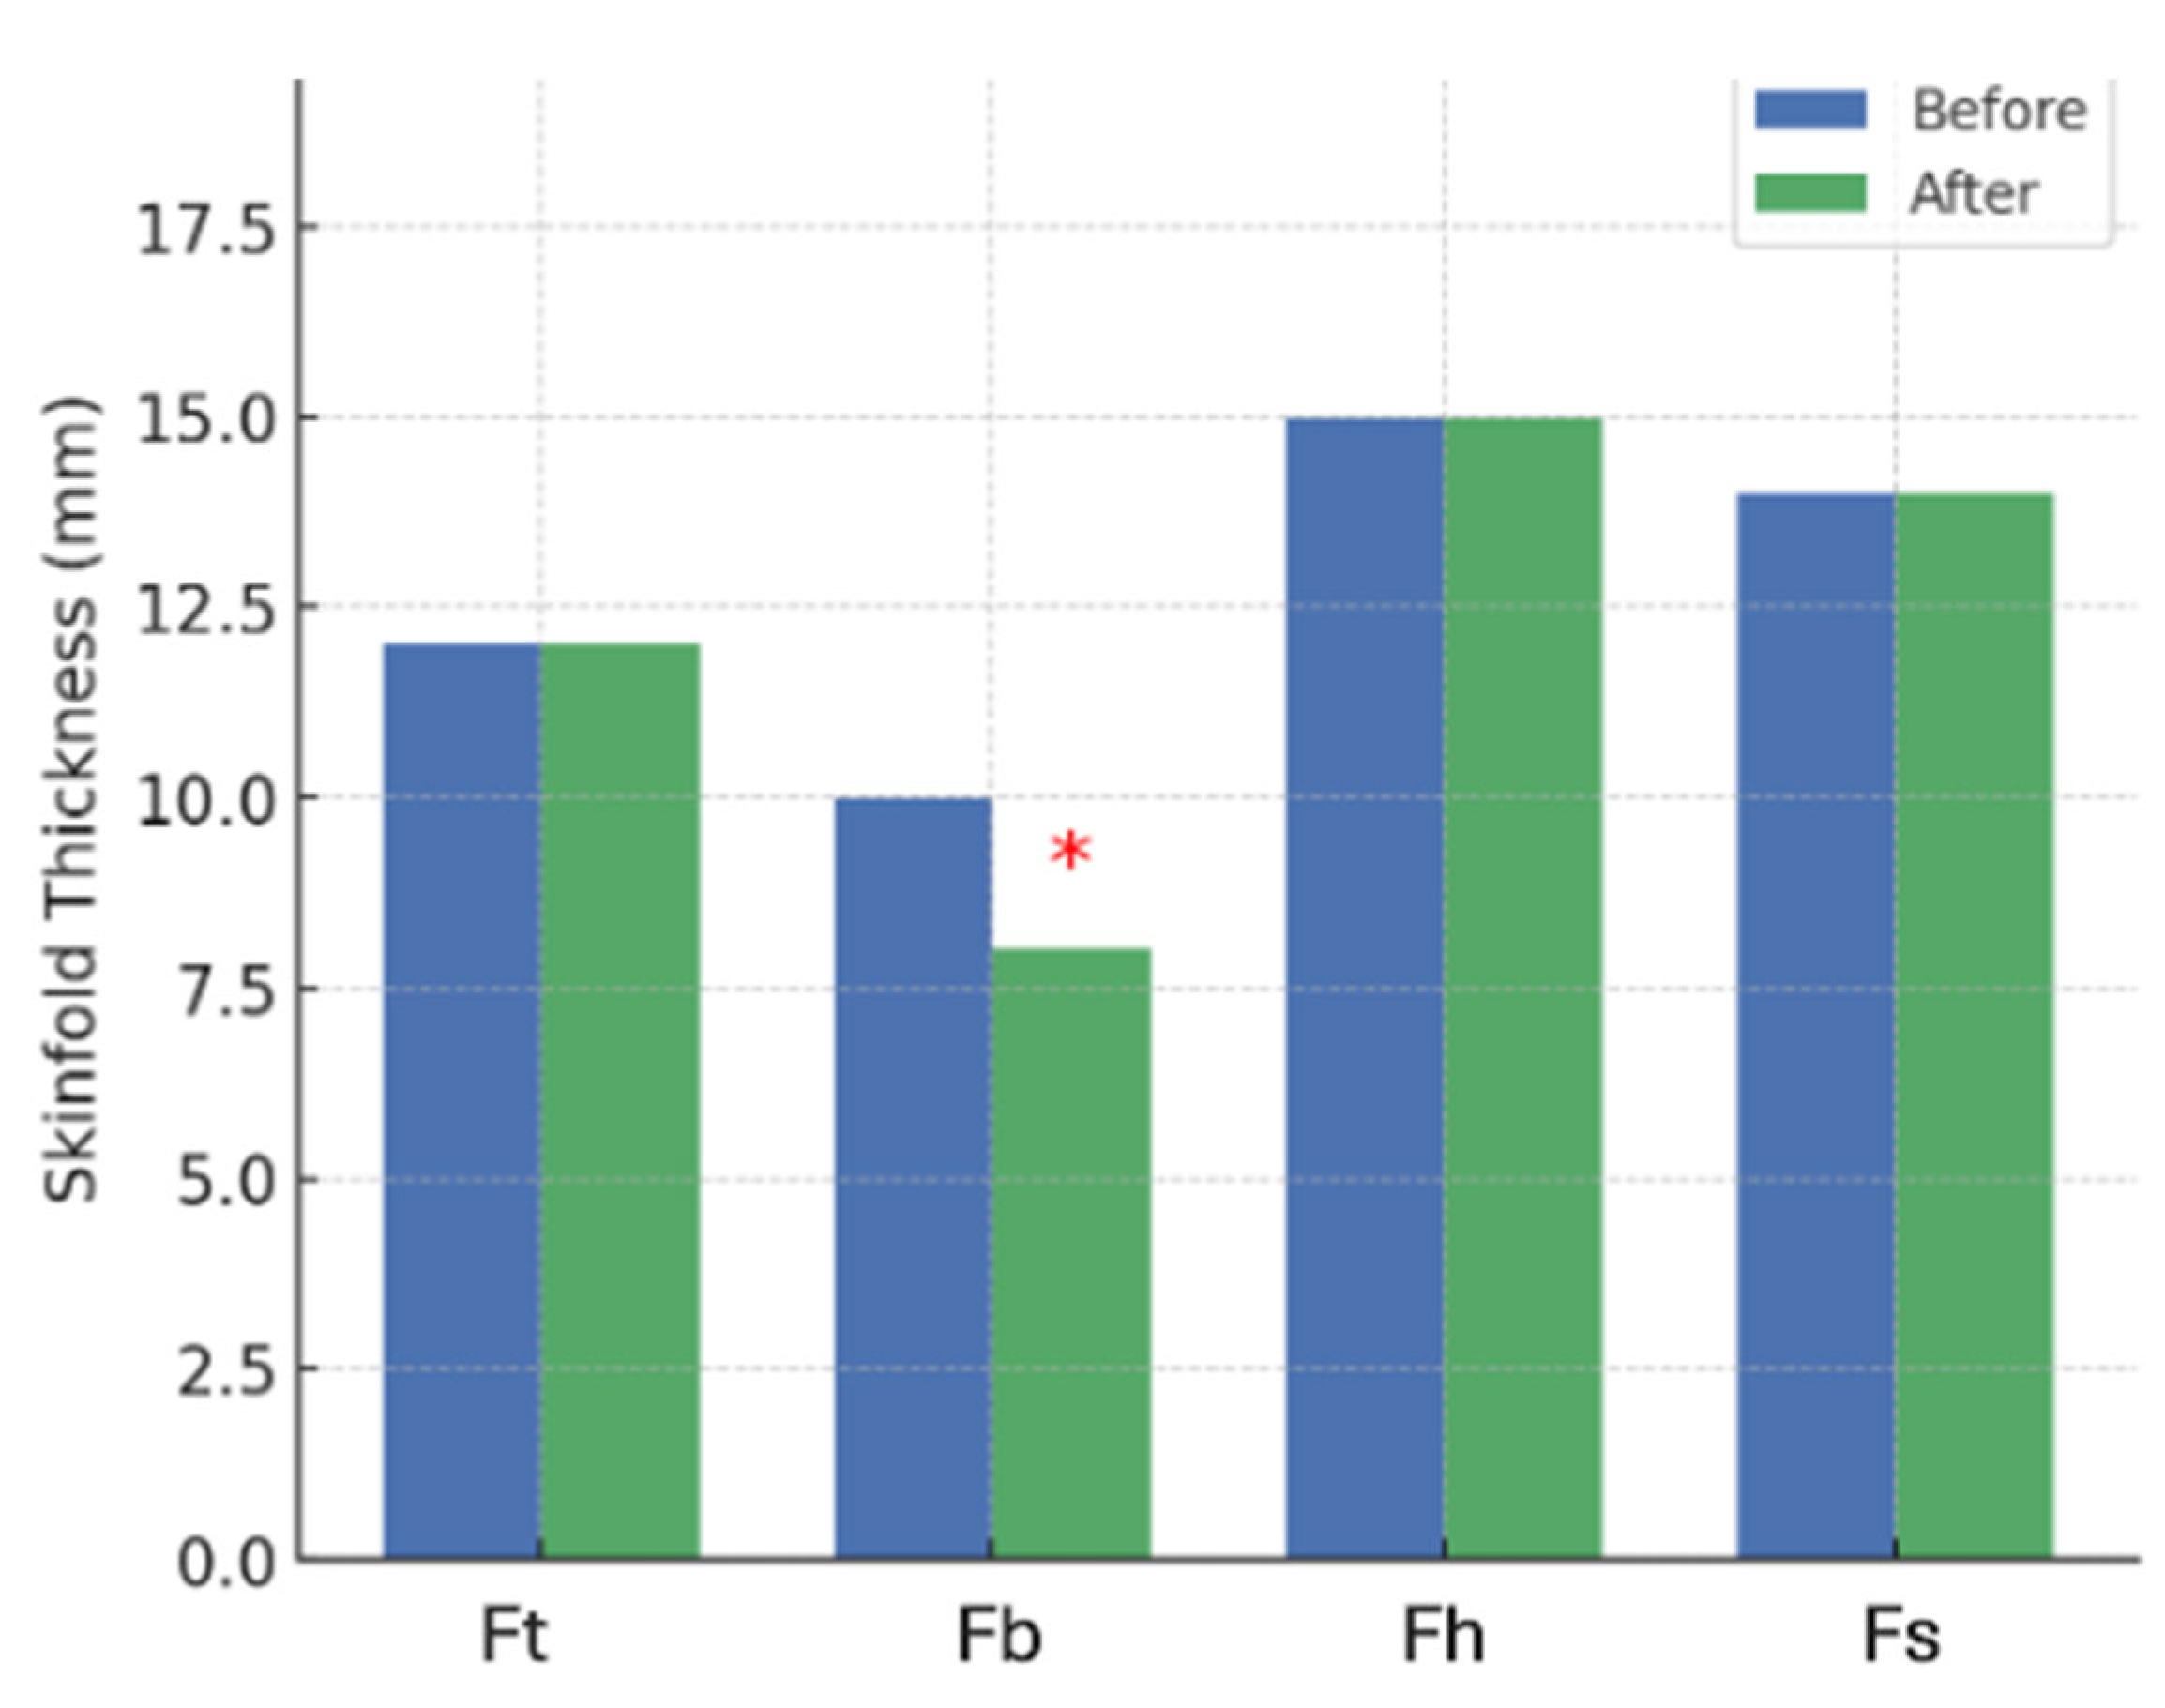
| Ft | Triceps Skinfold Thickness |
| Fb | Biceps Skinfold Thickness |
| Fh | Suprailiac Skinfold Thickness |
| Fs | Subscapular Skinfold Thickness |
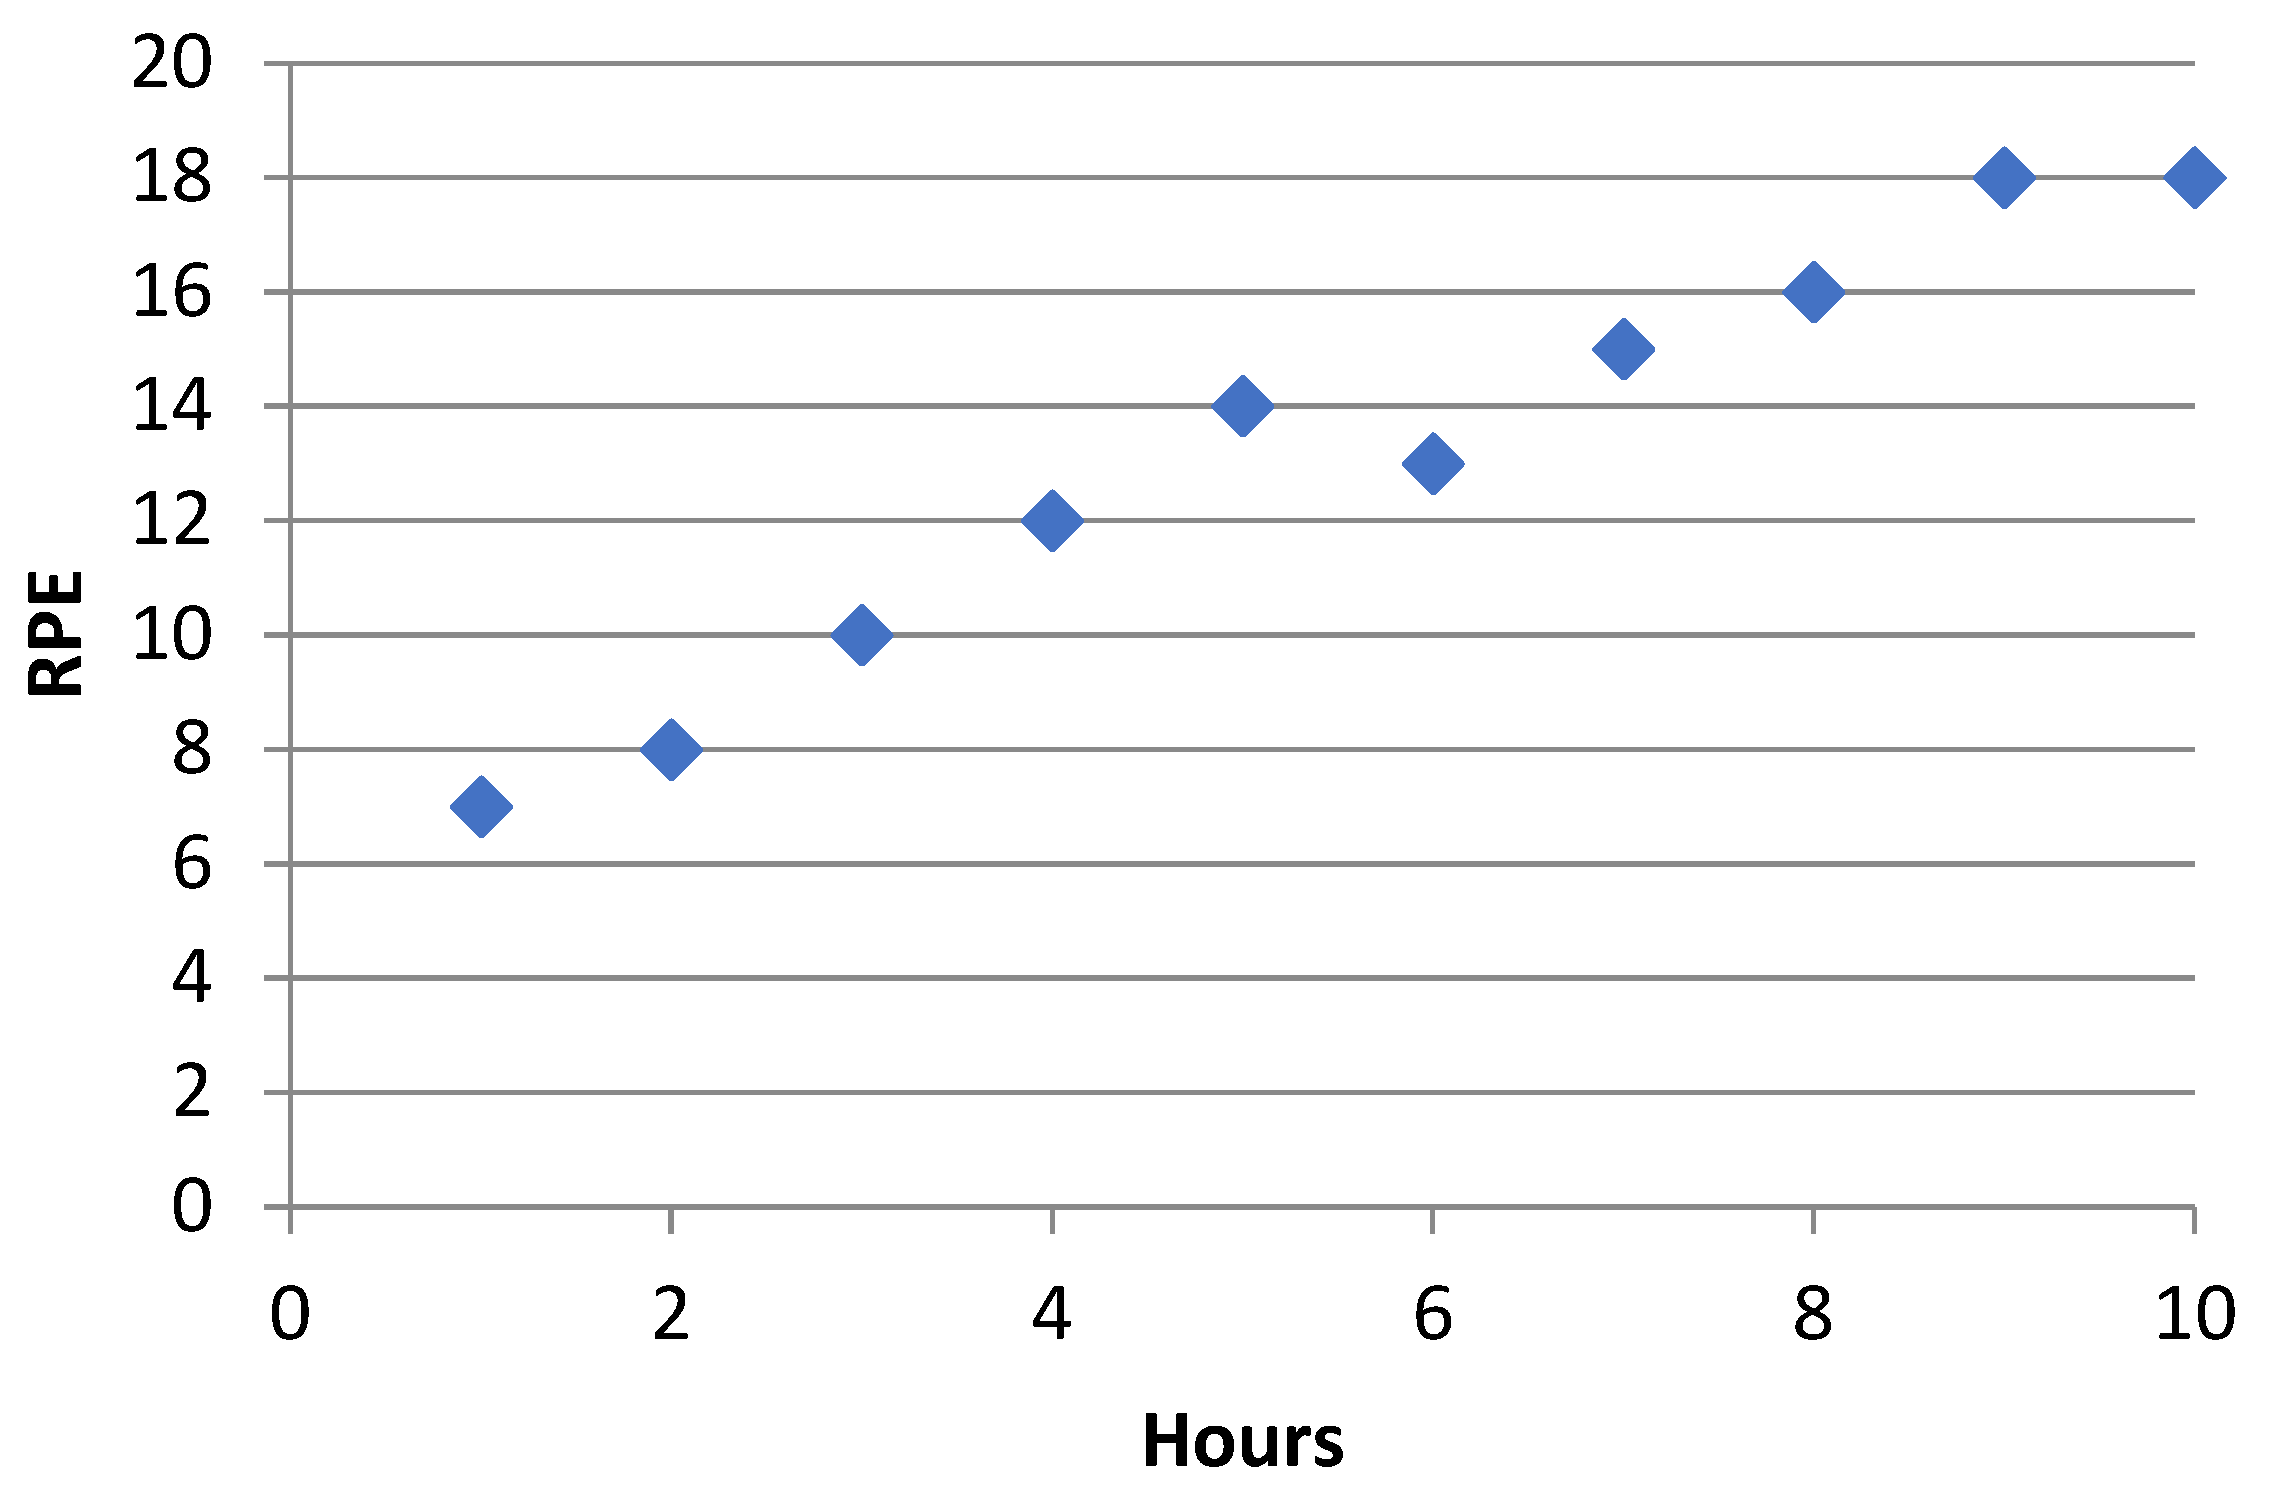
| RPE | Rating of Perceived Exertion |
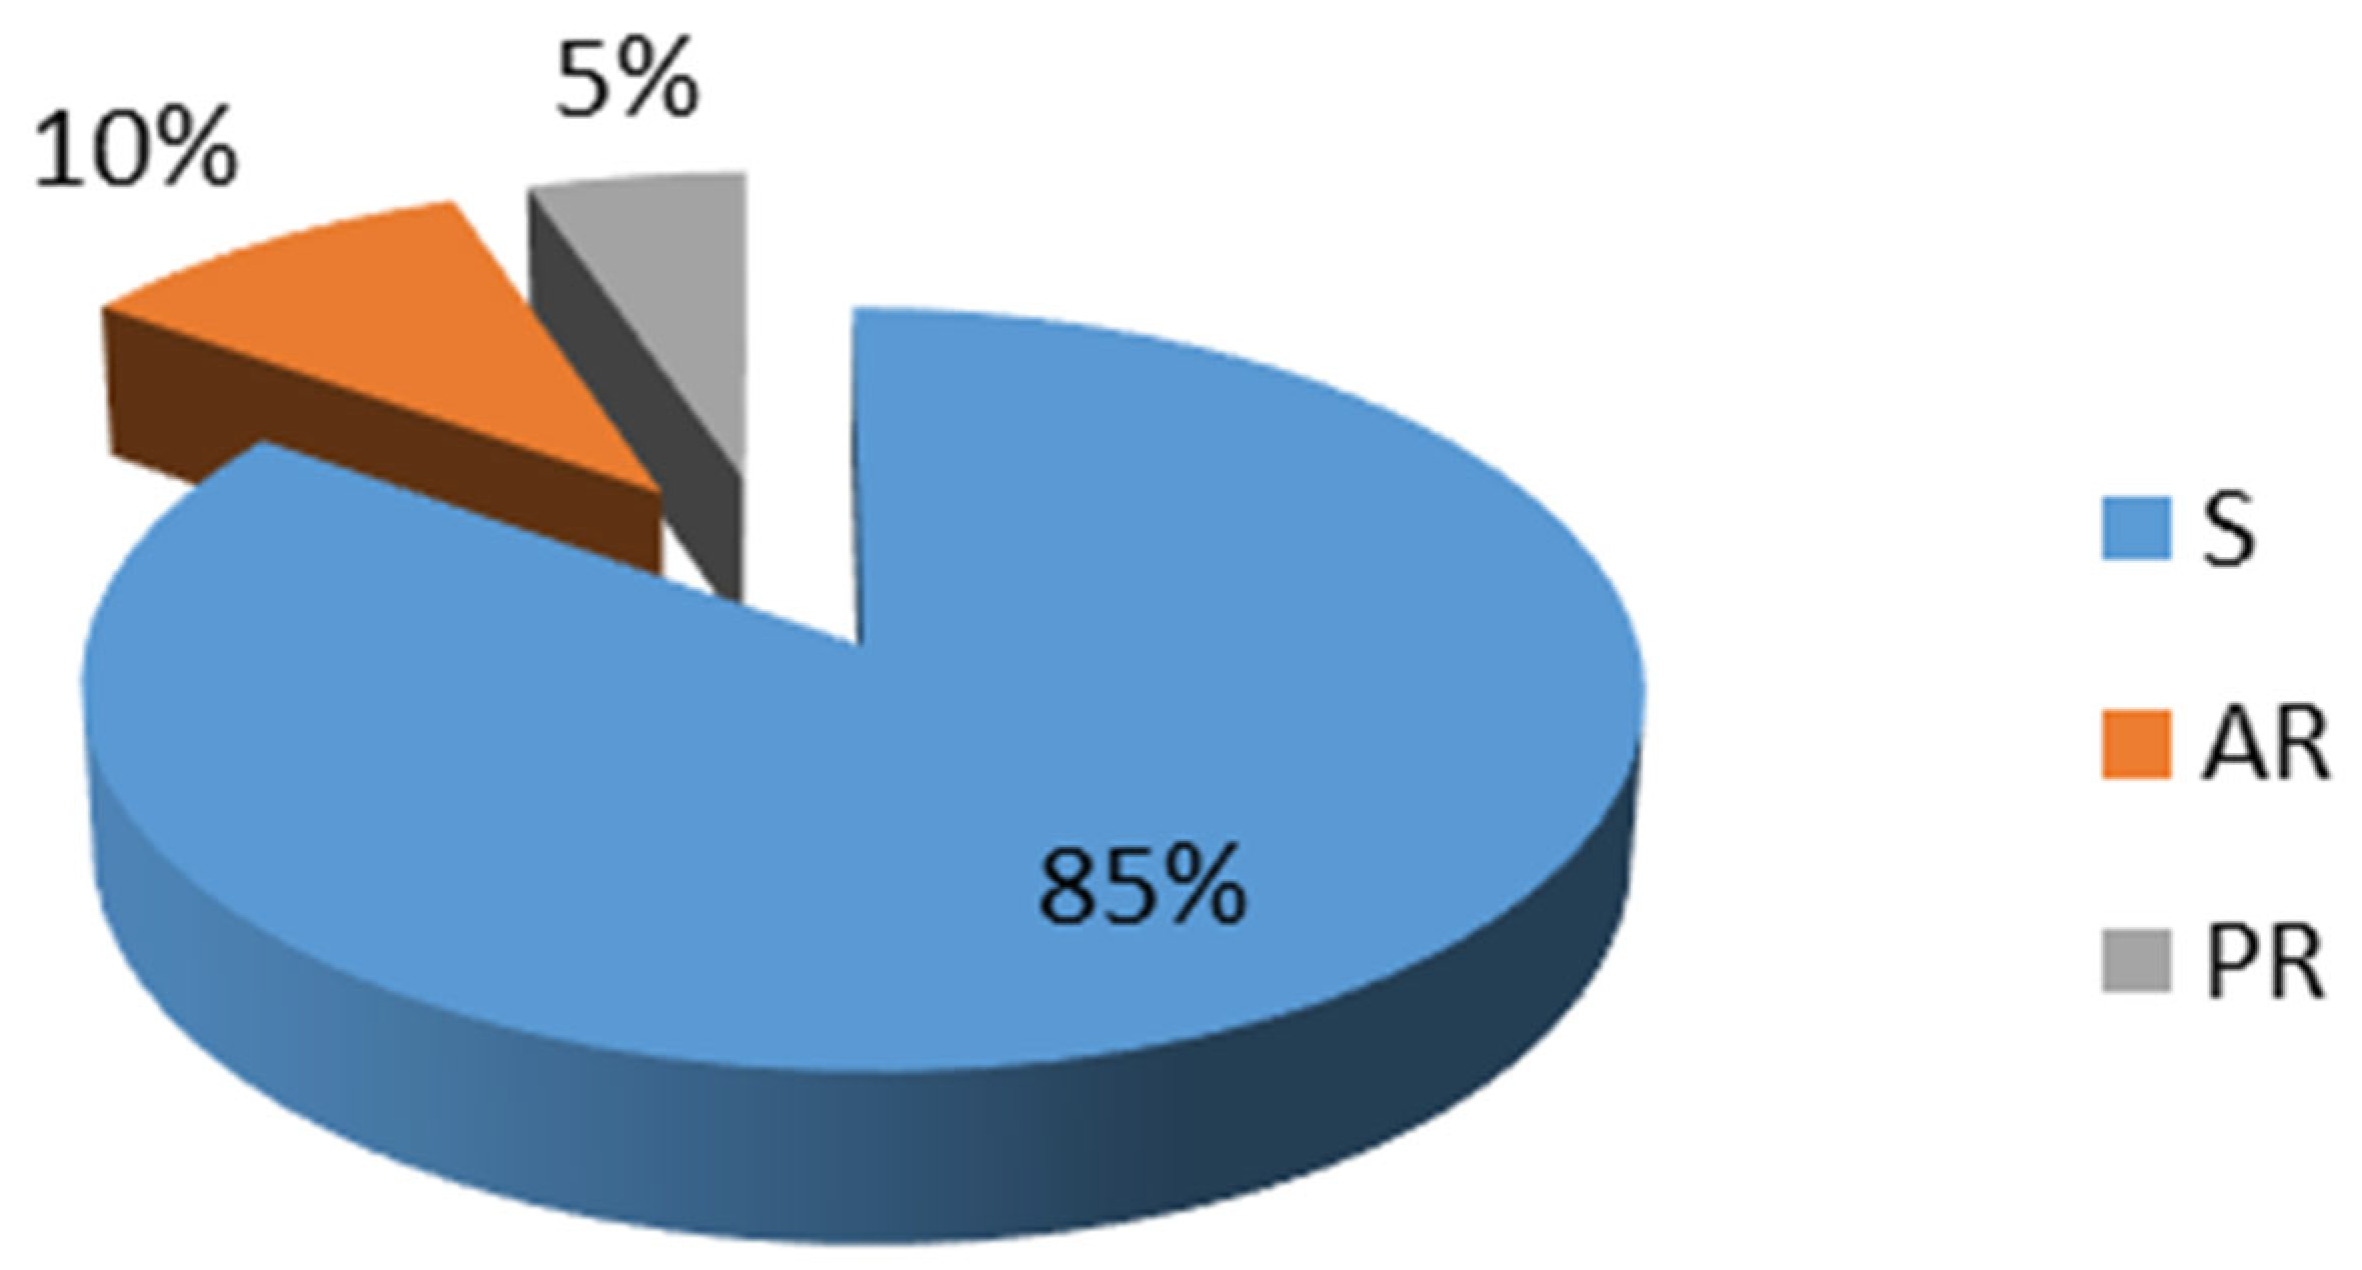
| AR | Active Recovery |
| PR | Passive Recovery |
| Pa | Arm Circumference |
| Pl | Thigh Circumference |
| Pm | Waist Circumference |
| Ph | Hip Circumference |
| Pc | Chest Circumference |
| ISAK | International Society for the Advancement of Kinanthropometry |
| Aoh | Arm Span |
| Apl | Foot Length |
| BD | Body Density |
| IBM SPSS | International Business Machines Statistical Package for the Social Sciences |
Appendix A

| Participant | Fat (%) | Distance (m) |
|---|---|---|
| 1 | 20.2 | 33.000 |
| 2 | 21.4 | 19.000 |
| 3 | 31.6 | 24.600 |
| 4 | 19.6 | 26.200 |
| 5 | 19.6 | 33.600 |
| 6 | 25.9 | 26.100 |
| 7 | 20.4 | 18.900 |
| 8 | 34.3 | 27.000 |
| 9 | 35.0 | 25.000 |
References
- Pelarigo, J.G.; Fernandes, R.J.; Ribeiro, J.; Denadai, B.S.; Greco, C.C.; Vilas-Boas, J.P. Comparison of Different Methods for the Swimming Aerobic Capacity Evaluation. J. Strength Cond. Res. 2018, 32, 3542–3551. [Google Scholar] [CrossRef] [PubMed]
- Groeneveld, W.; Krainz, M.; White, M.P.; Heske, A.; Elliott, L.R.; Bratman, G.N.; Fleming, L.E.; Grellier, J.; McDougall, C.W.; Nieuwenhuijsen, M.; et al. The psychological benefits of open-water (wild) swimming: Exploring a self-determination approach using a 19-country sample. J. Environ. Psychol. 2025, 102, 102558. [Google Scholar] [CrossRef]
- Knechtle, B.; Rüst, A.; Rosemann, T.; Knechtle, P.; Bescos, R. Estimation bias: Body mass and body height in endurance athletes. Percept. Mot. Ski. 2012, 115, 833–844. [Google Scholar] [CrossRef] [PubMed]
- Lepers, R.; Rüst, C.; Stapley, P.; Knechtle, B. Trends in triathlon performance: Effects of sex and age. Sports Med. 2013, 43, 851–863. [Google Scholar] [CrossRef]
- Dopsaj, M.; Zuoziene, I.J.; Milic, R.; Cherepov, E.; Erlikh, V.; Masiulis, N.; di Nini, A.; Vodicar, J. Body composition in international sprint swimmers: Are there any relations with performance? Int. J. Environ. Res. Public Health 2020, 17, 9469. [Google Scholar] [CrossRef]
- Zingg, M.; Rust, C.; Rosemann, T.; Lepers, R.; Knechtle, B. Analysis of sex differences in open-water ultra-distance swimming performances in the FINA World Cup races in 5 km, 10 km and 25 km from 2000 to 2012. Sports Sci. Med. Rehabil. 2014, 6, 7. [Google Scholar] [CrossRef]
- Papadimitriou, K.; Kabasakalis, A.; Papadopoulos, A.; Mavridis, G.; Tsalis, G. Comparison of ultra-short race pace and high-intensity interval training in age group competitive swimmers. Sports 2023, 11, 186. [Google Scholar] [CrossRef]
- Knechtle, B.; Rosemann, T.; Lepers, R.; Rüst, C. Women outperform men in ultradistance swimming: The Manhattan Island Marathon Swim from 1983 to 2013. Int. J. Sports Physiol. Perform. 2014, 9, 913–924. [Google Scholar] [CrossRef]
- Vogt, P.; Rüst, C.; Rosemann, T.; Lepers, R.; Knechtle, B. Analysis of 10 km swimming performance of elite male and female open-water swimmers. SpringerPlus 2013, 2, 603. [Google Scholar] [CrossRef]
- Senefeld, J.; Joyner, J.; Stevens, A.; Hunter, K. Sex differences in elite swimming with advanced age are less than marathon running. Scand. J. Med. Sci. Sports 2016, 26, 17–28. [Google Scholar] [CrossRef]
- Knechtle, B.; Rosemann, T.; Rüst, A. Women cross the ‘Catalina Channel’ faster than men. SpringerPlus 2015, 4, 332. [Google Scholar] [CrossRef] [PubMed]
- Senefeld, J.; Joyner, M.J.; Hunter, S.K. Sex differences in endurance exercise performance. Curr. Sports Med. Rep. 2021, 20, 243–249. [Google Scholar]
- Eichenberger, E.; Knechtle, B.; Rüst, C.; Knechtle, P.; Lepers, R.; Rosemann, T. No gender difference in peak performance in ultra-endurance swimming performance—Analysis of the ‘Zurich 12-h Swim’ from 1996 to 2010. Chin. J. Physiol. 2012, 55, 346–351. [Google Scholar] [PubMed]
- Eichenberger, E.; Knechtle, B.; Knechtle, P.; Rüst, C.; Rosemann, T.; Lepers, R.; Senn, O. Sex difference in open-water ultra-swim performance in the longest freshwater lake swim in Europe. J. Strength Cond. Res. 2013, 27, 1362–1369. [Google Scholar] [CrossRef]
- Rust, C.; Knechtle, B.; Rosemann, T.; Lepers, R. Analysis of performance and age of the fastest 100-mile ultra-marathoners worldwide. Clinics 2013, 68, 605–611. [Google Scholar] [CrossRef]
- Rüst, A.; Knechtle, B.; Rosemann, T.; Lepers, R. Women reduced the sex difference in open-water ultra-distance swimming La Traversée Internationale du Lac St-Jean, 1955–2012. Appl. Physiol. Nutr. Metab. 2013, 39, 270–273. [Google Scholar] [CrossRef]
- Knechtle, B.; Knechtle, P.; Kohler, G. No correlation of anthropometry and race performance in ultra-endurance swimmers at a 12-hours-swim. Anthr. Anz. 2008, 66, 73–79. [Google Scholar] [CrossRef]
- Lepers, R.; Rüst, C.A.; Stapley, P.J.; Knechtle, B. Age-related changes in performance in ultra-endurance sports. Extreme Physiol. Med. 2013, 2, 33. [Google Scholar]
- Knechtle, B.; Dalamitros, A.A.; Barbosa, T.M.; Sousa, C.V.; Rosemann, T.; Nikolaidis, P.T. Sex differences in swimming disciplines—Can women outperform men in swimming? Int. J. Environ. Res. Public Health 2020, 17, 3651. [Google Scholar] [CrossRef]
- Barbosa, T.M.; Fernandes, R.J.; Keskinen, K.L.; Vilas-Boas, J.P. The influence of stroke mechanics into energy cost of elite swimmers. Eur. J. Appl. Physiol. 2008, 103, 139–149. [Google Scholar] [CrossRef]
- Psycharakis, S.G.; Sanders, R.H. Body roll in swimming: A review. J. Sports Sci. 2010, 28, 229–236. [Google Scholar] [CrossRef] [PubMed]
- Durnin, J.V.; Rahaman, M.M. The assessment of the amount of fat in the human body from measurements of skinfold thickness. Br. J. Nutr. 1967, 21, 681–689. [Google Scholar] [CrossRef] [PubMed]
- Knechtle, B.; Baumann, B.; Knechtle, P.; Rosemann, T. Speed during training and anthropometric measures in relation to race performance by male and female open-water ultra-endurance swimmers. Percept. Mot. Ski. 2010, 111, 463–474. [Google Scholar] [CrossRef] [PubMed]
- Borg, G.A. Psychophysical bases of perceived exertion. Med. Sci. Sports Exerc. 1982, 14, 377–381. [Google Scholar] [CrossRef]
- Faul, F.; Erdfelder, E.; Lang, A.-G.; Buchner, A. G*Power 3: A Flexible Statistical Power Analysis Program for the Social, Behavioral, and Biomedical Sciences. Behav. Res. Methods 2007, 39, 175–191. [Google Scholar] [CrossRef]
- Gourgoulis, V. Swimming: Analysis and Teaching Technique, 2nd ed.; Salto Publications: Thessaloniki, Greece, 2019. [Google Scholar]
- Papadimitriou, K.; Zafeiriadis, S.; Papadimitriou, N.; Tsalis, G. Case report: Impact of dolphin kick implementation during backstroke finishes on swimming performance. From regional to Olympic-level swimmers. A comparative case study. Front. Sports Act. Living 2025, 7, 1531427. [Google Scholar] [CrossRef]
- Sakkas, G.K.; Chatzinikolaou, P.N.; Zafeiridis, A.S.; Tsimeas, P.D.; Kambas, A.; Mougios, V. Nutrition strategies before and during ultra-endurance event: A significant gap between science and practice. Scand. J. Med. Sci. Sports 2017, 27, 1350–1359. [Google Scholar]
- Brobakken, M.F.; Krogsaeter, I.; Helgerud, J.; Wang, E.; Hoff, J. Abdominal aerobic endurance exercise reveals spot reduction exists: A randomized controlled trial. Physiol. Rep. 2023, 11, e15853. [Google Scholar] [CrossRef]
- Speedy, D.B.; Thompson, J.M.; Rodgers, I.; Collins, M.; Sharwood, K. Oral salt supplementation during ultradistance exercise. Clin. J. Sport Med. 2002, 12, 279–284. [Google Scholar] [CrossRef]
- Weitkunat, T.; Knechtle, B.; Knechtle, P.; Rüst, C.; Rosemann, T. Body composition and hydration status changes in male and female open-water swimmers during an ultra-endurance event. J. Sports Sci. 2012, 30, 1003–1013. [Google Scholar] [CrossRef]
- Alley, J.T.; Mohiuddin, S.S. Biochemistry, Fatty Acid Oxidation. In StatPearls; StatPearls Publishing: Treasure Island, FL, USA, 2025. Available online: https://www.ncbi.nlm.nih.gov/books/NBK556002/ (accessed on 23 June 2025).
- Romero, S.A.; Minson, C.T.; Halliwill, J.R. The cardiovascular system after exercise. Compr. Physiol. 2017, 7, 321–332. [Google Scholar] [CrossRef]
| Liquids | Food | Supplements | Drugs |
|---|---|---|---|
| Refreshment drinks Coffee Isotonics Water Electrolytes | Banana Chocolate Tahini Sandwich Chicken Biscuits Croissant Pasta Bread | Powerbar Carbons Fruit gels | Anti-inflammatory pills Caffeine Caffeine gel Salt stick |
| Parameters | Meters (m) | BF% (%) | LBM (kg) | BMI (kg/m2) | HR (bpm) | p-Value |
|---|---|---|---|---|---|---|
| Before | ---------------- | 24.2 ± 6.8 | 61.8 ± 11.8 | 27 ± 3 | 71 ± 9 | |
| After | 25,993 ± 4832 | 25 ± 5.9 | 62 ± 12.4 | 27 ± 3 | 117 ± 18 | 0.06 |
| Parameters | Arm (cm) | Thigh (cm) | Waist (cm) | Hip (cm) | Chest (cm) | p-Value |
|---|---|---|---|---|---|---|
| Before | 31.9 ± 2 | 54.3 ± 4.2 | 89.0 ± 7.8 | 103.0 ± 7.3 | 104.7 ± 7.5 | |
| After | 32.4 ± 2 | 54.3 ± 4.7 | 89.0 ± 7.9 | 101.7 ± 7.5 | 104.7 ± 7.3 | 0.06 |
Disclaimer/Publisher’s Note: The statements, opinions and data contained in all publications are solely those of the individual author(s) and contributor(s) and not of MDPI and/or the editor(s). MDPI and/or the editor(s) disclaim responsibility for any injury to people or property resulting from any ideas, methods, instructions or products referred to in the content. |
© 2025 by the authors. Licensee MDPI, Basel, Switzerland. This article is an open access article distributed under the terms and conditions of the Creative Commons Attribution (CC BY) license (https://creativecommons.org/licenses/by/4.0/).
Share and Cite
Zompanakis, I.; Papadimitriou, K.; Koutlianos, N. Potential Associations Between Anthropometric Characteristics, Biomarkers, and Sports Performance in Regional Ultra-Marathon Swimmers: A Quasi-Experimental Study. Appl. Sci. 2025, 15, 7210. https://doi.org/10.3390/app15137210
Zompanakis I, Papadimitriou K, Koutlianos N. Potential Associations Between Anthropometric Characteristics, Biomarkers, and Sports Performance in Regional Ultra-Marathon Swimmers: A Quasi-Experimental Study. Applied Sciences. 2025; 15(13):7210. https://doi.org/10.3390/app15137210
Chicago/Turabian StyleZompanakis, Iasonas, Konstantinos Papadimitriou, and Nikolaos Koutlianos. 2025. "Potential Associations Between Anthropometric Characteristics, Biomarkers, and Sports Performance in Regional Ultra-Marathon Swimmers: A Quasi-Experimental Study" Applied Sciences 15, no. 13: 7210. https://doi.org/10.3390/app15137210
APA StyleZompanakis, I., Papadimitriou, K., & Koutlianos, N. (2025). Potential Associations Between Anthropometric Characteristics, Biomarkers, and Sports Performance in Regional Ultra-Marathon Swimmers: A Quasi-Experimental Study. Applied Sciences, 15(13), 7210. https://doi.org/10.3390/app15137210