Systematic Review

Road Crash Analysis and Modeling: A Systematic Review of Methods, Data, and Emerging Technologies

Department of Electrical Engineering and Computer Science, Florida Atlantic University, 777 Glades Rd, Boca Raton, FL 33431, USA
*
Author to whom correspondence should be addressed.
Appl. Sci. 2025, 15(13), 7115; https://doi.org/10.3390/app15137115
Submission received: 20 May 2025 / Revised: 18 June 2025 / Accepted: 18 June 2025 / Published: 24 June 2025

Abstract

Traffic crashes are a leading cause of death and injury worldwide, with far-reaching societal and economic consequences. To effectively address this global health crisis, researchers and practitioners rely on the analysis of crash data to identify risk factors, evaluate countermeasures, and inform road safety policies. This systematic review synthesizes the state of the art in road crash data analysis methodologies, focusing on the application of statistical and machine learning techniques to extract insights from crash databases. We systematically searched for peer-reviewed studies on quantitative crash data analysis methods and synthesized findings by using narrative synthesis due to methodological diversity. Our review included studies spanning traditional statistical approaches, Bayesian methods, and machine learning techniques, as well as emerging AI applications. We review traditional and emerging crash data sources, discuss the evolution of analysis methodologies, and highlight key methodological issues specific to crash data, such as unobserved heterogeneity, endogeneity, and spatial–temporal correlations. Key findings demonstrate the superiority of random-parameter models over fixed-parameter approaches in handling unobserved heterogeneity, the effectiveness of Bayesian hierarchical models for spatial–temporal analysis, and promising results from machine learning approaches for real-time crash prediction. This survey also explores emerging research frontiers, including the use of big data analytics, deep learning, and real-time crash prediction, and their potential to revolutionize road safety management. Limitations include methodological heterogeneity across studies and geographic bias toward high-income countries. By providing a taxonomy of crash data analysis methodologies and discussing their strengths, limitations, and practical implications, this paper serves as a comprehensive reference for researchers and practitioners seeking to leverage crash data to advance road safety.

1. Introduction

Road crashes represent a persistent global health crisis, causing over 1.3 million fatalities and up to 50 million injuries annually [1]. Beyond the immeasurable human suffering, these crashes impose substantial economic costs through medical expenses, lost productivity, and property damage. By 2030, road traffic crashes are projected to become the fifth leading cause of death globally, underscoring the urgent need for evidence-based approaches to road safety improvement.
The staggering impact of road crashes on society has spurred extensive efforts to improve road safety through driver behavior monitoring [2], vulnerable occupant detection [3], vehicle design improvements [4], road infrastructure enhancements [5], traffic laws and their enforcement [6,7], public awareness campaigns [8,9], and technological advancements [10,11]. While these measures can potentially reduce crash frequency and severity, the persistently high toll of road crashes remains unacceptable and necessitates continued research and innovation in road safety.

1.1. The Critical Role of Data-Driven Safety Analysis

The majority of the analysis in this field is based on crash data collected by transportation agencies, law enforcement, hospitals, and insurers. The statistical modeling of these data has long provided the empirical foundation for identifying risk factors, evaluating countermeasures, and developing data-driven safety policies that have demonstrably saved lives. However, the field faces three fundamental challenges that limit the effectiveness of current approaches.
First, data quality issues significantly compromise analysis reliability. From systematic underreporting to spatial inaccuracies, these problems create substantial analytical challenges that require targeted methodological solutions.
Second, methodological fragmentation persists between traditional statistical approaches and emerging machine learning techniques, with limited integration of these complementary analytical frameworks.
Third, a research–practice gap continues to separate sophisticated analytical methods from practical implementation in safety management and policy development [12].

1.2. Research Contributions and Framework

This systematic review addresses these challenges by focusing on five specific areas that span the complete spectrum from foundational data issues to cutting-edge technological applications:
  • A comprehensive data quality taxonomy that categorizes quality issues into collection-stage and analysis-stage challenges, providing a structured framework for understanding and addressing data limitations (Section 3).
  • A methodological evolution framework that traces the historical development from descriptive crash analysis to sophisticated system-based approaches, demonstrating how traditional statistical methods and emerging AI techniques can be integrated (Section 4).
  • Domain-specific intervention synthesis that demonstrates how advanced methodological approaches address real-world safety challenges across infrastructure design, vulnerable road users, and targeted countermeasures (Section 5).
  • Evidence-based implementation guidelines that bridge the research–practice gap by translating methodological advances into actionable recommendations for safety management and policy development (Section 6).
  • A future-oriented technology roadmap that examines emerging research frontiers in big data analytics, deep learning, real-time prediction systems, and connected/autonomous vehicle safety, identifying pathways for next-generation crash analysis capabilities (Section 7).
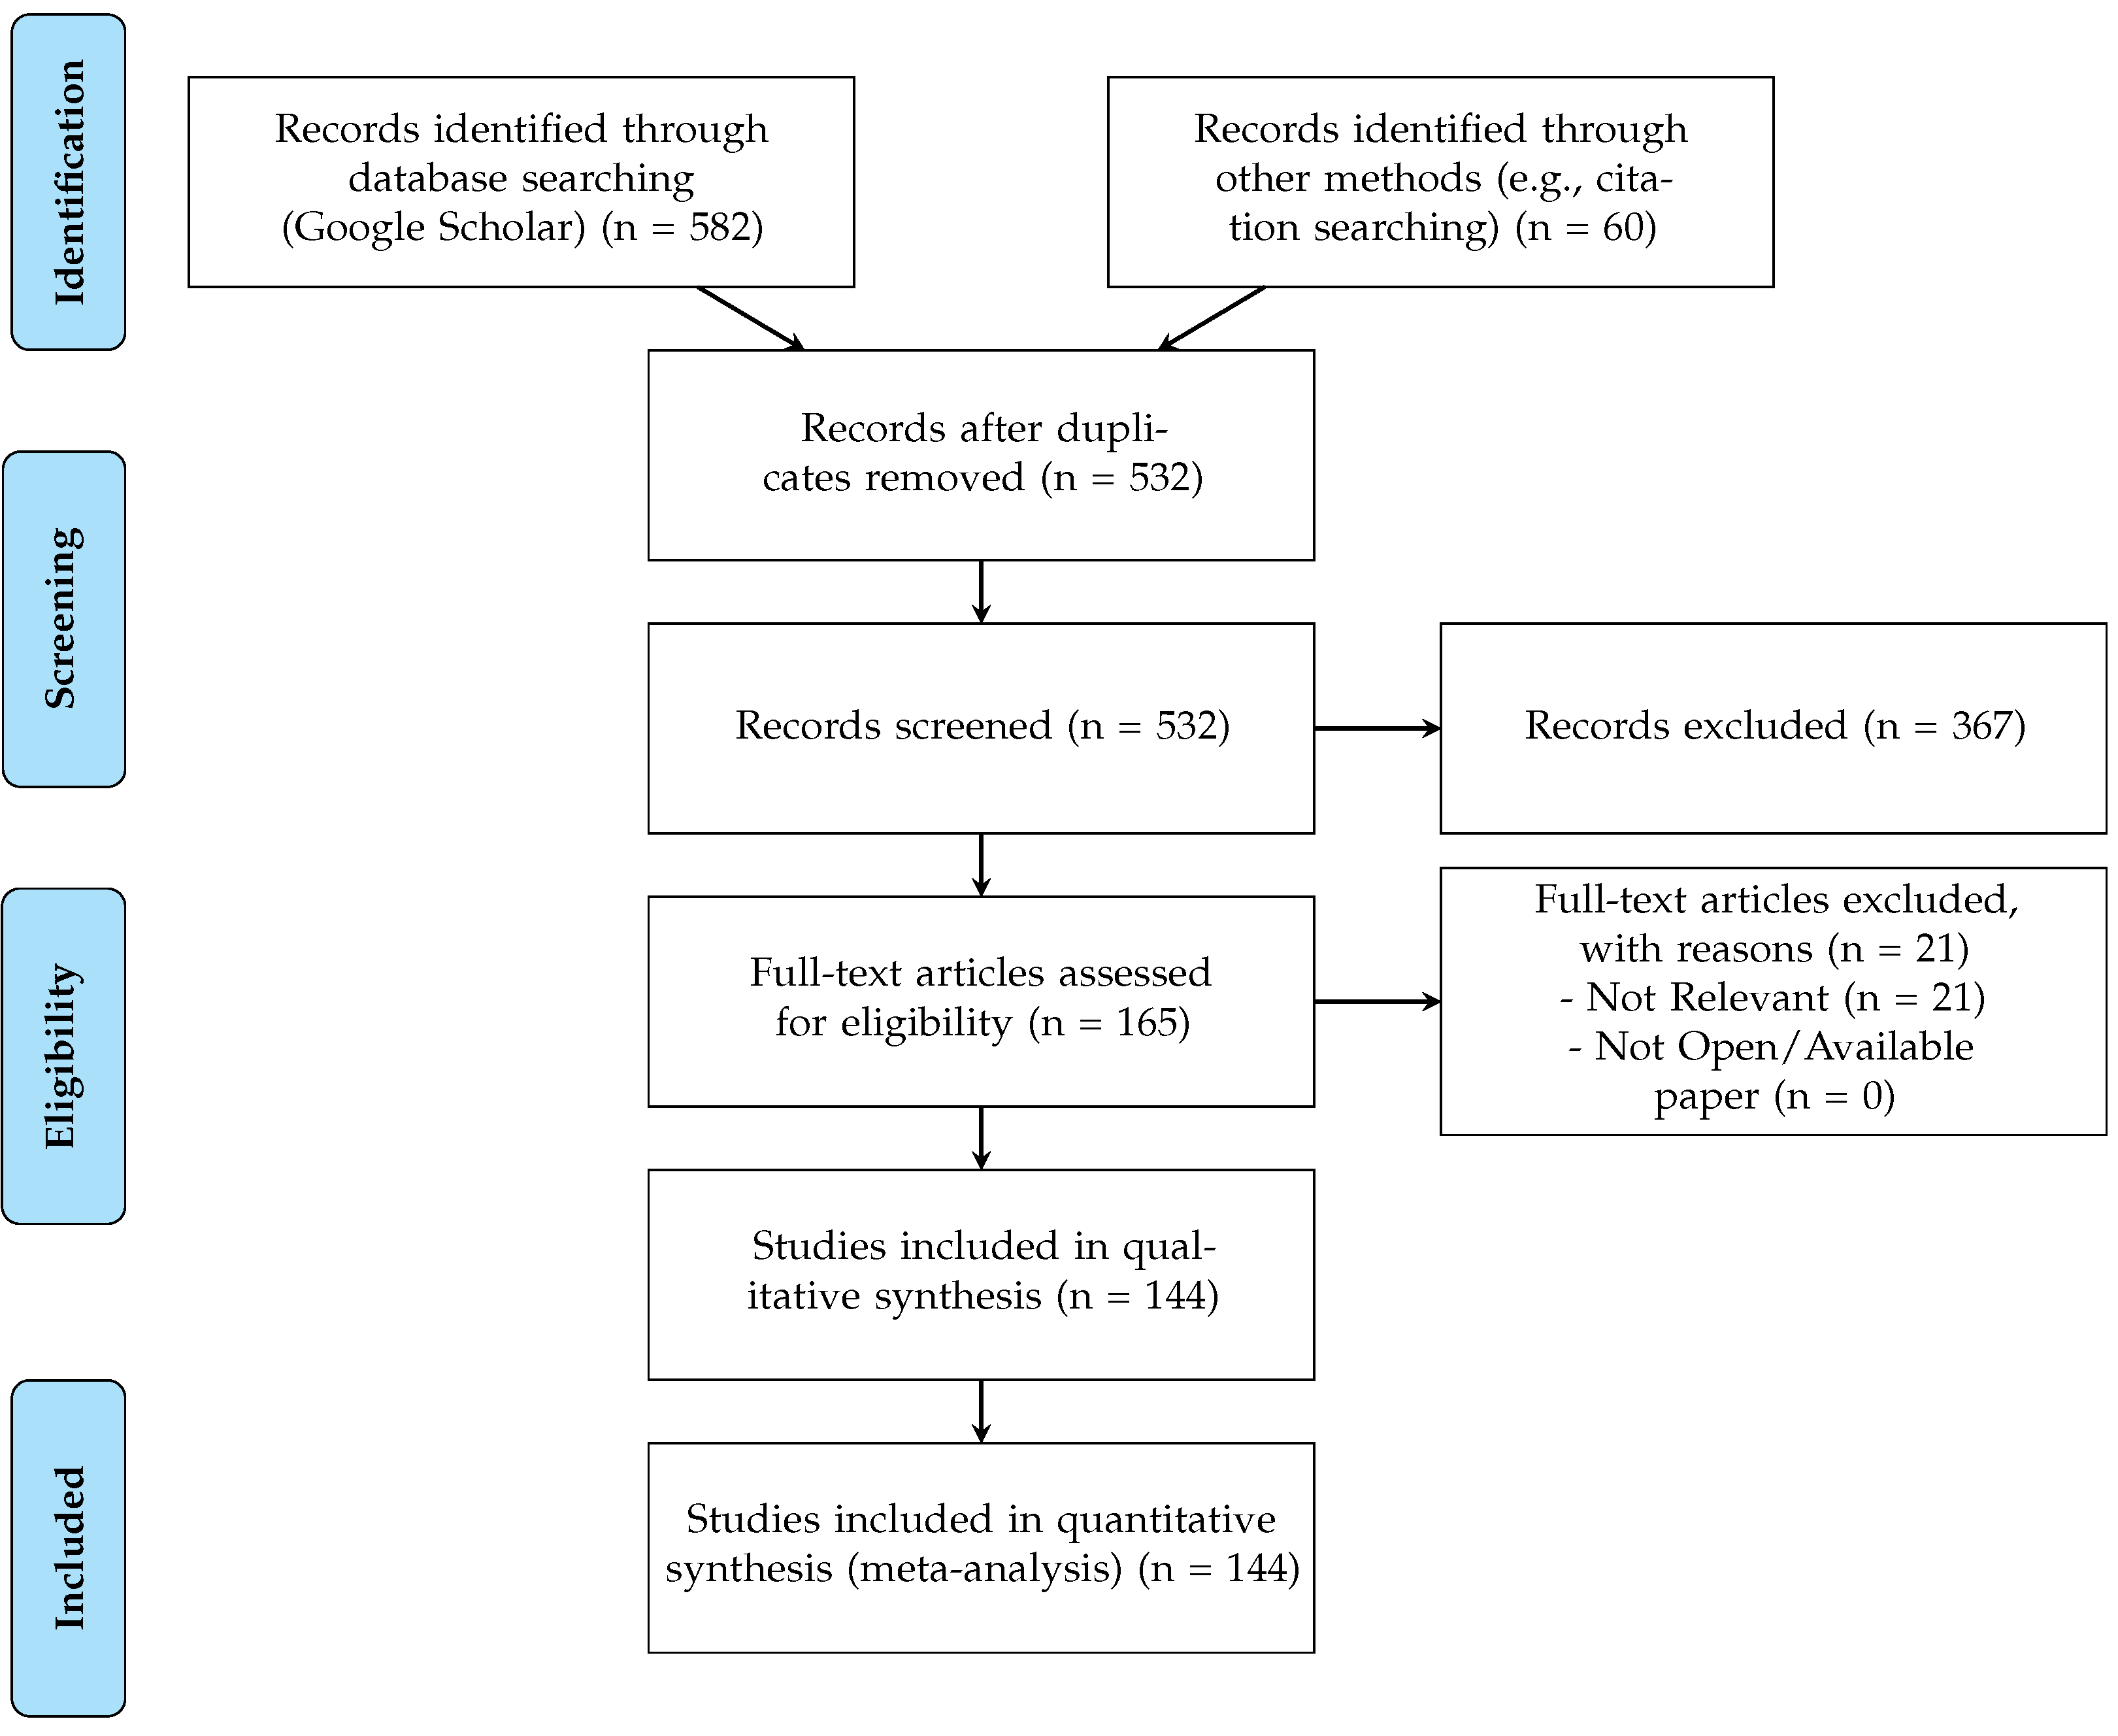
These contributions are unified by a central organizing principle: methodological sophistication must be balanced with practical applicability to achieve meaningful improvements in road safety outcomes. The framework progresses systematically from foundational data and methodological concerns through specific applications and policy implications, culminating in emerging technologies that will define the future of crash analysis.
This systematic approach serves two purposes: providing researchers and practitioners with a comprehensive methodological reference while identifying pathways for advancing sophisticated analytical approaches that enhance our ability to analyze crash data at scale and translate findings into effective safety interventions.

2. Methods

This systematic review was reported in accordance with the Preferred Reporting Items for Systematic Reviews and Meta-Analyses (PRISMA) 2020 statement [13]. The review was not prospectively registered due to its methodological focus and retrospective nature. The PRISMA checklist is provided in Appendix A.

2.1. Eligibility Criteria

This systematic review included studies presenting original research on road crash data analysis methodologies using statistical or machine learning techniques. Studies were required to analyze real-world crash data from transportation agencies, law enforcement, hospitals, or insurance records. Both traditional statistical modeling and emerging methodologies including deep learning and real-time prediction systems were included.
Studies were excluded if they were purely descriptive without methodological contributions, focused solely on vehicle engineering without crash data analysis, or analyzed only simulated data without real-world validation. Studies were grouped by methodological approach, data source type, analytical focus, and geographic scope.

2.2. Information Sources and Search Strategy

The primary search was conducted using Google Scholar to ensure broad interdisciplinary coverage across transportation engineering, statistics, computer science, and medical research. The search strategy integrated terms related to crash analysis methodologies, data sources, and analytical approaches, with attention to emerging technologies in connected and autonomous vehicle safety.
Additional records were identified through the citation searching of the included studies and relevant review articles. Search terms captured both traditional econometric approaches and advanced machine learning applications in crash analysis.

2.3. Selection Process and Data Collection

The search yielded 582 records through the Google Scholar database searching and 60 through citation searching and other sources (total: 642 records). After duplicate removal, 532 unique records underwent title and abstract screening. Of these, 367 were excluded, leaving 165 for full-text assessment. An additional 21 articles were excluded as not relevant, resulting in 144 studies for final synthesis.
The complete selection process is shown in Figure 1. Data extraction focused on methodological characteristics, analytical approaches, data sources, performance metrics, and validation procedures.

2.4. Data Items and Study Characteristics

Data extraction captured the methodological approaches (statistical models, machine learning techniques, and spatial–temporal analysis), the data source characteristics (police reports, hospital records, telematics data, and naturalistic driving studies), the performance metrics, the validation procedures, and the geographic/temporal scope. Particular attention was given to model specifications, comparative evaluations, and the handling of common challenges in crash data analysis.

2.5. Risk of Bias Assessment

Quality assessment focused on methodological rigor appropriate for observational crash analysis research. Key domains included data source adequacy, analytical methodology appropriateness, model specification completeness, validation procedures, and reporting transparency.

2.6. Synthesis Methods

Both qualitative and quantitative syntheses were conducted with all 143 included studies. The synthesis was structured by data sources, methodological approaches, specialized applications, and emerging research areas. Systematic tabulation and comparative assessment identified methodological patterns, trends, and relative advantages across different analytical strategies.
The synthesis emphasized methodological advancements, persistent challenges, and future research directions, particularly the evolution from traditional statistical approaches to sophisticated methodologies handling contemporary crash data complexity, including real-time prediction and connected vehicle applications.

2.7. Assessment of Evidence Quality

Evidence quality assessment was adapted for methodological research in crash analysis. Assessment considered study design quality, methodological rigor, validation procedures, and replication across different contexts, accommodating both traditional statistical and emerging machine learning approaches.

3. Data Sources and Quality

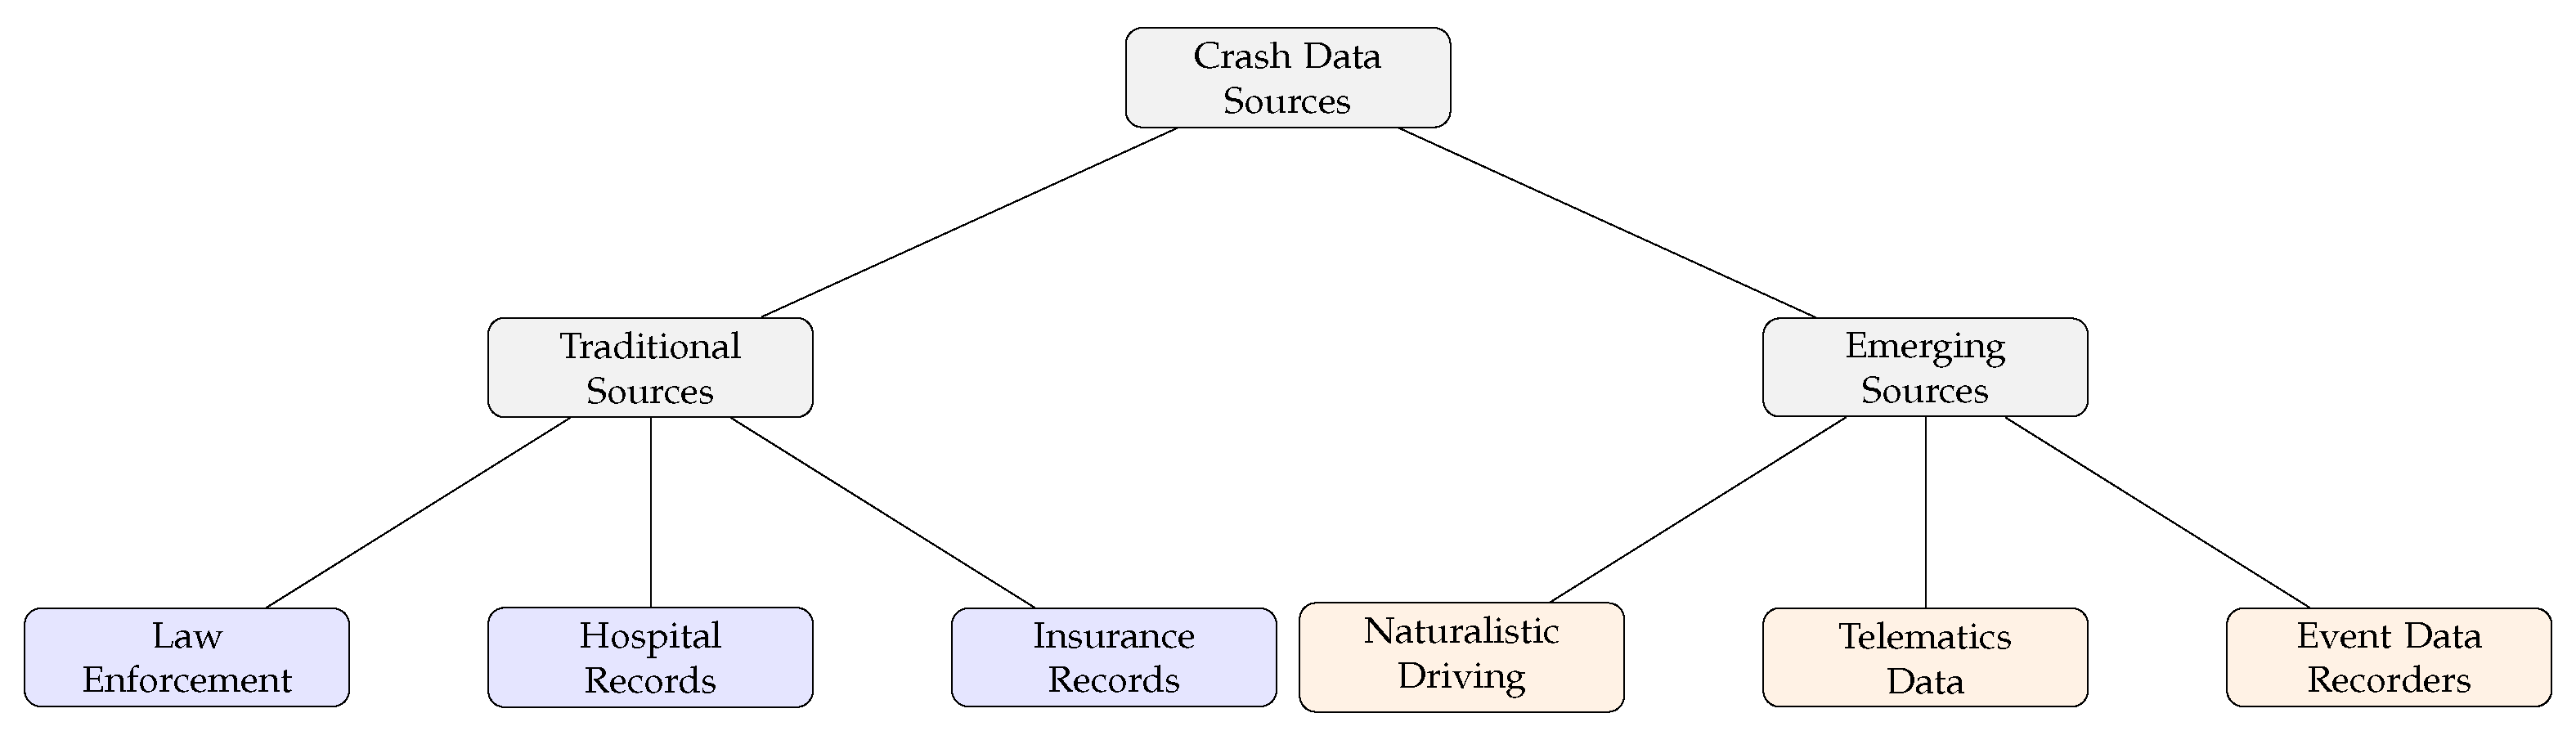
3.1. Common Sources of Data

The most common source of data for crash analysis are reports filed by Law Enforcement Officers at the scene of a crash. Several researchers have also used hospital records of traffic injuries, and in some countries, this is standard practice, e.g., the Netherlands and Sweden. Insurance records are another, less commonly used source of crash data [14].
Naturalistic driving data, i.e., real-world driving data collected without experimental controls or driver awareness, are also available for limited time periods in a small number of locations. Video of highways [15,16] and intersections [17] are examples of studies based on naturalistic data. A key challenge with naturalistic data is that they are expensive to collect and therefore not available for comprehensive analysis across geographies and time.
Another emerging source is telematics—data collected automatically by vehicles or electronic devices installed in vehicles. This type of data is often collected at the initiative of insurance companies in return for insurance premium discounts and provides real-time information about driving behavior and vehicle performance. One provider of telematics data has looked into whether drivers change their behavior to take advantage of discounts [18], but further research should be performed to determine the usefulness of such data at scale.
A significant development in the collection of crash data is the mandate that all new cars sold in the European Union (EU) after 7 July 2024 must be equipped with an Event Data Recorder (EDR), an onboard device that records information about a vehicle’s operation before, during, and after a crash. At the time this paper was written, research on EDR data was limited, but preliminary results [19] show promise. Figure 2 provides an overview of data sources used in crash research.

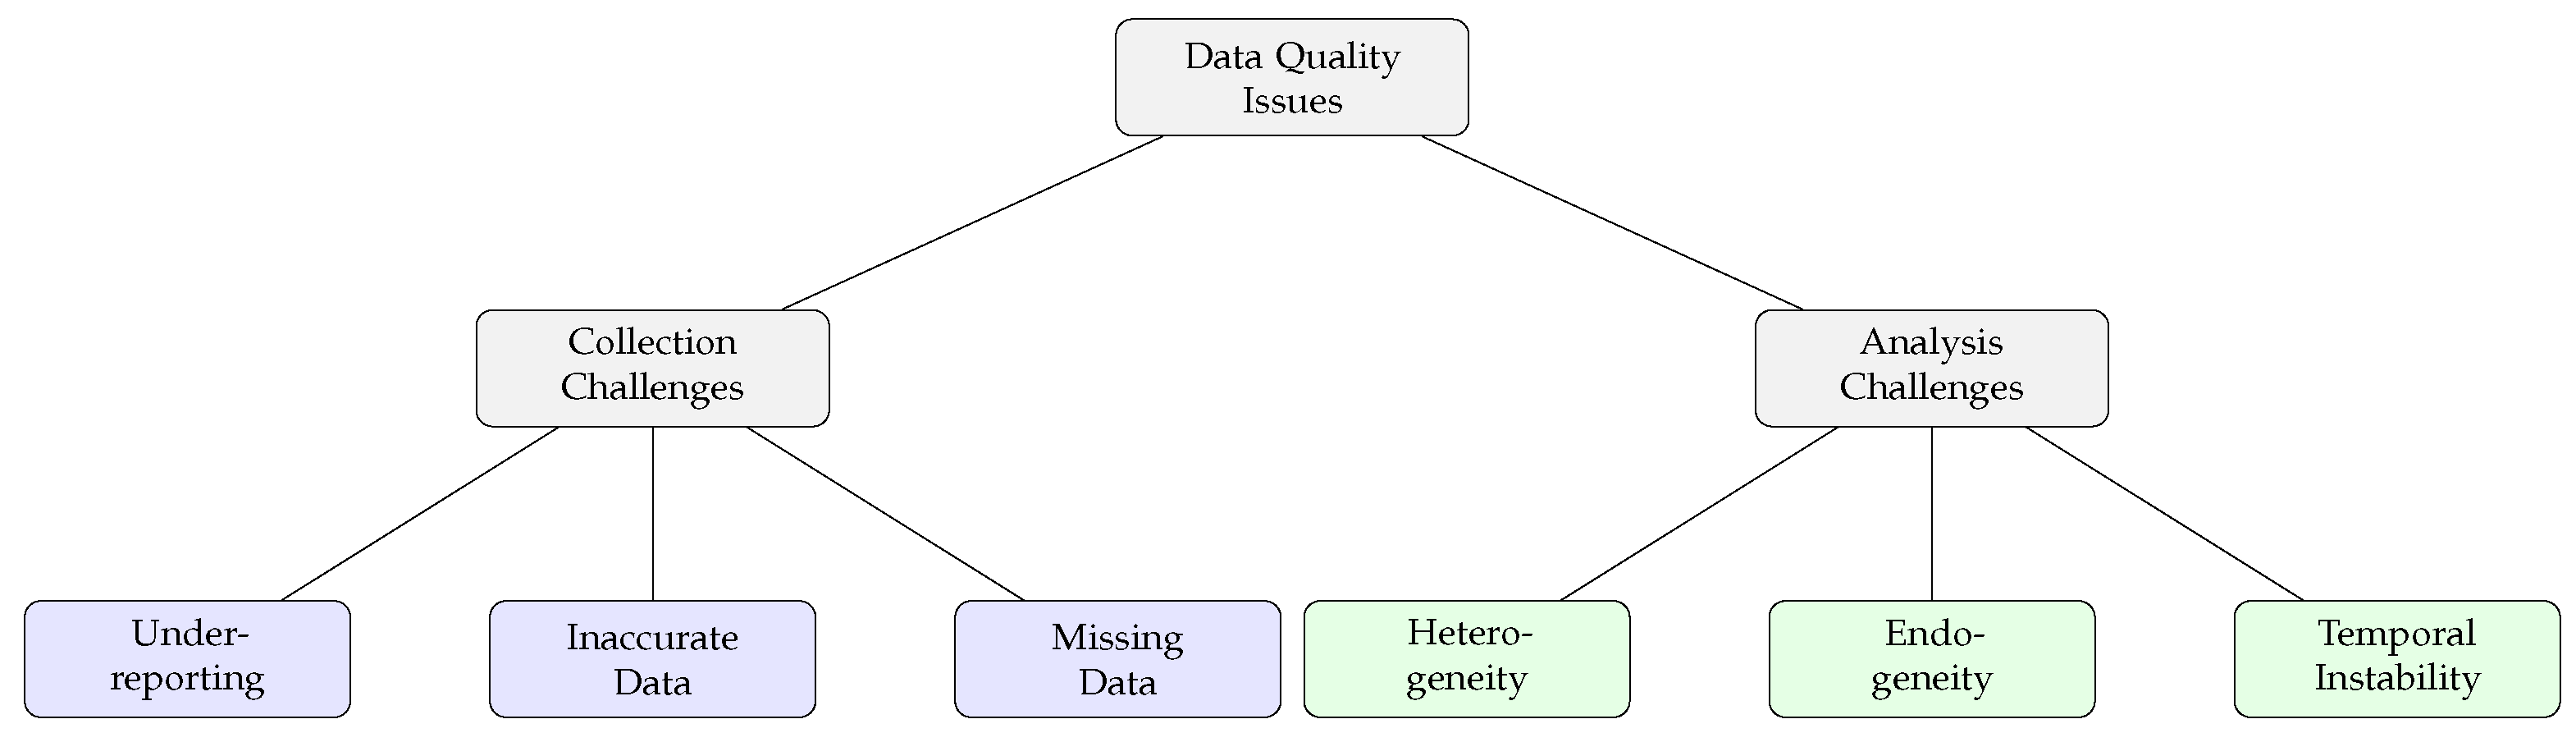
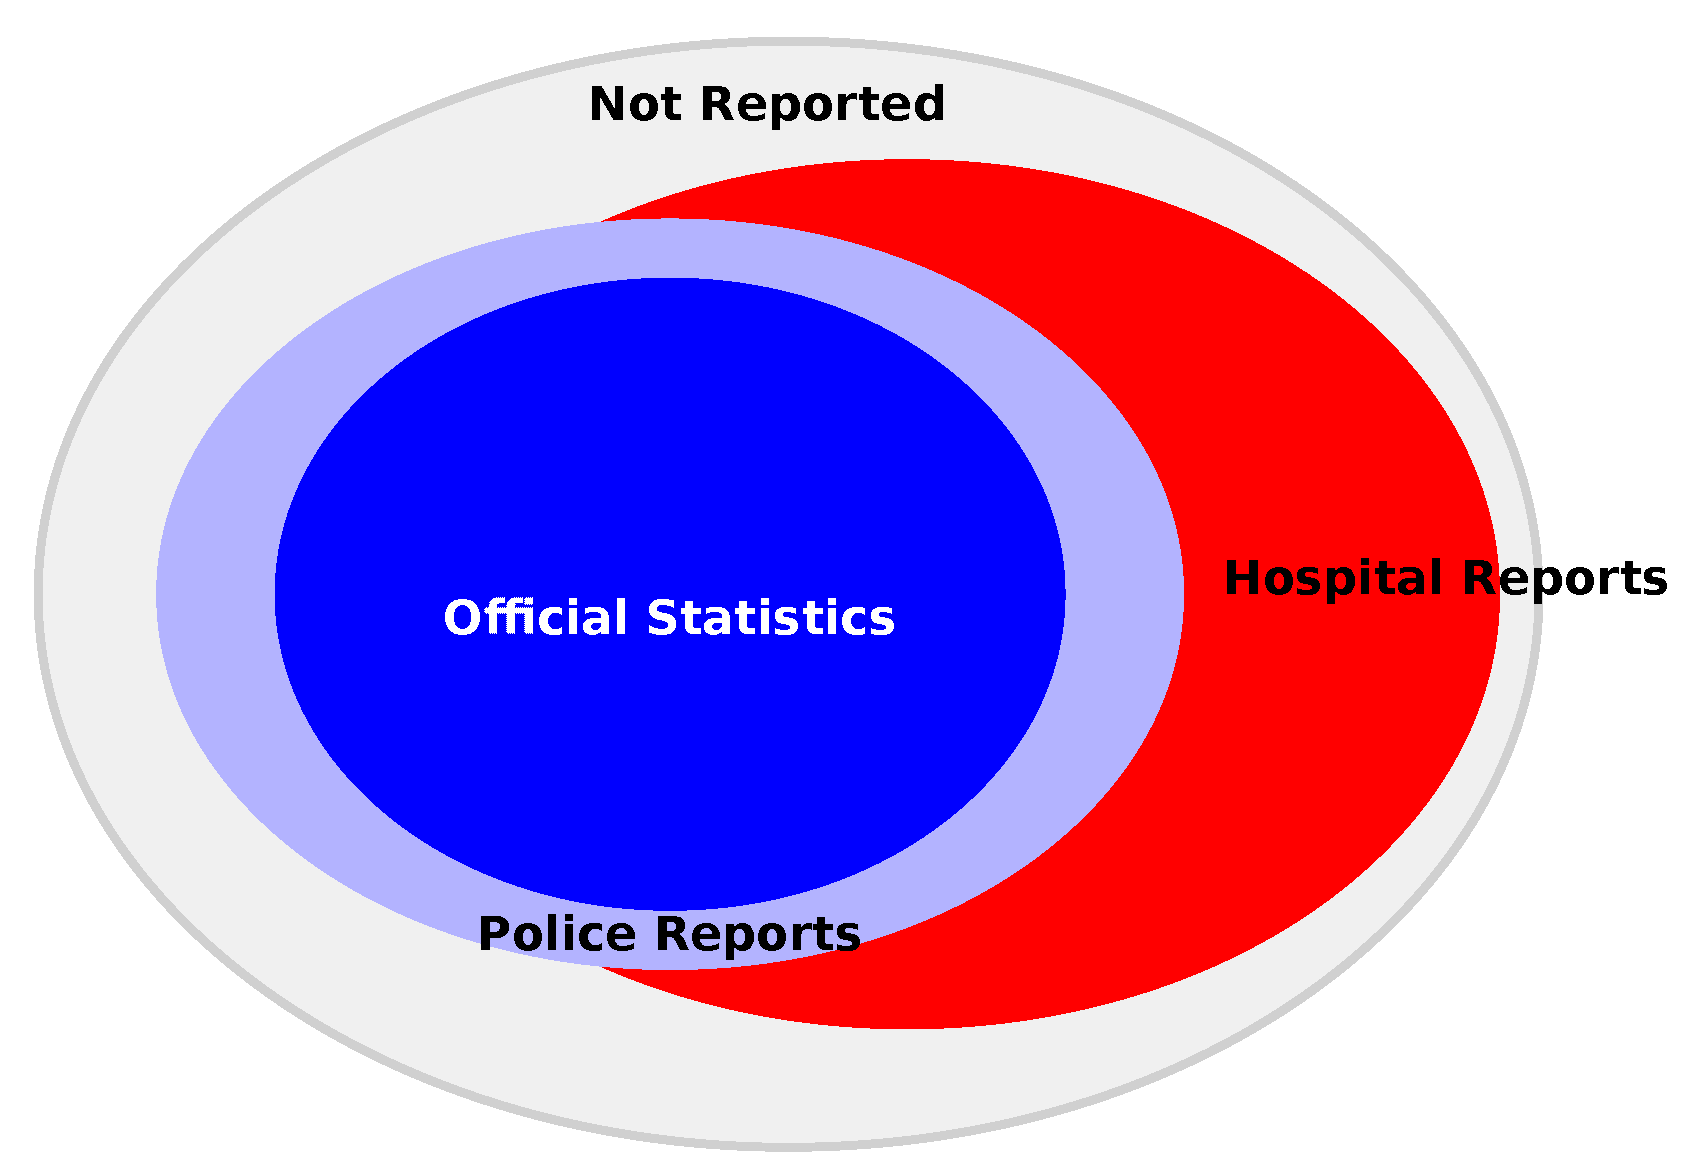
3.2. Data Quality Challenges in Crash Analysis

Crash data quality issues present significant challenges for road safety research and policy development. These challenges can significantly impact the reliability of crash analysis and the effectiveness of resulting safety interventions. Through extensive review of the literature and practice, we identify six fundamental categories of data quality issues that affect crash analysis, summarized in Figure 3. Each of these challenges requires specific methodological approaches to address, and failure to account for them can lead to biased results and ineffective safety recommendations.

3.3. Data Completeness and Accuracy

The most fundamental challenge in crash analysis is underreporting, where a significant number of crashes are not captured in official databases. Sweden’s Transport Agency (Transportstyrelsen) has studied this phenomenon extensively and provided a diagram, as seen in Figure 4, showing the varying coverage of different crash data sources. The extent of underreporting varies by crash type and jurisdiction, with Watson et al. [20] finding that motorcyclists, cyclists, and young people are particularly under-represented in official reports.
Beyond missing cases entirely, the accuracy of reported data presents another significant challenge. Location data prove especially problematic, with Miler et al. [21] finding inaccurate locations in approximately one-third of their studied crash reports. Such inaccuracies can severely impact spatial analysis and the identification of high-risk areas.

3.4. Statistical Challenges in Crash Analysis

The analysis of crash data is further complicated by three interrelated statistical challenges: heterogeneity, endogeneity, and temporal instability. Heterogeneity manifests as variations among units of analysis that available data features fail to capture, while endogeneity occurs when explanatory variables correlate with model error terms, often due to omitted variables or simultaneity.
The relationship between speed enforcement and crash rates illustrates both concepts. Speed enforcement measures, typically implemented in areas with historically high crash rates, create complex cause-and-effect relationships. The varying effectiveness of enforcement across different road segments demonstrates heterogeneity, while the potential reverse causality—where high crash rates might trigger enforcement implementation— exemplifies endogeneity.
Temporal instability adds another layer of complexity, as relationships between variables can shift across different time scales, from daily patterns to seasonal variations and long-term trends. These statistical challenges necessitate sophisticated methodological approaches, which we will explore in subsequent sections along with practical strategies for improving data quality at the source.

3.5. Strategies for Addressing Data Quality Issues

Approaches to addressing data quality issues in crash data can be broadly categorized into two types: (1) strategies to improve data quality at the collection stage, addressing the root causes of data problems, and (2) methodological approaches to identify and correct for data quality issues during analysis. Both approaches are necessary and complementary in improving the reliability of crash analysis.

3.5.1. Improving Data Quality at Collection

A fundamental approach to addressing data quality issues is to improve the initial data collection process. Two key strategies have emerged in this area: the implementation of automated data collection systems and the integration of multiple data sources.
The advent of new technologies offers promising solutions for reducing data quality issues at their source. Event Data Recorders (EDRs) in the European Union [19] represent a significant advance in automated crash data collection, providing accurate information about crash circumstances without relying on human reporting. Similarly, Imprialou and Quddus [22] advocate for intelligent crash reporting systems to address the frequent misreporting of crucial attributes such as crash location, time, and severity.
Likewise, the systematic integration of data from multiple sources has proven effective in creating more complete crash records. Sweden’s STRADA system exemplifies this approach, as illustrated in Figure 4, by systematically combining various data sources to improve reporting completeness [23].
Several studies demonstrate the value of this approach:
  • Short and Caulfield [14] showed how combining insurance claim data with police and hospital records in Ireland provided a more comprehensive picture of crash incidents.
  • Lombardi et al. [24] improved crash injury identification by linking hospital discharge data with state-level crash reports.
  • Janstrup et al. [25] demonstrated the benefits of connecting police and medical records for understanding individual crash characteristics.
  • Burdett et al. [26] revealed significant discrepancies between law enforcement and medical assessments of injury severity, finding overestimation in 45% to 90% of cases.

3.5.2. Statistical Methods for Addressing Existing Data Issues

When working with historical data or in contexts where improved data collection is not yet feasible, statistical methods can help identify and correct for data quality issues during analysis.
Several methodological advances help address inherent data challenges. Li et al. [27] demonstrated that binary logit models can effectively handle heterogeneous effects of road design features and traffic conditions, while their grouped random-parameter logit models specifically address unobserved heterogeneity among crash units. This work builds on Mannering et al.’s [28] comprehensive framework for dealing with unobserved heterogeneity in crash analysis.
For temporal stability issues, Shabab et al. [29] developed a “mixed spline indicator pooled model” that captures parameter changes over time while incorporating unobserved heterogeneity across severity levels and time periods. Their approach achieved 55–78% prediction accuracy for 2021 using Florida crash data from 2011–2019.
Furthermore, targeted statistical methods can address specific types of data bias. Chang and Mannering [30] developed a nested logit model to correct occupancy overestimation bias, while Yasmin et al. [31] advanced methods for handling endogeneity in transportation safety studies. These approaches demonstrate how statistical techniques can compensate for known data quality issues when analyzing existing datasets.
While both collection-stage improvements and analytical methods are valuable, Imprialou and Quddus [22] note that the full impact of data quality problems on road safety analyses remains incompletely understood. This suggests that the continued development of both approaches—improving data collection and advancing statistical methods—will be necessary for comprehensive improvement in crash data quality.

4. Methodological Approaches in Crash Research

Over the past century, road safety research has progressed through distinct paradigms, moving from simple descriptions of crash statistics and accident-prone individuals to increasingly complex, system-based approaches. Early studies offered descriptive accounts and basic mathematical models to understand traffic incidents. Later, research began focusing on single causes of accidents, leading to solutions centered on engineering, education, and enforcement. The introduction of the Haddon Matrix in the 1970s [32] introduced more complex interactions of factors into the analysis, while recent years have emphasized comprehensive, system-level approaches, incorporating behavioral theories like risk homeostasis.
Few studies capture the historical trajectory of road safety research but Hagenzieker et al. [33] applied bibliometric techniques to identify past research trends and explore potential future developments in the field. Figure 5 shows a timeline based on their research.
Building on these developments in crash research, Table 1 synthesizes current methodological approaches, from traditional statistical methods to emerging techniques for connected and autonomous vehicles. The table highlights key characteristics and limitations of each approach, demonstrating the field’s increasing methodological sophistication.

4.1. Traditional Statistical Foundations

The evolution of crash analysis methodologies began with fundamental statistical approaches that established the empirical foundation for road safety research. Mannering and Bhat [12] provide context for the evolution of statistical methods in highway-accident research, highlighting persistent challenges like unobserved heterogeneity and endogeneity. Lord and Mannering [53] further elaborate on these methodological challenges, particularly in crash-frequency analysis, addressing issues such as data overdispersion, underreporting, and omitted-variable bias.
The foundation of crash analysis often begins with basic statistical approaches. Al-Ghamdi [54] demonstrates the application of logistic regression methodology in analyzing accident severity, identifying location and cause as significant variables. Building on these fundamentals, Jones and Jørgensen [44] show how multilevel modeling frameworks can better account for residual variation across accidents and geographical locations, revealing significant intra-unit correlation in accident outcomes. Cafiso et al. [34] calibrated comprehensive accident models using extensive road characteristics data, demonstrating the application of Generalized Linear Modeling approaches with variables such as exposure, AADT, driveway density, curvature ratio, and roadside hazard rating.
A significant advancement came with the development of random-parameter models to address unobserved heterogeneity. Anastasopoulos and Mannering [45] explored random-parameter count models for analyzing vehicle accident frequencies, demonstrating methodological approaches for accounting for heterogeneity across various factors. Yasmin et al. [31] presented an econometric framework using instrumental variables to estimate causal effects while controlling for endogeneity. Saeed et al. [55] compared uncorrelated and correlated random-parameter count models, providing methodological guidance for model selection in multilane highway analysis. Anastasopoulos and Mannering [45] further explored these models using Indiana data, revealing significant impacts of pavement condition and geometric features. Anastasopoulos et al. [56] utilized random-parameter tobit regression for urban interstate accident analysis, identifying eleven significant factors affecting accident rates. Aziz et al. [57] applied random-parameter logit models to explain pedestrian injury severity levels in New York City.
Advanced regression techniques addressed specific analytical challenges in crash data. Anastasopoulos et al. [58] applied Tobit regression methodological frameworks to analyze vehicle accident rates, offering novel approaches to understanding crash data by treating accident rates as continuous variables. Castro et al. [59] proposed flexible econometric structures for highway segment analysis. Chen and Jovanis [60] developed variable-selection procedures for crash injury severity analysis. Fundamental issues in statistical modeling were addressed by Bijleveld [61], who addressed statistical issues in the simultaneous analysis of accident-related outcomes, particularly regarding variance–covariance structure estimation. Bhat [62] advanced the field computationally with the Maximum Approximate Composite Marginal Likelihood (MACML) estimation method. Bhat et al. [63] introduced methodological formulations for count data models with endogenous covariates, applying multinomial discrete-count modeling approaches to address self-selection and simultaneity bias.

4.2. Advanced Bayesian and Spatial Methods

The field progressed toward more sophisticated approaches that could better handle the complex spatial and temporal dependencies inherent in crash data. Aguero-Valverde and Jovanis [35] employed Full Bayes (FB) hierarchical modeling frameworks, incorporating spatial and temporal effects for county-level crash analysis. In subsequent methodological work [36], they demonstrated the importance of spatial correlation structures in road crash-frequency models, showing that first-order adjacency structures improve model fit and reduce bias in parameter estimates. Their Bayesian multivariate Poisson lognormal modeling approach [37] shows methodological improvements in precision estimation across severity levels, though requiring extensive data for effective calibration.
Wang et al. [43] advanced the field with bivariate negative-binomial spatial conditional autoregressive models for joint analysis of crashes and violations, enabling the identification of high-risk areas while accounting for spatial relationships. Xu and Huang [42] investigated spatial heterogeneity using random-parameter negative binomial and semi-parametric geographically weighted Poisson regression methodological frameworks, demonstrating that geographically weighted approaches better capture spatial heterogeneity and crash data correlation for regional crash modeling.
Chiou and Fu [38] proposed integrated modeling approaches under the Multinomial Generalized Poisson architecture for the simultaneous analysis of crash frequency and severity. Chiou et al. [39] extended this methodological framework with spatial Multinomial Generalized Poisson models, demonstrating superior performance of spatial modeling approaches, particularly the spatial exogenous-EMGP model for capturing spatial dependencies in crash data. Bonneson and Pratt [40] developed accident modification factors using cross-sectional data, particularly effective for large roadway systems, with their work on curve radius AMFs showing higher crash risks on curves.

4.3. Machine Learning and Data Mining Approaches

As computational capabilities expanded, the field embraced machine learning and artificial intelligence techniques. Iranitalab and Khattak [41] compared statistical and machine learning methodological approaches for crash severity prediction, evaluating various classification algorithms, including Nearest-Neighbor Classification, finding that NNC had the best predictive performance, while K-means clustering improved model performance. Abdelwahab and Abdel-Aty [64] explored neural network methodological frameworks for predicting driver injury severity, demonstrating early applications of artificial intelligence techniques to traffic safety analysis.
Chiou et al. [65] developed genetic mining rule methodological frameworks utilizing stepwise rule-mining algorithms for crash severity analysis, integrating data mining techniques with traditional statistical modeling and demonstrating the effectiveness of a two-stage mining framework in capturing the joint effects of risk factors. Mahmud et al. [46] developed count data modeling approaches using traffic conflict techniques as surrogate safety measures, providing alternative methods for assessing road safety when crash data are limited. Zhang et al. [47] presented methodological frameworks for identifying crash risk through the coupling of in-vehicle data with kinetic parameters, advancing the integration of real-time vehicle dynamics in safety assessment.
Wu et al. [66] employed gradient boosting decision trees (GBDTs) to address key challenges in crash analysis, particularly the multicollinearity inherent in real-world traffic data. Their approach demonstrates strong predictive accuracy across four crash indicators while ranking 27 influential factors—revealing crucial insights into variable importance that traditional “black-box” machine learning methods obscure. This methodological contribution advances the field by combining robust statistical performance with interpretability, enabling researchers to identify and understand complex relationships within crash datasets.

4.4. Real-Time Prediction and Emerging Technologies

Several recent methodological developments focus on real-time analysis capabilities and applications in emerging vehicle technologies. Li et al. [67] developed hybrid Long Short–Term Memory-Convolutional Neural Network (LSTM-CNN) methodological frameworks for real-time crash risk prediction, combining temporal sequence modeling with spatial feature extraction capabilities and demonstrating the benefits of parallel structures for capturing both long-term dependencies and local features. Zheng et al. [52] presented real-time risk assessment methodological approaches for connected autonomous vehicles, utilizing HMM-based prediction methods and time-varying risk maps for continuous safety monitoring.
Castro et al. [50] incorporated temporal and spatial dependencies in modeling frameworks for urban intersection analysis, developing latent variable representations of count data models to accommodate for spatial and temporal dependence. Ahmed et al. [51] developed methodological frameworks using Bayesian hierarchical models for analyzing crash frequencies with temporal and spatial dependencies on mountainous freeways. Adjenughwure et al. [68] proposed a Monte Carlo-based microsimulation approach to estimating collision probability in real traffic conflicts, with a methodology that can simulate conflicts involving an arbitrary number of vehicles under various initial conditions, using automated detection methods and accounting for variability in driver behavior parameters.
Specialized applications across these methodological frameworks demonstrate their practical utility. Abdel-Aty and Keller [48] investigated factors influencing crash severity at signalized intersections by using ordered probit models. Abay [49] explored pedestrian injury severity by using various disaggregate modeling approaches. Abay et al. [69] presented multivariate probit modeling frameworks for the simultaneous analysis of injury severity and seat belt use. Geographic-specific applications include work by Altwaijri et al. [70], who examined factors affecting crash severity in Riyadh; Abbas [71], who assessed rural road safety conditions in Egypt; and Jahan et al. [72], who proposed enhanced frameworks to model crash frequency while accommodating zero-crash zones. Infrastructure and environmental factors have been examined by Papadimitriou et al. [73], Wu et al. [74], Moslem et al. [75], and Farooq et al. [76] by using various methodological approaches.

5. Targeted Safety Interventions

Traffic crashes arise from a complex interplay of infrastructure, road user, technological, and environmental factors. Figure 6, Figure 7, Figure 8 and Figure 9 provide a structured overview of these domains and the specific topics reviewed in the following subsections.

5.1. Intersection and Segment-Level Crash Analysis

Retting et al. [77] investigated the characteristics and countermeasures for motor vehicle crashes at stop signs, focusing on four U.S. cities. The study found that stop sign violations—particularly “rolling” stops—accounted for roughly 70% of crashes, with younger and older drivers being disproportionately involved.
Boroujerdian et al. [78] proposed a dynamic wavelet-based model to locate and measure high-crash road segments. Their approach improves identification performance by 25–38% when the analyst seeks the worst 10–20% of roadway length, underscoring the value of precise segment delineation for multi-scale safety analysis.
Amoros et al. [79] compared traffic safety across French counties with Generalized Linear Models, revealing that differences in safety vary jointly with county and road type. Accounting for sub-county socio-economic factors and road-type mix substantially improves explanatory power.
Bonneson and McCoy [80] developed a negative-binomial crash-frequency model for 125 two-way stop-controlled intersections. With a product-of-flows formulation and gamma-distributed mean, the model captures a nonlinear rise in crashes with traffic demand, illustrating how such distributions pinpoint hazardous sites.
These studies demonstrate the complexity of intersection and segment safety analysis, with consistent evidence of nonlinear relationships between traffic volume and crash risk. Research reveals significant methodological diversity, from wavelet-based approaches achieving 25–38% performance improvements to negative-binomial models capturing traffic flow interactions. A critical finding across studies is the importance of spatial and demographic context: both Amoros et al.’s [79] county-level analysis and Retting et al.’s age-specific patterns highlight that location and user characteristics substantially influence crash patterns. The dominance of stop sign violations (70% of crashes) in Retting et al.’s findings, combined with Bonneson and McCoy’s traffic demand relationships, suggests that intersection control design must account for both human behavioral patterns and traffic flow characteristics.

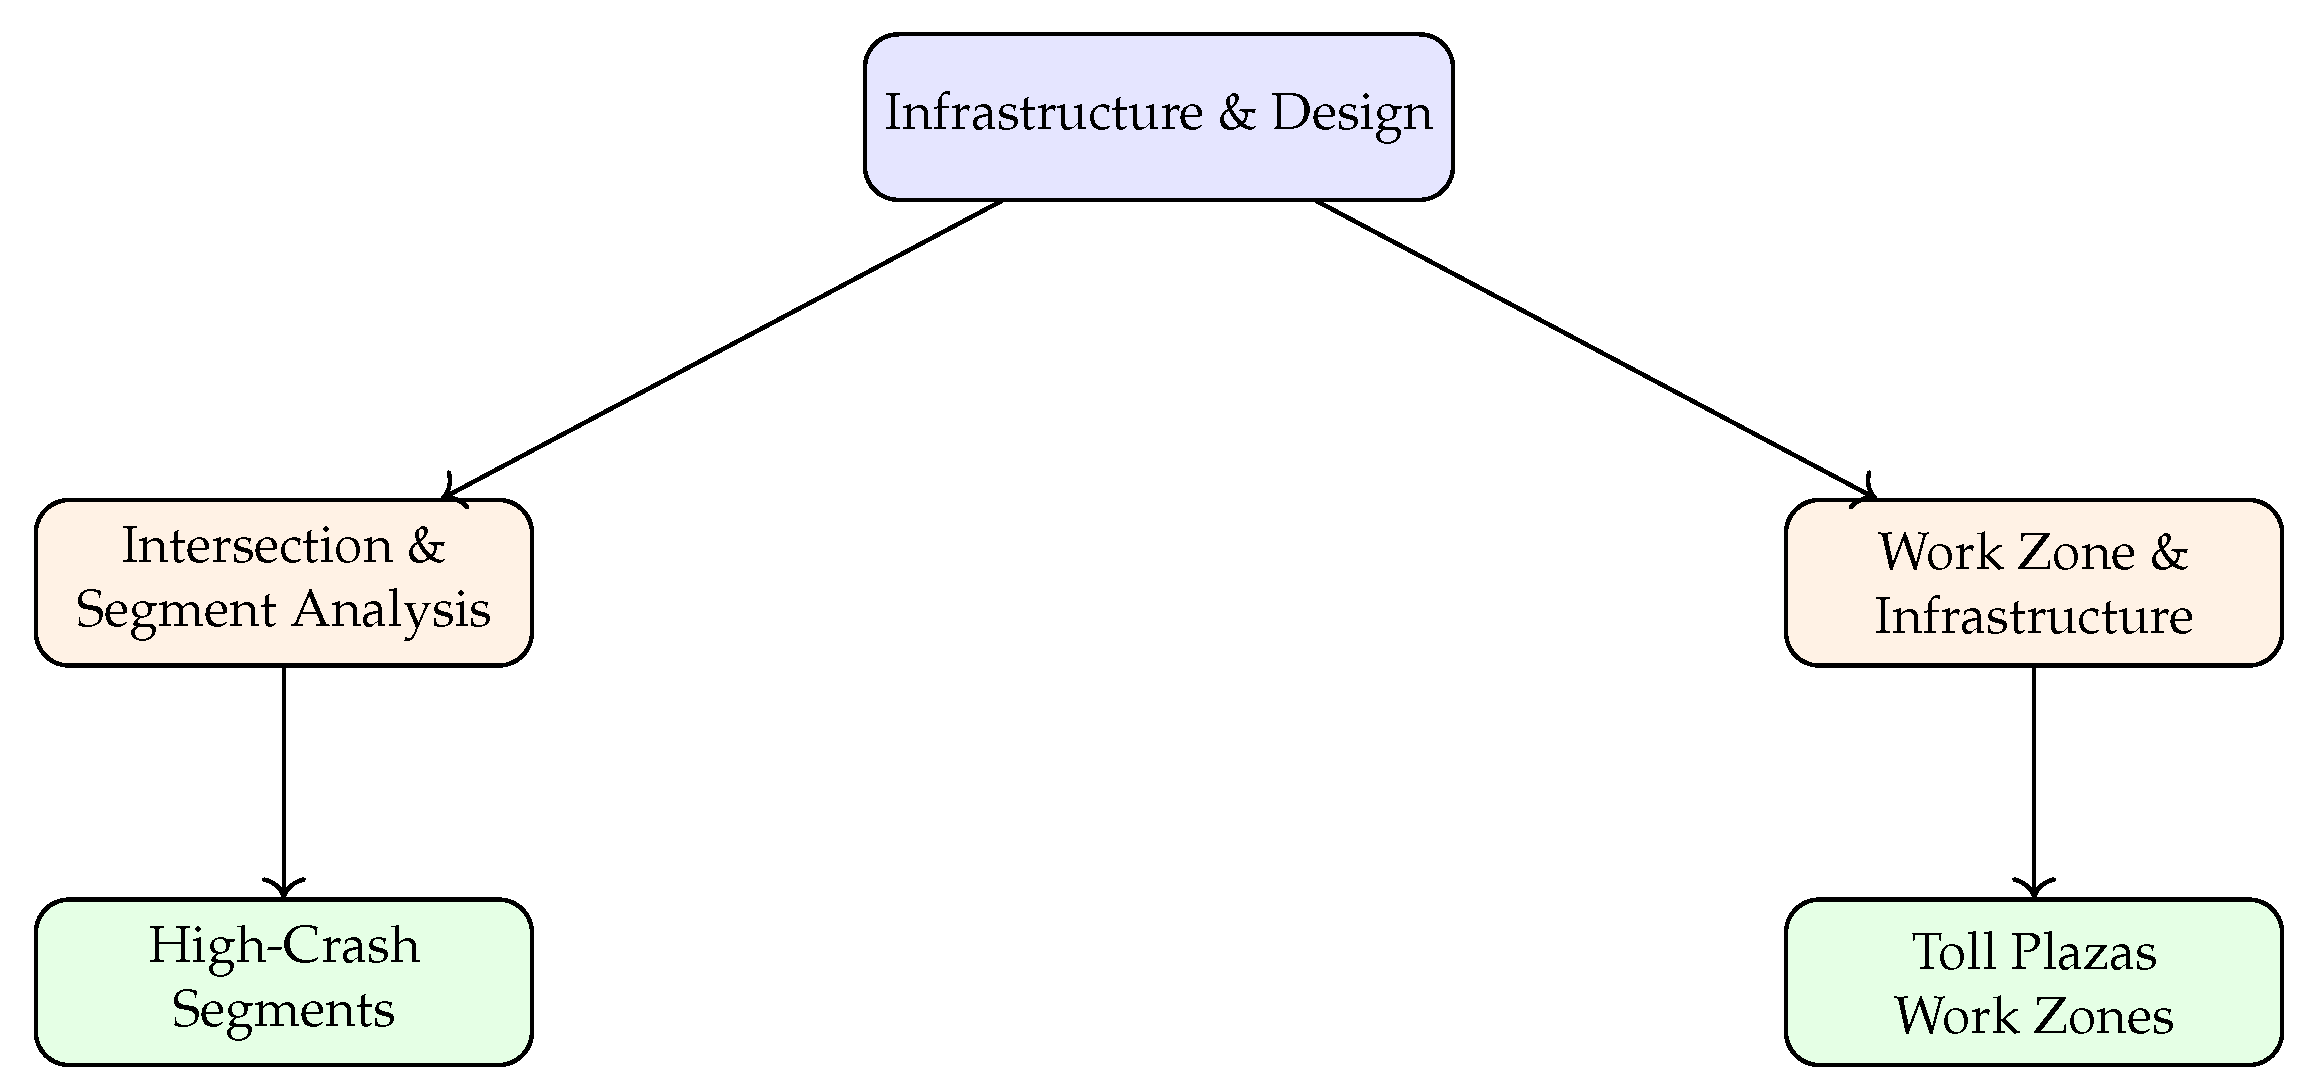
5.2. Work Zone Safety and Roadway Infrastructure Factors

Abuzwidah and Abdel-Aty [81] analyzed crash frequency for different toll plaza designs. Compared with traditional plazas, hybrid designs cut crashes by 44.7% and all-electronic toll collection (AETC) by 72.6%. Diverge areas at hybrid plazas, however, exhibit 23% higher risk than merge areas.
Feknssa et al. [82] applied a random-parameter negative-binomial model with heterogeneity in means and variances to freeway ramp crashes. Ramp type, horizontal alignment, truck volume, and interchange geometry all significantly affect crash counts, demonstrating the need for spatially nuanced design standards.
Carson and Mannering [83] found that highway ice warning signs are not, by themselves, a significant crash-reduction factor—although their effects intertwine with location-specific variables that influence ice-related crash frequency and severity.
Anastasopoulos et al. [58] employed Tobit regression to treat crash rates as continuous outcomes on Indiana interstates, identifying pavement condition, geometry, and traffic composition as key predictors.
Chen and Tarko [84] compared two-level random-parameter and fixed-parameter negative-binomial models for work zone safety, showing that fixed-parameter specifications can suffice in certain contexts.
Petegem and Wegman [85] built a network-wide crash prediction model for rural roads. Roads with ≤2 m safety zones see 50% more run-off-road crashes, while sharp curves triple run-off-road risk; roadside barriers halve it.
Bhat et al. [63] introduced a count data model with endogenous covariates for urban intersection crashes, finding that crest approaches, frontage-road locations, and flashing-light control substantially increase crash numbers—stressing the value of addressing hidden as well as overt risk factors.
Kwon and Varaiya [86] documented chronic under-utilization and capacity penalties in California high-occupancy-vehicle (HOV) lanes. They argue that improving overall freeway efficiency, rather than expanding HOV networks, is the more cost-effective path.
Infrastructure interventions demonstrate a clear effectiveness hierarchy, with physical design modifications significantly outperforming information-based approaches. Electronic toll collection systems achieve the highest safety benefits (72.6% crash reduction), followed by roadside barriers (50% reduction), while ice warning signs show minimal effectiveness. This pattern suggests that passive infrastructure changes that modify driver behavior through design constraints are more effective than active warning systems requiring driver response. The studies reveal important spatial heterogeneity, with Feknssa et al.’s random-parameter models and Petegem and Wegman’s safety zone analysis both emphasizing location-specific factors. Methodologically, the comparison between Chen and Tarko’s findings and other studies suggests that while sophisticated random-parameter models often outperform fixed-parameter approaches, the context determines optimal model complexity. The failure of HOV lanes to achieve the intended benefits (Kwon and Varaiya) contrasts sharply with the success of toll plaza modifications, highlighting the importance of design compatibility with actual driver behavior rather than idealized usage patterns.

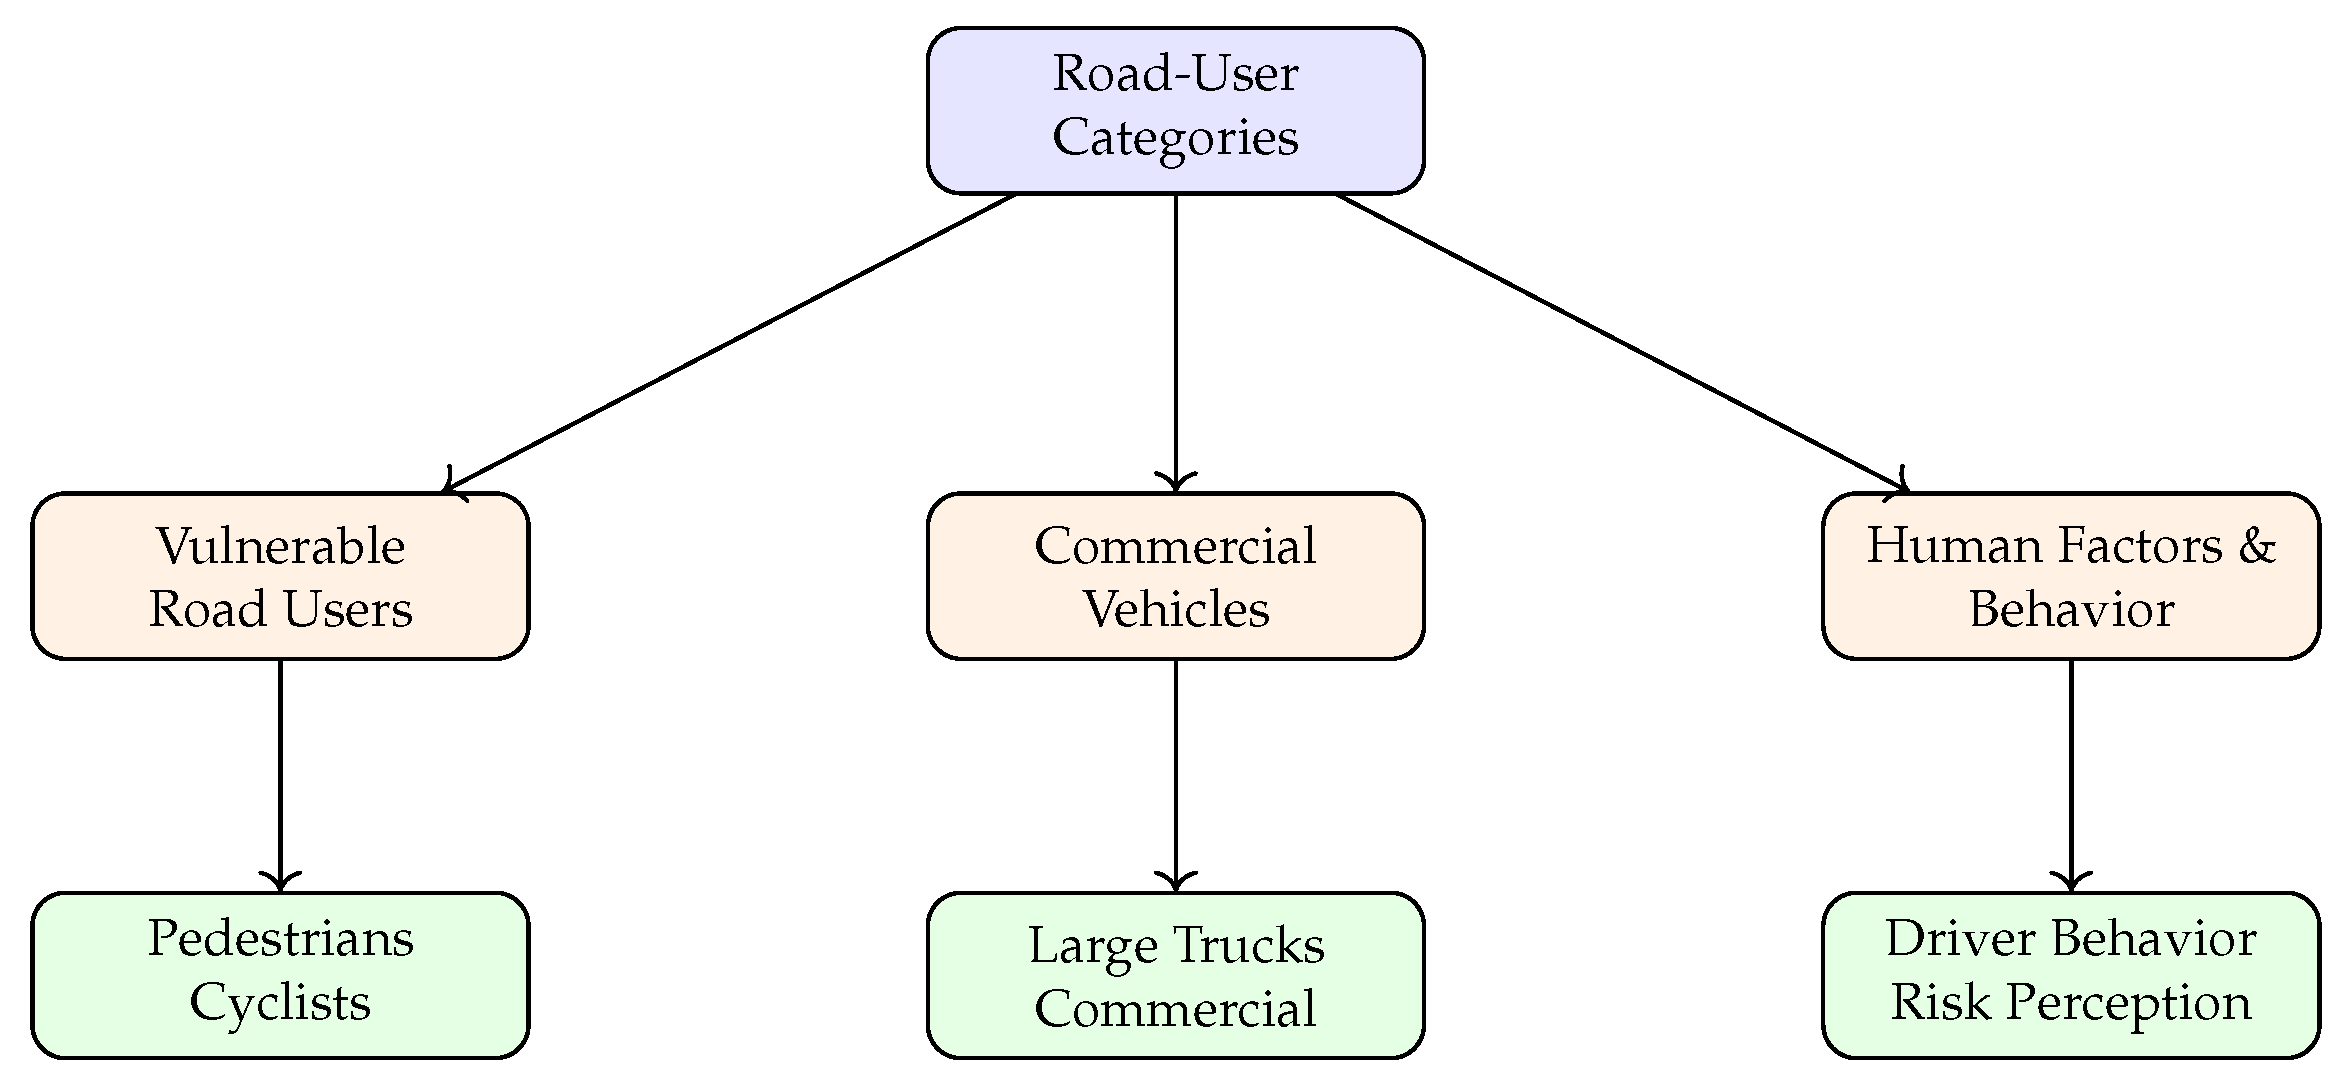
5.3. Vulnerable Road User Safety

Austin and Faigin [87] used travel surveys, crash databases, and an ordered probit model to show that older occupants travel more by passenger car and suffer higher risk in side-impact crashes, heightening fatal and serious-injury odds.
Brude and Larsson [88] demonstrated that even simple exposure models—with motor vehicle and unprotected-user counts—can give “nearly perfect” predictions of pedestrian and cyclist crashes. Risk rises with motor vehicle volume but falls as pedestrian and cyclist volumes grow; cyclists face roughly double the risk of pedestrians under comparable conditions.
Vulnerable road user safety research reveals both age-related and mode-specific risk patterns that challenge conventional safety approaches. Austin and Faigin’s findings on older occupants contrast with Brude and Larsson’s “safety in numbers” effect for pedestrians and cyclists, suggesting that vulnerability mechanisms differ substantially between age-based and mode-based classifications. The counterintuitive finding that increased pedestrian and cyclist volumes reduce individual risk contradicts simple exposure-based models and implies that infrastructure and driver behavior adapt to user presence. However, cyclists face double the risk of pedestrians under similar conditions, indicating that mode-specific factors beyond simple exposure influence safety outcomes. These findings suggest that effective vulnerable user protection requires differentiated strategies addressing both demographic vulnerability (age-related) and mode-specific risks.

5.4. Large Truck and Commercial Vehicle Safety

Abdel-Aty and Abdelwahab [89] developed nested logit models showing that visibility obstruction by light trucks markedly increases the likelihood of a following passenger car striking them in rear-end crashes—especially when the lead vehicle brakes sharply.
Ballesteros et al. [90] found that pedestrians struck by SUVs or pickup trucks suffer more severe and fatal injuries than those hit by conventional cars; vehicle mass and speed are key drivers, with front-end geometry influencing injury patterns at lower speeds.
Commercial vehicle safety research demonstrates that vehicle size and mass create dual safety challenges: increased crash likelihood through visibility obstruction (Abdel-Aty and Abdelwahab) and increased injury severity when crashes occur (Ballesteros et al.). Both studies highlight the interaction between vehicle design characteristics and crash dynamics, with visibility obstruction increasing rear-end collision probability while mass and geometry determine injury outcomes in pedestrian crashes. The emphasis on sudden-braking scenarios and front-end geometry suggests that commercial vehicle safety interventions must address both crash prevention through improved visibility and injury mitigation through design modifications. These findings indicate that the growing prevalence of larger vehicles in traffic streams creates compound safety challenges requiring multi-faceted intervention approaches.

5.5. Human Factors, Driver Behavior, and Risk Perception

Chang and Yeh [91] identified common and divergent fatality-risk factors for motorcyclists and other drivers, emphasizing seat belt use, speed management, rider risk perception, and low-class roadway quality.
Bédard et al. [92] showed that drivers aged 80+ are five times more likely to die in crashes than those aged 40–49; seat belt use is strongly protective, whereas alcohol effects vary with concentration.
Benfield et al. [93] revealed that anthropomorphizing vehicles (e.g., attributing “agreeable” personalities) can predict aggressive driving as well as or better than driver personality traits.
Bhat and Eluru [94] used a copula-based model to disentangle built-environment and self-selection effects on daily vehicle miles traveled (VMT), finding that traditional Gaussian assumptions understate self-selection’s contribution.
Hasan et al. [95] reviewed distracted-driving studies, highlighting links to workload, environment, demographics, and roadway design. They advocate surrogate safety metrics, targeted lighting/lane-marking treatments, and technology-based countermeasures.
Human factor research reveals complex interactions among demographics, psychology, and behavior that challenge simple intervention approaches. Age emerges as a critical factor across studies, with Bédard et al.’s five-fold mortality increase for drivers 80+ and Chang and Yeh’s age-specific patterns for motorcyclists. However, the effectiveness of protective factors varies significantly—seat belt use provides consistent protection across age groups and vehicle types, while alcohol effects vary with concentration and user characteristics. The psychological dimensions explored by Benfield et al. suggest that vehicle anthropomorphism may be as predictive of dangerous behaviors as traditional personality measures, indicating that human–vehicle interaction psychology warrants greater attention in safety interventions. The complexity of built-environment effects (Bhat and Eluru) and multi-faceted nature of distraction (Hasan et al.) underscore that human factor interventions must account for individual differences, environmental context, and technological integration rather than relying on universal behavioral assumptions.

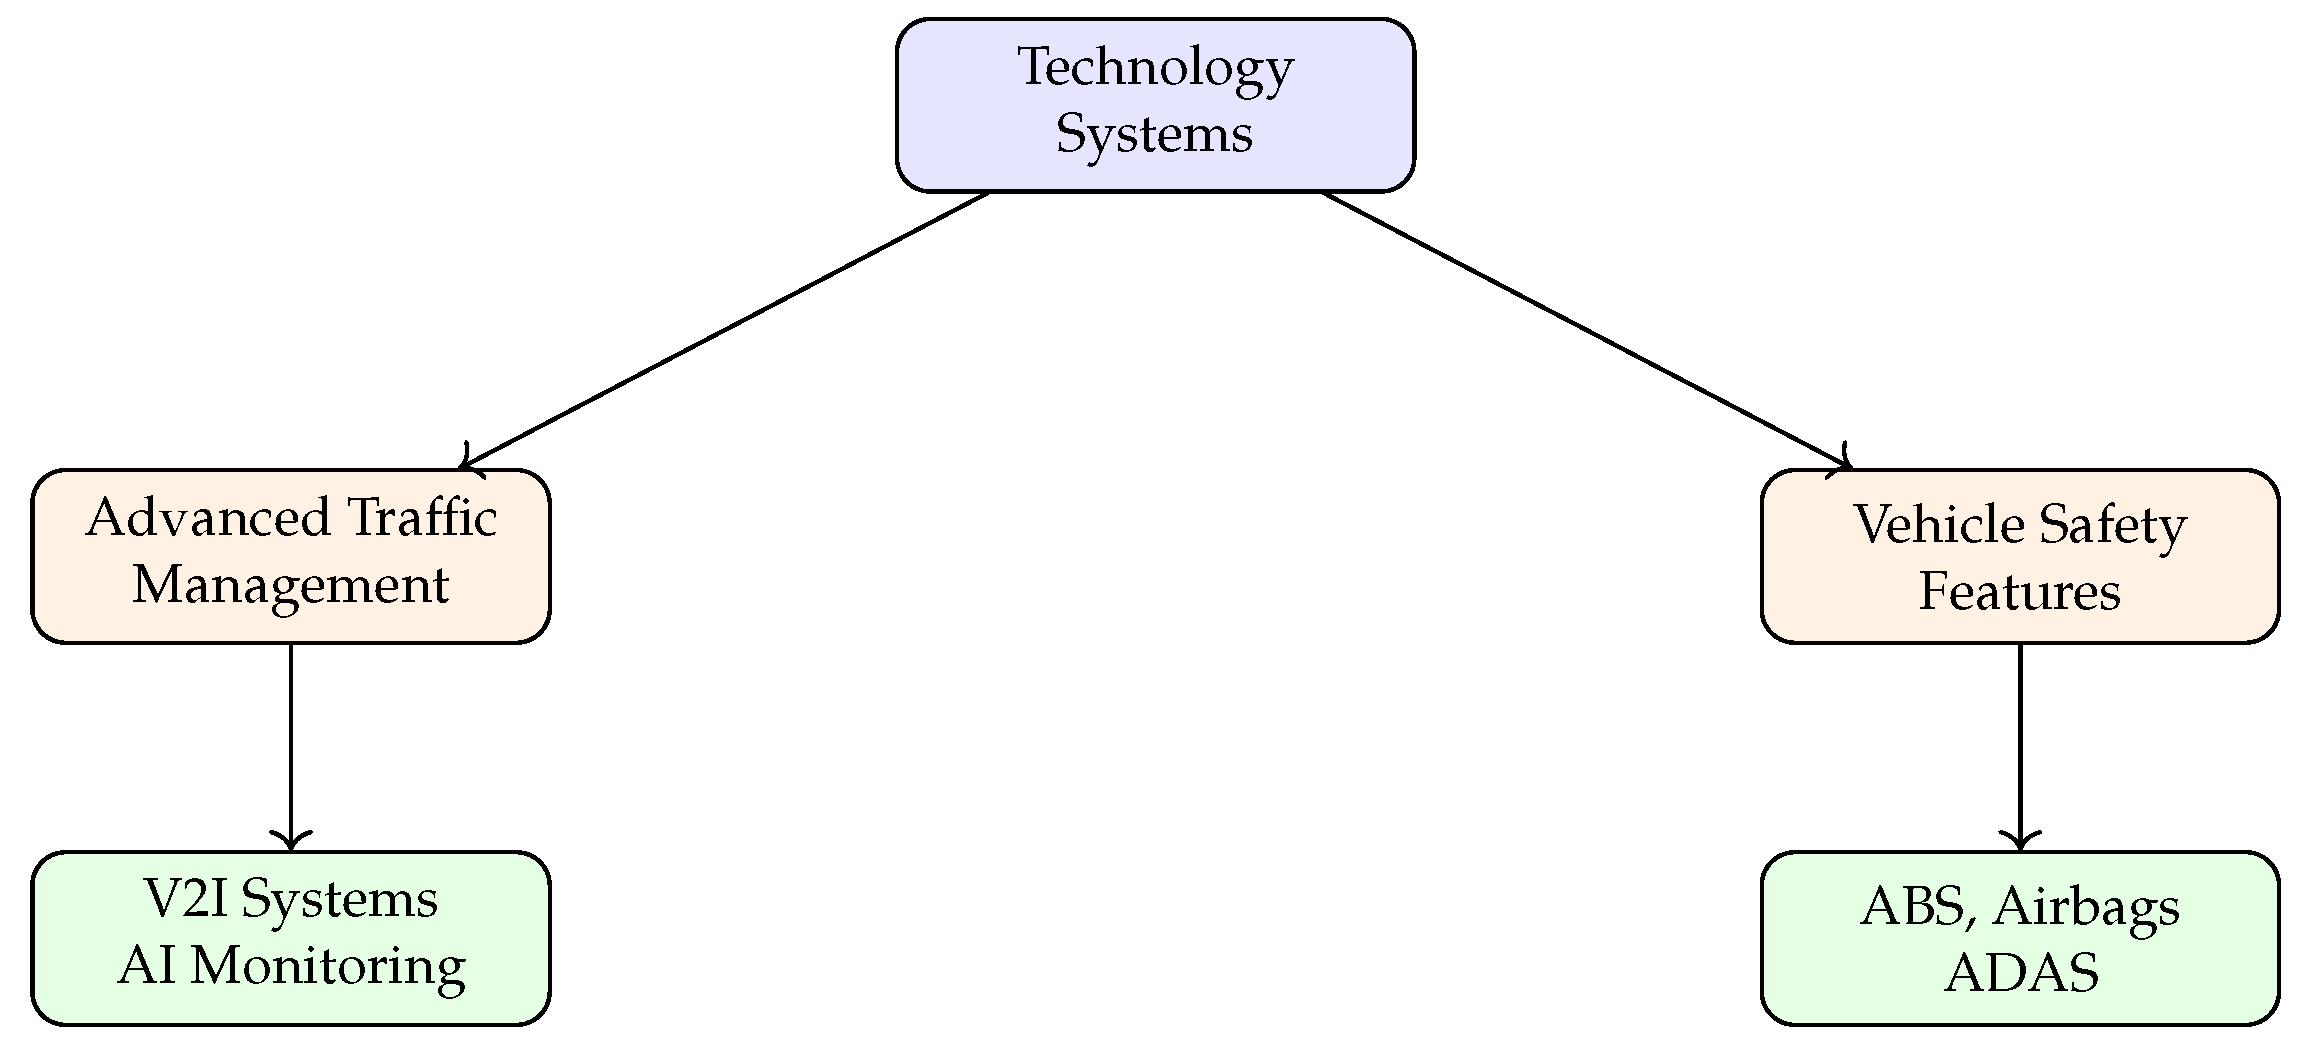
5.6. ATMSs: Advanced Traffic Management Systems

Thabit et al. [96] divided modern monitoring and management into four phases—data gathering, transmission, analysis, and application—surveying sensor technologies, 4–6 G and LPWAN communications, and AI-driven analytics for congestion and safety.
De Souza et al. [97] cataloged challenges for traffic management systems, including heterogeneous data, real-time hazard representation, route-choice side effects, and security/privacy in vehicular ad hoc networks.
Mandal et al. [98] presented a deep learning traffic-surveillance suite (Mask R-CNN, YOLO, and Faster R-CNN) that detects queues with 90.5% accuracy and stationary vehicles with an F1 of 0.83, outperforming manual methods.
Milanes et al. [99] prototyped a V2I-based fuzzy-logic controller that dynamically manages headways and speed, prioritizing safety in complex urban layouts; IEEE 802.11p field tests confirm feasibility.
Advanced traffic management system research demonstrates the progression from conceptual frameworks to practical implementation, with significant performance achievements but persistent challenges. Mandal et al.’s deep learning systems achieve impressive detection accuracy (90.5% for queues), while Milanes et al.’s V2I controllers demonstrate real-world feasibility through field testing. However, the challenges cataloged by de Souza et al.—heterogeneous data integration, real-time processing, and security concerns—highlight the gap between laboratory performance and system-wide deployment. The four-phase framework proposed by Thabit et al. provides structure for understanding system complexity, but the practical challenges suggest that each phase presents implementation barriers that may limit overall system effectiveness. The contrast between high-performance individual components and systemic integration challenges indicates that ATMS success depends as much on architectural design and standardization as on component-level performance.

5.7. Vehicle Features: ABS, AirBags, and ADAS

Høye [100] found that frontal airbags cut driver fatalities by 22% for belted occupants but provide no net benefit to unbelted drivers, contradicting earlier claims of airbag-induced risk.
Kusano and Gabler [101] evaluated three pre-collision system (PCS) algorithms; the most comprehensive one (FCW + PBA + PB) reduces injury severity by up to 34% and could prevent 3.2–7.7% of rear-end crashes.
Ding et al. [102] compared 1001 SAE-L2 ADAS and 548 SAE-L4 ADS crashes, finding L2 events cluster on highways and L4 in urban areas; low mileage and new-technology generation correlate with lower injury odds.
Vehicle safety technology research reveals important patterns in system effectiveness and user interaction dependencies. The effectiveness of safety systems varies dramatically with user behavior—airbags provide a 22% fatality reduction for belted drivers but no benefit for unbelted drivers (Høye), illustrating that passive safety systems require complementary protective behaviors. More advanced systems show greater effectiveness, with comprehensive pre-collision systems achieving an injury reduction of up to 34% (Kusano and Gabler) compared with airbags’ 22% benefit. However, Ding et al.’s analysis of automated driving systems reveals that the deployment context significantly influences the outcomes, with different automation levels experiencing distinct crash patterns (L2 on highways and L4 in urban areas). The correlation between low mileage and lower injury odds suggests learning effects or selection bias in early adopters. These findings indicate that vehicle safety technology effectiveness depends on the interaction among system sophistication, user behavior, and deployment context rather than technology capabilities alone.

5.8. Weather, Environmental, and Temporal Factors

Malin et al. [103] employed Palm probability to relate crash risk to the time spent on a segment; relative risk is the highest in icy rain and on slippery surfaces, with single-vehicle crashes being particularly sensitive.
Bullough et al. [104] linked roadway lighting to night-to-day crash ratios, finding observed ratio drops (≤13%) smaller than the oft-cited 30%, likely because of uncontrolled covariates in earlier studies.
Zhang et al. [105] built a spatial multinomial-logit injury-severity model with real-time weather, identifying vertical grade, visibility, EMS response time, and vehicle type as key factors; spatial correlation improves fit and predictive accuracy.
Environmental factor research demonstrates the complexity of weather and visibility effects on crash risk, with important methodological implications for intervention assessment. Malin et al.’s finding of the highest risk during icy rain conditions, combined with the particular sensitivity of single-vehicle crashes, suggests that environmental interventions must target specific weather–crash type combinations rather than general adverse conditions. The lighting research by Bullough et al. reveals a significant methodological issue: the observed safety benefits (≥13%) are substantially smaller than commonly cited values (30%), highlighting how uncontrolled covariates can overstate intervention effectiveness. Zhang et al.’s integration of real-time weather data with spatial modeling demonstrates that environmental factors interact with infrastructure characteristics (vertical grade) and emergency response capabilities, suggesting that effective environmental safety interventions require integrated approaches considering multiple interacting factors. The consistent emphasis on spatial correlation across studies indicates that environmental effects vary significantly by location, challenging universal intervention strategies.

6. Applications and Policy Implications

Road safety research has evolved significantly in recent decades, moving from simple before–after studies to sophisticated analytical approaches that combine empirical evidence with advanced statistical methods. This evolution has enabled a more nuanced understanding of safety interventions and their effectiveness, leading to evidence-based policy recommendations. This section examines key applications and methodological advances in road safety analysis, focusing on critical areas of safety intervention evaluation, the identification of high-risk locations, and the development of analytical frameworks for safety performance assessment.

6.1. Evidence-Based Safety Interventions

The evaluation of traffic safety measures requires robust methodological approaches to separate true effects from statistical artifacts and confounding factors. Recent studies have employed increasingly sophisticated methods to assess various safety interventions, providing crucial insights for policy development.

6.1.1. Legislative and Behavioral Interventions

Cohen and Einav [106] conducted a landmark study on mandatory seat belt laws by using panel data analysis. Their findings challenge previous assumptions about the magnitude of safety benefits while providing important evidence against the risk compensation hypothesis. Specifically, their analysis shows that while seat belt laws significantly reduce traffic fatalities, the effect is more modest than earlier estimates suggested, and importantly, they found no evidence of compensatory risk-taking behavior among drivers.
Chang and Yeh’s [91] comparison between non-motorcycle drivers and motorcyclists revealed common factors as well as risk discrepancies between the two groups. The study concluded that enhancing seat belt use rates, speed management, rider risk perceptions, and road quality improvements are particularly important in reducing the risk of fatality for both groups.
Bédard et al.’s [92] analysis found that drivers aged 80+ are five times more likely to experience fatal injuries compared with those aged 40–49 while confirming the protective effects of seat belts. These findings support age-specific driver assessment and vehicle design policies, highlighting the need for targeted interventions for older drivers.

6.1.2. Infrastructure Modifications and Design Interventions

Infrastructure modifications have been subject to rigorous evaluation with varying degrees of success. Zheng and Sayed [107] demonstrated the effectiveness of smart channel conversions for right-turn lanes, employing time-to-collision metrics and extreme value theory. Their finding of a 34% reduction in severe conflicts, though with limitations regarding merging conflicts, provides valuable guidance for intersection design policies.
Abuzwidah and Abdel-Aty’s [81] evaluation of toll plaza designs found that hybrid toll plazas result in 44.7% fewer crashes than traditional toll plazas, while all-electronic toll-collection systems achieve 72.6% fewer crashes. For hybrid systems, crash risk in diverge areas is 23% higher than in merge areas. These findings provide clear guidance for toll plaza design as they indicate that all-electronic toll plazas are significantly safer.
Petegem and Wegman [85] modeling results found that roads with safety zones of 2 m or less resulted in 50% more run-off-road crashes, while strong curvature increases run-off-road crashes by three times compared with straight roads. Roadside barriers were found to reduce 50% of run-off-road crashes compared with roads with small safety zones. These specific percentages provide quantitative guidance for rural road design standards.
However, not all infrastructure interventions prove effective. Carson and Mannering’s [83] statistical analysis showed that ice warning signs were not a significant factor in reducing accident frequency or severity, indicating that this common safety measure may not provide the expected benefits and resources might be better allocated elsewhere.

6.1.3. Vehicle Technology Safety Impacts

Vehicle safety technologies have demonstrated significant benefits when properly implemented. Høye’s [100] analysis found that airbags reduce driver fatality for belted drivers by 22%; however, airbags are neither effective nor counterproductive for unbelted drivers. This finding supports the continued promotion of seat belt use alongside airbag deployment.
Kusano and Gabler’s [101] evaluation of pre-collision systems found that systems utilizing forward collision warning, pre-crash brake assist, and autonomous pre-crash brake achieved the highest effectiveness, reducing severity by 14–34% and reducing severity for belted drivers by 29–50%. The systems could prevent 3.2–7.7% of rear-end collisions, supporting policies mandating such technologies.
Ding et al.’s [102] analysis revealed distinct operational patterns between ADAS (SAE Level 2) and ADS (SAE Level 4) vehicles, with ADAS crashes being concentrated on highways and ADS crashes in urban environments. This finding supports targeted testing and deployment strategies for different automation levels.

6.1.4. Intersection and Traffic Control Interventions

Retting et al.’s [77] investigation of motor vehicle crashes at stop signs across four U.S. cities revealed that stop sign violations, particularly when drivers had initially stopped, accounted for about 70 percent of crashes, with younger and older drivers being disproportionately involved. These findings provide specific targets for intervention design and driver education programs.
Bonneson and McCoy’s [80] analysis of 125 two-way stop-controlled intersections demonstrated that accident frequency follows a gamma distribution with nonlinear increases relative to traffic demands. This relationship enables the identification of hazardous locations based on traffic volume thresholds.
In a methodologically innovative study, Yanmaz-Tuzel and Ozbay [108] utilized Full Bayes analysis to evaluate various road safety countermeasures. Their work not only identified the most effective interventions—including improved road alignment and median barrier installation—but also advanced the methodological framework by demonstrating the advantages of P-LN model structures with hierarchical priors for limited-data scenarios.

6.1.5. Vulnerable Road User Protection Strategies

Austin and Faigin’s [87] analysis revealed that older individuals are more likely to be involved in side-impact crashes compared with younger occupants, which significantly increases their fatality and injury risk. This finding supports targeted vehicle design improvements and intersection safety modifications for aging populations.
Brude and Larsson’s [88] modeling results show that accident risk involving unprotected road users increases with motor vehicle numbers while decreasing with more pedestrians and cyclists present. Additionally, accident risk is approximately twice as high for cyclists compared with pedestrians under similar traffic conditions. These findings support policies promoting safety in numbers and differentiated protection strategies.
Ballesteros et al.’s [90] investigation in Maryland revealed that pedestrians hit by SUVs and pickup trucks are more likely to suffer severe injuries and fatalities compared with conventional cars, with vehicle weight and speed being significant contributors. These findings support vehicle design regulations and urban speed limit policies.

6.1.6. Commercial Vehicle Safety Interventions

Abdel-Aty and Abdelwahab’s [89] analysis demonstrated that the visibility obstruction caused by light truck vehicles significantly increases the probability of rear-end collisions involving regular passenger cars, particularly when the lead vehicle stops suddenly. This supports policies regarding commercial vehicle design standards and following distance regulations.
Chen and Tarko’s [84] analysis identified specific safety effects of work zone designs and traffic management features, providing evidence-based guidance for temporary traffic control strategies during construction activities.

6.1.7. Environmental and Weather-Related Interventions

Malin et al.’s [103] analysis showed relative accident risks to be the highest for icy rain and slippery road conditions. The overall relative accident risk is lower on motorways compared with other road types; however, risk under poor weather conditions is higher on motorways. These findings support weather-responsive traffic management strategies.
Nighttime driving can be more dangerous due to reduced visibility, but Bullough et al.’s [104] found that the crash risk increased about 12%, less than previously assumed, suggesting that lighting improvements provide measurable but modest safety benefits that should be evaluated against costs.
Zhang et al.’s [105] investigation using real-time weather data identified key risk factors including vertical grade, visibility, emergency medical services response time, and vehicle type. These factors provide specific targets for infrastructure improvements and emergency response optimization.

6.2. Spatial Analysis and Risk Assessment

The spatial dimension of road safety has emerged as a crucial consideration in both research and practice, leading to new approaches in hotspot identification and network screening.

6.2.1. Methodological Advances in Spatial Analysis

Ziakopoulos and Yannis [109] provided a comprehensive review of spatial analysis methods in road safety, emphasizing the critical role of spatial heterogeneity and dependence in crash risk analysis. Their work establishes a framework for incorporating geographical factors into safety assessments, highlighting the importance of appropriate areal unit selection and Bayesian modeling approaches.
Ryan et al. [110] advanced the field by integrating risk assessment into path planning through an innovative modification of Dijkstra’s algorithm. Their approach combines traditional distance optimization with risk exposure metrics while employing self-organizing maps to identify distinct risk groups. This methodology bridges the gap between theoretical risk assessment and practical route planning applications.

6.2.2. Applied Risk Assessment and Hotspot Identification

Afghari et al. [111] developed an integrated approach to blackspot identification, combining crash count and severity in a joint econometric model. Their weighted risk score methodology, which incorporates both frequency and severity predictions, demonstrates superior performance in identifying locations with high risk of severe injuries. This approach provides a more nuanced tool for prioritizing safety improvements, particularly in contexts where resources are limited.
Boroujerdian et al.’s [78] dynamic modeling approach demonstrated a 25–38% improvement in comparison with existing models for identifying 10–20% of high-crash road segments. This performance improvement has direct implications for resource allocation in safety improvement programs.
Amoros et al.’s [79] comparison of traffic safety across French counties identified significant interactions between county and road type, indicating that differences in safety across counties depend on the road type and vice versa. This finding emphasizes the need for location-specific safety strategies rather than one-size-fits-all approaches.

6.3. Safety Performance Functions and Crash Modification Factors

Safety Performance Functions (SPFs) have become the cornerstone of modern traffic safety analysis since their introduction in the Highway Safety Manual (HSM) [112] by the American Association of State Highway and Transportation Officials (AASHTO). These statistical models, which predict the average crash frequency for a given site type under specific conditions, are now widely used by the Federal Highway Administration (FHWA) and infrastructure analysts across the United States, providing transportation agencies with robust tools for identifying high-risk locations and evaluating safety improvements.
The foundation for modern SPF implementation was established by Hauer [113], who demonstrated the Empirical Bayes (EB) method’s effectiveness in addressing two critical challenges: improving precision with limited crash data and mitigating regression-to-mean bias. This methodological breakthrough, combined with the increasing availability of calibrated SPFs and overdispersion parameters, has facilitated the widespread adoption of EB estimation in safety analysis.
The practical implementation of these methods has been demonstrated in various contexts. Powers and Carson [114] developed an accessible Excel-based approach for evaluating safety improvements in Montana’s roadway reconstruction projects. Their work highlighted both the method’s utility and its constraints, particularly the requirement for three-year aggregated crash data to ensure reliable SPF modeling.
Persaud and Lyon [115] provided crucial validation of the EB methodology, demonstrating its superiority over traditional approaches in before–after safety studies. Their research emphasized the importance of comprehensive data collection and proper analyst training while also identifying potential pitfalls in CMF derivation. They proposed future research directions, including refinements to SPFs and the exploration of Full Bayes (FB) modeling for handling spatial correlations in accident data.
A significant methodological advancement came from Hauer [116], who challenged the conventional assumption of uniform overdispersion parameters. His work showed that shorter road sections were disproportionately affected by this assumption, leading to potentially biased estimates. By proposing length-dependent overdispersion parameters, Hauer improved the accuracy of EB estimates across varying road section lengths.
Elvik [117] conducted a comprehensive assessment of the EB method’s performance in observational studies, confirming its position as the leading approach for before–after safety analyses. His research demonstrated that EB estimates based on accident prediction models achieved the highest accuracy among available methods, though noting variations in prediction errors across different techniques.
Recent developments, exemplified by Park et al. [118], have expanded the application of both EB and FB methods to specific safety interventions. Their analysis of roadside barriers revealed the importance of considering multiple factors in safety assessments, including vehicle characteristics, driver demographics, and environmental conditions. This work demonstrates the evolution of CMFs toward more nuanced, condition-specific applications, reflecting the increasing sophistication of safety analysis methods.
This progression in methodology, from basic prediction models to sophisticated multi-factor analyses, coupled with FHWA’s standardization of SPFs, has established a robust framework for evidence-based safety analysis in transportation infrastructure. Future developments will likely focus on incorporating emerging data sources and refining condition-specific applications while maintaining the fundamental principles that have made these methods successful. Table 2 summarizes the develpment of SPFs and CMFs.

6.4. Economic Analysis, Crash Costs, and Resource Allocation

Bougna et al. [119] completed a quantitative analysis of studies estimating the socio-economic costs of road crashes, highlighting methodological differences between high-income countries (favoring willingness-to-pay method) and lower-income countries (using human capital approach). They conclude that there is potential for high returns on investment in road safety measures and argue that comprehensive cost analysis can bolster support for crash-reduction programs, potentially driving economic development.
Wijnen et al. [120] analyzed road crash cost estimates for 31 European countries, providing an overview of the official monetary valuations. The study found the total costs of road crashes to be 0.4–4.1% of GDP. The valuation of preventing a serious injury was determined to be 2.5–34.0% of the value per fatality and the valuation of preventing a slight injury to be 0.03–4.2% of the value per fatality. The results reveal that the method of obtaining valuations majorly impacts results, underlining the importance of harmonization of valuation practices.
Wu et al. [66] examined the economic dimensions of road safety in Zhongshan, China, revealing a nonlinear relationship between GDP per capita and crash outcomes. Their analysis demonstrates that economic development initially increases crash risk but reduces crashes beyond approximately RMB 60,000 per capita, when improved economic conditions enable safety investments. The study documents how the government allocation of RMB 546 million for road infrastructure improvements and RMB 7 million for safety education during 2008–2009 resulted in measurable crash reductions, illustrating the potential for strategic economic resource allocation in safety interventions.
Zaloshnja et al. [121] estimated the costs per crash for three crash severity groups within 16 selected crash geometry types and 2 speed limit categories by using police crash reports. The results of the study find the most costly crashes to be non-intersection, fatal or disabling injury crashes on roads with a speed limit of at least 50 mph where there were head-on collisions or human–vehicle collisions. These crashes are estimated at over USD 1.69 and USD 1.16 million per crash, respectively. The study also found run-off-road collisions to make up 34% of total crash costs.
Pirdavani et al. [122] demonstrated the application of zonal crash prediction models to evaluate travel demand management strategies, specifically examining fuel cost increases as a safety intervention. Their analysis of a 20% fuel price increase scenario in Flanders, Belgium, predicted an 11.57% reduction in vehicle kilometers traveled and a corresponding 2.83% decrease in crash frequency, illustrating how economic policies can yield measurable safety benefits through reduced exposure.

6.5. Emerging Technology Applications and Connected Vehicle Integration

A challenges when introducing new technology, including connected and autonomous vehicles, is the public’s risk assessments and acceptance. Ahmed et al.’s [123] performed a survey of public opinions and found that while 66% and 68% of respondents expect fewer and less severe crashes with autonomous vehicles, significant concerns exist regarding equipment failure (71%), system failures (73%), hacking (68%), and privacy breaches (74%). These findings highlight critical areas requiring attention for successful deployment and public acceptance.

6.5.1. Autonomous Vehicle Crash Patterns and Safety Implications

Bogg et al.’s [124] analysis of California crash data revealed that 61.1% of autonomous vehicle-including accidents were rear-end collisions. Environmental factors, such as mixed land use and proximity to schools, play a significant role in crash propensity. These findings support targeted safety system improvements and deployment strategies, particularly enhanced rear-end collision avoidance through automatic emergency braking systems in conventional vehicles.

6.5.2. Mixed Traffic Flow Dynamics

Chang et al.’s [125] analysis revealed that intelligent and connected vehicles can improve mixed traffic flow stability under a critical speed and effectively improve traffic capacity. However, they can degrade stability if the critical speed is exceeded, with this critical speed decreasing as the maximum platoon size increases. These findings have important implications for traffic management policies in mixed autonomous and conventional vehicle environments.

6.6. Impact of Interventions

It can be hard to measure the direct impact of individual safety interventions. When seat belts were introduced, for instance, there was no specific date at which all cars had seat belts—there was a gradual transition from optional equipment to mandatory installation, to mandatory usage laws, and finally to widespread compliance. Similar gradual adoption patterns apply to other safety technologies and legal changes, from ABS brakes to drunk-driving laws.
If we take a closer look at recent decades, we can compare traffic fatalities to population to assess the efficacy of various safety interventions and countermeasures. Figure 10 presents this comparative analysis for both the United States and the United Kingdom from 1994 to 2022. The longitudinal data reveal divergent trends in road safety outcomes between these nations, despite similar levels of economic development and technological advancement. While both countries have implemented evidence-based safety measures since the 1990s, when U.S. fatality rates peaked at approximately 15.7 per 100,000 inhabitants, the rate disparity remains significant, with the U.S. currently experiencing about 12.9 deaths per 100,000 inhabitants compared with less than 3 in the United Kingdom.
While exposure differences, particularly higher vehicle miles traveled (VMT) in the United States, contribute to this disparity, multivariate analyses suggest that this factor alone does not fully explain the variation. The U.S. built environment, characterized by auto-centric development patterns, creates systematic exposure risks by necessitating motor vehicle use across all demographic groups, including populations that may be more susceptible to crash involvement. Moreover, controlled studies examining fatality rates per vehicle mile traveled (VMT) indicate persistent disparities, suggesting fundamental differences in system design parameters, vehicle fleet characteristics, and regulatory frameworks between the two countries.
The divergent trajectories, particularly the recent uptick in U.S. fatalities while the UK rates maintain a downward trend, underscore the critical role of systemic factors and policy interventions in determining road safety outcomes. This empirical evidence suggests that elevated U.S. fatality rates are not merely a function of increased exposure through higher mobility but rather reflect addressable systemic factors. These findings have important implications for the application of countermeasures and the transfer of successful safety interventions between jurisdictions, particularly in the context of emerging analytical methodologies and real-time crash prediction systems.

7. Emerging Research Areas and Future Directions

This section reviews emerging research, a summary of which is available in Table 3.

7.1. Big Data Analytics and Data Mining Techniques

Chiou et al. [65] developed a genetic mining rule model utilizing a stepwise rule-mining algorithm. Their study integrated 29 mined rules into a mixed logit model to identify key safety and risk conditions associated with severe crashes. Their analysis revealed that seat belt fastening was the most critical safety condition, while risk conditions included vehicle type, alcohol use, driver characteristics, time period, road status, and surface condition. These findings demonstrate the effectiveness of a two-stage mining framework in capturing the joint effects of risk factors contributing to single-vehicle crash severity on freeways.
The application of advanced data mining techniques, as exemplified in the study, provides a robust foundation for identifying intricate, multi-dimensional relationships in traffic safety, thereby informing more effective crash prevention strategies.

7.2. Deep Learning and Advanced AI Applications

In a study performed in 2020, Huang et al. [127] concluded that while deep models can be effectively applied to traffic data for crash occurrence classification and risk prediction, simpler models can often achieve comparable or even better performance. Specifically, they found that for crash detection, CNNs with dropout outperformed some shallow models and, for crash prediction, deep models showed comparable performance to shallow models.
Building on this, Zhang et al. [128] utilized a state-wide live traffic database that provides crowdsourced probe vehicle data to develop real-time traffic crash prediction models. The crash prediction models use machine learning models to predict crash risk according to pre-crash traffic dynamics and static freeway attributes. The results of the study reveal a significant relationship between rear-end crashes and pre-crash traffic dynamics. Additionally, the study ranks traffic speed factors in terms of feature of importance, finding the speed variance and speed reduction prior to crashes to be most important, both of which are positively related to rear-end crash risk. Random forest models emerged as the most effective among various machine learning approaches, highlighting significant relationships between rear-end crashes and pre-crash traffic dynamics. Key predictive factors included speed variance and reductions prior to crashes, offering actionable insights for traffic safety interventions.
Together, these studies underscore both the potential and limitations of AI-driven methodologies in crash analysis and risk prediction, emphasizing the necessity of aligning model selection with specific data and research objectives.

7.3. Integration of Emerging Data Sources and Technologies

Recent studies have shed light on the prevalence and impact of distracted driving in the United States. Cambridge Mobile Telematics (CMT) and Arity, two companies aggregating data from mobile phones and vehicle telematics, provide alarming insights:
  • CMT’s 2023 report reveals that 34% of all drivers who crash interact with their phone in the minute before the crash [130].
  • Arity’s 2023 report notes a 30% increase in distracted driving per mile from 2019 to 2023 [131].
These findings contrast with the National Highway Traffic Safety Administration’s (NHTSA) 2022 research note, which reports lower percentages of distraction-affected crashes [132]. The discrepancy can be attributed to different methodologies and data sources, highlighting the value of telematics data in supplementing traditional police crash reports.
The studies also reveal interesting patterns in distracted-driving behavior, including seasonal and geographic variations. However, it is important to note potential limitations in the data sample collected by companies like Arity and CMT, such as selection bias and the focus on phone-based distractions.
These findings underscore the urgent need for continued efforts to combat distracted driving through legislation, enforcement, education, and technology-based solutions.

7.4. Real-Time Crash Risk Prediction and Proactive Safety Management

Li et al. [67] developed a hybrid Long Short-Term Memory–Convolutional Neural Network (LSTM-CNN) model to predict real-time crash risk on urban arterials. Using a year’s worth of traffic, signal, and weather data, they applied SMOTE to address data imbalance. Their parallel LSTM-CNN model outperformed other methods, including sequential LSTM-CNN, LSTM, CNN, XGBoost, and Bayesian Logistic Regression, achieving the highest AUC of 0.93, the highest sensitivity, and the lowest false alarm rate. The study demonstrated the potential of deep learning in traffic safety prediction, highlighting the benefits of combining LSTM with CNNs in a parallel structure for capturing both long-term dependencies and local features.

7.5. Safety Implications of Connected and Autonomous Vehicles

To ensure the effective deployment of autonomous vehicle (AV) technologies, it is crucial to account for both public perception and the underlying safety challenges highlighted by real-world accident data. While Ahmed et al. [123] underscore the public’s optimism regarding the potential of AVs to reduce crash frequency and severity, their findings also emphasize significant apprehensions about system failures, cybersecurity risks, and privacy concerns. They analyzed public perceptions of autonomous vehicles (AVs) by applying a grouped random-parameter bivariate probit model with heterogeneity in means. Based on a survey of 584 U.S. respondents, the study found that while 66% and 68% expected fewer and less severe crashes, respectively, significant concerns existed regarding equipment failure in poor weather (71%) and potential crashes due to system failures (73%). Furthermore, 68% of respondents worry about hacking and terrorist attacks, while 74% express concerns about privacy breaches. The study highlights the importance of continuously monitoring these perceptions for effective AV deployment strategies.
In the same vein, Esenturk et al. [129] discussed solutions to traffic safety regarding autonomous vehicles (AVs) through two main objectives: identifying patterns in traffic accidents and developing test scenarios for AVs based on these patterns. The authors analyze the STATS19 accident data, a dataset of 20,000 accidents from the UK, using the COOLCAT clustering algorithm, which is designed for high-dimensional categorical data. This analysis reveals six distinct clusters of traffic accidents, each characterized by unique real-world situations, aiding in the understanding of risk factors. Additionally, the study employs association rule mining to create non-trivial test scenarios for AVs, addressing the industry’s challenge of ensuring safe deployment in risky situations. The findings show the value of clustering techniques and more effective data collection methods to inform safety strategies for emerging vehicle technologies, contributing to safer transportation systems.
These findings by Esenturk et al. [129] underscore the importance of addressing complex accident patterns and developing tailored safety strategies for autonomous vehicles. Expanding on this focus, Bogg et al. [124] transitioned to real-world crash data from California, offering valuable insights into specific collision types and the environmental factors influencing AV-including accidents. Together, these studies highlight the critical need for both predictive safety frameworks and practical interventions to enhance the safe integration of AVs in diverse traffic environments. Their research concludes that while automated vehicles (AVs) in California have accumulated significant mileage, the insights gained from analyzing crash reports reveal critical patterns in AV-including accidents, particularly the high frequency of rear-end collisions (61.1%). The study emphasizes the need for careful consideration of unobserved heterogeneity in crash data, advocating for the use of informative uniform priors in Bayesian models over the traditional uninformative inverse-gamma priors. The findings suggest that environmental factors, such as mixed land use and proximity to schools, play a significant role in crash propensity. Practical implications include the potential for enhanced rear-end collision avoidance through the implementation of automatic emergency braking systems in conventional vehicles, which could lead to improved safety outcomes in mixed traffic scenarios involving both AVs and human-driven vehicles.
Similarly, Chang et al. [125] delved into the dynamics of mixed traffic scenarios, shedding light on how intelligent and connected vehicles (ICVs) influence traffic flow stability and capacity. They analyzed the traffic flow configurations and the spatial distributions of various types of vehicles when mixed traffic flow is in equilibrium. The study revealed that intelligent and connected vehicles (ICVs) can improve the stability of mixed traffic flow under a critical speed; however, ICVs can degrade stability if the critical speed is exceeded. This critical speed decreases as the maximum platoon size of ICVs increases. Additionally, the results also suggest that ICVs can effectively improve traffic capacity.
Collectively, these studies underscore the transformative potential of connected and autonomous vehicle technologies while emphasizing the necessity of addressing technical and societal challenges for their safe and effective integration into transportation systems. The integration of AV and ICV technologies demands a multidisciplinary approach to ensure their benefits are maximized while mitigating associated risks.

8. Conclusions

This systematic review addressed three fundamental challenges in crash data analysis: data quality issues, methodological fragmentation, and research–practice gaps. Through the comprehensive analysis of methodological evolution from descriptive to system-based approaches (Figure 5) and the systematic categorization of data quality challenges (Figure 3), we demonstrate how sophisticated analytical approaches can be balanced with practical applicability. That being said, persistently high injury rates in traffic, particularly in the United States (Figure 10), reveal limited success in translating research advances into effective countermeasures.

8.1. Key Methodological Advancements

The field has witnessed significant evolution in analytical approaches. The progression from fixed-parameter to random-parameter models has improved accounting for unobserved heterogeneity, while hierarchical Bayesian methods have enhanced the incorporation of spatial–temporal correlations. Advanced spatial analysis techniques, including geographically weighted regression, have revealed geographical patterns in crash occurrences.
Data integration represents another crucial advancement. Combining police reports, hospital records, and insurance claims has addressed underreporting and misclassification issues. This multi-source approach, complemented by surrogate safety measures and traffic conflict analysis, provides alternatives when crash data are limited.
Machine learning and AI applications have uncovered complex, nonlinear relationships in crash data. Real-time crash risk prediction, utilizing streaming sensor and telematics data, enables proactive safety management. Novel severity analysis approaches, including latent class and mixed logit models, have improved injury outcome identification. Big data analytics has opened avenues for discovering previously unknown risk patterns, while methodological advances in addressing endogeneity and self-selection bias have produced more accurate intervention estimates.
Despite these advances, autonomous and mixed traffic solutions emerge as the most promising frontier, alongside continuous data quality improvements.

8.2. Future Research Directions

Given their potential for transformative change, autonomous and mixed traffic solutions should be prioritized as primary research directions. Big data availability presents unprecedented analytical opportunities, requiring advanced data mining and machine learning algorithms to extract meaningful patterns and uncover hidden risk factors.
Real-time crash risk prediction represents a prominent frontier. The evolution from Yuan et al.’s LSTM-RNN improvements [133] through Lim et al.’s Temporal Fusion Transformer architecture [134] to Han et al.’s transformer-based approach [135] demonstrates rapid progress. Their 15.69% recall improvement over traditional methods highlights the potential of integrating connected vehicle data for comprehensive risk assessment.
Data integration remains critical. While traditional analysis relies on police reports, emerging approaches leverage connected vehicle and roadside sensor data—resources rarely available in standard records. This mirrors successful practices like Sweden’s mandatory hospital reporting system. Additional data streams, including social media, detailed weather information, and expanded telematics data, offer further potential for holistic risk assessment.
Despite social acceptability [136,137] and trust challenges [138,139], autonomous and connected vehicles with advanced safety features [140,141] will necessitate new analytical frameworks for human–autonomous vehicle interactions. Addressing endogeneity and self-selection bias [30,31] remains crucial to accurate intervention evaluation.
Interdisciplinary research combining crash analysis with behavioral psychology shows promise. McCarty et al. [142] demonstrated that demographic factors explain over 28% of accident rate variance, while Gu et al. [143] revealed how environmental factors create complex causation chains. These findings emphasize the need for comprehensive models accounting for multiple interacting factors—from individual behavior to demographic patterns and environmental conditions.
Success requires pursuing data-driven approaches leveraging technological and methodological advances but also effectively bridging the persistent gap between research sophistication and practical implementation. Only through this integration can the field fulfill its potential to significantly reduce road crashes and save lives worldwide.

Author Contributions

Conceptualization, M.N.; data curation, L.S.; formal analysis, L.S., M.N., N.D. and A.Y.; investigation, L.S., N.D. and A.Y.; methodology, L.S. and M.N.; project administration, L.S. and M.N.; resources, M.N.; supervision, M.N.; validation, N.D. and A.Y.; visualization, L.S.; writing—original draft preparation, L.S., N.D. and A.Y.; writing—review and editing, L.S. and M.N. All authors have read and agreed to the published version of the manuscript.

Funding

This research received no external funding.

Acknowledgments

During the preparation of this work, the authors used Claude 3.7 Sonnet to assist with LATEX document preparation. After using this tool/service, the authors reviewed and edited the content as needed and take full responsibility for the content of the publication.

Conflicts of Interest

The authors declare no conflict of interest.

Appendix A. PRISMA 2020 Checklist

This appendix provides a detailed assessment of how our systematic review addresses each item in the PRISMA 2020 checklist for systematic reviews and meta-analyses.
Table A1. PRISMA 2020 checklist assessment for road crash analysis systematic review.
ItemPRISMA ElementStatusLocation/Comments
1TitleDocument title clearly identifies this as a systematic review: “Road Crash Analysis and Modeling: A Systematic Review of Methods, Data, and Emerging Technologies”
ABSTRACT
2AbstractAbstract Section includes background, objectives, data sources, study selection criteria, data extraction, synthesis methods, results, limitations, conclusions, and funding statement
INTRODUCTION
3RationaleSection 1, “Introduction”, and Section 1.1 and Section 1.2. Describes importance of crash data analysis, gaps between research and practice, and need for comprehensive methodological review
4ObjectivesSection 1.2, “Scope and Objectives”. Clear statement to “systematically examine established and emerging analytical approaches” with dual purposes outlined
METHODS
5Eligibility criteriaSection 2.1, “Eligibility Criteria”. Clear inclusion/exclusion criteria for studies with methodological contributions
6Information sourcesSection 2.2, “Information Sources and Search Strategy”. Google Scholar as primary source, citation searching, and rationale for database selection
7Search strategySection 2.2. Lists search terms.
8Selection processSection 2.3, “Selection Process and Data Collection” + PRISMA flow diagram. Clear description of screening process
9Data collection processSection 2.3 and Section 2.4. Description of data extraction focusing on methodological characteristics
10Data itemsSection 2.4, “Data Items and Study Characteristics”. Lists extracted elements: methodological approaches, data sources, and performance metrics
11Study risk of bias assessmentSection 2.5, “Risk of Bias Assessment”. Adapted quality assessment for methodological research
12Effect measuresNot applicable for methodological review that does not meta-analyze effect sizes
13Synthesis methodsSection 2.6, “Synthesis Methods”. Description of qualitative and quantitative synthesis approaches
14Reporting bias assessmentLimited applicability for methodological reviews vs. intervention studies
15Certainty assessmentSection 2.7 “Assessment of Evidence Quality”. Adapted approach for methodological research
RESULTS
16Study selectionSection 2.4 + PRISMA flow diagram. Study coverage and selection described including exclusion reasons
17Study characteristicsThroughout Section 3, Section 4, Section 5, Section 6 and Section 7, Table 1. Studies characterized by methodology and applications
18Risk of bias in studiesIndividual study quality assessment not explicitly presented.
19Results of individual studiesThroughout Section 3, Section 4, Section 5, Section 6 and Section 7. Focus on methodological contributions rather than effect estimates (appropriate for review type)
20Results of synthesesTable 1 and Table 2, throughout Results. Synthesis of methodological approaches, applications, and emerging areas
21Reporting biasesBriefly acknowledged in Limitations. Less critical to methodological reviews
22Certainty of evidenceSection 4. Assessment of strength of evidence for different methodological approaches
DISCUSSION
23DiscussionSection 8, “Conclusions”. Comprehensive interpretation of findings in road safety research context
24LimitationsAbstract mentions of “methodological heterogeneity” and “geographic bias”. Section 7 discusses research–practice gaps
25ConclusionsSection 7, “Future Research Directions”. Clear conclusions about methodological evolution and future directions
OTHER INFORMATION
26Registration and protocolStatement added to the beginning of Section 2 that review was not prospectively registered with justification
27SupportAbstract states “This research received no external funding”. Funding section in manuscript template

References

  1. Curry, P.; Ramaiah, R.; Vavilala, M.S. Current trends and update on injury prevention. Int. J. Crit. Illn. Inj. Sci. 2011, 1, 57–65. [Google Scholar] [CrossRef] [PubMed]
  2. Qu, F.; Dang, N.; Furht, B.; Nojoumian, M. Comprehensive study of driver behavior monitoring systems using computer vision and machine learning techniques. J. Big Data 2024, 11, 44. [Google Scholar] [CrossRef]
  3. Nojoumian, M. Active Occupant Status and Vehicle Operational Status Warning System and Methods. U.S. Patent 17/542,807, 9 June 2022. [Google Scholar]
  4. Bhalla, K.; Gleason, K. Effects of vehicle safety design on road traffic deaths, injuries, and public health burden in the Latin American region: A modelling study. Lancet Glob. Health 2020, 8, e819–e828. [Google Scholar] [CrossRef]
  5. Ahmed, I. Road infrastructure and road safety. Transp. Commun. Bull. Asia Pac. 2013, 83, 19–25. [Google Scholar]
  6. Åberg, L. Traffic rules and traffic safety. Saf. Sci. 1998, 29, 205–215. [Google Scholar] [CrossRef]
  7. Rezapour Mashhadi, M.M.; Saha, P.; Ksaibati, K. Impact of traffic enforcement on traffic safety. Int. J. Police Sci. Manag. 2017, 19, 238–246. [Google Scholar] [CrossRef]
  8. Fletcher, A.; McCulloch, K.; Baulk, S.D.; Dawson, D. Countermeasures to driver fatigue: A review of public awareness campaigns and legal approaches. Aust. N. Z. J. Public Health 2005, 29, 471–476. [Google Scholar] [CrossRef]
  9. Delaney, A.; Lough, B.; Whelan, M.; Cameron, M. A Review of Mass Media Campaigns in Road Safety; Monash University Accident Research Centre: Clayton, Australia, 2004; Volume 220, p. 85. [Google Scholar]
  10. Nojoumian, M.; Skaug, L. Road-Risk Awareness System (RAS) in Semi or Fully Autonomous Vehicles. U.S. Patent 19/016,485, 10 January 2025. [Google Scholar]
  11. Nojoumian, M.; Skaug, L. Sun Glare Avoidance System (SAS) in Semi or Fully Autonomous Vehicles. U.S. Patent 19/016,240, 10 January 2025. [Google Scholar]
  12. Mannering, F.L.; Bhat, C.R. Analytic methods in accident research: Methodological frontier and future directions. Anal. Methods Accid. Res. 2014, 1, 1–22. [Google Scholar] [CrossRef]
  13. Page, M.J.; McKenzie, J.E.; Bossuyt, P.M.; Boutron, I.; Hoffmann, T.C.; Mulrow, C.D.; Shamseer, L.; Tetzlaff, J.M.; Akl, E.A.; Brennan, S.E.; et al. The PRISMA 2020 statement: An updated guideline for reporting systematic reviews. BMJ 2021, 372, n71. [Google Scholar] [CrossRef]
  14. Short, J.; Caulfield, B. Record linkage for road traffic injuries in Ireland using police hospital and injury claims data. J. Saf. Res. 2016, 58, 1–14. [Google Scholar] [CrossRef]
  15. Mahajan, V.; Katrakazas, C.; Antoniou, C. Crash Risk Estimation Due to Lane Changing: A Data-Driven Approach Using Naturalistic Data. IEEE Trans. Intell. Transp. Syst. 2022, 23, 3756–3765. [Google Scholar] [CrossRef]
  16. Wang, X.; Liu, Q.; Guo, F.; Fang, S.; Xu, X.; Chen, X. Causation analysis of crashes and near crashes using naturalistic driving data. Accid. Anal. Prev. 2022, 177, 106821. [Google Scholar] [CrossRef] [PubMed]
  17. Ali, Y.; Haque, M.M.; Mannering, F. A Bayesian generalised extreme value model to estimate real-time pedestrian crash risks at signalised intersections using artificial intelligence-based video analytics. Anal. Methods Accid. Res. 2023, 38, 100264. [Google Scholar] [CrossRef]
  18. Pinals, L.; Kerin, A.; Van Alsten, C.; Sharp, R.; Madden, S. Telematics-Enabled Usage-Based Insurance (UBI) and Its Impact on Driving Behavior. 2023. Available online: https://m.cmtelematics.com/hubfs/CMT%20Study%20-%20UBI%20Engagement%20Impact.pdf (accessed on 22 June 2023).
  19. Fix, R.; Wilkinson, C.; Siegmund, G. Comparing Event Data Recorder Data (EDR) in Front/Rear Collisions from the Crash Investigation Sampling System (CISS) Database; Technical Report 2024-01-2892, SAE Technical Paper; SAE International: Warrendale, PA, USA, 2024. [Google Scholar] [CrossRef]
  20. Watson, A.; Watson, B.; Vallmuur, K. Estimating under-reporting of road crash injuries to police using multiple linked data collections. Accid. Anal. Prev. 2015, 83, 18–25. [Google Scholar] [CrossRef]
  21. Miler, M.; Todić, F.; Ševrović, M. Extracting accurate location information from a highly inaccurate traffic accident dataset: A methodology based on a string matching technique. Transp. Res. Part Emerg. Technol. 2016, 68, 185–193. [Google Scholar] [CrossRef]
  22. Imprialou, M.; Quddus, M. Crash data quality for road safety research: Current state and future directions. Accid. Anal. Prev. 2019, 130, 84–90. [Google Scholar] [CrossRef]
  23. Transportstyrelsen (Swedish Transport Agency). Om Strada (About STRADA). Available online: https://www.transportstyrelsen.se/sv/vagtrafik/statistik/olycksstatistik/om-strada/ (accessed on 17 June 2025).
  24. Lombardi, L.R.; Pfeiffer, M.R.; Metzger, K.B.; Myers, R.K.; Curry, A.E. Improving identification of crash injuries: Statewide integration of hospital discharge and crash report data. Traffic Inj. Prev. 2022, 23 (Suppl. S1), S130–S136. [Google Scholar] [CrossRef]
  25. Janstrup, K.H.; Kaplan, S.; Hels, T.; Lauritsen, J.; Prato, C.G. Understanding traffic crash under-reporting: Linking police and medical records to individual and crash characteristics. Traffic Inj. Prev. 2016, 17, 580–584. [Google Scholar] [CrossRef]
  26. Burdett, B.; Bill, A.; Noyce, D. Evaluation of Law Enforcement Agency Injury Severity Assessments. Transp. Res. Rec. 2022, 2676, 246–255. [Google Scholar] [CrossRef]
  27. Li, J.; Li, C.; Zhao, X. Optimizing crash risk models for freeway segments: A focus on the heterogeneous effects of road geometric design features, traffic operation status, and crash units. Accid. Anal. Prev. 2024, 205, 107665. [Google Scholar] [CrossRef]
  28. Mannering, F.L.; Shankar, V.; Bhat, C.R. Unobserved heterogeneity and the statistical analysis of highway accident data. Anal. Methods Accid. Res. 2016, 11, 1–16. [Google Scholar] [CrossRef]
  29. Redwan Shabab, K.; Bhowmik, T.; Zaki, M.H.; Eluru, N. A systematic unified approach for addressing temporal instability in road safety analysis. Anal. Methods Accid. Res. 2024, 43, 100335. [Google Scholar] [CrossRef]
  30. Chang, L.Y.; Mannering, F.L. Predicting Vehicle Occupancies from Accident Data: An Accident Severity Approach. Transp. Res. Rec. 1998, 1635, 93–104. [Google Scholar] [CrossRef]
  31. Yasmin, S.; Eluru, N.; Haque, M.M. Addressing endogeneity in modeling speed enforcement, crash risk and crash severity simultaneously. Anal. Methods Accid. Res. 2022, 36, 100242. [Google Scholar] [CrossRef]
  32. Haddon, W.J. A Logical Framework for Categorizing Highway Safety Phenomena and Activity. J. Trauma Inj. Infect. Crit. Care 1972, 12, 193–207. [Google Scholar] [CrossRef]
  33. Hagenzieker, M.P.; Commandeur, J.J.; Bijleveld, F.D. The history of road safety research: A quantitative approach. Transp. Res. Part Traffic Psychol. Behav. 2014, 25, 150–162. [Google Scholar] [CrossRef]
  34. Cafiso, S.; Graziano, A.D.; Silvestro, G.D.; Cava, G.L.; Persaud, B. Development of comprehensive accident models for two-lane rural highways using exposure, geometry, consistency and context variables. Accid. Anal. Prev. 2010, 42, 1072–1079. [Google Scholar] [CrossRef]
  35. Aguero-Valverde, J.; Jovanis, P.P. Spatial analysis of fatal and injury crashes in Pennsylvania. Accid. Anal. Prev. 2006, 38, 618–625. [Google Scholar] [CrossRef]
  36. Aguero-Valverde, J.; Jovanis, P.P. Analysis of Road Crash Frequency with Spatial Models. Transp. Res. Rec. 2008, 2061, 55–63. [Google Scholar] [CrossRef]
  37. Aguero-Valverde, J.; Jovanis, P.P. Bayesian Multivariate Poisson Lognormal Models for Crash Severity Modeling and Site Ranking. Transp. Res. Rec. 2009, 2136, 82–91. [Google Scholar] [CrossRef]
  38. Chiou, Y.C.; Fu, C. Modeling crash frequency and severity using multinomial-generalized Poisson model with error components. Accid. Anal. Prev. 2013, 50, 73–82. [Google Scholar] [CrossRef] [PubMed]
  39. Chiou, Y.C.; Fu, C.; Chih-Wei, H. Incorporating spatial dependence in simultaneously modeling crash frequency and severity. Anal. Methods Accid. Res. 2014, 2, 1–11. [Google Scholar] [CrossRef]
  40. Bonneson, J.A.; Pratt, M.P. Procedure for Developing Accident Modification Factors from Cross-Sectional Data. Transp. Res. Rec. 2008, 2083, 40–48. [Google Scholar] [CrossRef]
  41. Iranitalab, A.; Khattak, A. Comparison of four statistical and machine learning methods for crash severity prediction. Accid. Anal. Prev. 2017, 108, 27–36. [Google Scholar] [CrossRef]
  42. Xu, P.; Huang, H. Modeling crash spatial heterogeneity: Random parameter versus geographically weighting. Accid. Anal. Prev. 2015, 75, 16–25. [Google Scholar] [CrossRef]
  43. Wang, X.; Zhang, X.; Pei, Y. A systematic approach to macro-level safety assessment and contributing factors analysis considering traffic crashes and violations. Accid. Anal. Prev. 2024, 194, 107323. [Google Scholar] [CrossRef]
  44. Jones, A.P.; Jørgensen, S.H. The use of multilevel models for the prediction of road accident outcomes. Accid. Anal. Prev. 2003, 35, 59–69. [Google Scholar] [CrossRef]
  45. Anastasopoulos, P.C.; Mannering, F.L. A note on modeling vehicle accident frequencies with random-parameters count models. Accid. Anal. Prev. 2009, 41, 153–159. [Google Scholar] [CrossRef]
  46. Mahmud, S.S.; Ferreira, L.; Hoque, M.S.; Tavassoli, A. Using a surrogate safety approach to prioritize hazardous segments in a rural highway in a developing country. IATSS Res. 2020, 44, 132–141. [Google Scholar] [CrossRef]
  47. Zhang, C.; He, J.; King, M.; Liu, Z.; Chen, Y.; Yan, X.; Xing, L.; Zhang, H. A crash risk identification method for freeway segments with horizontal curvature based on real-time vehicle kinetic response. Accid. Anal. Prev. 2021, 150, 105911. [Google Scholar] [CrossRef]
  48. Abdel-Aty, M.; Keller, J. Exploring the overall and specific crash severity levels at signalized intersections. Accid. Anal. Prev. 2005, 37, 417–425. [Google Scholar] [CrossRef] [PubMed]
  49. Abay, K.A. Examining pedestrian-injury severity using alternative disaggregate models. Res. Transp. Econ. 2013, 43, 123–136. [Google Scholar] [CrossRef]
  50. Castro, M.; Paleti, R.; Bhat, C.R. A latent variable representation of count data models to accommodate spatial and temporal dependence: Application to predicting crash frequency at intersections. Transp. Res. Part Methodol. 2012, 46, 253–272. [Google Scholar] [CrossRef]
  51. Ahmed, M.; Huang, H.; Abdel-Aty, M.; Guevara, B. Exploring a Bayesian hierarchical approach for developing safety performance functions for a mountainous freeway. Accid. Anal. Prev. 2011, 43, 1581–1589. [Google Scholar] [CrossRef]
  52. Zheng, X.; Zhang, D.; Gao, H.; Zhao, Z.; Huang, H.; Wang, J. A Novel Framework for Road Traffic Risk Assessment with HMM-Based Prediction Model. Sensors 2018, 18, 4313. [Google Scholar] [CrossRef]
  53. Lord, D.; Mannering, F. The statistical analysis of crash-frequency data: A review and assessment of methodological alternatives. Transp. Res. Part A Policy Pract. 2010, 44, 291–305. [Google Scholar] [CrossRef]
  54. Al-Ghamdi, A.S. Using logistic regression to estimate the influence of accident factors on accident severity. Accid. Anal. Prev. 2002, 34, 729–741. [Google Scholar] [CrossRef]
  55. Saeed, T.U.; Hall, T.; Baroud, H.; Volovski, M.J. Analyzing road crash frequencies with uncorrelated and correlated random-parameters count models: An empirical assessment of multilane highways. Anal. Methods Accid. Res. 2019, 23, 100101. [Google Scholar] [CrossRef]
  56. Anastasopoulos, P.C.; Mannering, F.L.; Shankar, V.N.; Haddock, J.E. A study of factors affecting highway accident rates using the random-parameters tobit model. Accid. Anal. Prev. 2012, 45, 628–633. [Google Scholar] [CrossRef]
  57. Aziz, H.A.; Ukkusuri, S.V.; Hasan, S. Exploring the determinants of pedestrian–vehicle crash severity in New York City. Accid. Anal. Prev. 2013, 50, 1298–1309. [Google Scholar] [CrossRef]
  58. Anastasopoulos, P.C.; Tarko, A.P.; Mannering, F.L. Tobit analysis of vehicle accident rates on interstate highways. Accid. Anal. Prev. 2008, 40, 768–775. [Google Scholar] [CrossRef] [PubMed]
  59. Castro, M.; Paleti, R.; Bhat, C.R. A spatial generalized ordered response model to examine highway crash injury severity. Accid. Anal. Prev. 2013, 52. [Google Scholar] [CrossRef] [PubMed]
  60. Chen, W.H.; Jovanis, P.P. Method for Identifying Factors Contributing to Driver-Injury Severity in Traffic Crashes. Transp. Res. Rec. 2000, 1717, 1–9. [Google Scholar] [CrossRef]
  61. Bijleveld, F. The covariance between the number of accidents and the number of victims in multivariate analysis of accident related outcomes. Accid. Anal. Prev. 2005, 37, 591–600. [Google Scholar] [CrossRef]
  62. Bhat, C.R.; Dubey, S.K. A new estimation approach to integrate latent psychological constructs in choice modeling. Transp. Res. Part B Methodol. 2014, 67, 68–85. [Google Scholar] [CrossRef]
  63. Bhat, C.R.; Born, K.; Sidharthan, R.; Bhat, P.C. A count data model with endogenous covariates: Formulation and application to roadway crash frequency at intersections. Anal. Methods Accid. Res. 2014, 1, 53–71. [Google Scholar] [CrossRef]
  64. Abdelwahab, H.T.; Abdel-Aty, M.A. Development of Artificial Neural Network Models to Predict Driver Injury Severity in Traffic Accidents at Signalized Intersections. Transp. Res. Rec. 2001, 1746, 6–13. [Google Scholar] [CrossRef]
  65. Chiou, Y.C.; Lan, L.W.; Chen, W.P. A two-stage mining framework to explore key risk conditions on one-vehicle crash severity. Accid. Anal. Prev. 2013, 50, 405–415. [Google Scholar] [CrossRef]
  66. Wu, W.; Jiang, S.; Liu, R.; Jin, W.; Ma, C. Economic development, demographic characteristics, road network and traffic accidents in Zhongshan, China: Gradient boosting decision tree model. Transp. A Transp. Sci. 2020, 16, 359–387. [Google Scholar] [CrossRef]
  67. Li, P.; Abdel-Aty, M.; Yuan, J. Real-time crash risk prediction on arterials based on LSTM-CNN. Accid. Anal. Prev. 2020, 135, 105371. [Google Scholar] [CrossRef]
  68. Adjenughwure, K.; Klunder, G.; Hogema, J.; der Horst, R.V. Monte Carlo-Based Microsimulation Approach for Estimating the Collision Probability of Real Traffic Conflicts. Transp. Res. Rec. 2023, 2677, 314–326. [Google Scholar] [CrossRef]
  69. Abay, K.A.; Paleti, R.; Bhat, C.R. The joint analysis of injury severity of drivers in two-vehicle crashes accommodating seat belt use endogeneity. Transp. Res. Part Methodol. 2013, 50, 74–89. [Google Scholar] [CrossRef]
  70. Altwaijri, S.; Quddus, M.; Bristow, A. Analysing the Severity and Frequency of Traffic Crashes in Riyadh City Using Statistical Models. Int. J. Transp. Sci. Technol. 2012, 1, 351–364. [Google Scholar] [CrossRef]
  71. Abbas, K.A. Traffic safety assessment and development of predictive models for accidents on rural roads in Egypt. Accid. Anal. Prev. 2004, 36, 149–163. [Google Scholar] [CrossRef]
  72. Jahan, M.I.; Bhowmik, T.; Eluru, N. Enhanced Aggregate Framework to Model Crash Frequency by Accommodating Zero Crashes by Crash Type. Transp. Res. Rec. 2024, 2678, 506–519. [Google Scholar] [CrossRef]
  73. Papadimitriou, E.; Filtness, A.; Theofilatos, A.; Ziakopoulos, A.; Quigley, C.; Yannis, G. Review and ranking of crash risk factors related to the road infrastructure. Accid. Anal. Prev. 2019, 125, 85–97. [Google Scholar] [CrossRef]
  74. Wu, P.; Song, L.; Meng, X. Influence of built environment and roadway characteristics on the frequency of vehicle crashes caused by driver inattention: A comparison between rural roads and urban roads. J. Saf. Res. 2021, 79, 199–210. [Google Scholar] [CrossRef]
  75. Moslem, S.; Farooq, D.; Ghorbanzadeh, O.; Blaschke, T. Application of the AHP–BWM Model for Evaluating Driver Behavior Factors Related to Road Safety: A Case Study for Budapest. Symmetry 2020, 12, 243. [Google Scholar] [CrossRef]
  76. Farooq, D.; Moslem, S.; Jamal, A.; Butt, F.M.; Almarhabi, Y.; Faisal Tufail, R.; Almoshaogeh, M. Assessment of Significant Factors Affecting Frequent Lane-Changing Related to Road Safety: An Integrated Approach of the AHP–BWM Model. Int. J. Environ. Res. Public Health 2021, 18, 10628. [Google Scholar] [CrossRef]
  77. Retting, R.A.; Weinstein, H.B.; Solomon, M.G. Analysis of motor-vehicle crashes at stop signs in four U.S. cities. J. Saf. Res. 2003, 34, 485–489. [Google Scholar] [CrossRef]
  78. Boroujerdian, A.M.; Saffarzadeh, M.; Yousefi, H.; Ghassemian, H. A model to identify high crash road segments with the dynamic segmentation method. Accid. Anal. Prev. 2014, 73, 274–287. [Google Scholar] [CrossRef] [PubMed]
  79. Amoros, E.; Martin, J.; Laumon, B. Comparison of road crashes incidence and severity between some French counties. Accid. Anal. Prev. 2003, 35, 537–547. [Google Scholar] [CrossRef]
  80. Bonneson, J.A.; Mccoy, P.T. ESTIMATION OF SAFETY AT TWO-WAY STOP-CONTROLLED INTERSECTIONS ON RURAL HIGHWAYS. In Transportation Research Record No. 1401: Highway and Traffic Safety and Accident Research, Management, and Issues; Transportation Research Board: Washington, DC, USA, 1993. [Google Scholar]
  81. Abuzwidah, M.; Abdel-Aty, M. Crash risk analysis of different designs of toll plazas. Saf. Sci. 2018, 107, 77–84. [Google Scholar] [CrossRef]
  82. Feknssa, N.; Venkataraman, N.; Shankar, V.; Ghebrab, T. Unobserved heterogeneity in ramp crashes due to alignment, interchange geometry and truck volume: Insights from a random parameter model. Anal. Methods Accid. Res. 2023, 37, 100254. [Google Scholar] [CrossRef]
  83. Carson, J.; Mannering, F. The effect of ice warning signs on ice-accident frequencies and severities. Accid. Anal. Prev. 2001, 33, 99–109. [Google Scholar] [CrossRef]
  84. Chen, E.; Tarko, A.P. Modeling safety of highway work zones with random parameters and random effects models. Anal. Methods Accid. Res. 2014, 1, 86–95. [Google Scholar] [CrossRef]
  85. van Petegem, J.J.H.; Wegman, F. Analyzing road design risk factors for run-off-road crashes in the Netherlands with crash prediction models. J. Saf. Res. 2014, 49, 121.e1–127. [Google Scholar] [CrossRef]
  86. Kwon, J.; Varaiya, P. Effectiveness of California’s High Occupancy Vehicle (HOV) system. Transp. Res. Part C Emerg. Technol. 2008, 16, 98–115. [Google Scholar] [CrossRef]
  87. Austin, R.A.; Faigin, B.M. Effect of vehicle and crash factors on older occupants. J. Saf. Res. 2003, 34, 441–452. [Google Scholar] [CrossRef]
  88. Brüde, U.; Larsson, J. Models for predicting accidents at junctions where pedestrians and cyclists are involved. How well do they fit? Accid. Anal. Prev. 1993, 25, 499–509. [Google Scholar] [CrossRef]
  89. Abdel-Aty, M.; Abdelwahab, H. Modeling rear-end collisions including the role of driver’s visibility and light truck vehicles using a nested logit structure. Accid. Anal. Prev. 2004, 36, 447–456. [Google Scholar] [CrossRef] [PubMed]
  90. Ballesteros, M.F.; Dischinger, P.C.; Langenberg, P. Pedestrian injuries and vehicle type in Maryland, 1995–1999. Accid. Anal. Prev. 2004, 36, 73–81. [Google Scholar] [CrossRef] [PubMed]
  91. Chang, H.L.; Yeh, T.H. Risk Factors to Driver Fatalities in Single-Vehicle Crashes: Comparisons between Non-Motorcycle Drivers and Motorcyclists. J. Transp. Eng. 2006, 132, 227–236. [Google Scholar] [CrossRef]
  92. Bédard, M.; Guyatt, G.H.; Stones, M.J.; Hirdes, J.P. The independent contribution of driver, crash, and vehicle characteristics to driver fatalities. Accid. Anal. Prev. 2002, 34, 717–727. [Google Scholar] [CrossRef]
  93. Benfield, J.A.; Szlemko, W.J.; Bell, P.A. Driver personality and anthropomorphic attributions of vehicle personality relate to reported aggressive driving tendencies. Personal. Individ. Differ. 2007, 42, 247–258. [Google Scholar] [CrossRef]
  94. Bhat, C.R.; Eluru, N. A copula-based approach to accommodate residential self-selection effects in travel behavior modeling. Transp. Res. Part B Methodol. 2009, 43, 749–765. [Google Scholar] [CrossRef]
  95. Hasan, A.S.; Jalayer, M.; Heitmann, E.; Weiss, J. Distracted Driving Crashes: A Review on Data Collection, Analysis, and Crash Prevention Methods. Transp. Res. Rec. 2022, 2676, 423–434. [Google Scholar] [CrossRef]
  96. Thabit, A.S.; Kerrache, C.A.; Calafate, C.T. A survey on monitoring and management techniques for road traffic congestion in vehicular networks. ICT Express 2024, 10, 1186–1198. [Google Scholar] [CrossRef]
  97. de Souza, A.M.; Brennand, C.A.; Yokoyama, R.S.; Donato, E.A.; Madeira, E.R.; Villas, L.A. Traffic management systems: A classification, review, challenges, and future perspectives. Int. J. Distrib. Sens. Netw. 2017, 13, 1550147716683612. [Google Scholar] [CrossRef]
  98. Mandal, V.; Mussah, A.R.; Jin, P.; Adu-Gyamfi, Y. Artificial Intelligence-Enabled Traffic Monitoring System. Sustainability 2020, 12, 9177. [Google Scholar] [CrossRef]
  99. Milanes, V.; Villagra, J.; Godoy, J.; Simo, J.; Perez, J.; Onieva, E. An Intelligent V2I-Based Traffic Management System. IEEE Trans. Intell. Transp. Syst. 2012, 13, 49–58. [Google Scholar] [CrossRef]
  100. Høye, A. Are airbags a dangerous safety measure? A meta-analysis of the effects of frontal airbags on driver fatalities. Accid. Anal. Prev. 2010, 42, 2030–2040. [Google Scholar] [CrossRef] [PubMed]
  101. Kusano, K.D.; Gabler, H.C. Safety Benefits of Forward Collision Warning, Brake Assist, and Autonomous Braking Systems in Rear-End Collisions. IEEE Trans. Intell. Transp. Syst. 2012, 13, 1546–1555. [Google Scholar] [CrossRef]
  102. Ding, S.; Abdel-Aty, M.; Barbour, N.; Wang, D.; Wang, Z.; Zheng, O. Exploratory analysis of injury severity under different levels of driving automation (SAE Levels 2 and 4) using multi-source data. Accid. Anal. Prev. 2024, 206, 107692. [Google Scholar] [CrossRef]
  103. Malin, F.; Norros, I.; Innamaa, S. Accident risk of road and weather conditions on different road types. Accid. Anal. Prev. 2019, 122, 181–188. [Google Scholar] [CrossRef]
  104. Bullough, J.D.; Donnell, E.T.; Rea, M.S. To illuminate or not to illuminate: Roadway lighting as it affects traffic safety at intersections. Accid. Anal. Prev. 2013, 53, 65–77. [Google Scholar] [CrossRef]
  105. Zhang, X.; Wen, H.; Yamamoto, T.; Zeng, Q. Investigating hazardous factors affecting freeway crash injury severity incorporating real-time weather data: Using a Bayesian multinomial logit model with conditional autoregressive priors. J. Saf. Res. 2021, 76, 248–255. [Google Scholar] [CrossRef]
  106. Cohen, A.; Einav, L. The Effects of Mandatory Seat Belt Laws on Driving Behavior and Traffic Fatalities. Rev. Econ. Stat. 2003, 85, 828–843. [Google Scholar] [CrossRef]
  107. Zheng, L.; Sayed, T. Application of Extreme Value Theory for Before-After Road Safety Analysis. Transp. Res. Rec. 2019, 2673, 1001–1010. [Google Scholar] [CrossRef]
  108. Yanmaz-Tuzel, O.; Ozbay, K. A comparative Full Bayesian before-and-after analysis and application to urban road safety countermeasures in New Jersey. Accid. Anal. Prev. 2010, 42, 2099–2107. [Google Scholar] [CrossRef]
  109. Ziakopoulos, A.; Yannis, G. A review of spatial approaches in road safety. Accid. Anal. Prev. 2020, 135, 105323. [Google Scholar] [CrossRef] [PubMed]
  110. Niroumand, R.; Tajalli, M.; Hajibabai, L.; Hajbabaie, A. Joint optimization of vehicle-group trajectory and signal timing: Introducing the white phase for mixed-autonomy traffic stream. Transp. Res. Part C Emerg. Technol. 2020, 116, 102659. [Google Scholar] [CrossRef]
  111. Afghari, A.P.; Haque, M.M.; Washington, S. Applying a joint model of crash count and crash severity to identify road segments with high risk of fatal and serious injury crashes. Accid. Anal. Prev. 2020, 144, 105615. [Google Scholar] [CrossRef]
  112. American Association of State Highway and Transportation Officials (AASHTO). Highway Safety Manual. n.d. Available online: https://www.highwaysafetymanual.org (accessed on 17 June 2025).
  113. Hauer, E.; Harwood, D.W.; Council, F.M.; Griffith, M.S. Estimating Safety by the Empirical Bayes Method: A Tutorial. Transp. Res. Rec. 2002, 1784, 126–131. [Google Scholar] [CrossRef]
  114. Powers, M.; Carson, J. Before-After Crash Analysis: A Primer for Using the Empirical Bayes Method; Final Report FHWA/MT-04-002/8117-21; Montana State University, Department of Civil Engineering, Montana Department of Transportation, U.S. Department of Transportation, Federal Highway Administration: Bozeman, MT, USA, 2004. [Google Scholar] [CrossRef]
  115. Persaud, B.; Lyon, C. Empirical Bayes before–after safety studies: Lessons learned from two decades of experience and future directions. Accid. Anal. Prev. 2007, 39, 546–555. [Google Scholar] [CrossRef]
  116. Hauer, E. Overdispersion in modelling accidents on road sections and in Empirical Bayes estimation. Accid. Anal. Prev. 2001, 33, 799–808. [Google Scholar] [CrossRef]
  117. Elvik, R. The predictive validity of empirical Bayes estimates of road safety. Accid. Anal. Prev. 2008, 40, 1964–1969. [Google Scholar] [CrossRef]
  118. Park, J.; Abdel-Aty, M.; Lee, J. Use of empirical and full Bayes before–after approaches to estimate the safety effects of roadside barriers with different crash conditions. J. Saf. Res. 2016, 58, 31–40. [Google Scholar] [CrossRef]
  119. Bougna, T.; Hundal, G.; Taniform, P. Quantitative Analysis of the Social Costs of Road Traffic Crashes Literature. Accid. Anal. Prev. 2022, 165, 106282. [Google Scholar] [CrossRef]
  120. Wijnen, W.; Weijermars, W.; Schoeters, A.; van den Berghe, W.; Bauer, R.; Carnis, L.; Elvik, R.; Martensen, H. An analysis of official road crash cost estimates in European countries. Saf. Sci. 2019, 113, 318–327. [Google Scholar] [CrossRef]
  121. Zaloshnja, E.; Miller, T.; Council, F.; Persaud, B. Crash costs in the United States by crash geometry. Accid. Anal. Prev. 2006, 38, 644–651. [Google Scholar] [CrossRef] [PubMed]
  122. Pirdavani, A.; Brijs, T.; Bellemans, T.; Kochan, B.; Wets, G. Evaluating the road safety effects of a fuel cost increase measure by means of zonal crash prediction modeling. Accid. Anal. Prev. 2013, 50, 186–195. [Google Scholar] [CrossRef] [PubMed]
  123. Ahmed, S.S.; Pantangi, S.S.; Eker, U.; Fountas, G.; Still, S.E.; Anastasopoulos, P.C. Analysis of safety benefits and security concerns from the use of autonomous vehicles: A grouped random parameters bivariate probit approach with heterogeneity in means. Anal. Methods Accid. Res. 2020, 28, 100134. [Google Scholar] [CrossRef]
  124. Boggs, A.M.; Wali, B.; Khattak, A.J. Exploratory analysis of automated vehicle crashes in California: A text analytics & hierarchical Bayesian heterogeneity-based approach. Accid. Anal. Prev. 2020, 135, 105354. [Google Scholar] [CrossRef]
  125. Chang, X.; Li, H.; Rong, J.; Zhao, X.; Li, A. Analysis on traffic stability and capacity for mixed traffic flow with platoons of intelligent connected vehicles. Phys. A Stat. Mech. Its Appl. 2020, 557, 124829. [Google Scholar] [CrossRef]
  126. OECD. Road Accidents (Indicator). 2023. Available online: https://www.oecd.org/en/data/indicators/road-accidents.html (accessed on 6 July 2023).
  127. Huang, T.; Wang, S.; Sharma, A. Highway crash detection and risk estimation using deep learning. Accid. Anal. Prev. 2020, 135, 105392. [Google Scholar] [CrossRef]
  128. Zhang, Z.; Nie, Q.; Liu, J.; Hainen, A.; Islam, N.; Yang, C. Machine learning based real-time prediction of freeway crash risk using crowdsourced probe vehicle data. J. Intell. Transp. Syst. 2024, 28, 84–102. [Google Scholar] [CrossRef]
  129. Esenturk, E.; Wallace, A.G.; Khastgir, S.; Jennings, P. Identification of Traffic Accident Patterns via Cluster Analysis and Test Scenario Development for Autonomous Vehicles. IEEE Access 2022, 10, 6660–6675. [Google Scholar] [CrossRef]
  130. Cambridge Mobile Telematics. Distracted Driving Report; Technical report; Cambridge Mobile Telematics: Cambridge, MA, USA, 2023; Available online: https://www.cmtelematics.com/press/distracted-driving-report-2023/ (accessed on 17 June 2025).
  131. Arity. Distracted Driving Trends Report; Technical report; Arity: Chicago, IL, USA, 2023; Available online: https://www.arity.com/distracted-driving/ (accessed on 17 June 2025).
  132. National Highway Traffic Safety Administration. Distracted Driving 2022; Research Note DOT HS 813 382; National Highway Traffic Safety Administration: Washington, DC, USA, 2022. Available online: https://crashstats.nhtsa.dot.gov/Api/Public/ViewPublication/813382 (accessed on 17 June 2025).
  133. Yuan, J.; Abdel-Aty, M.; Gong, Y.; Cai, Q. Real-Time Crash Risk Prediction using Long Short-Term Memory Recurrent Neural Network. Transp. Res. Rec. 2019, 2673, 314–326. [Google Scholar] [CrossRef]
  134. Lim, B.; Arık, S.O.; Loeff, N.; Pfister, T. Temporal Fusion Transformers for interpretable multi-horizon time series forecasting. Int. J. Forecast. 2021, 37, 1748–1764. [Google Scholar] [CrossRef]
  135. Han, L.; Abdel-Aty, M.; Yu, R.; Wang, C. LSTM + Transformer Real-Time Crash Risk Evaluation Using Traffic Flow and Risky Driving Behavior Data. IEEE Trans. Intell. Transp. Syst. 2024, 25, 18383–18395. [Google Scholar] [CrossRef]
  136. Park, C.; Nojoumian, M. Social Acceptability of Autonomous Vehicles: Unveiling Correlation of Passenger Trust and Emotional Response. In Proceedings of the 4th International Conference on HCI in Mobility, Transport and Automotive Systems (MobiTAS); Springer International Publishing: Cham, Switzerland, 2022; LNCS 13335; pp. 402–415. [Google Scholar]
  137. Craig, J.; Nojoumian, M. Should Self-Driving Cars Mimic Human Driving Behaviors? In Proceedings of the 3rd International Conference on HCI in Mobility, Transport and Automotive Systems (MobiTAS), Virtual, 24–29 July 2021; LNCS 12791. pp. 213–225. [Google Scholar]
  138. Shahrdar, S.; Park, C.; Nojoumian, M. Human Trust Measurement Using an Immersive Virtual Reality Autonomous Vehicle Simulator. In Proceedings of the 2nd AAAI/ACM Conference on AI, Ethics, and Society (AIES), Honolulu, HI, USA, 27–28 January 2019; pp. 515–520. [Google Scholar] [CrossRef]
  139. Shahrdar, S.; Menezes, L.; Nojoumian, M. A Survey on Trust in Autonomous Systems. In Proceedings of the 2018 Computing Conference (Science and Information Conference); Springer: Cham, Switzerland, 2018; Volume 857, pp. 368–386. [Google Scholar]
  140. Nojoumian, M. Adaptive Speed-Limit Measurement (ASM) Based on the Traffic Flow in Semi or Fully Autonomous Vehicles. U.S. Patent 63/631,090, 8 April 2024. [Google Scholar]
  141. Nojoumian, M. Safety Self Talks (SST) by Large Language Models in Semi or Fully Autonomous Vehicles. U.S. Patent 63/747,463, 21 January 2025. [Google Scholar]
  142. McCarty, D.; Kim, H.W. Risky behaviors and road safety: An exploration of age and gender influences on road accident rates. PLoS ONE 2024, 19, e0296663. [Google Scholar] [CrossRef] [PubMed]
  143. Gu, Z.; Peng, B.; Xin, Y. Higher traffic crash risk in extreme hot days? A spatiotemporal examination of risk factors and influencing features. Int. J. Disaster Risk Reduct. 2025, 116, 105045. [Google Scholar] [CrossRef]
Figure 1. PRISMA 2020 flow diagram. Records identified through database searching and citation searching.
Applsci 15 07115 g001
Figure 2. Common sources of crash data, categorized by traditional and emerging methods.
Applsci 15 07115 g002
Figure 3. Categories of data quality issues in crash analysis, grouped by collection and analysis challenges.
Applsci 15 07115 g003
Figure 4. Injury reporting sources in Sweden’s STRADA system.
Applsci 15 07115 g004
Figure 5. The development of crash analysis over time.
Applsci 15 07115 g005
Figure 6. Infrastructure and design domain with its subcategories and example topics.
Applsci 15 07115 g006
Figure 7. Road user categories and associated safety topics.
Applsci 15 07115 g007
Figure 8. Technology-based safety systems: management and in-vehicle features.
Applsci 15 07115 g008
Figure 9. Factors affecting crash risk including weather and visibility.
Applsci 15 07115 g009
Figure 10. Comparison of motor vehicle fatalities per 100,000 inhabitants between the United States and the United Kingdom (1994–2022). Data source: [126].
Applsci 15 07115 g010
Table 1. Consolidated analysis of methodological approaches in crash research.
Methodological ApproachKey CharacteristicsReferences
Generalized Linear Modeling (GLM)Identification of three models with varying variables such as exposure, AADT, driveway density, curvature ratio, and roadside hazard rating. Limited to specific road section data; may not generalize to all road types. [34]
Full Bayes (FB) hierarchical modelsFB models better account for spatial correlation, showing higher accuracy in injury crash prediction compared with negative-binomial models. Complexity in implementing FB models at large scale due to computational demand. It was found that spatial correlation structures like first-order adjacency improve fit and reduce bias in parameter estimates. [35,36]
Bayesian multivariate modelsMultivariate Poisson lognormal approach enhances precision in crash-frequency estimates across severity levels. May require extensive data to calibrate the model effectively. [37]
Multinomial Generalized Poisson (MGP)MGP model with error components showed superior fit in analyzing crash frequency and severity together. Spatial exogenous-EMGP model best captures spatial dependencies in crash data. Complexity in interpreting factors contributing to both frequency and severity. Model complexity increases with alternative spatial structures. [38,39]
Accident modification factors (AMFs)Curve radius AMFs derived for Texas showed higher crash risks on curves. Variability in intersection data may impact AMF accuracy. [40]
Statistical and machine learning methodsNearest-Neighbor Classification (NNC) had the best predictive performance; K-means clustering improved model performance; latent class clustering lowered NNC performance. Results may vary by method. [41]
Spatial–geographic modelsRandom-parameter negative-binomial (RPNB) and S-GWPR models. S-GWPR model better captures spatial heterogeneity and crash data correlation, improving regional crash modeling; requires high spatial granularity data; and may not apply to broader regions. [42]
Statistical modelingBivariate negative-binomial spatial models; multilevel models; Full Bayes models; logistic regression; multivariate tobit models; comparative analysis with Generalized Linear Models. [34,43,44]
Random-parameter modelsAccount for heterogeneity; handle unobserved elements; incorporate correlated parameters; use instrumental variables. [31,45]
Surrogate safety measuresTraffic conflict techniques; in-vehicle data analysis; kinetic parameters for risk assessment [46,47]
Injury severity analysisOrdered probit models; neural networks; multivariate probit models; flexible econometric structures. [48,49]
Real-time risk predictionBayesian hierarchical models; temporal–spatial dependencies; weather and geometry factors. [50,51]
Connected/autonomous vehiclesHMM prediction methods; time-varying risk maps; real-time assessment. [52]
Table 2. Evolution and applications of SPFs and CMFs in road safety analysis.
MethodologyKey Contributions and LimitationsReferences
Empirical Bayes (EB)Contributions: Precise estimation in sparse-data settings; corrects regression-to-mean bias.
Limitations: Requires well-calibrated SPFs and overdispersion parameters.
Hauer [113]
EB for infrastructure assessmentContributions: Post-reconstruction safety evaluation (Montana); Excel-based implementation.
Limitations: Needs three-year aggregated crash counts.
Powers & Carson [114]
EB methodology validationContributions: Demonstration of EB’s superiority in CMF derivation.
Limitations: Sensitivity to data quality and underlying EB assumptions.
Persaud & Lyon [115]
Variable overdispersionContributions: Introduction of length-based overdispersion to reduce short-segment bias.
Limitations: Breaking of uniform-parameter assumption; more complex calibration.
Hauer [116]
EB in observational studiesContributions: Lower prediction errors than alternatives; decade-long assessment.
Limitations: Context-specific performance; data-intensive.
Elvik [117]
Advanced Bayesian methodsContributions: Comparison of EB vs. Full Bayes; development of condition-specific CMFs.
Limitations: Higher computational cost; requirement of richer data.
Park et al. [118]
Table 3. Summary of emerging research areas and key findings.
Research AreaKey Methodological Contributions and FindingsReferences
Big Data Analytics and Data MiningTwo-stage mining framework integrating 29 mined rules into mixed logit model; identifies seat belt fastening as most critical safety condition; capture of joint effects of risk factors in single-vehicle freeway crashes.Chiou et al. [65]
Deep Learning and Advanced AI ApplicationsComparative analysis shows simpler models often achieve performance comparable to or better than that of deep models; random forest models are the most effective for crash risk prediction using crowdsourced probe vehicle data.Huang et al. [127];
Zhang et al. [128]
Real-Time Crash Risk PredictionHybrid LSTM-CNN model with parallel structure captures long-term dependencies and local features; it achieves the highest AUC of 0.93, highest sensitivity and the lowest false alarm rate for urban arterial prediction.Li et al. [67]
Connected and Autonomous Vehicle SafetySurvey of 584 U.S. respondents reveals 66–68% expect fewer and less severe crashes; concerns include equipment failure in poor weather (71%), system failures (73%), hacking (68%), and privacy breaches (74%).Ahmed et al. [123]
Autonomous Vehicle Crash Pattern AnalysisCOOLCAT clustering algorithm identifies six distinct accident clusters from UK STATS19 data; a total of 61.1% of AV-including accidents are rear-end collisions; environmental factors like mixed land use and school proximity influence crash propensity.Esenturk et al. [129];
Bogg et al. [124]
Intelligent Connected Vehicle Traffic FlowMixed traffic flow analysis shows ICVs improve stability under critical speeds and enhance traffic capacity; stability degrades when critical speed exceeded; critical speed decreases as maximum platoon size increases.Chang et al. [125]
Disclaimer/Publisher’s Note: The statements, opinions and data contained in all publications are solely those of the individual author(s) and contributor(s) and not of MDPI and/or the editor(s). MDPI and/or the editor(s) disclaim responsibility for any injury to people or property resulting from any ideas, methods, instructions or products referred to in the content.

