Article

Investigation of the Antioxidant and Antimicrobial Properties of Ultrasound-Assisted Extracted Phenolics from Aronia melanocarpa Pomace

by
Iuliana Aprodu
1,
Carmen Lidia Chitescu
2,
Leontina Grigore-Gurgu
1 and
Loredana Dumitrașcu
1,*
1
Faculty of Food Science and Engineering, Dunarea de Jos University of Galati, 111 Domneasca Street, 800201 Galati, Romania
2
Faculty of Medicine and Pharmacy, Dunarea de Jos University of Galati, 35 Al. I. Cuza Street, 800216 Galati, Romania
*
Author to whom correspondence should be addressed.
Appl. Sci. 2025, 15(13), 7070; https://doi.org/10.3390/app15137070
Submission received: 11 May 2025 / Revised: 3 June 2025 / Accepted: 21 June 2025 / Published: 23 June 2025
(This article belongs to the Special Issue Application of Natural Components in Food Production)

Abstract

Black chokeberry (Aronia melanocarpa; BC) pomace represents an excellent source of compounds with health-promoting properties. This study investigated the contribution of ultrasound treatment to the recovery of phenolic compounds in comparison with conventional extraction, using water and ethanol solvents. The ultrasound amplitude was tested between 20% and 60%, for 10 min, with the highest concentrations of total polyphenols and antioxidant activity being measured at a 30% amplitude. Ultrasound treatment was able to reduce the extraction time for the efficient recovery of antioxidants, from 24 h as required in conventional extraction to several minutes while using lower amplitudes. Regardless of the ultrasound extraction conditions, the ethanolic extracts provided higher content of antioxidants compared to water extracts. The chromatographic analysis highlighted the presence of 48 bioactive compounds, including phenolic acids, isoflavones, flavones, flavanones, proanthocyanidins, flavonols and terpenes. BC extracts showed potential to inhibit the growth of Escherichia coli and Staphylococcus aureus. In addition, the potential mechanism associated with the antibacterial activity was revealed after performing molecular docking tests involving, as receptors, essential proteins for the survival and colonization functions of E. coli and S. aureus.

1. Introduction

Nowadays, it is well known that the consumption of fruits and vegetables is essential for a healthy diet [1]. The health benefits are mainly attributed to the content of phenolic compounds, which reduce the likelihood of developing oxidative stress-related diseases [2]. Black chokeberry (Aronia melanocarpa) (BC) is a shrub of the Rosacea family that emerged from North America, being cultivated in Europe mainly in the central and east–south parts as an industrial crop [2,3]. The shiny black fruits can be eaten fresh. However, frequently, they are processed due to the bitter taste and high astringency. These fruits, known as a superfood, have become very popular among consumers focused on diets with health-promoting properties, as they contain some of the highest in vitro antioxidant activity among fruits [2,4]. Thus, in 2023, the market size of BC berries was estimated at 356.9 million dollars, being expected to increase by about 40% by 2033 [5]. Unlike other berries, like blackberries, red raspberries and strawberries, BC contains higher concentrations of bioactive phenolic compounds, such as anthocyanins, proanthocyanidins, phenolic acids and flavonols, which can be used in the prevention or control of different diseases [6,7]. For example, in vitro and in vivo studies have revealed that the consumption of BC is positively correlated with blood sugar and blood pressure regulation and lipid metabolism, being considered essential components in preventing metabolic disorders like diabetes and obesity [8]. Moreover, BC presents anti-inflammatory and antimutagenic properties and has the potential to prevent the development of different types of cancer [9].
The BC juice and extract were found to have a pronounced inhibiting effect on the growth of Gram-positive bacteria such as Staphylococcus aureus, Listeria monocytogenes, Listeria innocua and Bacillus cereus and a weaker effect on Gram-negative bacteria like Pseudomonas aeruginosa [10,11]. These antibacterial properties make the components of BC fruits good candidates for food preservation, contributing to improving food safety [10]. Thus, it is not surprising that the global BC market was estimated at about USD 800 million in 2021, with a potential increase of up to 50% by 2028 [4]. BC fruits are frequently consumed as juice; however, after juice processing, about 50% of the dry weight of the fruit, containing the skin, fiber and seeds, is generated as pomace, which, in many cases, is either wasted through landfill or water or used as animal feed [4]. However, BC pomace was reported to contain higher amounts of phenolic compounds than BC juice [12]. Thus, it is important to maximize the valorization of this byproduct by using appropriate extraction technologies, which will further contribute to minimizing the environmental impact.
Frequently, the extraction of antioxidants from byproducts is performed with conventional methods like maceration and thermal extraction processes, such as steam or hydrodistillation, as well as solvent extraction. These methods are time- and energy-consuming, involve large amounts of solvents and are not recommended for thermosensitive components [13]. New technologies that meet legal requirements regarding emissions while delivering high-quality extracts, with increased functionality and at reduced costs, have been promoted [13]. For example, ultrasound-assisted extraction (UAE) is a green technology that, due to the cavitation effect, can ensure high yields of extraction with superior reproducibility. In addition, UAE can achieve complete extraction in several minutes, leading to final extracts of high purity that retain their biological and functional properties, while reducing the consumption of organic solvents [14]. The extraction efficiency during UAE is dependent on several factors, like the physical parameters during ultrasonication (power, power intensity, frequency, duty cycle, time and transducer efficiency), medium characteristics (solvent type, substrate properties and solvent-to-solid ratio) and environment parameters (temperature and air pressure) [14]. Regarding the solvents, besides their capacity to solubilize the desired compounds, they must possess several physical properties that promote acoustic cavitation [15]. The extraction of phenolic compounds from BC is commonly performed by maceration and mechanical rubbing in solvents like dichloromethane, methanol, ethanol or acetone/water [16]. However, combining alcohol with water demonstrated superior efficiency in extracting the antioxidants than using a single solvent [17]. Thus, compared with conventional technologies, UAE has emerged as an efficient and economic extraction technology [14]. Several studies have been performed on the application of UAE for the identification of the optimum extraction conditions for the phenolic compounds from BC pomace [7,13]. However, most of them provide a chromatographic profile of the major anthocyanins and focus less on the non-anthocyanin phenolic compounds. Taking into consideration that many of the phenolic compounds from BC pomace have a strong antimicrobial effect [10], their identification and quantification is essential and would maximize their valorization in a sustainable manner.
Therefore, the aim of this study was to valorize BC byproducts by applying an environmentally friendly technique based on UAE that would generate BC extracts with increased functionality in terms of antioxidant and antimicrobial properties. First, the effects of the ultrasound amplitude and time on the total polyphenols and antioxidant activity in water and 70% ethanol were investigated using spectrophotometric assays. The extract with the highest concentration of phenolic compounds was chromatographically characterized and tested for antibacterial activity. In addition, in silico investigations elucidated the mechanisms involved in the antibacterial activity exerted by the main phenolic com-pounds from the BC extract against Escherichia coli and Staphylococcus aureus.

2. Materials and Methods

2.1. Materials

Approximately 5 kg of fresh black chokeberries (BC) was bought from the local market (Galati, Romania) in August 2024. Moreover, 2,2-diphenyl-1-picrylhydrazyl (DPPH), 2,2′-azino-bis(3-ethylbenzothiazoline-6-sulfonic acid (ABTS) and Folin–Ciocalteu reagent were purchased from Sigma Aldrich, Co. (St. Louis, MO, USA).

2.2. Preparation of BC Pomace

The BC were rinsed with water, and the pomace obtained after squeezing the fruits with a cotton cloth was freeze-dried (CHRIST Alpha 1-4 LD plus, Martin Christ Gefriertrocknungsanlagen GmbH, Osterode am Harz, Germany) at −42 °C under pressure of 0.10 mBar for 72 h. Then, the pomace was stored under refrigeration in closed jars until use; the total solid in the freeze-dried pomace was 92.7%.

2.3. UAE

The extraction of bioactive compounds from the BC pomace using ultrasound treatment was performed as follows. First, the BC pomace was ground using a hand-mill with 180 W electric power (Bosch, Bosch Manufacturing Solutions GmbH, Stuttgart, Germany). Then, 0.5 g of BC powder was mixed with 50 mL of distilled water or 50 mL of 70% ethanol. The ethanol concentration was selected based on the potential of easily accessing the cells while preventing protein denaturation [17]. The ultrasound treatment was performed by using ultrasonic equipment operating at a constant frequency of 20 kHz (VCX-500, Sonics, Newtown, CT, USA), equipped with a 13 mm sonotrode, at a maximum of 40 °C. First, the mixture was sonicated for 10 min at amplitudes ranging from 20% to 60% in pulse mode (5 s on and 5 s off). The resulting energy released in the sample by varying the amplitude ranged from 5.40 kJ to 27.10 kJ. Then, an amplitude of 30% was selected, while the sonication time was varied from 5 to 20 min. The resulting energy released varied from 3.3 kJ to 13.8 kJ. The resulting extract was centrifuged at 9000 rpm for 5 min, and the collected supernatant was analyzed for anthocyanins, total phenolic compounds and antioxidant activity. The control sample was obtained by conventional extraction with water or 70% ethanol after 24 h of agitation in an orbital shaker at 25 °C. The extract used for chromatographic characterization and antimicrobial activity analysis was obtained in 70% ethanol after ultrasound exposure at a 30% amplitude for 15 min.

2.4. Total Phenolic Content (TPC)

The TPC of the samples obtained as previously detailed was measured according to the Folin–Ciocalteu protocol, as reported elsewhere [18]. Briefly, the extract was mixed with distilled water and Folin–Ciocalteu solution and left for 10 min to allow the interaction. Then, 20% sodium bicarbonate was added, and, after 30 min, the absorbance at 765 nm was collected using a UV–VIS spectrophotometer (Biochrom Libra S22, Cambridge, UK). The results were expressed as gallic acid equivalents (GAE) mg/100 g d.w. The extract containing the highest concentration of TPC was further used for chromatographic characterization.

2.5. Antioxidant Activity

The antioxidant activity was assessed by using the ABTS+ radical reaction assay and the DPPH radical scavenging assay. A sample with a volume of 20 µL or 50 µL was mixed with 1.98 mL of ABTS or 1.95 mL of DPPH solution, and, after 20 min, the absorbance at 734 nm (ABTS) and 515 nm (DPPH) was recorded. The results were expressed as Trolox equivalents per g dry weight [18].

2.6. Ultra-High-Performance Liquid Chromatography (UHPLC-HRMS-MS)

A Dionex Ultimate 3000 (ThermoFisher Scientific, Waltham, MA, USA) and an Accucore U-HPLC Column C18 (150 × 2.1 mm, 2.6 µm) (ThermoFisher Scientific, Waltham, MA, USA) were used for UHPLC characterization. The flow rate of the mobile phases was 0.4 mL/min, and the column temperature was set to 40 °C. The HPLC mobile phase consisted of (A) methanol and (B) water containing 500 µL L−1 formic acid. Gradient elution chromatography was performed as follows: 0–1 min 100% A; 1.0–10.0 min linear increase to 30% B; 10.0–26.0 linear increase to 100% B and hold 4.0 min; 30.0–32.5 decreasing to 0% B. The initial conditions were obtained again at the 35th min, with an equilibration time of 2.5 min. The injection volume of the samples was 20 μL.
Mass spectrometry in full MS, with a resolution of 70,000 and in variable data-independent acquisition (vDIA) mode, at a resolving power of 35,000 FWHM, was performed using a Q Exactive Orbitrap high-resolution mass spectrometer (ThermoFisher Scientific, Waltham, MA, USA) equipped with a heated electrospray ionization (HESI) source. Full-scan spectra were acquired over the mass range of 50 to 1000 m/z in the negative mode. In the MS2 scan events, the precursor ion ranges m/z 95–205, 195–305, 295–405, 395–505 and 500–10,005 were consecutively selected, fragmented in the HCD cell and measured in five separate Orbitrap scans. The fragmentation events were performed at normalized collision energy (NCE) values of 30, 60 and 80. Data were evaluated by the Quan/Qual Browser Xcalibur 2.3 (ThermoFisher Scientific, Watham, MA, USA). The mass tolerance window was set to 5 ppm.
For those compounds without available references, the most reasonable molecular formula with the lowest mass error was searched in the chemical ChemSpider database (www.chemspider.com. Accessed on 12 February 2025). Furthermore, fragment ions from the MS-MS analysis were used to confirm the chemical structure by manually comparing the fragmentation patterns with those in MassBank (https://massbank.eu/MassBank/. Accessed on 12 February 2025) and PubChem (https://pubchem.ncbi.nlm.nih.gov/. Accessed on 12 February 2025).

2.7. Antimicrobial Activity

The antibacterial activity of the BC extract was evaluated by the agar well diffusion method against L. monocytogenes Scott A, S. aureus ATCC 25923 and E. coli ATCC 25922 [19]. Briefly, a concentrated BC extract was diluted with distilled water to 2 mg/mL. Then, a volume of 100 µL was placed into wells (with the diameter of 8 mm) prepared in Muller–Hinton (MH) agar media inoculated with approximately 107 CFU/plate. The observed inhibition zone’s diameter was measured after 18 h of incubation at 37 °C.
The minimum inhibitory concentration (MIC) was determined by a microdilution assay [20]. The BC extract was directly diluted in a 96-well microplate with MH broth media to achieve decreasing concentrations from 1 mg/mL to 1.95 µg/mL. The MIC was evaluated at a final concentration of 5 × 10⁵ CFU/mL against E. coli and S. aureus, respectively. A volume of 10 µL of resazurin (2 mg/mL) was added to each well, aiming to determine the presence of bacterial metabolic activity. The positive control was a bacterial culture treated with both 10 µL of ampicillin (10 mg/mL) and erythromycin (10 mg/mL), while the negative control was the untreated bacterial culture. After 18 h of incubation at 37 °C, a 10 µL volume of the mixture from each well was placed on the surface of an MH agar plate and incubated for 24 h at 37 °C to check the bacterial growth inhibition and to determine the MIC value.
Furthermore, for the determination of the minimum bactericidal concentration (MBC) value, 100 µL of the mixture from each well was diluted 1:10 in brain heart infusion (BHI) broth media and incubated at 37 °C for 24 h. Then, 10 µL was spotted on the MH agar plate and incubated in the same conditions. The MBC was considered as the lowest concentration of BC extract that had bactericidal effects, demonstrated through the absence of bacterial biomass on the plate [21].

2.8. Molecular Docking Tests

Molecular docking with AutoDock Vina 1.2.0 on SwissDock2024 [22,23] was performed to test the potential attachment of the main polyphenols identified in the BC extract to several key proteins responsible for E. coli and S. aureus cells’ survival and colonization function.
The following ligands were selected from the PDBeChem database: quercetin (QUE), catechin (CAT), chlorogenic acid (CLA) and rutin (RUT).
The molecular models of the receptor proteins from S. aureus and E. coli were selected form the RCSB Protein Data Bank [24] as follows: the N-terminal fragment of subunit B of DNA gyrase (PDB ID: 4prv; [25]) and dispersin molecules (PDB ID: 2jvu; [26]) from the enteroaggregative E. coli and tyrosyl-tRNA synthetase (PDB 1jij; [27]) and DNA gyrase (PDB ID: 7mvs; [28]) from S. aureus. These proteins are known as targets for various inhibitors.
The three-dimensional models of the complexes with the highest affinity, as indicated by AutoDock Vina ranking, were further analyzed using the VMD 1.9.3. software [29], Ligplot v.2.2 [30] and PDBePISA tools [31].

3. Results and Discussion

UAE has the advantage of promoting cell wall disruption and increasing the release rate of bioactive compounds. Thus, in this study, the effects of the solvent type (70% ethanol and water), ultrasound amplitude (20–60%) and exposure time (5–20 min) were investigated to maximize the recovery of phenolic compounds from BC pomace, expressed in terms of the total phenolic content (TPC) and antioxidant activity. The results were also compared with those of a conventional extraction procedure.

3.1. Effects of Ultrasound Amplitude on Bioactive Extraction in Different Solvents

The results showing the influence of the amplitude on the extraction of bioactive compounds from BC in water and ethanol are collected in Table 1. Water and ethanol are frequently used for antioxidant extraction as they show high efficiency, moderate polarity and low toxicity, which make them appropriate for food industry applications [17]. The hydroalcoholic mixture changes the solvent polarity, which can affect the solubility of the phenolic constituents [17]. Even though water has reduced selectivity compared to ethanol and requires more energy for solvent evaporation, it offers the advantage that, when used in combination with ethanol, it provides a sustainable approach for the industrial valorization of bioresources rich in antioxidants.
In water extracts, phenolic recovery was not affected by the ultrasound amplitude, whereas, in ethanolic extracts, only the TPC was affected by amplitude variations, with the highest content being reported at a 30% amplitude (86.16 ± 0.66 mg GAE/g d.w.). Above this limit, the TPC decreased by about 15% (p < 0.05). On the other hand, when compared to conventional extraction, regardless of the amplitude of sonication, in most cases, UAE was able to recover similar or even higher concentrations of phenolics, indicating its potential in minimizing the extraction costs. For example, UAE was able to recover similar TPC after only 10 min when using water (Table 1), while, in ethanolic extracts, sonication at 30% for 10 min produced higher TPC than conventional extraction for 24 h (Table 1). Although the DPPH scavenging activity (Table 1) reported in water extracts after 24 h of conventional extraction was about 20% higher than that obtained during UAE at 30% for 10 min, the results highlight the excellent potential of ultrasound treatment in producing sustainable extracts. Larger differences were obtained for the ABTS+ scavenging activity, where UAE (regardless of the amplitude value) recovered about 40% (water samples) and 200% (ethanol samples) more antioxidants compared with conventional extraction. Regardless of the extraction method, the use of a mixture of ethanol and water as an extraction solvent contributed to the higher recovery of all bioactive compounds from BC pomace, when compared to using only water. Similar results have been reported by Galvan et al. [17], who tested the effects of the ethanol concentration on the extraction efficiency of phenolic antioxidants from BC. The authors reported about two-fold higher yields of extraction when using 50% ethanol compared to water. The results of our study in both water and ethanol are higher than those reported by Kaloudi et al. [32]. By using UAE at 100 W power to recover the phenolic constituents from BC pomace using methanol combined with trifluoroacetic acid, the authors reported a TPC value of 16.41 ± 0.04 mg/g d.w. Based on the results presented above, we selected an amplitude of 30% to further investigate the effects of the ultrasound exposure time on BC phenolic recovery.

3.2. Influence of Ultrasound Time on Bioactive Extraction in Different Solvents

In order to identify the conditions that allow us to obtain extracts with superior bioactive content while reducing the costs, the influence of the applied ultrasound treatment on the properties of the obtained extracts was further checked by varying the time interval from 5 to 20 min. Table 2 compares the phytochemical compositions of water and ethanol extracts after exposure to ultrasound treatment for up to 20 min, at a solid-to-liquid ratio of 1:100 (w/v). When water was used as a solvent, increasing the exposure time for UAE from 5 to 20 min favored the release of bioactive compounds, increasing by about 49% for TPC and 54% for antioxidants as measured by the DPPH assay and by 65% for antioxidants as measured by the ABTS-based method. These results indicate that, with increasing time, water enhanced mass transfer, promoting extraction [7]. On the other hand, when using ethanol as a solvent, regardless of the phenolic compound tested, the time had no effect on the extraction. These results are associated with the solid–liquid ratio of 1:100 (w/v) used in this study and ethanol’s ability to increase the extraction rate of antioxidants. Thus, when using 70% ethanol, the equilibrium state was reached in up to 5 min. Similar results were reported by Sady et al. [33], where an ultrasound extraction time between 10 and 30 min (at ethanol concentrations ranging from 60 to 96%, with a solid–liquid ratio of 1:10) did not show a significant influence on bioactive recovery. To generate high extraction yields of antioxidants, the same authors recommended the use of ultrasound treatment for 20 min in BC samples containing 60% ethanol as a solvent. As shown in Table 1, UAE was able to produce similar or higher concentrations of antioxidants than conventional extraction. The extraction time of up to 20 min applied in our study generated similar total phenolic concentrations to those reported by Xu et al. [16] after 50 min of UAE in 71% ethanol in the presence of 0.320 mg/mL ammonium sulfate, where the concentration of total phenolics extracted from BC pomace was 68.15 ± 1.04 mg/g. The authors mentioned that increasing the ethanol concentration beyond 70% led to the suspension of fat-soluble impurities in the upper phase, which decreased the permeability of the solvent, and the phenolic content reached a plateau. Therefore, considering the results presented in Table 1 and Table 2, it can be concluded that, compared with conventional extraction, UAE was able to obtain ethanolic extracts with higher antioxidant levels at a lower amplitude while reducing the extraction time from 24 h to 15 min. Further chromatographic characterization and antimicrobial activity tests were performed on the ethanolic extracts obtained through UAE using an amplitude of 30%, in pulse mode (5 s on 5 s off), for 15 min.

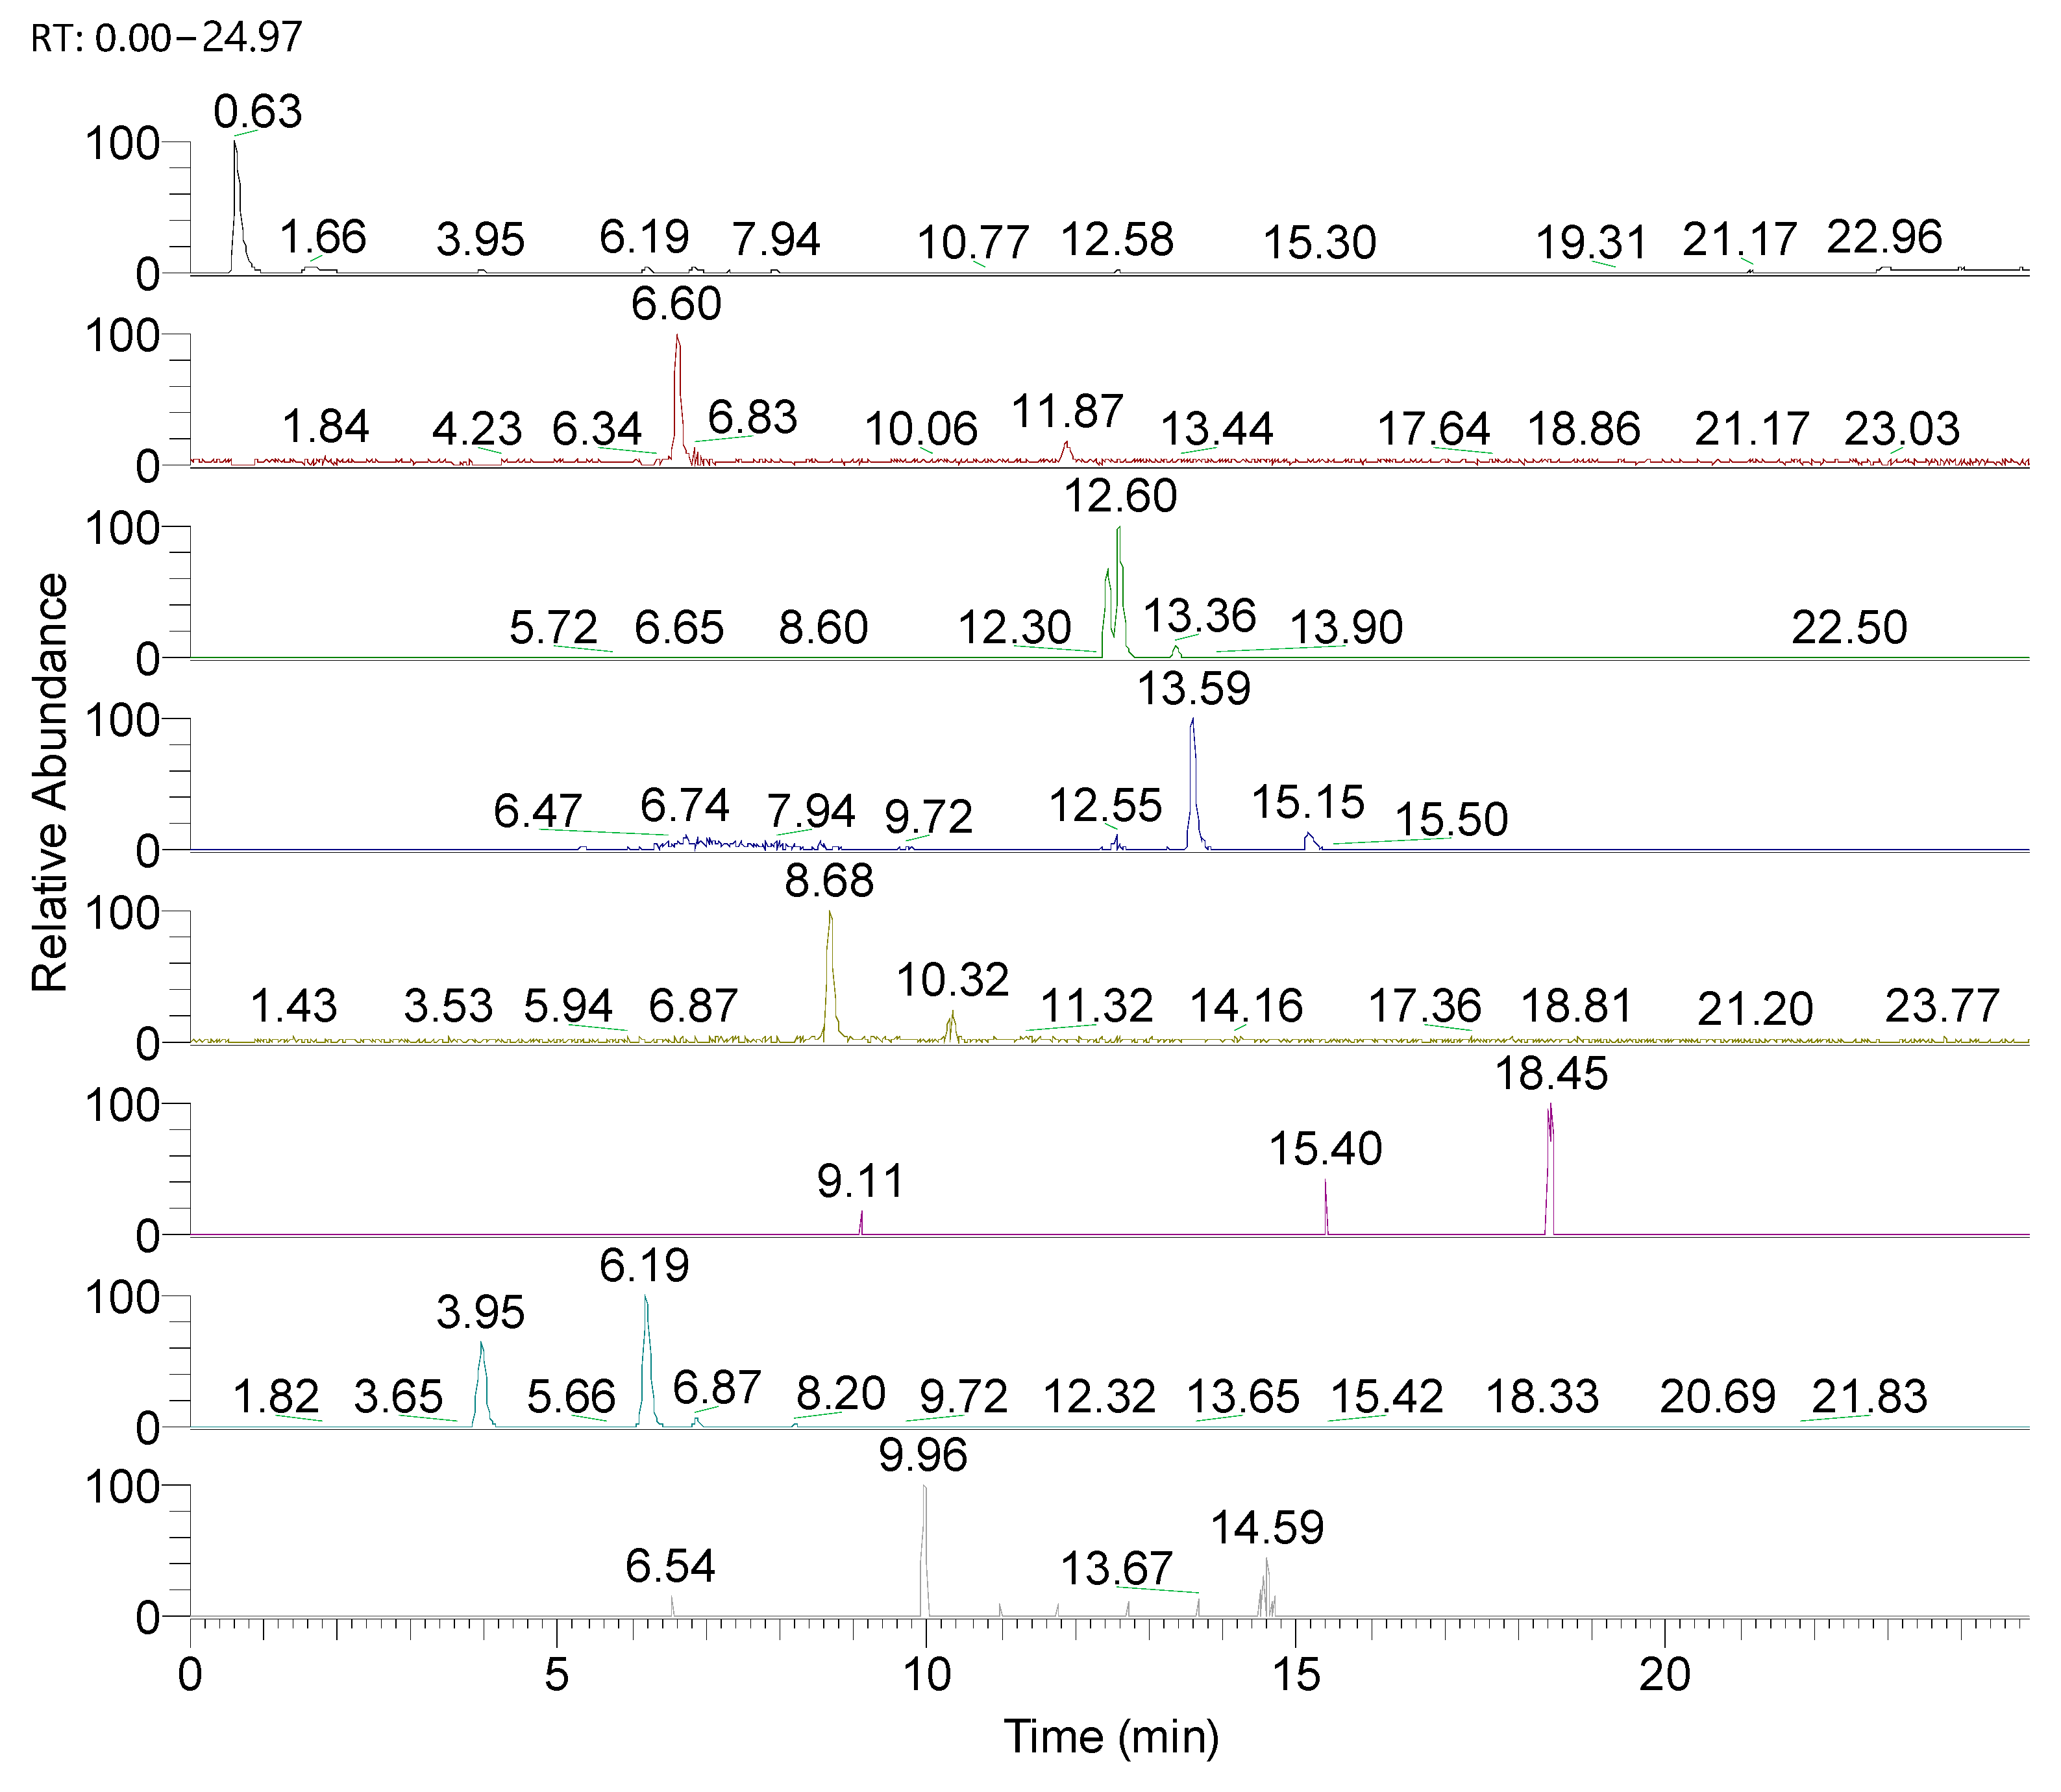
3.3. UHPLC-HRMS-MS Characterization

An UHPLC-HRMS-MS instrument coupled to a high-resolution Orbitrap mass spectrometer (ThermoFisher Scientific, Waltham, MA, USA) was used in a non-target HRMS-MS method to identify the bioactive components in the BC pomace extract.
A total of 48 bioactive compounds were identified, comprising a wide variety of polyphenolic compounds (including phenolic acids, isoflavones, flavones, flavanones, proanthocyanidins and flavonols), along with several terpenoids. Among them, 19 major compounds were unambiguously quantified by comparison with reference standards. The chemical formulae, accurate m/z values of adduct ions, retention time and measured amounts are presented in Table 3. Representative chromatograms of the phenolic compounds are presented in Figure 1.
Exploiting the capabilities of high-resolution mass spectrometry, the remaining 30 compounds were identified based on accurate mass measurements, isotopic distributions and fragmentation patterns, which were manually matched with those in mass spectra databases (MassBank, PubChem) (Table 4).
Representative chromatograms of the presumptive identified polyphenols of BC pomace are shown in Figure 2.
Several studies have shown that Aronia melanocarpa berries, juice and pomace have high polyphenol content with potential health benefits [3,12,34]. Among the phenolic compounds, chlorogenic acid (3-O-caffeoylquinic acid) and neochlorogenic acid (5-O-caffeoylquinic acid) were the main hydroxycinnamic acids in the BC pomace, as was reported previously [9,12]. Flavonoids like catechin, gallocatechin, rutin, naringin, apigenin and proanthocyanidins were also identified. The flavonols present in BC pomace consisted of quercetin derivatives (quercetin 3-vicianoside, dihydroquercetin 3-O-rhamnoside, dihydroquercetin-3-O-glucoside, quercetin 3-O-glucuronide, quercetin-3-rhamnoside), while kaempferol was also detected. High content of chlorogenic acid and specific quercetin derivatives such as quercetin 3-vicianoside, as well as eriodyctiol and its derivatives (glucoside and glucuronide), are particularities of chokeberry [35].
Procyanidin B1, naringenin, chrysin, vanillic acid, p-coumaric acid, caffeic acid and quinic acid, present in the tested BC pomace, were also identified in BC cultivars by other authors [36].
Chlorogenic acid was found in a significant concentration in our study (9045.88 mg/100 g d.w.), higher than that reported by Sidor and Gramza-Michałowska [37], who measured chlorogenic acid levels ranging from 848.17 to 1192.69 mg/100 g d.w. pomace. Catechin and epicatechin were present at concentrations of 65.55 mg/100 g d.w. and 791.44 mg/100 g d.w., respectively, and exceeded the previously reported concentrations in dried Aronia pomace powder of 260.13 mg/100 g d.w. for epicatechin and 180.27 mg/100 g d.w. for catechin. Ferulic acid was measured at 27.60 mg/100 g d.w., consistent with previous findings (15.09 mg/100 g d.w.) in pomace [37]. Quercetin was found in a significant amount, being the fourth most abundant compound in our study, with a concentration of 564.80 mg/100 g d.w.
Several studies have shown that Aronia melanocarpa possesses some of the highest polyphenol concentrations among dark berries, particularly for chlorogenic acid, epicatechin and quercetin. The reported concentrations in fresh fruit are 20–45 mg/100 g fresh weight (f.w.) for chlorogenic acid, 6–10 mg/100 g f.w. for epicatechin and approximately 2–5 mg/100 g f.w. for quercetin (aglycone or glycosylated forms), depending on the cultivar, extraction method and environmental factors [38].
Due to its high content of polyphenolic compounds, BC pomace exhibits a high antioxidant capacity. In vivo studies have shown that BC polyphenols can effectively scavenge superoxide anions in diabetes by increasing insulin gene expression, and they enhance superoxide dismutase (SOD) activity in the liver and kidneys [39,40].

3.4. Antimicrobial Activity

The in vitro diffusion-based method was used to determine the antimicrobial activity of the BC extract against three bacterial strains with pathogenic potential: E. coli, S. aureus and L. monocytogenes. The BC extract exerted good antimicrobial action against the Gram-negative strain, E. coli, compared to S. aureus (Table 5, Figure S1). However, no effect of the bioactive compounds extracted from BC against L. monocytogenes was observed. The antibacterial activity of the extract may be attributed to the cumulative effects of all bioactive compounds, as well as the synergic interactions among them.
Chlorogenic acid, the main phenolic acid in BC pomace, has the potential to increase the permeability of both the outer and plasma membranes, disrupts their integrity, depletes the intracellular potential and facilitates the release of cytoplasmic macromolecules, ultimately leading to cell death [41]. However, chlorogenic acid does not exhibit direct membrane disruption but induces a significant decrease in intracellular adenosine triphosphate (ATP) levels, likely affecting the material and energy metabolism and interfering with cell signaling transduction [42].
Catechins, as other major compounds in BC pomace, exhibit multiple antibacterial mechanisms, primarily linked to bacterial cell wall and membrane disruption, but they also induce oxidative stress and cause DNA damage by inhibiting DNA repair mechanisms and generating reactive oxygen species (ROS), particularly hydrogen peroxide (H2O2). Catechins can interact with bacterial membranes, leading to protein deposition and the inhibition of peptidoglycan biosynthesis, which leads to membrane perforation and reduced fluidity [43]. Catechins have demonstrated bactericidal effects on both Gram-positive (Streptococcus mutans and Streptococcus pneumoniae) and Gram-negative bacteria (Pseudomonas aeruginosa and E. coli), including multidrug-resistant strains [44].
Quercetin, a well-represented flavonol in BC pomace, exhibits broad-spectrum antimicrobial activity against drug-resistant Gram-positive and Gram-negative bacteria (E. faecalis, P. mirabilis, P. aeruginosa, S. aureus, Salmonella enterica, E. coli) [45]. Its antimicrobial effects are mediated through multiple mechanisms, including cell wall and membrane disruption, interfering with DNA replication and transcription processes, thereby inhibiting nucleic acid and protein synthesis and further bacterial growth and causing the suppression of virulence factors, enzyme inhibition and biofilm prevention [46,47,48].
Valcheva-Kuzmanova and Belcheva [49] highlighted the higher in vitro bacteriostatic activity of the fruit juice of Aronia melanocarpa against S. aureus compared to E. coli. Liepiņa et al. [11] tested the antimicrobial activity of dried BC fruits, emphasizing the potential of hydroalcoholic extracts against Bacillus cereus and S. aureus strains, compared to aqueous extracts of frozen or dried samples. Furthermore, both aqueous and hydroalcoholic extracts of fresh fruits inhibited the growth of the Gram-negative bacterium, Pseudomonas aeruginosa, but did not influence the growth of the E. coli strain [11].
The antimicrobial activity of the BC extract, as indicated by the MIC values, was determined to be at 0.5 mg/mL for E. coli and 1 mg/mL for S. aureus, respectively (Table 5). Alternatively, a much higher concentration of BC extract was necessary to exert bactericidal effects in both strains, with the MBC being higher than 1 mg/mL (Table 5, Figure S2).
Similarly, Salamon et al. [50] reported that a higher concentration of Aronia melanocarpa (acetone extract) was required to demonstrate a bactericidal effect against clinical isolates of S. aureus, with the reported MBC value of 15.0 mg/mL. In another study, Deng et al. [51] evaluated the antibacterial activity of Aronia melanocarpa anthocyanins against E. coli, reporting MIC and MBC values of 0.625 mg/mL and 1.25 mg/mL, respectively.
The BC extract exhibited antimicrobial activity against S. aureus but showed no inhibitory effect on L. monocytogenes, although they are both Gram-positive bacteria. This selective activity could be explained by the differences in their cell wall structure or the efflux pumps’ stress response. Although both bacteria possess a thick peptidoglycan layer, some differences have been reported in the cross-linking degree and the composition of teichoic acids [52]. For instance, L. monocytogenes possesses a meso-diaminopimelic acid (m-DAP) at the third position of its peptidoglycan stem peptide (typically composed of L-Ala–D-isoGlx–L-Lys–D-Ala–D-Ala) instead of L-lysine (L-Lys), while S. aureus has the L-Lys further acylated with five Gly residues [52]. This pentaglycine crossbridge can have important biological implications, particularly in the sensing of peptidoglycans by various phenolic compounds existing in the BC extract. Moreover, Listeria species are known to possess effective stress response systems and efflux pumps (such as MdrL—from the major facilitator superfamily (MFS) efflux pump), contributing to its resistance to different antimicrobial compounds. On the other hand, S. aureus possesses several other efflux pumps, including NorA and TetK from the MFS and Smr/QacC and EmrE from the small multidrug resistance (SMR) family [53]. The same authors [53] reviewed several studies, highlighting that terpenes can inhibit the NorA-mediated efflux pump by inhibiting genes expression or interacting with their membrane-binding sites, respectively. This may support the roles of terpenes, not only as NorA efflux pump inhibitors but also as compounds with intrinsic antibacterial activity in S. aureus strains [53,54].

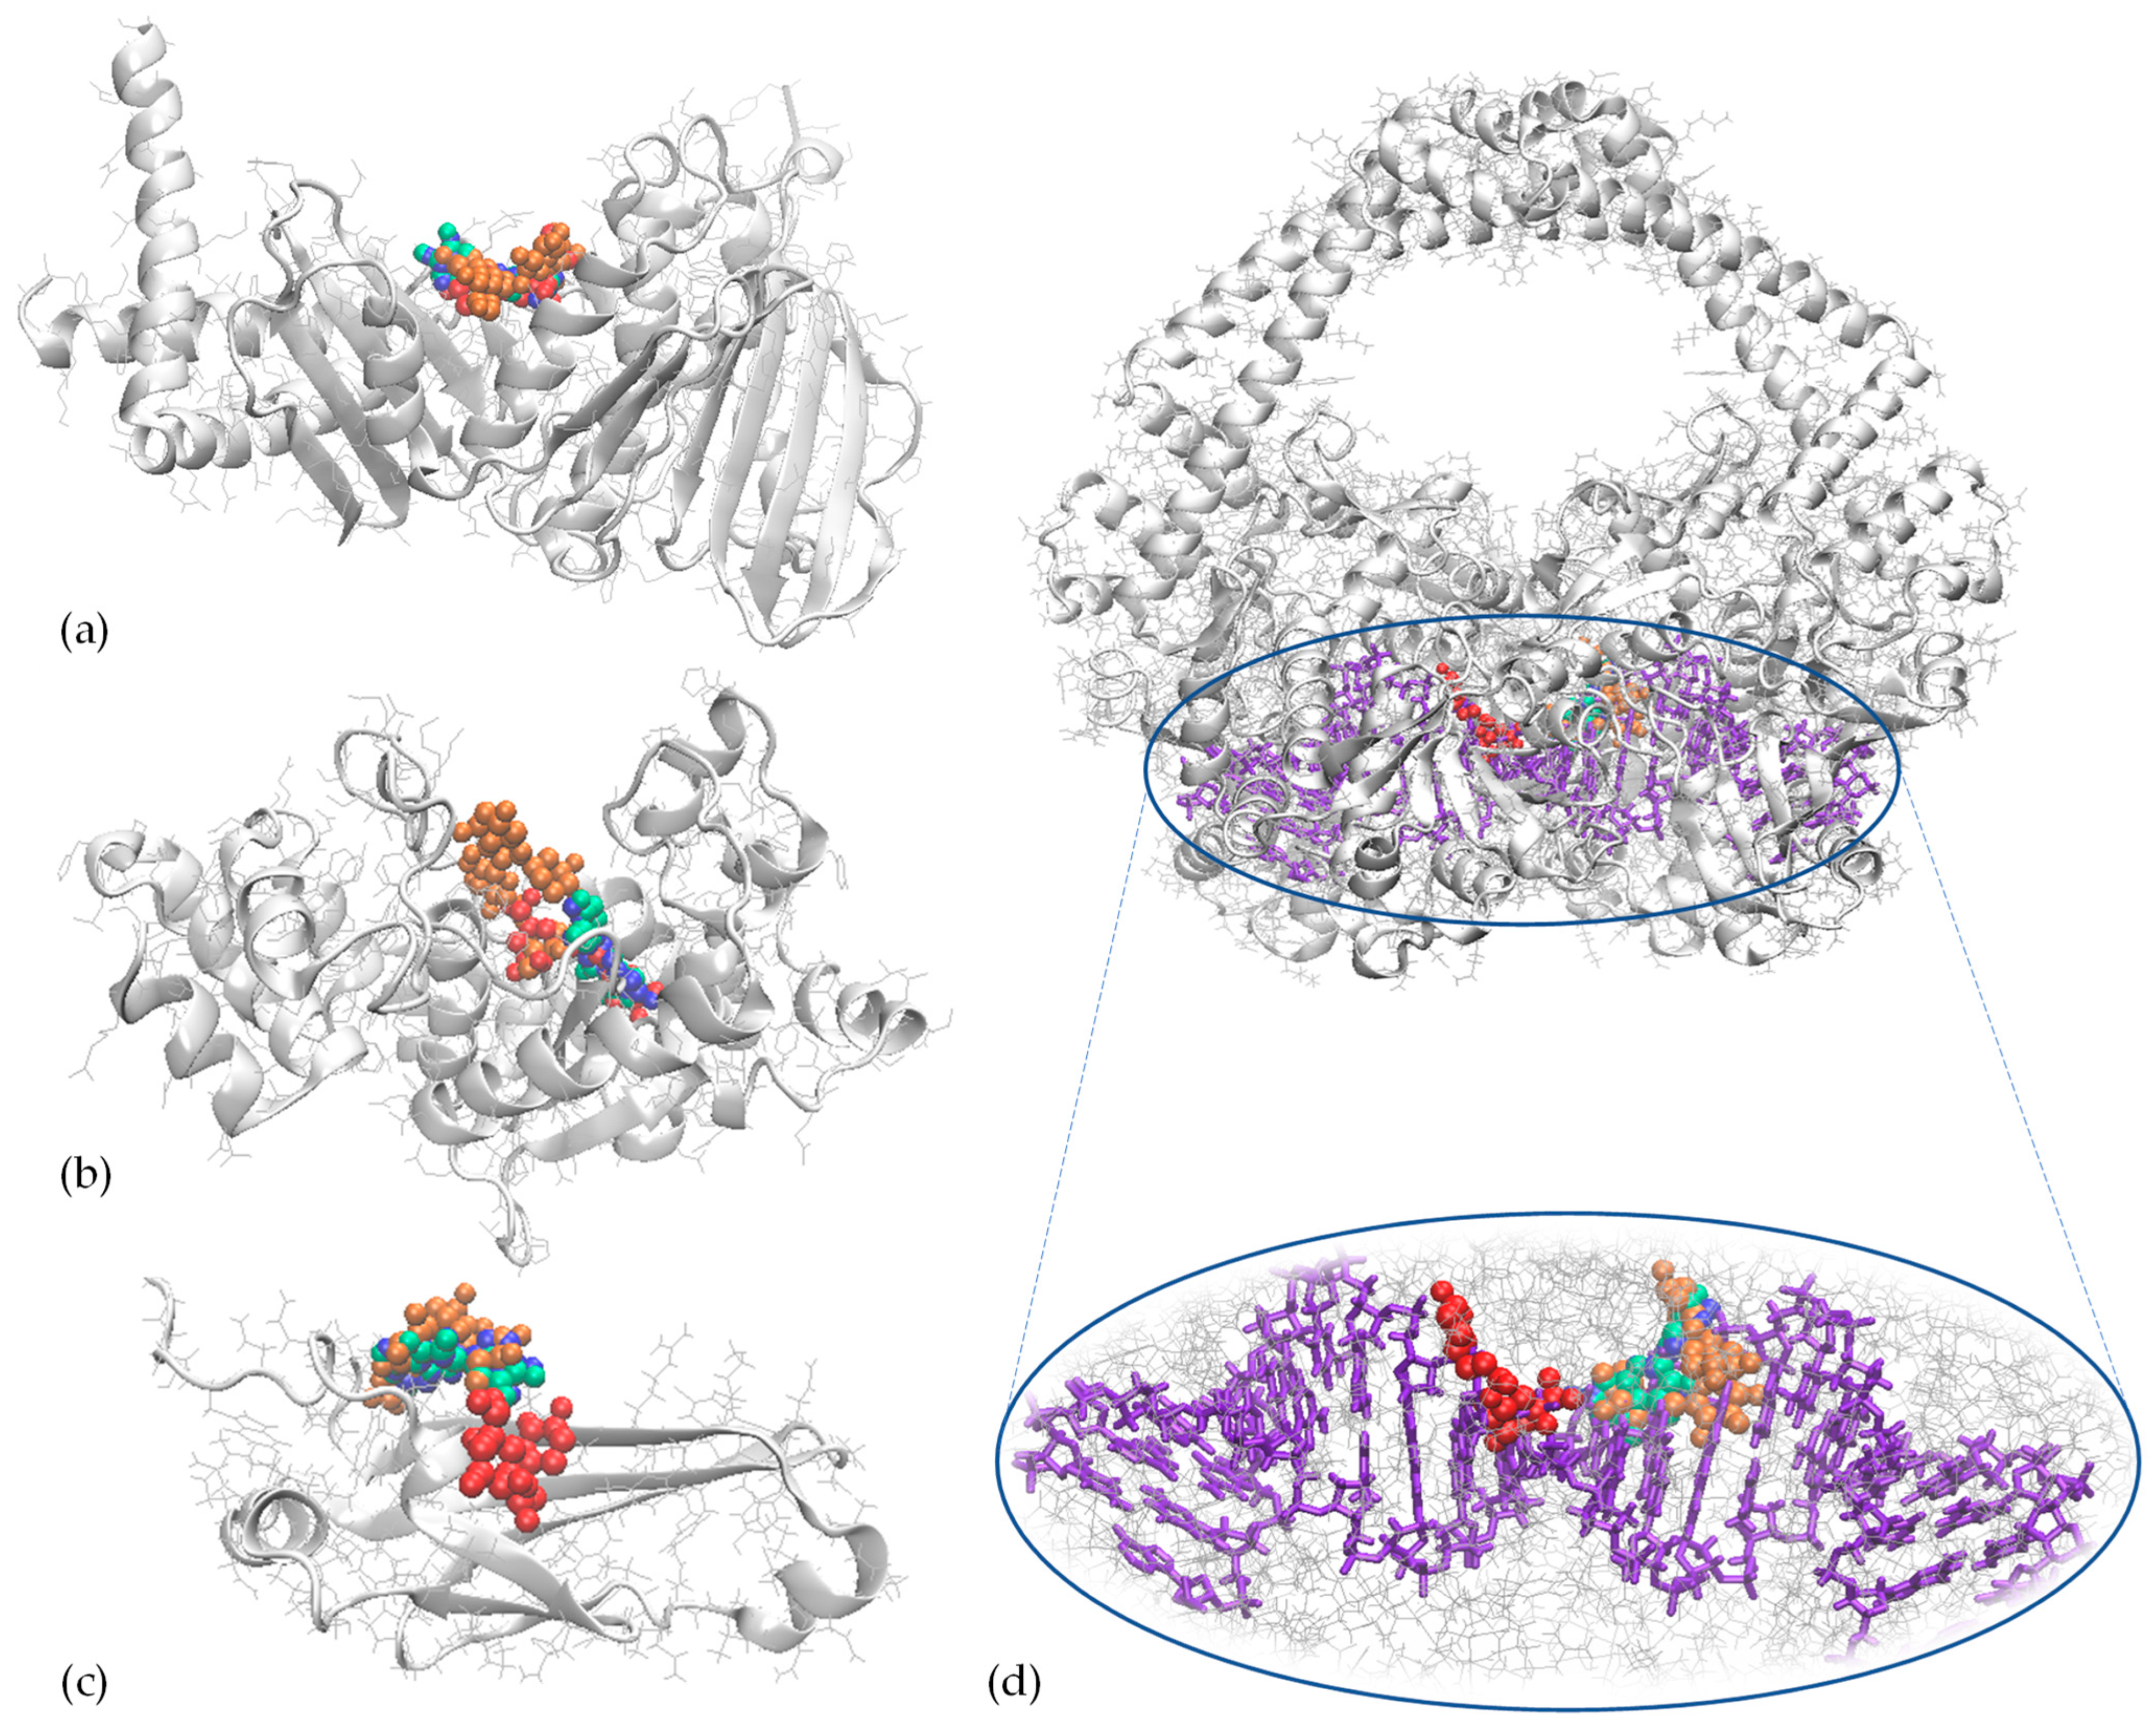
3.5. Molecular Docking Investigation

The antibiotic resistance of microorganisms is related to oxidative stress, making the identification of bioactive molecules with both antioxidant and antibacterial properties very appealing [55,56]. Therefore, further in silico investigations were carried out to test the abilities of the major compounds with antioxidant activity found in the BC extract to form complexes with selected protein models from S. aureus and E. coli. The molecular models of all favorably docked complexes (Figure 3) were further characterized in terms of the contacts established between the two interacting molecules, affinity and thermodynamic stability (Table 6).
Regarding E. coli, the proteins used as receptors in the molecular docking procedure were the N-terminal fragment of the B subunit of DNA gyrase (GyrB-N) (Figure 3a), which is a prototype of the type II DNA topoisomerase, and the dispersin molecule (Figure 3b), which plays an important role in the adherence and colonization functions of enteroaggregative E. coli.
GyrB-N includes the ATPase and transducer domains of DNA gyrase and is fully functional as a dimer. The enzyme uses the free energy released through ATP hydrolysis to introduce negative supercoils into double-stranded DNA molecules, therefore playing an important role in the three-dimensional orientation of double-stranded DNA [25]. The dimer of the GyrB-N model used in this study exhibits a 20 Å large hole in the central zone, which is meant to accommodate double-stranded DNA [25]. GyrB-N is able to hydrolyze ATP only in dimeric form, in the presence of double-stranded DNA.
Previous studies have reported GyrB-N as an important binding target for antibacterial activity [57,58]. Careful analysis of the GyrB-N docking models indicated that all investigated ligands were in close contact with residues of both the ATPase domain (residues 1–220) and transducer domain (residues 221–392). The results presented in Table 6 suggest that CAT, CLA and QUE exerted comparable affinity towards the GyrB-N molecule, with the free energy of interaction (ΔGint) ranging between −7.26 and −7.04 kcal/mol. Although the RUT–GyrB-N complex had an even lower ΔGint value of −9.01 kcal/mol, this complex is unstable from a thermodynamic point of view. Considering the free energy of receptor–ligand dissociation (ΔGdiss) of 0 kcal/mol, the spontaneous detachment of the interacting molecules might be expected. Among all docking models, the complexes formed by GyrB-N with CLA and QUE were characterized by the widest interaction surfaces and the highest ΔGdiss values of 10.2 and 9.7 kcal/mol, respectively (Table 6), suggesting that external driving forces are needed for the detachment of the phenolic compounds out of their complexes with GyrB-N.
The in silico observations indicated that CLA and RUT established non-bonded contacts with Thr336, which is part of the QTK loop (Ser334-Lys337). Depending on the ATP before and after the hydrolysis stage, the QTK loop suffers an important spatial rearrangement, along with rigid-body motion of the transducer domain by 6–12° rotation with respect to the body of the ATPase domain [19]. Of particular interest is also the fact that, upon ATP hydrolysis, the Gln335 and Thr336 residues belonging to the QTK loops of the two subunits move closer together at the dimerization interface, resulting in a 7 Å wider opening of the inter-subunit distance [25]. Considering CLA and RUT’s contacts with Thr336, these atomic-level events might occur upon ligand binding to the GyrB-N molecules.
Furthermore, the QTK loop is in close contact with the ATP-binding region: a hydrogen bond connects the Gln335 of the transducer domain to the Typ26 of the ATPase domain, whereas a water molecule mediates the interaction of both Gln335 and Lys337 with the Glu42 [25]. A detailed analysis at the atomic level allowed the identification of close hydrophobic contacts between the flavonoids considered as ligands in the docking study and the aromatic Phe41 residue, which is located in the close vicinity of the interaction region between the transducer and ATPase domains. In addition, CLA’s attachment to GyrB-N resulted in the burial of ~40% of the Phe41 surface initially exposed to the solvent. Therefore, the potential interference of CAT, QUE and CLA binding with the ability of GyrB-N to accurately fulfill its regular functions should be considered. Our observations agree with Plaper et al. [57], who reported that QUE is a competitive inhibitor of ATP binding to GyrB, impeding DNA supercoiling. The antibacterial activity of various flavonoids exerted through the inhibition of E. coli DNA gyrase was also reported by Fang et al. [58]. In fact, gyrase has been selected as an important target for antibacterial drugs [57,58].
Another receptor protein considered in the molecular docking experiment was dispersin, an aggregative factor secreted to the bacterial surface [26]. Dispersin is encoded in the pAA virulence plasmid and is important for the adherence and colonization functions of enteroaggregative E. coli ATCC 25922 [26,59].
All phytochemicals considered in the in silico tests interacted firmly with the receptor protein, with at least two hydrogen bonds involved in the stabilization of the interface area in each studied case (Table 6). Among all molecular docking models, the complexes formed with QUE and RUT were characterized by the highest affinity (ΔGint of −6.08 and −5.97 kcal/mol, respectively), exhibiting also the highest thermodynamic stability (ΔGdiss of 9.2 and 9.8 kcal/mol, respectively). The receptor–ligand interaction energy values are comparable to those reported by Abishad et al. [59] for the complexes formed by dispersin with carvacrol and cinnamaldehyde (binding energy of −5.17 and −5.65 kcal/mol, respectively). They employed the molecular docking approach to check the interactions between Food and Drug Administration (FDA)-approved phytochemical compounds and the dispersin domain, corroborating their in silico observations with the in vitro antimicrobial activity against enteroaggregative E. coli. In agreement with the study of Abishad et al. [59], the interface of the thermodynamically stable complexes with QUE and RUT involved contacts with Ala7, Trp93, Ser96 and Ser98, including hydrogen bonds stabilizing the complexes (Table 6). The active sites involving these amino acids were reported by Abishad et al. [59] in the case of a complex with cinnamaldehyde, which yielded MIC values of 0.25–0.50 μL/mL and MBCs of 0.50–1.00 μL/mL against three different strains of enteroaggregative E. coli.
Regarding S. aureus, the proteins used as receptors in the molecular docking procedure were tyrosyl-tRNA synthetase (TyrRS) (Figure 3c) and DNA gyrase (Figure 3d).
TyrRS is an aminoacyl-tRNA synthetase that catalyzes the covalent attachment of amino acids to tRNA, an important step in the translation process [52]. Since TyrRS is essential for protein synthesis and therefore for bacterial cell life and integrity, identifying potent inhibitors targeting the activity of this enzyme from the virulent strains of S. aureus is of particular importance. TyrRS is classified within the class I synthetases, having a specific Rossmann fold in the catalytic domain and the HIGH and KMSKS motifs involved in ATP binding [27]. Analyzing the results presented in Table 6, one can observe that all investigated ligands exhibited comparable affinity towards the TyrRS molecules, having ΔGint values in the −7.95 ÷ −8.82 kcal/mol range. Nonetheless, out of the TyrRS-based docking models, only the complex with QUE was thermodynamically stable (ΔGdiss of 8.1 kcal/mol). In addition, the TyrRS-QUE model was characterized by the widest interaction surface of 135.7 Å2, involving hydrophobic contacts and five hydrogen bonds for the complex interface’s stabilization (Table 6). Partial overlap of the active sites accommodating the four investigated phytochemicals on the surface of the enzyme was observed. All ligands were in direct contact with amino acids belonging to the N-terminal α/β domain (0–220). The only exception concerned RUT, which was interfaced with Pro222-Val224 and Phe232-Lys243, belonging to the peptide that forms the connection with the α-helical domain (248–323) [27]. Of particular importance is that all active sites share amino acids with the pockets described by Qiu et al. [27] for the accommodation of potent inhibitors of TyrRS. For instance, the binding sites of CAT, CLA and QUE share three or four amino acids, namely Ala39, Asp40, Thr42 and His50 (Table 6), with the binding pocket of SB-243545, which is a very strong TyrRS inhibitor [27]. On the other hand, CLA and RUT are in direct contact with Gly38, His50, Pro53, Gly193, Asp195 and Gln196 residues, also involved in the attachment of the SB-219383 inhibitor to TyrRS molecules [27]. Since all investigated ligands have an affinity towards the area comprising the HIGH motif (His47-His50), one might assume that phytochemical attachment will lead to changes in the active site of ATP [27], therefore interfering with the typical activity of the enzyme. In particular, RUT directly interfaces with the His47, Gly49 and His50 residues of the HIGH motif, establishing one hydrogen bond with Gly49. Moreover, the RUT binding pocket also includes the Phe232, Gly233 and Lys234 residues, which are part of the KFGKS motif. Therefore, the attachment of the flavonoid glycoside to the TyrRS enzyme might affect the flexibility of both the HIGH and KFGKS motifs, interfering with their appropriate involvement in the transition states specific to TyrRS-catalyzed reactions.
The second molecule target from S. aureus was DNA gyrase, a topoisomerase that is not present in eukaryotes and is therefore an attractive target for antibacterial agents [52]. All complexes involving DNA gyrase as a receptor in the molecular docking test were very stable (ΔGdiss of 13.4–13.6 kcal/mol), where the interfaces with the ligands were stabilized through hydrogen bonds, hydrophobic contacts, ionic bonds and π-stacking interactions (Table 6).
All investigated ligands preferentially attached to enzyme clefts located between the dimers of the molecules, in direct contact with the DNA fragment (Figure 3d). In fact, CAT, QUE and RUT shared the same cleft, involving mainly amino acids from chain B and only two amino acids from chain A (Table 6). Among the residues of this ligand-binding site, Asp30(B), Ser31(B), Gly52(B), Lys53(B), Arg323(A) and Phe324(A) were in direct contact with the DNA molecule. On the other hand, the enzyme cleft that accommodates CLA molecules involves mainly amino acids from chain A, and more than half of the residues (Asp30, Ser31, Gly52, His282 and Gly283 from chain A and Arg323 and Phe324 from chain B) directly interface with the DNA molecule (Figure 3d). Therefore, the possibility of the simultaneous attachment of CLA and any of the CAT, QUE or RUT ligands to DNA gyrase has to be considered, with important consequences for DNA gyrase’s activity. The specific DNA topology changes catalyzed by DNA gyrase occur with ATP hydrolysis and are essential for S. aureus’ survival [28,52].

4. Conclusions

The valorization of phenolic compounds from black chokeberry pomace using ultrasound-assisted extraction in two solvents was employed. The highest concentration of phenolic compounds was obtained in the ethanolic extract under ultrasound exposure for 10 min at a 30% amplitude. Compared with conventional extraction, ultrasound treatment shows higher potential for the valorization of black chokeberry pomace. The chromatographic characterization revealed that black chokeberry pomace is a rich source of non-anthocyanin polyphenolic compounds with outstanding health properties, such as antimicrobial potential against Staphylococcus aureus and Escherichia coli. These properties make black chokeberry pomace a promising candidate for the development of new ingredients with health benefits in a sustainable manner. The novelty of this study lies in combining the experimental approach with the in silico approach to ensure a better understanding of the mechanisms involved in the antibacterial activity exerted by the main phenolic compounds from the BC extract. The results of the molecular docking tests suggested that chlorogenic acid and rutin binding might interfere with the ATPase activity of Escherichia coli gyrase, potentially inhibiting the DNA supercoiling activity and therefore affecting the preservation of the bacterial chromosomes in an appropriate state.
All investigated ligands, namely quercetin, catechin, chlorogenic acid and rutin, were found to interfere with the activity of tyrosyl-tRNA synthetase from Staphylococcus aureus and therefore to potentially affect cell growth. Moreover, the studied phytochemicals appeared to preferentially bind to DNA gyrase clefts located in direct contact with nucleic acids, therefore preventing the enzyme from catalyzing the specific DNA topology changes that are crucial for Staphylococcus aureus’ survival. These findings, coupled with those of the in vitro studies, might be of particular importance in drug discovery, contributing to the knowledge-based design and development of active compounds that are suitable for alternative therapeutic strategies to address drug resistance.

Supplementary Materials

The following supporting information can be downloaded at: https://www.mdpi.com/article/10.3390/app15137070/s1, Figure S1: The antimicrobial activity of black chokeberry extract against Staphylococcus aureus (S. a) and Escherichia coli (E.c). The test was made in duplicate with two different concentrations (2 mg/mL—AV and 1 mg/mL—AN). The arrow shows the bacteria inhibition zones.; Figure S2: The colors developed in the 96-well microplate inoculated with Staphylococcus aureus (S. a) and Escherichia coli (E.c) together with different concentrations of black chokeberry extract (lane 1—1 mg/mL to lane 10—1.95 µg/mL), after 24 h of incubation at 37 °C.

Author Contributions

Conceptualization, L.D. and I.A.; methodology, L.D., C.L.C., L.G.-G. and I.A.; software, L.D. and I.A.; validation, L.D., C.L.C., I.A. and L.G.-G.; formal analysis, L.D., C.L.C., L.G.-G. and I.A.; investigation, L.D., C.L.C., L.G.-G. and I.A.; resources, I.A.; data curation, L.D. and I.A.; writing—original draft preparation, L.D., C.L.C., L.G.-G. and I.A.; writing—review and editing, L.D. and I.A.; supervision, L.D. and I.A.; project administration, I.A.; funding acquisition, I.A. All authors have read and agreed to the published version of the manuscript.

Funding

This work was supported by a grant from the Ministry of Research, Innovation and Digitization, CNCS/CCCDI-UEFISCDI, project number ERANET-M-3-SMARTGEL, within PNCDI IV.

Institutional Review Board Statement

Not applicable.

Informed Consent Statement

Not applicable.

Data Availability Statement

The raw data supporting the conclusions of this article will be made available by the authors on request.

Acknowledgments

The Integrated Center for Research, Expertise and Technological Transfer in the Food Industry is acknowledged for providing technical support.

Conflicts of Interest

The authors declare no conflicts of interest.

References

  1. Devirgiliis, C.; Guberti, E.; Mistura, L.; Raffo, A. Effect of fruit and vegetable consumption on human health: An update of the literature. Foods 2024, 13, 3149. [Google Scholar] [CrossRef]
  2. Denev, P.N.; Kratchanov, C.G.; Ciz, M.; Lojek, A.; Kratchanova, M.G. Bioavailability and antioxidant activity of black chokeberry (Aronia melanocarpa) polyphenols: In vitro and in vivo evidences and possible mechanisms of action: A review. Compr. Rev. Food Sci. Food Saf. 2012, 11, 471–489. [Google Scholar] [CrossRef]
  3. Zhang, Y.; Zhao, Y.; Liu, X.; Chen, X.; Ding, C.; Dong, L.; Zhang, J.; Sun, S.; Ding, Q.; Khatoom, S.; et al. Chokeberry (Aronia melanocarpa) as a new functional food relationship with health: An Overview. J. Future Foods 2021, 1–2, 168–178. [Google Scholar] [CrossRef]
  4. Lee, K.L.; Kim, S.; Lee, J.; Son, H.; Lee, J.; Park, C.; Yoo, H. Improved recovery of antioxidants from aronia juice processing residue via optimization of extraction variables based on multi-prediction models. Sus. Chem. Pharm. 2024, 39, 101546. [Google Scholar] [CrossRef]
  5. Available online: https://www.futuremarketinsights.com/reports/aronia-berries-market (accessed on 27 May 2025).
  6. Jakobek, L.; Šeruga, M.; Medvidovíc-Kosanovic, M.; Novak Jovanovic, I. Antioxidant Activity and Polyphenols of Aronia in Comparison to other Berry Species. Agric. Conspec. Sci. 2007, 72, 301–306. [Google Scholar]
  7. Andrade, T.A.; Hamerski, F.; Lopez Fetzer, D.; Roda-Serrat, M.C.; Corazza, M.L.; Norddahl, B.; Errico, M. Ultrasound-assisted pressurized liquid extraction of anthocyanins from Aronia melanocarpa pomace. Sep. Purif. Technol. 2021, 276, 119290. [Google Scholar] [CrossRef]
  8. Frumuzachi, O.; Rohn, S.; Mocan, A. Fermented Black Chokeberry (Aronia melanocarpa (Michx.) Elliott) products—A systematic review on the composition and current scientific evidence of possible health benefits. Food Res. Int. 2024, 196, 115094. [Google Scholar] [CrossRef] [PubMed]
  9. Sidor, A.; Dro, A.; Gramza-Micha, A. Black chokeberry (Aronia melanocarpa) and its products as potential health-promoting factors—An overview. Trends Food Sci. Technol. 2019, 89, 45–60. [Google Scholar] [CrossRef]
  10. Ghanbari, S.A.; Mousavi, S.; Bereswill, S.; Heimesaat, M.M. A review of the anti-bacterial effects exerted by Aronia melanocarpa. Eur. J. Microbiol. Immunol. 2025, 15, 13–20. [Google Scholar] [CrossRef]
  11. Liepiņa, I.; Nikolajeva, V.; Jākobsone, I. Antimicrobial activity of extracts from fruits of Aronia melanocarpa and Sorbus aucuparia. Environ. Exp. Biol. 2013, 11, 195–199. [Google Scholar]
  12. Rodríguez-Werner, M.; Winterhalter, P.; Esatbeyoglu, T. Phenolic Composition, radical scavenging activity and an approach for authentication of Aronia melanocarpa berries, juice, and pomace. J. Food Sci. 2019, 84, 1791–1798. [Google Scholar] [CrossRef] [PubMed]
  13. Chemat, F.; Rombaut, N.; Sicaire, A.G.; Meullemiestre, A.; Fabiano-Tixier, A.S.; Abert-Vian, M. Ultrasound assisted extraction of food and natural products. mechanisms, techniques, combinations, protocols and applications. A Review. Ultrason. Sonochem. 2017, 34, 540–560. [Google Scholar] [CrossRef]
  14. Shen, L.; Pang, S.; Zhong, M.; Sun, Y.; Qayum, A.; Liu, Y.; Rashid, A.; Xu, B.; Liang, Q.; Ma, H.; et al. A comprehensive review of ultrasonic assisted extraction (UAE) for bioactive components: Principles, advantages, equipment, and combined technologies. Ultrason. Sonochem. 2023, 101, 106646. [Google Scholar] [CrossRef]
  15. Sethi, S.; Rathod, V. Recent advances in ultrasound-assisted extraction of natural products using novel solvents: A mini-review. Chem. Eng. 2025, 48, 101132. [Google Scholar] [CrossRef]
  16. Xu, Y.Y.; Qiu, Y.; Ren, H.; Ju, D.H.; Jia, H.L. Optimization of ultrasound-assisted aqueous two-phase system extraction of polyphenolic compounds from Aronia melanocarpa pomace by response surface methodology. Prep. Biochem. Biotechnol. 2017, 47, 312–321. [Google Scholar] [CrossRef] [PubMed]
  17. Galvan D’Alessandro, L.; Kriaa, K.; Nikov, I.; Dimitrov, K. Ultrasound assisted extraction of polyphenols from black chokeberry. Sep. Purif. Technol. 2012, 93, 42–47. [Google Scholar] [CrossRef]
  18. Dumitraşcu, L.; Enachi, E.; Stănciuc, N.; Aprodu, I. Optimization of ultrasound assisted extraction of phenolic compounds from cornelian cherry fruits using response surface methodology. CyTA-J. Food 2019, 17, 814–823. [Google Scholar] [CrossRef]
  19. Mihalcea, L.; Aprodu, I.; Dumitrașcu, L.; Cucolea, E.I.; Dănilă, G.-M.; Enachi, E.; Barbu, V.; Constantin, O.E.; Grigore-Gurgu, L.; Stănciuc, N. Whey proteins isolate-based biopolymeric combinations to microencapsulate supercritical fluid extracted oleoresins from sea buckthorn pomace. Pharmaceuticals 2021, 14, 1217. [Google Scholar] [CrossRef]
  20. Li, J.; Li, S.; Li, H.; Guo, X.; Guo, D.U.; Yang, Y.; Wang, X.; Zhang, C.; Shan, Z.; Xia, X.; et al. Antibiofilm activity of shonin against Listeria monocytogenes and inhibition of key virulence factors. Food Control 2021, 120, 107558. [Google Scholar] [CrossRef]
  21. Gómez-Sequeda, N.; Cáceres, M.; Stashenko, E.E.; Hidalgo, W.; Ortiz, C. Antimicrobial and antibiofilm activities of essential oils against Escherichia coli o157:H7 and methicillin-resistant Staphylococcus aureus (MRSA). Antibiotics 2020, 9, 730. [Google Scholar] [CrossRef]
  22. Eberhardt, J.; Santos-Martins, D.; Tillack, A.F.; Forli, S. AutoDock Vina 1.2.0: New Docking Methods, Expanded Force Field, and Python Bindings. J. Chem. Inf. Model. 2021, 61, 3891–3898. [Google Scholar] [CrossRef] [PubMed]
  23. Bugnon, M.; Röhrig, U.F.; Goullieux, M.; Perez, M.A.S.; Daina, A.; Michielin, O.; Zoete, V. SwissDock2024: Major enhancements for small-molecule docking with Attracting Cavities and AutoDock Vina. Nucleic Acids Res. 2024, 52, W324–W332. [Google Scholar] [CrossRef]
  24. Berman, H.M.; Westbrook, J.; Feng, Z.; Gilliland, G.; Bhat, T.N.; Weissig, H.; Shindyalov, I.N.; Bourne, P.E. The protein data bank. Nuc. Acids Res. 2000, 28, 235–242. [Google Scholar] [CrossRef]
  25. Stanger, F.V.; Dehio, C.; Schirmer, T. Structure of the N-terminal Gyrase B fragment in complex with ADP⋅ Pi reveals rigid-body motion induced by ATP hydrolysis. PLoS ONE 2014, 9, 107289. [Google Scholar] [CrossRef] [PubMed]
  26. Velarde, J.J.; Varney, K.M.; Inman, K.G.; Farfan, M.; Dudley, E.; Fletcher, J.; Weber, D.J.; Nataro, J.P. Solution structure of the novel dispersin protein of enteroaggregative Escherichia coli. Mol. Microbiol. 2007, 66, 1123–1135. [Google Scholar] [CrossRef] [PubMed]
  27. Qiu, X.; Janson, C.A.; Smith, W.W.; Green, S.M.; McDevitt, P.; Johanson, K.; Carter, P.; Hibbs, M.; Lewis, C.; Chalker, A.; et al. Crystal structure of Staphylococcus aureus tyrosyl-tRNA synthetase in complex with a class of potent and specific inhibitors. Prot. Sci. 2001, 10, 2008–2016. [Google Scholar] [CrossRef]
  28. Lu, Y.; Vibhute, S.; Li, L.; Okumu, A.; Ratigan, S.C.; Nolan, S.; Papa, J.L.; Mann, C.A.; English, A.; Chen, A.; et al. Optimization of TopoIV potency, ADMET properties, and hERG inhibition of 5-amino-1, 3-dioxane-linked novel bacterial topoisomerase inhibitors: Identification of a lead with in vivo efficacy against MRSA. J. Med. Chem. 2021, 64, 15214–15249. [Google Scholar] [CrossRef]
  29. Humphrey, W.; Dalke, A.; Schulten, K. VMD: Visual molecular dynamics. J. Mol. Graph. 1996, 14, 33–38. [Google Scholar] [CrossRef]
  30. Wallace, A.C.; Laskowski, R.A.; Thornton, J.M. LIGPLOT: A program to generate schematic diagrams of protein-ligand interactions. Prot. Eng. 1995, 8, 127–134. [Google Scholar] [CrossRef]
  31. Krissinel, E. Crystal contacts as nature’s docking solutions. J. Comput. Chem. 2010, 31, 133–143. [Google Scholar] [CrossRef]
  32. Kaloudi, T.; Tsimogiannis, D.; Oreopoulou, V. Aronia Melanocarpa: Identification and Exploitation of Its Phenolic Components. Molecules 2022, 27, 4375. [Google Scholar] [CrossRef] [PubMed]
  33. Sady, S.; Matuszak, L.; Błaszczyk, A. Optimisation of ultrasonic-assisted extraction of bioactive compounds from Chokeberry Pomace using response surface methodology. Acta Sci. Pol. Technol. Aliment. 2019, 18, 249–256. [Google Scholar] [CrossRef]
  34. Dobros, N.; Zielińska, A.; Siudem, P.; Zawada, K.D.; Paradowska, K. Profile of bioactive components and antioxidant activity of Aronia melanocarpa fruits at various stages of their growth, using chemometric Methods. Antioxidants 2024, 13, 462. [Google Scholar] [CrossRef] [PubMed]
  35. Sagandyk, A.T.; Liberal, Â.; da Silveira, T.F.; Alves, M.J.; Ferreira, I.C.; Zhakupova, G.N.; Makangali, K.; Tultabayeva, T.C.; Barros, L. Nutritional, phytochemical, and bioactive prospects of black chokeberry (Aronia melanocarpa) and saskatoon berry (Amelanchier ovalis) grown in the Republic of Kazakhstan. App. Food Res. 2024, 4, 100564. [Google Scholar] [CrossRef]
  36. Oszmiański, J.; Lachowicz, S. Effect of the production of dried fruits and juice from chokeberry (Aronia melanocarpa L.) on the content and antioxidative activity of bioactive compounds. Molecules 2016, 21, 1098. [Google Scholar] [CrossRef]
  37. Sidor, A.; Gramza-Michałowska, A. Black chokeberry Aronia melanocarpa L.—A qualitative composition, phenolic profile and antioxidant potential. Molecules 2019, 24, 3710. [Google Scholar] [CrossRef]
  38. Higbee, J.; Solverson, P.; Zhu, M.; Carbonero, F. The emerging role of dark berry polyphenols in human health and nutrition. Food Front. 2022, 3, 3–27. [Google Scholar] [CrossRef]
  39. Rugină, D.; Diaconeasa, Z.; Coman, C.; Bunea, A.; Socaciu, C.; Pintea, A. Chokeberry anthocyanin extract as pancreatic β-cell protectors in two models of induced oxidative stress. Oxidative Med. Cell. Longev. 2015, 2015, 429075. [Google Scholar] [CrossRef]
  40. Meilan, L.; Beads, G.; Hongmei, L.; Chengzhe, J. Preliminary study on the antioxidant activity of sorbus nigrum on liver and kidney of mice. Livest. Feed. Sci. 2018, 39, 1388. [Google Scholar]
  41. Lou, Z.; Wang, H.; Zhu, S.; Ma, C.; Wang, Z. Antibacterial Activity and mechanism of action of chlorogenic acid. J. Food Sci. 2011, 76, M398–M403. [Google Scholar] [CrossRef]
  42. Wu, Y.; Liang, S.; Zhang, M.; Wang, Z.; Wang, Z.; Ren, X. The effect of chlorogenic acid on Bacillus subtilis based on metabolomics. Molecules 2020, 25, 4038. [Google Scholar] [CrossRef] [PubMed]
  43. Sirk, T.W.; Brown, E.F.; Sum, A.K.; Friedman, M. Molecular dynamics study on the biophysical interactions of seven green tea catechins with lipid bilayers of cell membranes. J. Agric. Food Chem. 2008, 56, 7750–7758. [Google Scholar] [CrossRef]
  44. Wu, M.; Brown, A.C. Applications of catechins in the treatment of bacterial infections. Pathogens 2021, 10, 546. [Google Scholar] [CrossRef]
  45. Wang, S.; Yao, J.; Zhou, B.; Yang, J.; Chaudry, M.T.; Wang, M.; Xiao, F.; Li, Y.; Yin, W. Bacteriostatic effect of quercetin as an antibiotic alternative in vivo and its antibacterial mechanism in vitro. J. Food Prot. 2018, 81, 68–78. [Google Scholar] [CrossRef] [PubMed]
  46. Hirai, I.; Okuno, M.; Katsuma, R.; Arita, N.; Tachibana, M.; Yamamoto, Y. Characterisation of Anti-Staphylococcus aureus Activity of quercetin. Int. J. Food Sci. Technol. 2010, 45, 1250–1254. [Google Scholar] [CrossRef]
  47. Abreu, A.C.; Serra, S.C.; Borges, A.; Saavedra, M.J.; Mcbain, A.J.; Salgado, A.J.; Simões, M. Combinatorial activity of flavonoids with antibiotics against drug-resistant Staphylococcus aureus. Microb. Drug Resist. 2015, 21, 600–609. [Google Scholar] [CrossRef]
  48. Kannan, S.; Balakrishnan, J.; Govindasamy, A.; Arunagiri, R. New insights into the antibacterial mode of action of quercetin against uropathogen Serratia marcescens in-vivo and in-vitro. Sci. Rep. 2022, 12, 21912. [Google Scholar] [CrossRef]
  49. Valcheva-Kuzmanova, S.; Belcheva, A. Current knowledge of Aronia melanocarpa as a medicinal plant. Folia Med. 2005, 48, 11–17. [Google Scholar]
  50. Salamon, I.; Şimşek Sezer, E.N.; Kryvtsova, M.; Labun, P. Antiproliferative and antimicrobial activity of anthocyanins from berry fruits after their isolation and freeze-drying. App. Sci. 2021, 11, 2096. [Google Scholar] [CrossRef]
  51. Deng, H.; Zhu, J.; Tong, Y.; Kong, Y.; Tan, C.; Wang, M.; Wan, M.; Meng, X. Antibacterial Characteristics and Mechanisms of Action of Aronia melanocarpa Anthocyanins against Escherichia coli. LWT Food Sci. Technol. 2021, 150, 112018. [Google Scholar] [CrossRef]
  52. Apostolos, A.J.; Pires, M.M. Impact of crossbridge structure on peptidoglycan crosslinking: A synthetic stem peptide approach. In Methods in Enzymology; Carlson, E., Ed.; Academic Press: Cambridge, MA, USA, 2022; Volume 665, pp. 259–279. [Google Scholar]
  53. Dias, K.J.S.D.O.; Miranda, G.M.; Bessa, J.R.; Araújo, A.C.J.D.; Freitas, P.R.; Almeida, R.S.D.; Paulo, C.L.R.; Neto, J.B.D.A.; Coutinho, H.D.M.; Ribeiro-Filho, J. Terpenes as bacterial efflux pump inhibitors: A systematic review. Front. Pharmacol. 2022, 13, 953982. [Google Scholar] [CrossRef] [PubMed]
  54. Dos Santos Barbosa, C.R.; Scherf, J.R.; De Freitas, T.S.; De Menezes, I.R.A.; Pereira, R.L.S.; Dos Santos, J.F.S.; De Jesus, S.S.P.; Lopes, T.P.; De Sousa Silveira, Z.; De Morais Oliveira-Tintino, C.D.; et al. Effect of carvacrol and thymol on NorA efflux pump inhibition in multidrug-resistant (MDR) Staphylococcus aureus strains. J. Bioenerg. Biomembr. 2021, 53, 489–498. [Google Scholar] [CrossRef] [PubMed]
  55. Martelli, G.; Giacomini, D. Antibacterial and antioxidant activities for natural and synthetic dual-active compounds. Eur. J. Med. Chem. 2018, 158, 91–105. [Google Scholar] [CrossRef] [PubMed]
  56. Pisano, M.B.; Kumar, A.; Medda, R.; Gatto, G.; Pal, R.; Fais, A.; Matos, M.J. Antibacterial activity and molecular docking studies of a selected series of hydroxy-3-arylcoumarins. Molecules 2019, 24, 2815. [Google Scholar] [CrossRef]
  57. Plaper, A.; Golob, M.; Hafner, I.; Oblak, M.; Šolmajer, T.; Jerala, R. Characterization of quercetin binding site on DNA gyrase. Biochem. Biophys. Res. Commun. 2003, 306, 530–536. [Google Scholar] [CrossRef]
  58. Fang, Y.; Lu, Y.; Zang, X.; Wu, T.; Qi, X.; Pan, S.; Xu, X. 3D-QSAR and docking studies of flavonoids as potent Escherichia coli inhibitors. Sci. Rep. 2016, 6, 23634. [Google Scholar] [CrossRef]
  59. Abishad, P.; Niveditha, P.; Unni, V.; Vergis, J.; Kurkure, N.V.; Chaudhari, S.; Rawool, D.B.; Barbuddhe, S.B. In silico molecular docking and in vitro antimicrobial efficacy of phytochemicals against multi-drug-resistant enteroaggregative Escherichia coli and non-typhoidal Salmonella spp. Gut Pathog. 2021, 13, 46. [Google Scholar] [CrossRef]
Figure 1. LC-HRMS chromatogram of BC pomace extract. The upper panel shows the total ion current (TIC) acquired in full-scan mode (50–1000 m/z), while the lower panels (from top to bottom) represent extracted ion chromatograms corresponding to the m/z values and retention times of caffeic acid (m/z 179.0350, TR 6.60); rutin (m/z 609.1461, TR 12.60); quercetin (m/z 301.0.354, TR 13.59); vanillic acid (m/z 167.0350, TR 8.68); pinocembrin (m/z 255.0663, TR 18.45); neochlorogenic/chlorogenic acid (m/z 353.0878, TR 3.95 and 6.19, respectively); and naringin (m/z 579.1718, TR 9.96). Chromatograms were extracted from TIC using a 5 ppm window.
Applsci 15 07070 g001
Figure 2. LC-HRMS extracted ion chromatograms of BC pomace, in which the following compounds were identified (from top to bottom): hydroxyferulic acid (m/z 371.0983, TR 6.75); eriodyctiol (m/z 287.0651, TR 14.20); petunidin caffeoyl diglucoside (m/z 802.1962, TR 6.22); gallocatechin (m/z 305.0666, TR 6.06); procyanidin B1 (m/z 577.1351, TR 11.82); procyanidin C1 (m/z 865.19854, TR 8.17); quinic acid (m/z 191.0561, TR 0.63); myricetin 3-O-galactoside (m/z 479.0831, TR 4.64). Chromatograms were extracted from TIC using a 5 ppm window.
Applsci 15 07070 g002
Figure 3. Superposition of the molecular complexes formed between targeted B subunit of DNA gyrase (a) and dispersin (b) from Escherichia coli or tyrosyl-tRNA synthetase (c) and DNA gyrase (d) from Staphylococcus aureus and bioactive compounds prevailing in the black chokeberry extract: catechin (blue), chlorogenic acid (red), quercetin (green) and rutin (orange). The protein models used as receptors in the docking procedure are represented in silver in new cartoon style, while the ligands are represented in Van der Waals style and DNA fragments (d) in violet in licorice style. The images were prepared with the VMD 1.9.3 software.
Applsci 15 07070 g003
Table 1. The effects of the ultrasound amplitude at a maximum of 40 °C, for 10 min, on the recovery of bioactive compounds (total phenolic content—TPC) from BC pomace in different solvents.
ComponentConventional
24 h, 25 °C
Ultrasound Amplitude, %
20304060
Solvent: Water
TPC mg GAE/g d.w.33.50 ± 1.32 A27.38 ± 1.46 Aa26.35 ± 3.08 Aa33.03 ± 3.15 Aa30.39 ± 3.66 Aa
DPPH scavenging activity mM Trolox/g d.w.103.84 ± 2.65 A73.10 ± 0.11 b82.95 ± 0.55 a80.84 ± 1.76 a78.03 ± 1.76 ab
ABTS+ scavenging activity mM Trolox/g d.w.163.03 ± 0.43 A150.26 ± 17.63 Ab228.41 ± 10.32 a226.58 ± 0.0 a228.41 ± 12.9 a
Solvent: 70% Ethanol
TPC mg GAE/g d.w.78.89 ± 3.00 A72.15 ± 1.39 Ac86.16 ± 0.66 a73.60 ± 1.39 Abc78.95 ± 2.34 Ab
DPPH scavenging activity mM Trolox/g d.w.149.12 ± 0.33 A149.59 ± 0.77 Aa151.16 ± 0.55 Aa149.91 ± 0.77 Aa153.19 ± 0.99 Aa
ABTS+ scavenging activity mM Trolox/g d.w.178.81 ± 1.50 A348.81 ± 8.6 a360.67 ± 4.73 a360.67 ± 3.87 a360.37 ± 5.16 a
Means within each row not labeled with the letter A are significantly different from the control level mean (obtained by conventional extraction), based on Dunnet’s method and 95% confidence. Means within each row labeled with different lowercase letters (a, b, c) are significantly different in regard to time effects and ultrasound exposure, based on Tukey’s method and 95% confidence.
Table 2. The influence of the ultrasound time at a 30% amplitude and a maximum of 40 °C on the recovery of bioactive compounds (total phenolic content—TPC) from BC pomace in different solvents.
ComponentConventional
24 h, 25 °C
Ultrasound Exposure, min
5101520
Solvent: Water
TPC mgGAE/g d.w.33.50 ± 1.32 A25.09 ± 0.0 b26.65 ± 3.08 b31.79 ± 0.95 abA37.29 ± 1.68 aA
DPPH scavenging activity mM Trolox/g d.w.103.84 ± 2.65 A64.10 ± 4.64 c82.95 ± 0.55 b79.51 ± 2.54 b98.75 ± 2.98 aA
ABTS+ scavenging activity mM Trolox/g d.w.163.03 ± 0.43 A163.34 ± 7.74 Ab201.34 ± 20.21 Ab183.10 ± 15.05 Ab269.15 ± 17.2 a
Solvent: 70% Ethanol
TPC mg GAE/g d.w.78.89 ± 3.00 A67.74 ± 2.34 a67.90 ± 3.44 a73.08 ± 0.51 Aa73.19 ± 1.39 Aa
DPPH scavenging activity mM Trolox/g d.w.149.12 ± 0.33 A149.12 ± 3.65 Aa154.99 ± 1.10 Aa154.05 ± 1.99 Aa155.22 ± 1.21 Aa
ABTS+ scavenging activity mM Trolox/g d.w.178.81 ± 1.50 A356.42 ± 0.43 a363.41 ± 4.3 a359.76 ± 5.16 a364.93 ± 1.29 a
Means within each row not labeled with the letter A are significantly different from the control level mean (obtained by conventional extraction), based on Dunnet’s method and 95% confidence. Means within each row labeled with different lowercase letters (a, b, c) are significantly different, based on Tukey’s method and 95% confidence.
Table 3. Quantitative analysis by UHPLC-HRMS, with the structures of the BC pomace compounds confirmed by comparison with reference standards.
CompoundChemical FormulaMonitored Ion [M-H]Retention Time (min)Amount (mg/100
g d.w.)
Chlorogenic acidC16H18O9353.087806.179045.88
Caffeic acidC9H8O4179.035016.60.265
EpicatechinC15H14O6289.071805.48791.44
Catechin C15H14O6289.071803.2965.55
Syringic acidC9H10O5197.045604.1311.41
p-Coumaric acidC9H8O3163.039506.7645.10
Ferulic acidC10H10O4193.0507012.6327.60
Hyperoside (quercetin-3-O-galactoside)C21H20O12463.0876810.82757.85
RutinC27H30O16609.1461012.61098.05
NaringinC27H32O14579.171859.9611.96
Abscisic acidC15H20O4263.1289014.8213.49
Gallic acidC7H6O5169.0143011.4127.62
QuercetinC15H10O7301.0354013.59564.80
ChrysinC15H10O4253.0506614.6922.61
PinocembrinC15H12O4255.0663018.4525.19
NaringeninC15H12O5271.0612015.645.93
DaidzinC21H20O9415.1034816.260.49
DaidzeinC15H10O4253.0506619.080.23
Vanillic acidC8H8O4167.035008.6847.13
Table 4. Compound names, formulae, m/z values of adduct ions and MS/MS fragment ions in negative ESI mode.
CompoundChemical FormulaMonitored Ion [M-H]Retention Time (min)Fragments
LiquiritigeninC15H12O4255.0663118.44211.0764; 135.00761; 119.04889; 117.03323
Kaempferol 3-O-rutosidC27H30O15593.151229.56299.05615; 255.02997; 227.0341
Azelaic acidC9H16O4187.0976114.12169.08600; 143.10655; 123.08015
CynarineC25H24O12515.1195012.4515; 353; 191
Rosmarinic acidC18H16O8359.077275.29161.0237; 135.0455; 133.0283
CarnasolC20H26O4329.1758618.86285.1856; 201.0897
Carnosic acidC20H28O4331.1915120.05287.2015
Neochlorogenic acidC16H18O9353.087803.93192.05876; 191.05544; 173.04474
Oleanoic acidC30H48O3455.3530925.16455.3507; 456.3572
GallocatechinC15H14O7305.066686.06137.0247; 125.0247; 109.0298
AesculetinC9H6O4177.0193310.51133.038; 105.0354
Naringenin-7-O-glucosideC21H22O10433.1140216.45271.0656; 151.0058
Chrysoeriol 7-O-glucosideC22H22O11461.1089615.62446.0844; 283.024; 255.0296
Apigenin-7-O-glucosidC21H20O10431.0983917.45269.0428; 268.037
Procyanidin B1C30H26O12577.135156.85125.0240; 289.0698; 407.0802
Procyanidin C1C45H38O18865.198548.17866.2419; 407.0965; 289.0844
Apigenin-O-glucuronideC21H18O11445.077636.52269.0455; 151.0012
Caraphenol B/CC28H22O7469.129286.86541.1187; 281.0819; 227.0714
Petunidin caffeoyl diglucosideC37H39O20802.196226.22640.1502; 478.0974
Dihydroquercetin 3-O-rhamnosideC21H22O11449.1089611.02285.0407; 151.0026; 123.0233
Dihydroquercetin-3-O-glucosideC21H22O12465.103877.99303.2508; 257.0452
Quercetin 3-vicianosideC26H28O16595.13054.26300.0262; 271.1450; 255.0276
Myricetin 3-O-galactosideC21H20O13479.083144.64317.0284; 271.0223; 151.0022
Hydroxyferulic acidC16H20O10371.098396.76209.0434; 165.0544
Quinic acidC7H12O6191.056110.63171.02702; 127.03691
Quercetin 3-O-glucuronideC21H18O13477.067408.17301.03558; 178.9986; 151.0013
Quercetin (quercetin 3-rhamnoside)C24H22O15549.08868.35300.0042; 505.0595
Eriodictyol C15H12O6287.056114.20135.0452; 117.0347; 89.0397
Eriodictyol-7-O-glucosideC21H22O11449.10898.34345.08292; 135.0453; 139.03893
Eriodictyol-7-glucuronideC21H20O12463.088210.82287.0655; 151.0038
Table 5. The inhibition zone diameters, the minimal inhibitory concentrations (MICs) and minimal bactericidal concentrations (MBCs) of BC extract against Escherichia coli, Staphylococcus aureus and Listeria monocytogenes.
Bacterial Strain
E. coliS. aureusL. monocytogenes
Inhibition zone diameter, mm25.50 ± 0.7017.00 ± 1.41nd
MIC, mg/mL0.51.0-
MBC, mg/mL>1.0>1.0-
nd—not detected.
Table 6. Details of the interactions established within the molecular complexes formed between the targeted B subunit of DNA gyrase (GyrB-N) and dispersin proteins from Escherichia coli or tyrosyl-tRNA synthetase (TyrRS) and DNA gyrase from Staphylococcus aureus and bioactive compounds prevailing in the black chokeberry extract: catechin (CAT), chlorogenic acid (CLA), quercetin (QUE) and rutin (RUT).
Complexes formed between GyrB-N and
CATCLAQUERUT
ΔGint, kcal/mol−7.22−7.04−7.26−9.01
ΔGdiss, kcal/mol0.010.29.70.0
Interaction surface, Å268.668.897.348.9
Interfacing residuesPhe41, Glu193, Tyr267, Cys268, Phe269, Pro274, Gln275, Arg276Phe41, Ile186, Lys189, Arg190, Glu193, Pro274, Thr336His38, Phe41, Arg190, Ile266, Pro274, Gln275, Arg276His38, Phe41, Ile186, Lys189, Arg190, Pro274, Arg276, Thr336
Amino acids involved in different types of interactions with the ligandsHydrophobic contacts: Phe41, Pro274, Arg276Ionic bonds: His38
Hydrophobic contacts: Tyr267, Phe269, Pro274
H bonds: Ile266
Hydrophobic contacts: Phe41, Pro274, Arg276
H bonds: His38
Hydrophobic contacts: Lys189, Tyr267,
Arg276, Pro274
Complexes formed between dispersin and
CATCLAQUERUT
ΔGint, kcal/mol−5.72−5.36−6.08−5.97
ΔGdiss, kcal/mol0.00.09.29.8
Interaction surface, Å249.769.991.465.5
Interfacing residuesAsp11, Pro12, Leu90, Thr91, Glu92, Trp93Ser13, Gln14, Ile16, Lys17, Gln18, Tyr23, Thr91Ala7, Asp8, Val10, Pro12, Leu90, Thr91, Glu92, Trp93, Ser98Ala7, Asp8, Val10, Asp11, Pro12, Glu92, Trp93, Ser96, Ser98
Amino acids involved in H bonds (no. of H bonds)Thr91,
Trp93
Lys17, Gln18, Thr91Thr91 (2),
Trp93
Val10, Ser96, Ser98
Complexes formed between TyrRS and
CATCLAQUERUT
ΔGint, kcal/mol−8.16−7.95−8.82−8.82
ΔGdiss, kcal/mol0.00.08.10.0
Interaction surface, Å286.480.1135.782.0
Interfacing residuesGly38, Ala39, Asp40, His50, Asp80, Thr75, Tyr170, Gln174, Asp195, Gln196Cys37, Gly38, Ala39, Asp40, His50, Pro53, Thr75, Asp80, Gly192, Gly193, Asp195, Gln196Tyr36, Gly38, Ala39, Asp40, Thr42, His50, Leu70, Thr75, Asp80, Asn124, Tyr170, Gln174, Asp177, Gln190, Asp195, Gln196Gly38, His47, Gly49, His50, Pro53, Gly193, Asp195, Gln196, Leu223, Val224, Phe232, Gly233, Lys234
Amino acids involved in different types of interactions with the ligandsH bonds: Thr75, Asp177, Gln190
Hydrophobic contacts: Gln174, Gln190
H bonds: Thr75
Hydrophobic contacts: Tyr36, Pro53, Gln196
H bonds: Gly38, Thr75 (2), Asp177, Gln190
Hydrophobic contacts: Gln174
H bonds: Gly49, Gly193, Val224, Phe232
Hydrophobic contacts: Ala39, Phe54, His50
Complexes formed between DNA gyrase and
CATCLAQUERUT
ΔGint, kcal/mol−7.39−7.45−7.56−9.37
ΔGdiss, kcal/mol13.513.613.413.6
Interaction surface with chains A/B, Å245.6/41.871.7/30.472.0/43.30/70.4
Interfacing residuesChain A: Arg323, Phe324
Chain B:
Glu28, Gly29, Asp30, Ser31, Gly52, Asp101
Chain A: Glu28, Gly29, Asp30, Ser31, Ala32, Gly52, Asp101, Pro281, His282, Gly283
Chain B:
Arg323, Phe324
Chain A:
Arg323, Phe324
Chain B: Glu28, Gly29, Asp30, Ser31, Arg51, Gly52, Asp101, Lys140
Chain B: Glu28, Ser31, Gly52, Lys53, Asp105, Ile109, Lys140, Arg234,
Ser285, Ser286
Amino acids (chain) involved in different types of interactions with the ligandsH bonds: Arg323(A),
Asp30(B), 2 Hb Ser31(B)
Hydrophobic contacts: Phe324(A)
π-stacking interactions:
Phe324(A)
H bonds: Asp30(A), Ser31(A), Pro281(A),
2 Hb Arg323(B)
Ionic bonds: Arg382(B)
Hydrophobic contacts: Phe324(B)
H bonds: Asp30(B), 3 Hb Ser31(B), Lys140(B),
Asp323(A)
π-stacking interactions:
Phe324(A)
H bonds: 2 Hb Glu28(B), Ser31(B), Lys53(B), Lys140(B), 2 Hb Ser285(B), 2 Hb Ser286(B)
ΔGint—free energy of receptor–ligand interaction; ΔGdiss—free energy of receptor–ligand dissociation.
Disclaimer/Publisher’s Note: The statements, opinions and data contained in all publications are solely those of the individual author(s) and contributor(s) and not of MDPI and/or the editor(s). MDPI and/or the editor(s) disclaim responsibility for any injury to people or property resulting from any ideas, methods, instructions or products referred to in the content.

