Article

Comparison of Selected Quality Parameters of Olive Oils Derived from Conventional and Organic Farming

Division of Food Quality Assessment, Department of Food Technology and Assessment, Faculty of Food Technology, Institute of Food Sciences, Warsaw University of Life Sciences, Nowoursynowska 159 Street, 02-787 Warsaw, Poland
*
Author to whom correspondence should be addressed.
Appl. Sci. 2025, 15(13), 7158; https://doi.org/10.3390/app15137158
Submission received: 23 May 2025 / Revised: 18 June 2025 / Accepted: 24 June 2025 / Published: 25 June 2025
(This article belongs to the Special Issue Application of Natural Components in Food Production)

Abstract

This research aimed to qualitatively analyze the composition of selected extra virgin olive oils from organic and conventional farming available on the Polish market. Determination of the fatty acid profile, determination of the sterol content, and measurement of the acidic and peroxide numbers of the olive oils were performed. Moreover, the content of phenolic acids was determined using the HPLC method, and the antioxidant activity was examined using, e.g., the FRAP and DPPH methods, to establish the differences between the analyzed olive oil samples. The most abundant fatty acids in the olive oil were monounsaturated fatty acids (65.60–78.50%) with oleic acid (59.54–75.36%), saturated fatty acids (14.60–20.49%) with palmitic acid (10.93–16.45%), and polyunsaturated fatty acids (7.80–15.04%) with linoleic acid (6.24–14.34%). The phytosterol fraction consisted of β-sitosterol, campesterol, stigmasterol, clerosterol, ∆5-avenasterol, cycloartenol, 24-methylenecycloartenol, and citrostadienol, and its concentration ranged from 775.23 to 1115.70 mg/kg of the olive oils. The conventional method of olive cultivation influenced campesterol concentration in the extra virgin olive oils, and the concentration was higher in such products than in organic. Tests conducted on the reduction of iron ions (FRAP method) showed that the olive oil obtained from conventional farming (except for one product) had slightly higher antioxidant activity (0.23–0.30 μmol TE/g of olive oil) than that obtained from organic farming (0.19–0.26 μmol TE/g of olive oil). The total content of phenolic acids (oleuropein, hydroxytyrosol, and tyrosol) in the extra virgin olive oils ranged from 133.20 to 226.82 mg/kg.

1. Introduction

The International Olive Council (IOC) defines extra virgin olive oil as oil obtained from the fruit of the olive tree (Olea europaea L.) solely by mechanical or other physical means, under conditions that do not lead to alterations in the oil’s natural composition. The oil must be produced at appropriate thermal conditions that prevent chemical changes and should undergo no treatments other than washing, decantation, centrifugation, and filtration [1]. The olive cultivar, climatic conditions of the region of origin, cultivation and harvesting methods, extraction technique, and transportation influence olive oil’s quality and chemical composition. Among all types of olive oil, cold-pressed extra virgin olive oil is considered the highest quality [2].
Its composition consists of 98–99% triacylglycerols, while the remaining 1–2% comprises minor components, including unsaponifiable matter and non-lipid compounds such as phenolics, pigments, and carotenoids, as well as lipid-derived substances like phospholipids and waxes. Olive oil is also rich in over 230 distinct chemical compounds, including aliphatic compounds, triterpenic alcohols, sterols, hydrocarbons, tocopherols, phenolic compounds, and volatile aromatic substances, which are responsible for the oil’s distinctive aroma, flavor, and nutritional benefits [3].
Over the past three decades, the production of organic olive oil in Mediterranean countries has increased significantly, driven by growing consumer interest. The main factor contributing to the rising demand is the belief that organic products offer superior nutritional and health benefits. Moreover, environmental considerations have also played a role; research indicates that biodiversity on organic farms is approximately 30% higher than conventional farms. This is attributed to the absence of synthetic pesticides and mineral fertilizers in organic agriculture, which promotes soil conservation and the maintenance of organic matter through environmentally friendly ground-cover management practices such as mowing and livestock grazing [4].
Conversely, conventional olive farming, which involves synthetic fertilizers, insecticides, and pesticides, may adversely affect the environment, the quality of the final product, and consumer health. Herbicides are commonly used to manage weeds, and there is a risk that residues may migrate into the oil, potentially compromising its quality. Studies by Berg et al. in 2018 [5] demonstrated that conventional agriculture disrupts the natural pest resistance of olive trees, increasing their dependency on insecticides, most notably dimethoate. In general, chemical plant protection agents can pollute water and soil, reducing biodiversity. Before harvest, intensive conventional practices often involve the complete removal of ground vegetation to facilitate fruit collection, which can lead to soil erosion. Additionally, pesticide exposure has been shown to pose health risks to farmers during application [5].
The prices of organic products are much higher than the prices of conventional products, but the increase in their consumption is still significant. Prices for organic olive oil are 2-fold higher than those for conventionally produced oils, and can be related to the potentially lower yields in organic farming, the use of more expensive agricultural materials, e.g., compost, manure, and legume seeds, the requirement for the maintenance of stringent quality standards, or the organic certification and auditing processes, all of which cost [4].
Ninfali et al., in 2008 [6], in a three-year study of organic and conventional olive oil cultivation, tried to describe the differences in the quality of extra virgin olive oils. After investigation of various parameters relating to the quality of extra virgin olive oils (acidity, peroxide index, and spectrophotometric data), the organoleptic properties (sensory panelists examination), and the nutritional properties (phenols, o-diphenols, secoiridoids, tocopherols, volatile compounds, antioxidant capacity), they stated that there were no differences in nutrient content and sensory properties between organic and conventional foods or they were specific over time [6]. Other observations were made by Jimenez et al. in 2015 [7] that suggested that fatty acid composition, phenol, tocopherol content, and oxidative stability were affected by cultivation practices. The phenol, total tocopherol, α-tocopherol, β-tocopherol, and linolenic acid contents were significantly higher in organic products. On the other hand, the authors declared that δ-tocopherol content, oleic acid, and oxidative stability were higher in the conventional oils than in the organic oil. Moreover, organic agronomical practices did not affect the acidity, peroxide index, or spectrophotometric constants of the extra virgin olive oils [7]. Other studies by Jimenez et al. in 2014 [8] reported that the content of tyrosol and hydroxytyrosol was higher in the conventionally farmed olive oils, except for the organic olive oils produced from olives in the last two stages of maturity [8].
Based on the data presented above, whether the cultivation method significantly influences the quality of extra virgin olive oil remains uncertain. This study aimed to analyze the composition of selected extra virgin olive oils from organic and conventional farming systems available on the Warsaw market (Poland) and determine whether oils from organic production exhibit superior quality compared to those from conventional systems. Furthermore, the impact of different cultivation practices—whether organic or conventional—on oil quality remains a subject of debate, with limited research available. Therefore, the influence of agronomic practices on oil quality needs to be clarified.

2. Materials and Methods

2.1. Materials

The study utilized the following groups of extra virgin olive oils (EVOOs): organically cultivated samples from Portugal (no. 1—name: Valle da Fonte, batch number: L-VFB2223, production year: 2024, cultivars: Verdeal, Madural, Cobrançosa, certification data: PT-BIO-05 Agricultural Portugal), Greece (no. 2—name: Lyrakis Family, batch number: EL-40-689, production year: 2024, cultivars: Koroneiki, certification data: GR-BIO-01 Greece Agriculture), Spain (no. 3—name: Bio village, batch number: L-398F61244P, production year: 2024, cultivars: no data, certification data: 1316990/01), Italy (no. 4—name: Costa d’Oro, batch number: L. 106992, production year: 2024, cultivars: no data, certification data: It Bio 009), and the European Union (no. 5—name: Ecowital, batch number: L11592334R2, production year: 2024, cultivars: no data, certification data: IT bio 009) and conventionally cultivated samples from Italy (no. 6—name: Olitalia, batch number: L208230430, production year: 2024, cultivars: no data), Portugal (no. 7—name: Gallo, batch number: L3248K8507, production year: 2024, cultivars: no data), Greece (no. 8—name: Biedronka, batch number: L 23222, production year: 2024, cultivars: no data), and Spain (no. 9—name: La Espanola, batch number: L 243298, production year: 2023, cultivars: no data).

2.2. Methods

2.2.1. Fatty Acid Profile in Olive Oils [9]

Approximately 50 mg of olive oil was weighed into Erlenmeyer flasks and dissolved in 2 mL of hexane. Then, 0.5 mL of 2 mol/dm3 KOH in methanol was added, and the transesterification reaction was conducted by shaking (Microshaker type 326, Premed, Warsaw, Poland) the samples for 1 h at room temperature. The resulting hexane layer was collected and transferred into a chromatographic glass vial for GC-MS analysis. The separation of fatty acid methyl esters was carried out using a gas chromatograph (Shimadzu QP-2010, Shimadzu Corporation, Kyoto, Japan) equipped with a mass spectrometer and a Quadrex 007/23 (Quadrex Corporation, Woodbridge, CT, USA) capillary column (30 m length, 0.25 mm i.d., 0.25 μm film thickness, stationary phase: poly(cyanopropylphenylmethyl)siloxane). The temperature program was as follows: initial temperature 50 °C for 1 min, then increased at 3 °C/min to 250 °C and held for 1 min. The carrier gas flow rate was 0.75 cm3/min. Injector and ion source temperatures were set at 230 °C and 200 °C, respectively; and the GC-MS interface temperature was 220 °C. The MS was operated in TIC mode (mass range: m/z 50–400), with an ionization energy of 70 eV. Total analysis time was approximately 60 min.
Individual fatty acid methyl esters were identified by comparing their mass spectra with those in the PAL 660 K (CTC Analytics AG, Fällanden, Switzerland) and WILEY 175 (John Wiley & Sons, Ltd., Chichester, UK) libraries and the literature data. The relative content of each fatty acid was calculated from the peak area percentage [%]. All analyses were performed in triplicate.

2.2.2. Sterol Content Determination in Olive Oils [9]

An internal standard solution was prepared by dissolving 10 mg of 5α-cholestane in chloroform in a 25 mL volumetric flask. Approximately 0.150–0.200 g of olive oil was weighed into glass vials, and 100 µL internal standard solution, 2 mL hexane, and 0.5 mL of 2 M KOH in methanol were added. Samples were vortexed (Tacx i-Vortex TTS 3 Basic, Tacx International, Wassenaar, The Netherlands) and left at room temperature for 1 h. The hexane layer was transferred to chromatographic vials, evaporated under nitrogen, then derivatized with 100 μL of pyridine and BSTFA + TMCS (99:1) to convert sterols into their trimethylsilyl ethers. Sterol trimethylsilyl ethers were separated using a GC-MS equipped with a capillary column (e.g., RTX-5; 30 m × 0.25 mm × 0.10 μm; stationary phase: dimethylphenylsiloxane). The temperature program was as follows: 65 °C for 2 min, then increased at 15 °C/min to 250 °C and held for 1 min, then increased at 5 °C/min to 310 °C and held for 13 min. Injector and ion source temperatures were 275 °C and 255 °C, respectively; the carrier gas was helium, 0.67 cm3/min; and the GC-MS interface temperature was 255 °C. The MS was operated in TIC mode (m/z range: 100–600), with an ionization energy of 70 eV. Sterols were identified compared to spectral libraries, and their contents [mg] were calculated based on the internal standard. Results were expressed in mg/kg of the olive oil sample. All measurements were performed in triplicate.

2.2.3. Determination of Acid Value [1]

Following the International Olive Council method, 10 g of each oil sample (±0.002 g) was weighed into Erlenmeyer flasks and dissolved in 100 mL of neutralized diethyl ether/ethanol mixture. Phenolphthalein was used as the indicator. Samples were titrated with 0.1 mol/L KOH solution until a persistent pale pink color was observed. The acid value was calculated as a percentage of oleic acid using the following formula:
A V = V × c × M 10 × m
where
  • V = volume of titrant (mL);
  • c = concentration of KOH solution (mol/L);
  • M = molar mass of oleic acid (282 g/mol);
  • m = mass of sample (g).
All measurements were performed in triplicate.

2.2.4. Determination of Peroxide Value [1]

The peroxide value (PV), indicating the content of peroxides and the degree of primary oxidation, was determined via iodometric titration with sodium thiosulfate. The PV is expressed in meq O2 per kg of fat, calculated according to the following formula:
P V = V × T × 1000   m
where
  • V = volume of sodium thiosulfate solution used (mL);
  • T = molarity of thiosulfate (mol/L);
  • m = mass of sample (g).
All analyses were performed in triplicate.

2.2.5. Spectrophotometric Measurement of UV Absorbance [10]

Approximately 0.25 g of oil (±1 mg) was weighed into 25 mL volumetric flasks, dissolved in isooctane, and diluted to volume. The absorbance of the solution was measured at 232 nm and 268 nm (Shimadzu UV 1240, Shimadzu Corporation, Kyoto, Japan) using a 10 mm quartz cuvette against pure solvent. After measuring absorbance at 268 nm, additional measurements were taken at λmax, λmax + 4, and λmax − 4 to determine the variation in specific extinction (∆K), calculated using the following formula:
K =   K m   K m 4 + K m + 4 2
Each sample was analyzed in triplicate.

2.2.6. DPPH Radical Scavenging Activity [10]

Sample Preparation—Phenolic Compound Extraction
A total of 1 g of oil was weighed into 15 mL centrifuge tubes and dissolved in 1 mL of hexane. Then, 1 mL of MeOH/H2O (3:2, v/v) was added. Samples were vortexed and centrifuged for 3 min at 3000 rpm, and then underwent ultrasonic extraction (21 kHz, 300 W) for 20 min (Bandelin Sonorex, Bandelin electronic GmbH & Co. KG, Berlin, Germany), a process which was repeated four times. The extract was washed with 2 mL of hexane, shaken, centrifuged again, and evaporated under nitrogen. The final extract was dissolved in 500 μL of MeOH/H2O (1:1, v/v).
Preparation of Standard Curve Solutions
A total of 3.9 mg of DPPH was dissolved in methanol to 100 mL. Trolox standards were prepared by dissolving 38 mg of Trolox in methanol to 100 mL, with subsequent dilutions to obtain concentrations ranging from 1.56 to 18.75 mL in 25 mL volumetric flasks.
Spectrophotometric Measurement Using a Microplate Reader
A total of 20 μL of the oil extract or Trolox standards was pipetted into 96-well plates, then 180 μL of DPPH solution. A blank was prepared with methanol instead of an extract. After 20 min incubation in the dark at room temperature, absorbance was measured at 518 nm using a SPECTROstar Nano reader (BMG LABTECH GmbH, Ortenberg, Germany). Antioxidant capacity was calculated from the Trolox standard curve (20–200 μM) and expressed as μmol TE/g of the olive oil. All samples were analyzed in triplicate.

2.2.7. FRAP Antioxidant Activity Assay [10]

Spectrophotometric Measurement Using Microplate Reader
Oil extracts (prepared as described in the paragraph Sample Preparation—Phenolic Compound Extraction) were diluted 20 fold. A total of 10 μL of extract was added to 190 μL of FRAP reagent (acetate buffer, 2,4,6-tris(2-pyridyl)-s-triazine, and ferric chloride) in a 96-well plate. A blank was prepared using methanol. Absorbance was measured at 593 nm after 6 min at room temperature using a SPECTROStar Nano reader.
Data Analysis
Results were calculated using a calibration curve for Trolox in the range of 0.005–0.04 μmol and expressed as μmol Trolox equivalents per gram of sample.

2.2.8. HPLC-DAD Analysis of Phenolic Compounds [10]

Phenolic compounds were extracted as follows: 1 g of oil was mixed with 1 mL of hexane, and then a methanol/water mixture (3:2, v/v) was added, and the sample was vortexed and centrifuged at 3000 rpm for 3 min. The extraction was performed in an ultrasonic bath at room temperature, with a frequency of 21 kHz and a heating power of 300 W for 20 min. The procedure was repeated four times. Subsequently, 2 mL of hexane was added to the extracted solution, vortexed, and centrifuged at 3000 rpm for 5 min. The hexane was then evaporated using a rotary evaporator, and then dried under a stream of nitrogen. The final extract was reconstituted in 500 μL of a methanol/water mixture (1:1, v/v).
The analyses were conducted using a Shimadzu HPLC system (Shimadzu, Kyoto, Japan), comprising an LC-40D XR solvent delivery module, an SIL-40C XR autosampler, a CTO-40C column oven, and a DGU-405 degasser. The system was coupled with an SPD-M40 photodiode array (PDA) detector.
Phenolic compounds were separated using a Luna pentafluorophenyl column (150 mm × 4.6 mm i.d., five μm particle size; Phenomenex, Torrance, CA, USA). The mobile phase consisted of solvent A (water with 0.1% formic acid) and solvent B (methanol/acetonitrile 1:1, v/v, with 0.1% formic acid), with a constant flow rate of 0.2 mL/min at 40 °C. The gradient elution program was as follows: 0–5 min, 5% B; 5–15 min, linear increase to 30% B; 15–40 min, gradient from 30% to 50% B; 40–50 min, ramp to 100% B. The injection volume was 35 μL. Data acquisition with the PDA detector was performed over a wavelength range of 210–400 nm, with chromatograms extracted at 280 nm for quantification.
Standard compounds were selected based on the typical phenolic profile of extra virgin olive oil. A mixture of three phenolic standards—4-hydroxyphenylacetic acid, oleuropein, and 2-(4-hydroxyphenyl)ethanol—was used for quantitative analysis and method validation. Method validation parameters included linearity, repeatability (intra-day and inter-day precision), limits of detection (LOD) (hydroxytyrosol: 0.75 ng/mL; tyrosol: 0.91 ng/mL; 3.75 ng/mL), and limits of quantification (LOQ) (hydroxytyrosol: 2.28 ng/mL; tyrosol: 2.75 ng/mL; 11.46 ng/mL). Linearity was assessed through calibration curves generated from HPLC analysis of standard solutions (ranges for tyrosol and hydroxytyrosol were 3–100 ng/mL and, for oleuropein, 25–100 ng/mL). Stock solutions of each standard were prepared in methanol at a concentration of 1 mg/L.

2.3. Statistical Analysis

All the results are reported as an arithmetic average, and the standard deviation was calculated from the replicates. Data were analyzed using one-way ANOVA within STATISTICA 13.3 software (Statsoft, Kraków, Poland). Tukey’s post hoc test and marginal means plots were used to determine significant differences between mean values at a significance level of p = 0.05.

3. Results and Discussion

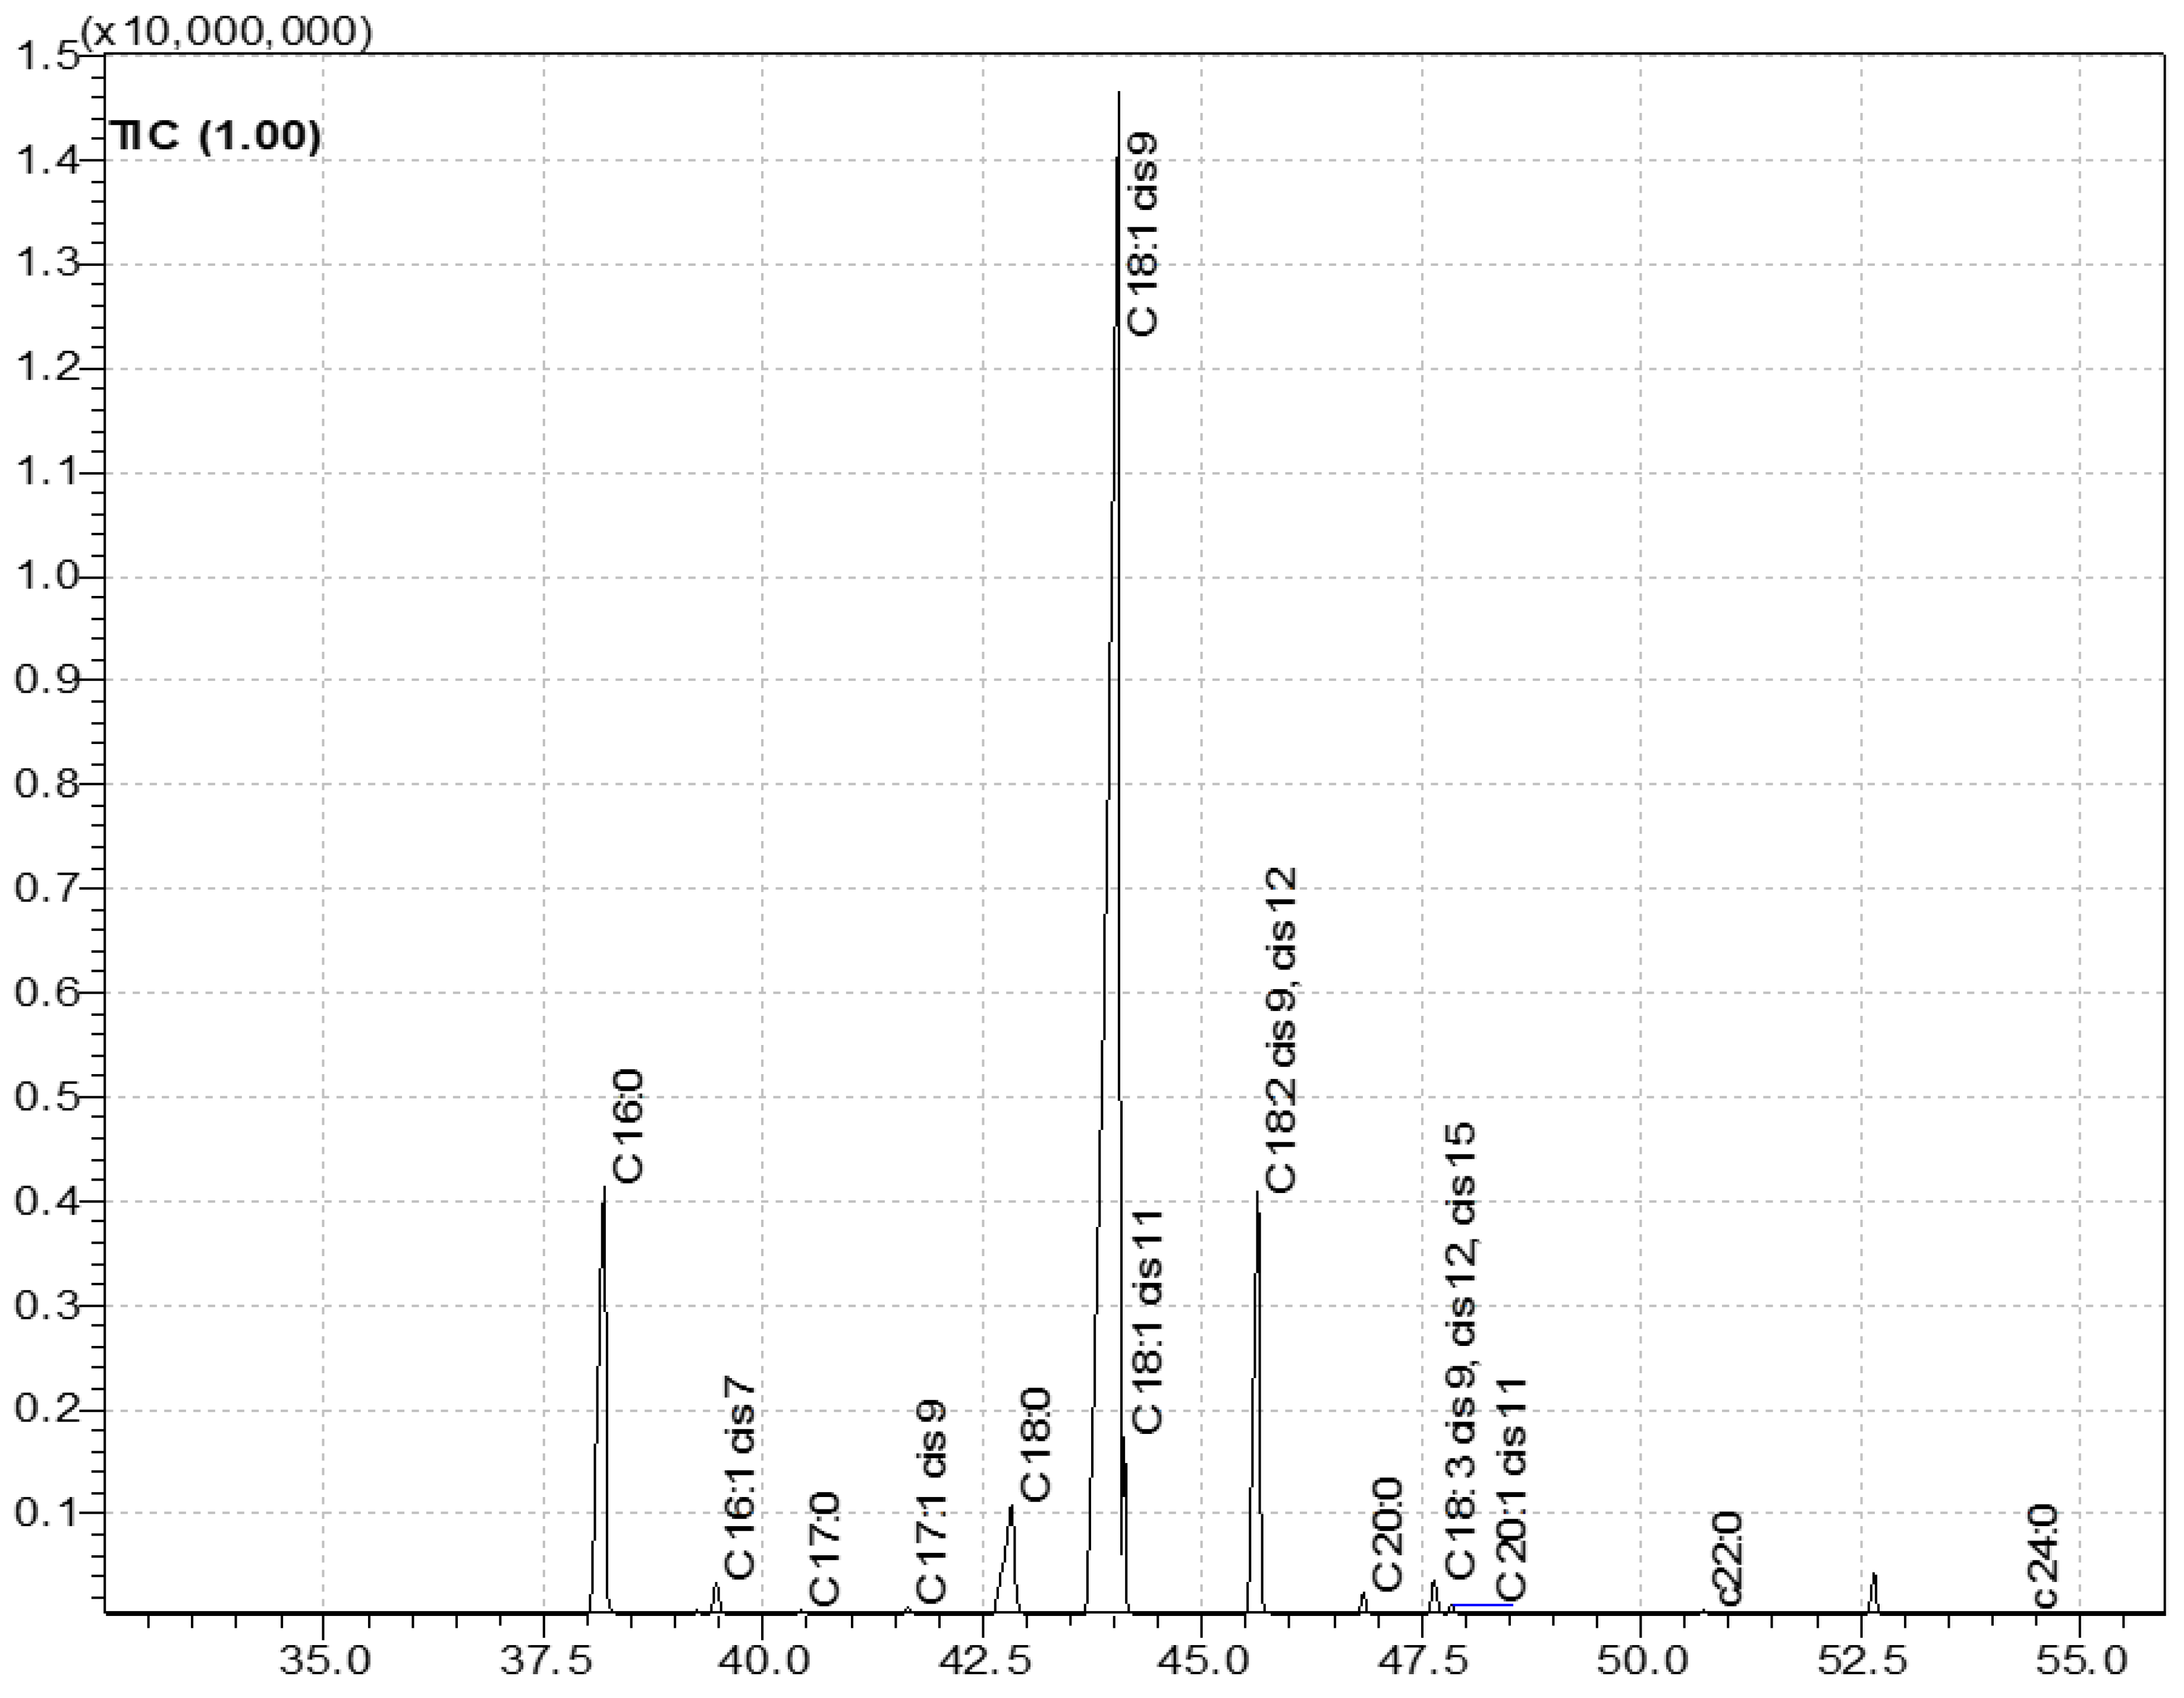
3.1. Fatty Acid Composition

Thirteen different fatty acids were identified in the analyzed olive oil samples, and the results of individual chromatographic analyses are summarized in Table 1. Figure 1 illustrates the separation of fatty acid methyl esters in a selected extra virgin olive oil.
Monounsaturated fatty acids (MUFAs) predominated in all samples, accounting for 65.58% to 78.52% of the total fatty acid content. Slightly lower MUFA content was observed in the organic olive oil sample no. 5 and the conventional olive oil sample no. 9. These two oils also exhibited the highest levels of saturated fatty acids (SFAs) (18.43–20.49%) and polyunsaturated fatty acids (PUFAs) (13.93–15.04%) among all tested samples.
Nowak et al. [11] observed that the monounsaturated, polyunsaturated, and saturated fatty acids in extra virgin olive oils from organic cultivation were comparable to those from conventional cultivation. Statistical analysis indicated no statistically significant differences (p < 0.05) in SFA, MUFA, and PUFA content between organic and conventionally cultivated oils. The SFA content in olive oils from conventional cultivation ranged from 16.70 to 17.01%, and, in oils from organic cultivation, from 17.14 to 17.46%. The MUFA content in olive oils from conventional cultivation ranged from 74.09 to 76.12%, and, in oils from organic cultivation, from 72.87 to 74.58%. The PUFA content in olive oils from conventional cultivation ranged from 7.18 to 8.89%, and, in oils from organic cultivation, from 8.28 to 9.67%. This suggests that the cultivation method did not influence the fatty acid profile of the analyzed oils.
All analyzed extra virgin olive oil samples met the requirements of the European Union Delegated Regulation 2022/2104 of 29 July 2022. According to the regulation, the fatty acid content in extra virgin olive oil should fall within the following ranges: oleic acid: 55.00–85.00%, palmitic acid: 7.00–20.00%, linoleic acid: 2.50–21.00%, stearic acid: 0.50–5.00%, palmitoleic acid: 0.30–3.50%, α-linolenic acid: ≤1.00%, arachidic acid: ≤0.60%, eicosenoic acid: ≤0.50%, heptadecanoic acid: ≤0.40%, and heptadecenoic acid: ≤0.60% [12].
The most abundant group in the overall fatty acid profile of the studied oils was the MUFA group. In all samples, oleic acid (C18:1 n-9 cis), a representative of MUFAs, was dominant, with its proportion ranging from 59.54% to 75.36%. Bouymajane et al. [13], in a study on the fatty acid composition of conventional extra virgin olive oils, confirmed that MUFAs were the predominant group, with oleic acid as the primary component, accounting for 69.79% to 79.39% of total fatty acids. Similar observations were reported by Nowak et al. [11], who characterized the fatty acid profile of organic extra virgin olive oils, finding oleic acid to be the most abundant, ranging from 72.49% to 74.18%.
Among all samples, the highest oleic acid content was found in the organic olive oil sample no. 2 (75.36%) and the conventional sample no. 6 (72.57%). Other MUFAs identified in lower amounts included palmitoleic acid (0.69–1.88%), heptadecenoic acid (0.07–0.31%), cis isomers of octadecenoic acid (2.10–3.80%), and eicosanoid acid (0.25–0.36%).
Based on the data presented in Table 1, among the SFAs, palmitic acid (C16:0) was the predominant component in all olive oil samples, both organic and conventional, with proportions ranging from 10.56% to 14.65%. Among the PUFAs, linoleic acid (C18:2 cis-9, cis-12) was dominant, accounting for 6.24% to 14.34% of the total fatty acids. The highest levels of palmitic and linoleic acids were found in organic sample no. 5 and conventional sample no. 9.
In addition to linoleic acid, α-linolenic acid (C18:3 cis-9, cis-12, cis-15) was also identified among the PUFAs, ranging from 0.66% to 0.87%. The remaining SFAs were present in smaller amounts and included heptadecanoic acid (0.05–0.13%), stearic acid (2.15–3.79%), arachidic acid (0.45–0.61%), behenic acid (0.12–0.29%), and lignoceric acid (0.05–0.13%).
Previous studies [9] reported that the second most abundant group of fatty acids in conventional extra virgin olive oils was the SFA group, with palmitic acid as the primary representative (8.8–12.8% of total fatty acids). The total SFA content ranged from 13.3% to 17.1%. According to Anastasopoulos et al. [14], SFAs constituted the second most abundant group in organic extra virgin olive oils, with palmitic acid accounting for 14.60% to 19.41%.
Bilušić et al. [15] conducted studies on conventional extra virgin olive oils, showing that linoleic acid content ranged from 6.65% to 10.55%, while α-linolenic acid was at 0.58% to 0.88%. Similarly, Nowak et al. [11] reported linoleic acid content in organic olive oils ranging from 7.56% to 8.94%.

3.2. Sterol Content in Olive Oils

Eight different phytosterols were identified in the research material, and their concentrations in the analyzed samples are presented in Table 2. The results are consistent with those reported by Gargouri et al. [16], who observed that β-sitosterol, ∆5-avenasterol, and campesterol are the most representative sterols in extra virgin olive oil. Notably, β-sitosterol, which is considered nutritionally beneficial due to its hypocholesterolemic effects, was the dominant sterol in the analyzed oils. This compound and other phytosterols inhibit intestinal cholesterol absorption and may help prevent the development of certain cancers, such as breast, colon, and prostate cancers [17].
The total phytosterol content in the tested oils, derived from both conventional and organic cultivation, varied and ranged from 775.23 to 1115.70 mg/kg (Table 2). Not all analyzed extra virgin olive oil samples met the European Union Delegated Regulation 2022/2104 requirements, which stipulates that the total sterol content in extra virgin olive oil should be ≥1000 mg/kg [12]. Organic samples nos. 1, 3, 4, and 5 and conventional samples nos. 7 and 9 met this criterion. The remaining samples had slightly lower total phytosterol contents, ranging from 775.23 to 893.43 mg/kg [7].
The sterol content determined by Anastasopoulos et al. [14] in extra virgin olive oils from organic cultivation ranged from 1119.0 mg/kg to 1388.9 mg/kg. In contrast, Sönmez et al. [18] reported sterol levels in organic olive oils ranging from 1597 to 1827 mg/kg. According to Giacalone et al. [19], the total sterol content in conventional olive oils ranged from 979 to as much as 2223 mg/kg.
Among the sterol fractions of the analyzed oils, β-sitosterol had the highest content, ranging from 476.08 to 774.79 mg/kg. ∆5-avenasterol was the second most abundant sterol, with levels between 45.22 and 140.47 mg/kg, followed by campesterol, which ranged from 18.26 to 35.37 mg/kg (Table 2). Clerosterol had the lowest concentration among the identified sterols, ranging from 4.90 to 8.27 mg/kg. Additionally, the analysis revealed the presence of compounds from the triterpene alcohol group. Cycloartenol was found in small amounts compared to 24-methylenecycloartenol, which, after β-sitosterol, was the second most abundant sterol in the profile, ranging from 63.27 to 185.93 mg/kg (Table 2). This can be explained by the fact that cycloartenol is the first cyclic triterpenoid precursor in phytosterol biosynthesis and serves as a substrate in the initial methylation step, leading to the production of larger amounts of 24-methylenecycloartenol [20].
The conventional extra virgin olive oils nos. 7 and 9 had the highest β-sitosterol content, while the lowest level was observed in the organic oil sample no. 2. However, no statistically significant differences (p ˃0.05) were found in β-sitosterol content between organic and conventional cultivation methods. In contrast, statistically significant differences (p < 0.05) were found for campesterol, indicating that the traditional cultivation method influenced its concentration in the oils. The organic oils, except sample no. 2, had the highest levels of 24-methylene-cycloartenol, while the lowest levels of this compound were found in the conventional oils, particularly in sample no. 7. The highest ∆5-avenasterol content was found in organic sample no. 2 and conventional sample no. 7, while the lowest was in conventional sample no. 8. No statistically significant differences (p < 0.05) that depended on the cultivation method were observed in ∆5-avenasterol and 24-methylenecycloartenol contents, suggesting that the type of cultivation had no significant impact on the concentration of these sterols in the oils.
Similar observations were made by Noorali et al. [21], who reported that β-sitosterol had the highest share in all conventional extra virgin olive oils, ranging from 66.5% to 86.5%. ∆5-avenasterol was the second most prevalent compound, accounting for 5.7% to 22.4%. In contrast to the present study, Noorali et al. in 2014 [21] reported a lower proportion of campesterol, ranging from 2.25% to 3.54%. These findings were confirmed by Konuskan et al. [22], who indicated that the most characteristic sterols in extra virgin olive oil, in decreasing order of content, were β-sitosterol (71.21–88.69%), ∆5-avenasterol (2.74–21.30%), and campesterol (1.52–3.68%), while clerosterol had the lowest concentration (0.83–1.16%).
According to Sönmez et al. [18], the β-sitosterol content in olive oils from organic cultivation ranged from 828.8 to 877.7 mg/kg, ∆5-avenasterol content from 49.3 to 84.2 mg/kg, and campesterol content from 24.4 to 34.0 mg/kg. In contrast, Giacalone et al. [19] reported β-sitosterol content in conventional olive oils ranging from 800 to as high as 1874 mg/kg, with campesterol levels between 29.4 and 55.0 mg/kg. ∆5-avenasterol was not measured in that particular study. However, Dag et al. [23] conducted sterol analysis in conventionally cultivated olive oils and confirmed β-sitosterol levels between 736.8 and 898.3 mg/kg, ∆5-avenasterol levels between 64.9 and 236.4 mg/kg, and campesterol levels between 18.9 and 31.9 mg/kg.

3.3. Acid Value (%), Peroxide Value (mEq O2/kg), and Extinction Coefficients K268, K232, and ∆K of Olive Olives

All analyzed olive oil samples exhibited acid values below the threshold established by the Commission Delegated Regulation (EU) 2022/2104 of 29 July 2022, which sets the maximum permissible acidity at ≤0.8% [12]. Similar findings were reported by Borges et al. [24] and Arfaoui et al. [25], where no exceedance of the acid value limit was observed in either conventional (0.15–0.75%) or organic (0.24–0.35%) olive oils. Likewise, Bengana et al. [26] found no violation of this limit in conventional oils, with acid values ranging from 0.2 to 0.3%. Giacometti et al. [27] also analyzed conventional olive oils with acid values ranging from 0.19 to 0.47%.
According to the results presented in Table 3, the lowest acid values were recorded in the conventional oil sample no. 7 (0.26%) and the organic oil sample no. 1 (0.28%). Conversely, the highest values were observed in conventional oils no. 6 (0.54%) and no. 8 (0.56%). Although all oils remained below the regulatory limit, the conventional oils exhibited slightly higher acid values. Based on the data in Table 3, the acid values did not differ significantly (p ˃ 0.05), indicating that the cultivation method had no statistically significant effect on this quality parameter.
All tested olive oil samples also complied with the peroxide value limits specified in Commission Delegated Regulation (EU) 2022/2104, which sets the maximum peroxide value for extra virgin olive oils at 20.0 mEq O2/kg. Borges et al. [24] reported that none of their analyzed conventional oils exceeded this limit. However, Barbieri et al. [28] noted that one exceeded the maximum peroxide value of four organic olive oil samples tested.
As shown in Table 3, the peroxide values of the tested oils, regardless of cultivation method, varied from 7.25 to 17.40 mEq O2/kg. The highest values were found in organic oil no. 5 (17.40 mEq O2/kg) and conventional oil no. 9 (16.01 mEq O2/kg), while the lowest were recorded in organic oil no. 1 (7.25 mEq O2/kg) and conventional oil no. 8 (9.46 mEq O2/kg). Organic oil no. 4 and conventional oil no. 6 had similar peroxide values, while the remaining samples showed greater variation, indicating that the cultivation method did not significantly affect peroxide value. Bouarroudj et al. [29] reported peroxide values for conventional olive oils ranging from 3.75 to 7.25 mEq O2/kg. In contrast, Barbieri et al. in 2015 observed peroxide values in organic oils ranging from 15.00 to 28.00 mEq O2/kg [28].
All analyzed samples also complied with the UV spectrophotometric criteria established in Commission Delegated Regulation (EU) 2022/2104, which sets the maximum values for extra virgin olive oil as follows: K232 ≤ 2.50, K268 ≤ 0.22, and ∆K ≤ 0.01 [12]. All organic and conventional cultivation samples exhibited low and comparable values, indicating high oil quality. The K268 values for the organic oils ranged from 0.08 to 0.10, and for the conventional oils from 0.09 to 0.10 (Table 3). The K232 values ranged from 0.10 to 0.12 for the organic oils and were 0.12 for all conventional oils. The ∆K values ranged from −0.011 to −0.005 for the organic oils and from −0.005 to −0.011 for the conventional ones. Statistical analysis (Table 3) showed no significant differences in these parameters, indicating that the cultivation method did not affect these extinction coefficients.
Willenberg et al. [30] reported K232 values of 1.54 to 2.32 and K268 values of 0.16 to 0.22 for conventional extra virgin olive oils. Similarly, Ceci et al. [31] reported relatively high extinction values in conventional oils: K268 ranged from 0.09 to 0.22, and K232 exceeded the limit in some samples, ranging from 1.48 to 2.99. Comparable results were obtained by Garcia-Gonzalez et al. [32] and Barbieri et al. [28], who found K232 values in organic oils ranging from 1.76 to 2.46 and from 1.74 to 2.34, respectively. K268’s values ranged from 0.18 to 0.22 and from 0.14 to 0.19, respectively.

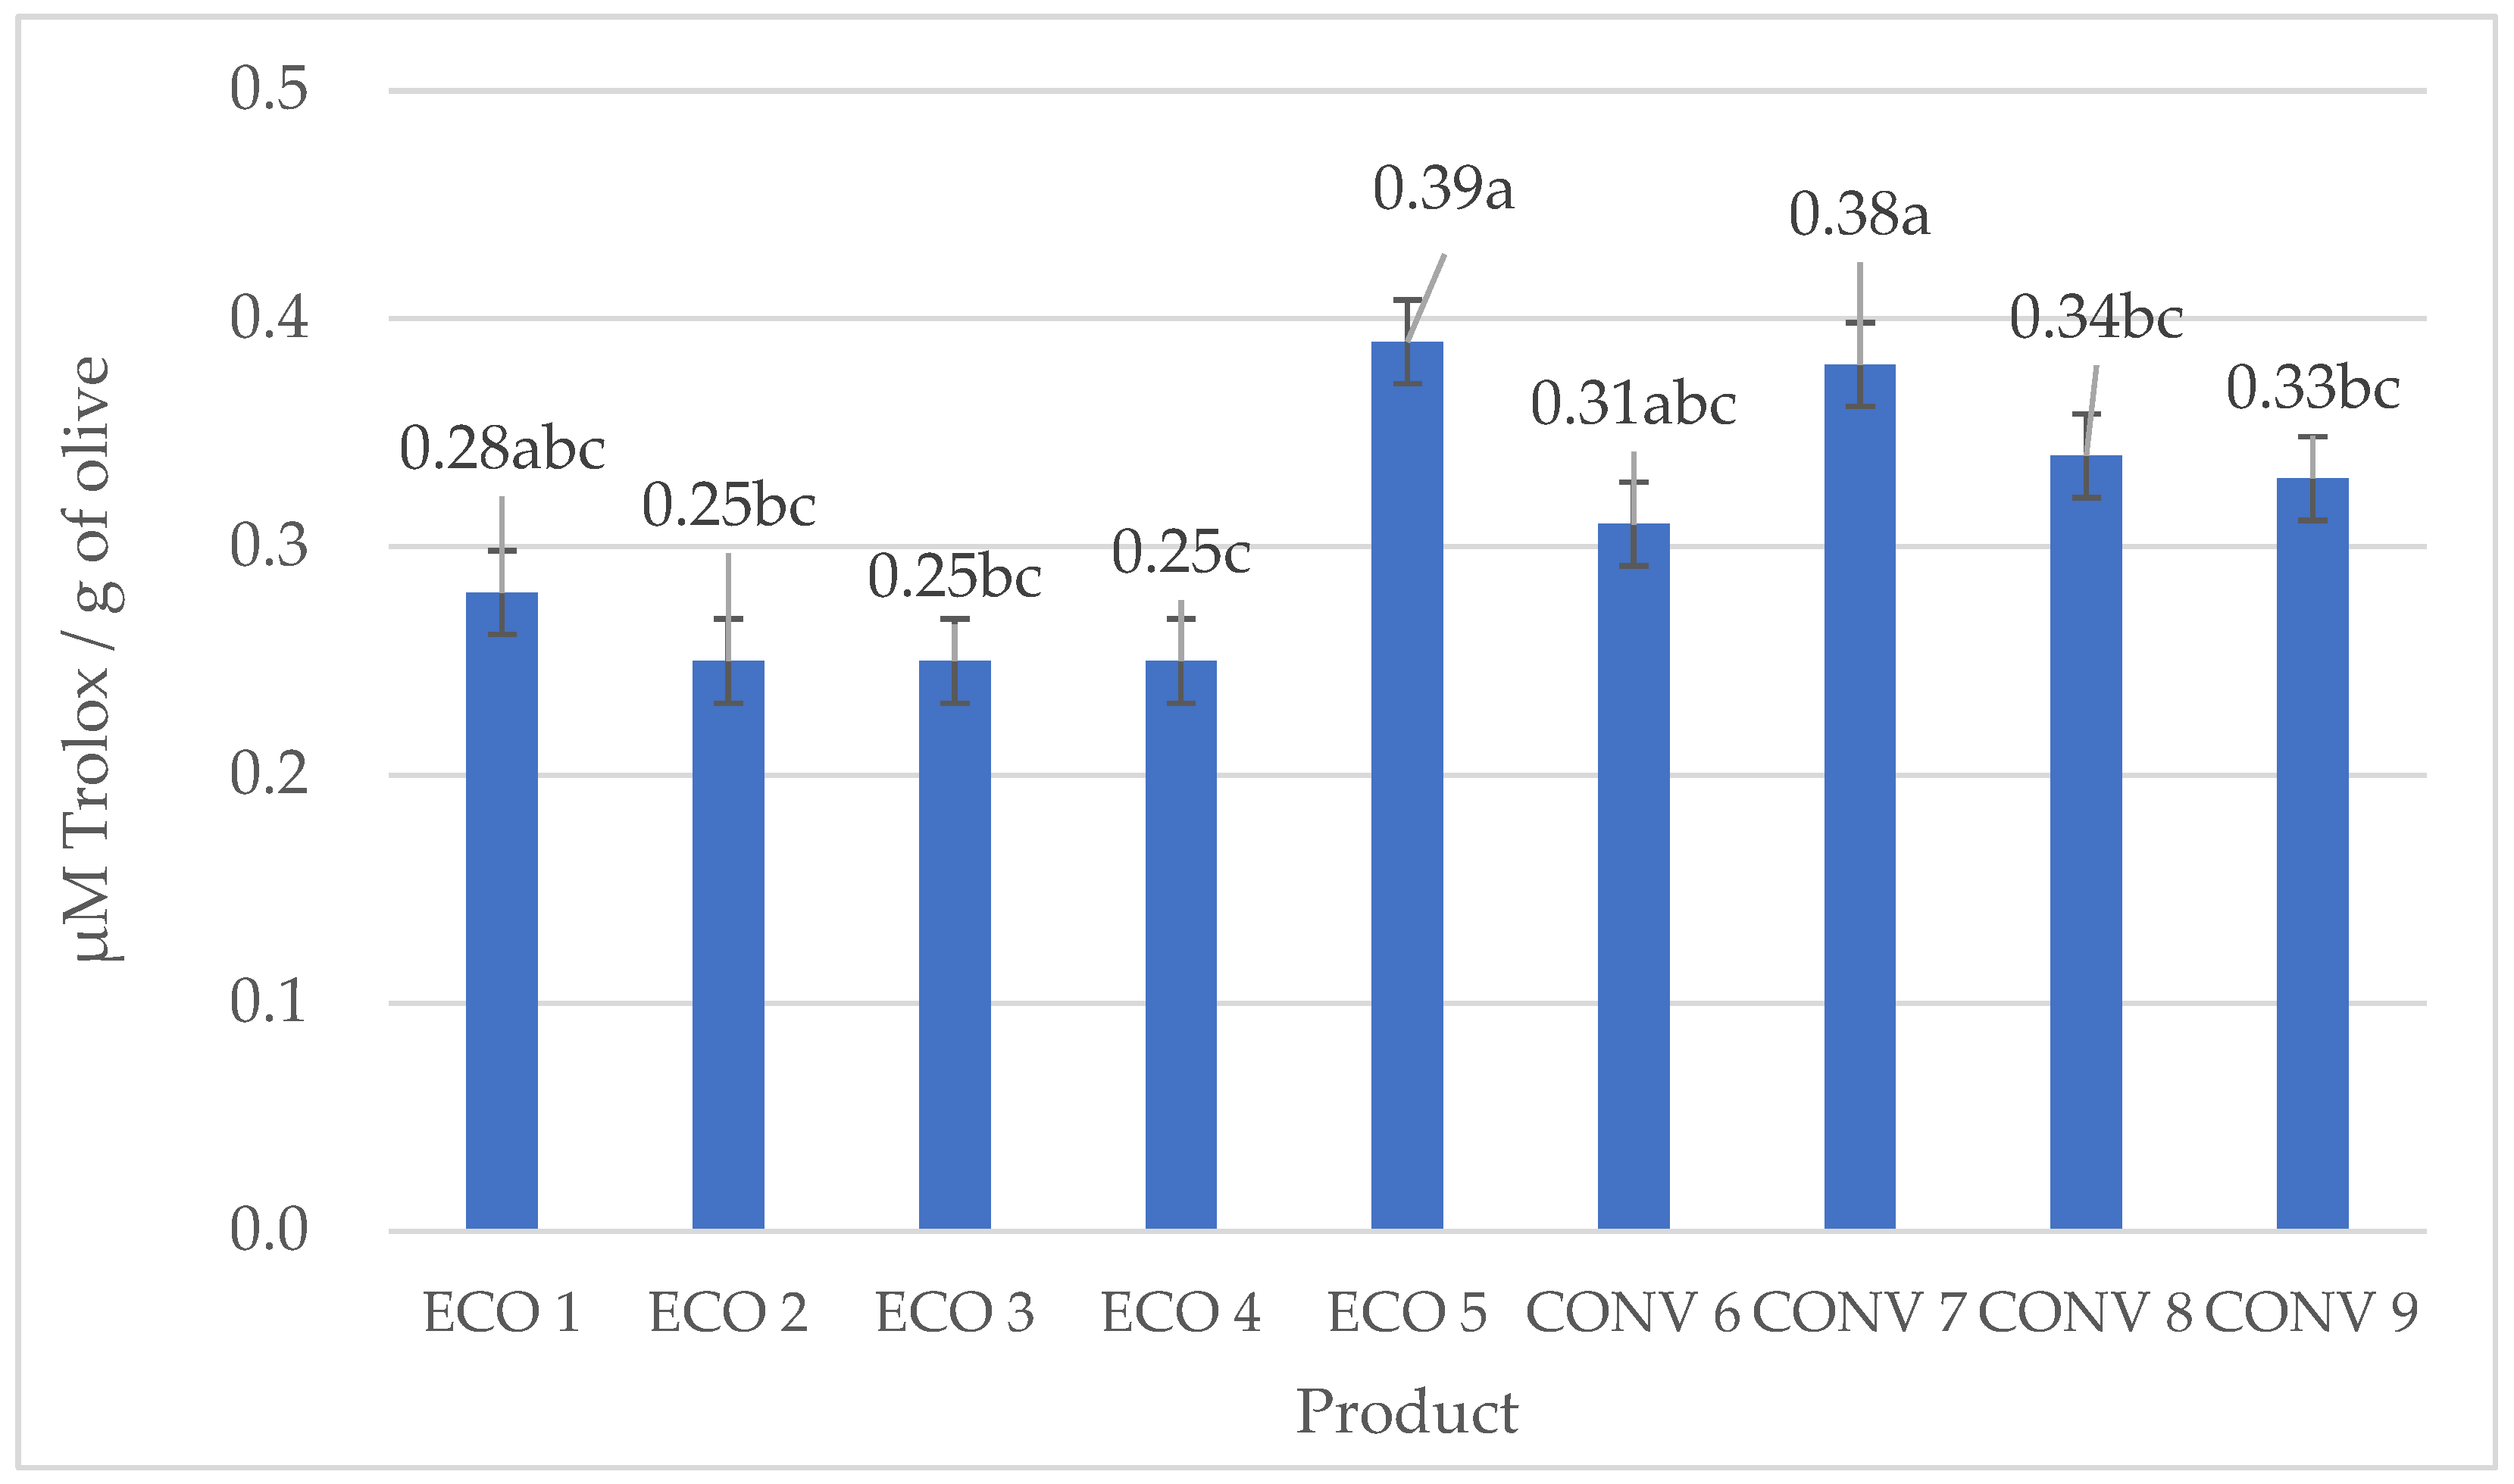
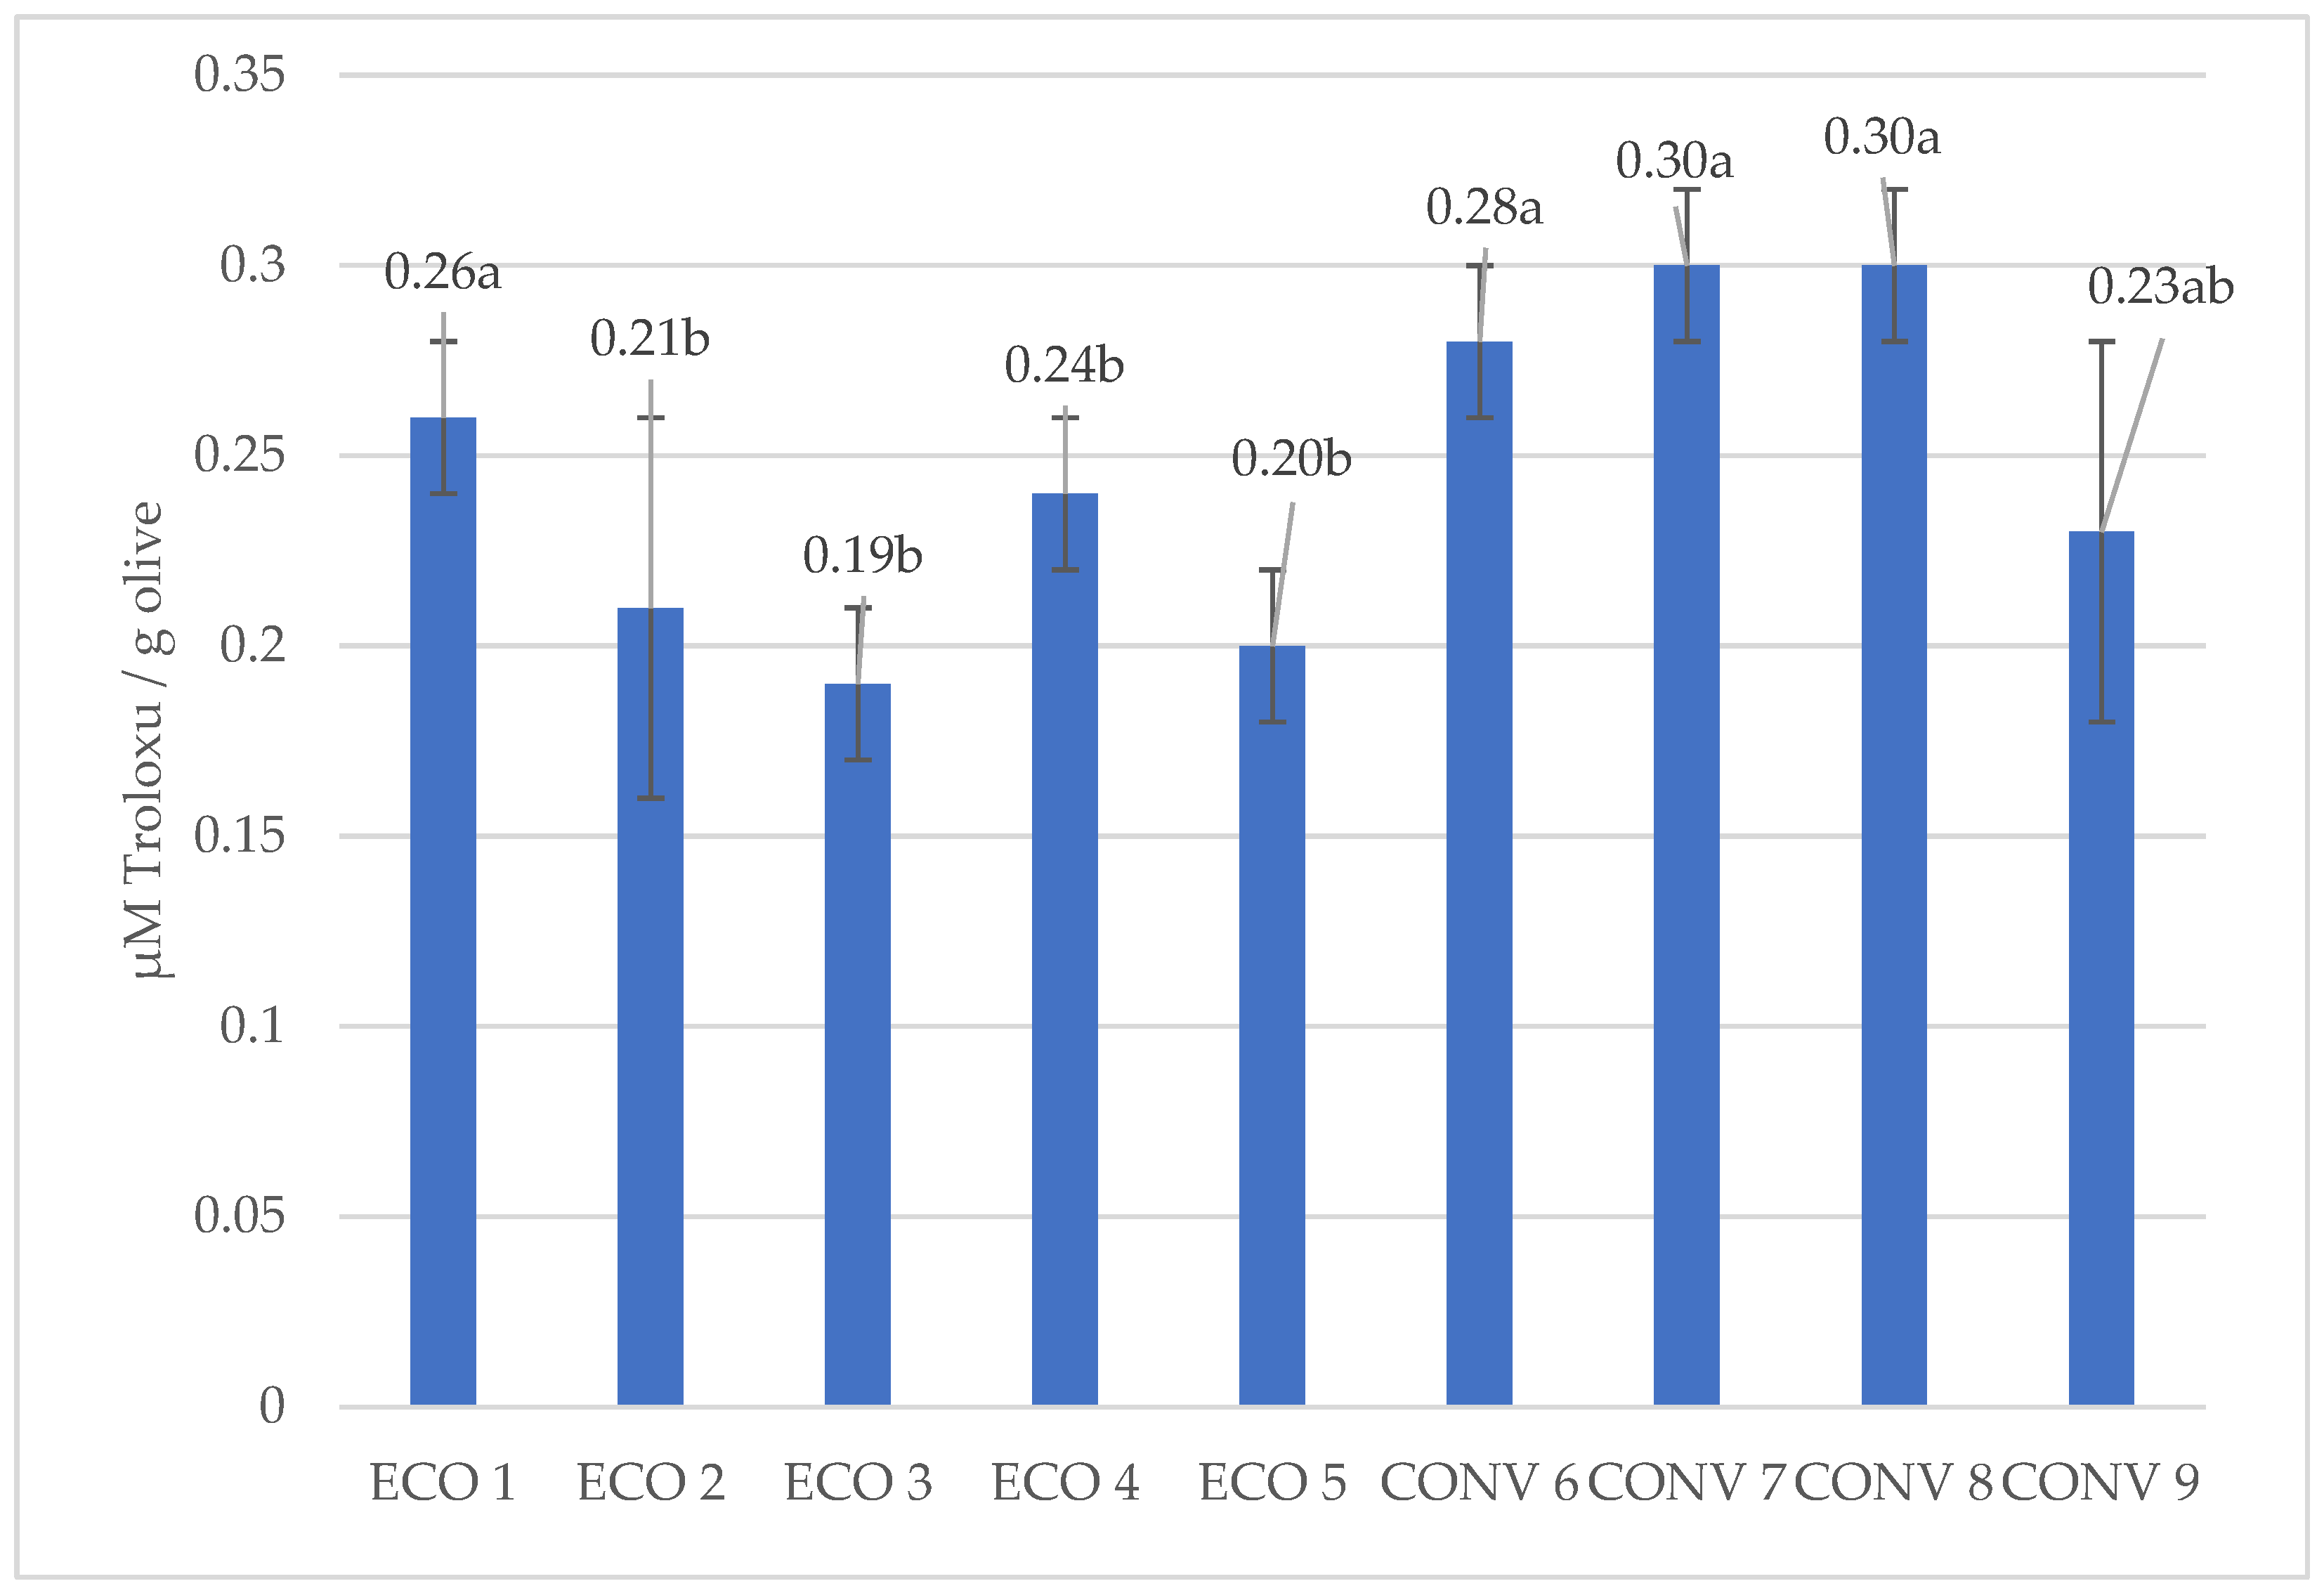
3.4. Analysis of the DPPH Antiradical Capacity of Olive Oils, FRAP Iron Ion Reduction, and Determination of Selected Phenolic Acids

Figure 2 presents the results of the antioxidant activity of olive oils determined by the DPPH assay. Higher DPPH values were observed in oils derived from conventional farming, particularly in sample no. 7. In contrast, oils from organic cultivation (sample nos. 1 to 4) exhibited lower but relatively consistent values, ranging from 0.25 to 0.28 μmol TE/g, compared to their conventionally produced counterparts. Among all samples, organic olive oil no. 5 demonstrated the highest DPPH radical scavenging capacity, amounting to 0.39 μmol TE/g.
Ballus et al. [33] analyzed the antioxidant potential of conventional olive oils and reported values ranging from 0.068 to 0.942 μmol TE/g. Similarly, Fanali et al. [10] observed that conventional olive oils had a higher radical scavenging capacity, ranging from 0.53 to 2.41 μmol TE/g values. Borges et al. [34] also measured DPPH values in conventional olive oils, which ranged between 0.36 and 0.62 μmol TE/g.
Figure 3 presents the results of the antioxidant activity of the olive oils as measured by the FRAP assay. The ferric ion-reducing capacity of the analyzed olive oil extracts ranged from 0.19 to 0.30 μmol TE/g. The highest values were observed in extracts from conventional olive oil samples nos. 6, 7, and 8, while the lowest were recorded in organic samples nos. 2, 3, and 5. The olive oils derived from conventional cultivation differed significantly from those obtained from organic farming (Figure 3). Additionally, the data in Figure 3 confirm the presence of statistically significant differences (p < 0.05) in the ferric ion-reducing capacity of extracts obtained from olive oils produced using different cultivation systems (three of the four products).
In the study by Huang et al. [35], conventional olive oils showed FRAP values ranging from 0.32 to 1.12 μmol TE/g. Similarly, Perez-Córdoba et al. [36] reported values ranging from 0.11 to 0.90 μmol TE/g, while Ramos-Escudero et al. [37] reported FRAP values for conventional olive oils between 0.38 and 1.67 μmol TE/g.
The analysis of phenolic acid content showed that the total content of phenolic acids (oleuropein, hydorxytyrosol, and tyrosol) ranged from 133.20 (olive no. 7) to 226.82 mg/kg (olive no. 6). Oleuropein content was found to be slightly higher in olives derived from conventional farming and ranged from 75.92 to 100.05 mg/kg, while its content in olive oils derived from organic farming was between 58.89 and 90.77 mg/kg (Table 4). The opposite observation was reported for hydroxytyrosol content, and, for olives derived from conventional farming, ranged from 3.56 to 56.23 mg/kg, while olive oils derived from organic farming had a hydroxytyrosol content that ranged from 42.99 to 59.35. The concentration of tyrosol in the analyzed olive oils samples was between 44.97 and 82.45 mg/kg. The highest amount of tyrosol was found in extra virgin olive oils no. 6 (conventional), no. 4 (organic), and no. 1 (organic). The content of particular phenolic acids does not correlate with DPPH antiradical capacity or FRAP iron ion reduction. According to that observation, the DPPH antiradical capacity or FRAP iron ion reduction capacity of olive oil is not related to the presence of the aforementioned phenolic acids. Fanali et al. [10] reported that the tyrosol content in Italian olive oils varied depending on the area where the olives were cultivated, e.g., in Sicily, the range was between 0.03 and 62.30 mg/kg, while in Lazio it was between 0.34 and 12.83 mg/kg. The same observation applied to hydroxytyrosol, because the olive oil derived from Sicily contained 9.20–62.7 mg, and, on the other hand, olive oil from Tuscany contained 0.72–38.64 mg hydroxytyrosol per 1 kg. Fanali et al. [10] found many different oleuropein aglycones in Italian olives; their content could range from 747.46 to 1682.89 mg/kg in Puglia olive oils. A lower content of phenolic acids was found in Croatian olive oils; for example, oleuropein ranged from 4.56 to 8.80 mg/kg, tyrosol from 0.28 to 1.70 mg/kg, and hydroxytyrosol from 1.98 to 3.62 mg/kg [28]. Brala et al. [38] reported that, in Plominka, Žižolera, Oblica, and Lastovka cultivars of olive oils derived from Croatia, the highest amounts of phenolic compounds were as follows: tyrosol: 4.35–32.16 mg kg−1, hydroxytyrosol: 5.07–16.29 mg kg−1, and oleuropein: 2.37–7.61 mg kg−1.

4. Conclusions

The analyzed extra virgin olive oils from conventional and organic farming met the requirements of the Delegated Regulation of the European Union 2022/2104 of 29 July 2022 regarding quality parameters. Still, no significant differences were observed between the organic and conventional cultivation methods. Only based on laboratory tests on the reduction of iron ions (FRAP method), it was shown that the olive cultivation method may affect the antioxidant activity of finished extra virgin olive oils, indicating that olives obtained from conventional farming (three out of four) have slightly higher antioxidant activity than those obtained from organic farming. Moreover, campesterol content was higher in conventional olive oils than in organic products. Considering the results of all the conducted tests on the qualitative antioxidant capacity of olive oils from organic and conventional farming, it is not easy to conclude which cultivation method improves the quality of extra virgin olive oil.

Author Contributions

Conceptualization, D.D.; methodology, D.D. and P.P.; software, D.D. and P.P.; validation, D.D. and P.P.; formal analysis, K.M.; investigation, K.M., P.P. and D.D.; resources, D.D.; data curation, D.D. and B.D.; writing—original draft preparation, D.D.; writing—review and editing, D.D.; visualization, K.M. and D.D.; supervision, D.D.; project administration, B.D. All authors have read and agreed to the published version of the manuscript.

Funding

This research received no external funding.

Institutional Review Board Statement

Not applicable.

Informed Consent Statement

Not applicable.

Data Availability Statement

The data presented in this study are available on request from the corresponding author. The data are not publicly available due to privacy concerns.

Conflicts of Interest

The authors declare no conflicts of interest.

References

  1. International Olive Oil Council (IOOC). Trade Standard Applying to Olive Oils and Pomace-Oils; COI/T.15/NC No.3/Rev.19/2022; International Olive Oil Council (IOOC): Madrid, Spain, 2022. [Google Scholar]
  2. Skowron, M.; Zalejska-Fiolka, J.; Błaszczyk, U.; Birkner, E. Właściwości prozdrowotne oleju rzepakowego i oliwy. Postępy Hig. Med. Dośw. 2018, 72, 1104–1113. [Google Scholar] [CrossRef]
  3. Wroniak, M.; Maszewska, M. Oliwa z oliwek w diecie śródziemnomorskiej. Żywność Nauka Technol. Jakość 2011, 5, 26–36. [Google Scholar]
  4. Volakakis, N.; Kabourakis, E.; Kiritsakis, A.; Rempelos, L.; Leifert, C. Effect of Production System (Organic versus Conventional) on Olive Fruit and Oil Yields and Oil Quality Parameters in the Messara Valley, Crete, Greece; Results from a 3-Year Farm Survey. Agronomy 2022, 12, 1484. [Google Scholar] [CrossRef]
  5. Berg, H.; Maneas, G.; Engstrom, A.S. A Comparison between Organic and Conventional Olive Farming in Messenia, Greece. Horticulturae 2018, 4, 15. [Google Scholar] [CrossRef]
  6. Ninfali, P.; Bacchiocca, M.; Biagiotti, E.; Esposto, S.; Servili, M.; Rosati, A.; Montedoro, G. A 3-Year Study on Quality, Nutritional and Organoleptic Evaluation of Organic and Conventional Extra-Virgin Olive Oils. J. Am. Oil Chem. Soc. 2008, 85, 151–158. [Google Scholar] [CrossRef]
  7. Jimenez, B.; Sánchez-Ortiz, A.; Lorenzo, M.L.; Rivas, A. Effect of Agronomical Practices on the Nutritional Quality of Virgin Olive Oil at Different Ripening Stages. J. Am. Oil Chem. Soc. 2015, 92, 1491–1501. [Google Scholar] [CrossRef]
  8. Jimenez, B.; Sánchez-Ortiz, A.; Lorenzo, M.L.; Rivas, A. Effect of Organic Cultivation of Picual and Hojiblanca Olive Varieties on the Quality of Virgin Olive Oil at Four Ripening Stages. Eur. J. Lipid Sci. Technol. 2014, 116, 1634–1646. [Google Scholar] [CrossRef]
  9. Derewiaka, D.; Rupert, M.; Wołosiak, R.; Bzducha-Wróbel, A.; Ścibisz, I.; Matuszewska-Janica, A. Volatiles as Markers of Bioactive Components Found in Croatian Extra Virgin Olive Oils. LWT—Food Sci. Technol. 2021, 139, 110589. [Google Scholar] [CrossRef]
  10. Fanali, C.; Posta, S.; Vilmercati, A.; Dugo, L.; Russo, M.; Petitti, T.; Mondello, L.; Gara, L. Extraction, Analysis, and Antioxidant Activity Evaluation of Phenolic Compounds in Different Italian Extra-Virgin Olive Oils. Molecules 2018, 23, 3249. [Google Scholar] [CrossRef] [PubMed]
  11. Nowak, D.; Gośliński, M.; Popławski, C. Antioxidant Properties and Fatty Acid Profile of Cretan Extra Virgin Bioolive Oils: A Pilot Study. Int. J. Food Sci. 2021, 2021, 1–10. [Google Scholar] [CrossRef] [PubMed]
  12. European Union. Commission Delegated Regulation (EU) 2022/2104 of 29 July 2022 Supplementing Regulation (EU) No 1308/2013 of the European Parliament and of the Council as Regards Marketing Standards for Olive Oil, and Repealing Commission Regulation (EEC) No 2568/91 and Commission Implementing Regulation (EU) No 29/2012. Off. J. Eur. Union 2022, L282, 1–36. [Google Scholar]
  13. Bouymajane, A.; Majdoub, Y.; Cacciola, F.; Russo, M.; Salafia, F.; Trozzi, A.; Filali, F.R.; Dugo, P.; Mondello, L. Characterization of Phenolic Compounds, Vitamin E and Fatty Acids from Monovarietal Virgin Olive Oils of “Picholine Marocaine” Cultivar. Molecules 2020, 25, 5428. [Google Scholar] [CrossRef]
  14. Anastasopoulos, E.; Kalogeropoulos, N.; Kaliora, A.C.; Kountouri, A.; Andrikopoulos, N.K. The Influence of Ripening and Crop Year on Quality Indices, Polyphenols, Terpenic Acids, Squalene, Fatty Acid Profile and Sterols in Virgin Olive Oil (Koroneiki cv.) Produced by Organic versus Non-Organic Cultivation Method. Int. J. Food Sci. Technol. 2010, 46, 170–178. [Google Scholar] [CrossRef]
  15. Bilušić, T.; Melliou, E.; Giacometti, J.; Čaušević, A.; Čorbo, S.; Landeka, M.; Magiatis, P. Phenolic, Fatty Acids and Biological Potential of Selected Croatian EVOOs. Eur. J. Lipid Sci. Technol. 2017, 119, 1600461. [Google Scholar] [CrossRef]
  16. Gargouri, B.; Ammar, S.; Zribi, A.; Mansour, A.B.; Bouaziz, M. Effect of Growing Region on Quality Characteristics and Phenolic Compounds of Chemlali Extra Virgin Olive Oils. Acta Physiol. Plant. 2013, 35, 2801–2812. [Google Scholar] [CrossRef]
  17. Cano, M.M.; Gordillo, C.M.; Mendoza, M.F.; Vertedor, D.M.; Casasa, J.S. The Sterol and Erythrodiol + Uvaol Content of Virgin Olive Oils Produced in Five Olive-Growing Zones of Extremadura (Spain). J. Am. Oil Chem. Soc. 2016, 93, 227–235. [Google Scholar] [CrossRef]
  18. Sönmez, A.; Özdikicierler, O.; Gümüşkesen, A.S. Evaluation of Olive Oil Quality during the Ripening of the Organic Cultivated Olives and Multivariate Discrimination of the Variety with a Chemometric Approach. Riv. Ital. Delle Sostanze Grasse 2018, 95, 173–181. [Google Scholar]
  19. Giacalone, R.; Giuliano, S.; Gulotta, E.; Monfreda, M.; Presti, G. Origin Assessment of Extra Virgin Olive Oils by Esterified Sterols Analysis. Food Chem. 2015, 188, 279–285. [Google Scholar] [CrossRef]
  20. Sakouhi, F.; Absalon, C.; Flamini, G.; Cioni, P.L.; Kalel, H.; Boukhchina, S. Lipid Components of Olive Oil from Tunisian Cv. Sayali: Characterization and Authenticity. Comptes Rendus Biol. 2010, 333, 642–648. [Google Scholar] [CrossRef] [PubMed]
  21. Noorali, M.; Barzegar, M.; Sahari, M.A. Sterol and Fatty Acid Compositions of Olive Oil as an Indicator of Cultivar and Growing Area. J. Am. Oil Chem. Soc. 2014, 91, 1571–1581. [Google Scholar] [CrossRef]
  22. Konuskan, D.B.; Mungan, B. Effects of Variety, Maturation and Growing Region on Chemical Properties, Fatty Acid and Sterol Compositions of Virgin Olive Oils. J. Am. Oil Chem. Soc. 2016, 93, 1499–1508. [Google Scholar] [CrossRef]
  23. Dag, C.; Demirtas, I.; Ozdemir, I.; Bekiroglu, S.; Ertas, E. Biochemical Characterization of Turkish Extra Virgin Olive Oils from Six Different Olive Varieties of Identical Growing Conditions. J. Am. Oil Chem. Soc. 2015, 92, 1349–1356. [Google Scholar] [CrossRef]
  24. Borges, T.H.; Pereira, J.A.; Cabrera-Vique, C.; Lara, L.; Oliveira, A.F.; Seiquer, I. Characterization of Arbequina Virgin Olive Oils Produced in Different Regions of Brazil and Spain: Physicochemical Properties, Oxidative Stability and Fatty Acid Profile. Food Chem. 2017, 215, 454–462. [Google Scholar] [CrossRef]
  25. Arfaoui, M.; Boulares, M.; Bezzezi, A.; Ayachi, S.; Ghrab, M.; Jouini, N.E.; Hassouna, M.; Boudiche, S. Effect of the Enrichment with Natural Antioxidants Obtained by Maceration or Ultrasound-Assisted Extraction from Olive Leaves on Organic Extra Virgin Olive Oil. Riv. Ital. Delle Sostanze Grasse 2022, 99, 121–129. [Google Scholar]
  26. Bengana, M.; Bakhouche, A.; Lozano-Sánchez, J.; Amir, Y.; Youyou, A.; Segura-Carretero, A.; Fernandez-Gutierrez, A. Influence of Olive Ripeness on Chemical Properties and Phenolic Composition of Chemlal Extra-Virgin Olive Oil. Food Res. Int. 2013, 54, 1868–1875. [Google Scholar] [CrossRef]
  27. Giacometti, J.; Milin, Č.; Giacometti, F.; Ciganj, Z. Characterization of Monovarietal Olive Oils Obtained from Croatian Cvs. Drobnica and Buza during the Ripening Period. Foods 2018, 7, 188. [Google Scholar] [CrossRef]
  28. Barbieri, S.; Bendini, A.; Valli, E.; Toschi, T.G. Do Consumers Recognize the Positive Sensorial Attributes of Extra Virgin Olive Oils Related with Their Composition? A Case Study on Conventional and Organic Products. J. Food Compos. Anal. 2015, 44, 186–195. [Google Scholar] [CrossRef]
  29. Bouarroudj, K.; Tamendjari, A.; Larbat, R. Quality, Composition and Antioxidant Activity of Algerian Wild Olive (Olea europaea L. subsp. oleaster) Oil. Ind. Crops Prod. 2016, 83, 484–491. [Google Scholar] [CrossRef]
  30. Willenberg, I.; Matthäus, B.; Gertz, C. A New Statistical Approach to Describe the Quality of Extra Virgin Olive Oils Using Near Infrared Spectroscopy and Traditional Analytical Parameters. Eur. J. Lipid Sci. Technol. 2019, 121, 1800484. [Google Scholar] [CrossRef]
  31. Ceci, L.N.; Mattar, S.B.; Carelli, A.A. Chemical Quality and Oxidative Stability of Extra Virgin Olive Oils from San Juan Province (Argentina). Food Res. Int. 2017, 100, 764–770. [Google Scholar] [CrossRef]
  32. Garcia-Gonzalez, D.L.; Aparicio-Ruiz, R.; Morales, M.T. Chemical Characterization of Organic and Non-Organic Virgin Olive Oils. OCL Oilseeds Fats Crops Lipids 2014, 21, D506. [Google Scholar] [CrossRef]
  33. Ballus, C.A.; Meinhart, A.D.; Souza Campos, F.A.; Teixeira-Godoy, H. Total Phenolics of Virgin Olive Oils Highly Correlate with the Hydrogen Atom Transfer Mechanism of Antioxidant Capacity. J. Am. Oil Chem. Soc. 2015, 92, 843–851. [Google Scholar] [CrossRef]
  34. Borges, T.H.; Cabrera-Vique, C.; Seiquer, I. Antioxidant Properties of Chemical Extracts and Bioaccessible Fractions Obtained from Six Spanish Monovarietal Extra Virgin Olive Oils: Assays in Caco-2 Cells. Food Funct. 2016, 7, 209–218. [Google Scholar] [CrossRef]
  35. Huang, S.; Wang, Q.; Wang, Y.; Ying, R.; Fan, G.; Huang, M.; Agyemang, M. Physicochemical Characterization and Antioxidant Activities of Chongqing Virgin Olive Oil: Effects of Variety and Ripening Stage. J. Food Meas. Charact. 2020, 14, 2010–2020. [Google Scholar] [CrossRef]
  36. Perez-Córdoba, R.; Quesada-Granados, J.J.; Ramirez-Anaya, J.P.; Peña-Díaz, J.; Blanca-Herrera, R.; Samaniego-Sánchez, C. Bioactive Compounds in Spanish Extra Virgin Olive Oils: Migration and Stability According to the Culinary Technique Used. Food Chem. 2023, 172, 1–11. [Google Scholar] [CrossRef]
  37. Ramos-Escudero, F.; Morales, M.T.; Asuero, A.G. Characterization of Bioactive Compounds from Monovarietal Virgin Olive Oils: Relationship Between Phenolic Compounds and Antioxidant Capacities. Int. J. Food Prop. 2015, 18, 348–358. [Google Scholar] [CrossRef]
  38. Brala, C.J.; Brnčić, D.; Šindrak, Z.; Barbarić, M.; Uršić, S. Labeled Extra Virgin Olive Oil as Food Supplement; Phenolic Compounds in Oils from Some Autochthonous Croatian Olives. Grasas Aceites 2015, 66, e099. [Google Scholar] [CrossRef]
Figure 1. Chromatogram of the fatty acid profile of a selected extra virgin olive oil.
Applsci 15 07158 g001
Figure 2. Value of the ability of olive oil extracts from organic and conventional farming to deactivate stable DPPH radicals expressed as [μmol TE/g of olive oil]. Data are the means of three independent experiments ± standard deviations (n = 3). a–c values in the bars with different lowercase letters indicate a significant difference at the 0.05 significance level (Tukey HSD).
Applsci 15 07158 g002
Figure 3. The ability of olive oils from organic and conventional farming to reduce iron ions, measured by the FRAP method and expressed as [μmol TE/g of olive oil]. Data are the means of three independent experiments ± standard deviations (n = 3). a–b values in the bars with different lowercase letters indicate a significant difference at the 0.05 significance level (Tukey HSD).
Applsci 15 07158 g003
Table 1. Profile of fatty acids [%] in olive oils from organic and conventional farming.
Organic FarmingConventional Farming
123456789
SFA15.80 cd ± 0.8614.60 d ± 0.6016.02 cd ± 0.4516.67 c ± 0.2218.43 b ± 0.1915.86 cd ± 0.1216.99 bc ± 0.7416.58 c ± 0.5020.49 a ± 0.02
C 16:0
palmitic acid
11.27 ef ± 0.7710.56 f ± 0.4711.93 de ± 0.4012.70 cd ± 0.1514.65 b ± 0.1611.74 def ± 0.0913.93 bc ± 0.6812.95 cd ± 0.4316.45 a ± 0.19
C 17:0
heptadecanoic acid
0.11 ab ± 0.010.05 f ± 0.010.10 bc ± 0.010.07 de ± 0.010.06 ef ± 0.010.05 ef ± 0.010.13 a ± 0.010.08 cd ± 0.010.11 ab ± 0.01
C 18:0
stearic acid
3.79 a ± 0.493.22 b ± 0.133.30 ab ± 0.03.15 b ± 0.072.98 b ± 0.033.25 b ± 0.042.15 c ± 0.062.84 b ± 0.063.13 b ± 0.18
C 20:0
arachidic acid
0.45 f ± 0.030.53 abc ± 0.020.47 ef ± 0.010.51 cde ± 0.010.52 bcd ± 0.010.57 a ± 0.010.49 de ± 0.010.48 ef ± 0.010.55 ab ± 0.01
C 22:0
behenic acid
0.12 e ± 0.020.18 abc ± 0.010.14 de ± 0.010.16 cd ± 0.010.15 de ± 0.000.19 ab ± 0.010.21 a ± 0.000.16 cd ± 0.010.17 bcd ± 0.01
C 24:0
lignoceric acid
0.05 a ± 0.020.07 a ± 0.010.08 a ± 0.010.08 a ± 0.010.08 a ± 0.010.06 a ± 0.030.08 a ± 0.010.07 a ± 0.010.08 a ± 0.00
MUFA74.50 cde ± 1.2678.50 a ± 0.8475.20 bc ± 0.6672.50 d ± 0.3866.50 e ± 0.3176.35 b ± 0.1973.40 cd ± 1.0475.50 bc ± 0.6765.60 e ± 0.41
C 16:1. (cis 9)
palmitoleic acid
0.80 e ± 0.230.69 e ± 0.031.07 cd ± 0.021.18 c ± 0.031.67 ab ± 0.010.84 de ± 0.011.64 b ± 0.071.16 c ± 0.021.88 a ± 0.02
C 17:1 (cis 10)
heptadecenoic acid
0.17 b ± 0.010.07 c ± 0.010.18 b ± 0.000.09 c ± 0.010.09 c ± 0.010.08 c ± 0.020.31 a ± 0.020.16 b ± 0.020.18 b ± 0.01
C 18:1 (cis 9)
oleic acid
71.12 b ±1.0175.36 a ± 0.9971.03 b ± 0.8668.24 cd ± 0.5261.44 e ± 0.4172.57 b ± 0.2567.33 d ±1.4770.61 bc ± 0.8459.54 e ± 0.47
C 18:1 (cis isomers)2.14 ef ± 0.402.10 f ± 0.132.67 cdef ± 0.182.68 cde ± 0.113.07 cd ± 0.092.51 def ± 0.043.80 a ± 0.333.18 bc ± 0.143.68 ab ± 0.04
C 20:1 (cis 11)
eicosenoic acid
0.25 d ± 0.030.30 b ± 0.010.28 de ± 0.010.30 c ± 0.010.26 d ± 0.000.35 a ± 0.020.36 a ± 0.020.34 ab ± 0.010.31 bc ± 0.01
PUFA9.70 d ± 0.906.90 g ± 0.238.70 ef ± 0.2010.90 c ± 0.1615.04 a ± 0.117.80 fg ± 0.079.60 de ± 0.307.90 f ± 0.1613.90 b ± 0.02
C 18:2 cis 9, cis 12
linoleic acid
8.99 d ± 0.856.24 f ± 0.228.05 e ± 0.2010.17 c ± 0.1514.34 a ± 0.107.05 f ± 0.068.83 de ± 0.287.09 f ± 0.1513.16 b ± 0.02
C 18:3 cis 9, cis 12, cis 15
α-linolenic acid
0.74 bc ± 0.040.66 e ± 0.020.69 de ± 0.00.68 de ± 0.010.70 cde ± 0.010.73 bcd ± 0.010.75 bc ± 0.020.87 a ± 0.010.77 b ± 0.01
Data are the means of three independent experiments ± standard deviations (n = 3). a–g values in the same row with different lowercase letters indicate a significant difference at the 0.05 significance level (Tukey HSD).
Table 2. Sterol content [mg/kg] from organic and conventionally farmed olive oils.
Organic FarmingConventional Farming
123456789
Campesterol18.26 e ± 0.7222.50 cd ± 1.2327.93 b ± 1.3025.05 bc ± 0.5128.34 b ± 1.6925.63 bc ± 2.0435.37 a ± 2.0220.50 de ± 0.5835.37 a ± 1.39
Stigmasterol6.23 de ± 0.094.20 f ± 0.078.08 bcd ± 0.526.65 cde ± 0.096.10 e ± 0.165.53 ef ± 0.0914.05 a ± 1.348.21 bc ± 0.289.34 b ± 1.27
Clerosterol5.94 bc ± 1.307.24 bc ± 0.408.07 b ± 1.746.68 ab ± 0.574.90 c ± 0.866.94 bc ± 0.497.99 b ± 1.255.89 bc ± 0.728.27 b ± 0.49
β-sitosterol609.08 b ± 56.29476.08 d ± 14.76611.86 d ± 10.39578.31 d ± 5.57635.95 c ± 32.49519.28 cd ± 31.59774.79 a ± 9.56510.42 d ± 1.53711.56 a ± 24.37
∆5-avenasterol97.04 b ± 10.23140.47 a ± 4.5076.20 c ± 1.4193.96 b ± 1.1788.59 bc ± 5.9594.87 b ± 6.40134.73 a ± 4.1545.22 d ± 0.7894.28 b ± 3.25
Cycloartenol34.24 f ± 5.2542.29 e ± 2.9958.98 bc ± 3.3882.61 a ± 2.1752.51 cd ± 1.8451.17 d ± 2.0023.75 g ± 0.6628.30 fg ± 1.5460.67 b ± 1.50
24-methylenearthenol176.69 ab ± 22.06117.91 c ± 7.07185.93 a ± 5.51157.62 b ± 3.84173.73 ab ± 9.42102.67 c ± 6.8963.27 d ± 2.80118.47 c ± 0.28115.91 c ± 4.73
Citrostadienol34.69 cd ± 5.8182.75 a ± 6.1132.63 cd ± 1.8142.34 c ± 1.2229.62 d ± 1.0559.83 b ± 5.0261.76 b ± 2.9438.22 cd ± 0.8938.18 cd ± 1.31
Total982.15 bcd ± 101.74893.43 cde ± 37.141009.69 abc ± 26.06993.22 abcd ± 15.141019.74 abc ± 53.46865.94 de ± 54.521115.70 a ± 24.73775.23 e ± 6.601073.58 ab ± 38.31
Data are the means of three independent experiments ± standard deviations (n = 3). a–g values in the same row with different lowercase letters indicate a significant difference at the 0.05 significance level (Tukey HSD).
Table 3. Acid value (%), peroxide value (mEq O2/kg), and extinction coefficients K268, K232, and ∆K of the tested oils from organic and conventional farming.
Farming TypeNo.Acid Value (%)Peroxide Value
(mEq O2/kg)
K268K232∆K
Organic10.28 f ± 0.007.25 f ± 0.350.09 a ± 0.000.1 a ± 0.01−0.011 a ± 0.003
20.41 c ± 0.0213.39 cd ± 0.240.08 a ± 0.010.12 a ± 0.01−0.011 a ± 0.004
30.32 e ± 0.0212.68 d ± 0.450.10 a ± 0.010.12 a ± 0.00−0.008 a ± 0.001
40.42 c ± 0.0314.80 bc ± 0.410.09 a ± 0.010.12 a ± 0.01−0.006 a ± 0.001
50.36 d ± 0.0217.40 a ± 0.390.10 a ± 0.010.12 a ± 0.00−0.005 a ± 0.002
Conventional60.54 b ± 0.0015.33 bc ± 0.500.10 a ± 0.010.12 a ± 0.00−0.007 a ± 0.002
70.26 g ± 0.0214.60 def ± 1.130.09 a ± 0.000.12 a ± 0.01−0.005 a ± 0.001
80.56 a ± 0.009.46 e ± 0.330.09 a ± 0.000.12 a ± 0.00−0.011 a ± 0.005
90.40 c ± 0.0316.01 ab ± 0.010.10 a ± 0.000.12 a ± 0.01−0.009 a ± 0.004
Data are the means of three independent experiments ± standard deviations (n = 3). a–g values in the same column with different lowercase letters indicate a significant difference at the 0.05 significance level (Tukey HSD).
Table 4. Selected phenolic acid content [mg/kg] from organic and conventionally farmed olive oils.
Farming Type No.OleuropeinHydroxytyrosolTyrosolTotal
Organic159.01 b ± 14.1746.83 a ± 2.0671.76 a ± 12.60177.60 ab ± 19.67
262.63 ab ± 14.1759.35 a ± 22.3859.73 a ± 25.69181.71 ab ± 33.90
390.77 ab ± 6.1842.99 a ± 9.5344.97 a ± 8.19178.73 ab ± 23.77
478.47 ab ± 13.9657.78 a ± 4.8873.43 a ± 0.57209.68 ab ± 19.40
558.89 b ± 12.0351.87 a ± 13.7955.56 a ± 14.99166.31 ab ± 39.45
Conventional688.13 ab ± 17.7956.23 a ± 7.8582.45 a ± 9.71226.82 a ± 2.50
778.97 ab ± 6.723.56 ab ± 1.0950.75 a ± 18.80133.20 b ± 17.24
875.92 ab ± 6.1636.04 ab ± 2.9667.39 a ± 7.87179.35 ab ± 11.07
9100.05 a ± 12.58.40.84 a ± 16.4651.24 a ± 7.46192.14 ab ± 32.57
Data are the means of three independent experiments ± standard deviations (n = 3). a–b values in the same column with different lowercase letters indicate a significant difference at the 0.05 significance level (Tukey HSD).
Disclaimer/Publisher’s Note: The statements, opinions and data contained in all publications are solely those of the individual author(s) and contributor(s) and not of MDPI and/or the editor(s). MDPI and/or the editor(s) disclaim responsibility for any injury to people or property resulting from any ideas, methods, instructions or products referred to in the content.

