Article

Evaluating the Role of Canada Goose Populations in Transmission Dynamics During Peak HPAI Incidence in Iowa, February 2022–December 2023

by
Christopher Jimenez
1,*,
Sergios-Orestis Kolokotronis
2,3,4,5,
Janet E. Rosenbaum
2 and
Lori A. Hoepner
1
1
Department of Environmental and Occupational Health Sciences, School of Public Health, SUNY Downstate Health Sciences University, Brooklyn, NY 11203-2098, USA
2
Department of Epidemiology and Biostatistics, School of Public Health, SUNY Downstate Health Sciences University, Brooklyn, NY 11203-2098, USA
3
Division of Infectious Diseases, Department of Medicine, College of Medicine, SUNY Downstate Health Sciences University, Brooklyn, NY 11203-2098, USA
4
Department of Cell Biology, College of Medicine, SUNY Downstate Health Sciences University, Brooklyn, NY 11203-2098, USA
5
Institute for Genomics in Health, SUNY Downstate Health Sciences University, Brooklyn, NY 11203-2098, USA
*
Author to whom correspondence should be addressed.
Appl. Sci. 2025, 15(12), 6900; https://doi.org/10.3390/app15126900
Submission received: 12 May 2025 / Revised: 13 June 2025 / Accepted: 14 June 2025 / Published: 19 June 2025
(This article belongs to the Special Issue Applied Microbial Biotechnology for Poultry Science, 2nd Edition)

Abstract

Featured Application

Evaluation of the species Branta canadensis (Canada goose) as a risk factor for domestic HPAI outbreaks in the US. Canada geese are abundant in Iowa. The species intermingles with other Anseriformes (waterfowl), the known reservoir hosts of HPAI, resulting in HPAI transmission. Although a migratory species, Canada geese frequently inhabit areas near human activities, including agriculture, increasing the likelihood of HPAI introduction into poultry populations.

Abstract

Since its emergence in the United States in February 2022, Highly Pathogenic Avian Influenza (HPAI) H5N1 has caused significant losses for poultry operations, particularly in Iowa between February 2022 and December 2023. Branta canadensis (Canada goose), an abundant North American waterfowl species, is considered a potential reservoir host for H5N1. This study examined the relationship between Canada goose abundance and H5N1 occurrence in Iowa counties. Although counties with H5N1 cases comprised 13% of the state’s Canada goose population—and 32% of those counties had high goose abundance—an inverse relationship was observed. Bivariate analysis indicated that counties with high goose abundance were significantly less likely to report HPAI cases (χ2 = 4.29, p = 0.04). Notably, intermediate goose abundance was associated with a 79% lower likelihood of HPAI occurrence (RR = 0.21, 95% CI [0.05, 0.90], p = 0.04). These findings highlight the limitations posed by the lack of accessible, high-resolution poultry farm location data, which hinders a definitive understanding of Canada geese’s role in H5N1 transmission. To address this gap, stakeholders should consider adopting next-generation surveillance tools like the Biothreats Emergence Analysis and Communication Network (BEACON) AI platform, or AI-integrated chemical sensors that generate real-time, actionable data for biosecurity decision-making. Given the uncertainty surrounding Canada goose role transmission dynamics, the species remains a relevant One Health concern.

1. Introduction

The current Highly Pathogenic Avian Influenza (HPAI) epizootic in the United States (US) began in 2022, with subsequent waves occurring in 2023, 2024, and continuing into 2025 [1,2]. Wild waterfowl are the natural reservoirs and vectors for HPAI, with the current consensus being that they play a significant role in seeding and maintaining the current epizootic [3]. They infect each other by engaging in instinctual behaviors (preening, dabbling) that result in them shedding the virus by opening their bills and excreting saliva and nasal secretions [4]. They become infected by ingesting these infected organic fluids, but they can also ingest infectious particles from fecal matter or feathers left behind from infected birds [5,6]. Most wild waterfowl are still mobile when infected with HPAI and shed infectious organic material while searching for resources on or close to poultry farms [1]. Domestic birds become infected by ingesting infectious material while they forage in their areas on poultry farms. H5N1 was the dominant HPAI strain during the reference period.
The high prevalence of H5N1 among wild birds is believed to have increased exposure and infection among domestic birds and poultry farm workers in the US. As of the writing of this article, there have been 70 confirmed human H5N1 infections in the US from 2022 to 2024. These cases are directly related to the current US epizootic because there had never been confirmed human H5N1 cases in the US until 2022 [7,8].
Iowa’s poultry industry has lost the most domestic birds (30 million) to H5N1 since the epizootic began in February 2022 [2]. Response strategies should use both virologic surveillance and the evaluation of surveillance of macro-level risk factors, such as the abundance of possible vector species. Branta canadensis (Canada goose) is an abundant, resilient species of waterfowl found throughout North America and specifically in Iowa [9]. The species has been understudied in the US since the beginning of the epizootic. Our study (Figure 1) is positing that this species is an efficient vector of H5N1, and a higher abundance of Canada geese in Iowa counties increased the risk of experiencing an H5N1 outbreak during the reference period (February 2022–December 2023). Aix sponsa (wood ducks), Anas crecca (green-winged teals), Anas platyrhynchos (mallard ducks), Spatula discors (blue-winged teals), and Anser caerulescnes (snow geese) were the other abundant species of waterfowl in Iowa during the reference period, and we included them in the study to evaluate whether their abundance was significantly associated with H5N1 outbreaks [1].

1.1. HPAI Epidemiology

HPAI strains like H5N1 are highly contagious influenza A viruses that occur naturally in wild birds, particularly the order Anseriformes (geese, ducks, and swans). The transmission of HPAI strains occurs via contact with infectious organic material from infected birds, including saliva, feces, blood, mucus, or feathers. Humans become infected when they are exposed to these materials while working closely with infected birds or birds that have died because of HPAI infection [4]. Wild birds infected with HPAI viruses can recover, but these viruses can wipe out entire domestic flocks if introduced on poultry farms with domestic poultry chickens, ducks, and turkeys [10]. Infected birds transmit the virus within their flocks and to other susceptible waterfowl species that roost in the same areas, lakes, and ponds. Infected birds do not follow anthropogenic boundaries and can fly if asymptomatic, so they effortlessly deposit infectious material as they move to areas where resources are present (farms, inland water bodies, open agricultural fields) [3]. This results in H5N1 exposure to any susceptible animal, domestic bird, or human that lives or works in an area where waterfowl resources are present.
Depending on environmental temperature, HPAI H5N1 can be transmitted even when infected birds leave the area or die. A 2013 study that focused on the resilience of the H5N1 in dry and wet feces reported that the virus remained active in wet and dry feces for 18 h at 42 °C, 24 h at 37 °C, and for up to 5 days at 24 °C [5]. Another study conducted in 2017, focusing on H5N1 resilience in tissue from dead chickens, reported that the virus remained viable at 4 °C for up to 240 days in feather tissues, 160 days in muscle tissue, and 20 days in liver tissue in laboratory conditions. The study also reported that at 20 °C, in laboratory conditions, H5N1 was maintained for up to 30 days in feather tissues, 20 days in muscle tissue, and 3 days in liver tissue [6]. These results suggest that H5N1 is resilient in the external environment, making it important to evaluate environmental risk factors, including species abundance, to identify waterfowl species that increase the risk of H5N1 infection in domestic poultry. HPAI viruses now pose constant threats, as H5N1 outbreaks have repeatedly occurred since 2021 [3]. HPAI risk reduction will require the cooperative expertise of numerous researchers working together to increase knowledge of viral circulation and identify viral diversity [11]. Our study aims to contribute to the knowledge of viral circulation by evaluating whether Canada goose abundance in Iowa is associated with increased H5N1 risk.

1.2. Canada Goose Ecology and Behavior

Canada geese grow to approximately 35–46 in (89–117 cm), although populations vary greatly in size and body color. They can be found throughout the US mainland as both migratory and resident populations along the Atlantic coast, the Midwest, and the Pacific Northwest. Canada geese are comfortable around humans and will engage in foraging, roosting, and nesting in areas where human presence and activity are common [12]. They also have stable populations in Iowa, suggesting that they can survive in both urban and rural contexts [13]. Since this species is abundant, resilient, and not deterred by human activity, evaluating its role in H5N1 transmission dynamics and spillover events is important.
Although Canada geese are comfortable around human activity, they remain a wild species not amenable to domestication. In the US, Canada geese have had increasingly frequent conflicts with humans because they will stay in areas containing resources even after humans have attempted to deter and remove them [14]. These conflicts reinforce their willingness to explore areas like poultry farms where human activity is apparent. A recent study evaluating self-reported risk factors on US poultry farms supports the postulation that Canada geese will be observed on farms and humans. The study reported that farmers who observed waterfowl within 320 m of their farms had greater odds of HPAI outbreaks, with farmers reporting they observed geese more often than ducks [15]. Although it is not known if Canada geese were the species observed by farmers, their fearlessness and abundance increase the likelihood they would be observed on farms, where they could transmit H5N1 to susceptible poultry.

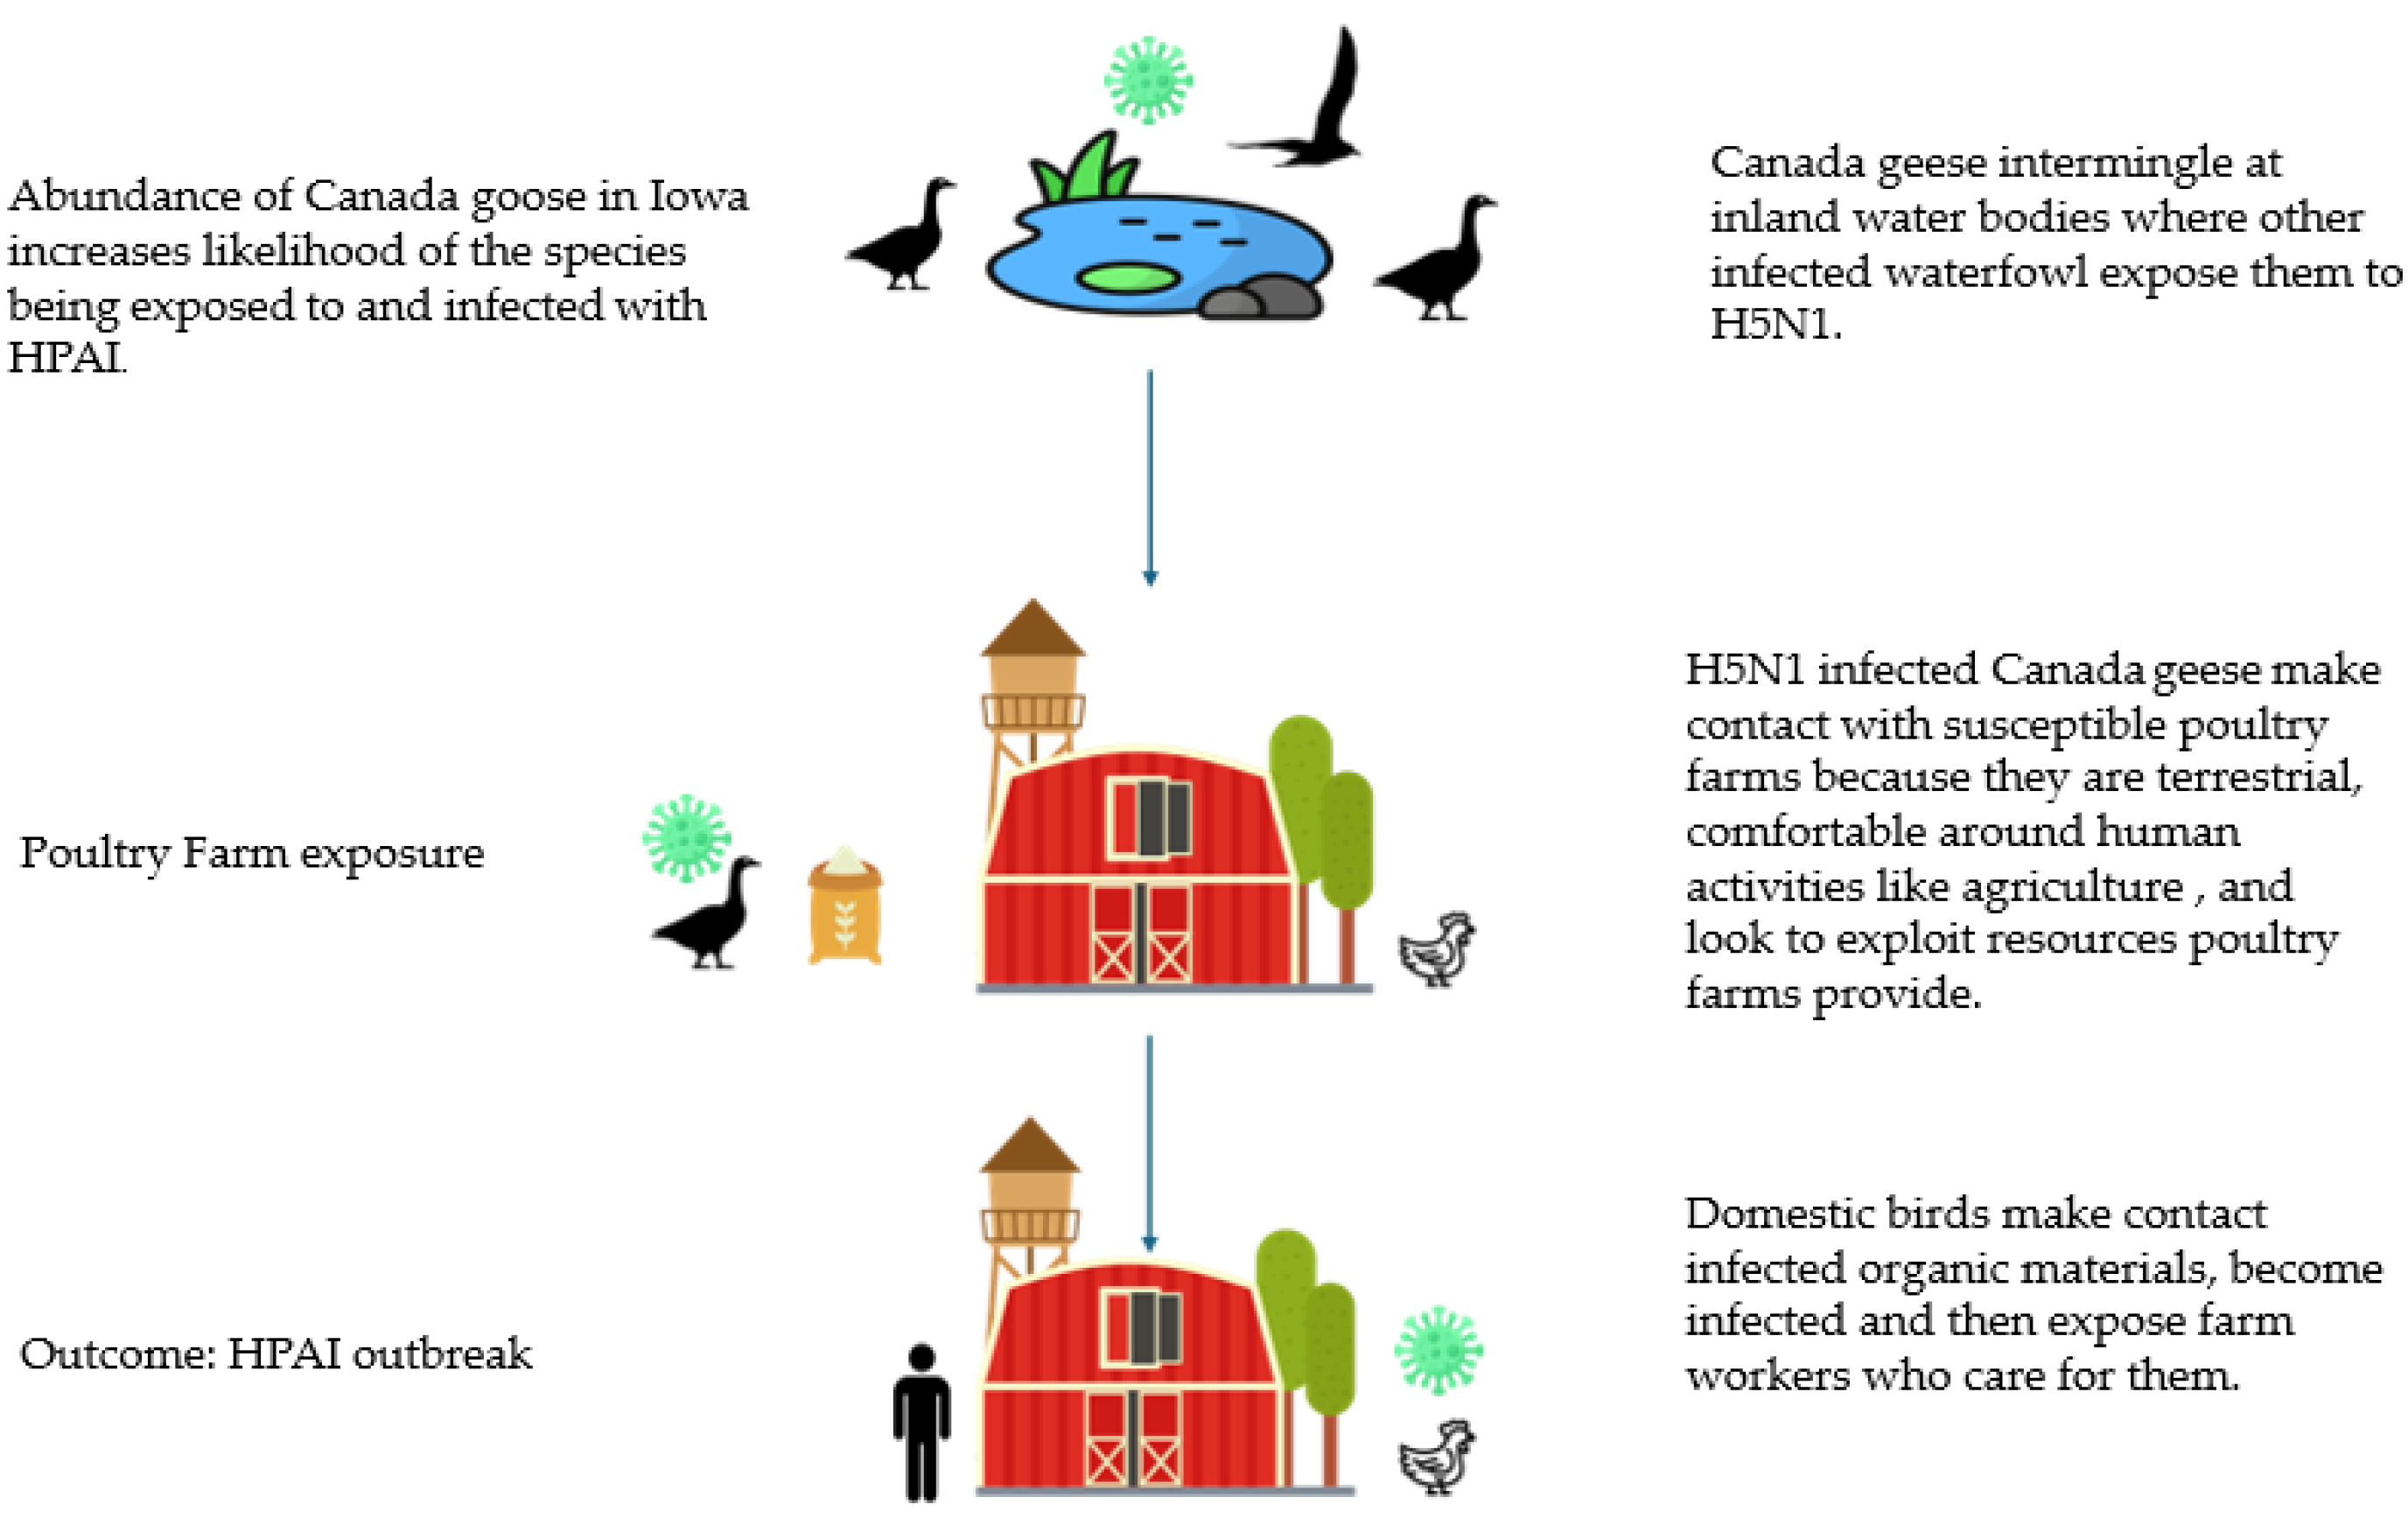
1.3. Possible Role of Canada Goose in HPAI Transmission

Large populations of Canada geese live across North America, but populations have specifically rebounded in Iowa over the past five decades. Millions of Canada geese reside in Iowa year-round, but they can intermingle with migrating waterfowl, given their instinct to seek out inland water [16]. Approximately 2.6 million Canada geese are harvested annually in North America, but they still have consistent population growth [12].
Adult Canada geese have been observed to be generally resistant to H5N1 [17]. This might indicate that they are efficient vectors of H5N1 as they can sustain infection long enough to transmit the virus. A 2022 study live-caught wild North American geese from 2008–2018, and collected oral-pharyngeal, cloacal, and blood samples that were then compared with global reference sequences for the three HPAI subtypes (H16, H13, H5). The results indicated that Canada geese could be resilient hosts and vectors of H5 subtypes, as the phylodynamic analysis of H5N1 during the reference period indicated goose-associated mutations were present when duck samples were analyzed. While these results did not identify Canada geese as the specific species to seed H5 infections, the study did report that the species is abundant and attracted to farms where co-grazing with livestock can influence HPAI transmission [18].
The current consensus is that Anas platyrhynchos (mallard ducks) are most likely to be primary reservoirs and vectors of HPAI due to their abundance and ability to continue migrating when infected. A recent study that evaluated mallard ducks’ ability to migrate while infected compared the movement patterns of infected and uninfected birds. During the study’s reference period (winter 2022), infected mallard ducks migrated slightly earlier but still migrated similar distances as uninfected birds. This suggests they had the potential to be effective dispersal agents for H5N1 during its initial introduction to North America [19]. While identifying a specific species of waterfowl impacting H5N1 transmission during this epizootic has yet to occur, there is enough evidence to state that waterfowl abundance is a current factor worth evaluating.

1.4. Infection of Multiple Mammal Species

For the first time, US dairy cows became infected with H5N1 during this current epizootic, with dairy cow infections occurring in 17 states [20]. H5N1 has also been detected in cow’s milk, raising concerns of another possible exposure pathway [21]. Since the beginning of this epizootic, H5N1 has been reported in more than 200 mammals, an unprecedented spillover to mammals, livestock, and humans; a total of 974 H5N1 cases were reported among non-poultry livestock, which underscores the role of wild reservoirs and viral vectors in transmission dynamics [22].

1.5. HPAI Risk to Public Health: Human-Adapted Mutation

The spillover of H5N1 into U.S. dairy cattle underscores that livestock beyond poultry are at risk of exposure to infectious organic material from wild birds—such as Canada geese—and that infections in mammals are likely to persist. Continued spillovers increase the risk of a human-adapted HPAI strain emerging, particularly if mammalian mixing vessels become co-infected with both human influenza A and H5N1. During co-infection, the viruses can exchange genetic material, potentially creating a strain capable of efficient human-to-human transmission. The mammals of greatest concern are those that live on farms, such as Sus domesticus (domestic pigs), and those that frequently interact with waterfowl-rich environments and poultry farms, such as Neogale vison (wild minks) [23,24]. If Canada geese are found to be associated with increased H5N1 risk, targeted interventions can be developed to deter them from farms housing livestock.
A 2019 study analyzing two databases of HPAI (Highly Pathogenic Avian Influenza) infections found evidence that pigs and minks may serve as potential mixing vessels for the virus. The study reported a significant presence of various HPAI strains in both species. Pigs showed more confirmed infections with H1N1, H3N2, and H1N2 strains, while minks tested positive more frequently for H5N1, H9N2, and H10N4. Waterfowl, such as Canada geese, are often attracted to livestock feed grains found on farms or near inland water bodies—environments where both pigs and minks are commonly present [3,23]. This creates the potential for HPAI transmission to both mixing vessels [18,25]. These mammals can also be exposed to human influenza A when they are raised as livestock on farms. Additionally, wild minks may encounter human influenza A indirectly—through fomites on stainless steel and plastic farm equipment—while hunting on or near poultry farms.

2. Materials and Methods

This study is an ecological case-control study of predictors of HPAI outbreaks in the 99 Iowa counties. Cases were defined as any Iowa county that experienced an H5N1 outbreak during the reference period. Controls were defined as any Iowa county that did not experience an H5N1 outbreak during the reference period.

2.1. Period of Evaluation for Iowa: 6 March 2022–20 December 2023

The first reported US domestic HPAI outbreak occurred in Indiana on 8 February 2022, and the first outbreak in Iowa was reported on 6 March 2022 [3]. These two states are in the US Midwest, a region of 12 states that covers approximately 1.9 million km2. Within 60 days of the first HPAI infection, the virus was detected in 9 of the 12 midwestern states, which had 44% of domestic HPAI infections [1,2,3]. HPAI spreads rapidly to susceptible poultry farms once it is circulating within a geographic region [3]. Our study used 6 March 2022–20 December 2023 as the reference period because 94% of all confirmed HPAI poultry farm infections in Iowa occurred during that timeframe [2].

2.2. Canada Goose Abundance Data

We obtained Canada goose abundance data from the eBird web resource (https://ebird.org), which has been previously used in research and has high spatial and temporal resolution (File S3) [26,27]. Internet users collect eBird data after completing a tutorial about the optimal locations and times to spot birds. Users also learn how to submit their observation counts using eBird checklists through a cellular phone application (app). The website’s filter software checks user-submitted checklists and flags checklists for discrepancies in the time and location. Users who submitted a flagged checklist must submit further documentation, including photos and videos, for review by eBird ornithology expert volunteers who ensure adherence to data collection standards.
Using eBird, we obtained Canada goose counts (Figure 2) for all of Iowa’s 99 counties during the reference period. Clicking on the “explore” tab directs website users to the data access page, where one can choose counts by species, location (county), month, and year(s).
We created dichotomous Canada goose abundance variables for bivariate analysis for each of the years 2022 and 2023 and for the entire reference period (2022–23). These variables were coded as 1 for greater than or equal to the median value and 0 for less than the median value. We also created categorical variables for our primary predictor and covariates that contained three levels. The levels represented species counts within the first quartile (1 = less than or equal to 25%), species counts falling between the second and third quartile (2 = greater than 25% and less than or equal to 75%), and species counts above the third quartile (3 = greater than 75%). The median was used because Canada goose counts were skewed (Figure 1). Pearson’s coefficient of skewness (Sp) and D’Agostino’s K2 statistic indicated the data were positively skewed (Sp = 0.78, K2: p < 0.01).
Many Canada goose populations are migratory, but we did not incorporate the season into any of the abundance variables because Iowa is now home to a substantial population of temperate-breeding and residential Canada geese. It is now common for a high abundance of these geese to be present in Iowa all year-round, so we evaluated whether this general abundance was associated with a county experiencing an HPAI outbreak [9,28].

2.3. Outcome of Interest: HPAI Positive Counties

The outcome variable included Iowa counties that had at least one H5N1 outbreak during the reference period. Data were then obtained from the APHIS public website to indicate the number of H5N1 outbreaks experienced by an Iowa county. We then created two outcome variables at the county level for all 99 Iowa counties. Our first created outcome variable was dichotomous (HPAI outbreak 1 = yes, 0 = no) and was utilized for the Pearson’s χ2 test. The second variable we created was a count variable for multivariate analysis, representing the total number of HPAI outbreaks in each of the 99 counties during the reference period. The APHIS website includes HPAI outbreak data for wild birds, domestic birds, and mammals (File S2) [29].

2.4. Statistical Methods: Bivariate Analysis

For bivariate analysis, we used Pearson’s chi-square tests to evaluate whether there was an association between HPAI outbreaks and Canada goose abundance in 2022, 2023, and the combined period 2022–23 (Table 1). We used Pearson’s χ2 test because both variables were categorical, observations were independent, and sufficient sample size in each cell of the cross-tabulation. The alpha level for statistical significance was 0.05. R (Version 4.3.2) was used for all statistical analyses.

2.5. Multivariable Model Selection

We analyzed the data using generalized linear (GLM) and zero-inflated negative binomial models (ZINB). These techniques can adjust for confounding and effect modification with our data because they are designed to handle non-normal distributions, zero-inflation, and count data. Any predictor variable with significant Pearson’s χ2 results would be tested using GLM and ZINB models. The diagnostic methods utilized for selecting the most appropriate modeling technique (GLM or ZINB) were dispersion tests, deviance residual plots, fitted vs. observed plots, Akaike Information Criterion (AIC), Bayesian Information Criterion (BIC), and the likelihood ratio test (LRT). Linear and logistic regression models could not be employed because the goose counts had skewed distributions, and the outcome of interest was comprised of counts that contained a high number of zeroes, and a violation of the normality assumption.
After selecting the most suitable modeling technique for the dataset, covariates were systematically evaluated to construct a final model with strong interpretability. Covariate inclusion was guided by reductions in AIC and BIC values, with lower scores indicating better model fit and stability. Each covariate’s impact was assessed by sequentially adding it to the model and observing changes in these criteria. The final model included covariates that consistently contributed to minimizing the AIC and BIC.

2.6. Covariates

The species abundance predictor variable and covariates selected for multivariate models were transformed into more detailed categorical variables that represented quartiles for species counts during the reference period (Table 2). Data for all covariates was also created from species count data available on eBird. Since the relationship between species abundance and H5N1 outbreaks was the focus of this study, the covariates selected were comprised of the species of waterfowl in Iowa that accounted for more than half (61%) of confirmed H5N1-positive tests among wild birds during the reference period [1]. These species were: wood ducks, green-winged teals, mallard ducks, blue-winged teals, and snow geese. Mallard ducks served a dual purpose in our evaluation of Canada goose abundance. As the most abundant species of waterfowl in North America, they were also included in the study to control their presence in Iowa during the reference period.

3. Results

3.1. Descriptive Statistics and Bivariate Results

A total of 47 H5N1 outbreaks were recorded in Iowa during the reference period (Figure 3). Species count descriptive statistics indicated that the Canada goose was the most abundant species of waterfowl during the reference period (Table 3). Descriptive statistics for the variables used in the Pearson’s χ2 tests revealed that the majority of H5N1-positive counties were below the median values for all respective predictor variables (Table 4). Canada goose counts were below the median value for 68% (19/28) of HPAI-positive counties. The Canada gοοse abundance predictor representing the entire reference period (Table 4) was the only predictor to reach significance (χ2 = 4.29, p = 0.04). Given these results, the selection process to identify the appropriate GLM or zero-inflated negative binomial model was utilized only for the combined Canada goose abundance variable.

3.2. Model Diagnostic Results

The dispersion statistic from the Poisson model was greater than one (1.68), eliminating the model from the selection process due to overdispersion. Quasi-Poisson, negative binomial, and zero-inflated negative binomial (ZINB) models were then created to address overdispersion and the high number of zeroes in the data. The examination of the deviance residual indicated that the quasi-Poisson model was not the best fit for the data, and the model was eliminated. The quasi-Poisson model displayed residuals in the negative range of values, which should not occur with count data since negative values are not present. A review of the negative binomial model revealed similar issues that were present in the quasi-Poisson model. Residuals for the negative binomial model were also in the negative range of values. The ZINB model had a band of residuals close to zero, but that is expected, given how the model adjusts for excess zeroes. Furthermore, the residual plot points did not range into negative values the same way the quasi-Poisson and negative binomial models did. The fitted vs. observed plot also indicated ZINB to be the better model, as the predicted and observed values were closest to the fit line. The AIC for the ZINB model (193.89) was lower than the AIC for the negative binomial model (212.01). BIC for the ZINB model was (263.96) was higher compared to the negative binomial model (248.34). A Likelihood ratio test was then employed to evaluate which model performed better. The results indicated the ZINB model was a better fit for the data than the negative binomial model, as the ZINB model yielded a significant p-value. (Likelihood ratio p =< 0.01). The combination of small discrepancies between BIC values, better plot performance, Likelihood ratio test results supporting ZINB, and 72% of the outcome data containing zeroes led us to select the ZINB model over the negative binomial model.
Before evaluating the variables that resulted in the best model fit, the full model was summarized. The summarization revealed that the full model produced NaNs (not a number). A VIF (variance inflation factor) test to evaluate collinearity was conducted, but the test did not provide evidence of collinearity. In an attempt to identify which variables were contributing to NaNs, each variable was excluded, one by one, from subsequent models. This revealed that including the green and blue teal variables resulted in unstable ZINB models. Dropping the green and blue teals resulted in a more stable model with interpretable values, so the variables were not included in the final ZINB model.

3.3. Multivariate Zero-Inflated Negative Binomial Results

The negative binomial component of the ZINB model produced significant results for the Canada goose abundance variable. Canada geese outnumbered all species by at least a 2:1 margin in Iowa during the reference period (Table 3). However, Iowa counties with Canada goose abundance between the 25th and 75th percentile of bird counts were approximately 79% less likely (Table 5) to experience an HPAI outbreak (RR = 0.21; 95% CI = 0.06, 0.62). There were no significant results for the zero-inflated portion of the model.

4. Discussion

4.1. Canada Goose Abundance Hypothesis

During the reference period (February 2022–December 2023), 74% of all H5N1 outbreaks in Iowa were reported, supporting the evaluation of Canada goose abundance during this time. The significant bivariate results indicating an inverse relationship between Canada goose abundance and H5N1 risk were unexpected, given the species’ potential as a vector for transmission. Multivariate analysis confirmed the current unexpected results, as Canada goose abundance between the 25th and 75th percentiles was also associated with reduced risk of H5N1 outbreaks. One possible biological mechanism underlying this association is that Canada geese, due to their large size and territorial behavior, may displace other waterfowl species that are more efficient transmitters of HPAI. Their dominance in shared habitats could reduce interspecies interactions and limit opportunities for viral transmission, despite their own potential to carry the virus. However, without access to detailed farm location data or significant findings for geese abundance above the 75th percentile, we interpret these results with caution. It remains unclear whether higher goose abundance is associated with increased or decreased risk.
Given that the Canada goose is among the most abundant waterfowl species in North America and has demonstrated the ability to carry HPAI, we initially hypothesized that intermediate or high abundance would be associated with increased outbreak risk. The lack of support for this hypothesis raises the possibility that other vectors, such as rodents, may play a more prominent role in H5N1 transmission. Rodents frequently inhabit environments used by waterfowl (e.g., inland water bodies) and can infiltrate poultry farms with compromised fencing [30]. Their anatomy allows them to collect and transport contaminated organic material, which could be deposited in areas where domestic birds are housed. These characteristics suggest rodents may act as effective mechanical vectors of HPAI.
Our findings are consistent with recent studies that did not identify Canada geese as primary vectors of HPAI [16,28]. For example, infected mallard ducks have been shown to maintain migratory behavior while shedding H5N1 and exhibit greater viral tropism than Canada geese [16,28]. These traits allow mallards to travel long distances while remaining infectious, a capacity not yet demonstrated in Canada geese. Our results further support the notion that Canada geese may not play the same role in HPAI transmission dynamics as mallards.
Although our study yielded statistically significant inverse results, the role of Canada geese in H5N1 transmission remains inconclusive. This uncertainty stems from the lack of significant associations between both low and high Canada goose abundance and HPAI occurrence. The absence of clear patterns across abundance levels highlights the need for more granular data and supports the growing consensus in recent literature that the species’ role in HPAI dynamics is still not well understood. While Canada geese may not currently be major contributors to HPAI spread, their widespread distribution and behavioral tendencies—particularly their habituation to human environments—warrant continued surveillance and inclusion in future risk assessments [13,18]. Our findings therefore support the continued use and reinforcement of existing biosecurity protocols, since Canada goose abundance was not associated with elevated H5N1 risk. Had a positive association been observed, targeted interventions—such as visual deterrents (e.g., predator-mimicking balloons)—might have been warranted [31].
While reinforcing existing biosecurity protocols remains essential for reducing H5N1 risk, emerging technologies—such as artificial intelligence (AI), robotics, and sensor networks—offer promising solutions to overcome current limitations, particularly the lack of robust, accessible data. AI-enabled platforms can enhance rapid detection, modeling, and response to HPAI outbreaks without relying on centralized or restricted datasets. For instance, the Biothreats Emergence, Analysis, and Communications Network (BEACON), launched in April 2025, integrates AI with expert human oversight to collect, validate, and disseminate outbreak intelligence [32]. Its ability to generate GIS-compatible, location-tagged data presents a valuable resource for enhancing ecological modeling efforts like ours. Platforms like BEACON also hold significant promise because, in theory, they can collaborate with government agencies to leverage restricted datasets in generating public-facing outbreak intelligence—without compromising the confidentiality of the underlying data.
In addition, smart chemical sensors coated with HPAI-specific antibodies—when paired with AI classifiers—enable real-time detection of viral particles. These systems are particularly beneficial on farms housing mixing vessel mammals, where early identification is critical [33]. By facilitating immediate quarantine and targeted biosecurity responses, such technologies have the potential to significantly reduce viral spread and associated economic losses.
Large poultry producing companies investing in AI is a cost-effective strategy since it will reduce the number of livestock lost due to the efficient rapid detection capabilities AI technology can provide. AI implementation would be costly for smaller farms, but stakeholders could apply for USDA grants and technical assistance that award funding for innovative production [34]. Stakeholders should also collaborate to request more government funding for the implementation of novel technologies on farms. The justification would be that the improved rapid detection capabilities of AI will result in fewer livestock lost, therefore reducing the need for indemnity payments from the government agency USDA-APHIS.

4.2. Short-Term Strategy to Reduce H5N1 Spread: Reinforcing Biosecurity Guidelines

4.2.1. Maintaining Biosecurity on All Farms

Although specific biosecurity recommendations to deter Canada geese do not need to be implemented, recommended biosecurity practices should be maintained on all farms that raise livestock. The current epizootic has underscored how H5N1 can infect poultry, cows, and mixing vessel mammals. The primary recommendations for reducing HPAI on all farms are grading property to avoid the pooling of water, filling areas where water stands for more than 48 h, farm workers avoiding areas where water stands for more than 48 h, and farm owners consistently inspecting pipes and connections for leaks. At the time of our study, APHIS reported only one confirmed HPAI-positive test in a pig: a positive sign that biosecurity is being prioritized by stakeholders on farms raising these potential mixing vessels [19]. However, maintaining these biosecurity recommendations is crucial, given that H5N1 is still circulating in the US. A lapse in biosecurity could result in an HPAI surge in pigs, triggering the otherwise well-known evolutionary processes in a mixing vessel [19,20].

4.2.2. Rodent Control

Rodents can function as mechanical vectors because they frequent inland water bodies where waterfowl congregate and travel to farms to exploit available resources (e.g., feed spills). It is possible that H5N1-positive poultry farms from Iowa had significant rodent infestations, which may have played a role in exposing susceptible poultry to infectious organic material [15,30]. The most common rodents found on US farms are Mus musculus (house mouse) and Rattus norvegicus (brown rat). These rodents possess the anatomy (short legs, bodies close to the ground) to gather and deposit various organic materials in their coats [35]. The recent study evaluating self-reported US HPAI risk factors also discussed how problems with rodent control were reported more on case farms, which is consistent with previous findings that controlling rodents reduces HPAI risk [15,31]. Biosecurity recommendations to reduce rodent infiltration on farms include eliminating sweating pipes, open drains, and open water sources such as troughs. Reduction of feed spillage and keeping all feed in metal hoppers or covered cans is another intervention that can deter both waterfowl and rodents.

4.3. Study Limitations

4.3.1. Poultry Farm Data Limitations

Robust location data for where Canada geese were spotted and counted was available, but without poultry farm location data, we could not evaluate the distance between Canada geese and farms with outbreaks. If location data were available, we would have created detailed variables that incorporated different levels of distance between poultry farms and Canada goose abundance to discern if it affected HPAI risk. An example of the type of variable we would have created with poultry farm location data is HPAI-positive farms 2 km2 from >200 Canada geese. Besides the inferential power of statistical comparisons, there is a practical importance of reporting geospatial evaluation results for all variables. The results will help US stakeholders determine the relative importance of risk factors.

4.3.2. Canada Geese and Covariate Species Data Limitations

All species variables were created using data from the eBird website [26]. The website (https://ebird.org) relies on observations and reports from citizen scientists, which may introduce spatial and temporal biases. This can occur through unequal engagement across different locations or times, individual variations in data collecting behavior, and selective observation based on personal interests. These biases can result in data inconsistencies, creating issues when analyzing the data. The way eBird attempts to offset the lack of expertise needed to observe and submit data is by offering online training that educates prospective citizen scientists on how to follow the proper reporting protocols.

4.3.3. Study Design Limitations

One of the reasons we were unable to establish causal inferences was due to the use of an ecological study design. This approach allowed us to examine associations between species abundance and HPAI outbreak risk, but not causality. The choice of study design was driven by the lack of access to precise poultry farm location data. Had such data been available, a case-control or prospective study design would have been preferable. Access to accurate farm location data would enable researchers to assess which specific waterfowl species are present near farms and whether proximity to these birds influences HPAI outbreak risk over time.
Despite these limitations, our study design enabled us to leverage available county-level farm outcome data, and eBird remains a trusted data source. In the absence of poultry farm location data, the ecological design was a necessary choice that allowed us to initiate evaluation of our predictors of interest. eBird continues to be widely used in scientific research due to the rigorous quality control measures implemented by the Cornell Lab of Ornithology. These include automated data filters and a network of volunteer bird experts who help verify observations submitted by citizen scientists [26,27].

4.3.4. Reason for Lack of Poultry Farm Location Data

Allowing access to protected data for specific individuals would benefit stakeholders because more research conducted on issues relevant to them will result in more ideas on how to reduce risk. Therefore, stakeholders in Iowa should create a coalition that focuses on reaching out and communicating with legislators. These communications would center on providing the rationale for amending the law prohibiting full access to outbreak data so that qualified researchers, not part of a government agency, trade group, or university extension, can gain access [36]. A qualified researcher is someone with a well-reasoned plan for wanting to use the data and a willingness to maintain confidentiality. Gaining an exemption from accessing data would be contingent upon the individual attesting to maintain confidentiality and not disseminating the data to anyone else. The dataset could contain a digital rights management tool (DRM) and an expiration date as extra security measures, should the qualified researcher fail to uphold their rights and responsibilities. Anyone who violates the attestation will be disqualified from future exemptions. Allowing qualified researchers access to this data provides the opportunity for multiple relevant studies to take place in a timely manner, which will inform stakeholders on how and where to focus their resources.
Data access policies may be intended to protect privacy, but they can limit research opportunities that benefit stakeholders. Establishing qualified research exemptions may facilitate studies leading to improved risk management and mitigation strategies.

5. Conclusions

The expected results for Canada goose abundance did not materialize. However, the significant results we obtained provide justification for further evaluation of this species. It is possible our study could have yielded significant results if we had access to location data. We would have included how close counted (km2) Canada goose flocks were to each respective poultry farm in all 99 Iowa counties, instead of being limited to county-level analysis.
Allowing reasonable public access to accurate farm location data will let qualified public health professionals conduct robust evaluations of environmental risk factors unique to HPAI outbreaks. The results from these evaluations will translate into more detailed information to help stakeholders decrease HPAI exposure and incidence among farm workers, domestic poultry, and the public.
In the absence of strong evidence supporting revised biosecurity measures for a specific vector, reinforcing existing protocols on susceptible poultry farms remains the most effective strategy to reduce H5N1 risk. However, the lack of accessible poultry farm data underscores the need for next-generation surveillance infrastructure. Future biosecurity efforts should prioritize integrating AI-driven tools like BEACON or biosensor networks to enable real-time, farm-level H5N1 monitoring. These technologies can enhance early outbreak detection and empower stakeholders to respond independently of centralized reporting systems. For large-scale operations, investing in AI offers a cost-effective means of minimizing livestock losses, while smaller farms could benefit from USDA grants and cooperative funding models to support adoption.

Supplementary Materials

The following supporting information can be downloaded at: https://www.mdpi.com/article/10.3390/app15126900/s1, File S1: USDA FOIA acknowledgment letter, File S2 APHIS data provided after FOIA, File S3 eBird raw data, File S4 Iowa state law 163.3C, File S5 SPSS dataset, File S6 R code.

Author Contributions

Conceptualization, C.J. and L.A.H.; data curation, C.J.; formal analysis, C.J.; investigation, C.J.; methodology, C.J.; supervision, L.A.H.; writing—original draft, C.J.; writing—review and editing, C.J., S.-O.K., J.E.R. and L.A.H. All authors have read and agreed to the published version of the manuscript.

Funding

This research received no external funding.

Institutional Review Board Statement

This study did not include any human subjects, so no IRB approval was needed.

Informed Consent Statement

Not applicable, no human subjects in this study.

Data Availability Statement

Direct links are provided to website pages where raw data for variables of interest are stored. SPSS Datasets imported to R Studio 4.3.2 are included in the folder with the Supplementary Materials (R code Canada goose analysis.docx and Waterfowl_man.sav). HPAI outbreaks: https://www.aphis.usda.gov/livestock-poultry-disease/avian/avian-influenza/hpai-detections/commercial-backyard-flocks (accessed on 2 January 2024). Canada goose count: https://ebird.org/barchart?r=US-IA&bmo=1&emo=12&byr=2022&eyr=2023&spp=cangoo (accessed on 2 April 2024).

Acknowledgments

Thank you to the editorial staff for all their assistance during this process.

Conflicts of Interest

The authors declare no conflicts of interest.

Abbreviations

The following abbreviations are used in this manuscript:
AICAkaike Information Criterion
AIArtificial Intelligence
APHISAnimal and Plant Health Inspection Service
BICBayesian Information Criterion
HPAIHighly Pathogenic Avian Influenza
HAHemagglutinin
NANeuraminidase
NaNNot a Number
OROdds Ratio
VIFVariance Inflation Factor
RRRelative Risk
USDAUnited States Department of Agriculture
USUnited States
ZINBZero inflated negative binomial

References

  1. United States Department of Agriculture-Animal Health and Plant Inspection Service. Confirmations of Highly Pathogenic Avian Influenza in Wild Birds. 2025. Available online: https://www.aphis.usda.gov/livestock-poultry-disease/avian/avian-influenza/hpai-detections/wild-birds (accessed on 20 March 2025).
  2. United States Department of Agriculture-Animal Health and Plant Inspection Service. Confirmations of Highly Pathogenic Avian Influenza in Commercial and Backyard Flocks. 2024. Available online: https://www.aphis.usda.gov/livestock-poultry-disease/avian/avian-influenza/hpai-detections (accessed on 4 April 2024).
  3. Animal and Plant Health Inspection Service-Veterinary Services Surveillance, P. and Response Services. Epidemiologic and Other Analyses of HPAI-Affected Poultry Flocks 1 June 2023 Interim Report. 2023. Available online: https://www.aphis.usda.gov/sites/default/files/epi-analyses-avian-flu-poultry-2nd-interim-rpt.pdf (accessed on 24 January 2024).
  4. Center for Disease Control and Prevention. Avian Influenza in Birds: Causes and How It Spreads. 2022. Available online: https://archive.cdc.gov/#/details?url=https://www.cdc.gov/bird-flu/virus-transmission/avian-in-birds.html (accessed on 20 May 2023).
  5. Kurmi, B.; Murugkar, H.V.; Nagarajan, S.; Tosh, C.; Dubey, S.C.; Kumar, M. Survivability of Highly Pathogenic Avian Influenza H5N1 Virus in Poultry Faeces at Different Temperatures. Indian J. Virol. 2013, 24, 272–277. [Google Scholar] [CrossRef] [PubMed]
  6. Yamamoto, Y.; Nakamura, K.; Mase, M. Survival of Highly Pathogenic Avian Influenza H5N1 Virus in Tissues Derived from Experimentally Infected Chickens. Appl. Environ. Microbiol. 2017, 83, e00604-17. [Google Scholar] [CrossRef] [PubMed]
  7. Center for Disease Control and Prevention. H5 Bird Flu: Current Situation. 2025. Available online: https://www.cdc.gov/bird-flu/situation-summary/index.html (accessed on 1 April 2025).
  8. Center for Disease Control and Prevention. CDC Confirms Human Cases of H5 Bird Flu Among Colorado Poultry Workers. 2024. Available online: https://www.cdc.gov/media/releases/2024/p-0715-confirm-h5.html (accessed on 16 August 2024).
  9. Luukkonen, B.Z.; Jones, O.E., III; Klaver, R.W. Canada Goose Survival and Recovery Rates in Urban and Rural Areas of Iowa, USA. J. Wildl. Manag. 2021, 85, 283–292. [Google Scholar] [CrossRef]
  10. United States Department of Agriculture-Animal Health and Plant Inspection Service. Avian Influenza. 2025. Available online: https://www.aphis.usda.gov/livestock-poultry-disease/avian/avian-influenza (accessed on 3 April 2025).
  11. Runstadler, J.A.; Puryear, W.B. The virus is out of the barn: The emergence of HPAI as a pathogen of avian and mammalian wildlife around the globe. Am. J. Vet. Res. 2024, 85, 1–7. [Google Scholar] [CrossRef] [PubMed]
  12. Cornell Lab of Ornithology. All About Birds-Canada Goose. 2022. Available online: https://www.allaboutbirds.org/guide/Canada_Goose (accessed on 19 April 2024).
  13. Luukkonen, B.Z.K.; Jones, O.E., III. Movement of Canada Geese in urban and rural areas of Iowa, USA. Avian Conserv. Ecol. 2022, 17, 27. [Google Scholar] [CrossRef]
  14. Askren, R.J.; Eichholz, M.; Sharp, C.M.; Washburn, B.E.; Beckerman, S.F.; Pullins, S.; Fournier, A.; VonBank, J.; Weegman, M.D.; Hagy, H.M.; et al. Behavioral responses of Canada geese to winter harassment in the context of human-wildlife conflicts. Wildl. Soc. Bull. 2022, 46, e1384. [Google Scholar] [CrossRef]
  15. Green, A.L.; Branan, M.; Fields, V.L.; Patyk, K.; Kolar, S.K.; Beam, A.; Marshall, K.; McGuigan, R.; Vuolo, M.; Freifeld, A.; et al. Investigation of risk factors for introduction of highly pathogenic avian influenza H5N1 virus onto table egg farms in the United States, 2022: A case–control study. Front. Vet. Sci. 2023, 10, 1229008. [Google Scholar] [CrossRef] [PubMed]
  16. Iowa Department of Natural Resoruces. Waterfowl Management, Seasons, and Harvests in Iowa. 2023. Available online: https://www.iowadnr.gov/media/1706/download?inline (accessed on 6 March 2024).
  17. Pasick, J.; Berhane, Y.; Embury-Hyatt, C.; Copps, J.; Kehler, H.; Handel, K.; Babiuk, S.; Hooper-McGrevy, K.; Li, Y.; Mai Le, Q.; et al. Susceptibility of Canada Geese (Branta canadensis) to highly pathogenic avian influenza virus (H5N1). Emerg. Infect. Dis. 2007, 13, 1821–1827. [Google Scholar] [CrossRef] [PubMed]
  18. Hill, N.J.B.; Trovão, N.S.; Ineson, K.M.; Schaefer, A.L.; Puryear, W.B.; Zhou, K.; Foss, A.D.; Clark, D.E.; MacKenzie, K.G.; MacKenzie, K.G.; et al. Ecological divergence of wild birds drives avian influenza spillover and global spread. PLoS Pathog. 2022, 8, e1010062. [Google Scholar] [CrossRef] [PubMed]
  19. Teitelbaum, C.S.; Masto, N.M.; Sullivan, J.D.; Keever, A.; Poulson, R.; Bradshaw, B.; Highway, C.; Feddrsem, J.; Hagy, H.; Gerhold, R.; et al. North American wintering mallards infected with highly pathogenic avian influenza show few signs of altered local or migratory movements. Sci. Rep. 2023, 13, 14473. [Google Scholar] [CrossRef] [PubMed]
  20. Center for Disease Control and Prevention. Current Situation: Bird Flu in Dairy Cows. 2025. Available online: https://www.cdc.gov/bird-flu/situation-summary/mammals.html (accessed on 20 February 2025).
  21. Arizona Emergency Information Network. Avian Influenza Found in Dairy Cattle in Maricopa County. 2025. Available online: https://ein.az.gov/avian-influenza-found-dairy-cattle-maricopa-county (accessed on 17 February 2025).
  22. United States Department of Agriculture- Animal Health and Plant Inspection Service. Detections of Highly Pathogenic Avian Influenza in Mammals. 2025. Available online: https://www.aphis.usda.gov/livestock-poultry-disease/avian/avian-influenza/hpai-detections/mammals (accessed on 20 March 2025).
  23. Shao, W.L.; Goraya, M.; Wang, S.; Chen, J.L. Evolution of Influenza A Virus by Mutation and Re-Assortment. Int. J. Mol. Sci. 2017, 18, 1650. [Google Scholar] [CrossRef] [PubMed]
  24. Zhao, P.; Sun, L.; Xiong, J.; Wang, C.; Chen, L.; Yang, P.; Yu, H.; Cheng, Y.; Jiang, L.; Chen, Y.; et al. Semiaquatic mammals might be intermediate hosts to spread avian influenza viruses from avian to human. Sci. Rep. 2019, 9, 11641. [Google Scholar] [CrossRef] [PubMed]
  25. Abdelwhab, E.M.; Mettenleiter, T.C. Zoonotic Animal Influenza Virus and Potential Mixing Vessel Hosts. Viruses 2023, 15, 980. [Google Scholar] [CrossRef] [PubMed]
  26. eBird. eBird Review Process. 2024. Available online: https://support.ebird.org/en/support/solutions/articles/48000795278?_gl=1*1b9zjoy*_gcl_au*MTE1NDA1ODQ1MS4xNzI5NDgzMzQx*_ga*MTY1MzU0ODUwOC4xNzE1MzUxNzQ1*_ga_QR4NVXZ8BM*MTczNDM4MjY4Ny4zMS4xLjE3MzQzODI2OTkuNDguMC4w&_ga=2.194236781.1517257474.1734382688-1653548508.1715351745 (accessed on 12 April 2024).
  27. eBird. eBird Status and Trends. 2024. Available online: https://science.ebird.org/en/status-and-trends (accessed on 13 May 2024).
  28. Iowa Department of Natural Resources. Canada Goose Control Guidelines; Iowa Department of Natural Resources: Des Moines, IA, USA, 2025; p. 7.
  29. United States Department of Agriculture- Animal Health and Plant Inspection Service. H5N1. 2025. Available online: https://www.aphis.usda.gov/h5n1-hpai#detections-hpai (accessed on 5 April 2025).
  30. Velkers, F.C.; Blokhuis, S.J.; Veldhuis Kroeze, E.J.B.; Burt, S.A. The role of rodents in avian influenza outbreaks in poultry farms: A review. Vet. Q. 2017, 37, 182–194. [Google Scholar] [CrossRef] [PubMed]
  31. United States Department of Agriculture-Animal Health and Plant Inspection Service. Prevent Avian Influenza at Your Farm-Improving Your Biosecurity with Simple Wildlife Management Practices. 2015. Available online: https://www.aphis.usda.gov/sites/default/files/hpaifactsheet_wildlife-biosecurity.pdf (accessed on 20 March 2025).
  32. Biothreats Emergence, Analysis and Communications Network (BEACON). 2025. Available online: https://www.bu.edu/ceid/projects-partnerships/beacon/ (accessed on 29 May 2025).
  33. Park, M.; Britton, D.; Daley, W.; McMurray, G.; Navaei, M.; Samoylov, A.; Usher, C.; Xu, J. Artificial intelligence, sensors, robots, and transportation systems drive an innovative future for poultry broiler and breeder management. Anim. Front. 2022, 12, 40–48. [Google Scholar] [CrossRef] [PubMed]
  34. United States Department of Agriculture. USDA Announces Grants and Technical Assistance Funding for Urban Agriculture and Innovative Production. 2025. Available online: https://www.usda.gov/about-usda/news/press-releases/2025/01/08/usda-announces-grants-and-technical-assistance-funding-urban-agriculture-and-innovative-production (accessed on 13 June 2025).
  35. Backhans, A.; Fellström, C. Rodents on pig and chicken farms—A potential threat to human and animal health. Infect Ecol. Epidemiol. 2012, 2, 17093. [Google Scholar] [CrossRef] [PubMed]
  36. Iowa State Assembly. Infectious and contagious diseases among animals: Foreign animal disease preparedness and response strategy. Available online: https://www.legis.iowa.gov/docs/ico/chapter/163.pdf (accessed on 15 February 2025).
Figure 1. Study diagram.
Applsci 15 06900 g001
Figure 2. Histogram for Canada goose count in Iowa, February 2022–December 2023.
Applsci 15 06900 g002
Figure 3. Frequency distribution of HPAI outbreaks in all Iowa counties during the reference period, 2022—2023.
Applsci 15 06900 g003
Table 1. Variables for bivariate analysis (Pearson’s χ2).
Dichotomous VariableVariable DescriptionVariable Type
Combined Canada goose count greater than median valueWhether a county’s cumulative Canada goose count, for years 2022–2023, was above the median value created from count data for 99 Iowa counties. Primary predictor.Categorical 1 = Yes, 0 = No
2022 Canada goose count greater than median valueWhether a county’s cumulative Canada goose count, for 2022, was above the median value created from count data for 99 Iowa counties. Stratified variable.Categorical 1 = Yes, 0 = No
2023 Canada goose count greater than median valueWhether a county’s cumulative Canada goose count, for 2023, was above the median value created from count data for 99 Iowa counties. Stratified variable.Categorical 1 = Yes, 0 = No
HPAI outbreakWhether a county experienced an HPAI outbreak during the reference period (2022–2023). Outcome of interest.Categorical 1 = Yes, 0 = No
Table 2. Predictor variable and covariates for multivariate analysis of Canada goose abundance for all Iowa counties (N = 99) during the reference period.
Predictor Variable and CovariatesVariable DescriptionVariable Type
Canada goose species abundance by quartile.Primary predictor: Canada geese abundance derived from species counts stored in eBird for all 99 Iowa counties. Counts represent the entire reference period (January 2022–December 2023).Categorical 1 = counts within the first quartile (25%), 2 = counts falling between the second and third quartile (25–75%), 3 = counts above the third quartile (>75%).
Mallard duck species abundance by quartile.Covariate: mallard duck abundance derived from species counts stored in eBird for all 99 Iowa counties. Counts represent the entire reference period (January 2022–December 2023).Categorical 1 = counts within the first quartile (25%), 2 = counts falling between the second and third quartile (25–75%), 3 = counts above the third quartile (>75%).
Wood duck abundance by quartile.Covariate: Wood duck abundance derived from species counts stored in eBird for all 99 Iowa counties. Counts represent the entire reference period (January 2022–December 2023).Categorical 1 = counts within the first quartile (25%), 2 = counts falling between the second and third quartile (25–75%), 3 = counts above the third quartile (>75%).
Green-winged teal abundance by quartile.Covariate: Green-winged teal abundance derived from species counts stored in eBird for all 99 Iowa counties. Counts represent the entire reference period (January 2022–December 2023).Categorical 1 = counts within the first quartile (25%), 2 = counts falling between the second and third quartile (25–75%), 3 = counts above the third quartile (>75%).
Table 3. Waterfowl species counts during the study reference period.
YearCanada GeeseMallard DucksWood DucksBlue-Winged TealsGreen-Winged TealsSnow Geese
20221,293,380334,31028,87266,32067,224568,426
20231,076,316297,37428,64957,00768,878433,246
Total2,369,666631,69757,521123,327136,1021,001,672
Table 4. Descriptive statistics and Pearson χ2 test.
VariableSpecies CountHPAI+ Counties CountMedianHPAI+ Counties > Medianχ2 (p-Value)
Canada goose counts greater than or equal to median (full reference period)2,369,666310,19839479 (32%)4.29 (0.04)
Canada goose counts greater than or equal to median 20221,293,380152,166236311 (39%)1.39 (0.24)
Canada goose counts greater than or equal to median 20231,076,316158,032160011 (39%)1.39 (0.24)
Table 5. Canada goose abundance in HPAI+ Iowa counties compared to that in HPAI Iowa counties, zero-inflated negative binomial regression, N = 99.
Variables/CovariatesRR95 CI%p-Value
Canada goose abundance between 25th and 75th percentiles0.21 **0.04, 0.90 **0.04 **
Canada goose abundance above 75th percentile0.200.02, 1.110.13
Mallard duck abundance between 25th and 75th percentile>100<0.01, >1000.95
Mallard duck abundance above 75th percentile>100<0.01, >1000.98
Snow goose abundance between 25th and 75th percentiles1.440.31, 6.630.64
Snow goose abundance above 75th percentile0.810.20, 3.300.77
Wood duck abundance between 25th and 75th percentiles<0.01<0.01, >1000.95
Wood duck abundance above 75th percentile<0.01<0.01, >1000.96
Zero-inflated component
Canada goose abundance between 25th and 75th percentiles0.18<0.01, 37.120.52
Canada goose abundance above 75th percentile>100<0.01, >1000.95
Mallard duck abundance between 25th and 75th percentiles<0.01<0.01, >1000.94
Mallard duck abundance above 75th percentile1.73<0.01, >1000.99
Snow goose abundance between 25th and 75th percentiles8.510.29, 17.840.21
Snow goose abundance above 75th percentile0.18<0.01, 3.850.28
Wood duck abundance between 25th and 75th percentiles>100<0.01, >1000.92
Wood duck abundance above 75th percentile>100<0.01, >1000.95
** p < 0.05.
Disclaimer/Publisher’s Note: The statements, opinions and data contained in all publications are solely those of the individual author(s) and contributor(s) and not of MDPI and/or the editor(s). MDPI and/or the editor(s) disclaim responsibility for any injury to people or property resulting from any ideas, methods, instructions or products referred to in the content.

