1. Introduction
Blueberries are widely grown around the world, including the United States, Japan, China, New Zealand, and Europe [
1], and have high economic value because of their rich nutrition and unique taste [
2]. As traditional manual harvesting can no longer meet the growing market demands, automated blueberry harvesting technology has become a research interest [
3]. Fast and accurate maturity detection is key to automated picking but faces challenges in complex outdoor environments, such as shading by branches and leaves, variations in light, overlapping fruits, and the small diameter of blueberries themselves.
Traditional image processing methods mainly rely on extracting surface features, such as the color and texture of the target fruit, and then use support vector machines and K-means clustering algorithms to detect and classify the maturity of the fruit [
4]. Khojastehnazhand et al. classified apricots into three maturity stages (i.e., unripe, ripe, and overripe), employing color features [
5]. Saifullah et al. used the K-Nearest Neighbors (KNN) method based on color feature extraction to classify the fruit maturity of oil palms [
6]. Saha et al. studied starfruit maturity using smartphone-based imaging and a variety of traditional machine-learning algorithms [
7]. Wei et al. predicted the maturity of grapes from color values using the back-propagation neural network algorithm (BPNN) [
8]. Yue et al. developed three strawberry maturity recognition models using absorbance data, finding the multivariate nonlinear model most accurate in greenhouse conditions [
9]. Wang et al. segmented strawberries based using hue-based masks and used the red ratio to quantify maturity [
10].
While traditional methods achieve high accuracy in controlled settings, their sensitivity to lighting and background changes limits their generalization and suitability for outdoor farming, and this limitation has led to the adoption of deep learning, offering a more robust approach for maturity detection in fruit and vegetable crops under complex natural conditions [
3]. Yang et al. proposed a strawberry maturity grading model based on YOLOv8, combined with a LW-Swin Transformer module to improve the generalization capability [
11]. Addressing more complex scenarios, such as the detection of small objects and the occlusion of different maturity stages, Wang et al. proposed a foreground–foreground class balance method and an improved YOLOv8s network to detect and segment tomato fruits [
12]. Zhou et al. [
13] compared strawberry maturity classification using YOLOv3 with aerial and ground-based images, demonstrating superior speed and accuracy, respectively. Siricharoen et al. [
14] addressed the problem of limited training data for pineapple maturity grading using the more traditional Mask R-CNN. Saedi et al. [
15] introduced a dual-path lightweight CNN combining regular and dilated convolution to classify olive varieties. To address occlusion and lighting interference in broccoli maturity recognition, Kang et al. [
16] developed a CNN–Transformer-based instance segmentation network. MacEachern et al. [
17] compared six YOLO variants for wild blueberry maturity detection, aiding localized grower decisions. Parvathi et al. [
18] proposed a Faster R-CNN model with ResNet-50 for detecting coconut maturity in complex backgrounds. Wang et al. [
19] combined a Faster R-CNN with a path aggregation network for tomato maturity detection, achieving strong results in occluded and uneven lighting conditions. Chen et al. [
20] introduced a multi-task variant of YOLOv7 to assess cherry tomato with respect to the location, size, category, and maturity of the fruit clusters. The methods and drawbacks of fruit and vegetable maturity detection research using deep learning are shown in
Table 1.
While these algorithms outperform traditional computer vision methods in accuracy, robustness, and applicability, they are often limited to close-range detection and struggle with more complex scenarios. In blueberry maturity detection, the issues of extraordinarily small fruits, severe occlusions, and strongly varying light conditions need to be addressed for automated harvesting across large areas. Therefore, how to optimize model complexity while ensuring detection accuracy and enhancing adaptability in complex environments remains a key issue in current algorithm research.
The contributions of this work are as follows: (1) This article extends the well-known YOLOv8n model by Receptive-Field Attention Convolution (RFAConv) [
21] in the backbone network to enhance the model’s ability to extract small object features and improve detection accuracy. (2) A small object detection layer is introduced in the neck network. (3) These features are integrated as a four-head adaptive spatial feature fusion (Detect-FASFF), based on [
22], which further enhances the model’s ability to detect targets at different scales and reduces feature loss to solve the problem of missed detections and false positives under conditions such as long-range views, severe occlusion, and varying lighting. (4) A more focused complete intersection over union loss (Focaler-CIoU) is introduced into the loss function to speed up the convergence of the model, thus improving its detection performance [
23].
2. YOLOv8 Reference Network
YOLOv8, developed by the company Ultralytics, is the eighth-generation model in the YOLO series. It introduces several architectural improvements to enhance performance and flexibility in object detection tasks [
24]. The standard YOLOv8 network consists of three main components: the backbone, the neck, and the head networks.
In YOLOv8, the backbone network replaces the earlier C3 (Cross Stage Partial Network v3) module with the C2f (Cross Stage Partial Network v2 with Fusion) module for feature extraction. The C2f module integrates the bottleneck structure, convolutional layers, and skip connections, improving gradient flow while reducing model complexity. Additionally, the SPPF (Spatial Pyramid Pooling-Fast) module is incorporated for multi-scale feature extraction and fusion. The neck network employs the FPN (Feature Pyramid Network) and PAN (path aggregation network) architectures to enhance feature fusion for multi-scale object detection. The head network adopts a decoupled structure with an anchor-free design, where the classification task uses the BCE (Binary Cross Entropy) loss function and the regression task employs the Distribution Focal Loss and CIOU (complete intersection over union) loss functions.
3. Modifications to the Reference Network
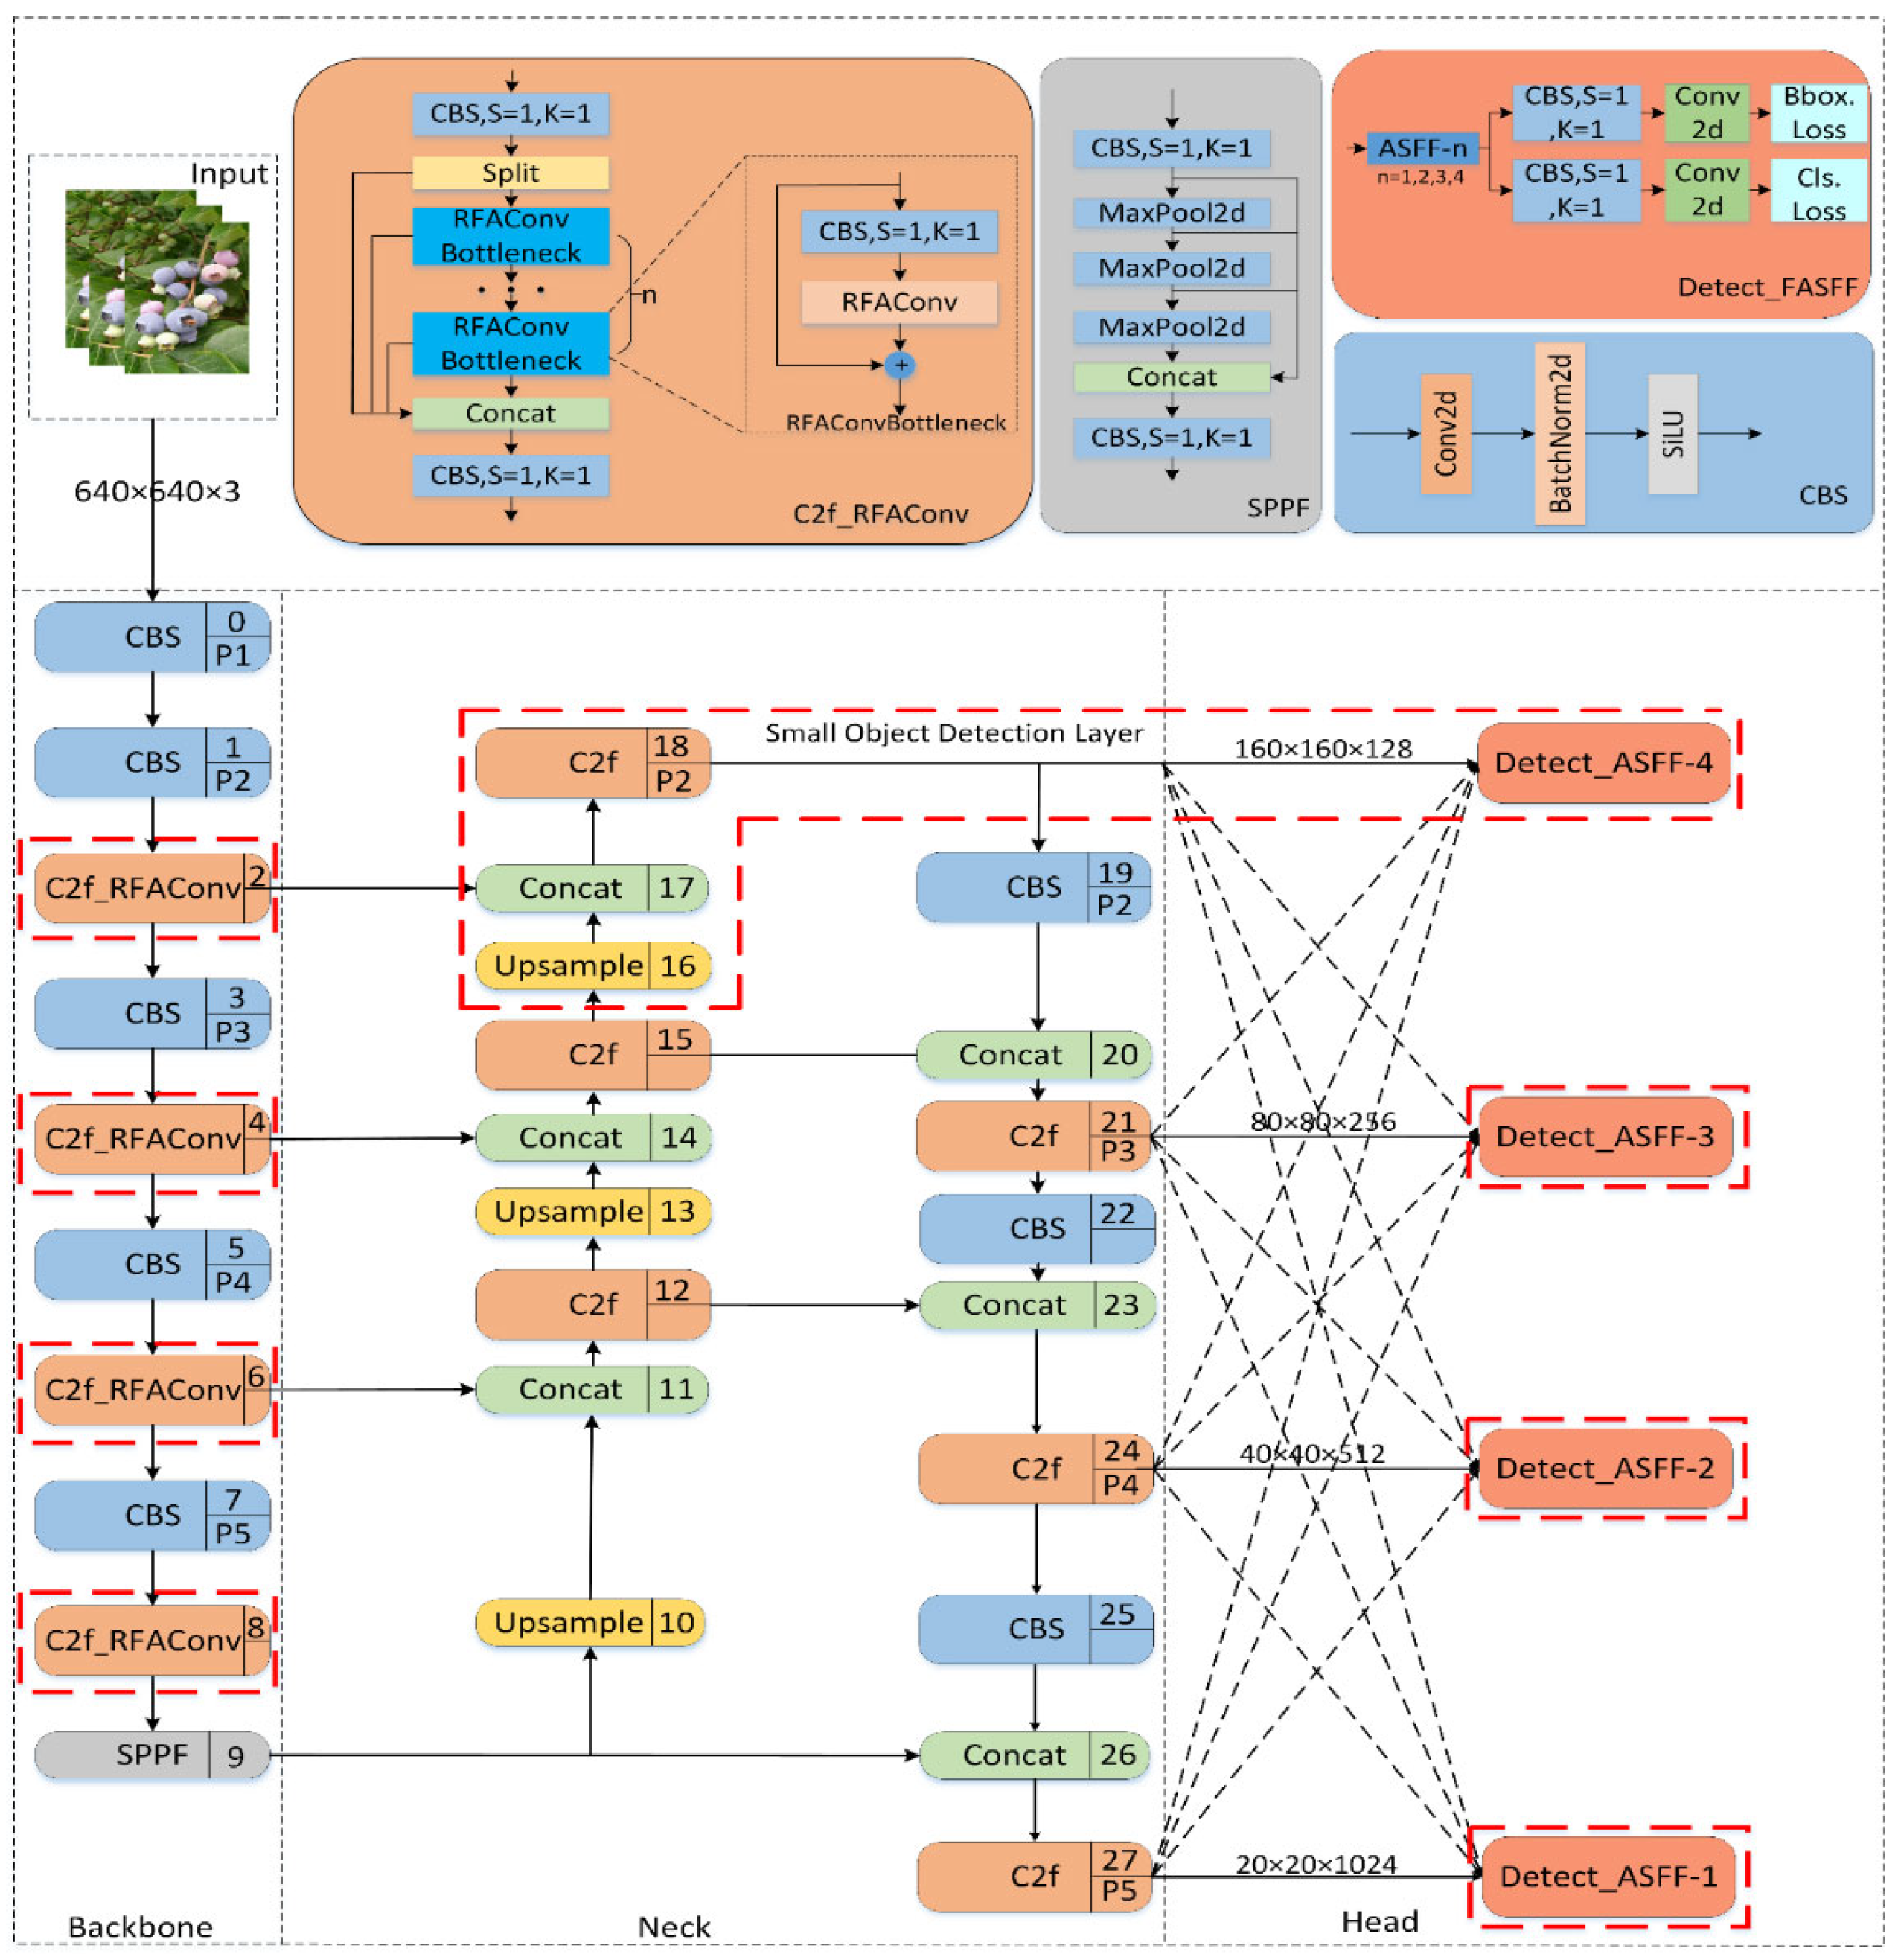
This paper aims to improve the YOLOv8n baseline network for the detection of very small objects, such as blueberry fruits. Our modifications include the following: (1) In the backbone, Receptive-Field Attention Convolution (RFAConv) is applied to the C2f module. The C2f-RFAConv module aims to capture more detailed structural information for small objects by strengthening receptive fields to enhance sensitivity to fine-scale features. (2) In the neck network, a small object detection layer is added to enhance the ability to extract small object features. (3) At the output stage, this study employs a four-head version of the adaptive spatial feature fusion detection (Detect-FASFF). This module integrates multi-scale spatial features to improve the detection of small and occluded objects. (4) The CIOU loss function is replaced with Focaler-CIoU, a more focused complete intersection over union loss. This modification intends to improve bounding box regression by prioritizing difficult-to-detect small objects. The adapted model’s structure diagram is shown in
Figure 1, with the red dashed boxes indicating the modifications.
3.1. Receptive-Field Attention Convolution
RFAConv (Receptive-Field Attention Convolution) [
21] improves upon standard convolution by addressing its key limitation: parameter sharing. Traditional convolutions apply the same kernel across the entire image, which can overlook variations in feature importance across different spatial locations. RFAConv introduces Receptive-Field Attention (RFA), which assigns attention weights to different receptive fields for more context-aware feature extraction. This approach is beneficial for detecting small objects like blueberries by focusing on locally relevant receptive fields, making it more effective at capturing small-object patterns.
In this work, integrating RFAConv into the C2f module of YOLOv8 is proposed, as shown in
Figure 2: the conventional bottleneck consists of two convolutions with a residual connection and fusion (concat) [
25,
26,
27], and the convolutions are replaced by the RFAConv module.
3.2. Small-Target Detection Layer
The blueberry dataset used in this paper includes scenes with long distances and severe branch and leaf occlusion, with a large number of small-sized blueberry fruits. The feature maps at the lower pyramid levels, P1 and P2, of the backbone network contain rich information about small targets; however, this information has not been fully utilized. To improve on this point, a small-target detection layer is added in this paper. The proportion of small targets in the image is very small, so when detecting, the model needs a higher spatial resolution to capture the features of small targets; that is, a 160 × 160 feature map detection layer needs adding to the original network to detect small blueberry targets larger than 4 × 4 pixels, thereby improving the detection capability for small blueberry targets at long distances and in severe occlusion scenes. The structure diagram is shown as a dashed box in
Figure 1.
3.3. Four-Head ASFF Detector
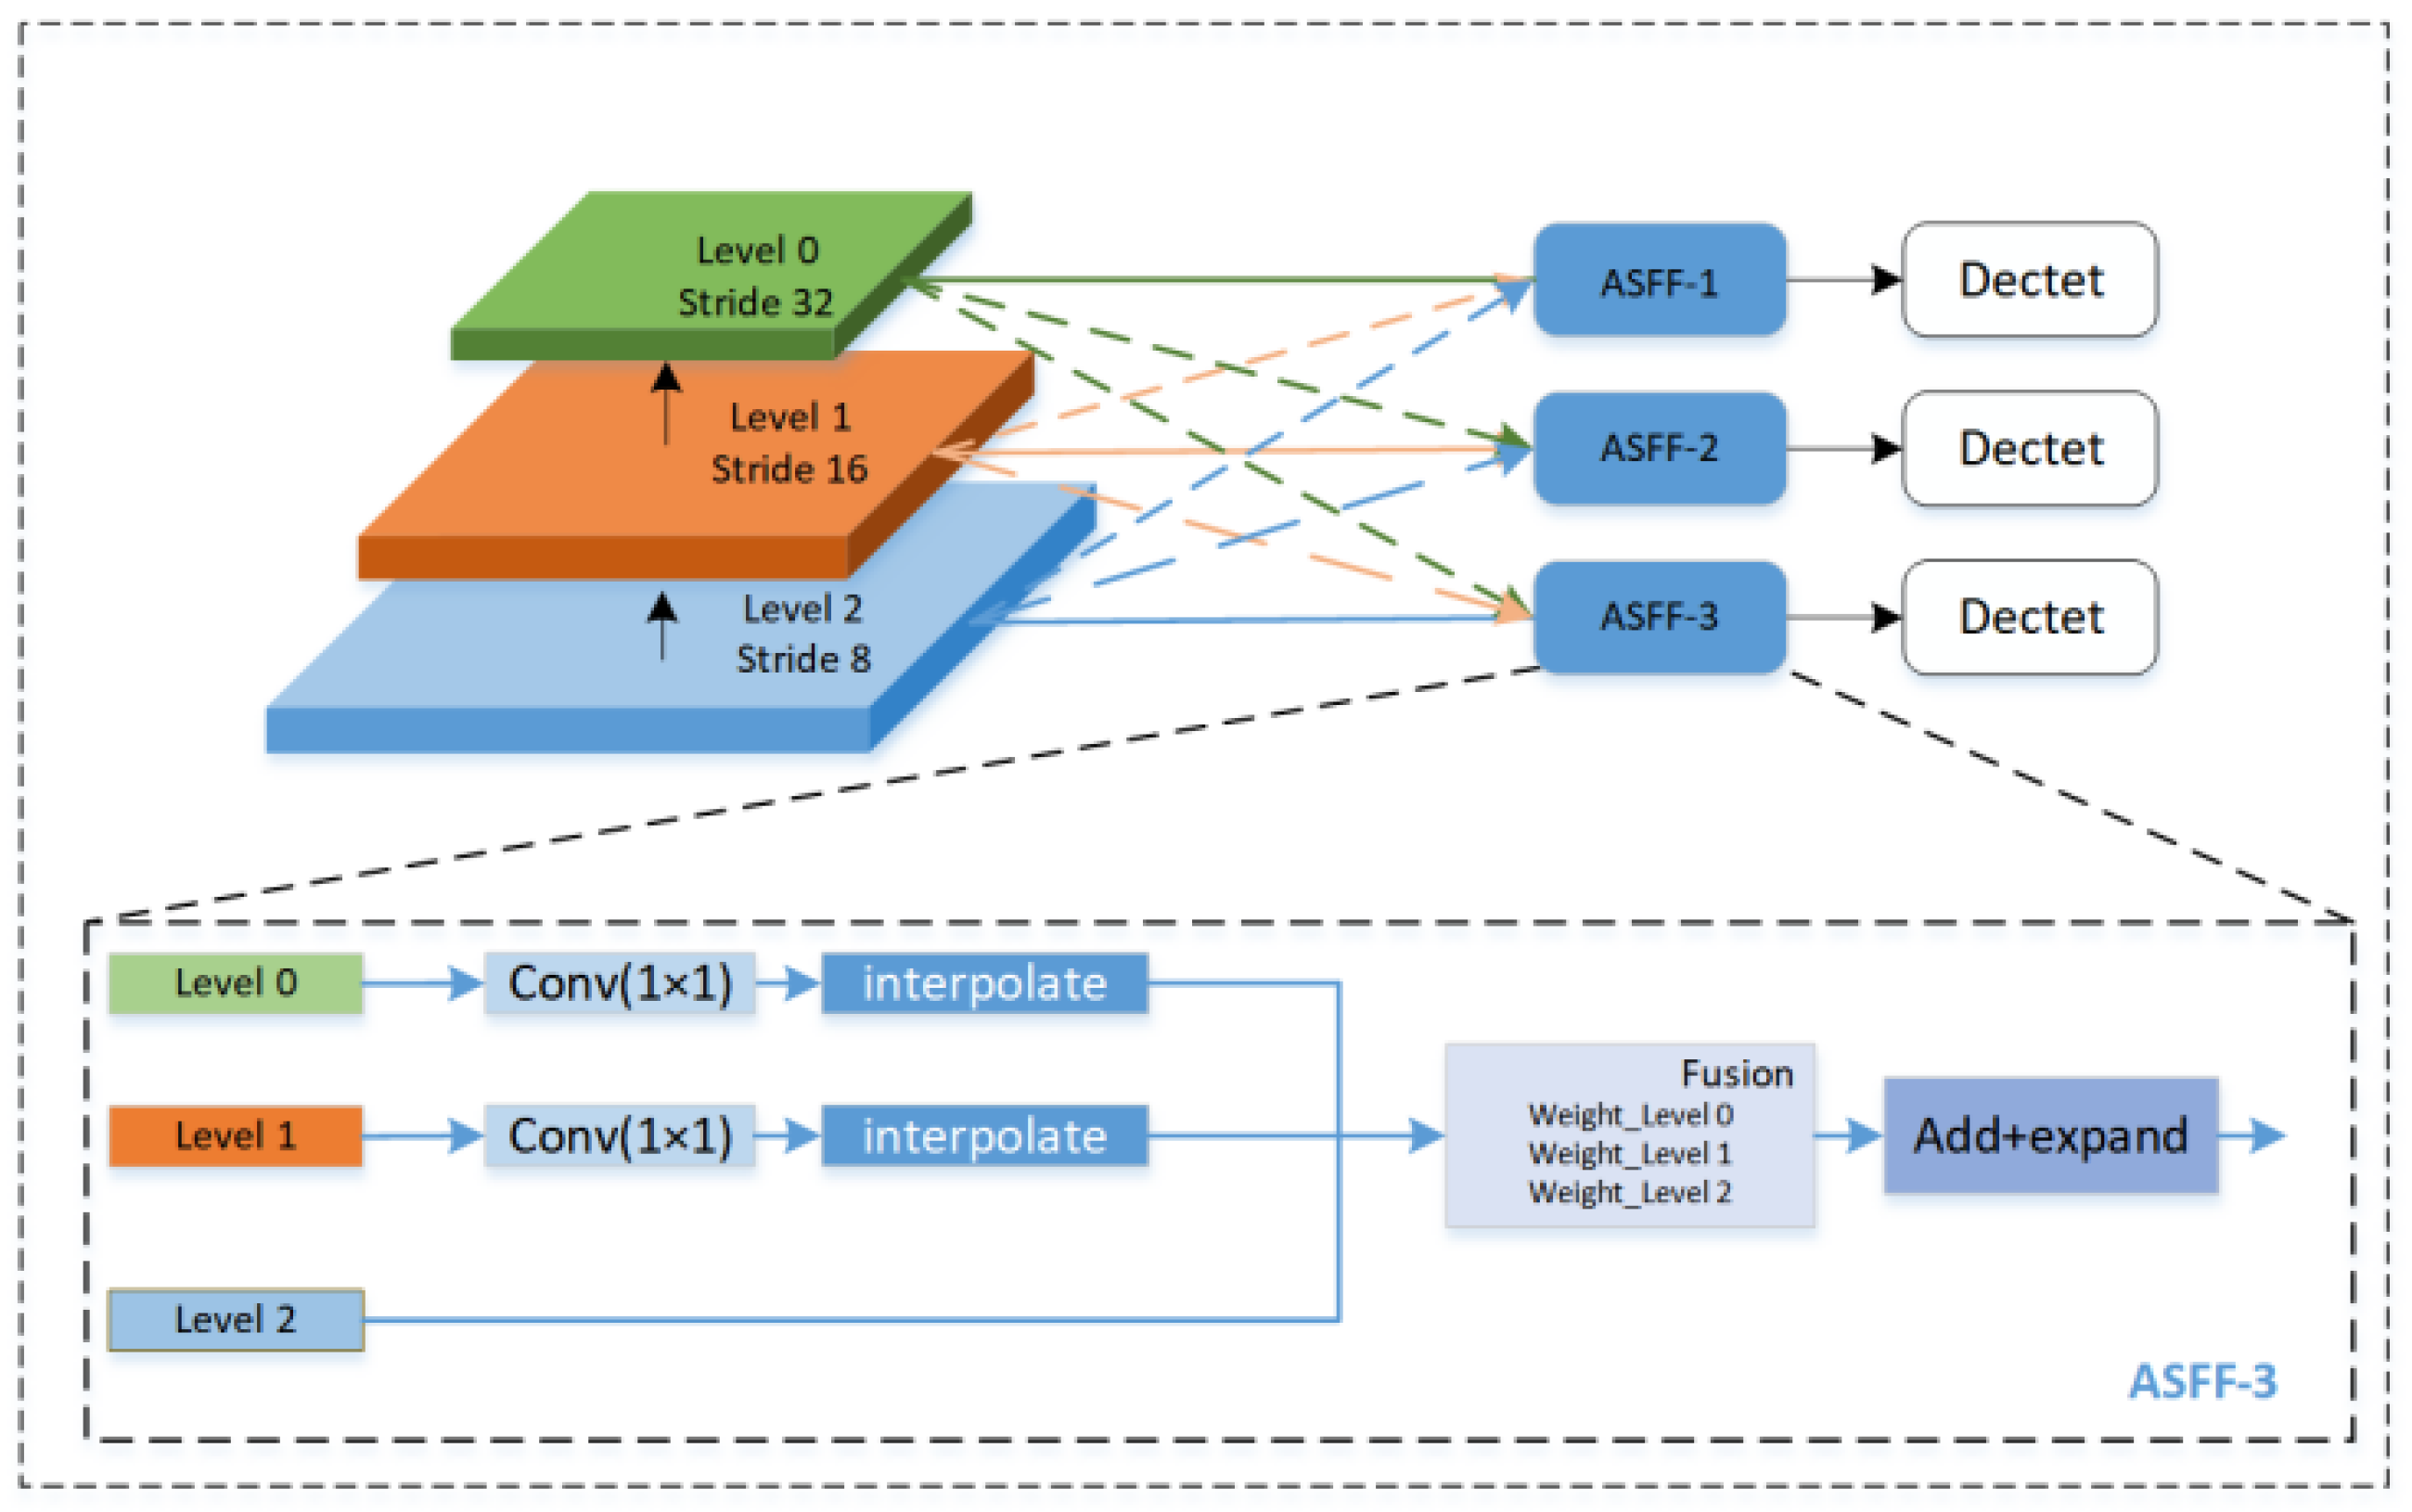
Adaptive spatial feature fusion (ASFF) reweighs feature maps from different pyramid levels and performs fusion using learned control parameters. As usual, this process is differentiable and can be optimized through back-propagation to improve the model’s detection performance [
22]. The ASFF structure diagram is shown in
Figure 3.
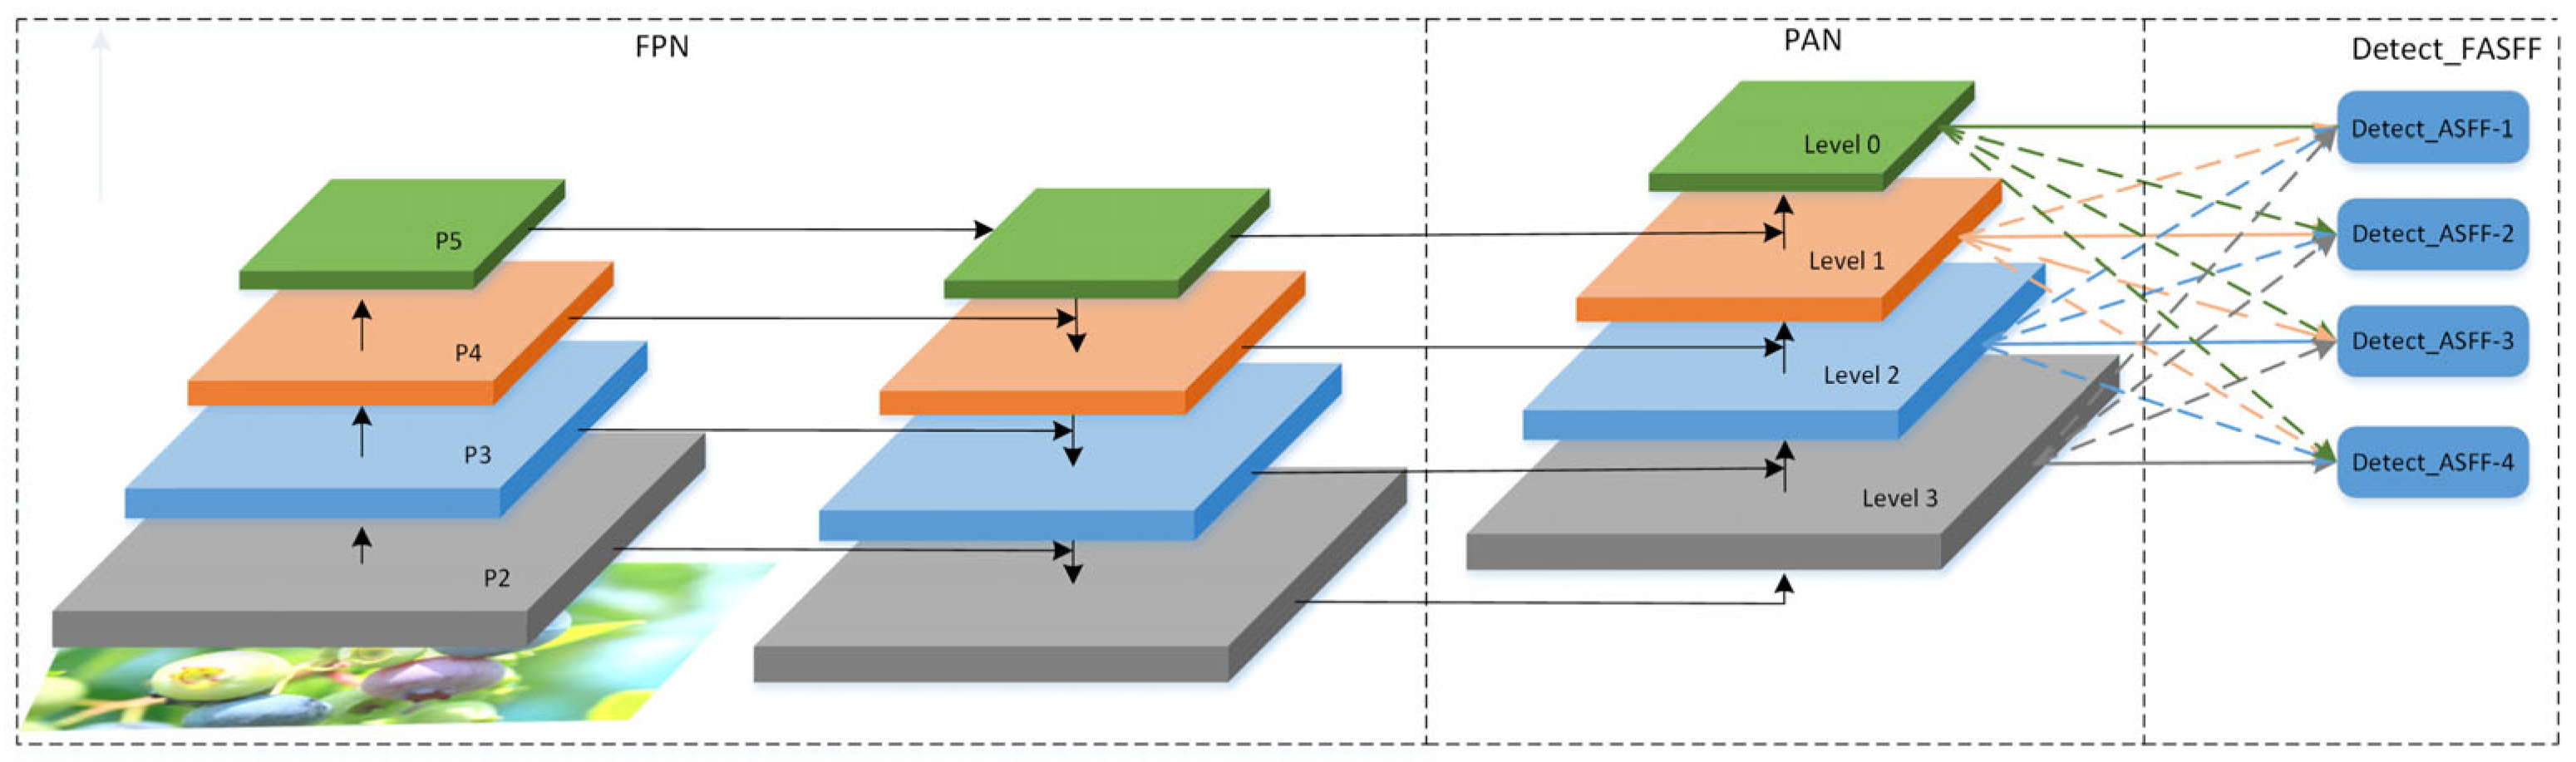
The PAN-FPN structure in YOLOv8 can extract information from multiple scales, but its feature fusion process is fixed and lacks flexibility. Feature maps of different resolutions are fused in a fixed weighted manner, and the best fusion strategy cannot be adaptively selected according to the characteristics of the target. This fixed fusion method may lead to feature loss and feature inconsistency problems when detecting very small targets like blueberries. To optimize feature fusion, improve detection accuracy, and reduce the missed detection rate and false detection rate in complex environments, this paper proposes a four-head adaptive spatial feature fusion detection head (Detect-FASFF) based on ASFF. The original equations were extended to fuse four levels, with the structure shown in
Figure 4 and feature calculation shown in Equations (1) and (2).
Here, xijs→l represents a feature map that is rescaled from the size of a layer s to the size of a layer l. Then, α, β, γ, and δ are weight parameters that indicate the importance of the feature map of each layer, the values of which are learned during training through gradient descent to effectively adjust the contribution of each layer’s feature map to the final output, and αlij, βlij, γlij, and δlij are the values of α, β, γ, and δ at position (i, j), respectively.
3.4. Focaler-CIoU Loss Function
The loss
LCIoU of the original network bounding box of YOLOv8 is calculated using the CIoU (complete intersection over union loss) formula, as shown in Equations (3) to (5).
Here, v is a measure of the consistency of the aspect ratio of the predicted box and the true box, and α is a weight function that depends on the difference in the aspect ratio of the predicted box and the true box. wg and hg are the width and height of the true box, respectively. In the detection of small blueberry objects, due to the small size of the object, the CIoU loss function cannot accurately reflect the actual situation, resulting in unsatisfactory optimization results. The scale of objects varies greatly, especially for small-object detection, which strongly depends on the camera view and distance. CIoU has limited performance in dealing with an uneven sample distribution and is prone to overfitting for easy-to-classify samples while ignoring difficult-to-classify samples. In complex tasks, the convergence speed of CIoU is still slow, and it does not dynamically adjust sample features, resulting in an overall unbalanced performance and certain limitations.
To address these issues, we combine the CIoU loss function with the Focaler-IoU loss and introduce Focaler-CIoU. This strengthens the bounding box regression by focusing on the sample distribution to solve the problem of sample imbalance. Our method reconstructs the IoU in the loss function, making the model more focused on positive samples that are difficult to classify, thereby improving detection accuracy. The formula for LFocaler-CIoU is shown in (6) to (7).
LFocaler-CIoU is the improved loss, and
d and
u are the lower and upper thresholds, respectively, where
d,
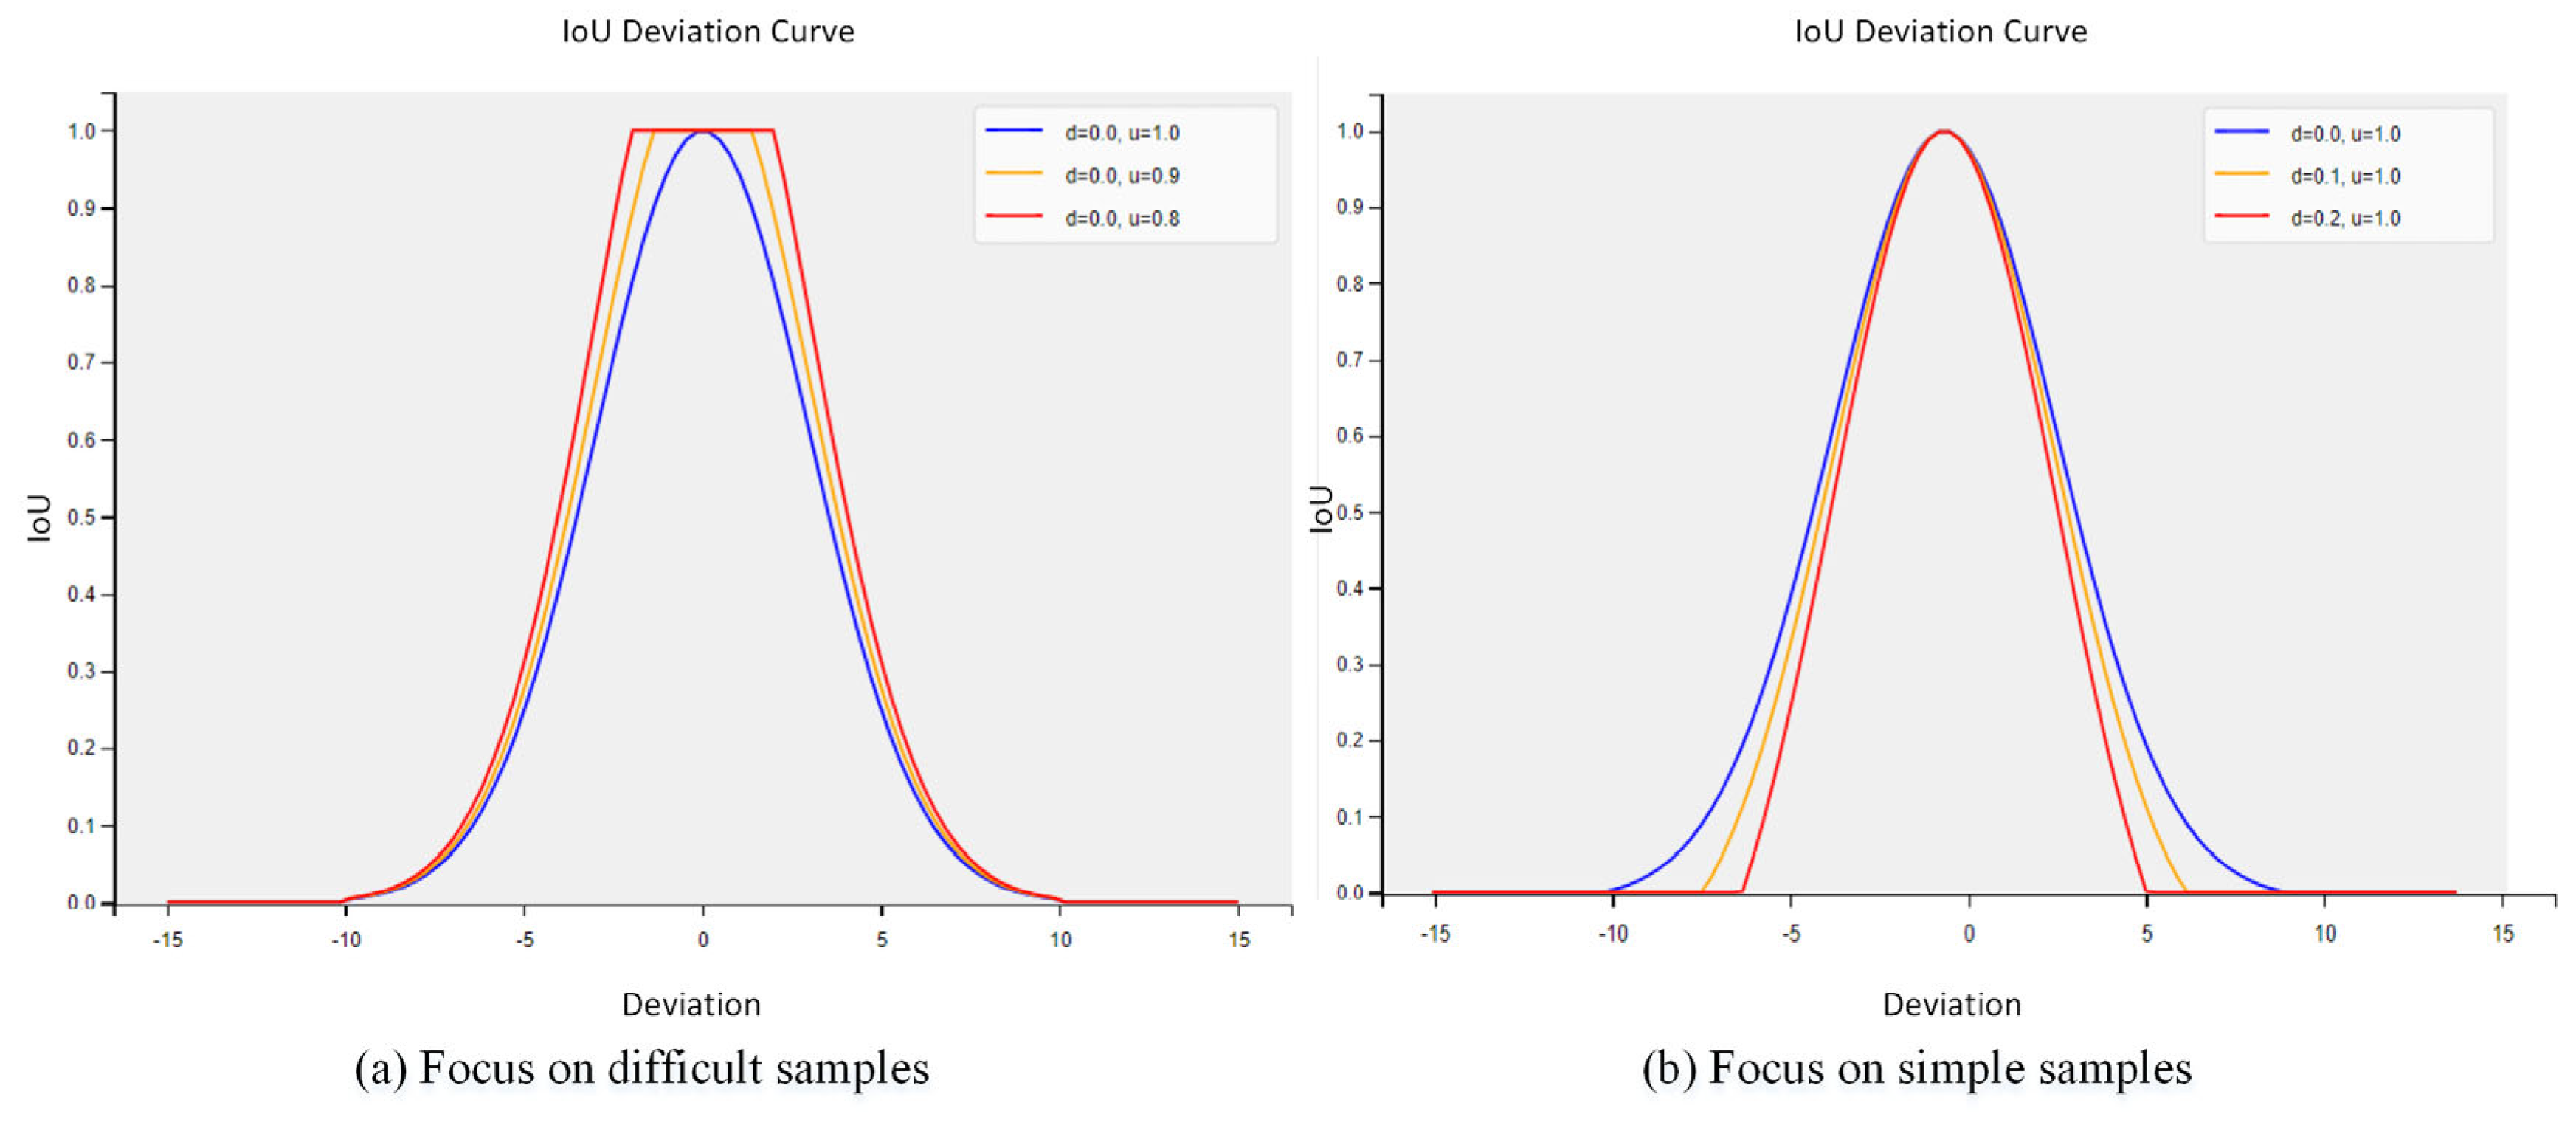
u ∈ [0, 1]. Focaler-CIoU optimizes the loss function by using the intersection over union (IoU) value, thereby increasing the model’s sensitivity to samples with medium overlap, enabling it to learn the features of these samples more effectively. By adjusting the thresholds, the IoU can focus on different regression samples rather than just the simplest or most difficult ones, as shown in
Figure 5.
Figure 6a,b show the linear mapping curves of Focaler-CIoU for difficult samples and simple samples, respectively. A loss function designed in this way can effectively distinguish samples with different IoU values, allowing the model to learn more selectively. Specifically, samples with an extremely low IoU will be ignored to prevent the model from overly focusing on negative samples that are still too difficult to learn. For samples with an IoU in the medium range, the loss function is more sensitive to changes in the IoU, which leads to the model performing better on these samples. For samples with a very high IoU,
IoUfocaler is fixed to 1 to avoid over optimization of the model on these already well performing samples, thereby saving computational resources.
4. Experiment and Result Analysis
All experiments in this section were conducted under the same conditions to ensure fairness in the results. Specifically, all experiments used the same image input size, augmentation methods, training schedule, and parameters.
4.1. Experimental Environment and Training Parameter Settings
The following hardware configuration was used for training: Intel Xeon(R) Silver 4210 CPU @ 2.20 GHz × 40, NVIDIA GeForce RTX 2080 Ti. The software environment was Ubuntu 18.04.6 LTS, Python version 3.8, Pytorch 2.3.0 framework, GPU acceleration library is Cuda 12.1 version, and the training parameters are listed in
Table 2.
4.2. Image Acquisition
The image dataset used in this study was assembled by two methods: (1) collection from the internet by a web-crawler and (2) the Roboflow Universe platform. The number of images collected through the network was 661, and the number of images from the Roboflow Universe platform was 614. Thus, the total number of original images was 1275. The image resolution varied between 1480 × 1974 and 3883 × 5184 pixels.
The images include different lighting conditions (strong light, normal light, insufficient light), natural environmental factors (such as branch and leaf occlusion, fruit stacking), and different shooting distances (close-up and distant). These images include three levels of blueberry fruit maturity: ripe, semi-ripe, and unripe according to maturity.
Table 3 provides representative close-up images of the maturity levels, while
Figure 6 presents representative images from the dataset.
To ensure the effectiveness of model training, this study used the LabelImg tool to annotate the collected images, generating XML annotation files in the Pascal VOC format. The data was divided into training and validation test datasets using a split ratio of 70%:10%:20%. To improve generalization and to reduce model overfitting, the dataset was augmented by common techniques such as flipping, scaling, translation, rotation, and the addition of noise, along with random combinations of these methods [
28]. To minimize computational effort, data augmentation was pre-computed resulting in a total of 4500 augmented images. As shown in
Figure 7, the visualization results of the dataset illustrate several aspects: the top left corner of the figure shows the number of labels for each category in the dataset, and the top right-hand corner of the figure presents the distribution of bounding boxes. The bottom left-hand corner of the figure explains the distribution of the center points, and the bottom right-hand corner of the figure displays the size distribution of labels in the dataset. It can be seen from the figure that most of the targets are concentrated in the range of 0–0.2, indicating that small blueberry targets account for a large proportion of the entire dataset.
4.3. Effect of the Four-Head ASFF Detector
First, the original three-head ASFF detector (Detect-ASFF) was compared with the four-head ASFF detector (Detect-FASFF), which extends to the P2 feature layer for small objects. To this end, the conventional YOLOv8n was used, and both the three-head detector and the four-head version were inserted into the model. All other parameters were kept unchanged, and the model was evaluated on the blueberry maturity dataset.
The experimental results are shown in
Table 4. Although the use of the Detect-FASFF model slightly increases the computational complexity and memory requirements, its precision, recall rate, and average precision improved by 1.7%, 4.2%, and 4.0%, respectively, compared to the baseline model. Thus, the overall detection quality of the model was significantly improved. Although the frame rate (FPS) decreased, this setup can still meet the requirements of practical applications.
Figure 8 shows the results on a representative image. Detect-ASFF and Detect-FASFF have fewer missed detections, especially when the blueberries are smaller or severely occluded.
4.4. Ablation Experiments
To verify the improvements in the YOLOv8n algorithm proposed in this paper, five ablation experiments were conducted on the blueberry maturity dataset to assess the effectiveness of each modification. The results of the ablation experiments are compared to the YOLOv8n reference in
Table 5.
As shown in
Table 4, in Experiment 1, replacing the C2f module in the backbone of the YOLOv8n network with C2-RFAConv enhanced the model’s attention to local information when processing features. However, this comes at the cost of partially neglecting global features, leading to a decrease in recall. Despite this, the model’s precision and mean average precision (mAP@0.5) increased by 2.2% and 0.7%, respectively, with only a slight increase of 0.1 MB in model size.
In Experiment 2, the introduction of Detect-FASFF adds additional convolutional layers and parameters, enabling the model to learn and compute adaptive weights for feature fusion. As a result, the model size increased by 2.6 MB. However, compared to Experiment Ref, the precision, recall, and mAP@0.5 improved by 1.7%, 4.2%, and 4%, respectively, significantly enhancing the model’s detection performance.
Experiment 3 incorporated Focaler-CIoU, further improving the model’s precision, recall, and mAP@0.5, demonstrating that Focaler-CIoU enhances the model’s fitting capability. In Experiment 4, fusing C2f-RFAConv and Detect-FASFF lead to an overall performance improvement compared to Experiments 1 and 2. In Experiment 5, the fusion of Detect-FASFF and Focaler-CIoU further improved the model’s detection performance compared to Experiment 2.
Finally, Experiment 6 evaluated the combined effect of all three proposed enhancements of the baseline network, resulting in the best-performing model. Compared to the baseline model, the improved model achieved increases of 2.8% in precision, 4% in recall, and 4.5% in mAP@0.5, while the model size only grew by 2.7 MB. Additionally, the frame rate (FPS) reached 80 frames per second, fully meeting real-time detection requirements.
Furthermore, as illustrated in
Figure 9, the P-R curve of the final improved model is closer to the upper right corner of the coordinate axis and exhibits a larger area under the curve (AUC) compared to the baseline model. This indicates better overall performance across different thresholds.
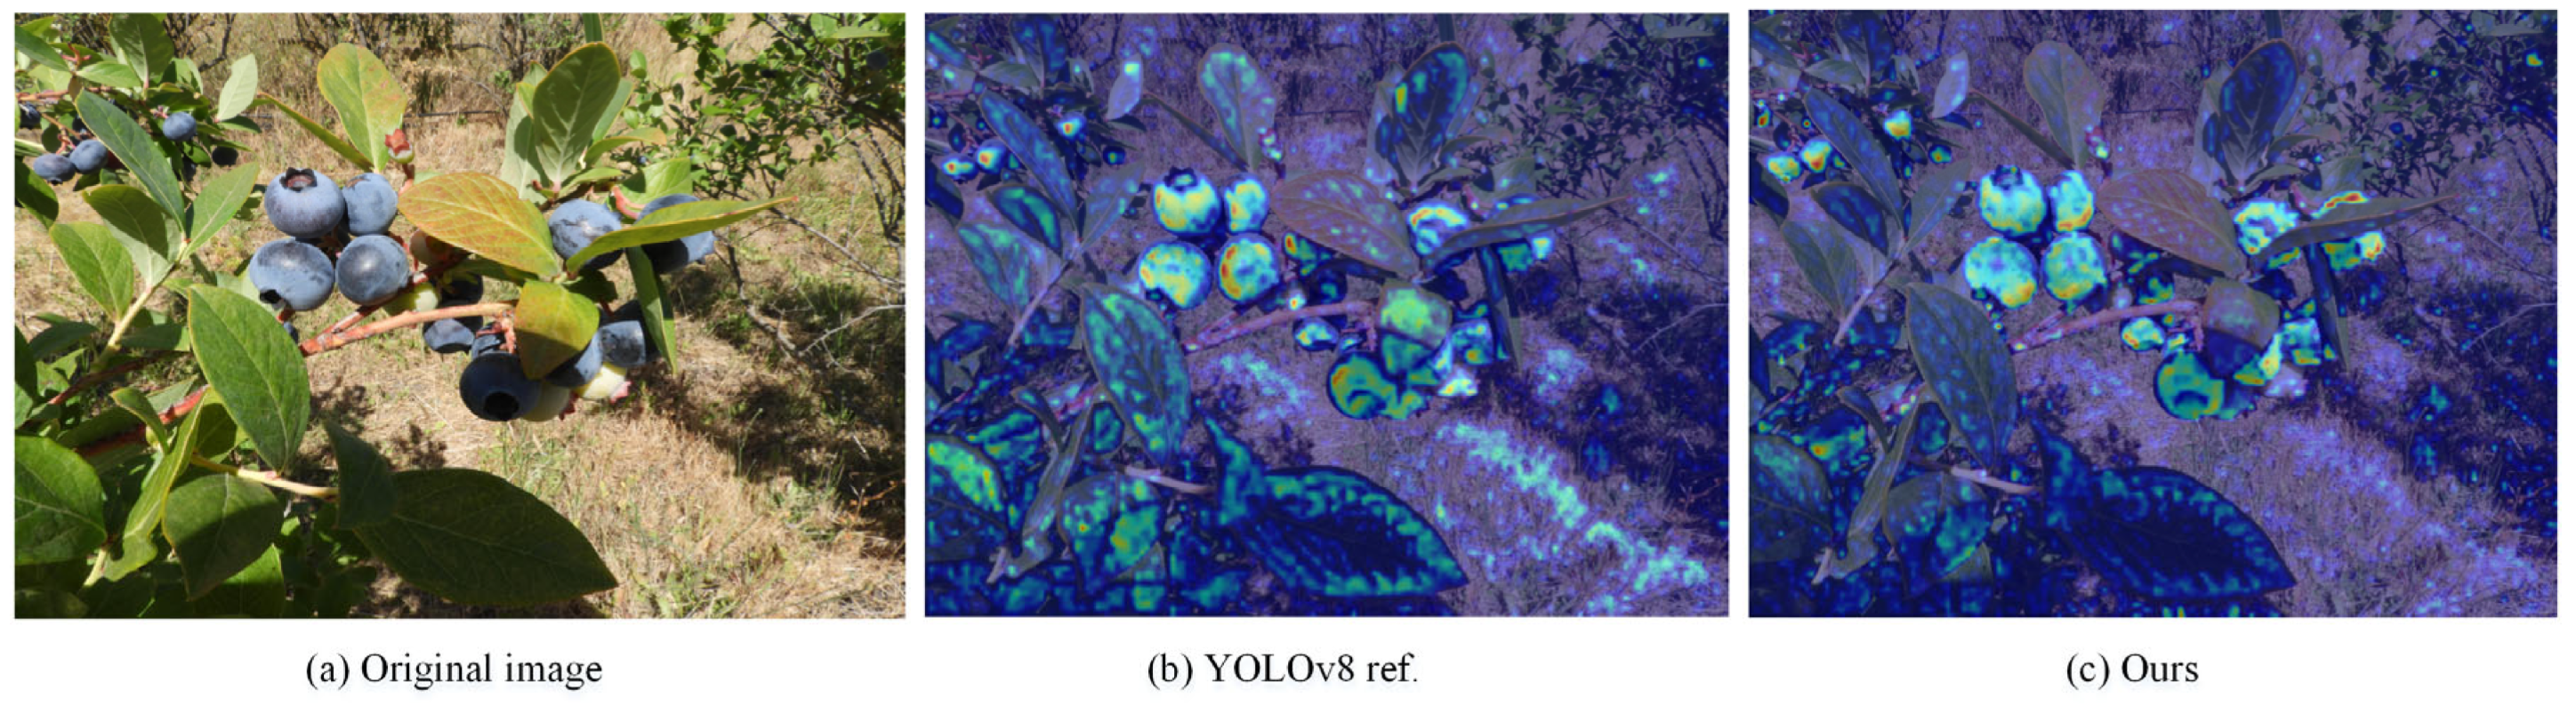
In addition, to further demonstrate the model’s sensitivity to blueberry targets of different sizes, an image containing blueberry targets of various sizes was selected for testing. The results are shown in
Figure 10. Through the heatmap, it can be intuitively seen that the model proposed in this paper can better focus on blueberry targets of different sizes at close and far distances while effectively suppressing environmental background noise. On the other hand, the YOLOv8n model shows insufficient attention to certain sizes of blueberries in the detection process, and some environmental background noise is present.
4.5. Comparison of Other Backbone Networks
In this experiment, YOLOv8n was used as the baseline network, replacing mainstream feature extraction backbones such as MobileNetV3, GhostNetV2, and ShuffleNet. To ensure a fair comparison, all settings except for the backbone network remained unchanged while evaluating the training performance on the blueberry dataset.
As shown in
Table 6, our backbone network incorporating the C2f-RFAConv improvement method outperformed ShuffleNetV1, ShuffleNetV2, and GhostNetV2, achieving an increase in mAP@0.5 of 4.3%, 2.4%, and 2.5%, respectively. While the proposed backbone achieved the same mAP@0.5 improvement as MobileNetV3, it reduced the number of parameters by 2.2 M, the computational complexity by 2.2 G, and the model size by 5 MB. These reductions make the model more efficient and better suited for real-world deployment.
4.6. Comparison of Different Target Detection Models
To verify the proposed algorithm in blueberry maturity detection, the same dataset and experimental conditions were used to compare it with mainstream models such as YOLOv3-tiny, YOLOv5n, YOLOv6, YOLOv7-tiny, and YOLOv9c. The experimental results are shown in
Table 7.
According to
Table 6, the proposed algorithm outperformed other models in multiple key performance indicators, especially in precision, recall, and average precision (mAP@0.5). Among them, the mAP@0.5 is improved by 13.8%, 5.3%, 7.5%, 2.3%, 6.0%, and 0.5% compared with YOLOv3-tiny, YOLOv5n, YOLOv6n, YOLOv6s, YOLOv7-tiny, and YOLOv9c, respectively. In addition, although the number of parameters and the amount of calculation have increased compared to the older models YOLOv5n and YOLOv6n, the proposed model has excellent performance in terms of performance indicators such as precision, recall, and mAP@0.5. By improving the performance and resource efficiency of the proposed model, an ideal balance is achieved, which significantly improves the accuracy and reliability of the blueberry maturity detection task.
4.7. Visual Comparison
To visualize the results, two representative cases are compared in
Figure 9 and
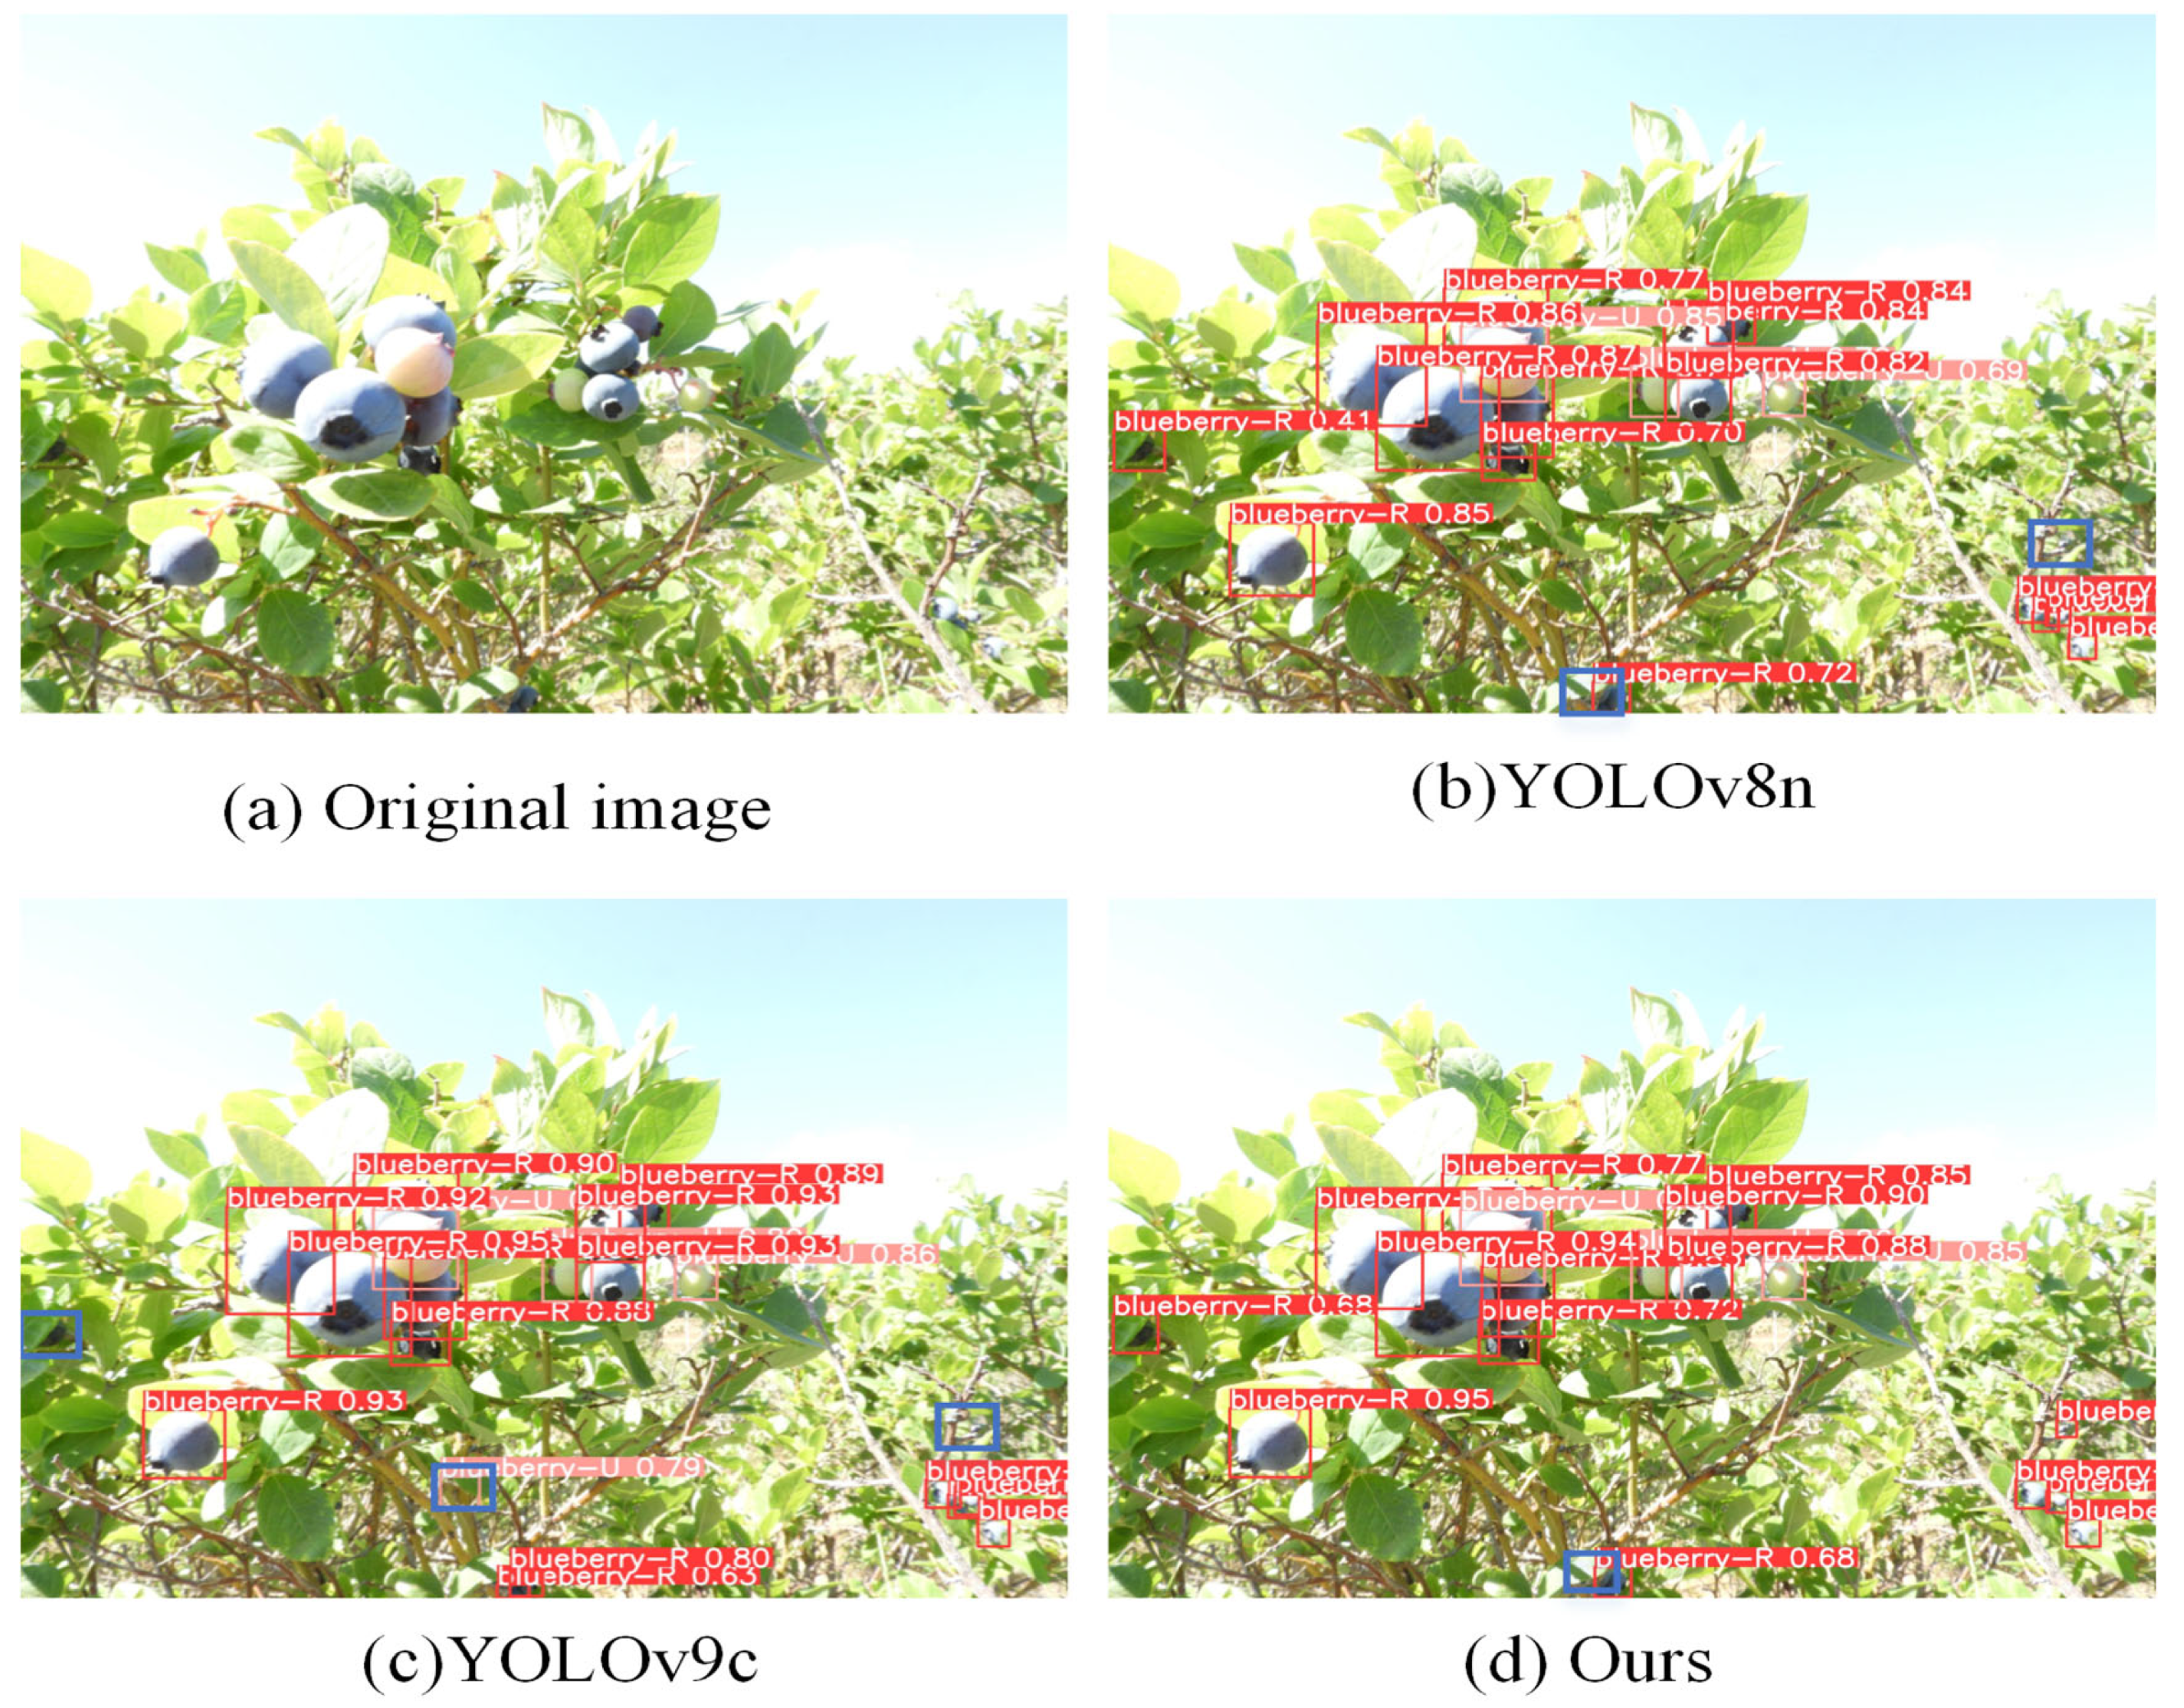
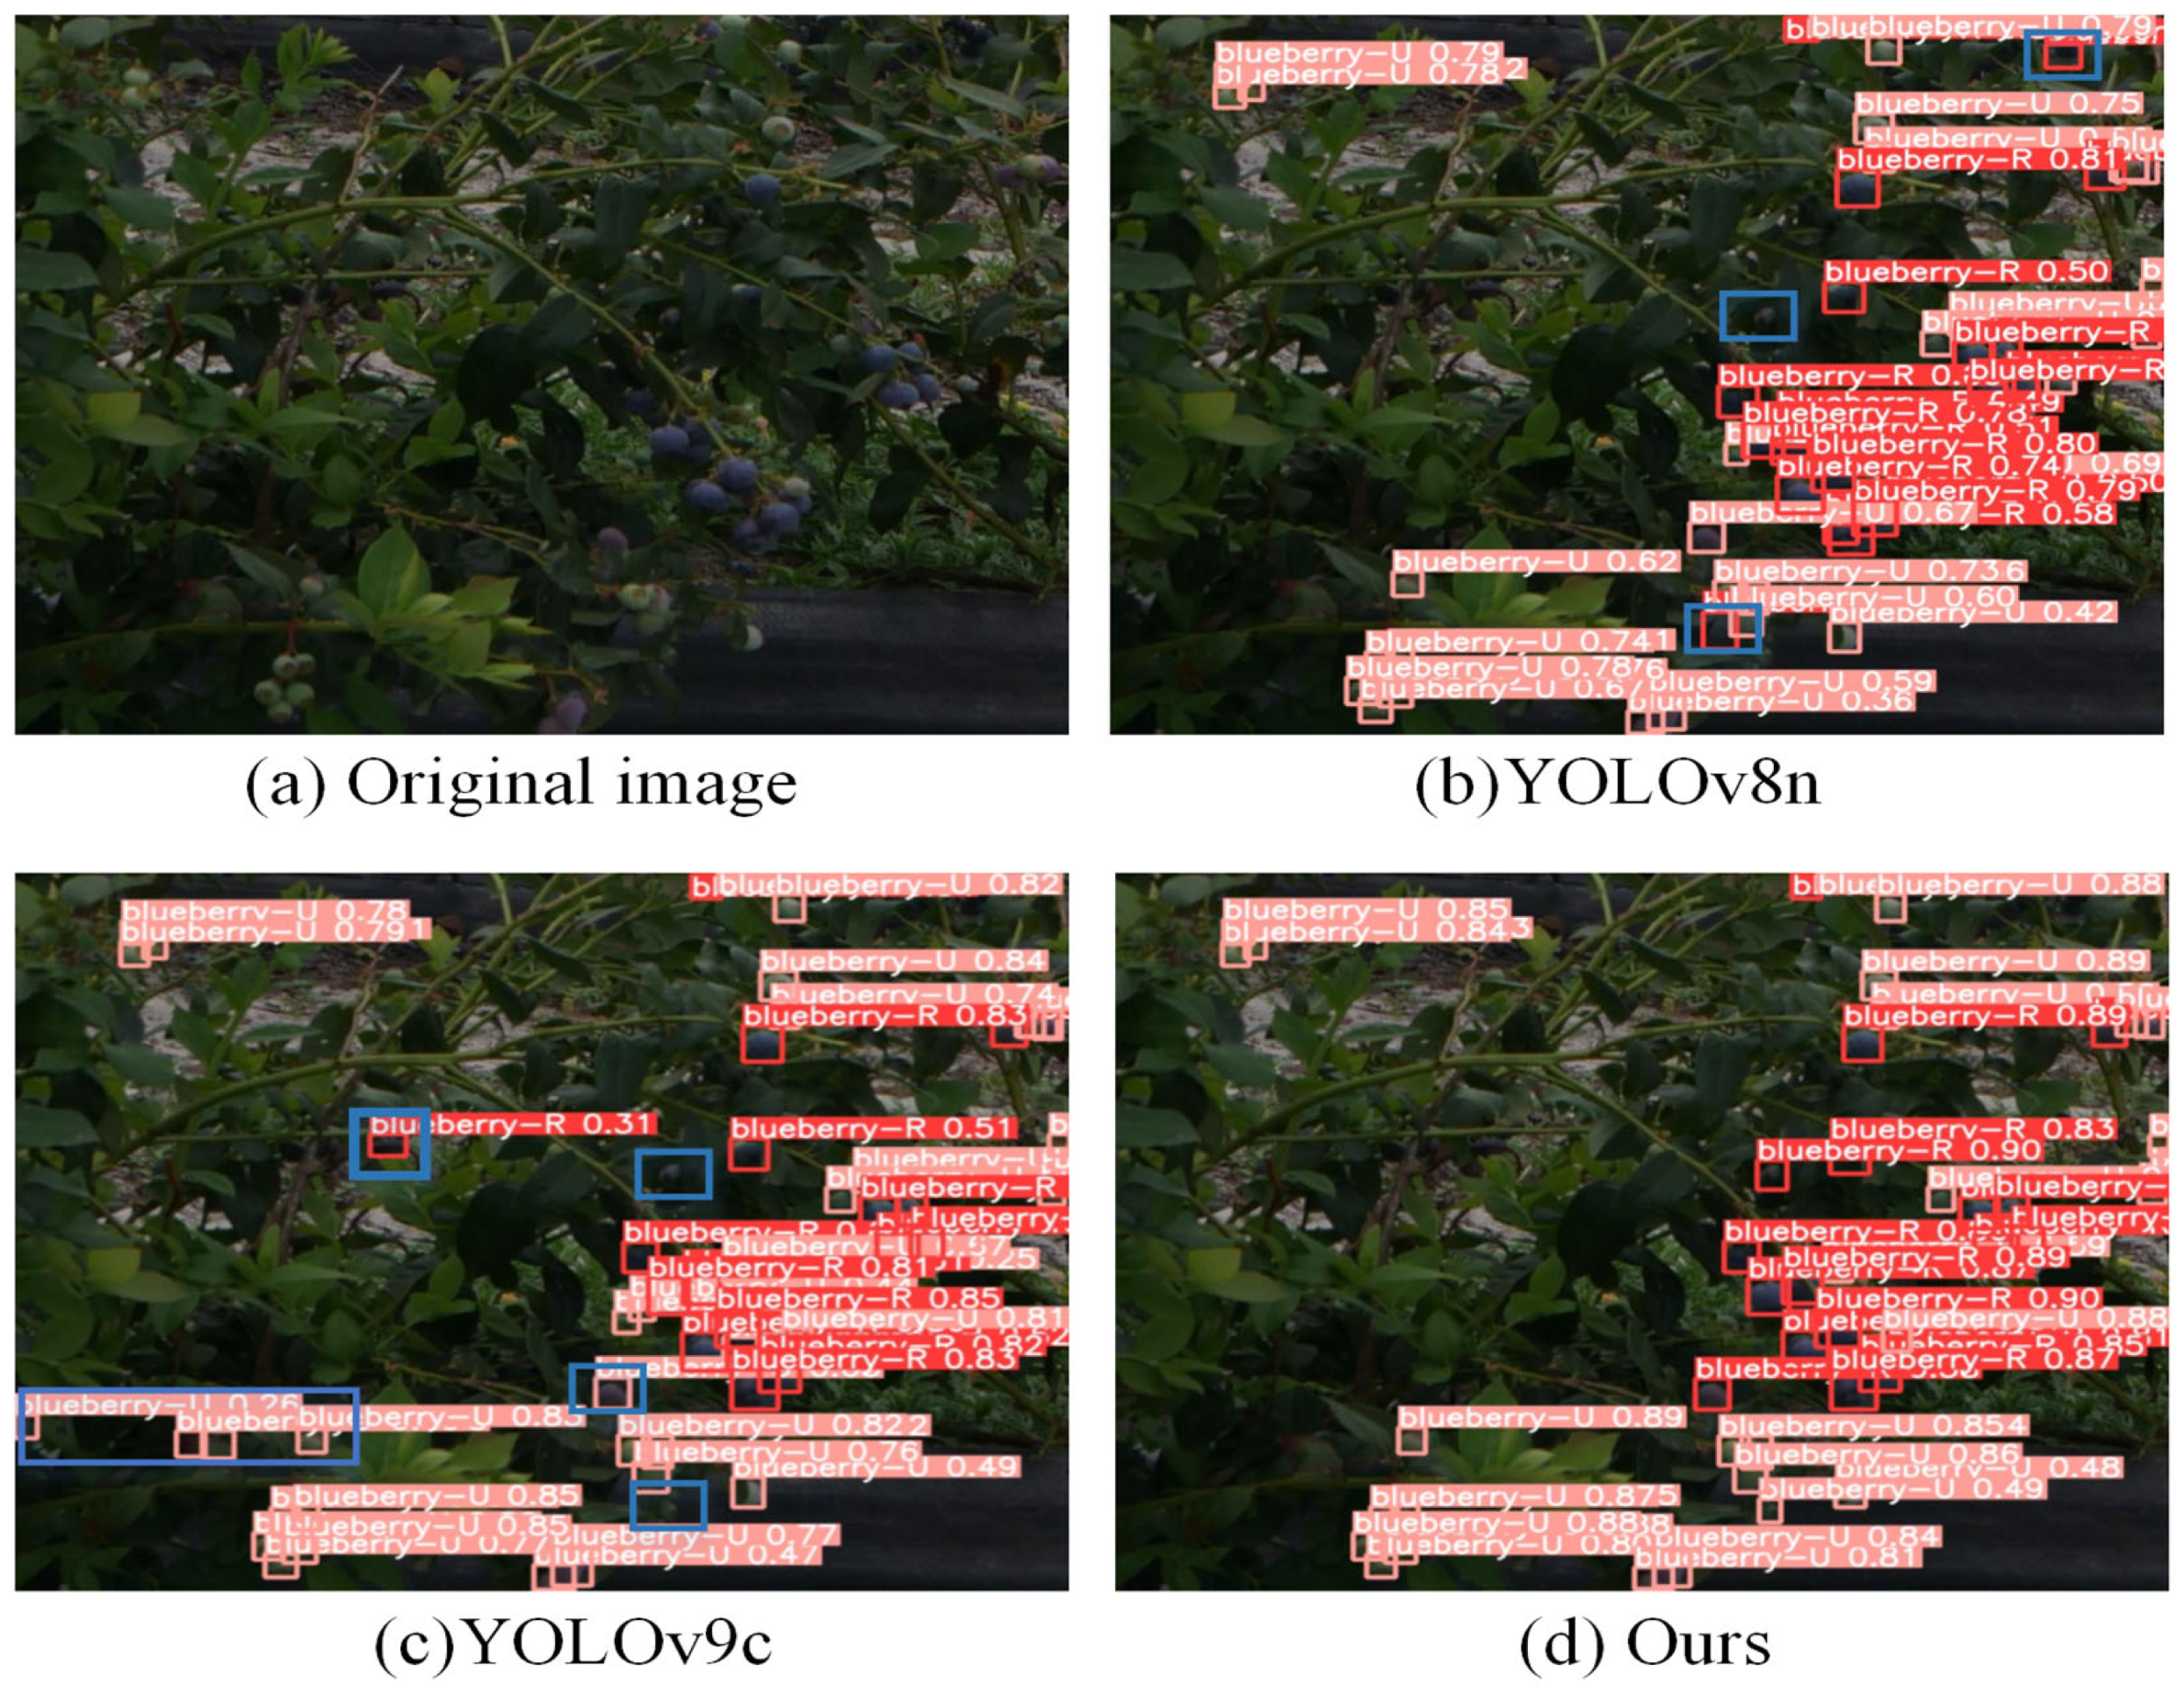
Figure 10. Red boxes indicate ripe blueberries, orange boxes indicate semi-ripe blueberries, and pink boxes indicate unripe blueberries. Moreover, blue boxes indicate missed or false detections.
4.7.1. Strong Light, Close Range, and Occlusion
As shown in
Figure 11b,c, in strong light conditions, YOLOv8n and YOLOv9c struggle to detect small blueberry targets at long distances, under intense lighting, and when heavily obstructed by branches and leaves, resulting in missed and false detections. While YOLOv9c demonstrates higher confidence levels, it still produces some missed and false detections. In contrast, the proposed model exhibits lower missed and false detection rates, achieving the best detection performance and higher confidence levels.
4.7.2. Weak Light, Long Distance, and Occlusion
As shown in
Figure 12b,c, under conditions of insufficient light, long distances, and severe occlusion, YOLOv8n and YOLOv9c frequently misidentify darker branches and leaves as ripe or unripe blueberries, resulting in high missed and false detection rates. In contrast, the proposed model demonstrates superior detection performance in challenging environments, with overall higher confidence levels.
4.8. Model Robustness Testing Under Different Conditions
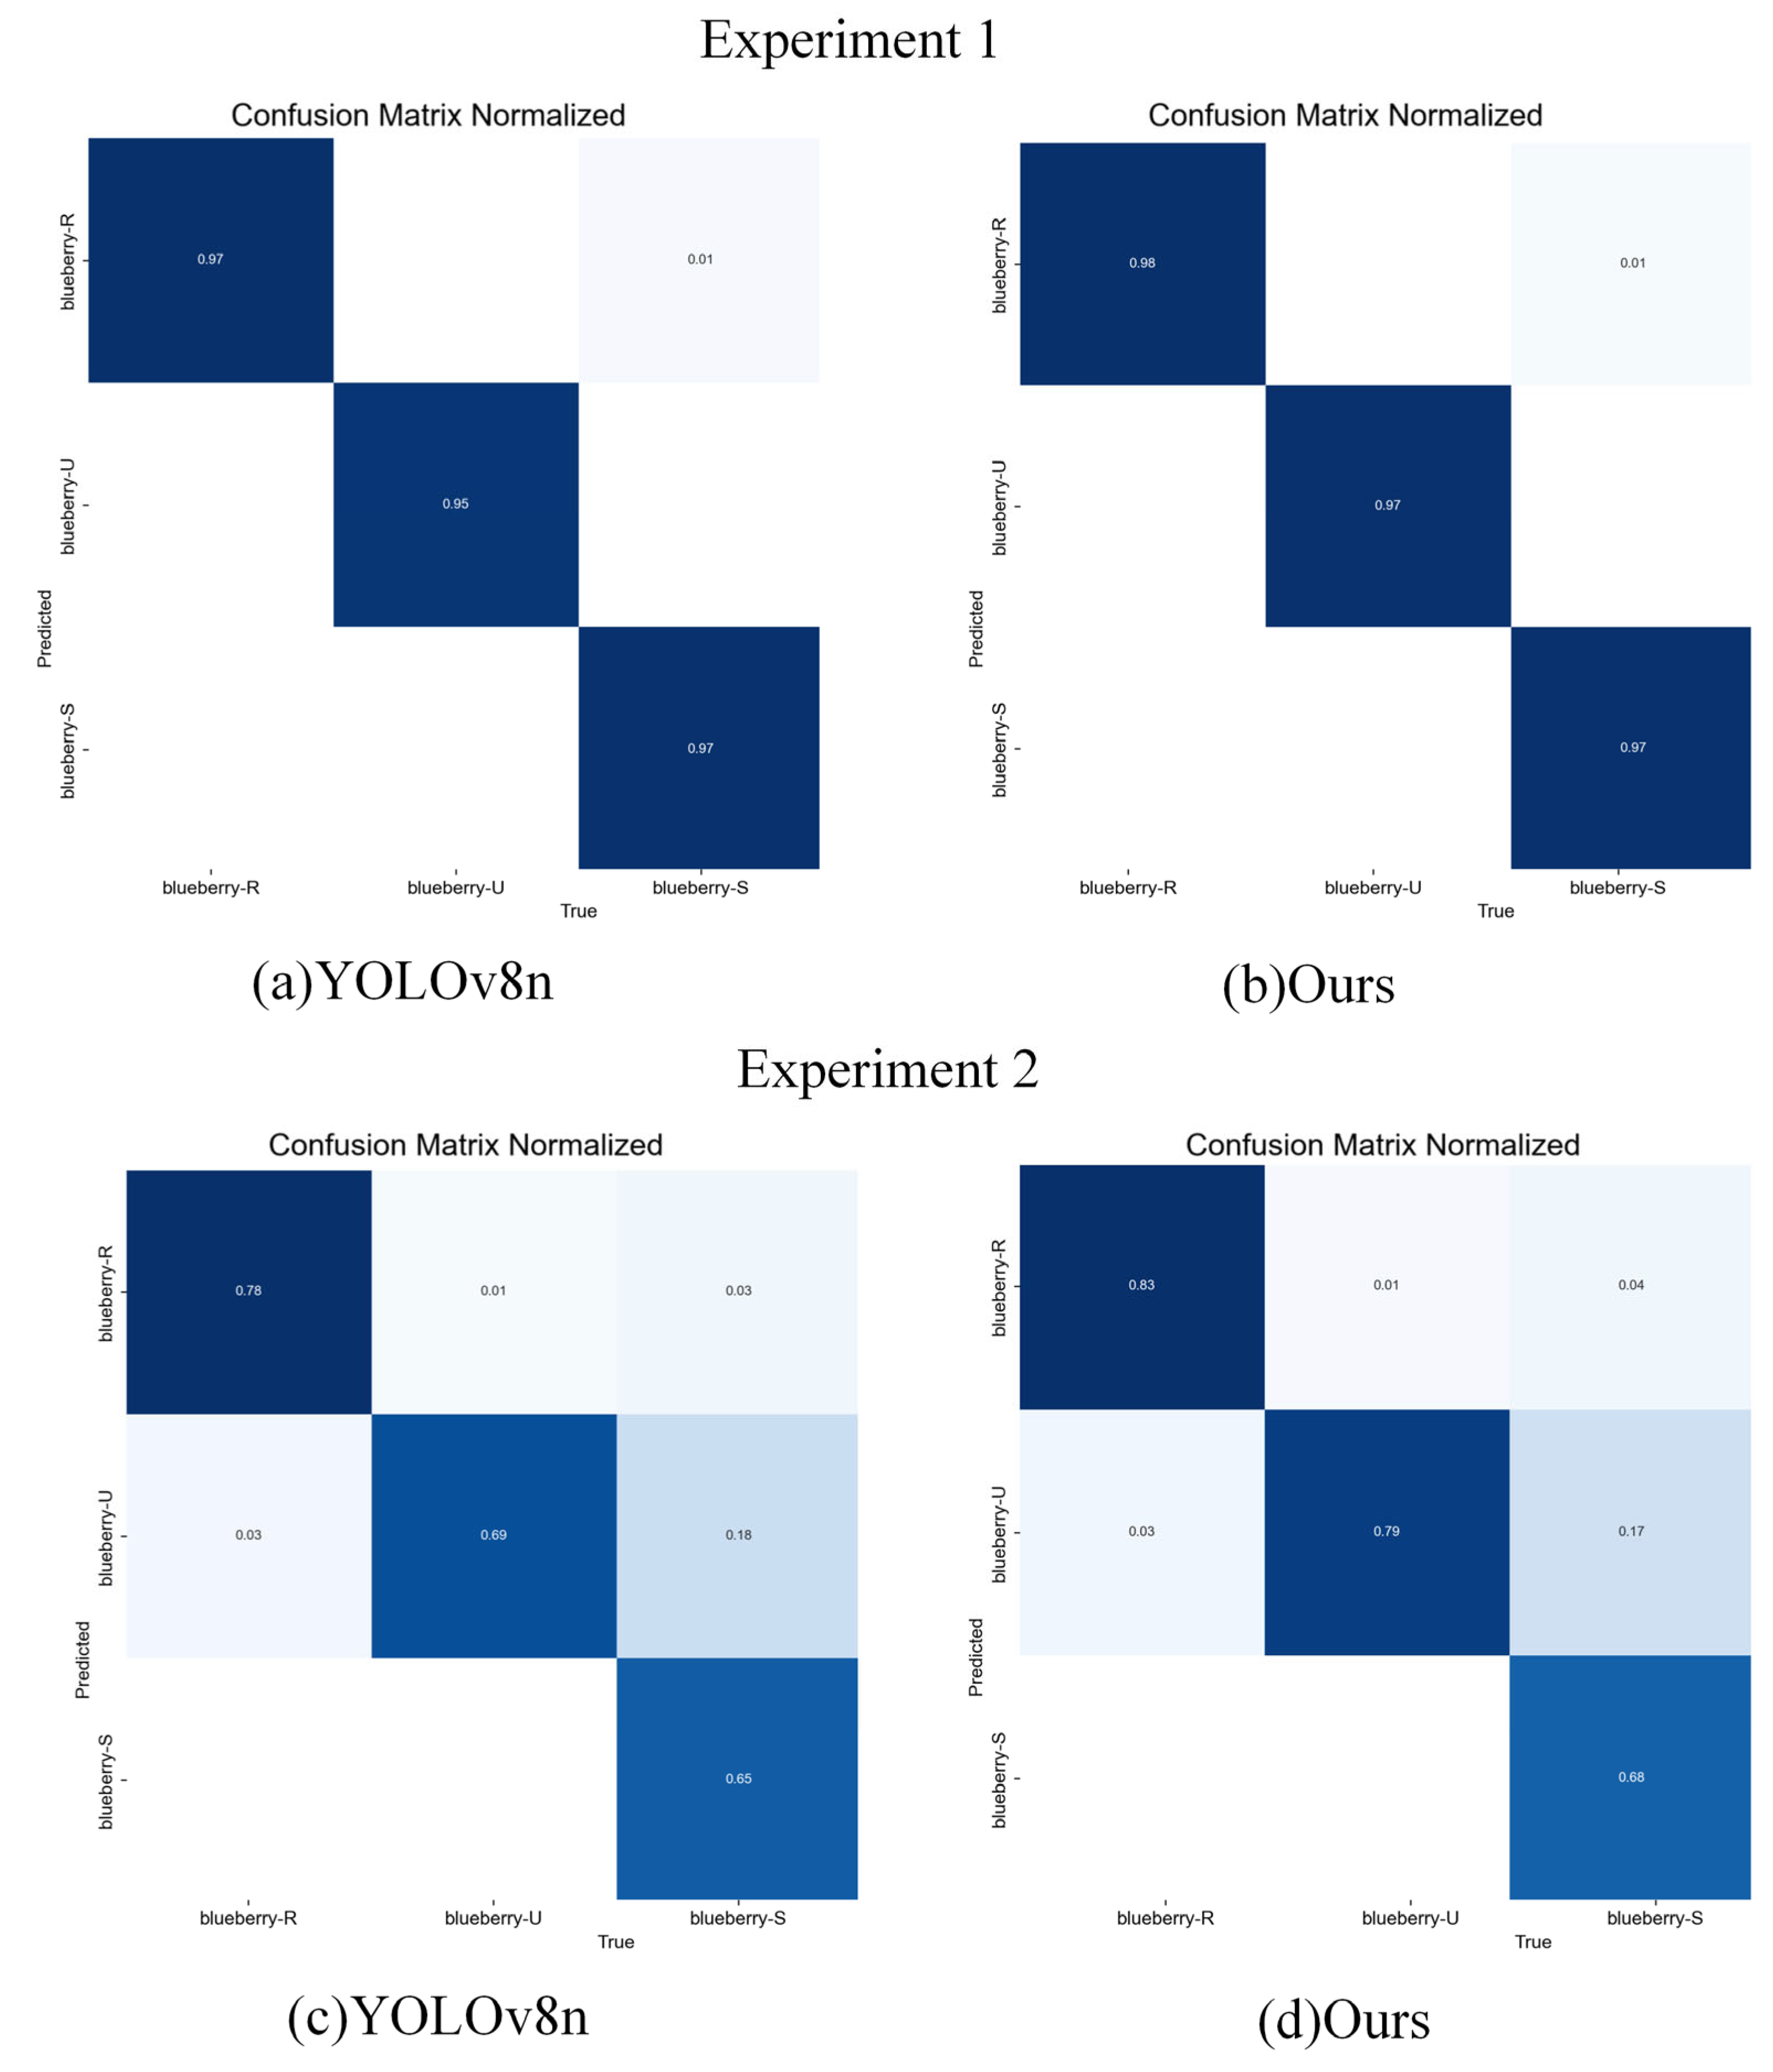
To verify the robustness of the model under varying lighting, occlusion, and distance conditions, the 917 test images in the dataset were divided into two experimental groups based on the presence of environmental disturbances. The test images in Experiment 1 mainly include blueberries under close distances, no occlusion, and normal lighting conditions. The test images in Experiment 2 mainly include blueberries under conditions with environmental disturbances such as long distances, partial occlusion, strong lighting, and insufficient lighting. Under the same experimental conditions, the performance of the proposed model was compared with that of the YOLOv8n model. The experimental results are shown in
Table 8, and the confusion matrix after testing the models is shown in
Figure 13.
As shown in
Table 8, the model proposed in this paper exhibits significant advantages under environmental disturbance conditions, particularly outperforming YOLOv8n in terms of precision, recall rate, and mAP@0.5. In Experiment 1, under normal environmental conditions, the accuracy of the model proposed is slightly higher than YOLOv8n, with only a small difference in detection performance between the two. However, in Experiment 2, when faced with environmental disturbances, the precision, recall rate, and mAP@0.5 of the model proposed improved by 3%, 5.4%, and 4.6%, respectively, compared to YOLOv8n, significantly enhancing its performance in complex environments. These results indicate that the model proposed exhibits stronger robustness in blueberry detection tasks, better adaptability to environmental changes, and higher stability and accuracy.
As shown in the confusion matrix in
Figure 11, the model proposed outperforms YOLOv8n in both experiments. Although the performance of the two models is similar in Experiment 1, the model proposed has a slight advantage in classification accuracy, especially for blueberry-U. However, in Experiment 2, our model significantly outperforms YOLOv8n, providing more precise classification for all categories (blueberry-R, blueberry-U, blueberry-S) and significantly reducing the misclassification rate for all categories. Overall, the model proposed demonstrates higher stability and accuracy than YOLOv8n in both experiments, especially in more complex classification tasks, and shows stronger model robustness.
5. Conclusions
Based on a review of previous research on fruit detection, a blueberry detection algorithm based on improved YOLOv8n is proposed in this paper, which effectively improves the detection problem for very small objects in complex orchard environments. The improvements mainly include optimizing the feature extraction of the model backbone network, adding a small-target detection layer at pyramid level P2, and improving the detection head and loss function. Specifically, RFAConv is introduced into the backbone network and a C2F-RFAConv module is constructed to enhance the model’s ability to extract target features and capture global information more accurately through the interactive adaptive learning of spatial receptive fields and convolutions. To solve the problem of small-target detection, a detection layer specifically for small targets is added to the neck network, which significantly improved the detection accuracy of distant small targets. The head network adopts a four-head detector (Detect-FASFF), which reduced missed and false detections in complex environments by adaptively fusing information from the lower pyramid level’s feature maps. In addition, a more focused complete intersection over union loss (Focaler-CIoU) is introduced into the bounding box loss function, which effectively handles the sample imbalance problem, speeds up the convergence, and reduces the bounding box loss value. Combining various improvement measures, the proposed algorithm exhibits high detection performance in complex orchard environments, demonstrating excellent robustness and accuracy and significantly improving the accuracy and efficiency of blueberry maturity detection.
The proposed model performs well in blueberry target detection in complex environments, with average precisions of 89.1%, 91.0%, and 85.5% for ripe, semi-ripe and unripe blueberries, respectively. Compared with the baseline model YOLOv8n, the proposed model has improved mAP@0.5 by 4.5% in all maturity detection tasks. The model demonstrates excellent detection performance in complex environments such as those with multiple targets, strong lighting, insufficient lighting, distant and close ranges, and a frame rate of up to 80 FPS.
Although this study achieved significant results in the detection of blueberry maturity, there are still potential areas for improvement that need to be addressed in future research. Firstly, although the current model achieves a good balance between detection accuracy and operational efficiency, there is still potential for further compression in terms of parameter scale and size. This is particularly important when considering various application scenarios, where lightweight models are particularly crucial. Therefore, future work will focus on optimization strategies such as model pruning and quantization, with the aim of further reducing model size, lowering computational costs, and improving deployment efficiency while maintaining detection accuracy.
Meanwhile, the deployment of the model not only relies on the optimization of the algorithm itself but also requires comprehensive consideration of the hardware performance of the terminal devices, real-time data acquisition, and the overall stability of the system. Future research will further explore the integration of this detection system with agricultural intelligent devices (such as drones, agricultural robots, etc.) to promote the intelligence and scalable application of the blueberry maturity detection system in real-world scenarios. This will provide more accurate and efficient solutions for agricultural production, effectively improving blueberry harvesting efficiency and quality management and supporting automation and intelligence in agriculture. However, the current model still has limitations in terms of adaptability to complex natural environments. For example, under rainy or foggy conditions, the stability and accuracy of the model may be affected. Therefore, future research should further enhance the robustness of the model in dynamic environments to improve its stability and reliability in real-world applications.
In addition, the current training data coverage may still be insufficient and cannot fully represent all blueberry varieties, growth stages, and environmental differences. In the future, efforts should be made to enhance data diversity, covering more real collection scenarios and samples from different geographical regions. By integrating techniques such as adaptive learning and transfer learning, the generalization ability of the model can be improved in various environments. Although this study currently focuses on blueberries, future research will explore its applicability to other fruits and vegetables such as strawberries, grapes, etc., given the potential universality of this method in fruit maturity detection. These crops are also sensitive to harvest time and have rich visual features, making them suitable for maturity recognition using computer vision technology. By applying this model to other fruits and vegetables, the scope of the model could be further expanded and technical support for the development of a universal intelligent fruit and vegetable detection platform could be provided.

 ,
, 


