Abstract
Aiming at the problems of intense subjectivity and high redundancy in the screening of indicators in the stability evaluation of loess slopes, this study proposes an evaluation method integrating the validity and reliability coefficients. Following an initial screening of the indexes based on the engineering geological characteristics of loess slopes and literature research, 22 significant indicators were kept following a qualitative screening process (the principles of uniqueness, purpose, etc.); combined with the improved grey correlation-Delphi model for quantitative screening, the validity coefficient () and reliability coefficient () were introduced to validate the scientificity and consistency of the indicator system. The results showed that the 10 core indicators, including Cohesion, Internal Friction Angle, Maximum Monthly Rainfall, Rock Mass Structure, and Anthropogenic Engineering Activities, had a significant influence on loess slope stability, and the screening process effectively reduced the subjective bias and information redundancy. The method provides a data-driven theoretical framework for eolian slope risk assessment, which can improve the accuracy of landslide warning and the reliability of engineering protection design, and the engineering applicability of the model can be further optimized by combining the dynamic environmental parameters and multi-source monitoring data.
1. Introduction
One of the most damaging geological risks in the region where loess is distributed worldwide is loess slope instability. Under the combined influence of rainfall infiltration, freeze–thaw cycles, and human engineering activities (such as irrigation and excavation), loess is extremely vulnerable to landslide hazards due to its porous structure, susceptibility to wetting, and high sensitivity to hydrological conditions. These factors pose a serious threat to residential areas, farmland infrastructures, and traffic arterials [1,2,3,4]. At the same time, the suddenness and multi-scale damage characteristics of such disasters (e.g., cave collapse, slope shoulder crack extension) further highlight the complexity of stability evaluation [5,6]. About one-third of the annual geological disasters in China occur in the Loess Plateau, which not only causes casualties and infrastructure damage but also leads to huge direct economic losses [7,8]. Moreover, with the fluctuation of groundwater levels and the frequent occurrence of extreme weather events, the risk of slope landslides and other disasters in the Loess Plateau region is also increasing [4,9,10]. However, traditional analysis methods, such as the limit equilibrium method and finite element numerical simulation, make it difficult to quantify the nonlinear interaction effects among indicators due to the over-reliance on idealized assumptions (e.g., homogeneous soils, fixed slip fracture surfaces) [7,11,12]. This makes the theory often inconsistent with the actual situation in practical applications and, thus, there is an urgent need to construct a novel analytical framework that can integrate multiple data sources.
As the core of novel evaluation methods, the indicator screening mechanism is a widespread challenge. Among the existing methods, the subjective assignment method is susceptible to expert cognitive bias, leading to indicator redundancy or omission of key factors [13]. Objective methods such as principal component analysis can extract data features, but may screen out statistically significant indicators but lack engineering interpretability [14]; traditional methods have obvious human intervention in the screening process, such as the resolution coefficient in the grey correlation model, which needs to rely on empirical settings. In this example, the resolution coefficient in the grey correlation model relies on the empirical setting, and when the coefficient varies within a certain range, the variability of the correlation order of indicators is high [15]. However, the selection of indexes for slope stability evaluation typically depends too much on the knowledge and judgment of experts and is not supported by systematic verification procedures, raising questions about the repeatability and scientificity of index screening results [16,17]. When redundant parameters are added, computational complexity is needlessly increased, and the reliability of the evaluation model output is directly impacted by the significant decline in the identification accuracy of important driving factors under the coupling effect of multiple parameters [18,19]. Therefore, to minimize the subjectivity of index screening, guarantee the objectivity of the screening findings, and assure the correctness of slope stability evaluation, it is imperative to develop an objective index screening algorithm framework and a corresponding result verification method.
This study developed a quantitative screening mechanism for the joint control of validity and reliability and creatively suggested a quantitative screening mechanism based on the Delphi method and the improved grey correlation model to address the main issues in the stability evaluation of loess slope.The two-stage framework used to optimize the index system eliminated redundancy through qualitative screening, fused subjective and objective data through quantitative screening, and quantified the quality of the fusion using validity and reliability coefficients. This helped to validate expert consensus and statistical effectiveness, achieve multi-dimensional optimization of the index system, and effectively improve its applicability in loess slope scenarios with complex geological parameters and limited historical samples. Simultaneously, the two-stage screening framework may be adjusted to meet the requirements of regionally diverse evaluation by modifying the validity–reliability threshold parameters. A new methodological framework for the optimization of similar complex system index systems is provided by the collaborative control strategy based on subjective and objective data fusion, which transcends the boundaries of traditional analysis. Its core algorithm is not specific to any particular slope, so that all different types of slopes can be screened by the model, and this method can be applied tomulti-source heterogeneous data processing and complex system index optimization in geotechnical engineering.
2. Regional Geological Setting
2.1. Topography and Geomorphology
Situated in the southern region of the Loess Plateau of Longdong, in Lingtai County, Pingliang City, Gansu Province (Figure 1), the study area is a typical loess hilly-gully landform with a total area of and geographic coordinates ranging from 107°00′ to 107°57′ east longitude and 34°02′ to 34°23′ north latitude. The topography of the region is dominated by loess beam-pebble hills and erosion-accumulation valley plains. It has loess beams and a pebble hills base for the Cretaceous sandstone and gravel, the surface layer is covered with Malan loess, the formation of beams and pebbles interlace terrain, elevation is 910 to 1020 m, the gully is a V-shaped cut, depth is 20 to 150 m, a valley slope gradient of 15 to 40 degrees, and development of the gully and the intensive local collapse landslide. Erosion-accumulation of the river valley plains is distributed in the valley of the Daxi River and its tributaries, the development of river beds, river rambling beach, and multi-level terrace. The first and second terraces are flat and broad, while the third and fourth terraces are sporadically distributed and are base terraces, with a difference of 20 to 40 m in height between the terrace surfaces. Micro-geomorphology in the area is dominated by waterfall holes and gullies, with waterfall holes of 0.2–1.5 m in diameter, which are concentrated in the upper and middle slopes due to precipitation or irrigation seepage, and gullies have proliferated due to the frequency of torrential rains in recent years, aggravating the erosion and damage of slopes.
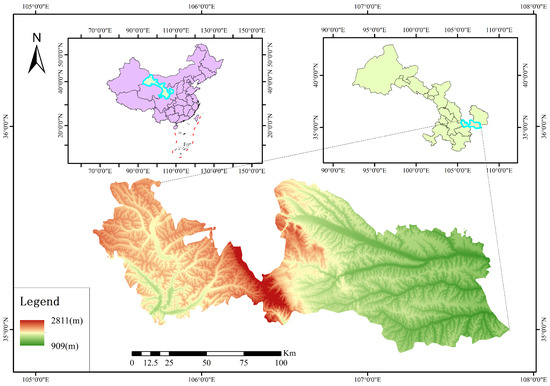
Figure 1.
Location map of the study area.
2.2. Lithological Characteristics
Cretaceous bedrock and Quaternary loose sedimentary layers dominate the research area’s geological structure. As the Quaternary basement, the Cretaceous strata are primarily found on both banks of the Daxi River and its tributaries, including the Luohandong Formation (K1lh) and the Zhidan Group Huanhe Formation (K1h). The brownish-red sandy mudstone of the Cretaceous Huanhe Formation (K1h) is interbedded with sandstone and has an argillaceous cementation that is easily dissolved and softened by water. With small fissures, purple-red sandstone, mudstone, and conglomerate make up the majority of the Luohan Cave Formation (K1lh). The Quaternary strata cover a wide area. Among them, the Lower Pleistocene (Qp1al) is a gravel and clay layer, which is distributed in tributary river valleys. The Middle Pleistocene (Qp2) is dominated by lithic loess (Qp2eol), with a thickness of 60∼150 m, developed vertical joints, and multi-layered paleosoil, which is prone to collapse and landslide. The Upper Pleistocene (Qp3) includes the Malan loess (Qp3eol, collapsible amount 97.4∼216.2 mm) with moderate collapsibility and loose gravelly loess silt (Qp3eol+pl). The Holocene (Qp4) is dominated by sand, gravel, and plain fill (Qp4ml), and its mechanical properties are extremely unstable. Details are shown in Figure 2.
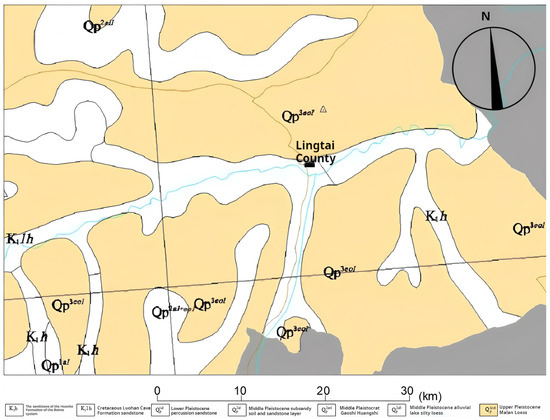
Figure 2.
Geological map of Lingtai County and surrounding areas [20].
2.3. Tectonic Features
According to the investigations of relevant literature [20], the study area is located in the stable tectonic unit of the southwestern edge of the Ordos Basin, with weak tectonic activities, no regional rupture, and the development of five gentle folds (four oblique and one dorsal). The new tectonic movement is dominated by intermittent uplift, forming the four-level terraces and bedrock outcrops in the river valley. Earthquakes are controlled by strong peripheral earthquakes, and the 1920 Haiyuan 8.5-magnitude earthquake triggered secondary disasters. The regional seismic defense intensity is VII degrees (peak acceleration of ground shaking 0.10 g), and the Earth’s crust is stable as a whole, but the loess slopes are weak in seismic performance, so it is necessary to carry out the analysis of anti-slip stability and reinforcement design under seismic conditions.
2.4. Meteorology and Hydrology
With an average annual precipitation of 654.4 mm, a historical maximum daily precipitation of 150.1 mm, and an average annual evaporation of 1145 mm, the study region has warm-temperate semi-humid continental monsoon weather. Details are shown in Figure 3. With an average yearly runoff of 53.28 million cubic meters for the Daxi River and 33 million cubic meters for the Heihe River, the two main rivers of the Jinghe River System are known to have a mineralization of 0.3 to 0.46 g/L and a water chemistry type that is dominated by , , and . The flood peak flow of the east ditch and west ditch in the area reaches 65 m3/s and 55 m3/s, respectively, during heavy rainfall, which makes it easy to trigger a mudflow disaster. Hydrogeological conditions are significantly affected by irrigation seepage and heavy rainfall infiltration, and the water table elevation and loess engineering characteristics jointly exacerbate the hydraulic erosion of slopes.
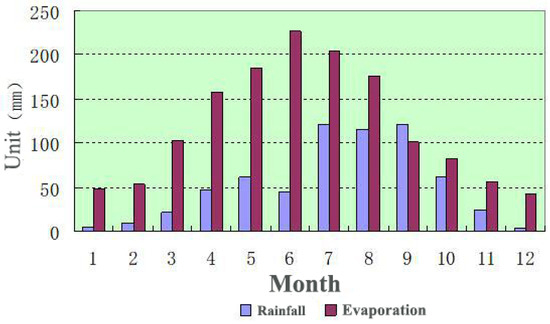
Figure 3.
The average rainfall and evaporation in Lingtai County for many years [20].
2.5. Human Activities
In the study area on the south side of Jingshan Mountain in Lingtai County, the risk of geological disasters has been significantly exacerbated by human engineering activities, which are mainly reflected in slope cutting, green irrigation, and air-raid shelters. Due to the large number of outsiders in the densely populated area, a large number of slopes were cut to build houses, which destroyed the original slope, increased the slope and slope weight, and directly destroyed the stability of the original slope. This is shown in Figure 4. The greening irrigation on the top of the slope causes water to infiltrate along the vertical joints and sinkholes, which raises the groundwater level weakens the shear strength of rock and soil, and weakens the stability of the slope. In addition, although the remaining air-raid shelters have been blocked, there are still hidden seepage channels, and the mechanical properties of the rock and soil around the caves are accelerated by water intrusion during rainfall. These activities are the core anthropogenic drivers of slope instability by altering the topographic structure, permeability conditions, and geophysical properties. This is shown in Figure 5.
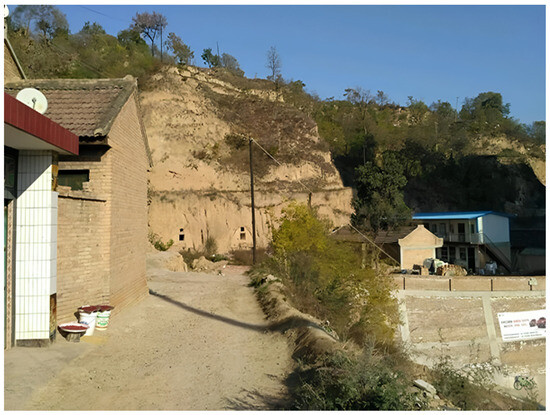
Figure 4.
The phenomenon of cutting slopes to build houses around Jingshan [20].
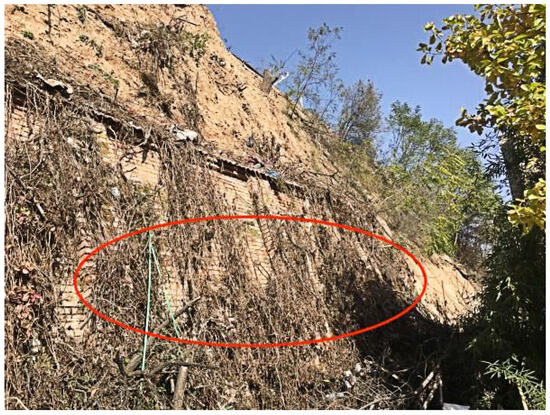
Figure 5.
An air-raid shelter at the foot of the slope of the study area [20].
3. Research Method
This study focuses on the stability of loess slopes and proposes the four-step method of “preliminary selection, qualitative screening, quantitative screening, and verification” to construct the slope stability evaluation index system and combines the improved grey correlation model with the statistical validation method to systematically analyze the validity and reliability of the indexes. The specific operation process is shown in Figure 6.
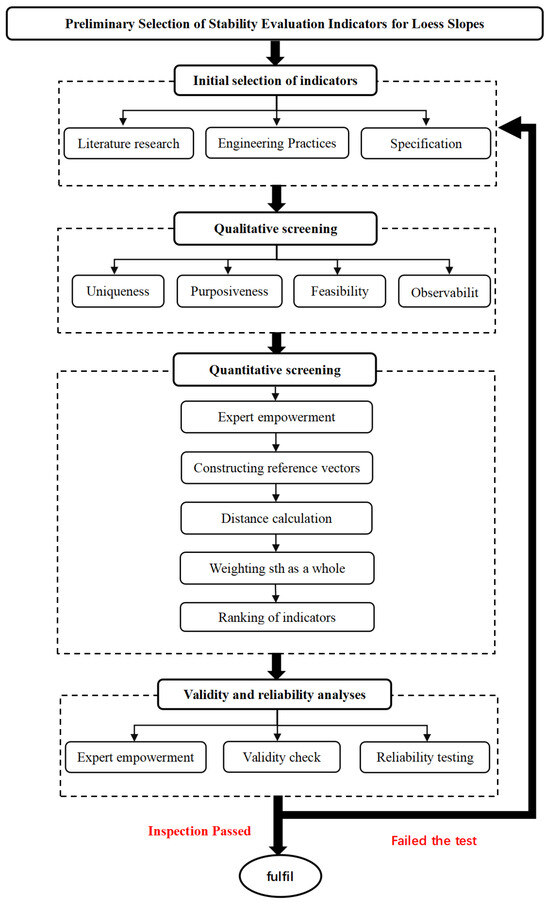
Figure 6.
Flowchart of the screening of indicators for loess slopes.
3.1. Preliminary Selection and Qualitative Screening of Evaluation Indicators
The stability state and evaluation criteria of loess slopes under various geological conditions differ greatly, and the influencing factors of slope stability are extremely varied and complex. These factors must be combined with the unique mechanical and physical characteristics of loess slopes for focused analysis. To systematically identify the core influencing factors of loess slope stability, the study is based on the research results of loess engineering geology and slope stability at home and abroad [21,22,23,24,25,26] and comprehensively refers to China’s “Code for Construction in Wet Trapped Loess Areas” (GB 50025-2018) [27] and “Highway Subgrade Design Code” (JTG D30-2015) [28]. Through theoretical analysis and engineering case verification, a preliminary loess slope stability evaluation index system containing several key parameters was constructed.
However, a large number of correlation indicators not only weaken the importance of the core parameters but also reduce the calculation efficiency due to the repetition of information, which is a result of this indicator system’s problem with an excessive number and redundancy of indicators. In this study, based on the analysis of the main control factors of loess slope stability in the study area, the four basic principles of uniqueness, purpose, feasibility, and observability are used as the screening framework to qualitatively screen several preliminary indicators. The principle of uniqueness requires the elimination of redundant and invalid indicators; the purpose emphasizes that the indicators should directly reflect the characteristics of loess slope stability, the feasibility ensures that the indicator data are accessible and operable, and the observability requires that the meaning of the indicators is clear and the parameters can be quantified.
In the stability assessment of loess slope, all four of these principles can efficiently eliminate redundant indicators, highlight key factors, increase computation efficiency, and guarantee that the indicators accurately reflect the stability characteristics, all of which can improve evaluation accuracy. This approach, however, could result in the loss of information from the unintentional deletion of duplicate signs with minor variations or the exclusion of important indicators owing to oversimplification. Furthermore, the choice of indicators might be influenced subjectively by the assessors. Thus, the initial screening findings for the core indicators were obtained using this method. After removing indications with poor relevance, complicated data collecting, and unclear representation, quantitative analyses are required to guarantee the accuracy of the evaluation.
3.2. Quantitative Screening of Evaluation Indicators
The quantitative screening stage is based on the improved grey correlation-Delphi model, aiming at mining the core influencing factors from the qualitatively screened indicators through the combination of mathematical modeling and expert empowerment. The specific process is as follows:
Improved Grey Correlation-Delphi Model
Grey correlation analysis is a research method in grey system theory, which assesses the strength of correlation by quantifying the similarity of the dynamically changing characteristics of data series [29]. The core step is to divide the target indicator into reference and comparison sequences and analyze the degree of coincidence between the two change trends; the higher the correlation, the greater the contribution of the indicator to the system’s behavioral pattern. With the core function of identifying the main controlling factors of the system, this method has been widely used in engineering practice, ecological research, economic analysis, and other fields [30,31,32]. However, in the traditional grey correlation model, the value of the discrimination coefficient has a strong subjective dependence due to the lack of objective criteria. In slope stability assessment, the same index may be classified as a core or secondary factor due to the different values of , which leads to bias in the development of engineering solutions [33]. Moreover, a slight adjustment of the value can trigger a large fluctuation of the correlation coefficient, resulting in a significant shift in the weighting of indicators and a non-stationary fluctuation of decision-making results. Aiming at this limitation of the traditional model, this study constructed an improved grey correlation analysis framework [34], and its improvement process is described as follows:
- The Delphi method, also known as the expert survey method, is a process for making decisions that involves anonymous rounds of expert consultation. It involves screening and optimizing the evaluation index system using principal component analysis, hierarchical analysis, and other techniques [35,36,37]. The implementation process includes designing a structured questionnaire, inviting experts to independently rate or suggest, and adjusting opinions after multiple rounds of data statistics and anonymous feedback until the expert group reaches a consensus. The method reduces subjective bias through anonymous interaction and guarantees objective and reliable conclusions. In the application, m experts can anonymously rate the weights of n indicators and construct the decision matrix D characterizing the weights of the indicators. This is shown in Equation (1):where D is the matrix of indicator weights and is the value of the mth expert’s assessment of the weight of the nth indicator to be screened.
- Construct the reference vector by extracting the maximum value of each column of the matrix D, as shown in Equation (2):
- According to Equation (3), the spatial difference value between each evaluation index and the reference series can be calculated, which intuitively characterizes the degree of dynamic shift of the index, and provides a quantitative basis for weight allocation and correlation analysis.where is the weight that the Kth expert awarded to the ith indicator, and is the distance between the ith indicator and the reference indicator.
3.3. Validity and Reliability Verification
This study uses statistical analysis techniques to build a quantitative assessment model and uses a two-parameter validation mechanism of the validity coefficient and the reliability coefficient to systematically test the level of confidence, structural validity, and data stability of the screening indexes to guarantee the evaluation index system’s scientific and engineering applicability [38].
3.3.1. Validity Test of Evaluation Indicator System
Assessing whether the index system can accurately reflect the objective reality requires the use of the validity test. Based on statistical theory, this study addressed the issues of subjective evaluation uncertainty and redundancy or lack of indicators by introducing the validity coefficient as a tool for quantifying deviations and measuring the fit between the index system and the real scenario using expert scoring data. Compared to costly field measurements and machine learning approaches that rely heavily on data quality, validity tests achieve a balance between scientific rigor and engineering feasibility, demonstrating distinct methodological advantages. For the 10 key indicators established in the pre-screening, the validity coefficient test is used to conduct empirical research, and the specific modeling process is as follows:
- Data collection and standardization: Let the evaluation index system be containing a total of n indicators. Invite M experts to participate in independent scoring. According to the relative importance of the indicators, the experts need to assign scores to the indicators within the standardization interval, forming the scoring matrix , where indicates the scoring value of the jth expert for the indicator .
- Calculation of the validity coefficient of the single indicator: Define the validity coefficient for indicator as:where V is the theoretical optimal value and is the average score value of the evaluation indicator , which can be calculated using Equation (7):
- Global validity coefficient synthesis: Integrate the validity coefficients of each index through the arithmetic average method to get the overall validity coefficient of the evaluation system:
- Validity determination criteria: The validity coefficient is often used as a core parameter to measure the scientificity of the evaluation system, and when the value is lower than the empirical threshold (routinely set at 0.15), the consensus of the expert group on the evaluation dimensions is significantly enhanced, and the validity of the indicator system in reflecting the objective reality is also enhanced.
3.3.2. Reliability Test of Evaluation Index System
In the process of constructing the evaluation index system, the subject of evaluation is affected by the heterogeneity of professionalism, cognitive framework, and knowledge reserve, and its scoring behavior is easily interfered with by subjective preferences, which leads to systematic bias in the assessment results. Such subjective cognitive differences will weaken the anti-interference and data reproduction ability of the indicator system, which in turn triggers controversy over the validity of the indicator screening. To solve this problem, this study proposes a reliability coefficient model () based on the strength of statistical association, which quantifies the intrinsic correlation between indicators to achieve validity verification, and the specific modeling process is as follows:
- Calculation of the mean value of a single indicator: For expert rating data processing of the jth indicator in the evaluation system, its arithmetic mean can be determined using Equation (9). This calculation process integrates the results of the multidimensional assessment of the members of the expert group for a particular indicator.
- Calculation of the global mean for the data set: Equation (10) illustrates how the baseline scoring standards of the expert panel for each indicator are first established to create the comprehensive evaluation model. represents the expert scoring dataset corresponding to an evaluation system with n indicators. Based on this, the comprehensive mean score of this dataset must be determined using Equation (11), a formula system that integrates expert assessment data from multiple dimensions to achieve the quantitative characterization of the overall level of the evaluation system.
- Calculating the single-indicator reliability coefficient . can be done using Equation (12):Among these, when , it means that has a positive correlation with the whole evaluation and that the score is consistent; the more closely approaches one, the more reliable the indicator is and the more powerful it is at explaining the total results.
- The synthetic total reliability coefficient can be calculated using Equation (13). This value synthetically reflects the stability and internal consistency of the whole indicator system. When is high, it indicates that the indicators within the indicator system are highly correlated and the degree of consensus of expert scores is high; when is low, it means that the logic between the indicators is loose or there is redundancy, and the structure needs to be optimized.
- Reliability level determination: Generally speaking, when , it indicates that the reliability of the evaluation index system is high, when , its reliability is at a general level, and when , its reliability is relatively low.
4. Engineering Application
In this paper, the loess slope on the south side of Jing Mountain in Lintai County, Gansu Province [20] is taken as the study area, and the stability evaluation indexes are selected for this slope. The area belongs to the Longdong loess hilly geomorphological area, dominated by natural loess gullies and artificially modified steep slopes. Regional tectonics are relatively stable, but it is strongly influenced by external dynamic geological effects such as weathering, gravity, surface water scouring, and groundwater activities, superimposed on the developed surface water system, high annual rainfall, and frequent human engineering activities, resulting in a significant risk of geological hazards. Several unstable loess slopes in the study area are near residential areas and public facilities, posing a high potential threat. Details are shown in Figure 7 and Figure 8.
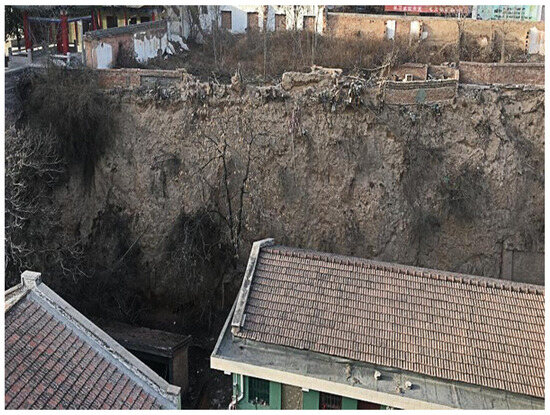
Figure 7.
Studying the location of the area and the building [20].
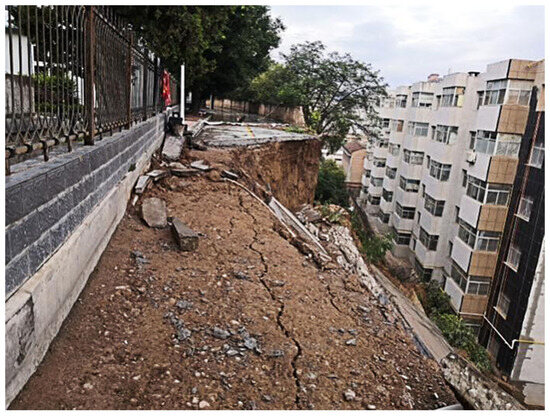
Figure 8.
The landslide’s location in relation to the building [20].
A preliminary construction of a loess slope stability evaluation index system that multi-dimensional indexes of loess stratification and structure, hydrogeological conditions, soil mechanical parameters, and human interference, was conducted in accordance with the principle of primary selection of evaluation indicators. Based on the four basic principles of uniqueness, purposefulness, feasibility, and observability, the qualitative screening of a number of indicators in the primary selection was carried out. Ultimately, as Table 1 illustrates, a simplified assessment framework comprising 22 fundamental indicators was developed.

Table 1.
Evaluation indicators for qualitative screening.
In order to extract the primary influencing elements from the subjectively screened indicators, the assessment indicators were quantitatively screened using the enhanced grey correlation model. Five specialists who are knowledgeable about the geological state of loess slopes were gathered using the Delphi technique to weigh each assessment index in accordance with Table 2 and create the index weight matrix D of Equation (14). The primary elements impacting the stability of loess slopes were determined by calculating and ranking the weights of the assessment indicators.

Table 2.
Evaluation indicator weights based on improved grey correlation.
The reference vector is constructed by extracting the maximum value of each column of the matrix D, as shown in Equation (15).
Table 3 displays the weights of the assessment indicators following qualitative screening, which were calculated by combining Equations (3)–(5).

Table 3.
Evaluation indicators for quantitative screening.
Analysis of the weight distribution in Table 2 reveals that the key influencing factors of loess slope stability (screening threshold of 0.0450) can be summarized into the following 10 core parameters: Rock Mass Structure (Indicator 1), Slope Height (Indicator 4), Underground Water Body (Indicator 6), Internal Friction Angle (Indicator 8), Cohesion (Indicator 9), Maximum Monthly Rainfall (Indicator 10), Slope Gradient (Indicator 11), Seismic Intensity (Indicator 17), Hydrological Conditions (Indicator 20), and Anthropogenic Engineering Activities (Indicator 22). Details are shown in Table 3. The Maximum Monthly Rainfall (indicator 10) and Anthropogenic Engineering Activities (indicator 22) have the highest weight among them. This is in line with the region’s actual conditions of high precipitation and robust human engineering activity, which confirms the accuracy and rationality of the weight calculation results.
5. Conclusions
To address the problem of stability evaluation of loess slopes on the south side of Jingshan Mountain in Lintai County, Gansu Province, this study proposes an evaluation index screening method that combines qualitative and quantitative analyses and integrates the improved grey correlation model through the introduction of the coefficient of validity () and the coefficient of reliability (), which significantly improves the redundancy of the indexes and subjective dependence that exists in the traditional method. The main research results are as follows:
- Multi-dimensional indicator screening framework: A qualitative analysis framework was constructed based on engineering geology, hydrogeology, and anthropogenic factors, and the preliminary selection of 60 indicators was quantitatively screened by combining it with the improved grey correlation model, and 10 core indicators were finally identified, including rock structure, slope height, groundwater body, internal friction angle, cohesion, maximum monthly rainfall, and geological structure. The framework achieves the precision and efficiency of the indicator system through a hierarchical screening mechanism, providing a scientific basis for the evaluation process.
- Evaluation system validity and reliability test: By calculating the validity coefficient () and reliability coefficient (), the logical rationality and data consistency of the screening indicator set were verified. The results show that the method takes into account expert experience and objective data analysis, significantly reduces human bias, and can provide a highly credible indicator basis for slope stability evaluation.
- Engineering practice value: The research results provide a standardized analysis tool for loess slope stability assessment, which can systematically identify potential risk factors, guide the deployment of the monitoring network, optimize the reinforcement scheme, and help improve the refinement of mine safety management. The method also has cross-regional adaptability and can be extended to the evaluation of loess slopes with different geological backgrounds.
Loess slopes in the southern Jingshan region of Lingtai County, Gansu Province, are the subject of this study. The model’s broad applicability needs more validation due to the limited expert samples and data coverage, especially across varied geological units including steep high slopes and composite stratigraphy. The proposed indicator screening model could be expanded in future research through the integration of critical parameters including extreme rainfall measurements, seismic indices, and freeze–thaw cycles into existing evaluation systems while adopting machine learning techniques to quantify coupling effects among these factors. Additionally, comprehensive model validation and numerical simulations across various geomorphological units of the Loess Plateau could elucidate the evolution mechanisms of slope collapse under extreme loading conditions. These enhancements would substantially improve the model’s adaptability to complex scenarios involving intense rainfall and seismic activities in loess terrains while strengthening its threshold identification capability.
Author Contributions
Conceptualization, H.S. and J.A.; Writing—original draft, J.L. All authors have read and agreed to the published version of the manuscript.
Funding
2024 Liaoning Provincial Science and Technology Plan Joint Programme Project [2024011314-JH2/1026].
Institutional Review Board Statement
Not applicable.
Informed Consent Statement
Not applicable.
Data Availability Statement
The original contributions presented in this study are included in the article. Further inquiries can be directed to the corresponding author.
Conflicts of Interest
Author Jianchao An was employed by the company Jinzhou Water (Group) Co., Ltd. The remaining authors declare that the research was conducted in the absence of any commercial or financial relationships that could be construed as a potential conflict of interest.
References
- Zhuang, J.; Peng, J.; Zhu, Y. Study of the effects of clay content on loess slope failure mode and loess strength. Bull. Eng. Geol. Environ. 2021, 80, 1999–2009. [Google Scholar] [CrossRef]
- Xu, J.; Wang, Z.q.; Ren, J.w.; Wang, S.h.; Jin, L. Mechanism of slope failure in loess terrains during spring thawing. J. Mt. Sci. 2018, 15, 845–858. [Google Scholar] [CrossRef]
- Li, X.; Lu, Y.; Zhang, X.; Fan, W.; Lu, Y.; Pan, W. Quantification of macropores of Malan loess and the hydraulic significance on slope stability by X-ray computed tomography. Environ. Earth Sci. 2019, 78, 522. [Google Scholar] [CrossRef]
- Zhuang, J.; Peng, J.; Wang, G.; Iqbal, J.; Wang, Y.; Li, W.; Xu, Q.; Zhu, X. Prediction of rainfall-induced shallow landslides in the Loess Plateau, Yan’an, China, using the TRIGRS model. Earth Surf. Process. Landforms 2017, 42, 915–927. [Google Scholar] [CrossRef]
- Wu, Z.j.; Zhao, D.y.; Che, A.l.; Chen, D.w.; Liang, C. Dynamic response characteristics and failure mode of slopes on the loess tableland using a shaking-table model test. Landslides 2020, 17, 1561–1575. [Google Scholar] [CrossRef]
- Peng, J.; Sun, P.; Igwe, O.; Li, X. Loess caves, a special kind of geo-hazard on loess plateau, northwestern China. Eng. Geol. 2018, 236, 79–88. [Google Scholar] [CrossRef]
- Zhuang, J.; Peng, J.; Wang, G.; Javed, I.; Wang, Y.; Li, W. Distribution and characteristics of landslide in Loess Plateau: A case study in Shaanxi province. Eng. Geol. 2018, 236, 89–96. [Google Scholar] [CrossRef]
- Peng, J.; Fan, Z.; Wu, D.; Huang, Q.; Wang, Q.; Zhuang, J.; Che, W. Landslides triggered by excavation in the loess plateau of China: A case study of Middle Pleistocene loess slopes. J. Asian Earth Sci. 2019, 171, 246–258. [Google Scholar] [CrossRef]
- Gao, H.; Zhang, X. Landslide susceptibility assessment considering landslide volume: A case study of Yangou watershed on the Loess Plateau (China). Appl. Sci. 2022, 12, 4381. [Google Scholar] [CrossRef]
- Ma, J.; Yao, Y.; Wei, Z.; Meng, X.; Zhang, Z.; Yin, H.; Zeng, R. Stability analysis of a loess landslide considering rainfall patterns and spatial variability of soil. Comput. Geotech. 2024, 167, 106059. [Google Scholar] [CrossRef]
- Sengani, F.; Allopi, D. Accuracy of two-dimensional limit equilibrium methods in predicting stability of homogenous road-cut slopes. Sustainability 2022, 14, 3872. [Google Scholar] [CrossRef]
- Wang, G.; Zhao, B.; Wu, B.; Zhang, C.; Liu, W. Intelligent prediction of slope stability based on visual exploratory data analysis of 77 in situ cases. Int. J. Min. Sci. Technol. 2023, 33, 47–59. [Google Scholar] [CrossRef]
- Wang, G.; Liu, Y.; Hu, Z.; Lyu, Y.; Zhang, G.; Liu, J.; Liu, Y.; Gu, Y.; Huang, X.; Zheng, H.; et al. Flood risk assessment based on fuzzy synthetic evaluation method in the Beijing-Tianjin-Hebei metropolitan area, China. Sustainability 2020, 12, 1451. [Google Scholar] [CrossRef]
- Li, L.m.; Cheng, S.k.; Wen, Z.z. Landslide prediction based on improved principal component analysis and mixed kernel function least squares support vector regression model. J. Mt. Sci. 2021, 18, 2130–2142. [Google Scholar] [CrossRef]
- Dong, Q.; Yi, P.; Li, W.; Wang, L. Evaluation of city sustainability using the HGRW method: A case study of urban agglomeration on the West Side of the Straits, China. J. Clean. Prod. 2022, 358, 132008. [Google Scholar] [CrossRef]
- Chen, L.; Guo, H.; Gong, P.; Yang, Y.; Zuo, Z.; Gu, M. Landslide susceptibility assessment using weights-of-evidence model and cluster analysis along the highways in the Hubei section of the Three Gorges Reservoir Area. Comput. Geosci. 2021, 156, 104899. [Google Scholar] [CrossRef]
- Gong, B. Study of PLSR-BP model for stability assessment of loess slope based on particle swarm optimization. Sci. Rep. 2021, 11, 17888. [Google Scholar] [CrossRef]
- Mahmoodzadeh, A.; Mohammadi, M.; Farid Hama Ali, H.; Hashim Ibrahim, H.; Nariman Abdulhamid, S.; Nejati, H.R. Prediction of safety factors for slope stability: Comparison of machine learning techniques. Nat. Hazards 2022, 111, 1771–1799. [Google Scholar] [CrossRef]
- Li, X.; Huang, F.; Yang, Z. Multisource monitoring data-driven slope stability prediction using ensemble learning techniques. Comput. Geotech. 2024, 169, 106255. [Google Scholar] [CrossRef]
- Nan, Z. Stability Analysis of Loess Slopes in Jingshan and Study of Management Options. Master’s Thesis, Lanzhou University, Lanzhou, China, 2023. [Google Scholar]
- Peng, J.; Wang, S.; Wang, Q.; Zhuang, J.; Huang, W.; Zhu, X.; Leng, Y.; Ma, P. Distribution and genetic types of loess landslides in China. J. Asian Earth Sci. 2019, 170, 329–350. [Google Scholar] [CrossRef]
- Wei, L.; Zeng, Z.; Yan, J. Factors Affecting the Stability of Loess Landslides: A Review. Appl. Sci. 2024, 14, 2735. [Google Scholar] [CrossRef]
- Zhang, Z.; Qi, W.; Zhao, Z.; Zheng, T. Influence of loess–mudstone strata structure on slope seismic stability of loess plateau in China. Appl. Sci. 2023, 13, 12854. [Google Scholar] [CrossRef]
- Zeng, F.; Nait Amar, M.; Mohammed, A.S.; Motahari, M.R.; Hasanipanah, M. Improving the performance of LSSVM model in predicting the safety factor for circular failure slope through optimization algorithms. Eng. Comput. 2021, 38, 1755–1766. [Google Scholar] [CrossRef]
- Liu, X.; Shao, S.; Shao, S. Landslide susceptibility zonation using the analytical hierarchy process (AHP) in the Great Xi’an Region, China. Sci. Rep. 2024, 14, 2941. [Google Scholar] [CrossRef]
- Feng, W.; Liu, Y.; Chen, Z.; Li, Y.; Huang, Y. Theoretical and practical research into excavation slope protection for agricultural geographical engineering in the Loess Plateau: A case study of China’s Yangjuangou catchment. J. Rural Stud. 2022, 93, 309–317. [Google Scholar] [CrossRef]
- GB 50025-2018; Standard for Building Construction in Collapsible Loess Regions. Ministry of Housing and Urban-Rural Development of the People’s Republic of China: Beijing, China, 2018.
- JTG D30-2015; Specifications for Design of Highway Subgrades. Ministry of Transport of the People’s Republic of China: Beijing, China, 2015.
- Deris, A.M.; Solemon, B.; Taha, H.; Omar, R.C. Determination of influencing factors for slope stability using grey relational analysis (GRA) technique. Syst. Rev. Pharm 2020, 11, 202–206. [Google Scholar]
- Zhao, X.; Yan, L.; Yang, L.; Chi, F.; Ning, Y. Deformation characteristics and influential factors of a toppling rock slope based on the grey relational analysis. Eur. J. Environ. Civ. Eng. 2023, 27, 2507–2518. [Google Scholar] [CrossRef]
- Dou, F.; Xing, H.; Li, X.; Yuan, F.; Lu, Z.; Li, X.; Ge, W. 3D Geological suitability evaluation for urban underground space development based on combined weighting and improved TOPSIS. Nat. Resour. Res. 2022, 31, 693–711. [Google Scholar] [CrossRef]
- Ye, S.; Huang, A.; Zhu, Y. Slope Stability Prediction Using Grey Entropy Correlation Analysis. Soil Mech. Found. Eng. 2024, 61, 419–425. [Google Scholar] [CrossRef]
- Ye, S.h.; Huang, A.p. Sensitivity analysis of factors affecting stability of cut and fill multistage slope based on improved grey incidence model. Soil Mech. Found. Eng. 2020, 57, 8–17. [Google Scholar] [CrossRef]
- Zhang, P.; Wang, Y.; Jiang, N.; Ge, L.; Ding, Y.; Tang, P. Screening method for evaluation index of distribution network regulation level based on improved grey correlation. J. Power Syst. Autom. 2018, 30, 64–69. [Google Scholar]
- Hu, X.d.; Gao, J.z.; Zhou, M.t.; Shen, J.; Zhao, T.h. Evaluating the success of engineering disturbed slope eco-restoration in the alpine region, southeast Qinghai-Tibet Plateau, China. J. Mt. Sci. 2021, 18, 2820–2832. [Google Scholar] [CrossRef]
- Kim, J.; Kim, C.; Kim, G.; Kim, I.; Abbas, Q.; Lee, J. Probabilistic tunnel collapse risk evaluation model using analytical hierarchy process (AHP) and Delphi survey technique. Tunn. Undergr. Space Technol. 2022, 120, 104262. [Google Scholar] [CrossRef]
- Yuan, X.; Hou, R.; Liu, Y.; Wei, X.; Wang, X.; Ying, Y.; Zhao, Y.; Yao, Y.; Chang, J. The evaluation of soil stability in loess hilly and gully region of Northern Shaanxi based on GIS. Geol. J. 2018, 53, 379–386. [Google Scholar] [CrossRef]
- Xiao, H. Dynamic Evaluation Method and Application of Slope Stability in Small and Medium-Sized Open Pit Mines. Ph.D. Thesis, China University of Mining and Technology, Xuzhou, China, 2019. [Google Scholar]
Disclaimer/Publisher’s Note: The statements, opinions and data contained in all publications are solely those of the individual author(s) and contributor(s) and not of MDPI and/or the editor(s). MDPI and/or the editor(s) disclaim responsibility for any injury to people or property resulting from any ideas, methods, instructions or products referred to in the content. |
© 2025 by the authors. Licensee MDPI, Basel, Switzerland. This article is an open access article distributed under the terms and conditions of the Creative Commons Attribution (CC BY) license (https://creativecommons.org/licenses/by/4.0/).