
Strain Rate Effects on Characteristic Stresses and Dynamic Strength Criterion in Granite Under Triaxial Quasi-Static Compression

Abstract
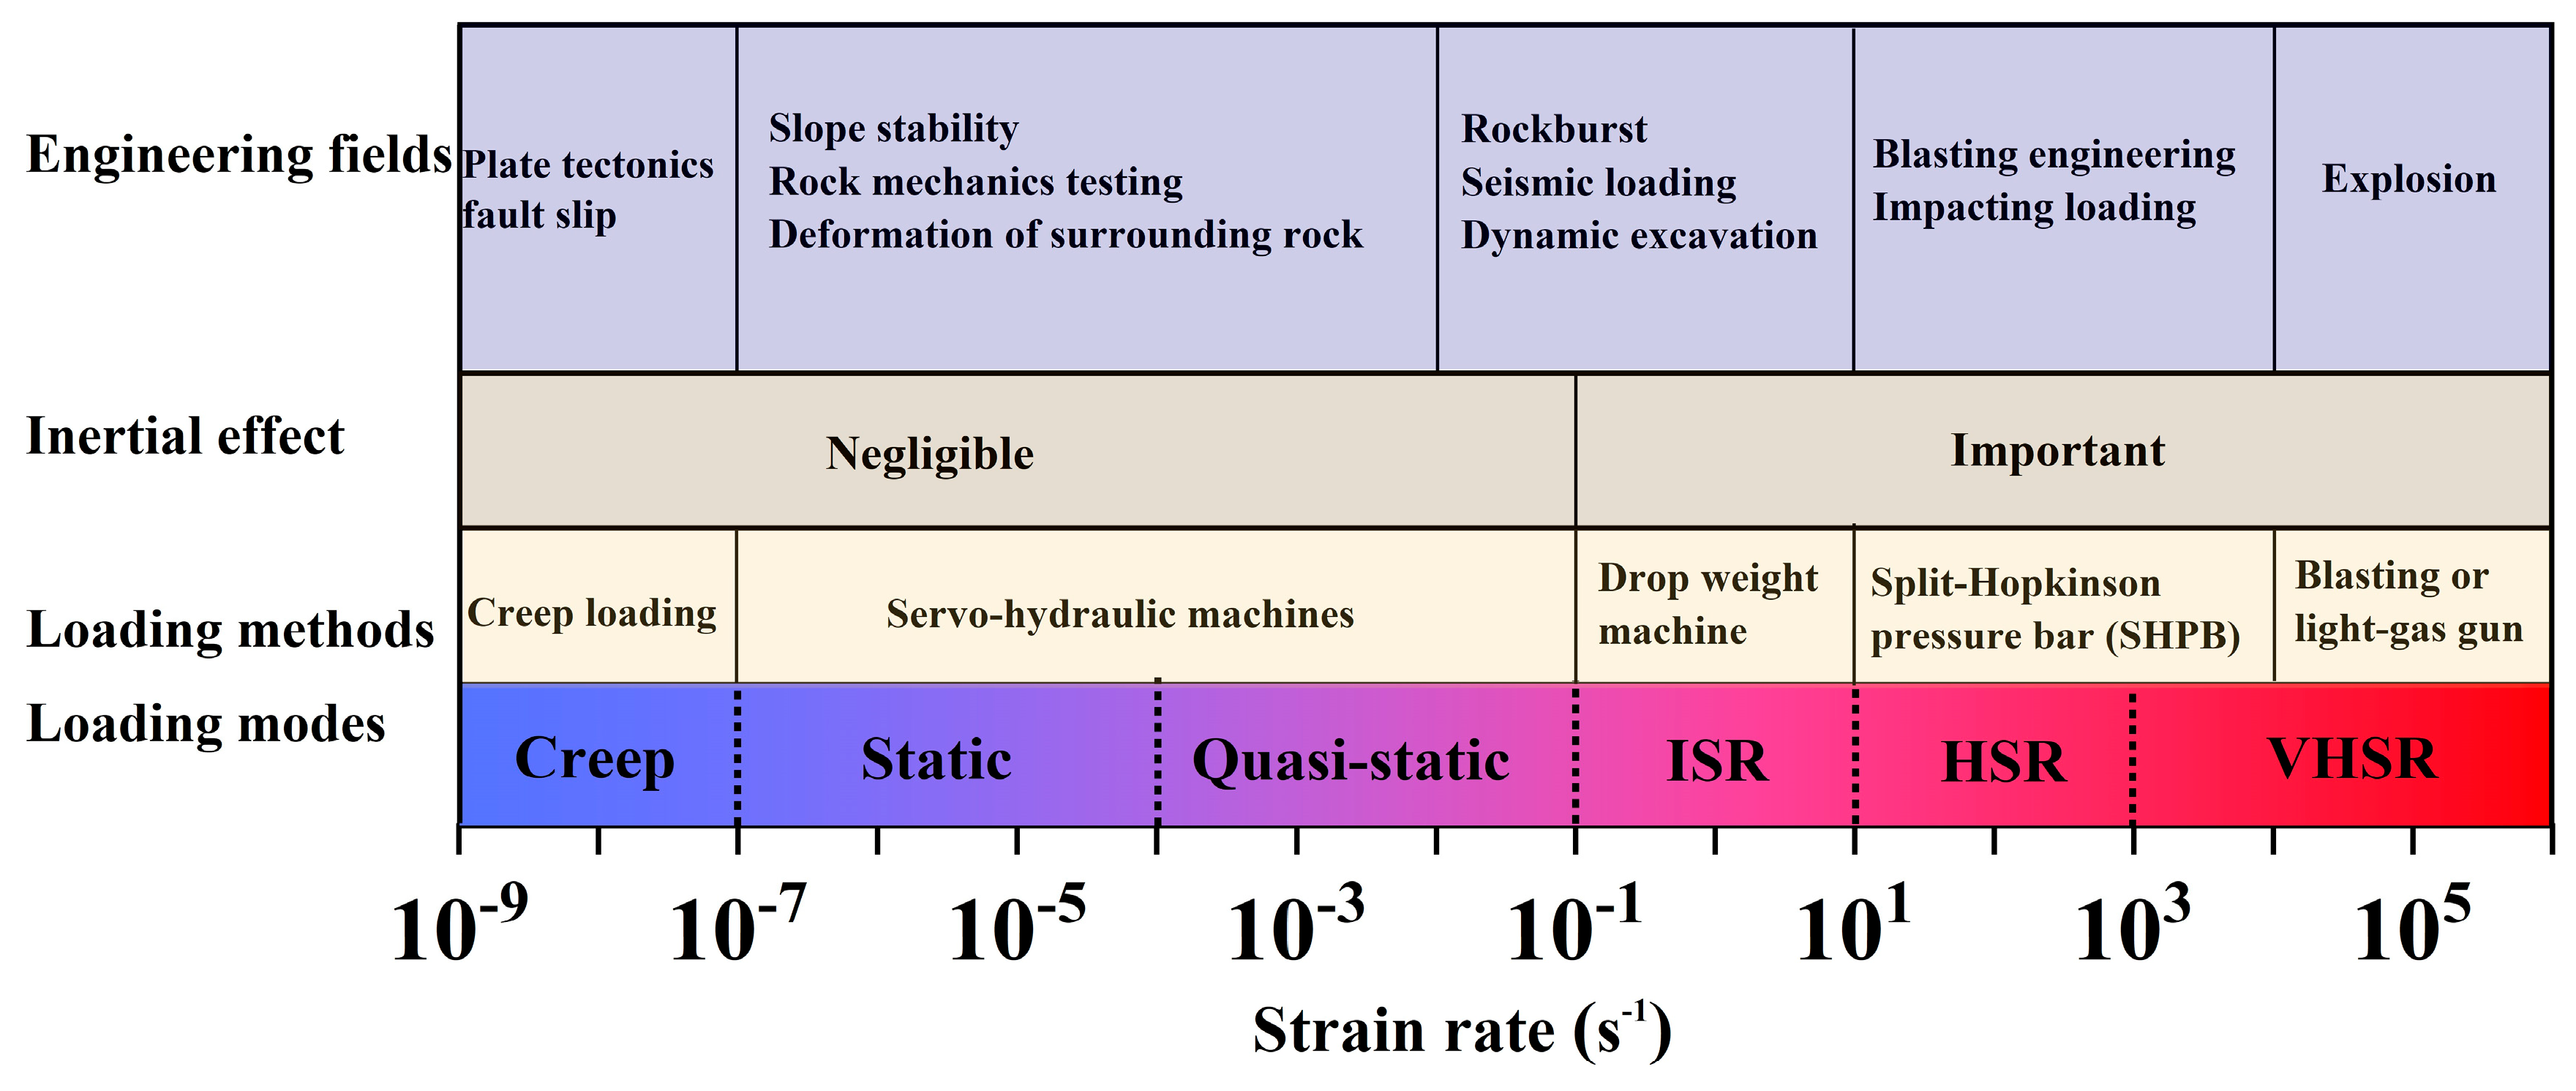
1. Introduction
2. Rock Specimens and Experiment Preparation
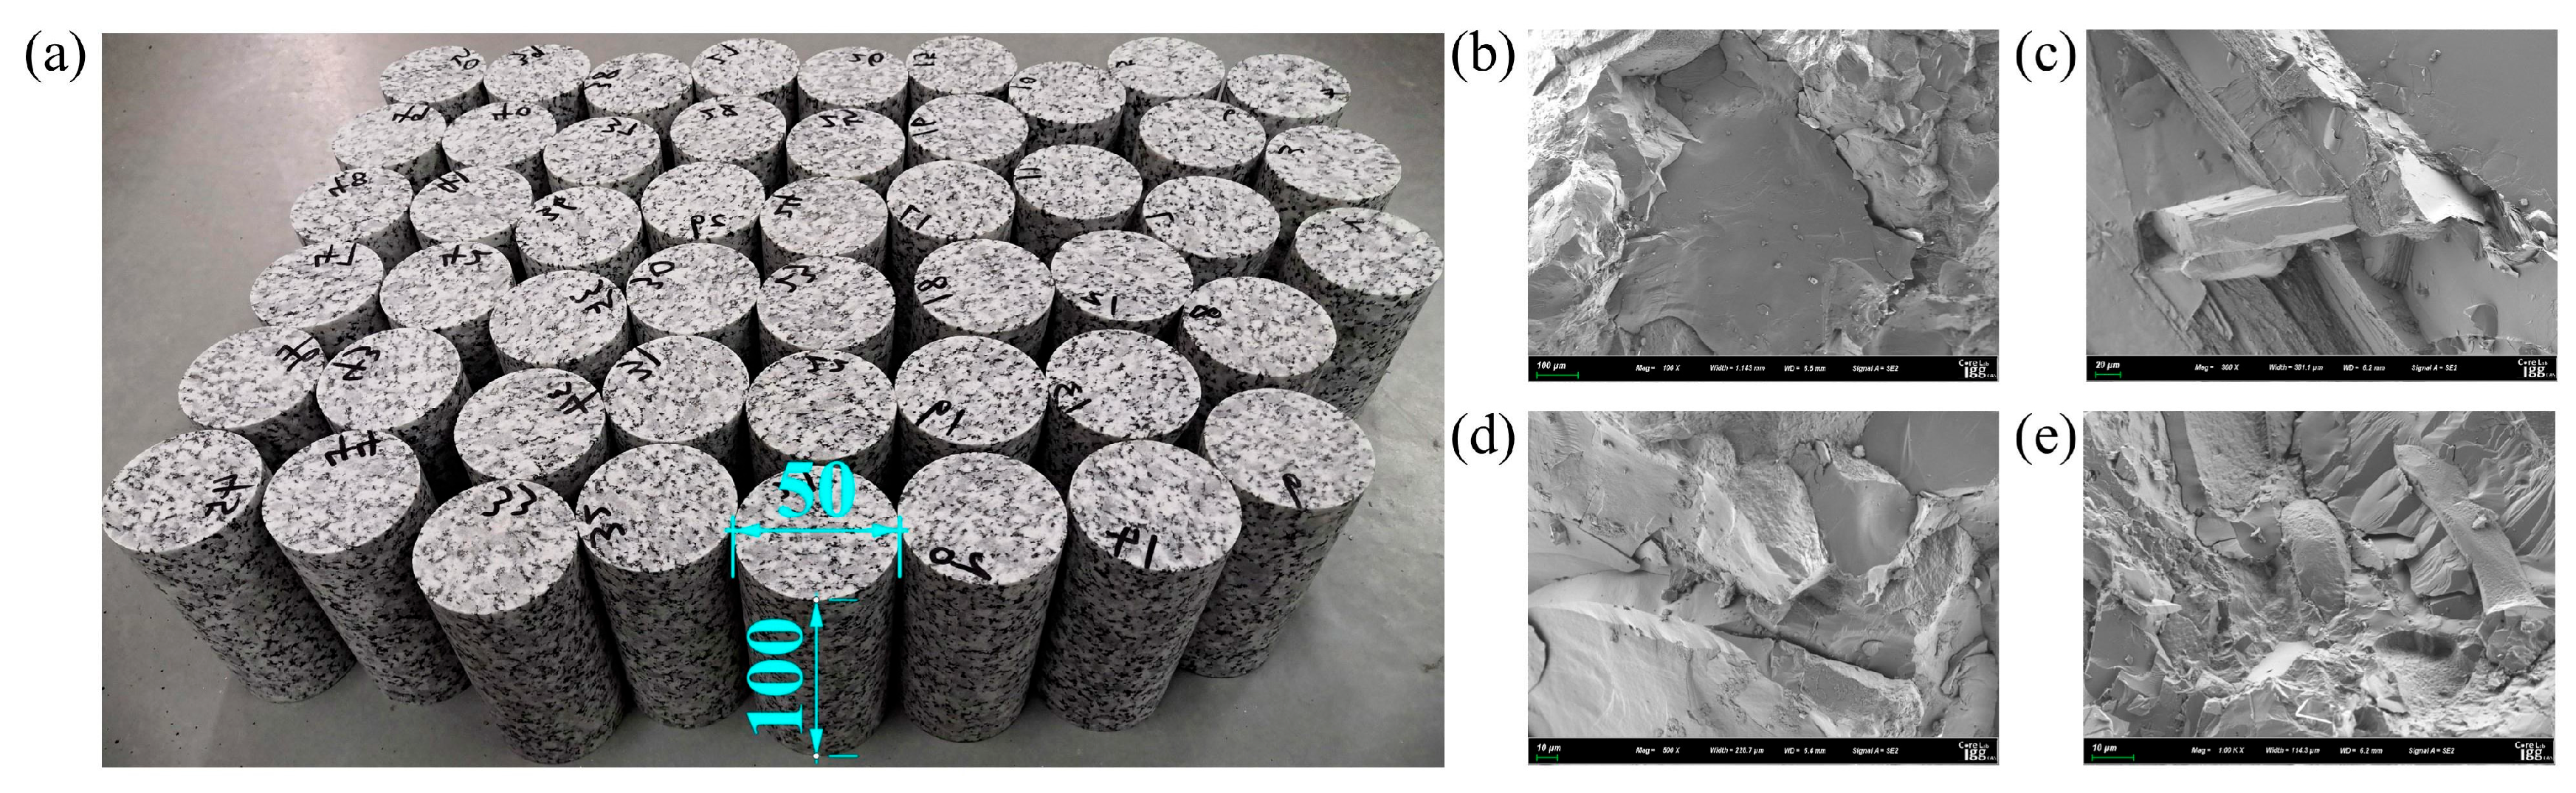
2.1. Rock Specimens and Testing System
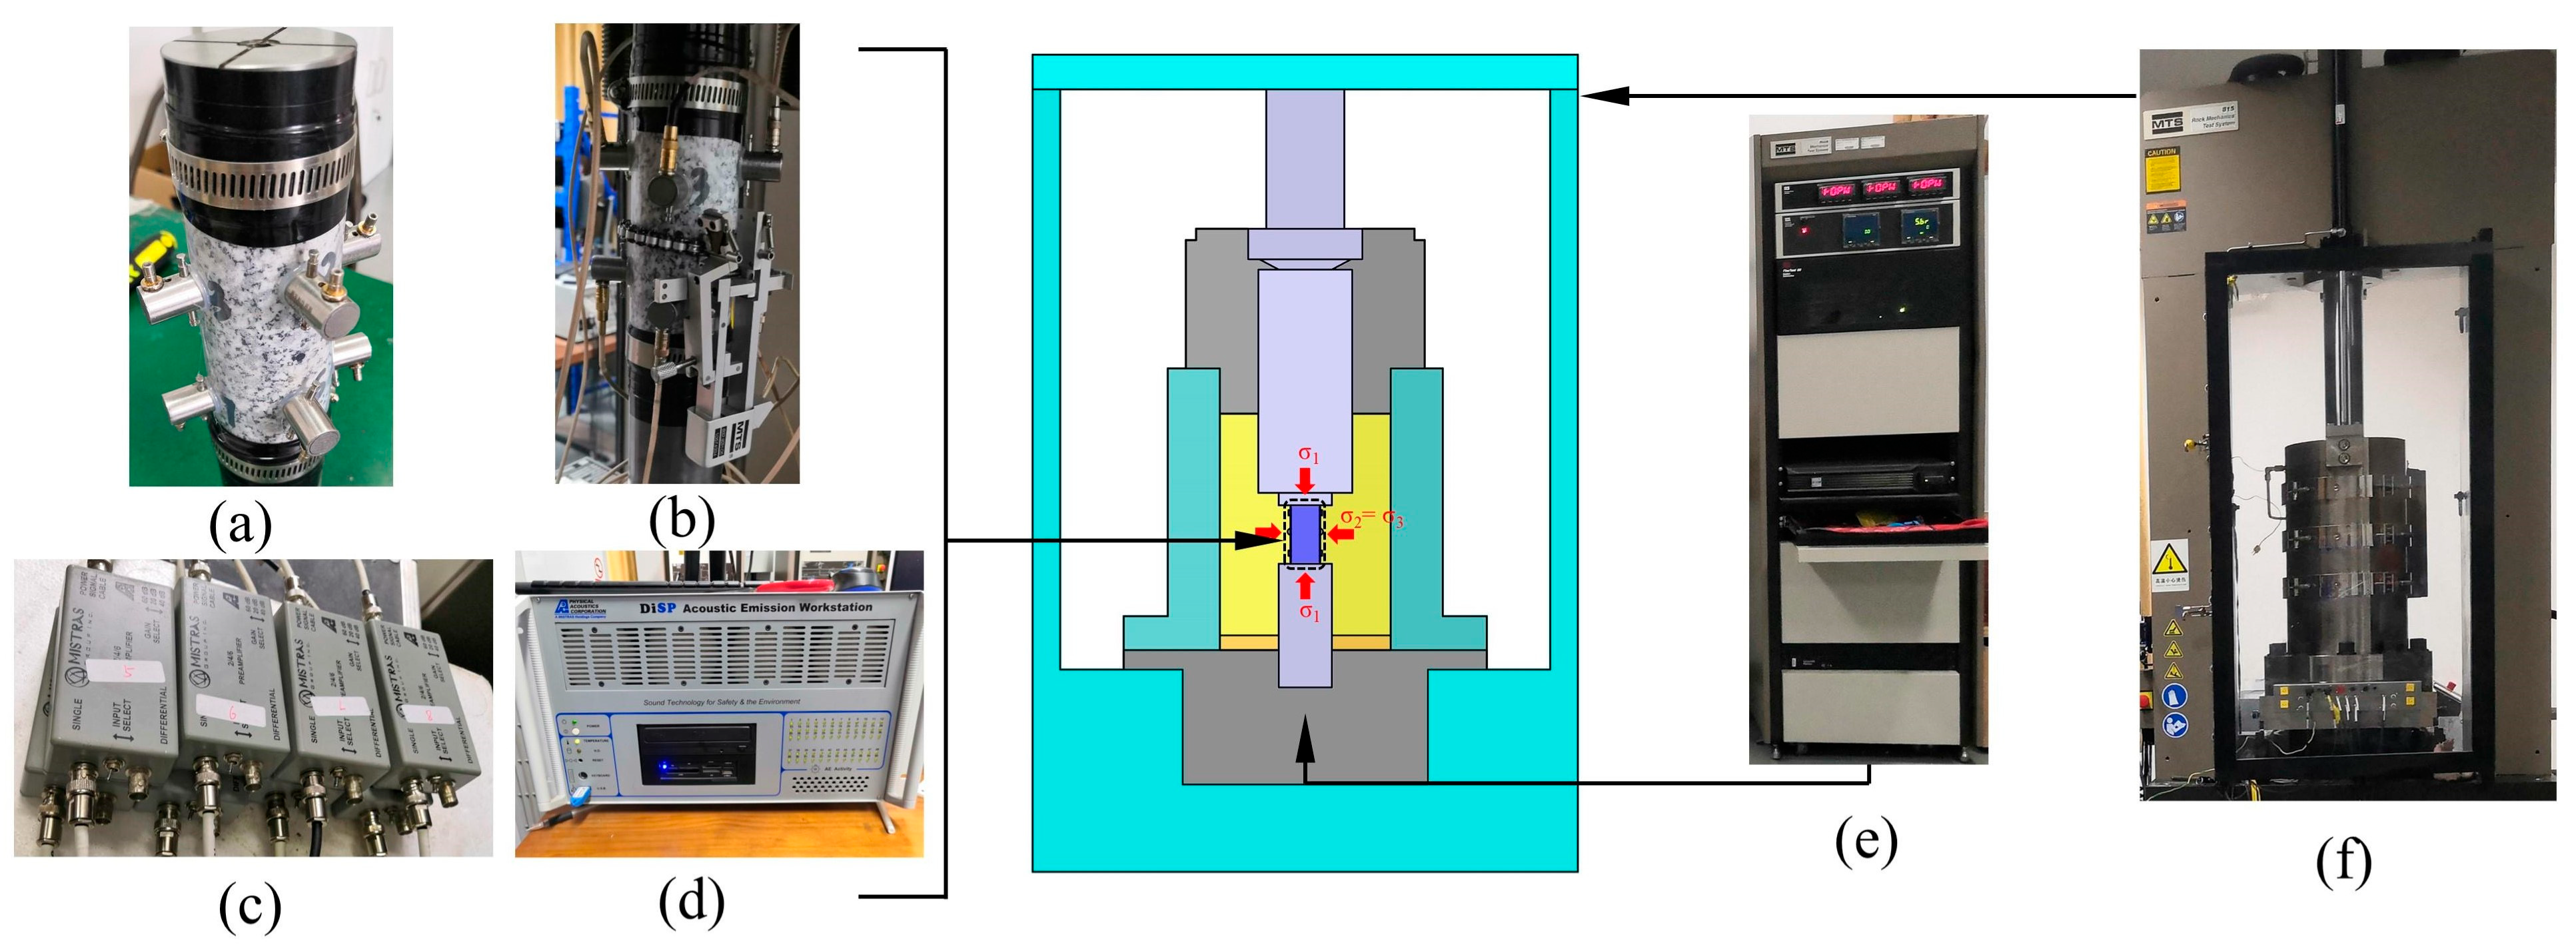
2.2. Testing System
2.3. Procedures for Testing
3. Experimental Results and Analysis
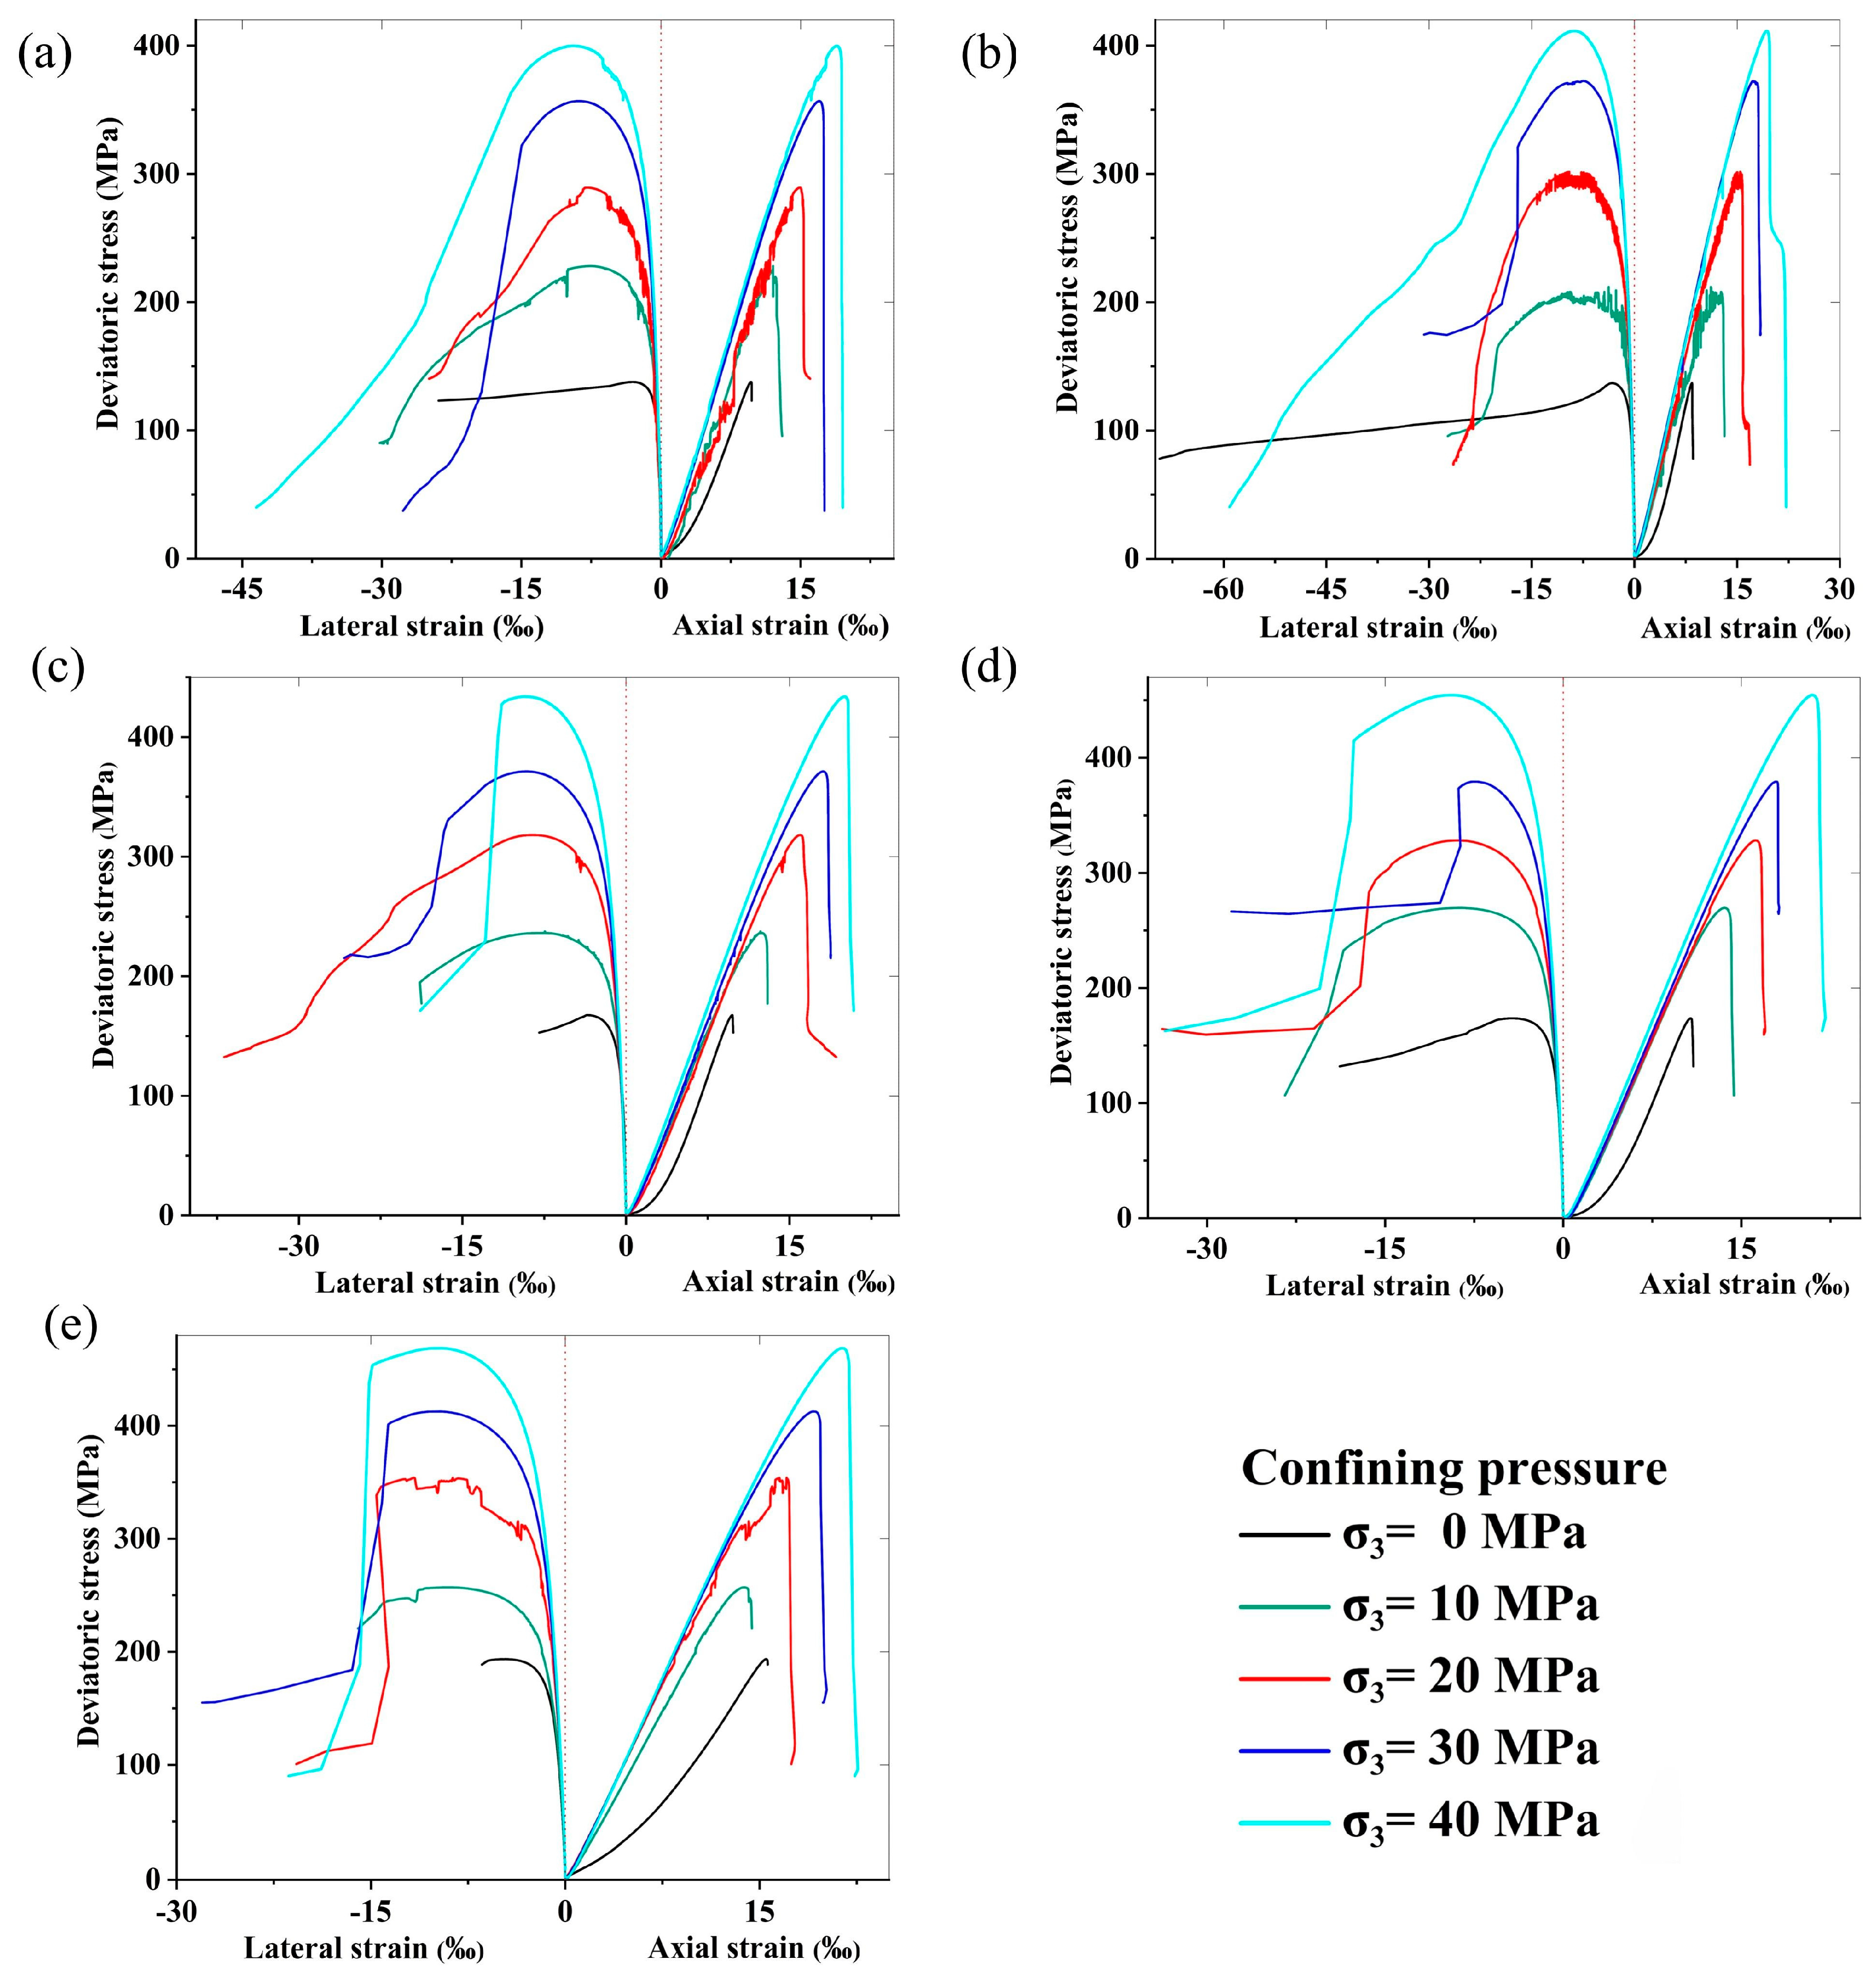
3.1. Stress–Strain Curves
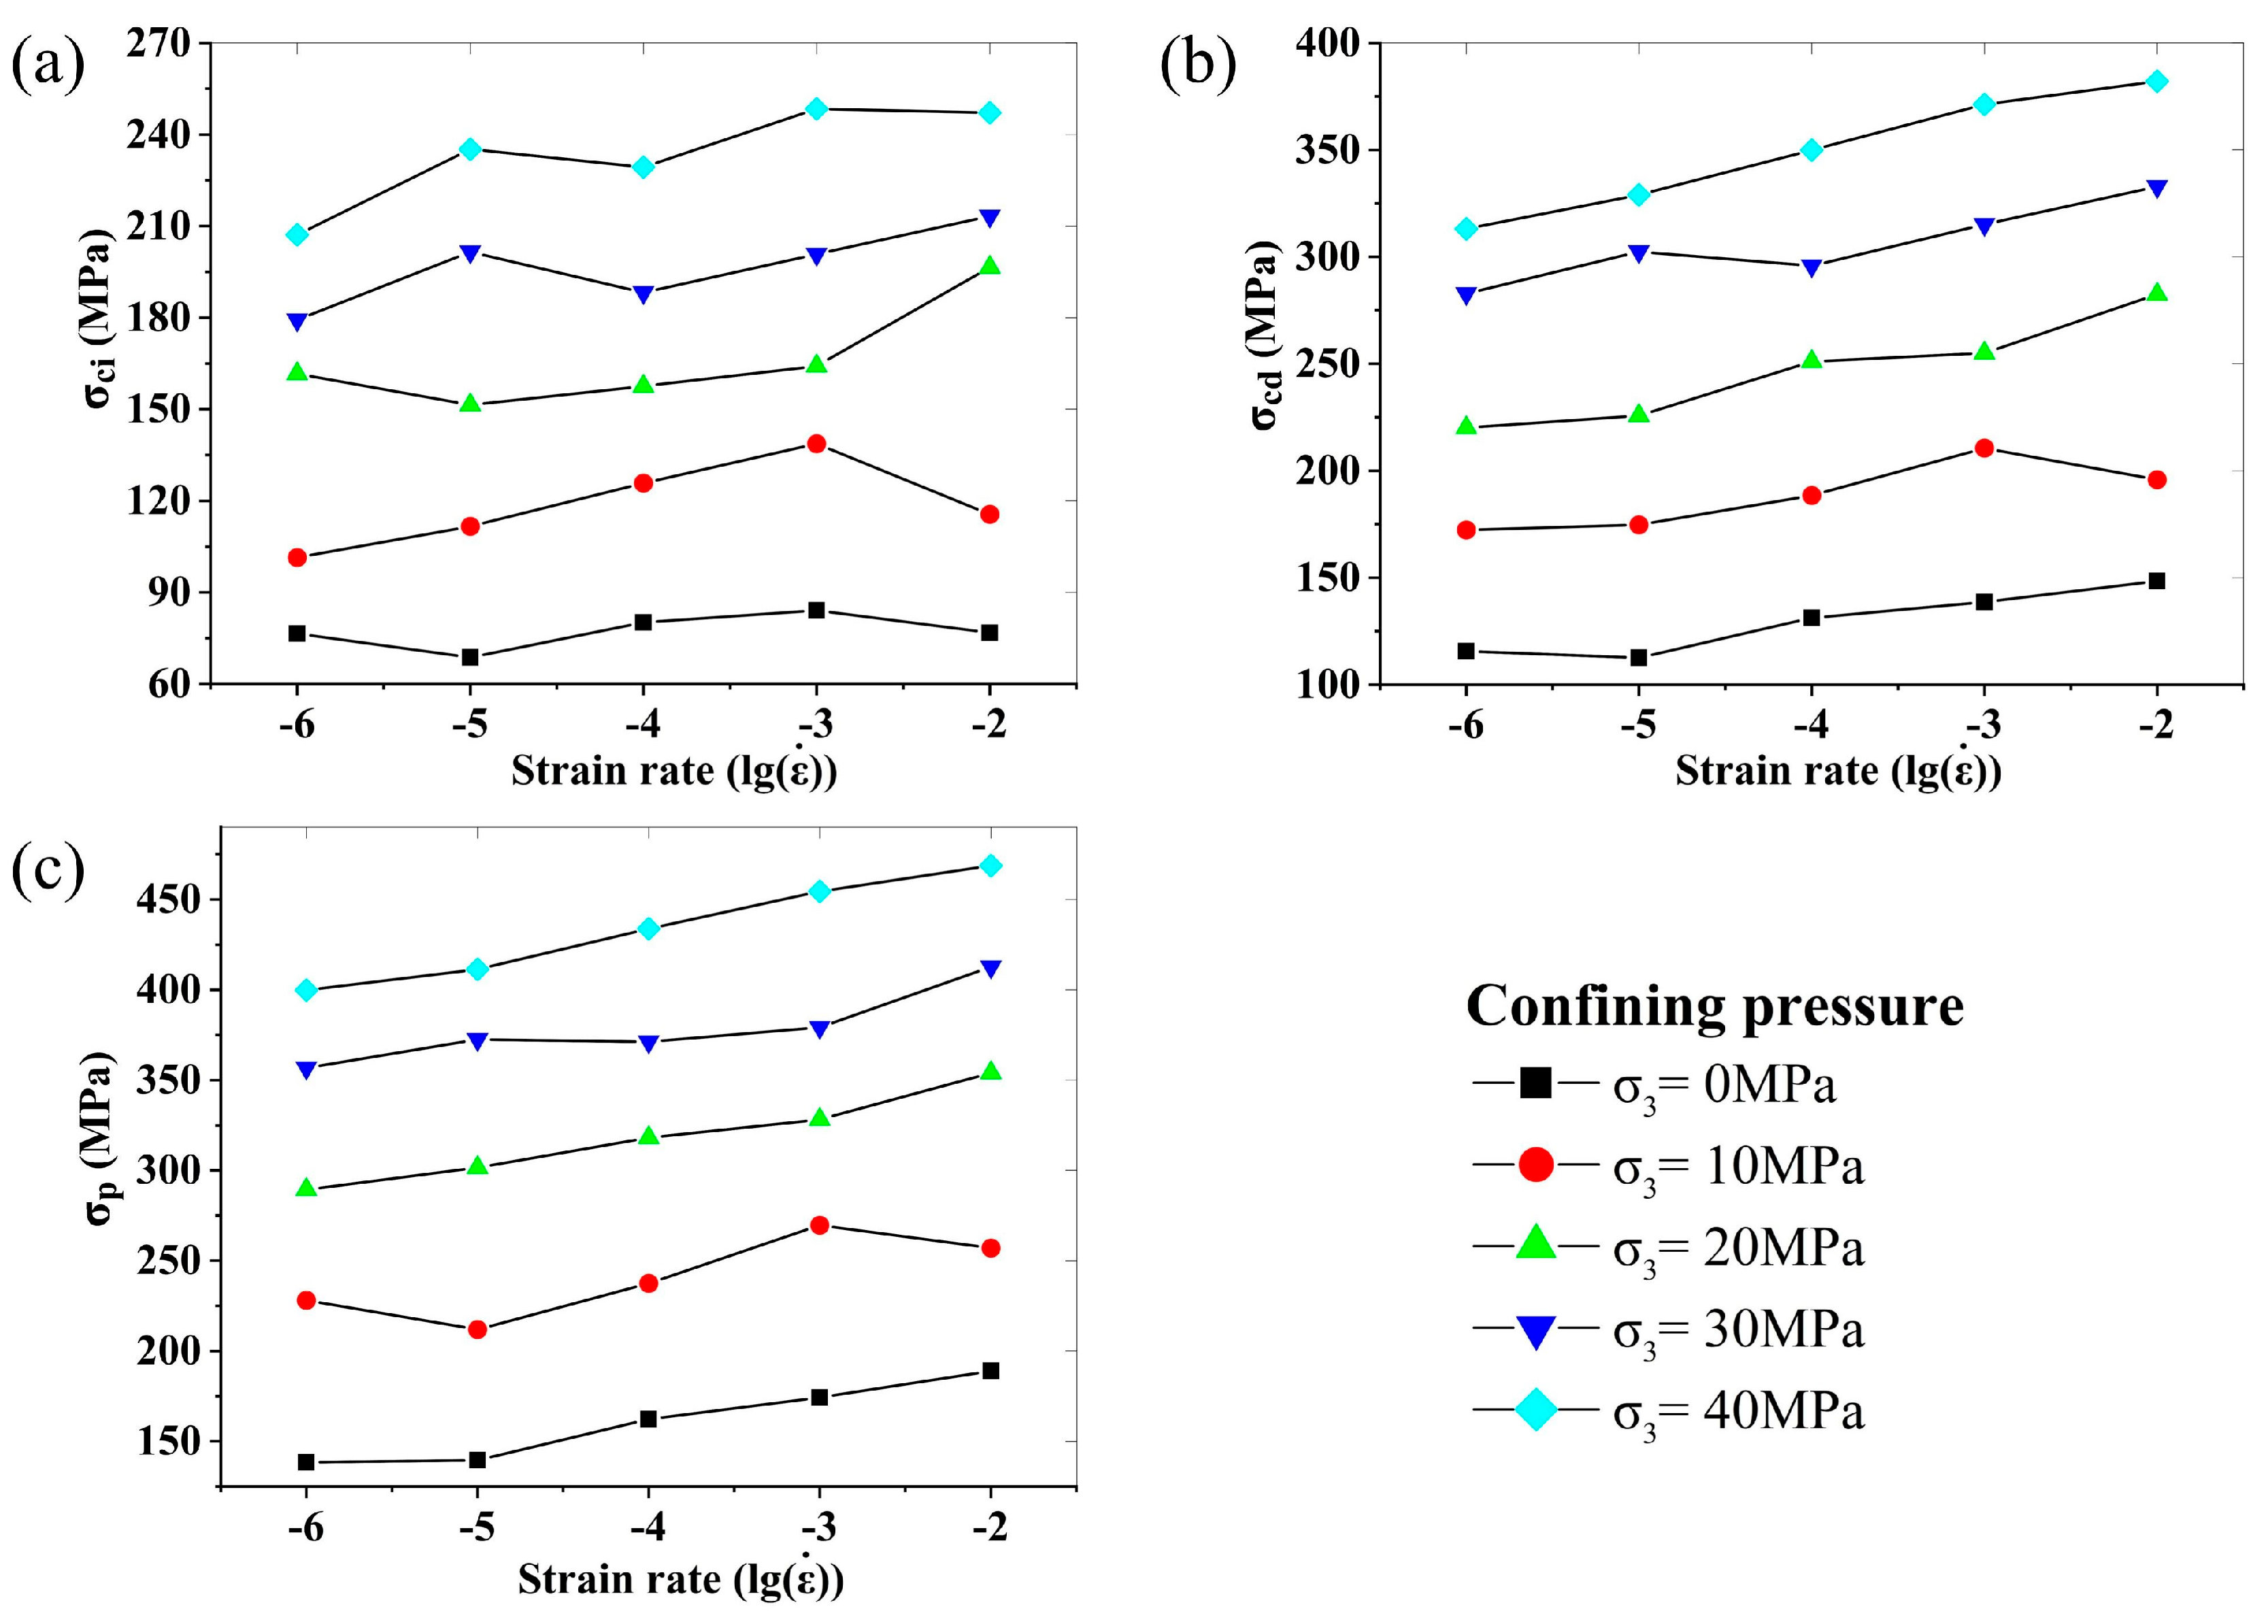
3.2. Strain Rate Effects on Characteristic Stresses
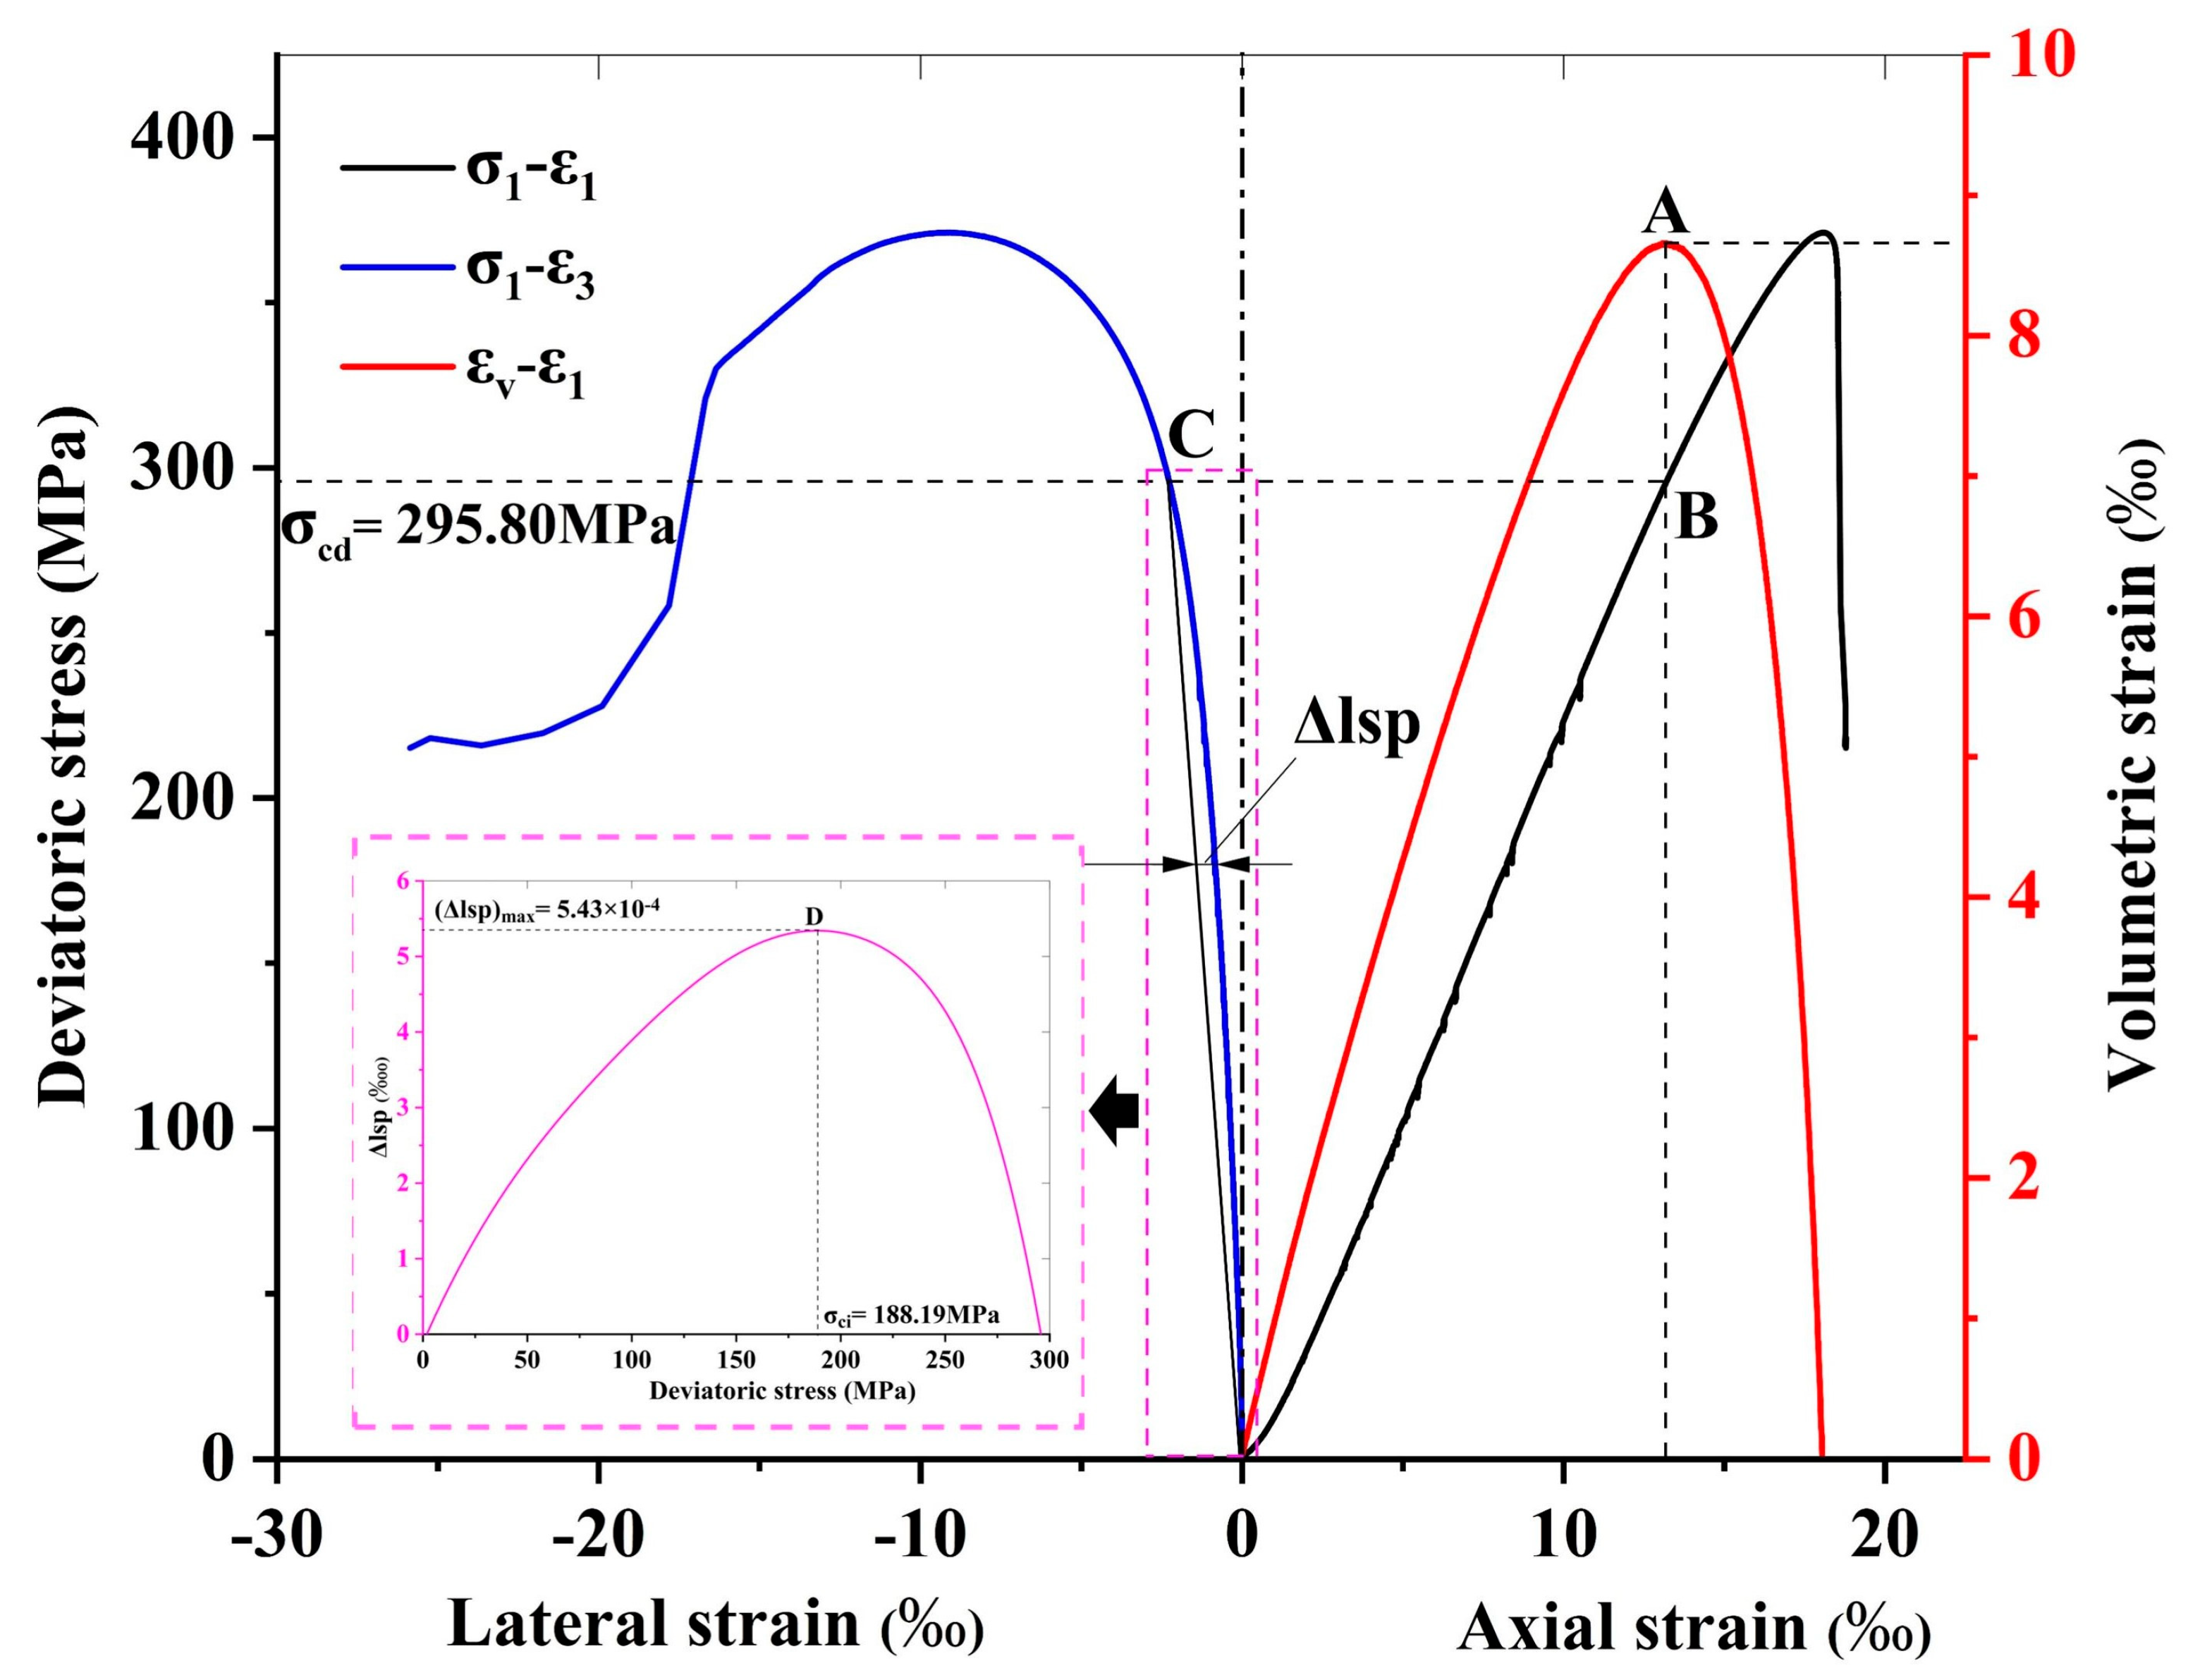
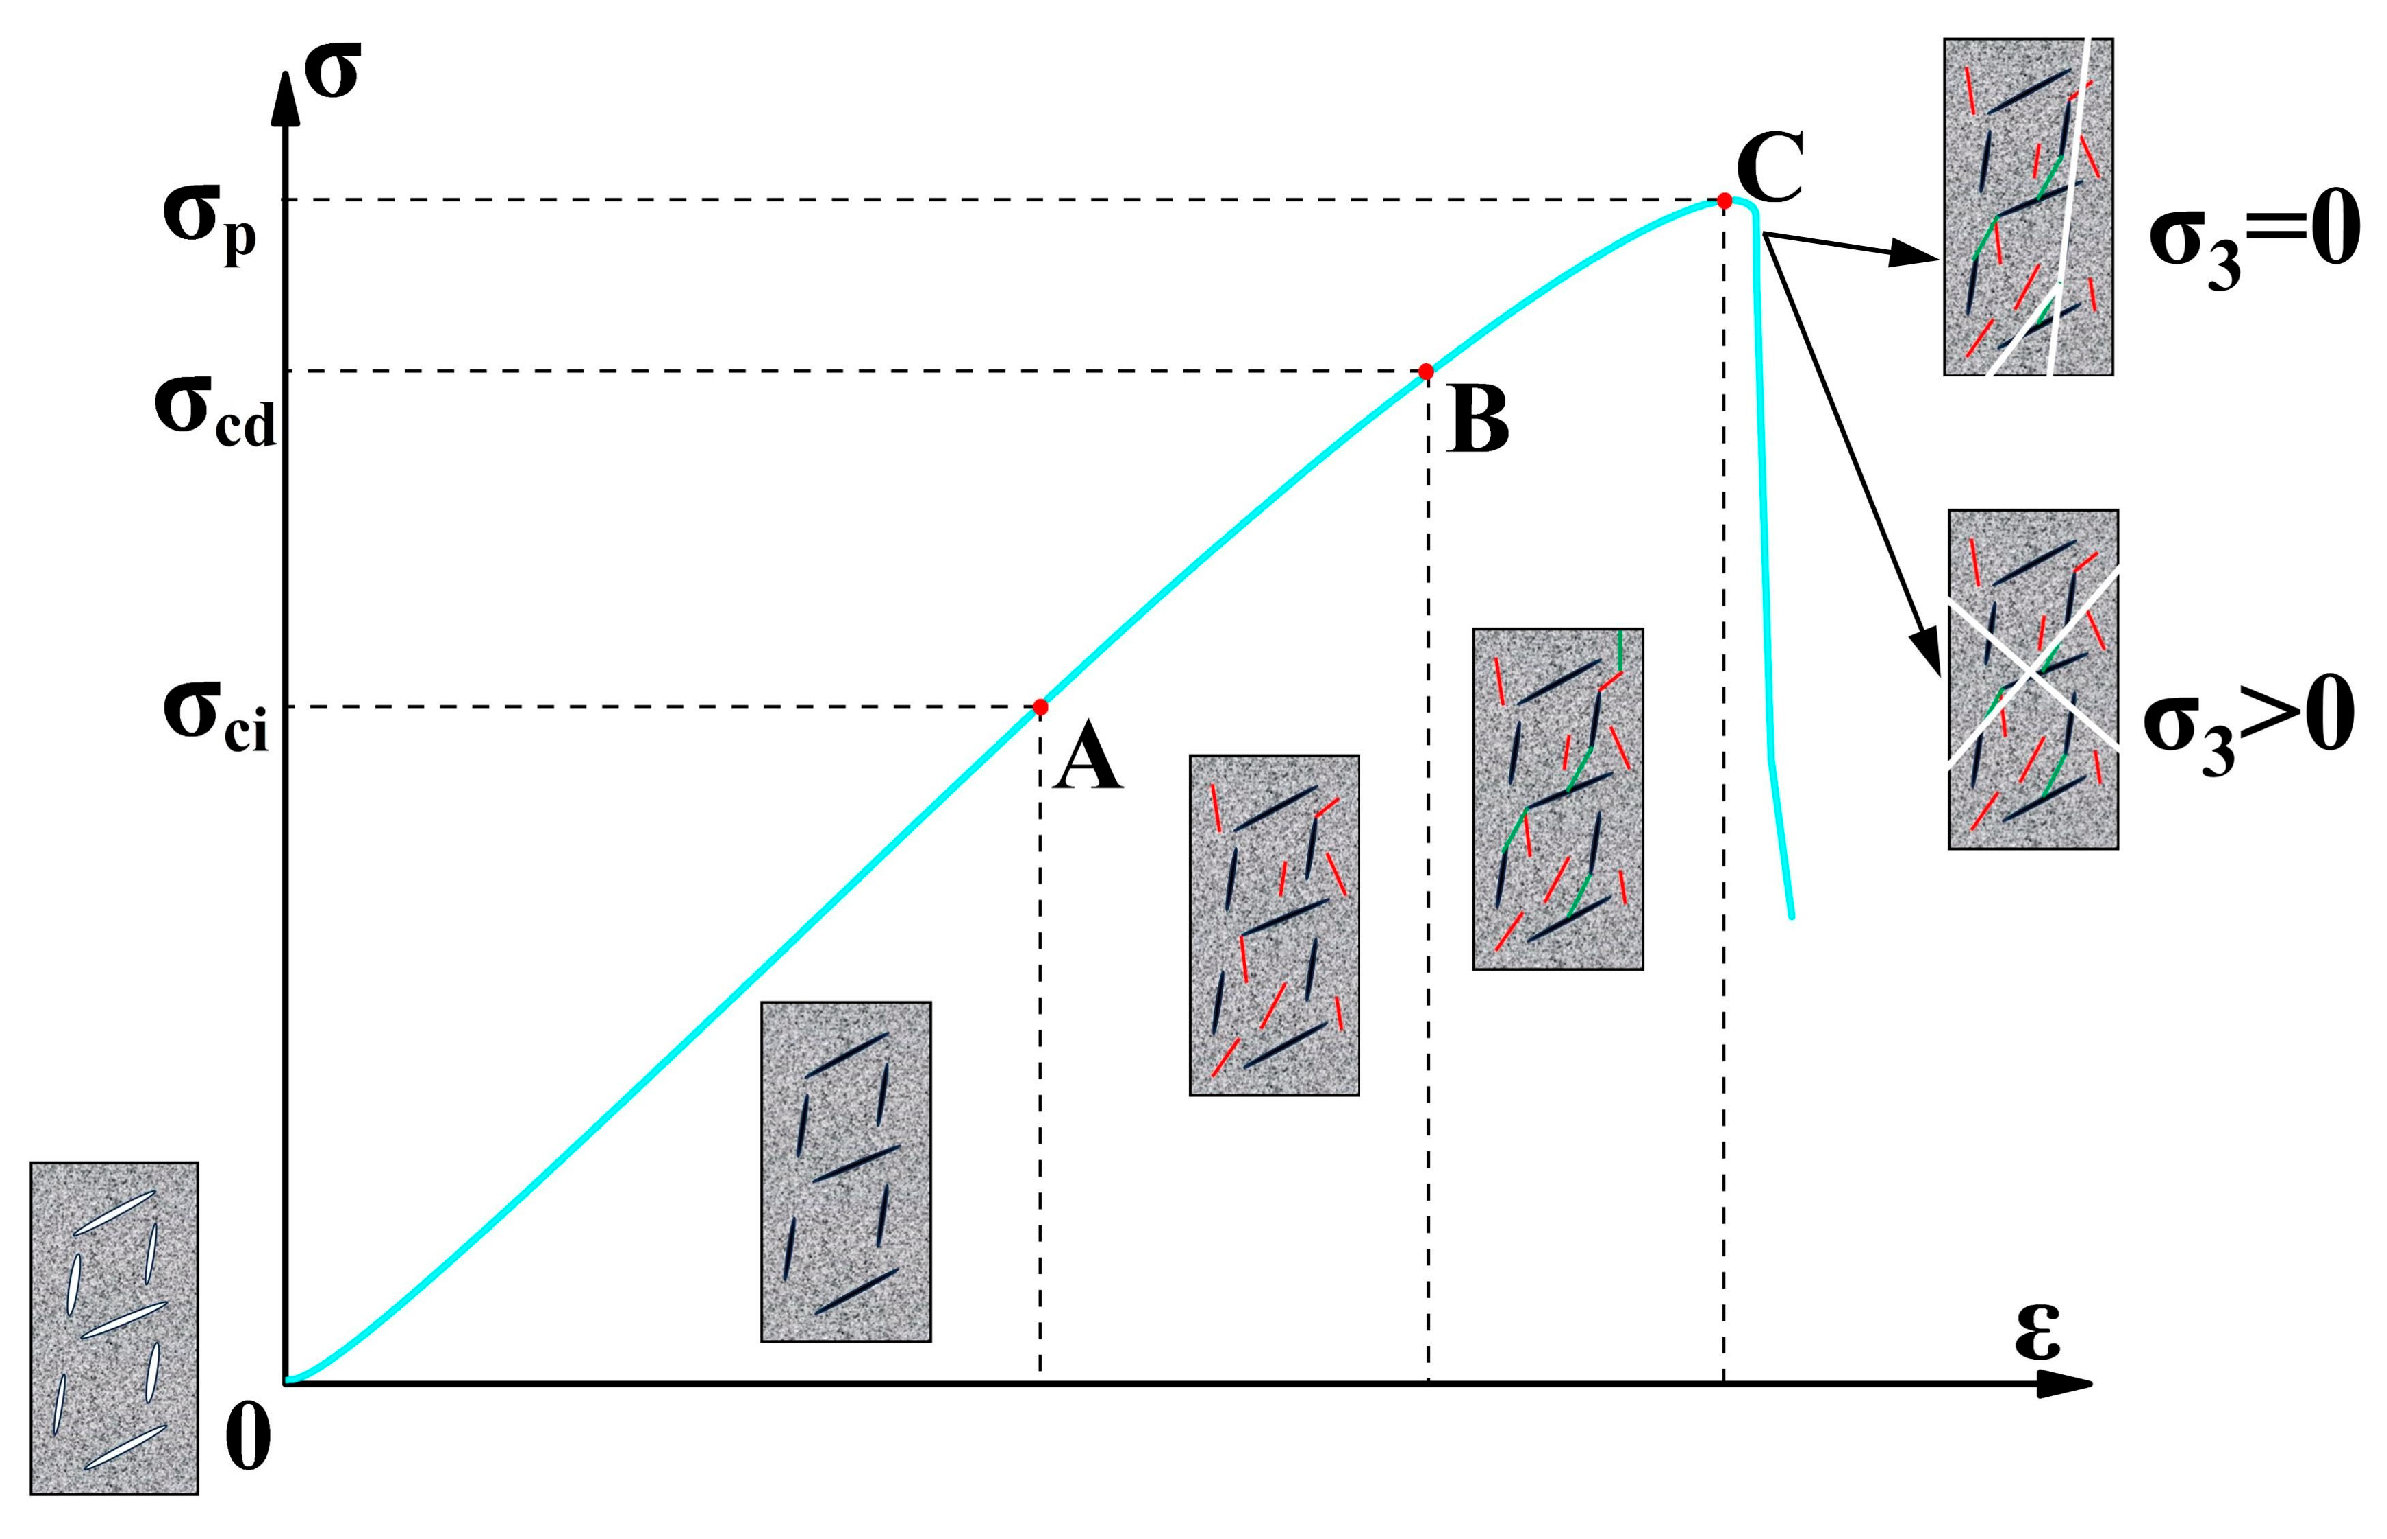
- The peak point of the axial stress–volumetric strain curve is the volumetric dilantancy point (point A in Figure 6), and the corresponding axial stress value is σcd;
- Assuring the point of σcd in the curve of the axial stress-–ateral strain and connecting it to the curve’s origin as the reference line, as shown in Figure 6;
- Drawing the curve based on the difference value between the curve of axial stress–lateral strain and the reference line, and the peak point of this curve corresponding to the axial stress is σci, as shown in Figure 6.
3.3. Macro-Fracture Patterns
3.4. Dynamic Strength Criterion
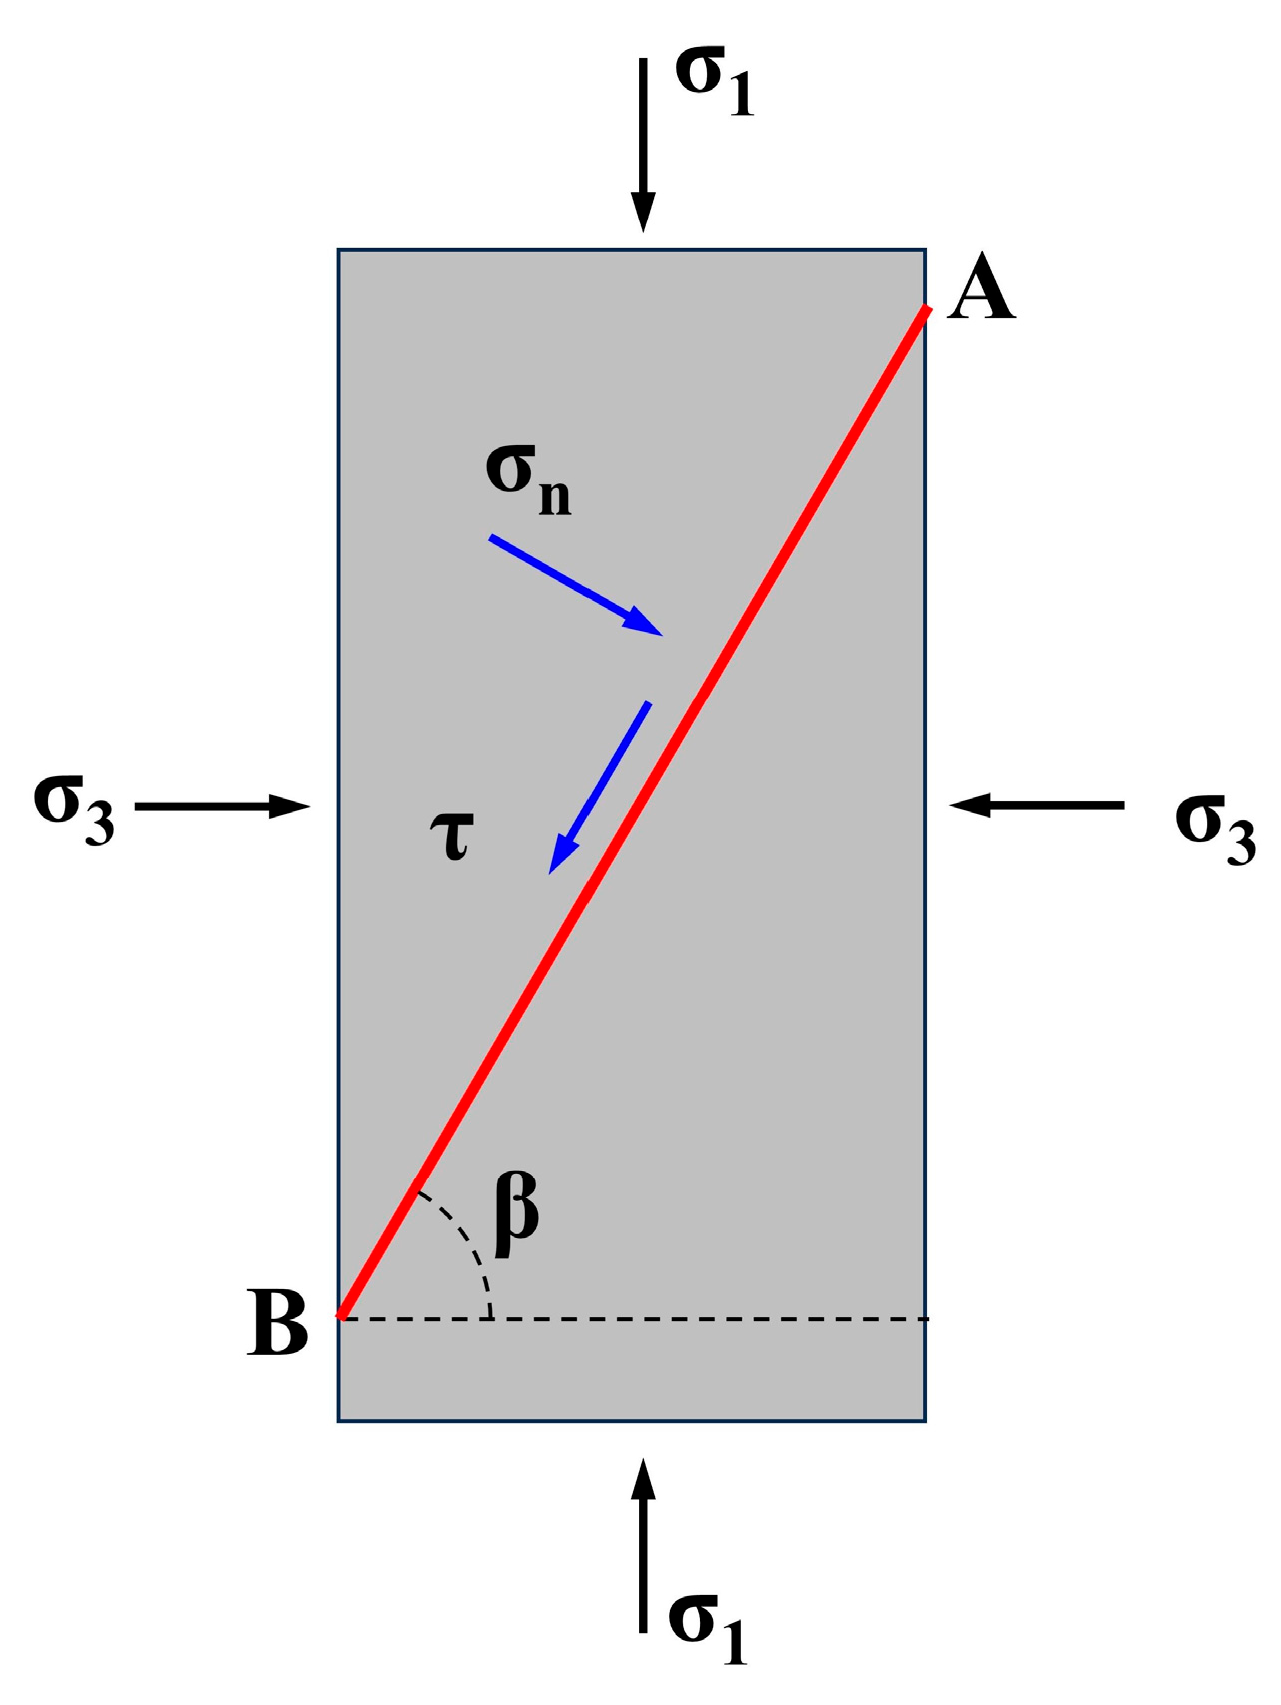
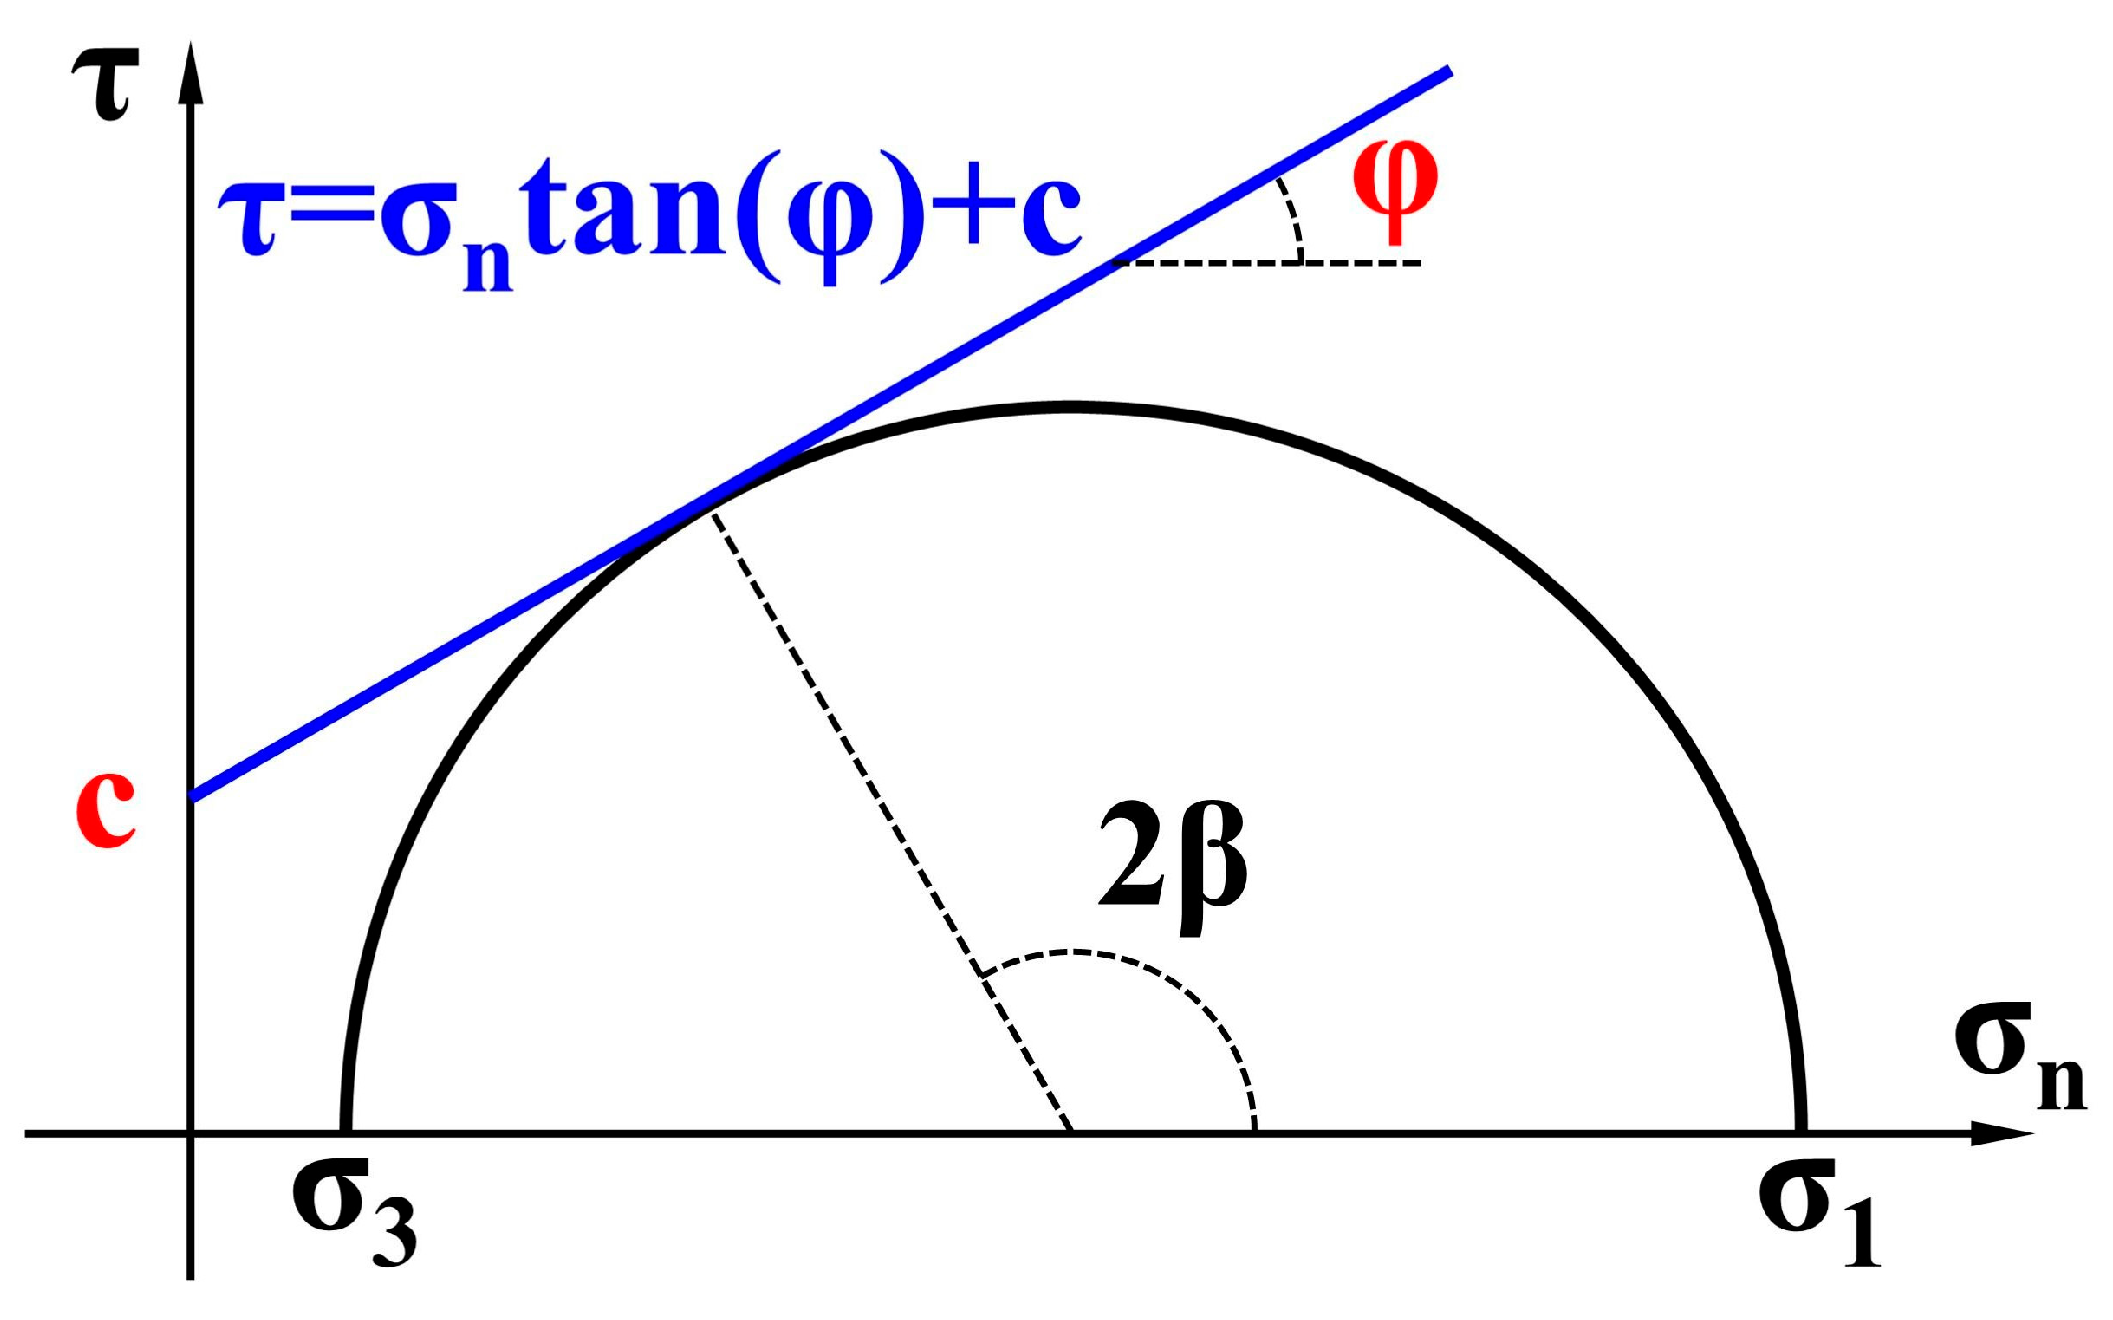
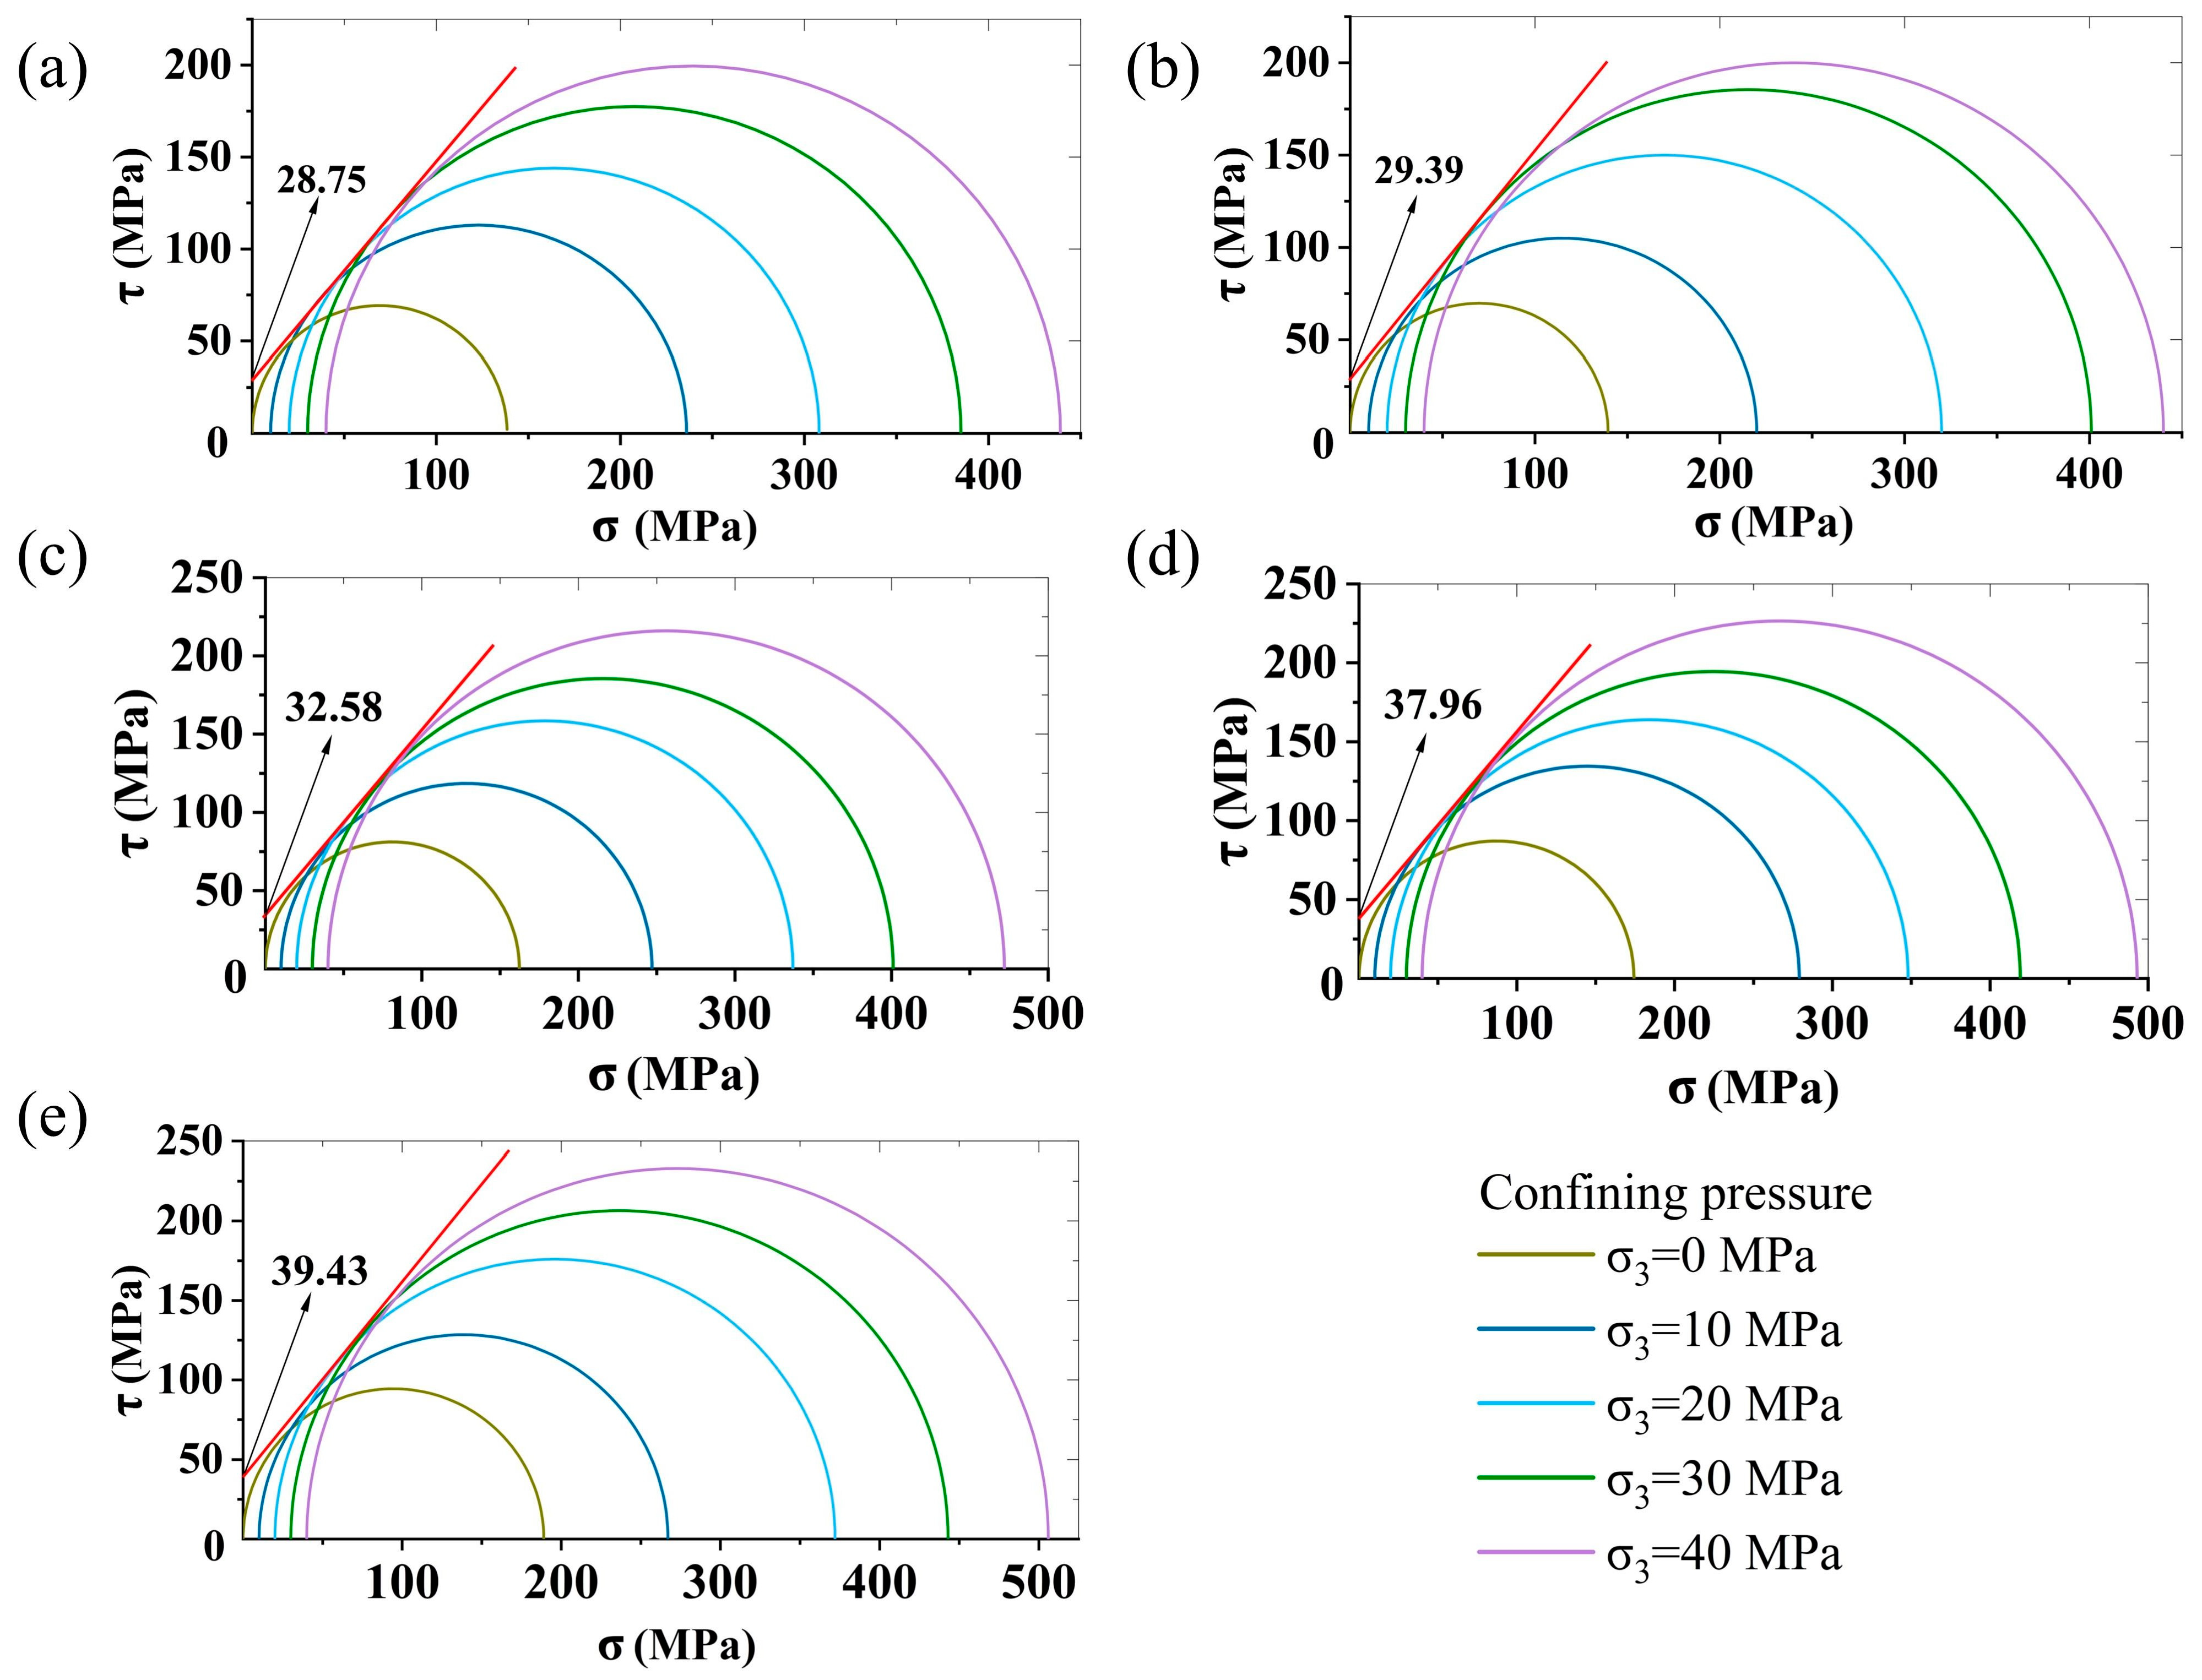
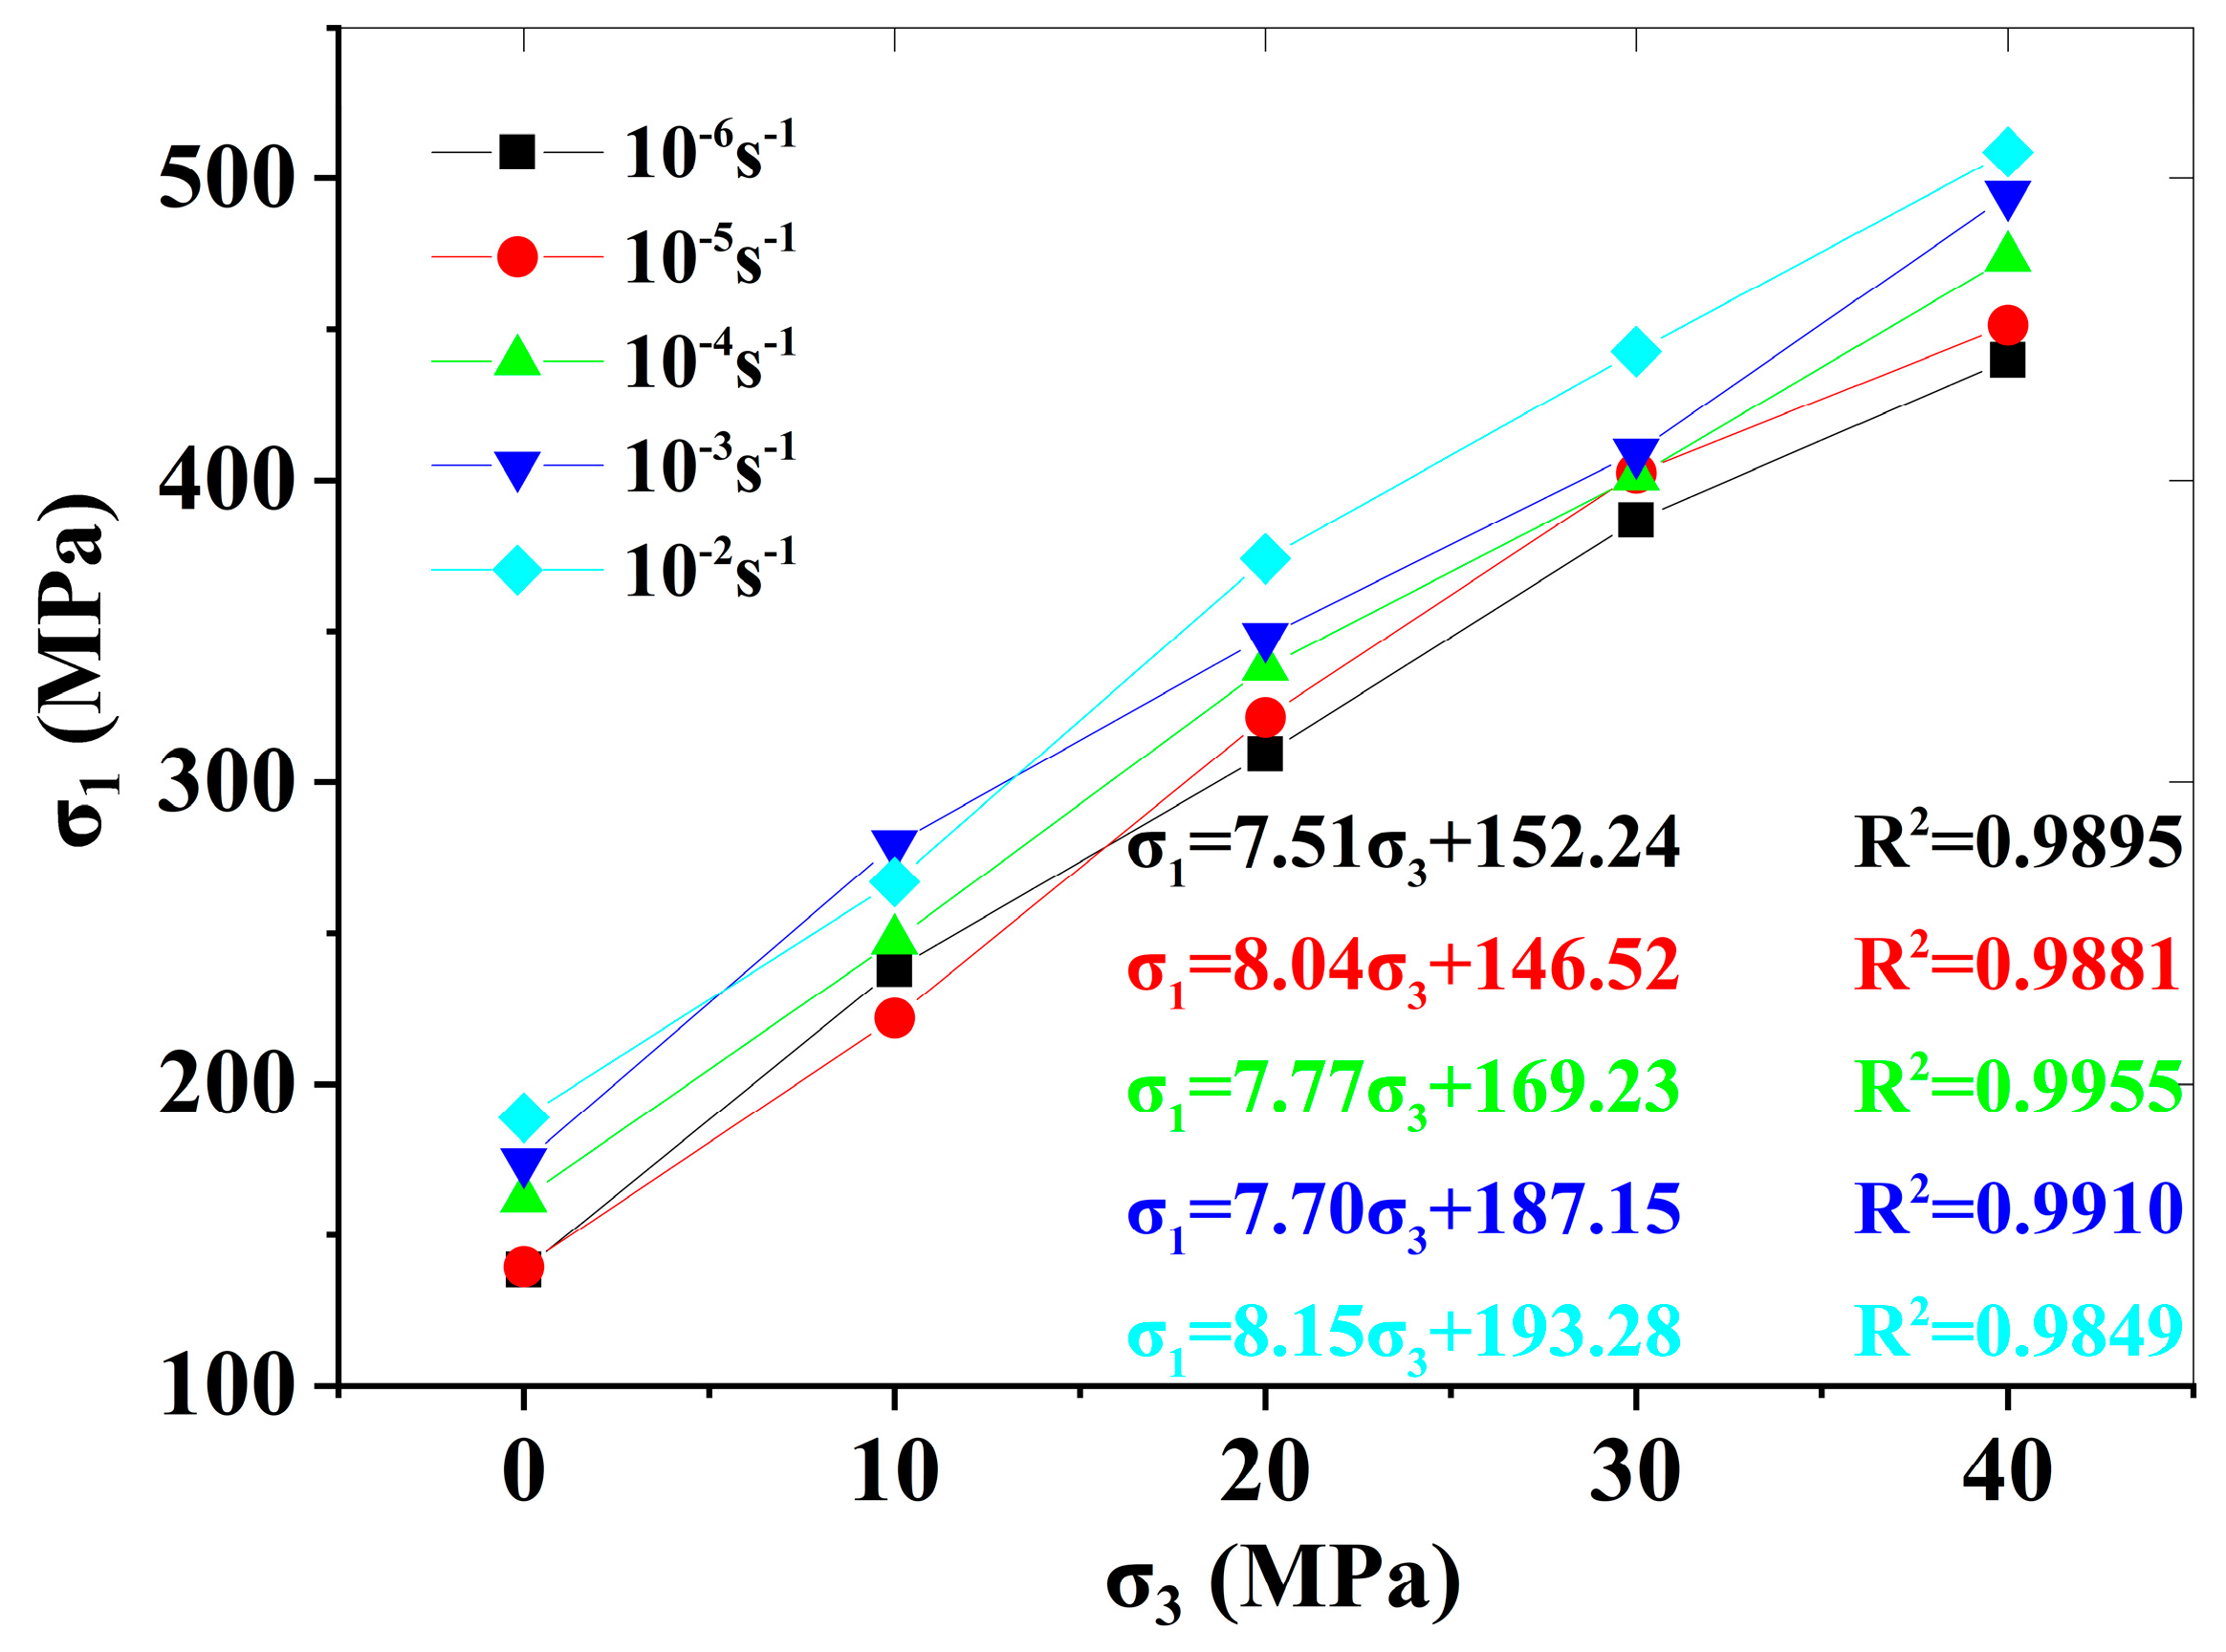
3.4.1. Mohr–Coulomb Strength Criterion
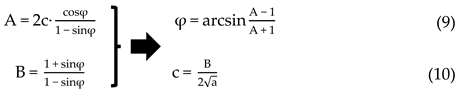
3.4.2. Dynamic Mohr–Coulomb Strength Criterion
4. Discussion
5. Conclusions
- (1)
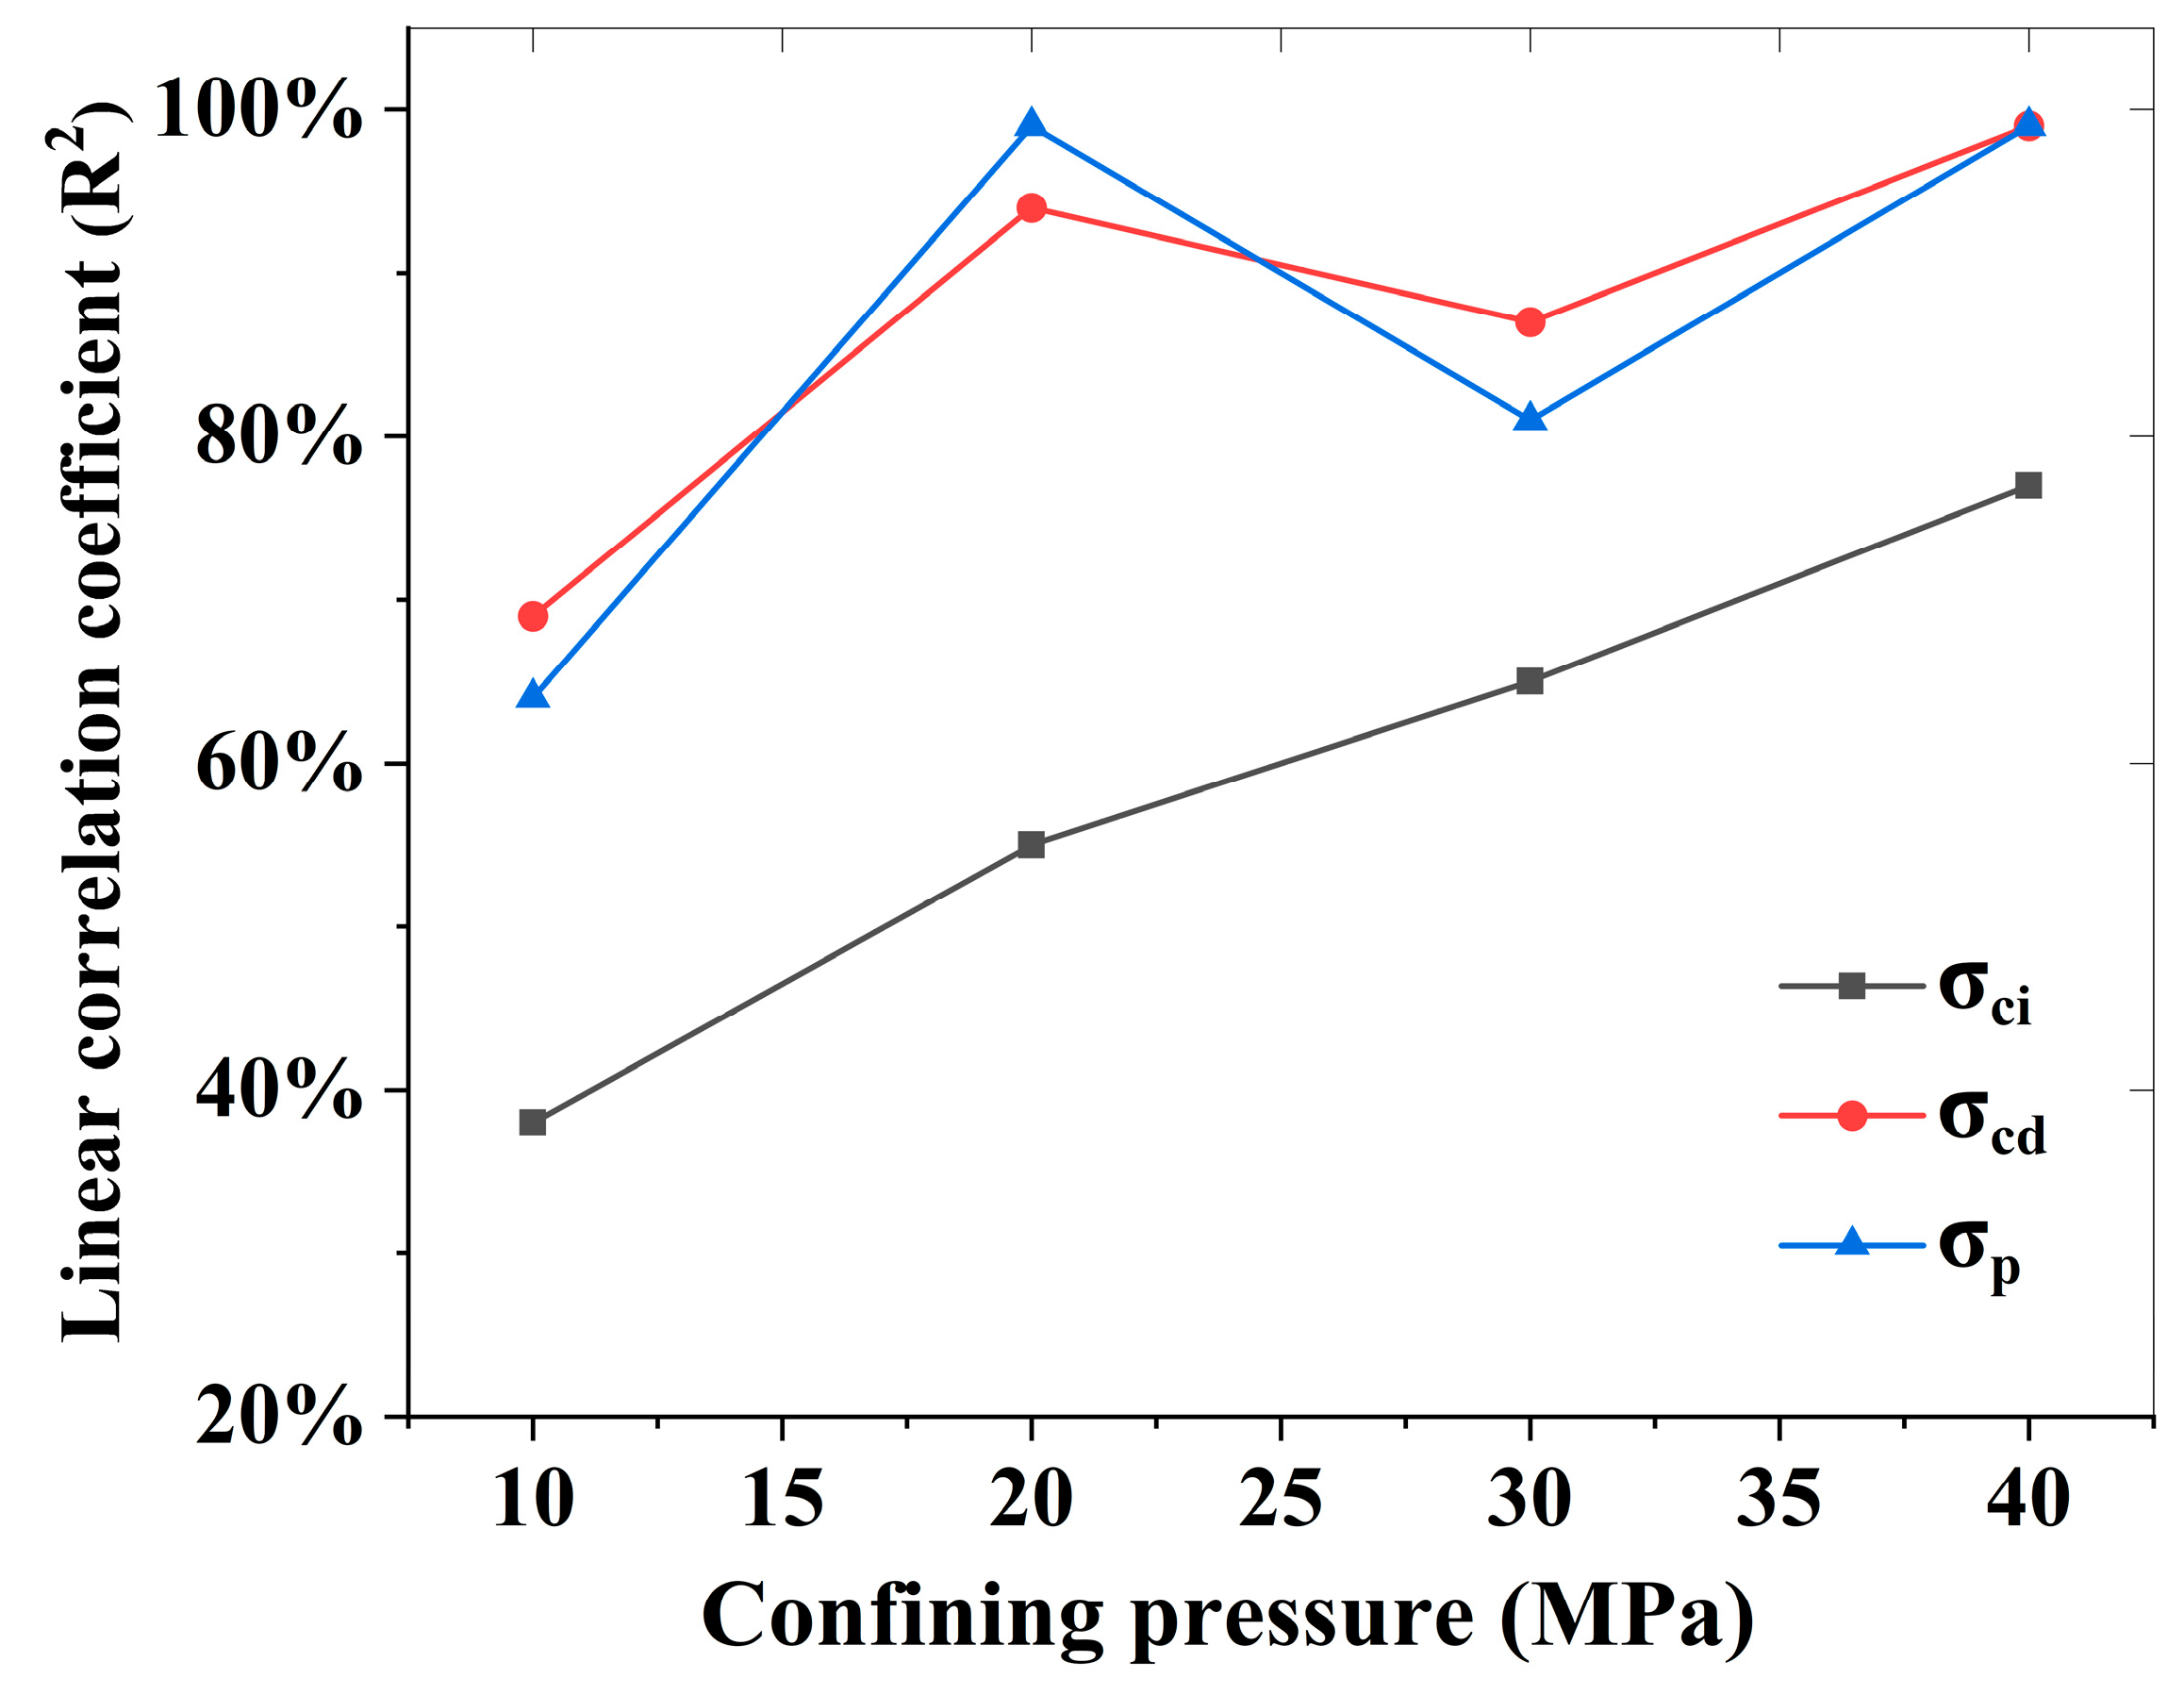
- Under varying confining pressures, characteristic stresses of granite exhibit positive correlations with the logarithm of strain rate and confining pressure. Specifically, σcd and σp demonstrate significant linear positive correlations with the strain rate logarithm, while σci shows a relatively weaker correlation.
- (2)
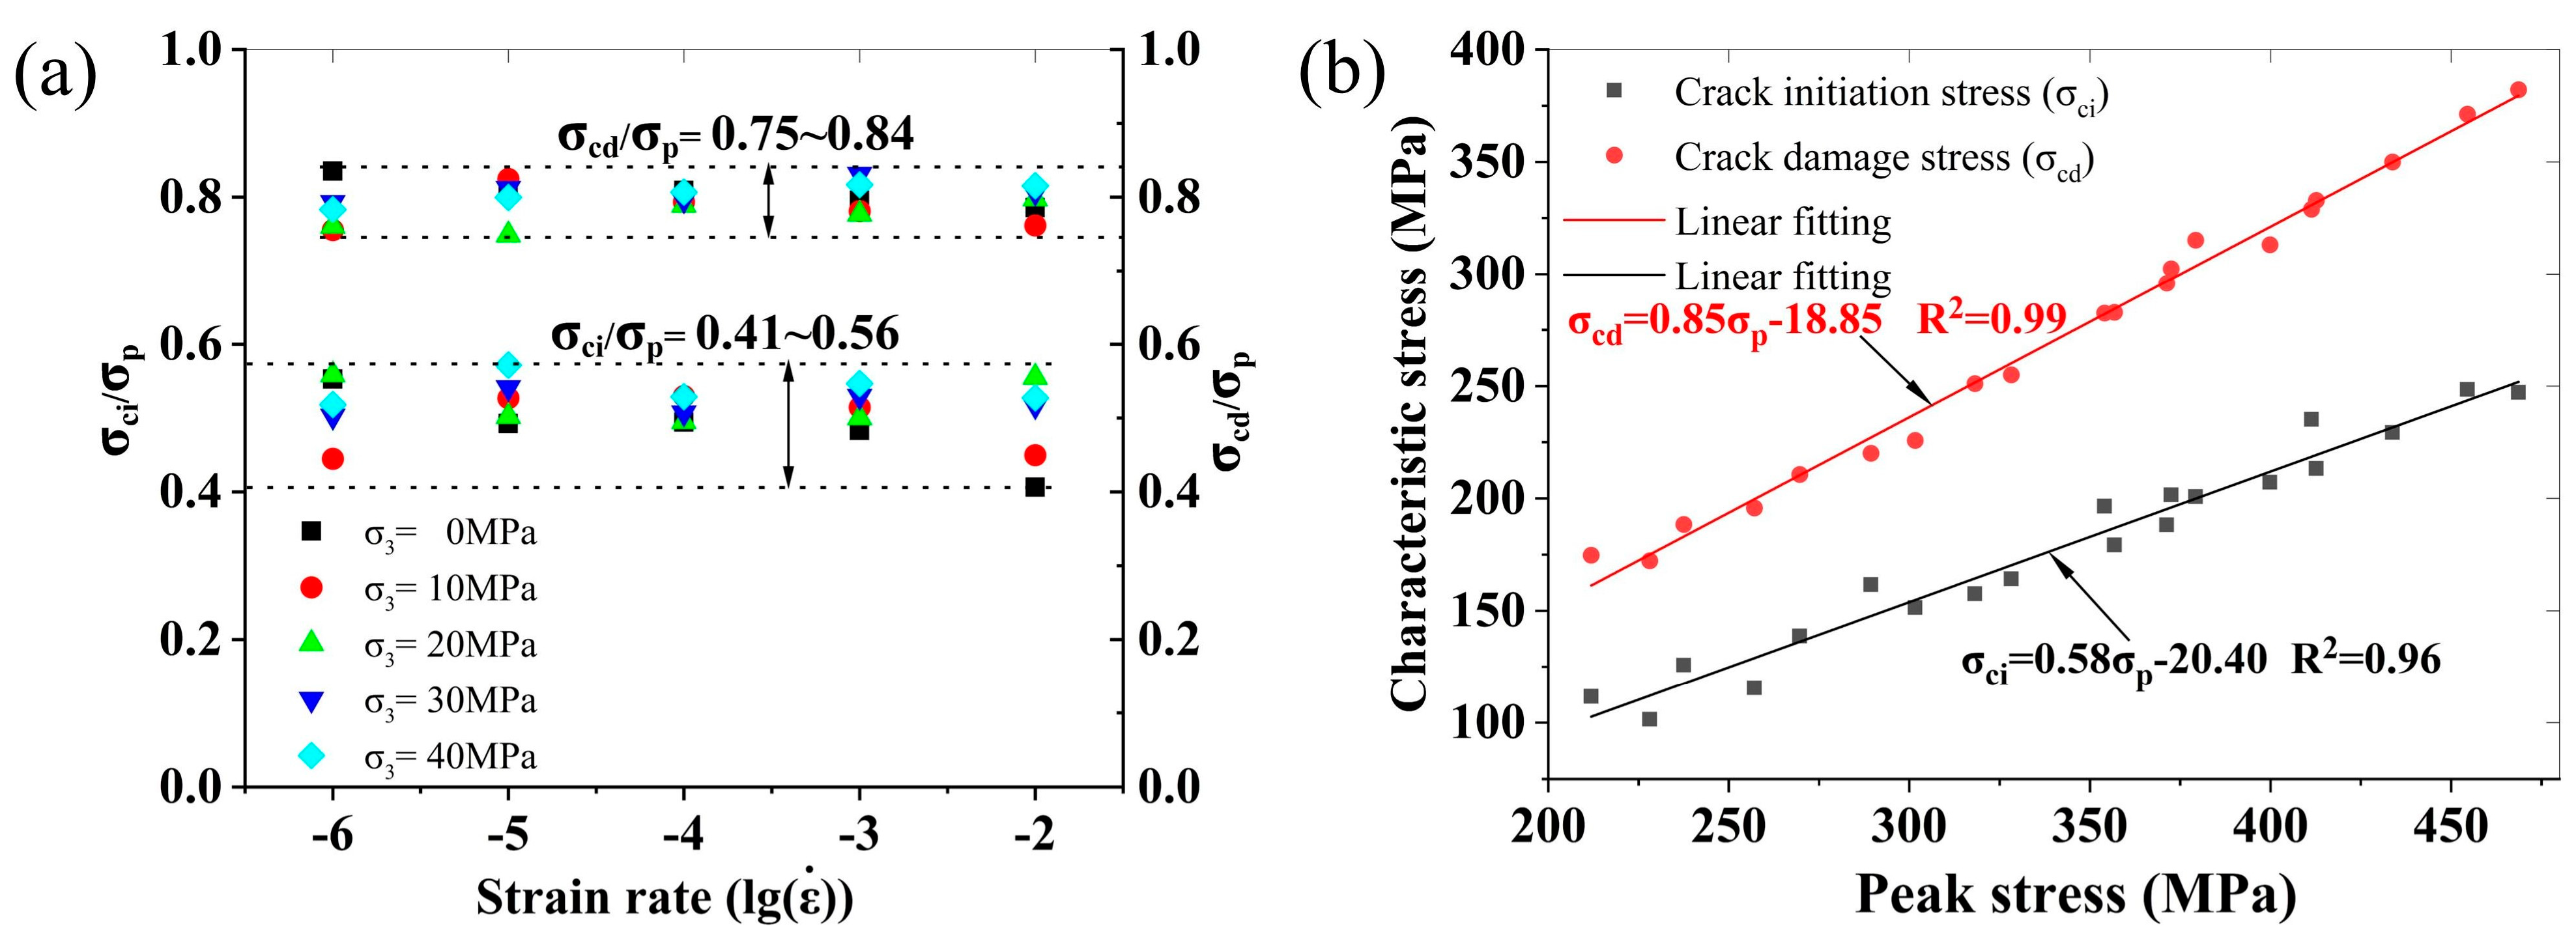
- Under triaxial quasi-static loading conditions, the value of σci/σp ranges from 0.41 to 0.56, and the value of σcd/σp ranges from 0.75 to 0.84. Linear regression analysis demonstrates strong linear correlations between σci/σp and σcd/σp, expressed as σci = 0.58σp and σcd = 0.85σp.
- (3)
- Macroscopic fracture patterns of granite are controlled by the confining pressure and strain rate: Y-shaped shear fractures predominantly form under low confining pressures and strain rates. With increasing confining pressure and strain rate, fracture patterns progressively transition to X-shaped shear-dominated failures.
- (4)
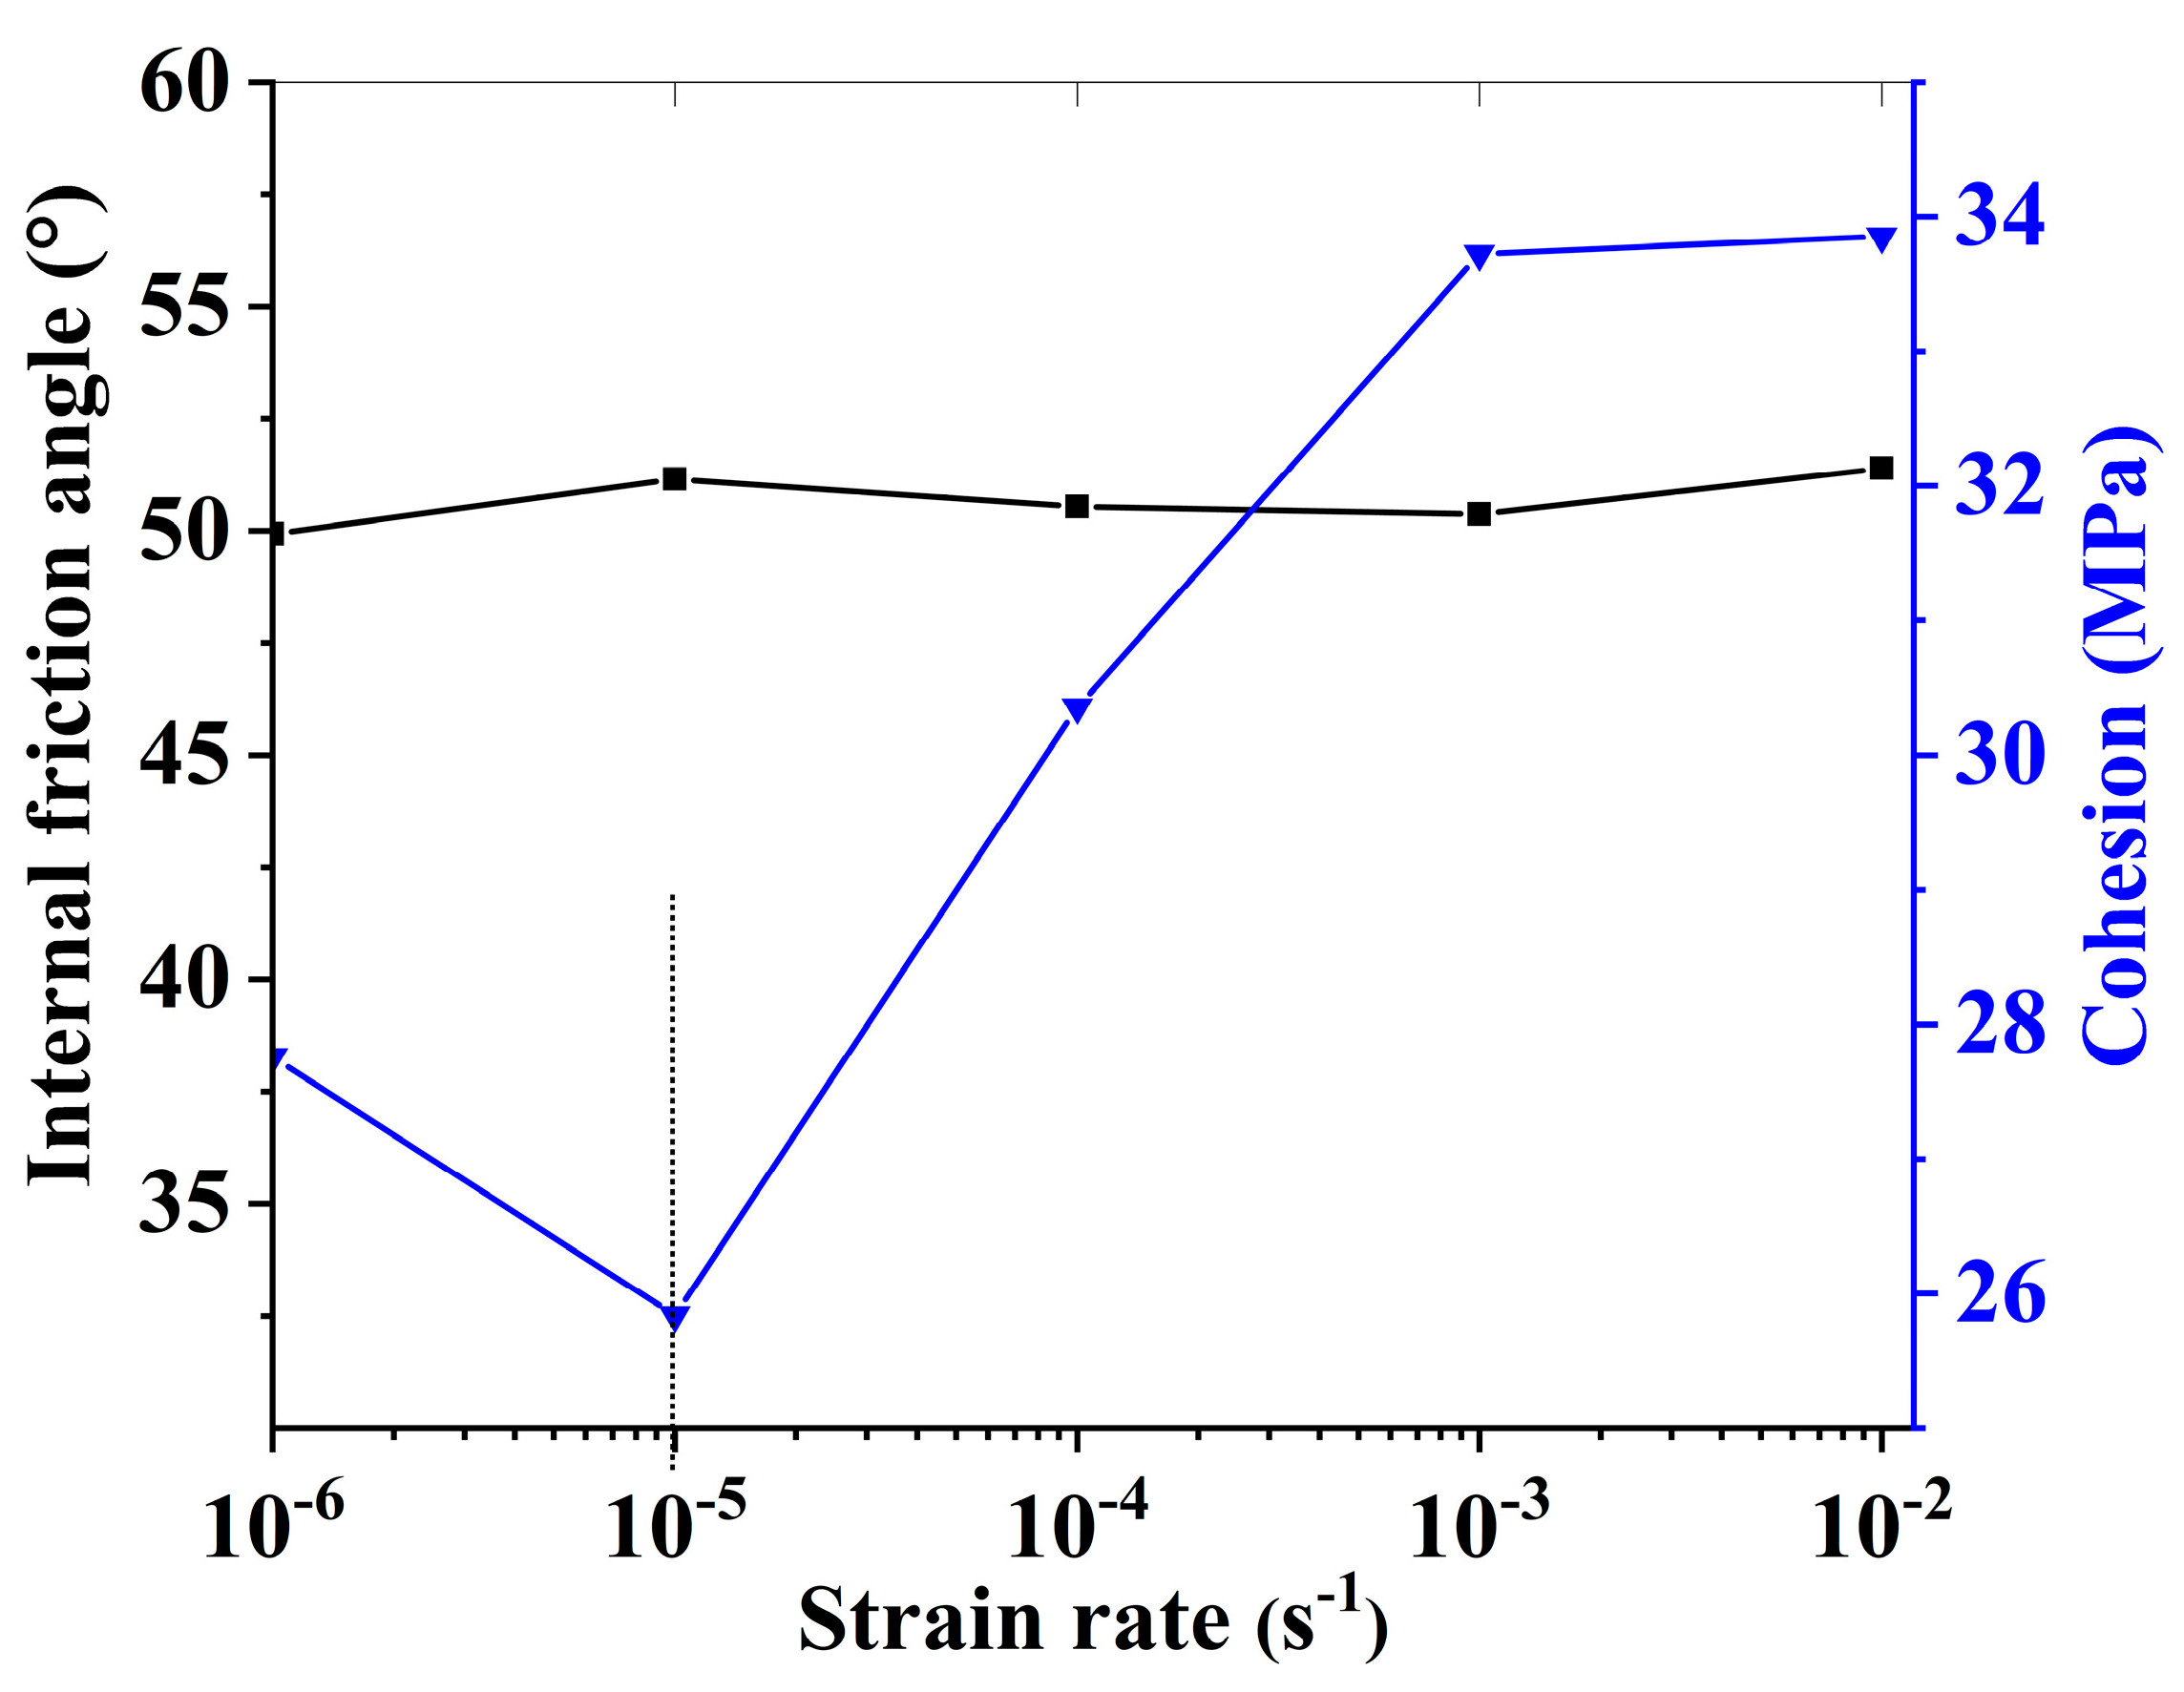
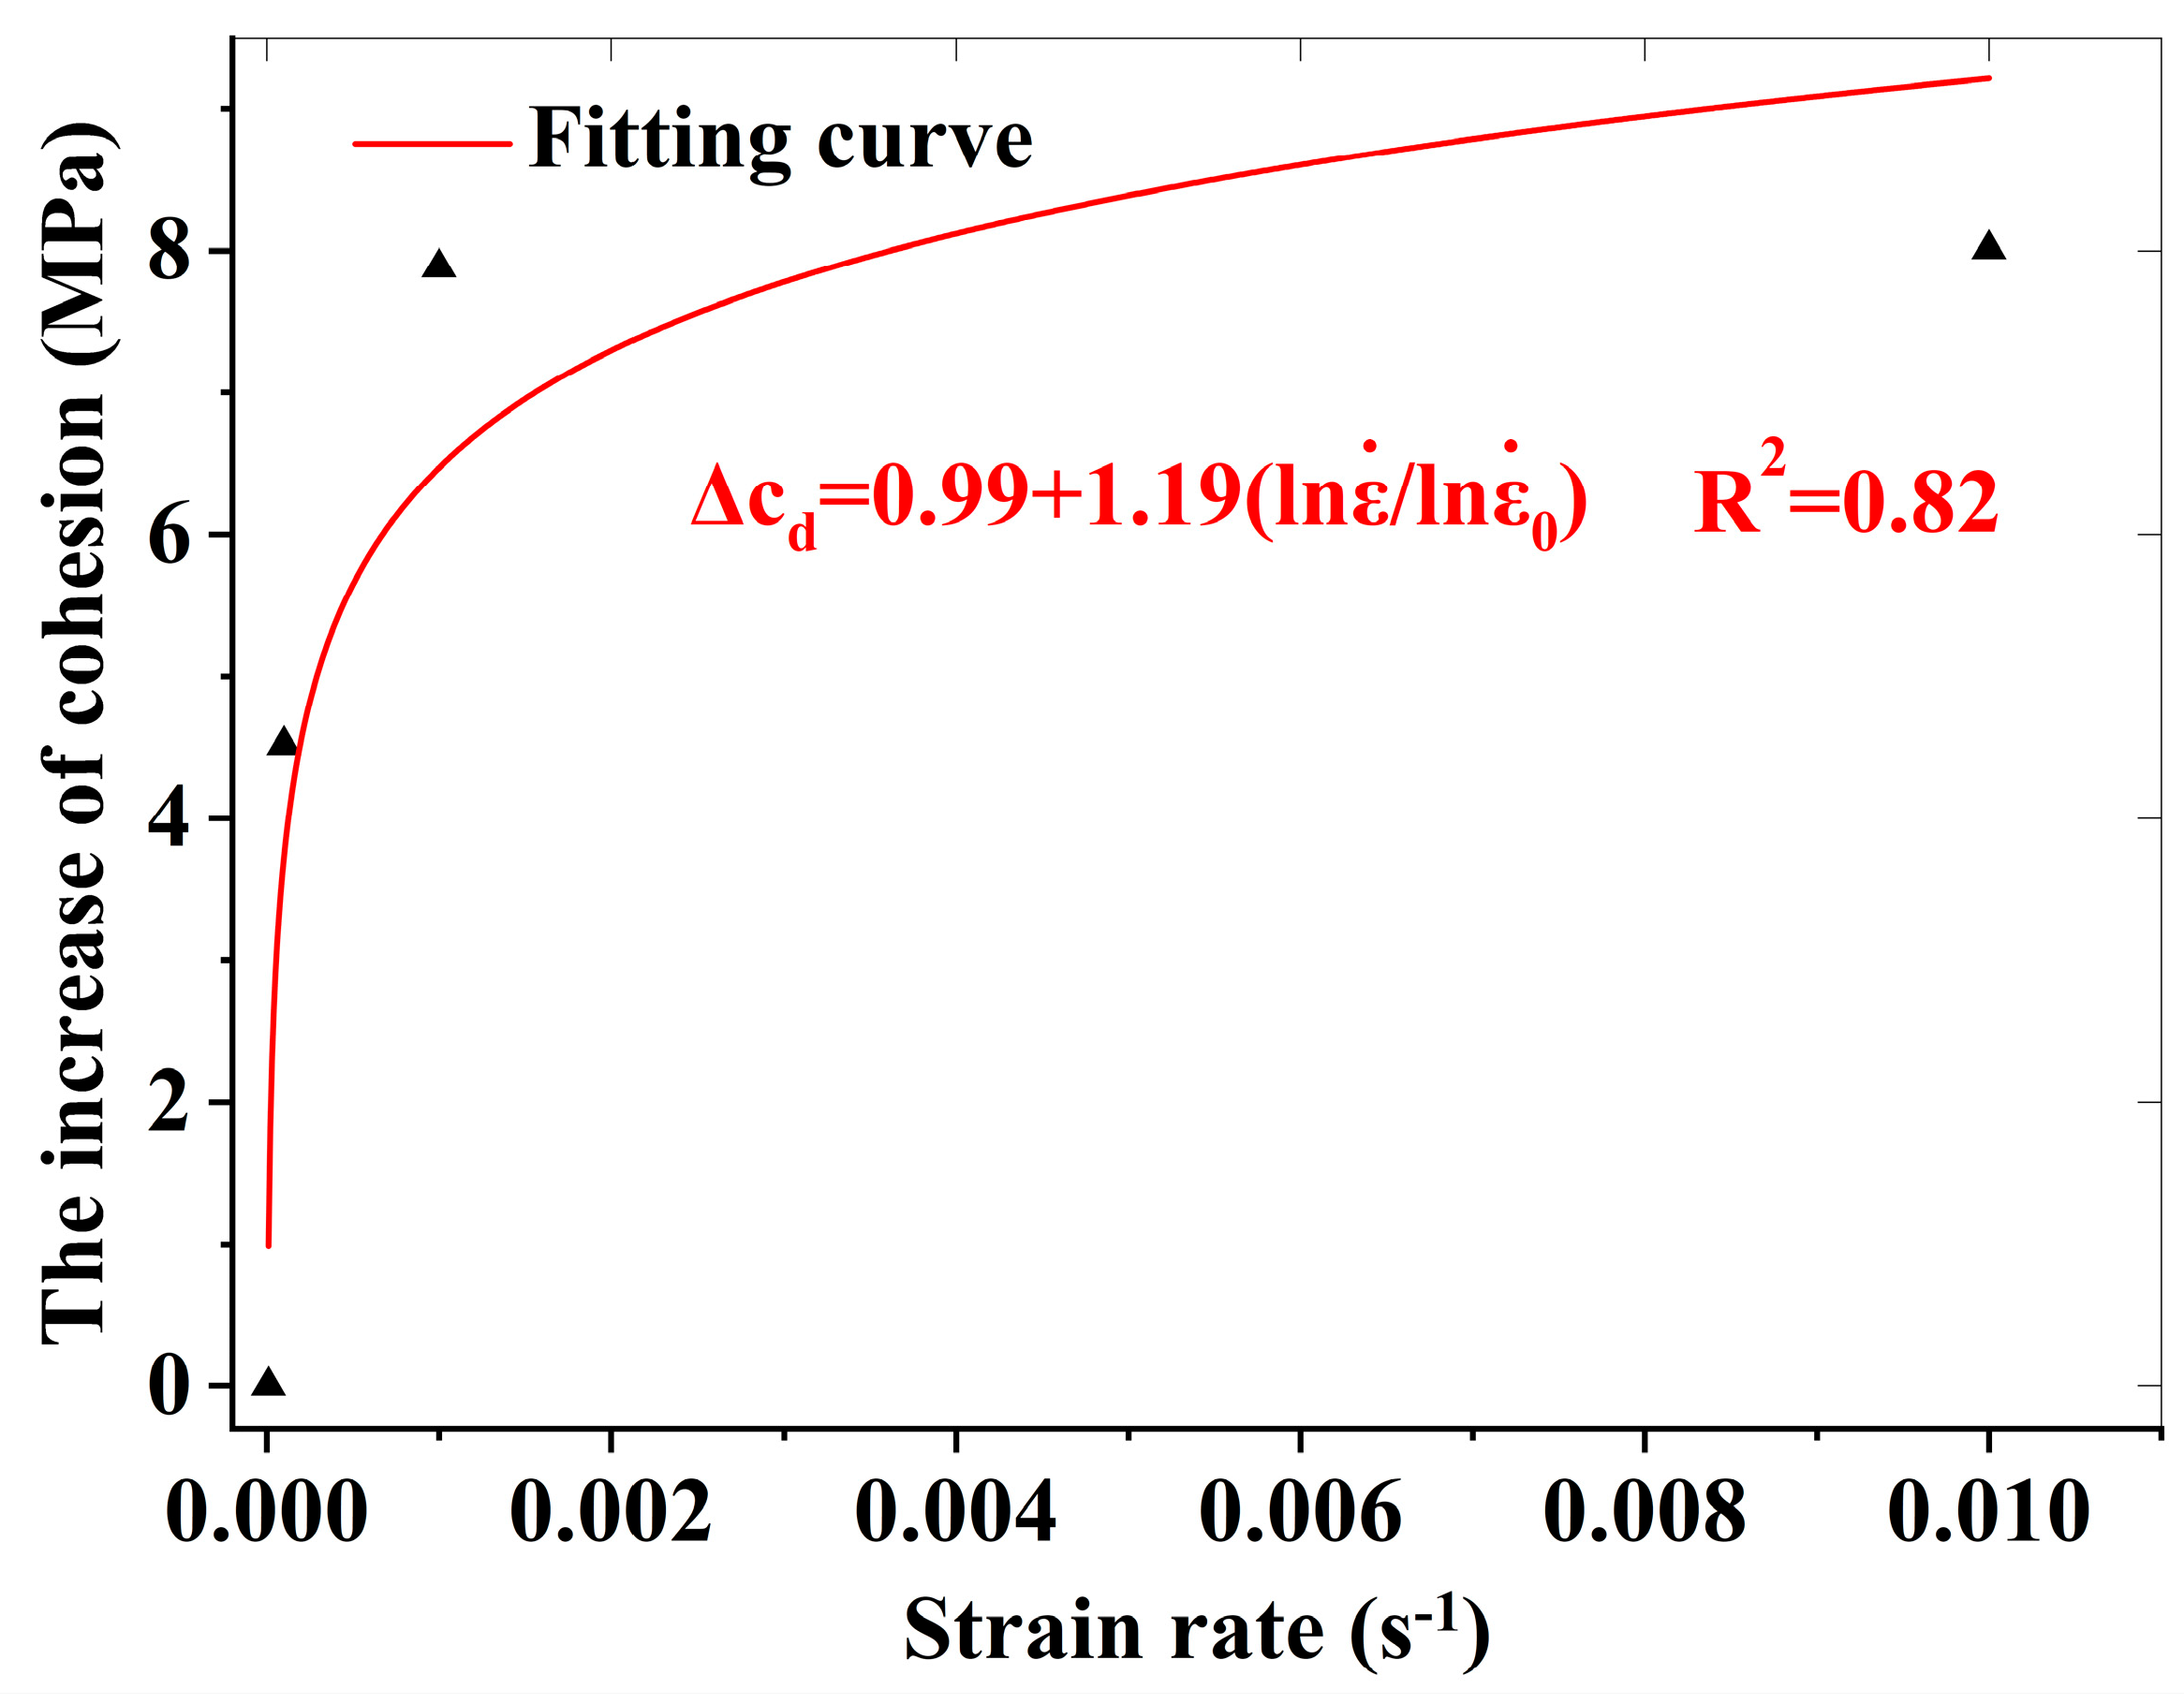
- The strain rate-induced enhancement of dynamic compressive strength primarily originates from the rate-strengthening effect on cohesion, while the internal friction angle remains stable across varying strain rates.
- (5)
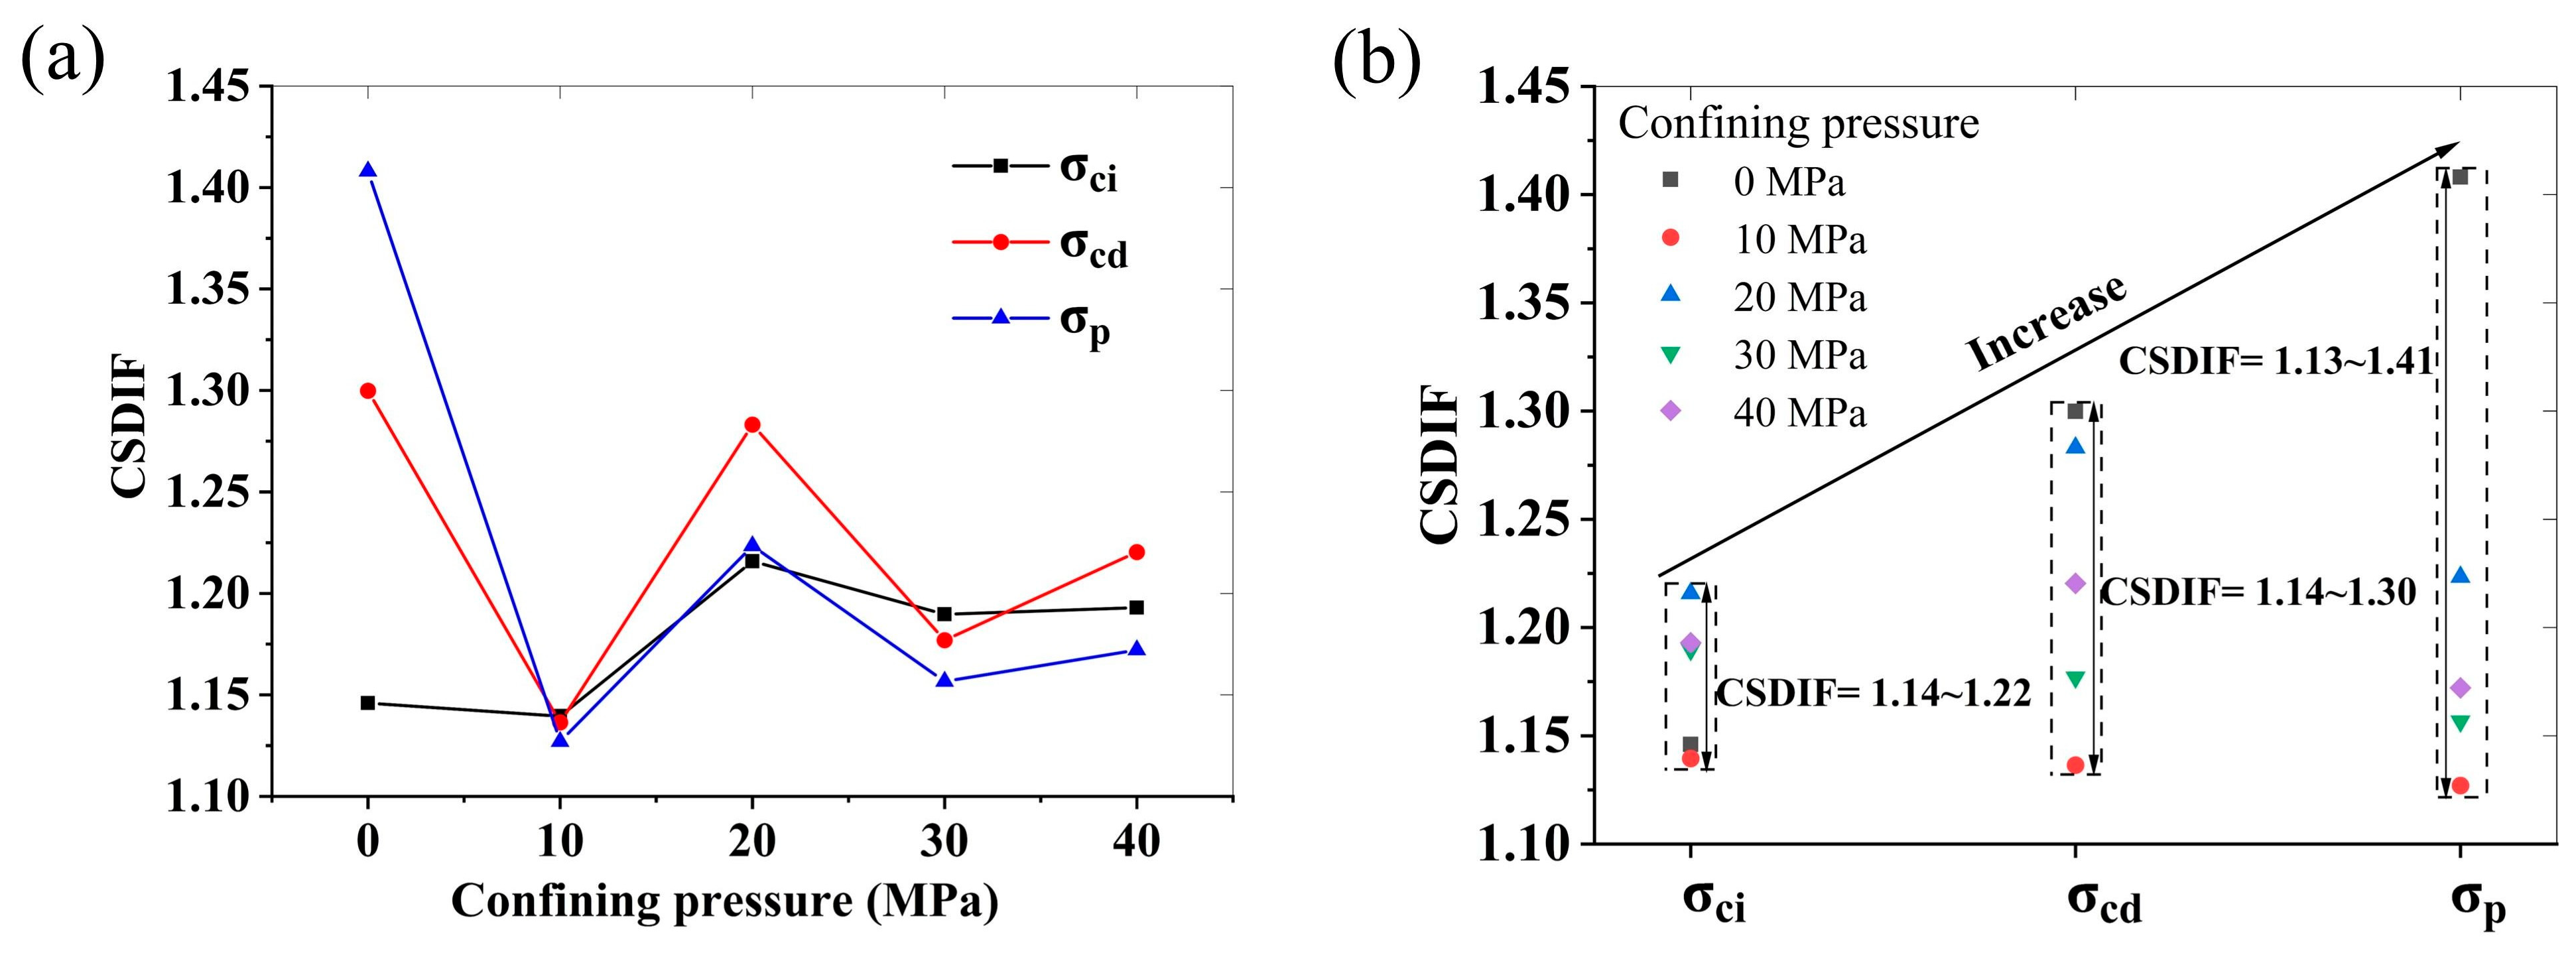
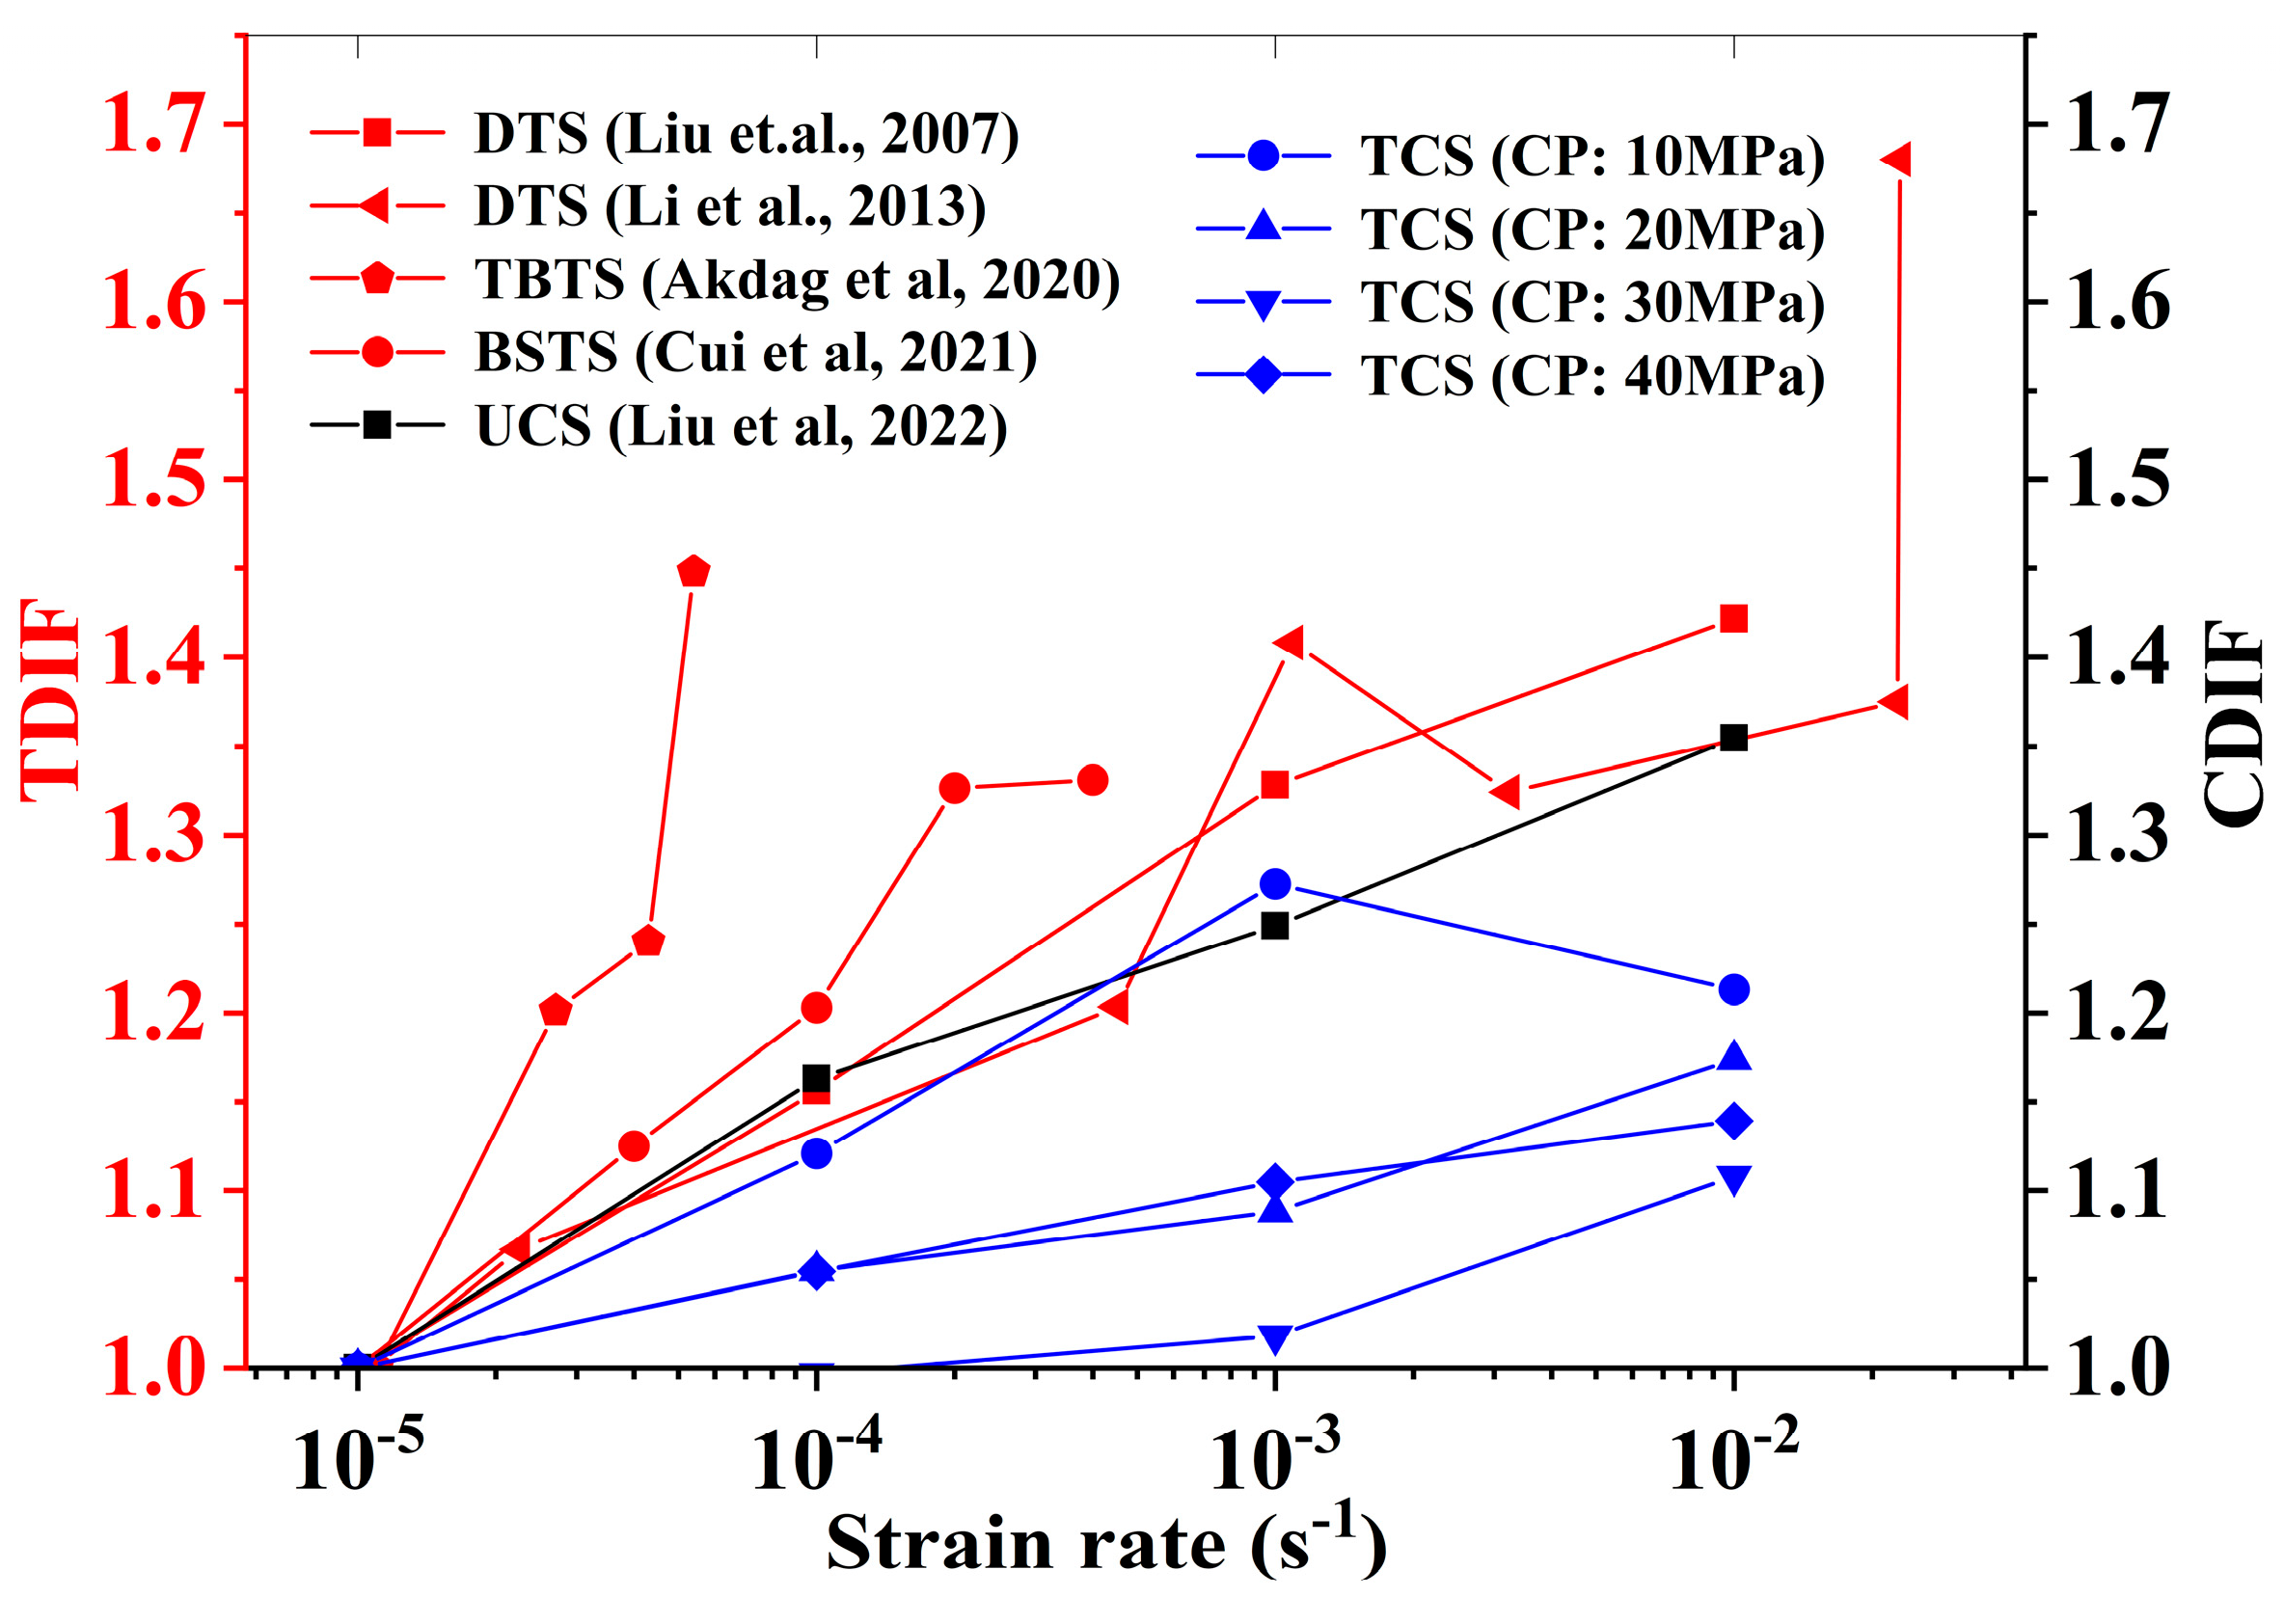
- The disparity in microcrack activity intensity during different deformation stages of rocks leads to the CSDIF of σci being lower than those of σcd and σp.
- (6)
- The CSDIF of σcd and σp decreases with elevated confining pressures. This differential behavior is explained by confinement-enhanced shear fracturing dominance during crack propagation stages combined with a lower strain rate sensitivity of shear versus tensile fracture toughness.
Author Contributions
Funding
Institutional Review Board Statement
Informed Consent Statement
Data Availability Statement
Conflicts of Interest
References
- He, M.; Cheng, T.; Qiao, Y.; Li, H. A Review of Rockburst: Experiments, Theories, and Simulations. J. Rock Mech. Geotech. Eng. 2023, 15, 1312–1353. [Google Scholar] [CrossRef]
- Zhang, Q.B.; Zhao, J. A Review of Dynamic Experimental Techniques and Mechanical Behaviour of Rock Materials. Rock Mech. Rock Eng. 2014, 47, 1411–1478. [Google Scholar] [CrossRef]
- Cai, M.; Kaiser, P.K.; Suorineni, F.; Su, K. A Study on the Dynamic Behavior of the Meuse/Haute-Marne Argillite. Phys. Chem. Earth 2007, 32, 907–916. [Google Scholar] [CrossRef]
- Bindiganavile, V.S. Dynamic Fracture Toughness of Fiber Reinforced Concrete. Ph.D. Thesis, University of British Columbia, Vancouver, BC, Canada, 2003. [Google Scholar]
- He, J.; Dou, L.; Cai, W.; Li, Z.; Ding, Y. In Situ Test Study of Characteristics of Coal Mining Dynamic Load. Shock Vib. 2015, 2015, 121053. [Google Scholar] [CrossRef]
- Liang, C.; Wu, S.; Li, X.; Xin, P. Effects of Strain Rate on Fracture Characteristics and Mesoscopic Failure Mechanisms of Granite. Int. J. Rock Mech. Min. Sci. 2015, 76, 146–154. [Google Scholar] [CrossRef]
- Agbabian, M.S. Design of Structures to Resist Nuclear Weapons Effects; American Society of Civil Engineers: New York, NY, USA, 1985. [Google Scholar]
- Li, H.; Zhao, J.; Li, T.J. Triaxial Compression Tests on a Granite at Different Strain Rates and Confining Pressures. Int. J. Rock Mech. Min. Sci. 1999, 36, 1057–1063. [Google Scholar] [CrossRef]
- Liang, C.; Zhang, Q.; Li, X.; Xin, P. The Effect of Specimen Shape and Strain Rate on Uniaxial Compressive Behavior of Rock Material. Bull. Eng. Geol. Environ. 2016, 75, 1669–1681. [Google Scholar] [CrossRef]
- Hokka, M.; Black, J.; Tkalich, D.; Fourmeau, M.; Kane, A.; Hoang, N.H.; Li, C.C.; Chen, W.W.; Kuokkala, V.T. Effects of Strain Rate and Confining Pressure on the Compressive Behavior of Kuru Granite. Int. J. Impact Eng. 2016, 91, 183–193. [Google Scholar] [CrossRef]
- Kumar, A. The Effect of Stress Rate and Temperature on the Strength of Basalt and Granite. Geophysics 1968, 33, 501–510. [Google Scholar] [CrossRef]
- Li, Y.; Huang, D.; Li, X. Strain Rate Dependency of Coarse Crystal Marble Under Uniaxial Compression: Strength, Deformation and Strain Energy. Rock Mech. Rock Eng. 2014, 47, 1153–1164. [Google Scholar] [CrossRef]
- Zhao, H.; Song, Z.; Zhang, D.; Liu, C.; Yu, B. True Triaxial Experimental Study on Mechanical Characteristics and Energy Evolution of Sandstone under Various Loading and Unloading Rates. Geomech. Geophys. Geo-Energ. Geo-Resour. 2021, 7, 22. [Google Scholar] [CrossRef]
- Qin, T.; Guo, X.; Huang, Y.; Wu, Z.; Qi, W.; Wang, H. Study on Macro-Meso Deformation Law and Acoustic Emission Characteristics of Granular Gangue under Different Loading Rates. Minerals 2022, 12, 1422. [Google Scholar] [CrossRef]
- Mahanta, B.; Singh, T.; Ranjith, P.; Vishal, V. Experimental Investigation of the Influence of Strain Rate on Strength; Failure Attributes and Mechanism of Jhiri Shale. J. Nat. Gas. Sci. Eng. 2018, 58, 178–188. [Google Scholar] [CrossRef]
- Zhao, Z.; Jing, H.; Shi, X.; Wu, J.; Yin, Q. Experimental Investigation on Fracture Behaviors and Acoustic Emission Characteristics of Sandstone under Different Strain Rates. Environ. Earth Sci. 2021, 80, 85. [Google Scholar] [CrossRef]
- Xue, J.; Wang, S.; Yang, Q.; Du, Y.; Hou, Z. Study on Damage Characteristics of Deep Coal Based on Loading Rate Effect. Minerals 2022, 12, 402. [Google Scholar] [CrossRef]
- Zhai, M.; Xu, C.; Xue, L.; Cui, Y.; Dong, J. Loading Rate Dependence of Staged Damage Behaviors of Granite under Uniaxial Compression: Insights from Acoustic Emission Characteristics. Theor. Appl. Fract. Mech. 2022, 122, 103633. [Google Scholar] [CrossRef]
- Liu, L.; Wang, S.; Yang, W. Strain Rate Effects on Characteristic Stresses and Acoustic Emission Properties of Granite under Quasi-Static Compression. Front. Earth Sci. 2022, 10, 960812. [Google Scholar] [CrossRef]
- Li, X.F.; Li, H.B.; Liu, L.W.; Liu, Y.Q.; Ju, M.H.; Zhao, J. Investigating the Crack Initiation and Propagation Mechanism in Brittle Rocks Using Grain-Based Finite-Discrete Element Method. Int. J. Rock Mech. Min. Sci. 2020, 127, 104219. [Google Scholar] [CrossRef]
- Li, H.; Liu, L.; Fu, S.; Liu, B.; Li, X. Rate-Dependent Strength and Crack Damage Thresholds of Rocks at Intermediate Strain Rate. Int. J. Rock Mech. Min. Sci. 2023, 171, 105590. [Google Scholar] [CrossRef]
- Xu, R.; Zhang, S.; Li, Z.; Yan, X. Experimental Investigation of the Strain Rate Effect on Crack Initiation and Crack Damage Thresholds of Hard Rock under Quasi-Static Compression. Acta Geotech. 2023, 18, 903–920. [Google Scholar] [CrossRef]
- Mahetaji, M.; Brahma, J. A Critical Review of Rock Failure Criteria: A Scope of Machine Learning Approach. Eng. Fail. Anal. 2024, 159, 107998. [Google Scholar] [CrossRef]
- Sato, K.; Kawakita, M.; Kinoshita, S. The Dynamic Fracture Properties of Rocks under Confining Pressure. Mem. Fac. Eng. Hokkaido Univ. 1981, 15, 467–478. [Google Scholar]
- Zhao, J. Applicability of Mohr–Coulomb and Hoek–Brown Strength Criteria to the Dynamic Strength of Brittle Rock. Int. J. Rock Mech. Min. Sci. 2000, 37, 1115–1121. [Google Scholar] [CrossRef]
- Huang, S.; Feng, X.; Xia, K. A Dynamic Punch Method to Quantify the Dynamic Shear Strength of Brittle Solids. Rev. Sci. Instrum. 2011, 82, 165. [Google Scholar] [CrossRef]
- Xia, K. A Mohr-Coulomb Failure Criterion for Rocks Subjected to Dynamic Loading; Springer: Heidelberg, The Netherlands, 2013. [Google Scholar]
- Ma, L.; Yang, F.; Wang, M.; Li, Z. Generalized Hoek-Brown dynamic strength criterion incorporating strain rate effect. Rock Soil Mech. 2018, 38, 27–32. (In Chinese) [Google Scholar] [CrossRef]
- Kovari, K.; Tisa, A.; Einstein, H.H.; Franklin, J.A. Suggested Methods for Determining the Strength of Rock Materials in Triaxial Compression: Revised Version. Int. J. Rock Mech. Min. Sci. 1983, 20, 285–290. [Google Scholar]
- MTS. MTS Rock and Concrete Mechanics Testing Systems; MTS Systems Corporation: Eden Prairie, MN, USA, 2003. [Google Scholar]
- Bieniawski, Z. Mechanism of Brittle Fracture of Rock: Part I—Theory of the Fracture Process. Int. J. Rock Mech. Min. Sci. 1967, 4, 395–406. [Google Scholar] [CrossRef]
- Martin, C.D.; Chandler, N.A. The Progressive Fracture of Lac Du Bonnet Granite. Int. J. Rock Mech. Min. Sci. 1994, 31, 643–659. [Google Scholar] [CrossRef]
- Nicksiar, M.; Martin, C.D. Evaluation of Methods for Determining Crack Initiation in Compression Tests on Low-Porosity Rocks. Rock Mech. Rock Eng. 2012, 45, 607–617. [Google Scholar] [CrossRef]
- Wang, Y.; Li, X.; Zheng, B. Stress-Strain Behavior of Soil-Rock Mixture at Medium Strain Rates—Response to Seismic Dynamic Loading. Soil Dyn. Earthq. Eng. 2017, 93, 7–17. [Google Scholar] [CrossRef]
- Cho, S.H.; Ogata, Y.; Kaneko, K. Strain-Rate Dependency of the Dynamic Tensile Strength of Rock. Int. J. Rock Mech. Min. Sci. 2003, 40, 763–777. [Google Scholar] [CrossRef]
- Jaeger, J.C.; Cook, N.G.; Zimmerman, R. Fundamentals of Rock Mechanics; John Wiley & Sons: Hoboken, NJ, USA, 2009. [Google Scholar]
- Zhao, J.; Li, H.; Wu, M.; Li, T. Dynamic Uniaxial Compression Tests on a Granite. Int. J. Rock Mech. Min. Sci. 1999, 36, 273–277. [Google Scholar] [CrossRef]
- Qian, Q.; Qi, C.; Wang, M. Dynamic Strength of Rocks and Physical Nature of Rock Strength. J. Rock Mech. Geotech. Eng. 2009, 1, 1–10. [Google Scholar] [CrossRef]
- Cai, M.; Kaiser, P.K.; Tasaka, Y.; Maejima, T.; Morioka, H.; Minami, M. Generalized Crack Initiation and Crack Damage Stress Thresholds of Brittle Rock Masses near Underground Excavations. Int. J. Rock Mech. Min. Sci. 2004, 41, 833–847. [Google Scholar] [CrossRef]
- Zhou, Y.X.; Xia, K.; Li, X.B.; Li, H.B.; Ma, G.W.; Zhao, J.; Zhou, Z.L.; Dai, F. Suggested Methods for Determining the Dynamic Strength Parameters and Mode-I Fracture Toughness of Rock Materials. Int. J. Rock Mech. Min. Sci. 2012, 49, 105–112. [Google Scholar] [CrossRef]
- Du, K.; Li, X.; Tao, M.; Wang, S. Experimental Study on Acoustic Emission (AE) Characteristics and Crack Classification during Rock Fracture in Several Basic Lab Tests. Int. J. Rock Mech. Min. Sci. 2020, 133, 104411. [Google Scholar] [CrossRef]
- Akdag, S.; Karakus, M.; Nguyen, G.D.; Taheri, A. Strain Burst Vulnerability Criterion Based on Energy-Release Rate. Eng. Fract. Mech. 2020, 237, 107232. [Google Scholar] [CrossRef]
- Cui, Z.; Qian, S.; Zhang, G.; Maochu, Z. An Experimental Investigation of the Influence of Loading Rate on Rock Tensile Strength and Split Fracture Surface Morphology. Rock Mech. Rock Eng. 2021, 54, 1969–1983. [Google Scholar] [CrossRef]
- Liu, S.; Li, H.; Li, J. Mechanical Properties of Rock Material under Dynamic Uniaxial Tension. Chin. J. Geotech. Eng. 2007, 29, 4. (In Chinese) [Google Scholar]
- Li, H.; Li, J.; Liu, B.; Li, J.; Li, S.; Xia, X. Direct Tension Test for Rock Material Under Different Strain Rates at Quasi-Static Loads. Rock Mech. Rock Eng. 2013, 46, 1247–1254. [Google Scholar] [CrossRef]


| Specimen | Strain Rate (s−1) | CP (MPa) | D (mm) | H (mm) | M (g) | V (cm3) | D (g.cm−3) |
|---|---|---|---|---|---|---|---|
| GS-S-1 | 10−6 | 10 | 49.81 | 100.62 | 524.90 | 196.07 | 2.68 |
| GS-S-2 | 20 | 49.92 | 100.26 | 524.90 | 196.23 | 2.67 | |
| GS-S-3 | 30 | 49.91 | 100.67 | 523.90 | 196.95 | 2.66 | |
| GS-S-4 | 40 | 49.95 | 100.72 | 526.00 | 197.37 | 2.67 | |
| GS-S-5 | 10−5 | 10 | 49.94 | 100.71 | 526.00 | 197.27 | 2.67 |
| GS-S-6 | 20 | 49.97 | 100.45 | 524.30 | 197.00 | 2.66 | |
| GS-S-7 | 30 | 49.89 | 100.62 | 524.80 | 196.70 | 2.67 | |
| GS-S-8 | 40 | 49.94 | 100.32 | 524.60 | 196.51 | 2.67 | |
| GS-S-9 | 10−4 | 10 | 49.99 | 100.31 | 525.60 | 196.88 | 2.67 |
| GS-S-10 | 20 | 49.92 | 100.33 | 525.40 | 196.37 | 2.68 | |
| GS-S-11 | 30 | 49.99 | 100.51 | 525.30 | 197.27 | 2.66 | |
| GS-S-12 | 40 | 49.91 | 100.19 | 524.10 | 196.02 | 2.67 | |
| GS-S-13 | 10−3 | 10 | 49.99 | 100.44 | 526.50 | 197.13 | 2.67 |
| GS-S-14 | 20 | 49.98 | 100.28 | 525.70 | 196.74 | 2.67 | |
| GS-S-15 | 30 | 50.03 | 100.34 | 525.80 | 197.25 | 2.67 | |
| GS-S-16 | 40 | 49.92 | 100.47 | 524.40 | 196.64 | 2.67 | |
| GS-S-17 | 10−2 | 10 | 50.01 | 100.59 | 526.00 | 197.59 | 2.66 |
| GS-S-18 | 20 | 49.87 | 100.44 | 525.10 | 196.19 | 2.68 | |
| GS-S-19 | 30 | 50.03 | 100.18 | 524.70 | 196.94 | 2.66 | |
| GS-S-20 | 40 | 49.88 | 100.43 | 525.60 | 196.25 | 2.68 |
| Scheme 1. | Strain Rate (s−1) | CP (MPa) | σci (MPa) | σcd (MPa) | σp (MPa) | σci/σp | σcd/σp | σci/σcd |
|---|---|---|---|---|---|---|---|---|
| GS-S-1 | 10−6 | 10 | 101.43 | 172.30 | 228.10 | 0.44 | 0.76 | 0.59 |
| GS-S-2 | 20 | 161.63 | 220.12 | 289.38 | 0.56 | 0.76 | 0.73 | |
| GS-S-3 | 30 | 179.28 | 282.83 | 356.78 | 0.50 | 0.79 | 0.63 | |
| GS-S-4 | 40 | 207.14 | 313.10 | 399.84 | 0.52 | 0.78 | 0.66 | |
| GS-S-5 | 10−5 | 10 | 111.66 | 174.73 | 211.90 | 0.53 | 0.82 | 0.64 |
| GS-S-6 | 20 | 151.43 | 225.78 | 301.60 | 0.50 | 0.75 | 0.67 | |
| GS-S-7 | 30 | 201.57 | 302.40 | 372.48 | 0.54 | 0.81 | 0.67 | |
| GS-S-8 | 40 | 235.18 | 328.94 | 411.37 | 0.57 | 0.80 | 0.71 | |
| GS-S-9 | 10−4 | 10 | 125.83 | 188.48 | 237.52 | 0.53 | 0.79 | 0.67 |
| GS-S-10 | 20 | 157.54 | 251.04 | 318.16 | 0.50 | 0.79 | 0.63 | |
| GS-S-11 | 30 | 188.19 | 295.80 | 371.28 | 0.51 | 0.80 | 0.64 | |
| GS-S-12 | 40 | 229.33 | 349.96 | 433.78 | 0.53 | 0.81 | 0.66 | |
| GS-S-13 | 10−3 | 10 | 138.72 | 210.61 | 269.64 | 0.51 | 0.78 | 0.66 |
| GS-S-14 | 20 | 164.19 | 254.99 | 328.23 | 0.50 | 0.78 | 0.64 | |
| GS-S-15 | 30 | 200.82 | 315.18 | 379.26 | 0.53 | 0.83 | 0.64 | |
| GS-S-16 | 40 | 248.45 | 371.26 | 454.48 | 0.55 | 0.82 | 0.67 | |
| GS-S-17 | 10−2 | 10 | 115.59 | 195.80 | 257.07 | 0.45 | 0.76 | 0.59 |
| GS-S-18 | 20 | 196.51 | 282.44 | 354.03 | 0.56 | 0.80 | 0.70 | |
| GS-S-19 | 30 | 213.29 | 332.89 | 412.68 | 0.52 | 0.81 | 0.64 | |
| GS-S-20 | 40 | 247.12 | 382.10 | 468.68 | 0.53 | 0.82 | 0.65 |
| CP (MPa) | σci | σcd | σp | |||
|---|---|---|---|---|---|---|
| Fitting Equation | R2 | Fitting Equation | R2 | Fitting Equation | R2 | |
| 10 | 0.38 | 0.69 | 0.64 | |||
| 20 | 0.55 | 0.94 | 0.99 | |||
| 30 | 0.65 | 0.87 | 0.81 | |||
| 40 | 0.77 | 0.99 | 0.99 | |||
| Confining Pressure (MPa) | CSDIF (σci) | CSDIF (σcd) | CSDIF (σp) |
|---|---|---|---|
| 0 | 1.15 | 1.30 | 1.41 |
| 10 | 1.14 | 1.14 | 1.13 |
| 20 | 1.22 | 1.28 | 1.22 |
| 30 | 1.19 | 1.18 | 1.16 |
| 40 | 1.19 | 1.22 | 1.17 |
| Strain Rate (s−1) | Parameters of Fitting Equation | Internal Friction Angle (°) | Cohesion (MPa) | |
|---|---|---|---|---|
| A | B | |||
| 10−6 | 152.24 | 7.52 | 49.93 | 27.76 |
| 10−5 | 146.52 | 8.04 | 51.15 | 25.84 |
| 10−4 | 169.23 | 7.77 | 50.53 | 30.36 |
| 10−3 | 187.15 | 7.70 | 50.36 | 33.72 |
| 10−2 | 193.28 | 8.15 | 51.39 | 33.85 |
Disclaimer/Publisher’s Note: The statements, opinions and data contained in all publications are solely those of the individual author(s) and contributor(s) and not of MDPI and/or the editor(s). MDPI and/or the editor(s) disclaim responsibility for any injury to people or property resulting from any ideas, methods, instructions or products referred to in the content. |
© 2025 by the authors. Licensee MDPI, Basel, Switzerland. This article is an open access article distributed under the terms and conditions of the Creative Commons Attribution (CC BY) license (https://creativecommons.org/licenses/by/4.0/).
Share and Cite
Liu, L.; Ouyang, J.; Yang, W.; Wang, S. Strain Rate Effects on Characteristic Stresses and Dynamic Strength Criterion in Granite Under Triaxial Quasi-Static Compression. Appl. Sci. 2025, 15, 6214. https://doi.org/10.3390/app15116214
Liu L, Ouyang J, Yang W, Wang S. Strain Rate Effects on Characteristic Stresses and Dynamic Strength Criterion in Granite Under Triaxial Quasi-Static Compression. Applied Sciences. 2025; 15(11):6214. https://doi.org/10.3390/app15116214
Chicago/Turabian StyleLiu, Lu, Jinhui Ouyang, Wencheng Yang, and Sijing Wang. 2025. "Strain Rate Effects on Characteristic Stresses and Dynamic Strength Criterion in Granite Under Triaxial Quasi-Static Compression" Applied Sciences 15, no. 11: 6214. https://doi.org/10.3390/app15116214
APA StyleLiu, L., Ouyang, J., Yang, W., & Wang, S. (2025). Strain Rate Effects on Characteristic Stresses and Dynamic Strength Criterion in Granite Under Triaxial Quasi-Static Compression. Applied Sciences, 15(11), 6214. https://doi.org/10.3390/app15116214