Article

An Explorative Investigation of the Flat-Jack Test for Prestress Assessment in Post-Tensioned Concrete Structures

by
Dalila Rossi
,
Carlo Pettorruso
*,
Virginio Quaglini
and
Sara Cattaneo
Department of Architecture, Built Environment and Construction Engineering, Politecnico di Milano, Piazza Leonardo da Vinci 32, 20133 Milan, Italy
*
Author to whom correspondence should be addressed.
Appl. Sci. 2025, 15(11), 6199; https://doi.org/10.3390/app15116199
Submission received: 11 April 2025 / Revised: 26 May 2025 / Accepted: 29 May 2025 / Published: 30 May 2025
(This article belongs to the Special Issue Advances in Building Materials and Concrete, 2nd Edition)

Abstract

:

Featured Application

The study explores the potential of the flat-jack test as a non-destructive technique for assessing residual prestress levels within post-tensioned concrete elements. While the current investigation is fundamental in nature, it lays the groundwork for exploring a method commonly used in masonry for a novel application in prestressed concrete, with particular relevance for structural health monitoring and evaluation of aging or damaged post-tensioned concrete elements.

Abstract

This preliminary study explores the feasibility of using the flat-jack test to assess residual prestress in post-tensioned concrete elements. Experimental testing was conducted on three concrete slabs under controlled laboratory conditions, with known stress states induced by axial loading. Two flat-jack sizes and two gage lengths were considered, and a tailored calibration procedure was implemented to reflect expected field conditions. The test produced acceptable stress estimations, with accuracy influenced by both the gage length and the jack size. The results are discussed within the broader context of prestress assessment, including a comparison between the flat-jack test’s performance in concrete and masonry and its positioning relative to alternative methods. The experimental design, result presentation, and theoretical analysis in this study are intentionally simple and not yet sufficiently mature to support practical application. Nevertheless, the findings offer promising initial insights and practical inspiration for practitioners and researchers exploring alternative methods for residual stress assessment in prestressed concrete structures, underscoring the need for further research to refine the methodology and validate its broader applicability.

1. Introduction

After the Second World War (WW II), prestressed concrete technology developed rapidly in Europe and has since become the dominant choice for infrastructure worldwide due to its effectiveness in both design and construction [1]. By this technology, prestressing is deliberately introduced to induce compressive stresses in the concrete, counteracting tensile stresses that would otherwise develop under service loads, thereby preventing cracking and controlling deflections. However, in the post-WW II period, the available technologies, materials, and construction methods lacked extensive experience on post-tensioning systems, leading to a design approach primarily focused on the increase in strength, with less emphasis on durability. As a result, many prestressed concrete structures today, several decades old and often near the end of their service life, show significant signs of deterioration, compromising their safety and functionality. Recent events have underscored this issue, such as the collapses of the Fossano Viaduct in 2017 and of the Polcevera Viaduct in 2018 [2], within the Italian context, and other tragic events worldwide [3].
The fundamental components of the post-tensioning (PT) system are the cables or tendons, which consist of high-strength steel strands placed inside the concrete structure. The tendons are housed within steel or plastic ducts and anchored at both ends to the concrete element. After concrete has hardened, the tendons are stretched using hydraulic jacks, then locked in place. The resulting compression strengthens the concrete, allowing it to resist tension forces, reduce cracking, and support heavier loads over longer spans. To prevent corrosion of the steel tendons, the ducts are injected with a cementitious grout, which creates an alkaline environment and ensures their bond with the surrounding concrete.
The primary issue in post-tensioned structures is the loss of tension in PT cables, which may arise from several causes, such as cable corrosion, anchorage degradation, and long-term effects related to the viscosity of steel and concrete. The corrosion of steel cables is an electrochemical process triggered by voids in the grout, which trap water and moisture. Over time, corrosion leads to section loss; decrease in the overall tension within the cable; and, ultimately, strand breakage. Anchorage degradation manifests through various mechanisms. Corrosion is a major concern, often initiated by moisture and contaminants penetrating the anchorage assembly and attacking the wedges and the steel strands within. High bearing stresses at the anchorages can induce cracking in the surrounding concrete, creating pathways for water and aggressive substances to reach the tendons and anchorages, further accelerating degradation. Finally, issues during the initial tensioning process can lead to slippage or improper seating of strands at the anchorage, resulting in an initial loss of prestress. Also long-term phenomena, such as shrinkage and creep in the concrete and relaxation in the steel, contribute significantly to the reduction in prestressing efficiency. Creep and shrinkage of the concrete depend on multiple factors, including ambient humidity, dimensions of the element, concrete composition, and curing conditions. Creep is further influenced by the maturity of the concrete at the time of first loading and the duration and magnitude of the applied load. Steel relaxation leads to a gradual loss of stress in the tendons over time after initial tensioning. While long-term losses are typically considered in the design, predictive models may sometimes prove inaccurate in practical applications due to the complexity of such effects, e.g., reference [4]. Moreover, estimating only long-term tension losses is not sufficient to assess the residual prestressing of an in-service bridge. Structural degradation over its service life can lead to additional, unforeseen tension losses. Therefore, if preliminary bridge inspections reveal widespread defects, a detailed assessment is necessary to accurately determine the residual tension level.
Tension loss can affect the behavior of the bridge at both the serviceability limit states (SLS) and the ultimate limit states (ULS), directly compromising the structure’s ability to carry loads safely and maintain long-term durability. At the SLS, the prestressing force contributes to shifting the position of the neutral axis, thereby controlling deflections and delaying the onset of cracking. A significant loss of prestressing will lead to increased deflections, earlier cracking, and enhanced penetration of aggressive agents, which accelerate degradation. At the ULS, the prestressing force provides a direct contribution to both flexural and shear resistance. Its reduction can therefore compromise the overall load-bearing capacity of the structural element. Different types of brittle failure can occur depending on the structural scheme: simply supported beams become more susceptible to shear failure; segmental structures may experience monolithic collapse due to joint opening, and in continuous beams, maximum moments typically occur at the supports, making it more challenging to detect critically stressed areas.
The evaluation of the structural safety and performance of post-tensioned concrete structures therefore requires a precise assessment of the residual prestress in concrete. Unforeseen or excessive prestress loss can lead to undesirable cracking; increased deflections; reduced fatigue life; and ultimately, a compromised structural integrity, potentially jeopardizing both serviceability and ultimate limit states and, in severe cases, leading to structural failure.
The issues discussed above highlight the need for reliable methods to assess the prestressing of post-tensioned concrete structures. Accurately determining the residual prestress is crucial for evaluating the actual condition and identifying severe deterioration of the PT system, otherwise difficult to detect; predicting the remaining service life; and making informed decisions regarding inspection, maintenance, and potential strengthening interventions to ensure the continued safety of these structures. However, as it will be discussed later, existing technologies for this purpose often present significant limitations, particularly in terms of invasiveness and operational complexity, which hinder their widespread and practical application. This justifies the ongoing investigation into alternative, more practical methods. In this context, the flat-jack test [5,6,7] appears promising for two key reasons: it is relatively simple and practical to perform, and it is minimally invasive as it does not require direct exposure of the steel strands. Flat jacks are widely used in structural and geotechnical investigations to measure in situ stresses, assess masonry and rock stability, monitor deformations, and evaluate the effects of reinforcement or restoration interventions. However, their application to prestressed reinforced concrete structures remains largely unexplored. This study aims to explore the fundamental feasibility of the flat-jack test for estimating the prestress in concrete members and identify the initial challenges and opportunities associated with this method. Section 2 of the paper presents a review of existing available non-destructive methods proposed for the assessment of the residual prestress in reinforced concrete (RC) elements, while Section 3 illustrates the general application of the flat-jack test methodology to concrete elements. In Section 4 a preliminary experimental study, consisting of a series of laboratory tests on concrete slabs, is presented. The slabs were subjected to the application of a controlled compression force, and flat-jack tests were performed using different instrumentations and setups. The experimental findings are shown and analyzed in Section 5, where the implications of the dimensions of the flat jack and the gage length are discussed. Section 6 delves deeper into the implications of the experimental results, discussing them within the broader context of prestress assessment, comparing the flat-jack test’s performance in concrete versus masonry, outlining its technical positioning, and highlighting the challenges that must be addressed for a successful transition from the controlled laboratory environment to practical engineering applications. Finally, conclusions are drawn in Section 7.
While the authors have prior experience in non-destructive assessment of prestressed reinforced concrete structures, this is their first investigation specifically focused on the application of the flat-jack test to prestressed members. Due to the preliminary nature of the study, the experimental design, result presentation, and theoretical analyses are intentionally at a simplified stage and require further maturation before supporting field implementation.

2. State of the Art of NDTs for Concrete Prestress Evaluation

This section presents a critical review of current non-destructive techniques (NDTs) that can be used to evaluate the prestressing of internal PT systems, highlighting the advantages and limitations of each technique. The methods discussed include those recommended by the Italian Guidelines for Special Inspection [8], developed based on the North American Federal Highway Administration Guideline [9], and the Highways England CS 465 [10] and CS 464 [11].
Current NDTs for assessing residual prestressing force in existing structures can be categorized into stress release methods and the X-ray diffraction (XRD) method.
Stress release methods estimate prestress by measuring the stress relieved when the continuity of a structural member (such as the concrete surrounding tendon ducts, or a wire of the tendon) is mechanically interrupted. These methods include the exposed strand method, the drilled hole method (or stress release coring), the saw-cut method, and the flat-jack test. It is worth noting that all these tests are considered as non-destructive because the affected areas are small in comparison with the dimensions of the structural member and are usually repaired after the test with minimal long-term impact on the overall structure.
The exposed strand method [12] estimates the prestressing force in a strand by comparing its load-displacement curve, obtained using a custom instrument applied to the strand, with a calibration diagram. Although the procedure appears straightforward, its accuracy heavily depends on the specific conditions under which the calibration data are collected, such as the strand’s dimensions, type, and exposed length. References on the application of this method date back to 1998 [12], with no recent applications found in the literature. Moreover, as the name suggests, this method requires the strand to be exposed. This involves removing the concrete, opening the duct, and extracting the grout to access the strand. After the test, the concrete must then be repaired.
Similar to the exposed strand method, the XRD method [13] also requires strand exposure, but it operates through a different physical principle. In this technique, X-rays are shot directly at the wire of the strand to measure the strain within the crystal lattice of the steel, allowing for an estimation of stress based on the material composition and elastic properties. XRD is widely used in materials engineering to analyze the crystalline structure of materials. In recent years, interest has grown in applying it to PT cables. Some exploratory studies [14,15] have obtained reliable results using XRD for this purpose. Reference [13] reported errors of about ±10% for typical working loads (corresponding to about 60% of the yielding strength of steel) and of ±30% for low working loads. However, the application of the XRD method to large-scale concrete structures faces substantial challenges. The most significant limitation is its invasiveness and the requirement for direct access to the steel tendons. To use XRD for measuring stress in the prestressing steel, the concrete cover, grout, and often even the duct must be removed to expose the steel strands. This makes it a highly destructive method for practical in situ assessment. Beyond invasiveness, the operational complexity is considerable. XRD equipment is typically laboratory-based, often large and sensitive, making it difficult to transport and operate on site, especially in challenging bridge environments. The technique also involves the management of ionizing radiation, requiring strict safety protocols and specialized training for operators. Its application is generally limited to small, exposed areas, making it impractical for assessing the overall prestress distribution across a large structural element.
In contrast to the previous methods, stress release methods such as the drilled hole method and the saw-cut method have the advantage of being performed on concrete without requiring exposure of the strands. The drilled hole method has been widely used in mechanical and aeronautical fields since 1934 and has a standardized test procedure for steel [16]. Later, several authors [17,18] explored improvements to make it suitable for concrete structural members, where small holes, suitable for steel, are impractical due to concrete’s heterogeneity. To address this issue, the International Federation for Structural Concrete (FIB) [19] recommends holes ranging from 77 to 79 mm in diameter and between 100 and 175 mm in depth. However, in post-tensioned concrete beams with parabolic cable layouts, the ducts may be too close to the concrete surface for this method to be effectively applied. To overcome the limitations of the drilled hole method, Kukay in 2008 introduced the saw-cut method [20], which involves isolating a small section of concrete through a transverse saw cut and measuring the strain relief by means of strain gages bonded to the concrete surface. While this method seems promising for in situ testing, it has yet to be thoroughly validated, and the literature presents conflicting results [21,22]. In particular, no direct evaluation of the error has been reported to date. The only available studies compare the results of the method with stress values obtained through analytical calculations of residual stress or finite element models [22,23]. A significant source of uncertainty in the results arises from the difficulty of fully isolating the concrete section as the cut depth must be limited in practice to avoid damaging the tendons. One of the primary limitations of stress release methods lies indeed in their invasiveness. They require physically cutting into or drilling holes in the concrete element, which inherently causes localized damage to the structure. This damage must then be repaired, adding to the cost, time, and complexity of the assessment. For in-service structures, such invasive procedures can disrupt operations, compromise structural integrity (even if localized), and raise concerns about the long-term performance of the repaired sections. Furthermore, the operational complexity of these methods can be high, requiring specialized equipment, precise execution to ensure accurate stress relief, and often skilled personnel to perform the tests and interpret the results correctly. The process can be time consuming, especially when multiple test locations are required across a large structure.
The flat-jack test is also performed directly on concrete, minimizing its impact on the structure. Compared with the drilled hole and saw-cut methods, it is operationally simpler and less invasive as it requires significantly less material removal, making it a promising alternative for evaluating concrete prestress. The flat jack was invented and patented by Eugéne Freyssinet in 1939 [24], and after about a decade of improvements to its design, it began to be used in rock engineering. Over the next two decades, the flat-jack test became widely employed for the determination of deformability and in situ stress conditions in existing structures, such as masonry buildings [5,25] and dams [6]. The minimally invasive nature of this test is further confirmed by its application to buildings of historical and cultural significance, as documented by various studies [26,27,
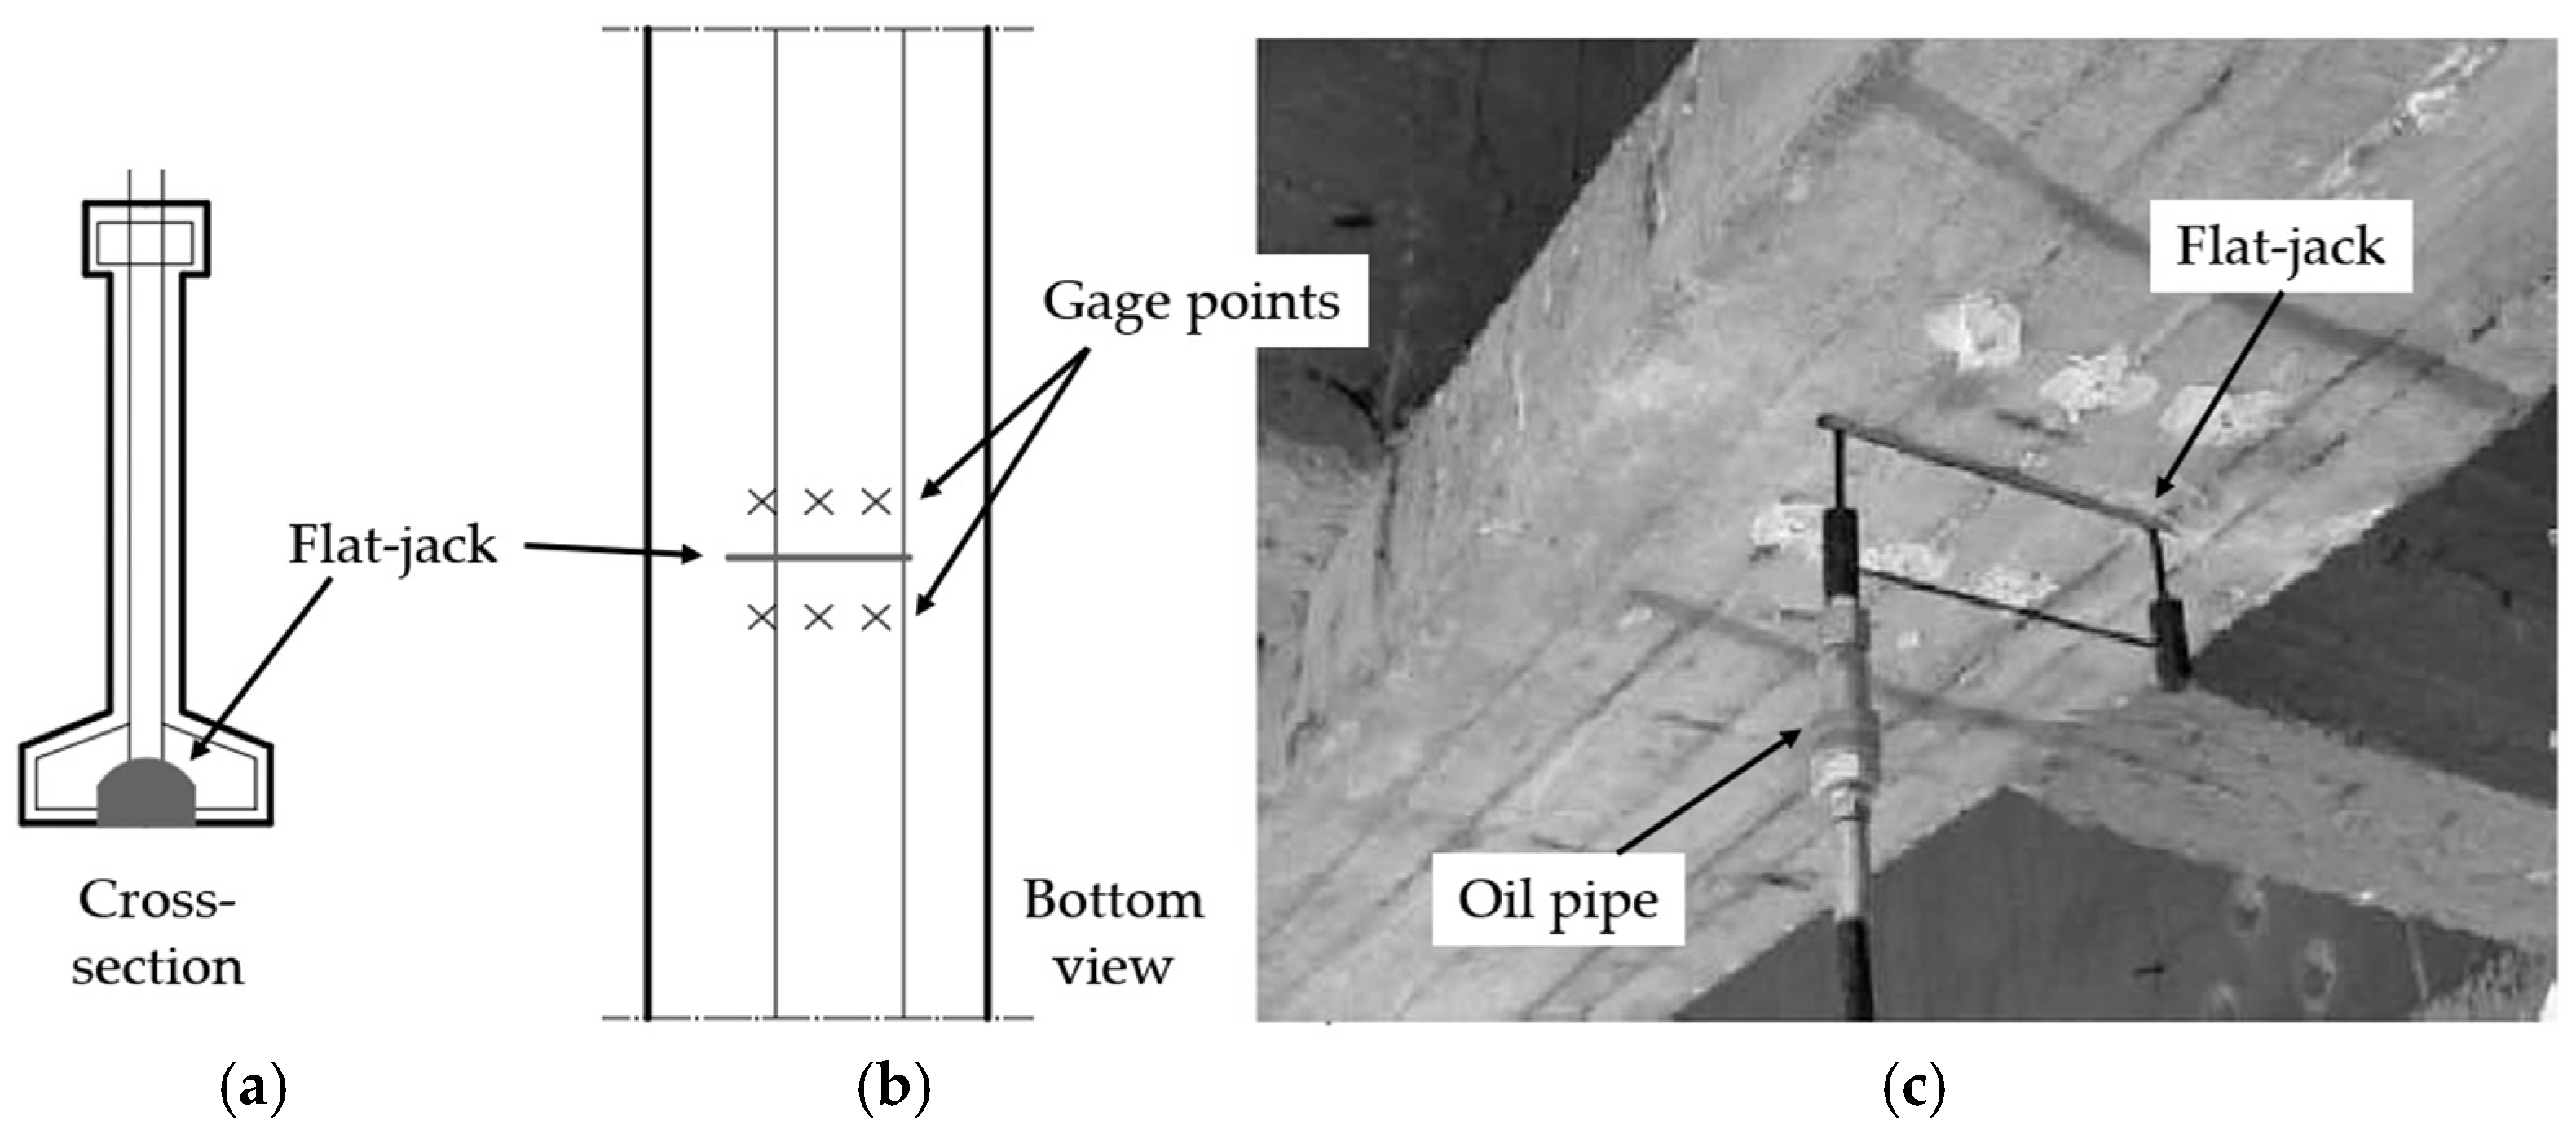
28]. However, despite its extensive use in structural assessment, there is a notable lack of research on its application to reinforced and prestressed concrete structures. In particular, the few references in this respect mainly regard its use on post-tensioned beams, as illustrated in Figure 1 [7,29], but these references are limited and not well established.
The American (ASTM) [30] and International (RILEM) [31] standards regulate flat-jack tests for masonry, providing guidelines on the necessary equipment, calibration procedures, test procedures, and result interpretations. While the test procedure itself does not differ significantly when applied to reinforced or prestressed concrete elements, certain uncertainties still exist regarding its application in these contexts.

3. Flat-Jack Test Methodology

The flat-jack test is used to assess the normal stress acting on a specific cross-section of a structural member. The procedure involves making a cut perpendicular to the outer surface of the element. If the element is under compression, the internal force causes the edges of the resultant slot to close. A displacement transducer (e.g., a mechanical strain gage) measures the change in distance between pairs of gage points placed at either side of the cut line. The flat jack is then inserted into the slot and connected to a hydraulic pump. The oil pressure inside the flat jack is gradually increased until the initial pre-cut distance between the gage points is restored. Finally, the stress acting perpendicularly to the cut section is determined based on the internal pressure of the flat jack measured using a manometer and corrected for two calibration factors introduced to account for the stiffness of the flat jack (Km) and the effective contact area (Ka) between the flat jack and the inner surface of the slot.
In more detail, the test procedure is summarized in the following steps, illustrated in Figure 2:
  • Step 1: Preparation of the test area. The cut line is marked on the surface of the element to be investigated, and metal gage points are aligned and bonded above and below the marked line. For masonry, both standards [29,30] recommend a distance between each pair of gage points between 0.3 and 0.6 times the primary dimension “L” of the flat jack (Figure 3). Each row of gage points thus formed shall be equally spaced above and below the cut line.
  • Step 2: Baseline measurements (“zero readings”). Once the adhesive has cured, initial baseline measurements of the distance between each pair of gage points are taken using a mechanical extensometer.
  • Step 3: Execution of the cut. A precise cut is made along the marked line using a circular saw. The plan geometry of the slot shall be similar to that of the flat jack being used. Slots for circular and semi-rectangular flat jacks are cut using circular saws of sufficient radius to provide the depth required. Slots for rectangular flat jacks may be formed by drilling overlapping holes (stitch drilling) and subsequently using a drill to remove the material and produce a slot of desired dimensions with smooth upper and lower surfaces.
  • Step 4: Post-cut measurements (“post-cut readings”). Assuming that the investigated element is under compression, after the cut the edges of the slot will move closer together. A second set of measurements is taken to record the change in distance between each pair of gage points.
  • Step 5: Insertion of the flat jack. The flat jack is carefully inserted and packed tightly into the cut slot.
  • Step 6: Pre-seating of the flat jack. To ensure proper positioning, an initial pressure of half the estimated maximum pressure is applied and then released.
  • Step 7: Gradual pressurization and displacement monitoring. The pressure inside the flat-jack device is increased by steps, while the change in distance between each pair of gage points is measured.
  • Step 8: Achievement of the target distance. The test is stopped when the distance between the pairs of gage points is returned (within a certain tolerance) to the baseline (pre-cut) value. The pressure in the flat jack is recorded.
  • Step 9: Flat-jack removal and restoration. The flat jack is depressurized and removed from the slot (tools may be required to facilitate the extraction). Finally, the slot is filled with a high strength mortar to restore the integrity.
According to the American standard [30], the average compressive stress in the element, fm, is calculated as
fm = Km × Ka × p,
where
  • Km [-] is a dimensionless constant that reflects the geometrical and stiffness properties of the flat jack;
  • Ka [-] is the ratio of the measured area of the flat jack to the average measured area of the cut slot;
  • p [psi or MPa] is the flat-jack pressure required to restore the gage points to the distance initially measured between them within the tolerance allowed.
The conversion factor Km accounts for the inherent stiffness of the flat jack, which resists to expansion; thus, this factor links the internal oil pressure inside the jack to the stress applied to the tested element. The second factor Ka accounts for the difference between the area of the flat jack and the area of the cut slot: the area of the slot is usually larger than the surface of the inserted flat jack (Figure 3), resulting in an effective loaded area that differs from the area of the device. The factor Km is evaluated through a calibration procedure [30], while Ka is determined by inferring the actual cut slot area from the length and depth of the slot. The latter measurement can be performed using a depth gage or a laser scanner as proposed in reference [32].

4. Experimental Program

4.1. Materials and Methods

The study involved three concrete samples, each consisting of a slab made of C20/25 concrete with dimensions of 34 × 150 × 50 cm (length × height × width). The dimensions were chosen to minimize edge effects. The maximum aggregate size of concrete was 20 mm. The experimental set-up is sketched in Figure 4 and consisted of two reaction plates anchored to a strong floor and a servo-hydraulic jack. The concrete slab was positioned horizontally and carefully aligned with the axis of the jack to prevent load eccentricity. The load was applied to the slab using rigid metal plates at both ends, ensuring a uniformly distributed pressure on the surface. The servo-hydraulic jack was operated in load-controlled mode, and the force applied to the sample was read by a calibrated load cell.
The procedure followed the one described in Section 3. After identifying the test area on the surface of the slab, the cut line and the position of the gage points were drawn (Figure 5). The cut line was located 18 cm from the end of the slab. Four rows of gage points were created: two rows at 14 cm gage length and two rows at 20 cm, according to the layout sketched in Figure 5a. Each row comprised 5 gage points, with 5 cm spacing between two consecutive points. The gage points consisted of small metal plates with a conical seat at the center, fitting the tips of the mechanical extensometer. The plates were bonded to the concrete surface using a suitable adhesive.
Two semicircular flat jacks were investigated. The smaller one measured 25 cm in length and 5 cm in height, while the larger one had a length of 33 cm and a height of 12 cm (Figure 5c). It must be noted that in applications in PT reinforced concrete elements, the height of the flat jack was constrained by the maximum allowable depth of the cut, which must not damage rebar or tendons. The tests were labelled by the acronym MXY, where “X” indicates the slab tag and “Y” refers to the flat-jack: “A” stands for the smaller device, and “B” stands for the larger one (Table 1). Only two tests with the 33 cm flat jack were performed because at the end of test M1B (test M4B was already performed), the jack became stuck in the slot. During the attempt to remove it, the device was damaged (specifically, the weld was compromised). Therefore, fearing that its reliability had been affected, further tests with this flat jack were discontinued.
To pressurize the flat jack, a hydraulic system was used, consisting of a manually operated hydraulic pump connected to the flat jack via hydraulic hoses (Figure 6).
The tests involved the assessment of the flat jacks at three levels of stress in the concrete slab: 2, 3, and 4 MPa. First, the pressure levels were applied incrementally (from 2 MPa to 4 MPa) on the intact concrete slab, and baseline measurements of the distance between each pair of gage points were recorded at each level. Measurements were taken using two extensometers, one with a gage length of 14 cm and the other with 20 cm gage length. At each stress level, readings were taken approximately 5 min after the load was applied to allow for stabilization. Once the baseline readings were obtained at all three stress levels, the flat-jack tests were performed following the protocol described below:
  • The load corresponding to the highest pressure level (4 MPa) was applied to the slab.
  • A cut of approximately 25 cm in length was made perpendicularly to the direction of application of the external load using a circular saw with a blade with diameter of 350 mm and thickness of 3 mm (Figure 5d). The compressive force on the slab was controlled and held constant during the operation. The actual dimensions of the cut slot (length and width) were recorded.
  • The 25 cm flat jack was inserted into the cut slot, while the slab was still subjected to the compressive force.
  • The distances between each pair of gage points (“post-cut readings”) at 14 cm distance were recorded.
  • The pressure in the flat jack was incrementally increased holding the pressure steady at each step, and at each increment the distance between each pair of gage points was measured.
  • The test was stopped when the original gage distances at 4 MPa were restored, and the flat-jack pressure read on the manometer was recorded. The allowable average deviation from the original gage length was 1/20th of the maximum initial deviation, with no single deviation exceeding 1/10th of the maximum deviation. However, as the reliability of glued reference points was not absolute, it was acceptable to reject one gage measurement out of the set of five if it was clearly no longer functional and giving irrational readings.
  • The valve of the flat jack was opened, and the pressure was released, bringing the device back to its initial configuration.
  • The sequence of operations was repeated using the gage points at 20 cm distance.
  • The load applied to the concrete slab was reduced until the 3 MPa stress level was achieved. A 5 min period was waited to allow the load to stabilize.
  • The distances between the pairs of gage points at 14 cm distance were recorded.
  • The pressure in the flat jack was incrementally increased holding the pressure steady at each step, and at each increment the distance between each pair of gage points was measured again, until the original gage distances at 3 MPa were restored within the allowable deviations. The flat-jack pressure was recorded.
  • The sequence of operations was repeated using the gage points at 20 cm distance.
  • The pressure in the flat jack was released, and the load applied to the concrete slab was reduced until the stress level of 2 MPa was achieved.
  • The same procedure described above was repeated for the 2 MPa level.
According to the procedure, measurements were performed by the flat jack at the same location on the slab for each level of compressive stress. At the end of the tests, the 25 cm flat jack was removed. The concrete slab was then reloaded to 4 MPa, and the cut slot was enlarged to accommodate the 33 cm flat jack. The actual dimensions of the enlarged cut slot were recorded. The procedure then followed the same steps described above.
The actual area of the slot was calculated based on the dimensions measured after each cut and used to calculate the correction factor Ka for each test (Table 2). It must be also mentioned that differently from applications in masonry, where steel shims are used to achieve a tight fit of the flat jack into the cut slot and bridge over any interior voids in the masonry, in the present study, no shims were used, and the flat jack was inserted with a small gap into the slot. The size of the gap affected the deformation of the pressurized jack and therefore must be considered in the calibration.

4.2. Flat-Jack Calibration

Before conducting the tests, the flat jacks were calibrated following the guidance of ASTM [30] to determine the conversion factor Km. The calibration setup is illustrated in Figure 7 and included the flat jack, the hydraulic pump, and the manometer that were used in the laboratory tests.
The compression machine used for the calibration included two rigid steel plates, with plan dimensions of 46 × 30 cm, covering the devices being calibrated. To ensure proper alignment with the load axis, the coordinates of the centroid of the two flat jacks were calculated using the AutoCAD 2023 software program [33] (Figure 8). Each flat jack was then positioned on the lower plate of the compression machine so that the maximum offset of the centroid with respect to the load axis was less than 6 mm of the machine’s load axis. Two load cells with different capacities were used depending on the type of flat jack. The load cell used for the 25 cm flat jack had a capacity of 75 kN, while for the 33 cm flat jack, a 500 kN load cell was employed.
Steel shims were inserted between the two rigid plates to simulate different cut slot openings. Spacers measuring 4 mm and 5 mm in thickness were used, corresponding to the actual cut widths measured after the cutting. The flat jack was positioned inside the machine and connected with hoses to the manually operated hydraulic pump. Calibration was performed as follows:
  • The internal pressure of the flat jack was incrementally increased using the hydraulic pump until the desired pressure level was reached, as indicated on the manometer. The pressure steps began at 5 Bar, followed by 10 Bar, and then increased in 10 Bar increments up to 90 Bar.
  • At each step the pressure was maintained constant for approximately 30 s, and the corresponding force was recorded by the load cell.
  • Once the final pressure step was reached and the corresponding force was recorded, the flat jack was fully depressurized.
The whole procedure was repeated for both flat jacks and both gap widths (4 mm and 5 mm), performing each time three cycles of pressurization. For each instrument, the pressure readings at the third cycle were similar to the ones at the second cycle but noticeably different from those at the first cycle, when the flat jack had not yet fully settled. Then, the conversion factor Km was derived as recommended in [30] based on the readings taken at the third cycle:
Km = Pmachine/Pflatjack,
where
  • Pmachine [MPa] is the contact pressure that the flat jack applies to the plates of the machine. It is calculated dividing the load recorded from the load cell by the nominal flat-jack area.
  • Pflatjack [MPa] is pressure inside the flat jack read by the manometer.
Figure 9 illustrates the results of the calibration procedure, reporting the conversion factor Km as a function of the pressure inside the flat jack read on the manometer for both devices. The plots reveal a nonlinear behavior common to both flat jacks, with lower Km values at low pressure. As the flat-jack pressure increased, Km also increased and became proportional to Pflatjack above 50 Bar. The width of the slot gap had a noticeable influence on the conversion factor Km for the 33 cm flat jack, possibly due to variations in the shape factor of the jack, while its effect turned out to be practically negligible for the 25 cm flat jack.

4.3. Assessment of Concrete Stress from Flat-Jack Measurements

The calculation of the stress in the concrete member (fm) from the flat-jack pressure measurements (p) involved the use of the conversion factor Km and the correction factor Ka, according to Equation (1). The process is schematically shown in the flowchart in Figure 10. The inner pressure in the flat jack, measured with the manometer, was multiplied times the conversion factor, which was obtained from the calibration curves of the device. Calibration curves were defined for different slot gap widths; therefore, the actual slot gap must be measured to identify the relevant curve. The stress was further corrected by means of the correction factor Ka, which depended on the measured slot area, to obtain the final concrete stress.

5. Results

This section presents the experimental findings from the preliminary flat-jack tests conducted according to Table 1. Due to the intentionally preliminary nature of this study and the small sample size (only four tests with the 25 cm flat jack and two tests with the 33 cm flat jack were performed), a full statistical analysis was not feasible. Therefore, the results are discussed primarily as trends rather than definitive statistical conclusions.

5.1. Experimental Findings

Figure 11 shows examples of the baseline measurements taken on a concrete slab, with gage lengths of either 20 cm (left panel) or 14 cm (right panel). The diagrams report the relative displacement (Δ) occurring between each pair of gage points as a function of the applied stress in the slab (σc). At each stress level, the relative displacements of the gage point pairs at 14 cm showed better consistency compared with those of the 20 cm gage point pairs. This trend was confirmed in all tests (diagrams not reported for sake of simplicity).
Examples of typical results of the tests are shown in Figure 12, where the concrete stress estimated by the flat jack in accordance with Equation (1), fm, is reported versus the stress in the concrete slab, σc, obtained by dividing the applied compressive force by the cross-section area of the slab. In each test, the conversion factor Km used for estimating fm was adjusted to the actual flat-jack pressure and cut slot width according to the calibration curves reported in Figure 9.
Figure 13 presents the results in terms of average values, showing, for each pressure level in the concrete, the stress measurement estimated as the mean across all tests. These averages account for the type of instrument used (25 cm or 33 cm flat jack) and the gage length (14 or 20 cm). Standard deviations are also reported and shown as error bars.
For ease of comparison, Table 3 and Table 4 report the average error E and the coefficient of variation CoV (defined as the standard deviation divided by the mean) at each pressure level for both the 25 cm and 33 cm flat jacks and for the 14 cm and 20 cm gage length.

5.2. Analysis of Accuracy and Reproducibility

The results of the flat-jack tests were evaluated in terms of both accuracy and reproducibility. Accuracy refers to how the mean of a set of measurements is closed to the “true” stress, while reproducibility indicates how consistent the measurements are when performed under varying boundary conditions (e.g., on different samples).
A notable observation was the large scatter in error (E) and coefficient of variation (CoV), indicating variability in both accuracy and reproducibility depending on the specific test conditions, namely, the instrument used and the chosen gage length. To understand this variability, an attempt was made to distinguish between systematic and random errors. Systematic errors are those inherent to the measurement setup or procedure, consistently biasing results, whereas random errors are unpredictable variations.
Systematic errors related to instrumentation were deemed to be largely controlled. Both flat jacks and extensometers underwent thorough calibration, ensuring an accuracy better than 1%. Also the correct alignment of the concrete slab with respect to the axis of load application was accurately assessed by checking the uniformity of the deformation patterns on the test area of the sample before the cut, as shown, e.g., in Figure 11b. This suggested that any consistent bias due to the primary measuring devices was minimized.
However, other sources of error, which can manifest as either systematic or random depending on their nature, significantly influenced the results. Random errors primarily included the heterogeneity of concrete among different samples. While in each slab, the cut slots for both the 25 cm and 33 cm flat jacks were made at the same location to mitigate within-sample variability, differences in concrete properties between distinct samples would contribute to random error in reproducibility, which could not be estimated due to the limited number of samples. Conversely, potential random errors arising from variations in the dimensions of the cut slots, due to imperfections in their execution, were minimized through the use of the calibration factor Km and the correction factor Ka adjusted to the actual measured dimensions of each slot. Additional random errors may be associated with variations in the applied stress; however, since the hydraulic jack was servo-controlled in force mode, such variations were considered negligible compared with the average stress value. Another crucial factor influencing accuracy and reproducibility, considered a systematic error related to the test setup and concrete interaction, was the distribution of stress in the concrete around the cut slot and its interaction with the gage length. The act of creating the slot for the flat jack fundamentally altered the stress field around the measurement area. The effectiveness and consistency of this stress relief and subsequent redistribution (when the jack is pressurized) were critical. Current guidelines [30,31] recommended that for stress measurement in masonry elements, the gage length l should be composed between 0.3 and 0.6 times the flat-jack primary dimension L defined in Figure 3. However, no specific guidance exists for concrete elements. In this study, gage lengths of 14 cm and 20 cm were chosen as practical options for in situ testing of post-tensioned concrete beams. The 14 cm gage length corresponded to an l/L ratio of 0.56 with the 25 cm flat jack and 0.42 with the 33 cm flat jack. With the 20 cm gage length, these ratios were 0.80 and 0.61. As shown in Figure 11, the deformation pattern on the measurement area of the concrete slab under the incremental application of the axial load was more consistent when the smaller (14 cm) gage length was considered. This observation suggested that the stress redistribution was more uniform or predictable over this shorter distance. The inference was confirmed by the data in Table 3 and Table 4, which clearly demonstrated that the 14 cm gage length provided better accuracy (lower average error E) across both flat jacks. Conversely, no clear trend was observed regarding repetitiveness. Inconsistent stress redistribution due to the cutting process could lead to either overestimation or underestimation depending on how strains were measured and recovered. Interestingly, with the 20 cm gage length, the accuracy tended to improve at higher stress levels, while the 14 cm gage length exhibited the opposite trend. However, these specific patterns were not further explored in this preliminary study.
A second influential factor, also exhibiting characteristics of a systematic error due to its direct relation to the testing setup, concerned the dimensions of the flat jack. As shown in Table 3 and Table 4, the 33 cm flat jack generally provided more accurate estimates when combined with the 14 cm gage length. With the 20 cm gage length, the accuracy was similar to the 25 cm device but at 2 MPa. The CoV was similar at 2 and 3 MPa, but it halved for the 33 cm instrument at 4 MPa, indicating improved consistency at higher stress levels with the larger jack. However, since only two tests were conducted with the larger flat jack, no definitive conclusions should be drawn from this observation alone.
The observed variability, including both overestimation and underestimation of stress, was likely a consequence of the flat-jack test’s interaction with the inherent heterogeneity of concrete, the localized nature of the measurement, and the specific geometric parameters of the test setup (gauge length and flat-jack size). It is worth mentioning that random sign of the error (either positive or negative) is typical of the flat-jack test on masonry as well: the American standard [3] indeed reports that “laboratory studies have shown that the in situ stress test exhibits no inherent bias in predicting the state of compressive stress present in the masonry, that is, the method may over or under estimate the actual compressive stress”.
A plausible explanation for the improved performance of the larger flat jack was its size, and specifically its height as shown in Figure 5c, relative to the maximum aggregate size of the concrete. The 25 cm flat jack penetrated to a depth of 5 cm in the slab, whereas the 33 cm flat jack penetrated to 12 cm. The larger surface of the 33 cm flat jack likely allowed it to interact with a sufficiently large volume of concrete such that the material could be effectively considered a more homogeneous medium, thereby reducing the influence of individual aggregate particles on the stress measurement. On the other hand, with the 25 cm flat jack, the heterogeneity of the concrete across the smaller surface of the device may not be negligible, contributing to higher variability. The statistical scatter (e.g., 43% for the 25 cm flat jack at 2 MPa with a 14 cm gauge length) directly reflected this localized interaction with the material’s heterogeneity. While the 33 cm flat jack showed improved CoV at higher stresses (e.g., 17% at 4 MPa with 14 cm gauge length), suggesting it averaged out heterogeneity better, the 25 cm flat jack (penetrating only 5 cm) was more susceptible to these localized variations.

6. Discussion

This section delves deeper into the implications of the experimental results, placing them within the broader context of prestress assessment, comparing the flat-jack test’s performance in concrete versus masonry, outlining its technical positioning in comparison with other assessment methods, and highlighting the challenges that must be addressed for a successful transition from the controlled laboratory environment to practical engineering applications.

6.1. Significance and Results of the Study

The primary aim of the study was to conduct a preliminary investigation into the experimental feasibility of adapting the flat-jack test for assessing residual stress in post-tensioned concrete elements. Recognizing that concrete exhibited significantly higher stiffness compared with traditional masonry, a key focus was to evaluate the method’s performance in this stiffer material. Specifically, the research sought to analyze the influence of varying gage lengths and flat-jack dimensions on measurement accuracy and consistency, with particular attention to smaller jacks for their potential in minimizing invasiveness and potential damage to steel elements. The study also aimed to assess the resolution achievable with the flat-jack test in concrete and to develop and implement a dedicated calibration procedure reflecting actual testing conditions to enhance the reliability of stress estimations.
The data suggested a direct link between the flat-jack size, gage length, and accuracy. In the tests performed with the 25 cm flat jack and 14 cm gage length, the accuracy error E was typically less than 15%, and the reproducibility error (CoV) was around 40–45%. The 33 cm flat jack, with its deeper penetration, provided more accurate estimates (maximum average error E of 8%) but comparable reproducibility. While the achieved level of reproducibility suggested that further refinement was needed, the accuracy was deemed adequate for its practical purpose of providing an estimate of the level of prestressing in concrete. Considering additional advantages of the methodology, such as low invasiveness, relative ease of implementation, and potentially lower cost compared with techniques like X-ray diffractometry, the flat-jack test emerges as a promising alternative for evaluating residual prestress in PT concrete elements. However, the trends observed in this pilot study with a limited dataset require validation through a broader experimental campaign to confirm these findings and inform the development of standardized procedures.
In conclusion, the observed variability, including both overestimation and underestimation of stress, was likely a consequence of the flat-jack test’s interaction with the inherent heterogeneity of concrete, the localized nature of the measurement, and the specific geometric parameters of the test setup (gage length and flat-jack size). The trends observed, particularly regarding the benefits of the 14 cm gage length and the 33 cm flat jack’s improved performance at higher stresses, underscore these complex interactions.
However, as this is preliminary research with a limited dataset, the explanation is based on the initial observations and potential contributing factors, and future research will be performed in future studies.

6.2. Application Differences Between Concrete and Masonry

The flat-jack test, traditionally a well-established method for assessing in situ stress and deformability in masonry structures, presents distinct application differences when transferred to concrete, particularly prestressed concrete. These differences primarily stem from the varying forms of material heterogeneity and the presence of embedded steel elements.
In masonry structures, heterogeneity is intrinsic to their composite nature, comprising discrete units (bricks and stones) bound by mortar joints. The mechanical properties of units and mortar can vary significantly, and the presence of bed and head joints creates planes of weakness and anisotropy. The slot cut for the flat jack typically intersects both units and mortar, leading to a complex stress redistribution, which is further enhanced by geometrical heterogeneities like voids created by the cut. Steel shims are commonly used to achieve a tight fit and bridge over any interior voids. The interpretation of the measured stress relief and subsequent re-compression must account for this inherent heterogeneity as the test aims to capture an average stress state over the tested area, influenced by the varying stiffnesses and potential localized cracking within the composite material.
On the other hand, concrete structures, although seemingly more homogeneous than masonry, possess their own forms of heterogeneity due to the presence of aggregates, cement paste, and micro-voids. The size and distribution of coarse aggregates can influence the cutting process and the localized stress field around the flat-jack slot, potentially affecting readings. Nevertheless, when the dimension of the flat jack is sufficiently large with respect to the size of the aggregate, the effect of such heterogeneities can be assumed to be negligible. A more significant and unique challenge in concrete, especially post-tensioned members, is the distribution of steel reinforcement and prestressing tendons. Unlike masonry, where the test primarily interacts with the load-bearing masonry fabric, in concrete, the flat-jack slot must be carefully positioned to avoid cutting through reinforcing bars or prestressing tendons (which can be detected, e.g., by performing a preliminary ground-penetrating radar survey). The presence of these embedded steel elements fundamentally alters the stress flow within the concrete. The flat-jack test in this context aims to measure the residual compressive stress in the concrete cross-section, which is a direct consequence of the prestressing force exerted by the tendons. Therefore, understanding the influence mechanisms of concrete’s inherent heterogeneity and, more importantly, the precise location and stress contribution of the steel reinforcement and prestressing system, becomes paramount for accurate test execution and reliable interpretation of results.
This distinction highlights why the application of the flat-jack test to prestressed concrete constitutes a novel and more complex investigation, requiring a thorough understanding of these material and structural interactions. For its practical application to concrete, it is necessary to develop a comprehensive stress transfer model that accounts for the complex material and structural interactions between the concrete and embedded steel elements, effectively correlating the localized stress measurement obtained by the flat jack to the actual, overall stress distribution within the reinforced concrete cross-section and to the tensile force in the tendons. However, given the preliminary nature of this study, such a detailed model has not yet been developed.
The study was intentionally kept simple, and a controlled experimental setup using C20/25 concrete under axial compression was designed to establish a baseline understanding and gather initial, reliable data. This approach was crucial for establishing a baseline understanding before embarking on a more extensive and complex research program. Deeper experimental investigations, encompassing a broader range of variables, and more advanced analytical analyses, including the development of comprehensive stress transfer models, will be pivotal for developing practical guidelines for the application of the method and are planned for future research.

6.3. Reproducibility of the Test

It is worth comparing the large measurement spreads obtained experimentally with the typical variability of the flat-jack test conducted on masonry structures, where this method is widely adopted and standardized.
In masonry the flat-jack test is generally considered a reliable method for assessing in situ compressive stress and deformability. This reliability stems from extensive research and practical experience, with various national and international standards [30,31] providing guidelines for its application. Accuracy can often be within ±10–20% of the actual stress, particularly for average stress determination over large areas [5,8]. In general, the variability ranges from 15 to 30%, depending on the heterogeneity of the masonry, the skill of the operator, and the consistency of the cutting and jacking procedures. The standard ASTM C1196 [30] acknowledges that the CoV of this method can be as great as 20% and recommends performing at least three tests in the same general area to verify the test results. Despite this variability, the method is commonly accepted in in situ structural testing as the test effectively averages out the macro-heterogeneity of units and mortar over the tested area.
The use of flat-jack tests in concrete is less prevalent and not as well documented as in masonry. However, the variability is expected to be influenced by factors, reinforcement layout, and concrete curing conditions. When applying the flat-jack test to concrete, especially for residual prestress in post-tensioned elements, the material’s properties such as aggregate size distribution and the presence of embedded steel introduce new complexities that can influence measurement accuracy and spread. To the knowledge of the authors of this paper, specific data on the CoV for flat-jack tests in concrete are missing. Garbowski et al. [34] discuss the application of flat-jack tests in concrete dams, highlighting the method’s potential for assessing stresses and Young’s modulus in deteriorated concrete structures. However, while they emphasize the need for careful calibration and interpretation, specific CoV values are not provided. Proverbio et al. [7] and Venturi et al. [29] report the results of prestressing load estimation in post-tensioned concrete beams but do not provide specific information on the spread of measurements.
In the current study, CoV values from tests performed on unreinforced concrete slabs ranged from 25% to 43% for the 25 cm flat jack and 10% to 40% for the 33 cm flat jack, which were significantly higher than the typical CoV values reported for masonry. Several factors which can contribute to this divergence, including heterogeneity of concrete properties among the tested slabs and interaction between the flat jack and the randomly distributed micro-heterogeneities of concrete (aggregates, cement paste, and voids), have been already discussed. However, the small dataset means that the high spreads are indicative of trends rather than definitive statistical conclusions. A larger experimental campaign would be necessary to confirm these observed divergences and better understand their statistical distribution.

6.4. Technical Positioning of the Flat-Jack Test

Existing methods for assessing the prestress in concrete, or alternatively the tensioning force in the steel tendons, are described in Section 2 of this paper and include X-ray diffractometry and stress release methods such as the drilled-hole method, the saw-cut method, and the proposed flat-jack test. Each method has distinct advantages and disadvantages. Understanding these distinctions clarifies the technical positioning of the flat-jack test as a promising alternative.
Invasiveness is a key differentiating factor. XRD is highly invasive, often requiring complete removal of concrete cover and grout to expose steel for direct measurement, making it impractical for routine bridge inspections. Drilled-hole and saw-cut methods are semi-destructive, creating localized damage (namely, a small hole or a slot, respectively) that requires repair. The flat-jack test is also semi-destructive, involving a slot cut, but its localized damage is manageable and repairable, often considered comparable to or slightly less impactful than a full saw cut for stress relief.
Each method presents its own nuances regarding detection accuracy. XRD measures the stress in exposed steel wires and requires a detailed mechanical model to relate such measurement to the overall tensile force in the tendon. Its accuracy is limited by its surface-sensitive nature and the inherent difficulty of accessing internal components without altering the stress state, making it less reliable for representing the overall prestress within the concrete matrix or at greater depths. Drilled-hole and saw-cut methods provide moderate to high local accuracy for localized stress measurements immediately around the cut. Their accuracy, however, heavily depends on meticulous execution, accurate strain measurement, and the correct application of theoretical or empirical correlations, with factors like material heterogeneity and precise cut geometry influencing the results. The flat-jack test provides moderate accuracy, sensitive to precise jack fit in the slot and accuracy of its calibration coefficients, and requires advanced models to translate local readings to global stress states. Setup conditions like gage length and jack size can also influence its accuracy and must be included in the model.
In terms of operational efficiency, XRD is very low for field applications due to bulky equipment, specific power and environmental requirements, and the need for highly trained personnel. Drilled-hole and saw-cut methods have medium efficiency, requiring specialized cutting or drilling tools along with strain gages and data acquisition systems. The process can be time-consuming per test point, encompassing cutting, strain gage installation, measurement, and subsequent repair, often demanding complex site logistics. The flat-jack test also has medium operational efficiency; its equipment is generally less complex and more portable than XRD, and its procedure can be comparatively quicker than some drilled-hole setups, making it moderately efficient for field deployment, although it still necessitates post-test repair.
From a cost perspective, XRD is typically the most expensive due to high equipment and specialized labor cost. At present stage it is still reserved for fundamental research. Drilled-hole and saw-cut methods fall into the moderate to high cost range. Significant investment in specialized equipment may be required, and the labor involved in preparation, testing, and post-test repair substantially contributes to the overall expense, with costs escalating quickly for multiple test points. The flat-jack test for masonry structures typically lies in the medium cost range, and the same is expected when transferred to concrete. While the initial investment for specialized equipment (jacks, pump, gages, and cutting tools) can be notable, the per-test cost might be competitive once the equipment is acquired.
The competitive advantages of the flat-jack test stem from its ability to directly measure residual stress in the concrete matrix, offering a more direct assessment than many indirect NDT methods. It presents a viable balance between obtaining valuable quantitative stress data and maintaining an acceptable level of invasiveness for in-service bridges. Its relative simplicity and field adaptability, especially compared with laboratory-intensive techniques like XRD, position it as a promising alternative.

6.5. Transition from Laboratory Testing to Practical Application

The successful transition of the flat-jack test from a controlled laboratory setting to practical engineering applications, particularly for assessing prestress in concrete bridges, necessitates addressing several key practical considerations and operational procedures that go beyond the fundamental feasibility explored in this study, including, e.g., slot depth control, steel bar avoidance, optimal flat-jack size, and adaptation to diverse cross-sectional forms.
Slot depth control is crucial not only for ensuring the structural integrity of the element but also for the accuracy and repeatability of the test. An excessively shallow cut might not sufficiently relieve the stress in the concrete surrounding the flat jack, leading to an underestimation of the true stress. Conversely, an overly deep cut could damage the structure or increase the risk of encountering internal reinforcement or prestressing tendons. Closely related is the critical aspect of steel bar and tendon avoidance. In a reinforced or prestressed concrete member, the flat-jack slot must be meticulously planned to bypass any embedded steel. Preliminary ground-penetrating radar surveys can aid in locating these elements and define a precise minimum slot distance to avoid damaging steel bars or prestressing tendons.
Furthermore, the choice of flat-jack size presents a key practical trade-off. While smaller flat jacks offer the advantage of reduced invasiveness and potentially easier application in confined spaces, they may be more susceptible to the localized heterogeneity of concrete and less representative of the average stress across a larger section. Conversely, larger flat jacks tend to average out the effects of local heterogeneity, potentially providing a more representative stress measurement for the overall concrete element, but they inherently require a larger and more invasive cut, which might not always be feasible or desirable on in-service structures. This selection directly impacts both the practical execution of the test and the interpretability of its results in a heterogeneous material.
Finally, the adaptation of the flat-jack test to different cross-sectional forms, such as T-beams, box girders, or slabs with varying thicknesses, introduces complexities in test point selection and result interpretation. Unlike the axially loaded, uniform concrete slabs examined in this study, real bridge elements exhibit complex stress distributions, often involving combined bending–shear forces, eccentric loads, and non-uniform sections. Selecting test points in such geometries requires careful consideration of stress gradients and the influence of internal structural features. The localized stress measurement obtained by the flat jack must be accurately correlated to the global stress state of the member, which is significantly more intricate in complex cross-sections.
While these practical considerations are critical for the widespread adoption and reliability of the flat-jack test in the field, their detailed investigation falls outside the primary scope of this preliminary study. The development of comprehensive guidelines concerning slot depth control, steel bar avoidance (including specific minimum distances) and optimal flat-jack sizing strategies, and methodologies for adapting the test to various complex cross-sections, along with their detailed implications on results, represent essential avenues for future research.

7. Conclusions

This preliminary study successfully explores the fundamental feasibility of employing the flat-jack test for the assessment of prestress in PT concrete elements. The experimental investigations, conducted under controlled laboratory conditions, provided initial insights into the method’s performance in a stiffer material than its traditional application in masonry.
The results confirm that the flat-jack test can provide consistent stress estimations in concrete, with accuracy and reproducibility influenced by test parameters such as gauge length and flat-jack size. While the observed measurement spread in concrete is higher than typically reported for masonry, the accuracy achieved, particularly with optimal parameters (e.g., 14 cm gauge length and 33 cm flat jack), is deemed adequate for providing a fair estimate of the prestressing level.
Despite the intentionally simple experimental design and analytical approach, this pilot study highlights the potential of the flat-jack test as a valuable semi-destructive alternative for prestress assessment, providing interesting inspirations and initial insights. Its direct measurement capability, coupled with a more acceptable level of invasiveness and operational efficiency compared with highly destructive or complex methods, positions it favorably in the context of bridge inspection technologies.
However, the findings also underscore the need for further comprehensive research. This includes developing a detailed stress transfer model to correlate localized flat-jack measurements to overall stress distribution; expanding experimental campaigns to cover a broader range of concrete types, stress states, and degradation factors; and establishing specific engineering application guidelines for slot depth control, steel bar avoidance, and adaptation to complex cross-sections. These future investigations are crucial to fully develop and validate the flat-jack test for widespread practical application in the field.

Author Contributions

Conceptualization, D.R., C.P. and V.Q.; methodology, D.R., C.P. and V.Q.; investigation, D.R. and C.P.; data curation, D.R. and V.Q.; writing—original draft preparation, D.R.; writing—review and editing, V.Q.; supervision, S.C. All authors have read and agreed to the published version of the manuscript.

Funding

This research was funded by the FABRE Research consortium for the evaluation and monitoring of bridges, viaducts, and other structures, within the framework of SAFOTEB (“A reviewed safety format for structural reliability assessment of posttensioned concrete bridges”) research project.

Data Availability Statement

The raw data supporting the conclusions of this article will be made available by the authors on request.

Acknowledgments

This research was conducted with the support of GRConsulting s.r.l. and the Materials Testing Laboratory (LPM) at Politecnico di Milano, Italy. The authors are especially grateful to Daniele Spinelli and Giacomo Vazzana for their support during the execution of the tests and the calibration of the equipment, as well as to GRConsulting for their valuable technical and practical assistance and for providing the equipment used in testing. Special thanks go to Ing. Giancarlo Raoli, Ing. Valerio Carusi, Ing. Angelo Forte, and Paolo Rossi for their professional contributions and continued support throughout the experimental activities.

Conflicts of Interest

The authors declare no conflicts of interest.

References

  1. Gupta, P.R. Post-Tensioning Manual, 6th ed.; Post-Tensioning Institute: Phoenix, AZ, USA, 2006; pp. 24–35. [Google Scholar]
  2. Rymsza, J. Causes of the Collapse of the Polcevera Viaduct in Genoa, Italy. Appl. Sci. 2021, 11, 8098. [Google Scholar] [CrossRef]
  3. Menga, A.; Kanstad, T.; Cantero, D.; Bathen, L.; Hornbostel, K.; Klausen, A. Corrosion-Induced Damages and Failures of Posttensioned Bridges: A Literature Review. Struct. Concr. 2023, 24, 84–99. [Google Scholar] [CrossRef]
  4. European Committee for Standardization (CEN). EN 1992: Design of Concrete Structures—Part 1-1: General Rules and Rules for Buildings, Bridges and Civil Engineering Structures; CEN: Brussels, Belgium, 2023; ISBN 9780539162332. [Google Scholar]
  5. Gregorczyk, P.; Lourenço, P.B. A Review on Flat-Jack Testing. Eng. Civil. 2000, 9, 39–50. [Google Scholar]
  6. Fedele, R.; Maier, G. Flat-Jack Tests and Inverse Analysis for the Identification of Stress States and Elastic Properties in Concrete Dams. Meccanica 2007, 42, 387–402. [Google Scholar] [CrossRef]
  7. Proverbio, E.; Recupero, A.; Venturi, V. Integrating Destructive and Non-Destructive Inspection Techniques in Evaluating Tendon Corrosion in Post-Tensioned Concrete Beams. In Proceedings of the CACRCS-DAYS Workshop, Online, 30 November–3 December 2021. [Google Scholar]
  8. Fabre Consortium. Ispezioni Speciali Su Ponti Esistenti in c.a.p. a Cavi Scorrevoli Ai Sensi Delle Linee Guida; Fabre: Pisa, Italy, 2022. (In Italian) [Google Scholar]
  9. Federal Highway Administration (FHWA). Guidelines for Sampling, Assessing, and Restoring Defective Grout in Prestressed Concrete Bridge Post-Tensioning Ducts; Federal Highway Administration: Washington, DC, USA, 2013. [Google Scholar]
  10. Highways England. CS 465—Management of Post-Tensioned Concrete Bridges; Highways England: London, UK, 2020. [Google Scholar]
  11. Highways England. CS 464—Non-Destructive Testing of Highways Structures; Highways England: London, UK, 2020. [Google Scholar]
  12. Civjan, S.A.; Jirsa, J.O.; Carrasquillo, R.L.; Fowler, D.W. Instrument to Evaluate Remaining Prestress in Damaged Prestressed Concrete Bridge Girders. PCI J. 1998, 43, 62–71. [Google Scholar] [CrossRef]
  13. Morelli, F.; Panzera, I.; Piscini, A.; Salvatore, W.; Chichi, F.; Marconi, G.P.; Maestrini, D.; Gammino, M.; Mori, M. X-Ray Measure of Tensile Force in Post-Tensioned Steel Cables. Constr. Build. Mater. 2021, 305, 124743. [Google Scholar] [CrossRef]
  14. Zanini, M.A.; Faleschini, F.; Pellegrino, C. New Trends in Assessing the Prestress Loss in Post-Tensioned Concrete Bridges. Front. Built Environ. 2022, 8, 956066. [Google Scholar] [CrossRef]
  15. Mazzatura, I.; Salvatore, W.; Caprili, S.; Celati, S.; Mori, M.; Gammino, M. Damage Detection, Localization, and Quantification for Steel Cables of Post-Tensioned Bridge Decks. Structures 2023, 57, 105314. [Google Scholar] [CrossRef]
  16. American Society for Testing and Materials (ASTM). Test Method for Determining Residual Stresses by the Hole-Drilling Strain-Gage Method; ASTM International: West Conshohocken, PA, USA, 2013. [Google Scholar]
  17. Owens, A. In-Situ Stress Determination Used in Structural Assessment of Concrete Structures. Strain 1993, 29, 115–124. [Google Scholar] [CrossRef]
  18. Azizinamini, A.; Keeler, B.J.; Rohde, J.; Mehrabi, A.B. Application of a New Nondestructive Evaluation Technique to a 25-Year-Old Prestressed Concrete Girder. PCI J. 1996, 41, 82–95. [Google Scholar] [CrossRef]
  19. Comité Euro–International du Béton (CEB). Strategies for Testing and Assessment of Concrete Structures Affected by Reinforcement Corrosion; CEB Bulletin No. 243; Comité Euro-International du Béton (CEB): Lausanne, Switzerland, 1998; pp. 1–184. [Google Scholar]
  20. Kukay, B.M. Bridge Instrumentation and the Development of Non-Destructive and Destructive Techniques Used to Estimate Residual Tendon Stress in Prestressed Girders. Master’s Thesis, Utah State University, Logan, UT, USA, 2008. [Google Scholar]
  21. Kukay, B.; Barr, P.J.; Halling, M.W.; Womack, K. Determination of the Residual Prestress Force of In-Service Girders Using Non-Destructive Testing. In Structures Congress 2010; American Society of Civil Engineers (ASCE): Orlando, FL, USA, 2010; pp. 709–716. [Google Scholar]
  22. Bagge, N.; Nilimaa, J.; Elfgren, L. In-Situ Methods to Determine Residual Prestress Forces in Concrete Bridges. Eng. Struct. 2017, 135, 41–52. [Google Scholar] [CrossRef]
  23. Kraľovanec, J.; Moravčík, M.; Bujňáková, P.; Jošt, J. Indirect Determination of Residual Prestressing Force in Post-Tensioned Concrete Beam. Materials 2021, 14, 1338. [Google Scholar] [CrossRef] [PubMed]
  24. Shushkewich, K.W. The Story of Eugène Freyssinet. Concr. Int. 2013, 35, 47–52, 72. [Google Scholar]
  25. Łatka, D.; Matysek, P. The Estimation of Compressive Stress Level in Brick Masonry Using the Flat-Jack Method. Procedia Eng. 2017, 193, 266–272. [Google Scholar] [CrossRef]
  26. Carpinteri, A.; Invernizzi, S.; Lacidogna, G. In Situ Damage Assessment and Nonlinear Modelling of a Historical Masonry Tower. Eng. Struct. 2005, 27, 387–395. [Google Scholar] [CrossRef]
  27. Binda, L.; Tiraboschi, C. Flat-Jack Test: A Slightly Destructive Technique for the Diagnosis of Brick and Stone Masonry Structures. Int. J. Restor. Build. Monum. 1999, 5, 449–472. [Google Scholar]
  28. Forcellini, D.; Giardi, F.; Tanganelli, M. Seismic Assessment of the Historical Third Tower in San Marino Based on a 3D Laser Scanner Survey (3D-LSS). Innov. Infrastruct. Solut. 2019, 4, 20. [Google Scholar] [CrossRef]
  29. Venturi, V.; Santacroce, D.; Longo, P.; Proverbio, E. Interventi Di Diagnosi Strutturale Su Un Ponte in Cemento Armato Precompresso. In Proceedings of the Atti Giornate Nazionali sulla Corrosione e Protezione, Messina, Italy, 20–22 June 2007; pp. 141–147. (In Italian). [Google Scholar]
  30. ASTM C1196; Test Method for In Situ Compressive Stress Within Solid Unit Masonry Estimated Using Flatjack Measurements. ASTM International: West Conshohocken, PA, USA, 2014.
  31. RILEM. RILEM Recommendation MDT. D.4: In-Situ Stress Tests Based on the Flat Jack; RILEM: Champs-sur-Marne, France, 1999. [Google Scholar]
  32. Lulić, L.; Stepinac, M.; Bartolac, M.; Lourenço, P.B. Review of the Flat-Jack Method and Lessons from Extensive Post-Earthquake Campaign in Croatia. Constr. Build. Mater. 2023, 384, 131407. [Google Scholar] [CrossRef]
  33. Autodesk Inc. AutoCAD 2023 Manual; Autodesk Inc.: San Rafael, CA, USA, 2022. [Google Scholar]
  34. Garbowski, T.; Maier, G.; Novati, G. Diagnosis of Concrete Dams by Flat-Jack Tests and Inverse Analyses Based on Proper Orthogonal Decomposition. J. Mech. Mat. Struct. 2011, 6, 181–202. [Google Scholar] [CrossRef]
Figure 1. Flat-jack test performed in situ on a post-tensioned T-beam, adapted from reference [29]: (a) cross-section of the T-beam illustrating the position of the flat jack; (b) bottom view of the beam, showing the cut slot for the flat jack and the gage points across the slot; and (c) a picture of the test, with the flat jack inserted in the slot, where the oil pipe for pressurizing the flat jack is also visible on its left.
Applsci 15 06199 g001
Figure 2. Schematic representation of the main steps of the procedure, adapted from reference [31].
Applsci 15 06199 g002
Figure 3. Area of the flat jack (in blue) and area of the cut slot (delimited by the dashed line).
Applsci 15 06199 g003
Figure 4. Experimental set-up: (a) Schematic representation. (b) Concrete slab positioned in the test set-up.
Applsci 15 06199 g004
Figure 5. Implementation of the testing procedure: (a) Layout of cut line and gage points (dimensions in cm). (b) Cut line and gage points positions drawn on slab 1. (c) Flat jacks involved in the study. (d) Cutting of the slot with a circular saw, where the red arrow indicates the longitudinal axis of the concrete slab.
Applsci 15 06199 g005
Figure 6. Pump with manometer connected to the inlet port of the flat jack.
Applsci 15 06199 g006
Figure 7. On the right, the compression machine used for the flat-jack calibration, and on the left, the manual hydraulic pomp with its manometer and the control panel to record the readings from the load cell.
Applsci 15 06199 g007
Figure 8. (a) Centroid coordinates of flat jack A. (b) Centroid coordinates of flat jack B.
Applsci 15 06199 g008
Figure 9. Calibration curves of (a) a 25 cm flat jack (“A”) and (b) a 33 cm flat jack (“B”) for gap δ = 4 mm and δ = 5 mm.
Applsci 15 06199 g009
Figure 10. Flowchart representing the calculation process of the concrete stress from the flat-jack pressure measurements.
Applsci 15 06199 g010
Figure 11. Baseline measurements taken on sample 3: (a) Gage length, 20 cm. (b) Gage length, 14 cm.
Applsci 15 06199 g011
Figure 12. Calculated and applied stress on sample 4 using the (a) 25 mm flat jack and (b) 33 mm flat jack.
Applsci 15 06199 g012
Figure 13. Average concrete stress estimated in flat-jack tests. Labels: M25_14, 25 cm flat jack, 14 cm gage length; M25_20, 25 cm flat jack, 20 cm gage length; M33_14, 33 cm flat jack, 14 cm gage length; and M33_20, 33 cm flat jack, 20 cm gage length.
Applsci 15 06199 g013
Table 1. Flat-jack test layout.
SampleTestFlat Jack
1M1AA
M1BB
M2AA
2M3AA
3M4AA
M4BB
Table 2. Correction factors Ka for flat-jack tests.
TestFlat JackCut Slot AreaFlat-Jack Area Ka
[cm2][cm2][-]
M1A25 cm95.1985.940.90
M1B33 cm290.12290.121.00
M2A25 cm85.9485.941.00
M3A25 cm88.8485.940.97
M4A25 cm88.0085.940.98
M4B33 cm304.72290.120.95
Table 3. Average error E and coefficient of variation CoV of tests conducted with the 25 cm flat jack.
Flat Jack 25 cm
σc [MPa]14 cm Gage Length 20 cm Gage Length
ECoVECoV
23%43%42%42%
3−4%30%20%41%
4−14%41%13%25%
Table 4. Average error E and coefficient of variation CoV of tests conducted with the 33 cm flat jack.
Flat Jack 33 cm
σc [MPa]14 cm Gage Length 20 cm Gage Length
ECoVECoV
21%36%20%40%
31%40%23%10%
48%17%17%24%
Disclaimer/Publisher’s Note: The statements, opinions and data contained in all publications are solely those of the individual author(s) and contributor(s) and not of MDPI and/or the editor(s). MDPI and/or the editor(s) disclaim responsibility for any injury to people or property resulting from any ideas, methods, instructions or products referred to in the content.

