1. Introduction
Eye tracking is highly interdisciplinary and can be used in numerous fields, including cognitive science, psychology, neurology, engineering, medicine, and marketing [
1,
2]. The application of eye tracking in human–computer interaction allows disabled people to interact with a computer through gaze [
3]. Eye monitoring can also be used to track car drivers [
4] or pilots [
5].
Extracting events from eye movement data is the most important step for automated visual behavior analysis and for many applications [
6]. The movement of the eye is typically divided into several types of events. The most important is fixation, a low-speed movement that occurs when the person focuses their eyes on an object. The purpose of fixation is to stabilize the object in the fovea for clear vision [
7]. Saccade is a high-speed eye movement from one fixation to another [
8]. A smooth pursuit (SP) event is performed only when the eyes follow a slowly moving object [
9,
10]. Post-saccadic oscillation (PSO) events are rapid oscillatory movements that may occur immediately after a saccade. They can be described as instabilities that appear at the end of a saccade and are characterized by a slight wobbling movement that leads to fixation after a saccade [
10,
11].
The problem of automatic detection of eye movement events has been studied for many years. However, it is associated with many challenges. For instance, raw eye-tracking data frequently consist of disturbances and noise, which may make it difficult for detection methods to identify events correctly. Moreover, differentiating between PSOs, SPs, fixations, and saccades, as well as finding precise onsets and offsets of events, may be difficult even for manual coders, and there is evidence that there are differences in event classification even between experienced coders [
12,
13].
Today, event detection is performed by processing raw eye-tracking data with specialized detection algorithms. Threshold-based and fully automated event detection algorithms have been used in previous works. For a long time, two broad classes of threshold-based algorithms have been used to detect eye movement events. The first class includes dispersion threshold-based algorithms that detect fixations [
14]. The most popular dispersion-based algorithm is the I-DT algorithm by Salvucci and Goldberg [
15]. These algorithms detect events, assuming that, for the fixation, the raw recorded data must fit in a spatial box for a specified minimum time. The second category is the velocity-based algorithms that focus on detecting saccades. The most popular velocity-based algorithm is the I-VT algorithm [
16,
17]. These algorithms classify eye movement data by calculating velocities and comparing them with a predefined threshold. Although the algorithms above differentiate between fixations and saccades only, Komogortsev et al. [
18] proposed the first automated event detection method that may also be used to classify smooth pursuits. Larsson et al. [
19] proposed another threshold-based approach for identifying fixations and smooth pursuits during intersaccadic intervals. The approach performed the classifications in three stages, as follows: a preliminary segmentation evaluating the characteristics of each such segment and reorganizing the preliminary segments into fixations and smooth pursuit events. This approach was proposed to address the misclassification between fixations and smooth pursuits. However, like all other threshold-based approaches, this approach also requires the end users to set threshold parameters manually, and the three-stage identification process makes the approach complex and time-consuming.
As event detection involves classifying each raw gaze sample into a separate class (event), applying machine learning algorithms to this task seems straightforward. Several attempts have been published using machine learning and, specifically, deep learning techniques to perform event detection [
20,
21,
22]. Details are provided in the
Section 2.
However, currently available event detection methods are unable to detect fixations, saccades, PSOs, and smooth pursuits simultaneously. In this study, we proposed a combination of 2D-CNN with an LSTM deep learning model that simultaneously identifies fixations, saccades, PSOs, and smooth pursuits. We aim to find the combination of features that gives the best results for different events. We compared the proposed model for different sets of features extracted from the raw data and with the baseline method, which is the most similar to our approach, presented in [
21]. We made this comparison on two levels, i.e., a sample level and an event level. Finally, we evaluated event measures for the proposed methods and compared them to the results of manual classification. The event-measuring metrics were the number of events and the mean duration of events. We tested the performance of our methods on the publicly available dataset described in the
Section 3.
This work has significant practical implications for eye-tracking applications. For example, in human–computer interaction (HCI), accurate eye movement classification can improve gaze-based interfaces, enabling smoother and more intuitive user experiences. In medical diagnosis, the precise identification of eye movement events can help in the early detection of neurological disorders such as Parkinson’s disease or multiple sclerosis, where abnormalities in eye movements serve as critical diagnostic markers. By improving the classification performance for multiple eye movement events simultaneously, this model could provide more reliable and detailed eye-tracking analytics, facilitating advancements in both HCI systems and clinical diagnostics.
The main contributions of the paper are as follows:
Testing the performance of the models for different feature sets consisting of velocity, acceleration, jerk, and direction.
Creating a model that simultaneously classifies four types of events, i.e., fixations, saccades, smooth pursuits, and post-saccadic oscillations.
Comparison of the usability of different features in classifying specific events.
Proposing the use of event statistics as a simple tool to evaluate the quality of a model.
The remainder of this paper is structured as follows: The related work is reviewed in
Section 2.
Section 3 describes the dataset used in this study, including its characteristics and potential biases. The proposed method is discussed in
Section 4. Results and discussion are presented in
Section 5.
Section 6 evaluates the proposed methods using event measures. Finally, the paper concludes in
Section 7, where future directions are outlined.
2. Related Works
Event detection can be performed manually by human coders or algorithms. In manual event detection, one or more human experts classify raw eye-tracking data into different event types based on subjective threshold values. Manual event classification is still treated as a “golden standard” [
12]. However, manual classification is ineffective at classifying eye movement events. Firstly, it is time-consuming, and secondly, different coders might also use distinctive subjective selection regulations that give different results [
23].
Threshold-based methods were the first automated eye movement event classification algorithms and are still frequently used [
15]. For example, Salvucci and Goldberg evaluated five different threshold-based event detection algorithms that were introduced by different authors. The evaluation was based on spatial and temporal criteria. The algorithms were namely, I-VT, I-DT [
15], I-HMM [
24], I-AOI, and I-MST [
15]. The I-DT is a simple eye movement event detection algorithm that distinguishes fixation and saccade points based on the dispersion of subsequent sample coordinates. The algorithm classifies gaze samples as elements of fixation when they are located within a spatially limited area (for example, 0.5°) for the minimum allowed fixation duration [
25]. It follows the assumption that fixation points generally occur close to each other. The saccades are then implicitly classified as everything else [
15]. However, dispersion threshold methods poorly detect fixations and saccades when the signal is noisy [
26]. Therefore, choosing the optimum threshold greatly impacts the classification performance and can lead to biased results and misclassifications.
The I-VT event detection algorithm is another threshold-based algorithm and the foundation for automated, objective standard event detection. Many studies have adopted this approach [
27,
28]. It assumes that saccadic eye movements are characterized by high velocity, and fixational movements by low velocity [
15]. However, just like I-DT, the classic I-VT method is designed to classify eye-tracking input data into fixations and saccades only. The other event types, like smooth pursuits, post-saccadic oscillations, and noises, are not considered. Finding the optimum threshold value is also challenging.
One of the main problems with threshold-based event detection methods discussed in this section is that they can only identify fixation and saccade movements. In order to address this problem, Komogortsev and Karpov [
18] proposed the first ternary automated event detection methods. The methods classify raw eye-tracking data into fixations, saccades, and smooth pursuits. The methods are I-VVT, I-VDT, and I-VMP. The I-VVT algorithm identifies fixations, saccades, and smooth pursuits (SPs) by first applying the I-VT algorithm to classify fixations and saccades using the existing threshold, then using one more threshold to distinguish SPs from fixations. The I-VMP algorithm distinguishes smooth pursuits from fixations using the movement direction. The I-VDT algorithm integrates both I-VT and I-DT to classify fixations, saccades, and smooth pursuits. As in I-VVT, I-VDT first applies the velocity threshold to classify saccades and fixations, and then the dispersion threshold is applied to distinguish fixations and smooth pursuits. The drawback of these methods is that they are still threshold-based, so the user must manually set the optimum threshold values. In addition, the identification process is done in two steps and requires two optimum threshold values.
Finding the optimum threshold value in threshold-based event detection methods is challenging, as threshold values vary depending on the type of task, data quality, and the user. In order to address these issues, Ref. [
29] proposed an automated velocity threshold data-driven event classification method. The algorithm can find the threshold adaptively and avoid the influence of noise by using adaptive VT values, considering different levels of noise occurrence. It also detects glissades as separate event types. However, glissades are detected based on duration only, which may lead to short saccades being classified as glissades or long glissades being classified as saccades. The algorithm can identify fixations, saccades, and glissades only. It does not consider smooth pursuits.
Threshold-based event detection methods require several threshold parameters, and finding the optimal values can be challenging. Machine learning and deep learning approaches can address these problems by applying end-to-end, fully automated event detection without human intervention or manually setting parameters like thresholds. These approaches are becoming popular in eye movement event detection. For instance, Ref. [
30] proposed a fully automated eye movement event classification using a random forest classifier. The method classifies the input data into fixations, saccades, and PSOs. According to the authors, the machine learning approach outperforms other event detection methods. However, this method does not consider the important event type (smooth pursuit). The other fully automated event detection method was proposed in [
22]. It is based on a deep convolutional neural network that predicts probabilities for each sample to belong to a fixation, saccade, or smooth pursuit based on a sequence of gaze samples. The approach uses the signal’s frequency to classify the data into event types. The method classifies fixations, saccades, and smooth pursuits only. The comparison is done with velocity and dispersion threshold algorithms only.
Ref. [
21] showed another example of applying deep learning to event detection. The proposed network combines a 1D convolutional network with a BLSTM layer. It classifies raw eye movement data into fixations, saccades, and smooth pursuits. Individual feature sets used for the model are raw xy coordinates, speed, acceleration, and direction. According to the authors, the combination of direction and speed provided good results. Acceleration as an additional feature did not improve the average event classification, probably because it cannot be used to distinguish smooth pursuits from fixations. The algorithm identifies fixations, saccades, and smooth pursuits. It does not consider PSO event types. Another deep learning approach in [
31] is proposed for online event classification for fixations, saccades, and smooth pursuits.
In summary, there have been many attempts to utilize machine learning and deep learning for eye movement event detection. However, to the authors’ knowledge, none of them attempted to combine the four eye movement features used in this work or to develop a model that simultaneously classifies eye movement data into four event types, i.e., fixations, saccades, smooth pursuits, and post-saccadic oscillations.
3. Dataset
To train and test the model, a manually annotated eye-tracking dataset was used, which had also been used in many previous studies [
9,
21,
22,
30]. The dataset was recorded with a Hi-Speed 1250 eye tracker from SensoMotoric Instruments at 500 Hz. The data were labeled by two manual raters, Marcus Nyström (MN) and Richard Andersson (RA), and annotated into six event types, i.e., fixations, saccades, PSOs, smooth pursuits, blinks, and undefined.
The subjects were presented with static images, video clips, and simple moving dot stimuli. The evaluation focused on the video domain with event classes including fixations, saccades, PSOs, and smooth pursuits, as the study was centered on these four types. Image viewing and moving dot data were not included because image viewing datasets lacked smooth pursuit events, and the moving dot domain did not contain a time-stamp feature, which was essential to calculate features such as velocity, acceleration, and jerk, which are key features in building the model. Six files with video stimuli were selected for the experiment, containing a total of 16,952 gaze samples. Among these, 36.4% of the samples were labeled as fixations, 6.8% as saccades, 3.1% as PSOs, and 53.6% as smooth pursuits. The statistics of the files are shown in
Table 1.
While this dataset has provided a robust foundation for evaluating the model, potential biases are acknowledged due to the focus on video stimuli and the exclusion of other stimulus types, such as static images and text reading. Eye movement patterns can vary significantly across different tasks and stimulus domains. This limitation may affect the generalizability of our approach to tasks outside the video domain. Additionally, although the dataset was annotated by expert raters, potential inter-rater variability could introduce annotation bias. Future work will explore cross-domain evaluations to further assess the robustness of the proposed method.
4. Proposed Method
In this study, a combination of 2D-CNN and LSTM was proposed to classify raw eye movement data into eye movement events. The CNN part filters the input data, and the LSTM part classifies the pre-processed data into event types. A similar approach to Startsev et al. [
21] was used. Before feeding the input to the network, velocity, acceleration, jerk, and direction were calculated from the raw positional coordinate points (x, y). The model classified each input data sample into one of four classes: fixations, saccades, PSOs, and smooth pursuits. Heuristic measures were then applied to the classifier’s output, such as merging nearby fixation points and determining the duration and number of events to produce the final events.
Unlike most event detection methods, the proposed approach simultaneously classifies fixation, saccade, PSO, and SP. Identifying PSOs in the presence of fixations, saccades, and smooth pursuits is particularly challenging due to their similar movement behaviors. Because of this, PSOs are frequently misclassified when only velocity is used. For example, PSOs may resemble fixations because of the small oscillatory movements in fixations. They can also be misclassified as saccades due to their similar velocity behaviors. In order to address these issues, the model incorporates not only velocity but also higher-order derivatives of velocity as features. In addition, the impacts of different feature combinations on event detection accuracy were evaluated.
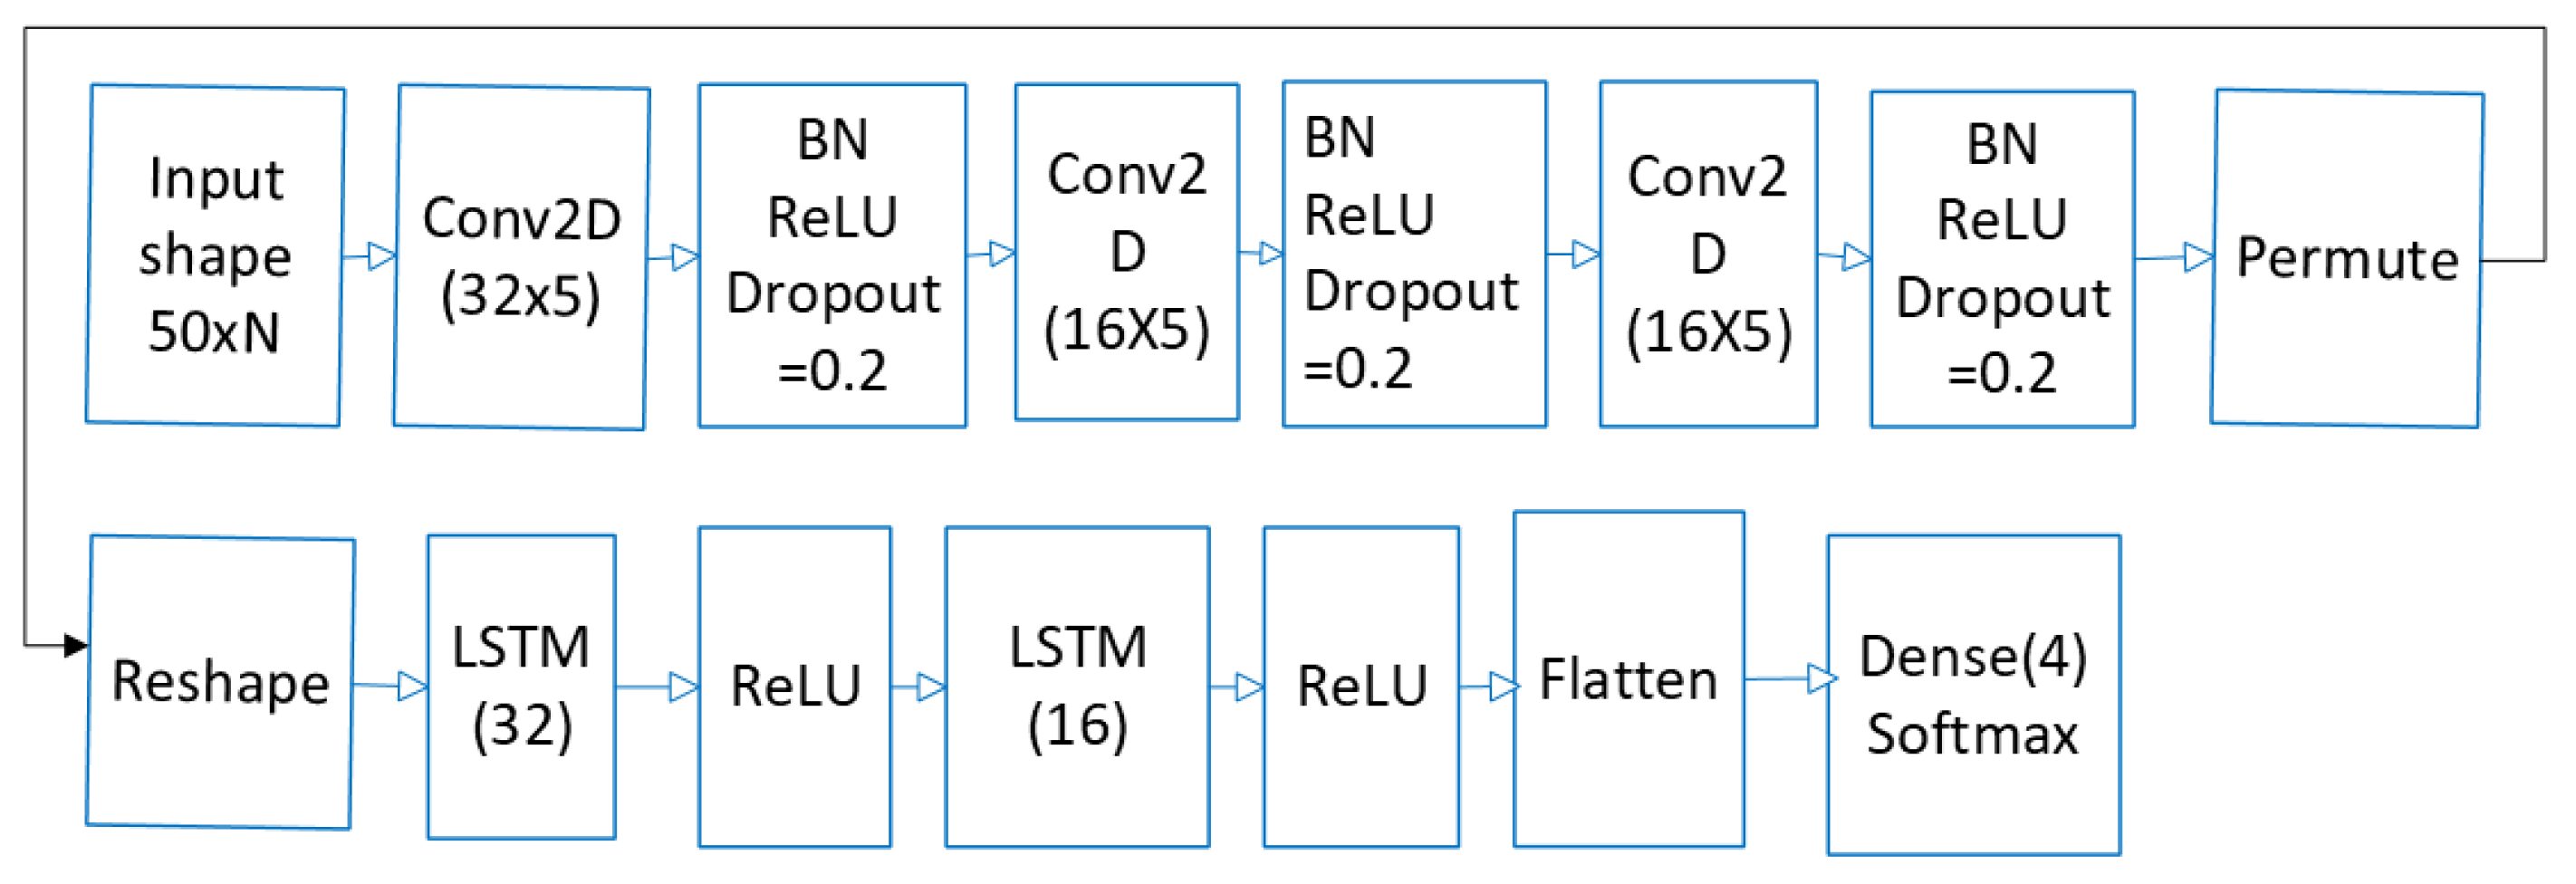
4.1. Network Architecture
The proposed model is a combination of CNN and LSTM approaches. Such an architecture is frequently referred to as a long-term recurrent convolutional network (LRCN) [
32]. The model takes a sequence of samples, and then subsequent convolutional layers are used to extract features that are important for further classification. While the original work [
32] worked with images, our model works with eye movement data samples containing preprocessed attributes such as velocity or acceleration. The features extracted from the input data by the convolutional layers are then passed as a sequence to the recurrent layers. Recurrent layers function as a memory-based network. Their subsequent outputs are generated based on the current input, and all inputs proceed in a sequence. In contrast to [
21], only the last output of the network is used. Thanks to the combination of convolutional and recurrent layers, the network is able to utilize both spatial and temporal features of the signal.
Therefore, the network takes a stream of samples as input. Each sample is a set of different eye movement features, such as direction, velocity, and their higher-order derivatives. The stream of samples is analyzed in windows of 50 samples (which gives a time span of 100 ms in our dataset). To obtain a prediction for each sample, the window moves over the sequence one by one, and the sample in the middle of the window is classified according to the neighboring samples. The network comprises different layers, precisely three convolutional layers with 32, 16, and 16 filters and a kernel size of 5. After the convolutional layers, a permute function reshapes the CONV2D output into an LSTM input shape, two LSTM layers with 32 and 16 units, batch normalization layers, and a dense output layer. A sequence of samples with a shape of
, where
N is the number of features for each feature’s combination, serves as the input to the network. The network architecture is shown in
Figure 1.
The model was evaluated using a leave-one-file-out cross-validation approach. In each fold, one file was reserved for testing, while the remaining files were used for training. Sequences of 50 samples were created from the raw data to form input windows for the model. The model was compiled using the RMSprop optimizer with the default learning rate of 0.001, categorical cross-entropy as the loss function, and categorical accuracy as the evaluation metric. During training, the model was trained for 25 epochs with a batch size of 50. For each training iteration, the labels were binarized using LabelBinarizer to encode the categorical labels into a one-hot format.
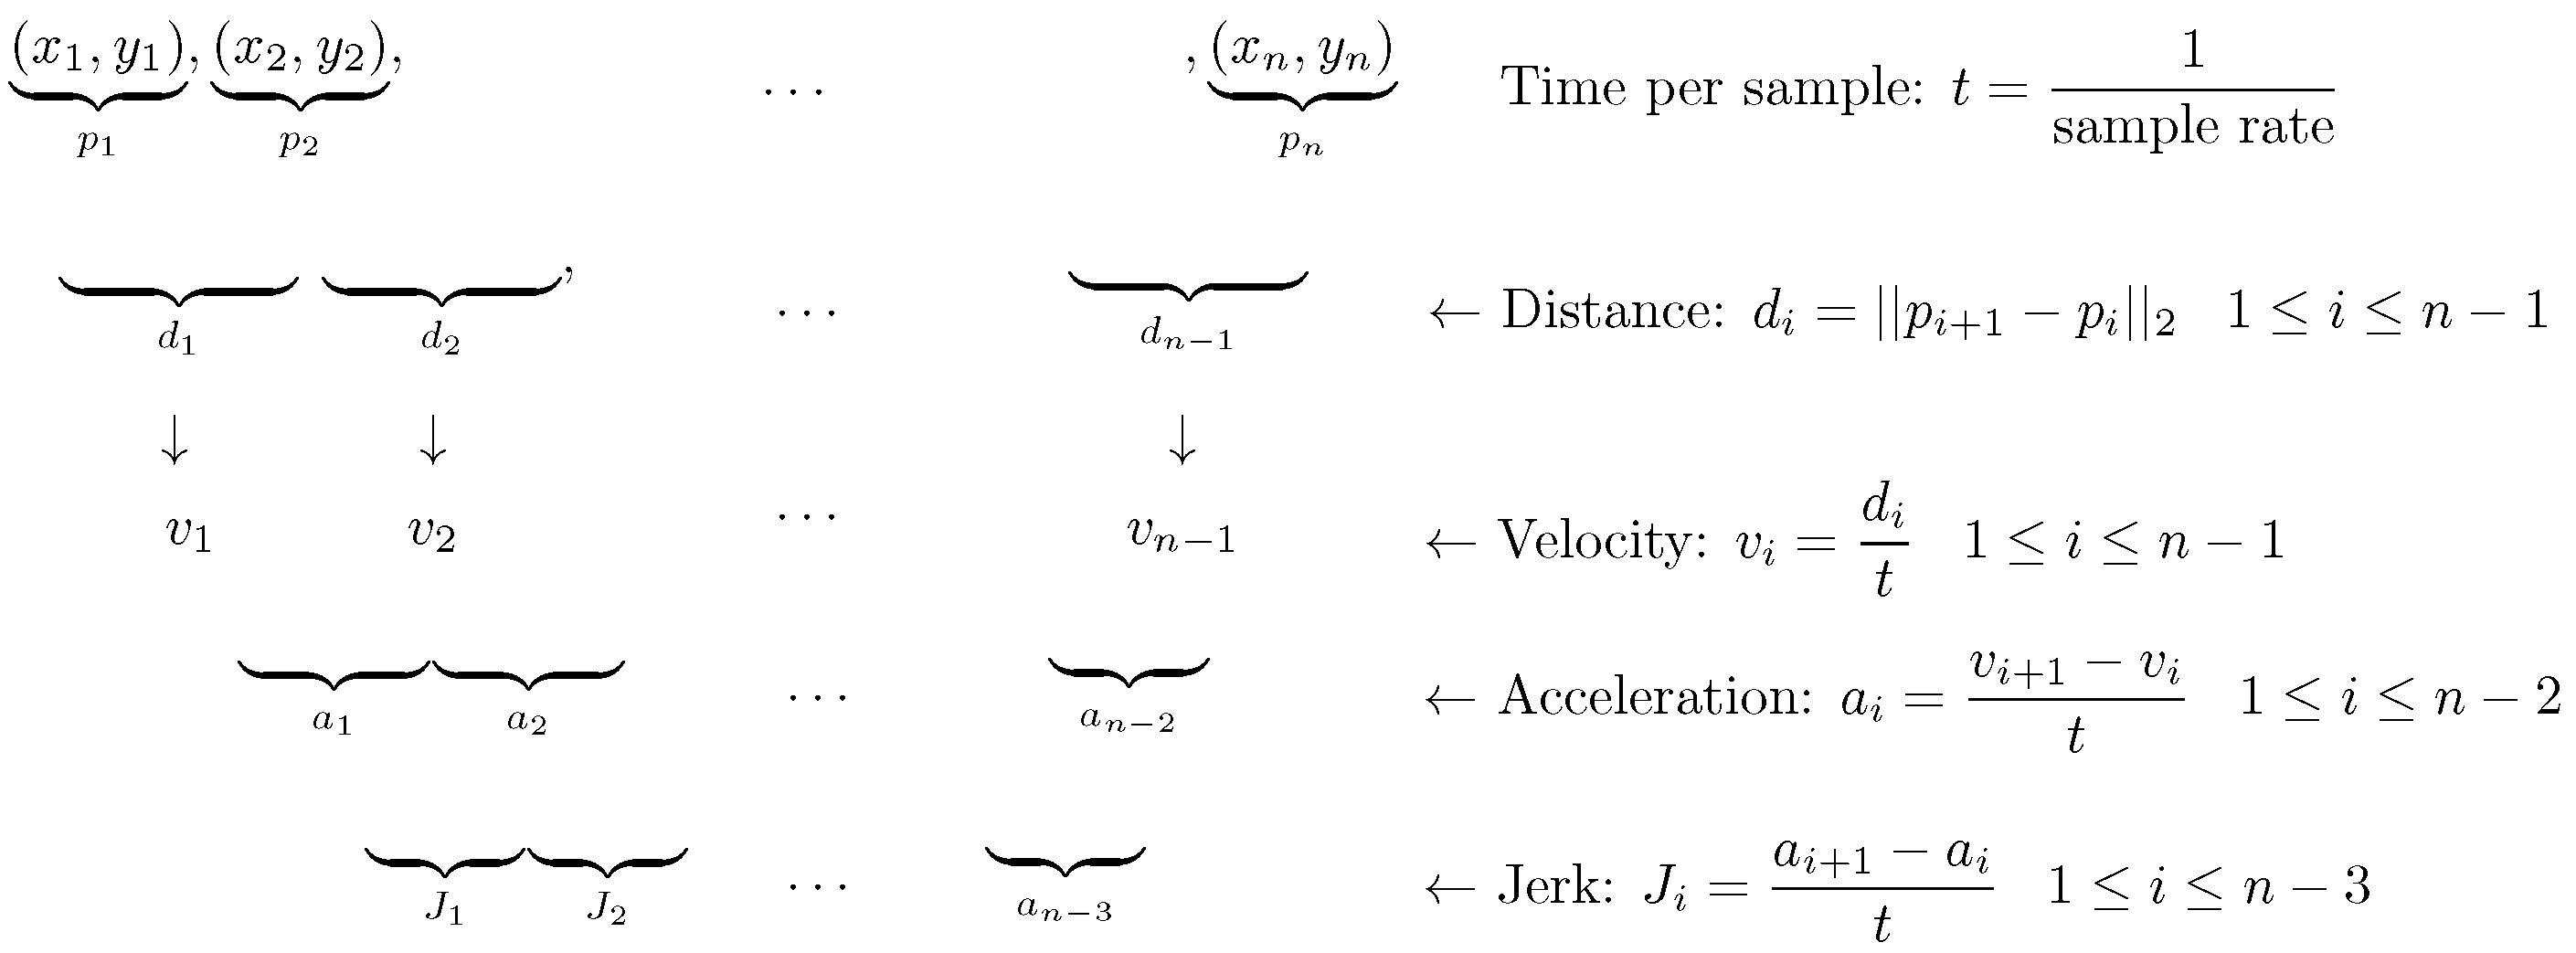
4.2. Feature Extraction
The main goal was to determine which features and feature combinations would correctly classify fixations, saccades, PSOs, and smooth pursuit events simultaneously. The features used for classification were velocity, acceleration, direction, and jerk. It was hypothesized that velocity and direction alone were insufficient to distinguish PSOs due to the overlapping nature of different event types. For example, velocity and direction were used in [
21], and it worked well, but only for fixation, saccade, and smooth pursuit detection. The velocity feature can distinguish saccades from fixations and smooth pursuits because fixations and smooth pursuits are low-velocity, and saccades are high-velocity movement types. Additionally, direction can distinguish smooth pursuits from fixations due to the uniform distribution of direction in fixations but not in smooth pursuits. However, using only velocity parameters to distinguish fixations from smooth pursuits will not work correctly, as both fixations and SPs are low-velocity movement types. Saccades and PSOs will also be misclassified, as both are high-speed movement types.
Because different features were important in classifying different events, tests were performed to verify which combination of features gave the best event detection results. Velocity, acceleration, and jerk were calculated from the raw x, y, coordinates, as shown in
Figure 2, while the direction was calculated as shown in Equation (
1).
4.3. Performance Evaluation
Currently used fully automated event detection algorithms cannot simultaneously detect all four events (i.e., fixations, saccades, PSOs, and smooth pursuits). Additionally, there is no standard performance metric for eye movement event detectors [
33]. So, for a fair comparison, it is recommended that they be compared using the same metrics (either against other algorithms or against the same algorithm under different conditions), using an applicable evaluation method [
33].
Threshold-based methods were not considered for comparison, as they are statically designed for specific event types based on the threshold value. For example, I-DT and I-VT are designed to detect fixation and saccades only. However, the dataset used for evaluation is annotated with four different event types. Therefore, comparing our method with threshold-based methods would be unfair.
The method was compared with the one most similar to ours, as presented in [
21]. This method also used a neural network built from a combination of CNN and LSTM layers, but they used 1D-CNN and BLSTM layers. Another difference was that their model output a sequence of event points, while ours classified only one point at a time. In addition, their method was designed to identify only fixations, saccades, and smooth pursuits. It did not consider PSOs, which were tricky to distinguish from fixations, saccades, and smooth pursuits due to their behavioral overlap with these event types.
To compare their model with ours, the model was reimplemented, and the final layer was changed to return only one value, as in ours. In addition, a 50-sample window was used as input to the model. The model was then trained on the same data as used in our experiments.
However, the primary purpose was to compare the same model for different feature sets. This comparison was made on the following two levels: sample-level and event-level. For the sample level, the output of the trained model was compared with the ground truth, and classic measures such as the F1 score and Cohen’s kappa were calculated for each sample. Furthermore, the corresponding confusion matrices for each combination of features—i.e., velocity (V), acceleration (A), direction (D), and jerk (J)—were analyzed.
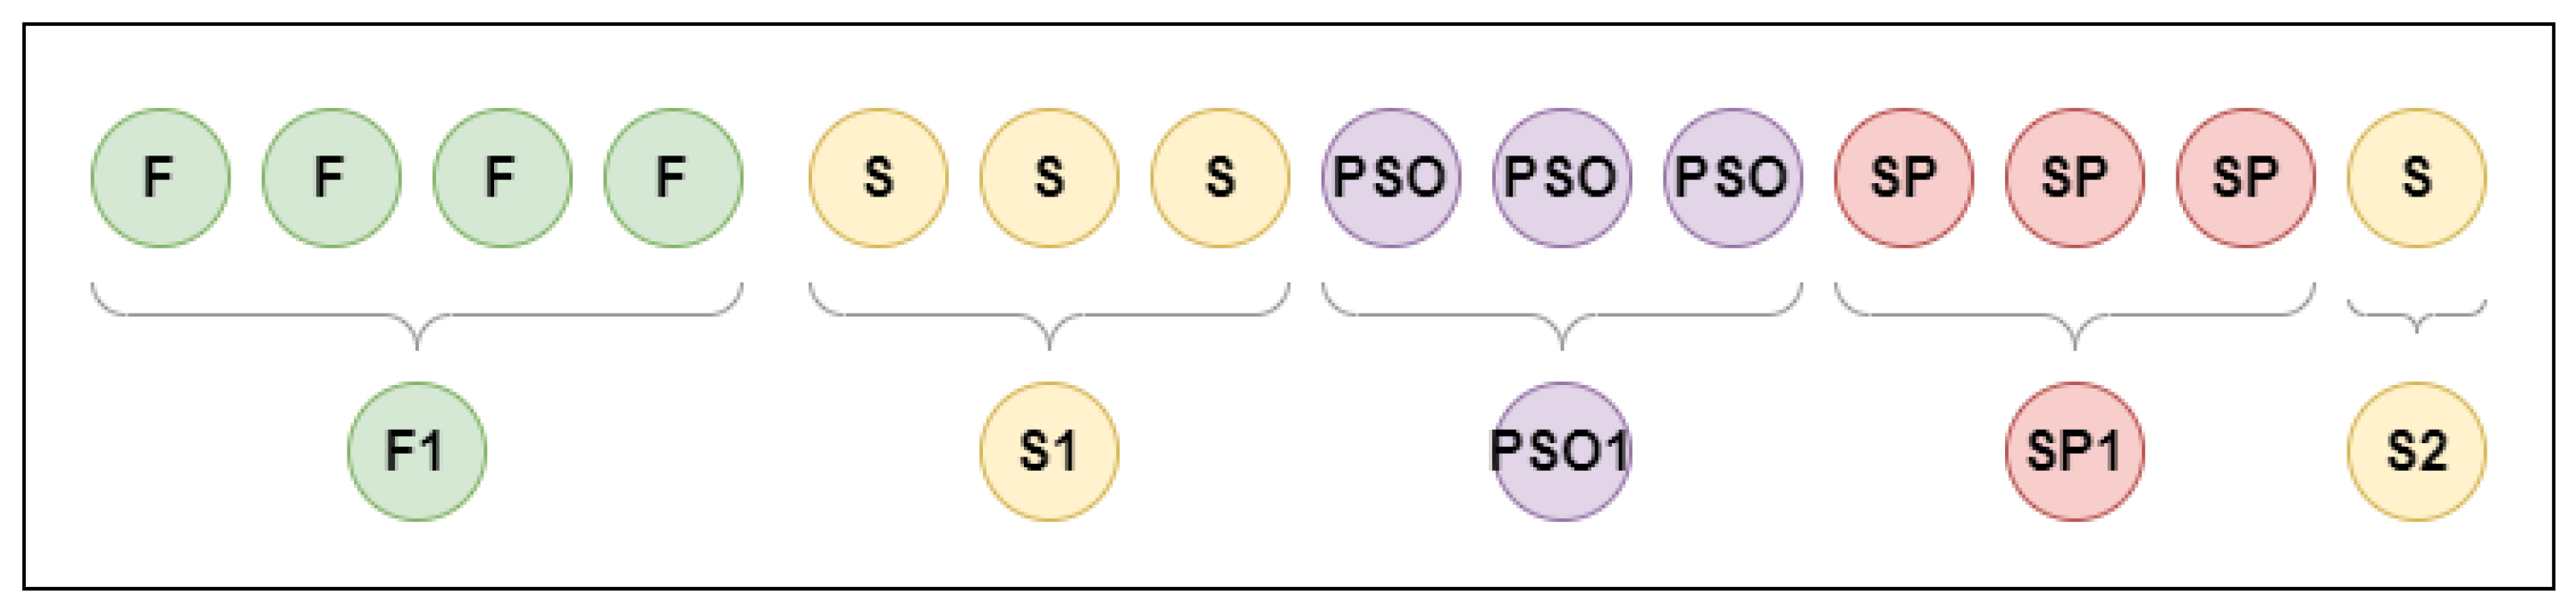
Classification of single-gaze data points is just the first step in event detection [
9]. The next step is to join identically classified neighboring points to form eye movement events. The process is visualized in
Figure 3. There are many possible measures to compare such results. However, there is no commonly accepted measure for this event-level comparison [
33]. Therefore, we compared general event statistics, i.e., the number of events and their mean duration. We believe that such information gives a reliable way to compare different results.
The train and test dataset split was done using the leave-one-file-out (LOFO) cross-validation method to avoid biased and overestimated model performance using a single test set, because we repeatedly fit a model to a dataset containing n-1 files. In our case, six files from the dataset described in
Section 3 were used.
5. Results and Discussion
In this section, the results and discussions on the impacts of various feature combinations on the classification performances of different eye movement events are presented. Direction plays a crucial role in identifying smooth pursuit (SP), as it captures the change in the direction of eye movement, which is key to distinguishing SP from other event types. Velocity is essential for distinguishing saccades from fixations and smooth pursuits, as it provides a clear differentiation between high-speed and low-speed movements. Additionally, acceleration and jerk contribute significantly to detecting post-saccadic oscillations (PSOs), as they help to separate PSOs from other movement types based on their rapid, oscillatory nature. Our analysis shows that combinations of velocity, acceleration, jerk, and direction (such as VAJD, VAD, and VJD) improve classification performance, particularly for PSO detection. We also found that while the absence of jerk in the VAD combination did not significantly affect performance, the lack of velocity in the AJD combination severely impacted the model’s ability to correctly classify events.
The performances of different models are presented in
Table 2 and
Table 3. The models using different feature combinations were compared with the ground truth (human coders) as a reference. The baseline model with velocity and direction features, originally used in [
21], was also evaluated for fixation, saccades, and smooth pursuit classification. Precision and F1 score were calculated for the proposed models. In order to measure the overall agreement between the manual coders and the proposed methods, Cohen’s kappa was calculated between each manual coder and the proposed methods. Moreover, confusion matrix analysis was used to analyze the performance of the models.
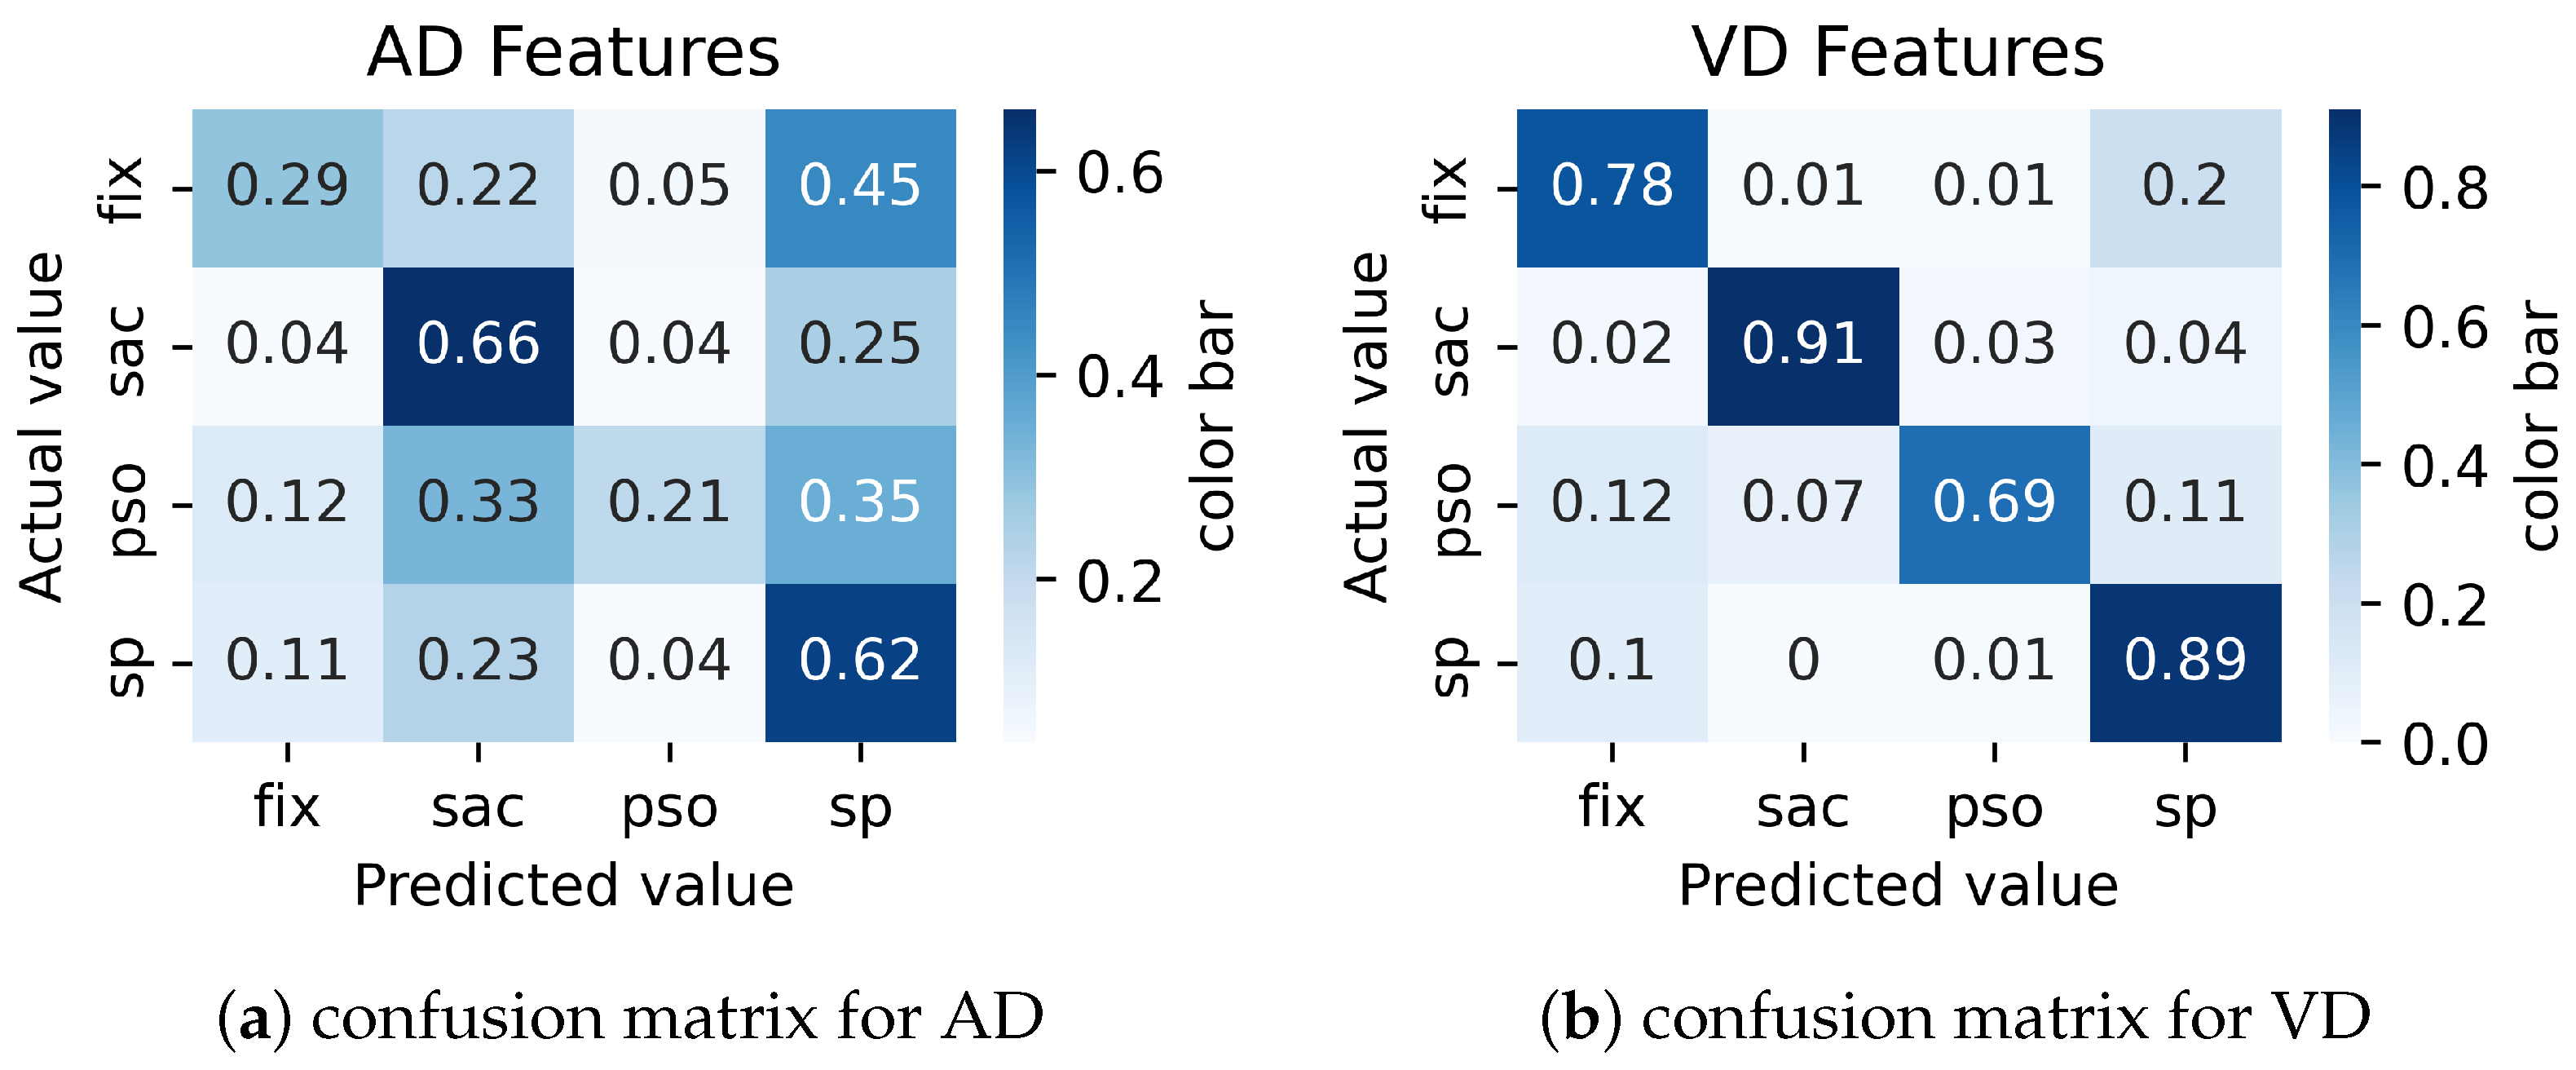
The experiment started with the combinations of VD and AD feature combinations, which were used in the baseline method [
21]. It was discovered that the AD feature combination exhibited very low event detection performance due to its inability to distinguish fixations from smooth pursuits and PSOs from all other event types. A combination of velocity and direction (VD) can identify saccades and PSOs, as velocity can identify saccades from fixations and smooth pursuits. However, the VD combination performs poorly in identifying PSOs due to their speed-related behavior being similar to that of saccades.
The results show that using acceleration or jerk in addition to velocity and direction helps the model to distinguish PSOs from other event types. This implies that the model’s classification performance with the VAJD, VAD, and VJD feature combinations is superior to that of the AJD, VD, and AD combinations. Not surprisingly, the AJD feature combination cannot classify all event types, especially PSOs. This implies that combining velocity and direction with acceleration and/or jerk shows significant performance improvement for all event types, including PSO.
As the results show, feature selection significantly impacts the event classification results. On the one hand, velocity is crucial for correctly detecting saccades from fixations and smooth pursuits. Hence, these events have low scores for AD and AJD sets. On the other hand, velocity is not sufficient to correctly distinguish between fixations and SPs, as both are low-speed movement types. Therefore, the direction is used to detect fixations from SPs. A classic VD set performs better than the former sets for SPs, but its performance is still low for PSOs. Adding acceleration and jerk improves the general performance of the models, especially for PSO detection. A comparison of VAD, VJD, and VAJD sets shows that both acceleration and jerk have a similar impact on the results, and their combination is only marginally better than using only one of them (see
Table 4 and
Table 5).
A comparison with the results of the 1D-CNN-BLSTM model on the same dataset, as reported in [
21], shows that our model performs better and can also distinguish the PSO events. Our modified implementation of the same model does not perform well. However, one of the reasons may be that we changed the model to return only one value instead of the sequence, and skipped the model optimization step.
Misclassifications Analysis
In this section, the misclassifications between events for each feature set are discussed using the confusion matrices, which help to analyze which events were mistaken for others in each feature set.
The confusion matrix analysis for the combinations of AD and VD features is shown in
Figure 4a and
Figure 4b, respectively. Each row in the matrices shows the percentage of samples for a given event that were classified as the event shown in the corresponding column. The results for the AD combination clearly show that fixations and smooth pursuits are often confused (45% of fixations are classified as smooth pursuits). Moreover, the recall of PSOs is very low, and most of the actual PSOs are misclassified (only 21% are classified correctly).
The velocity and direction (VD) combination shows a noticeable improvement over the AD combination. The combination significantly improves the performance of fixations, saccades, and smooth pursuits. However, its performance in correctly identifying PSOs from fixations and smooth pursuits is lower. So, we propose using the VAJD, VAD, AJD, and VJD combinations to improve PSO identification performance and reduce misclassifications between PSOs and other event types.
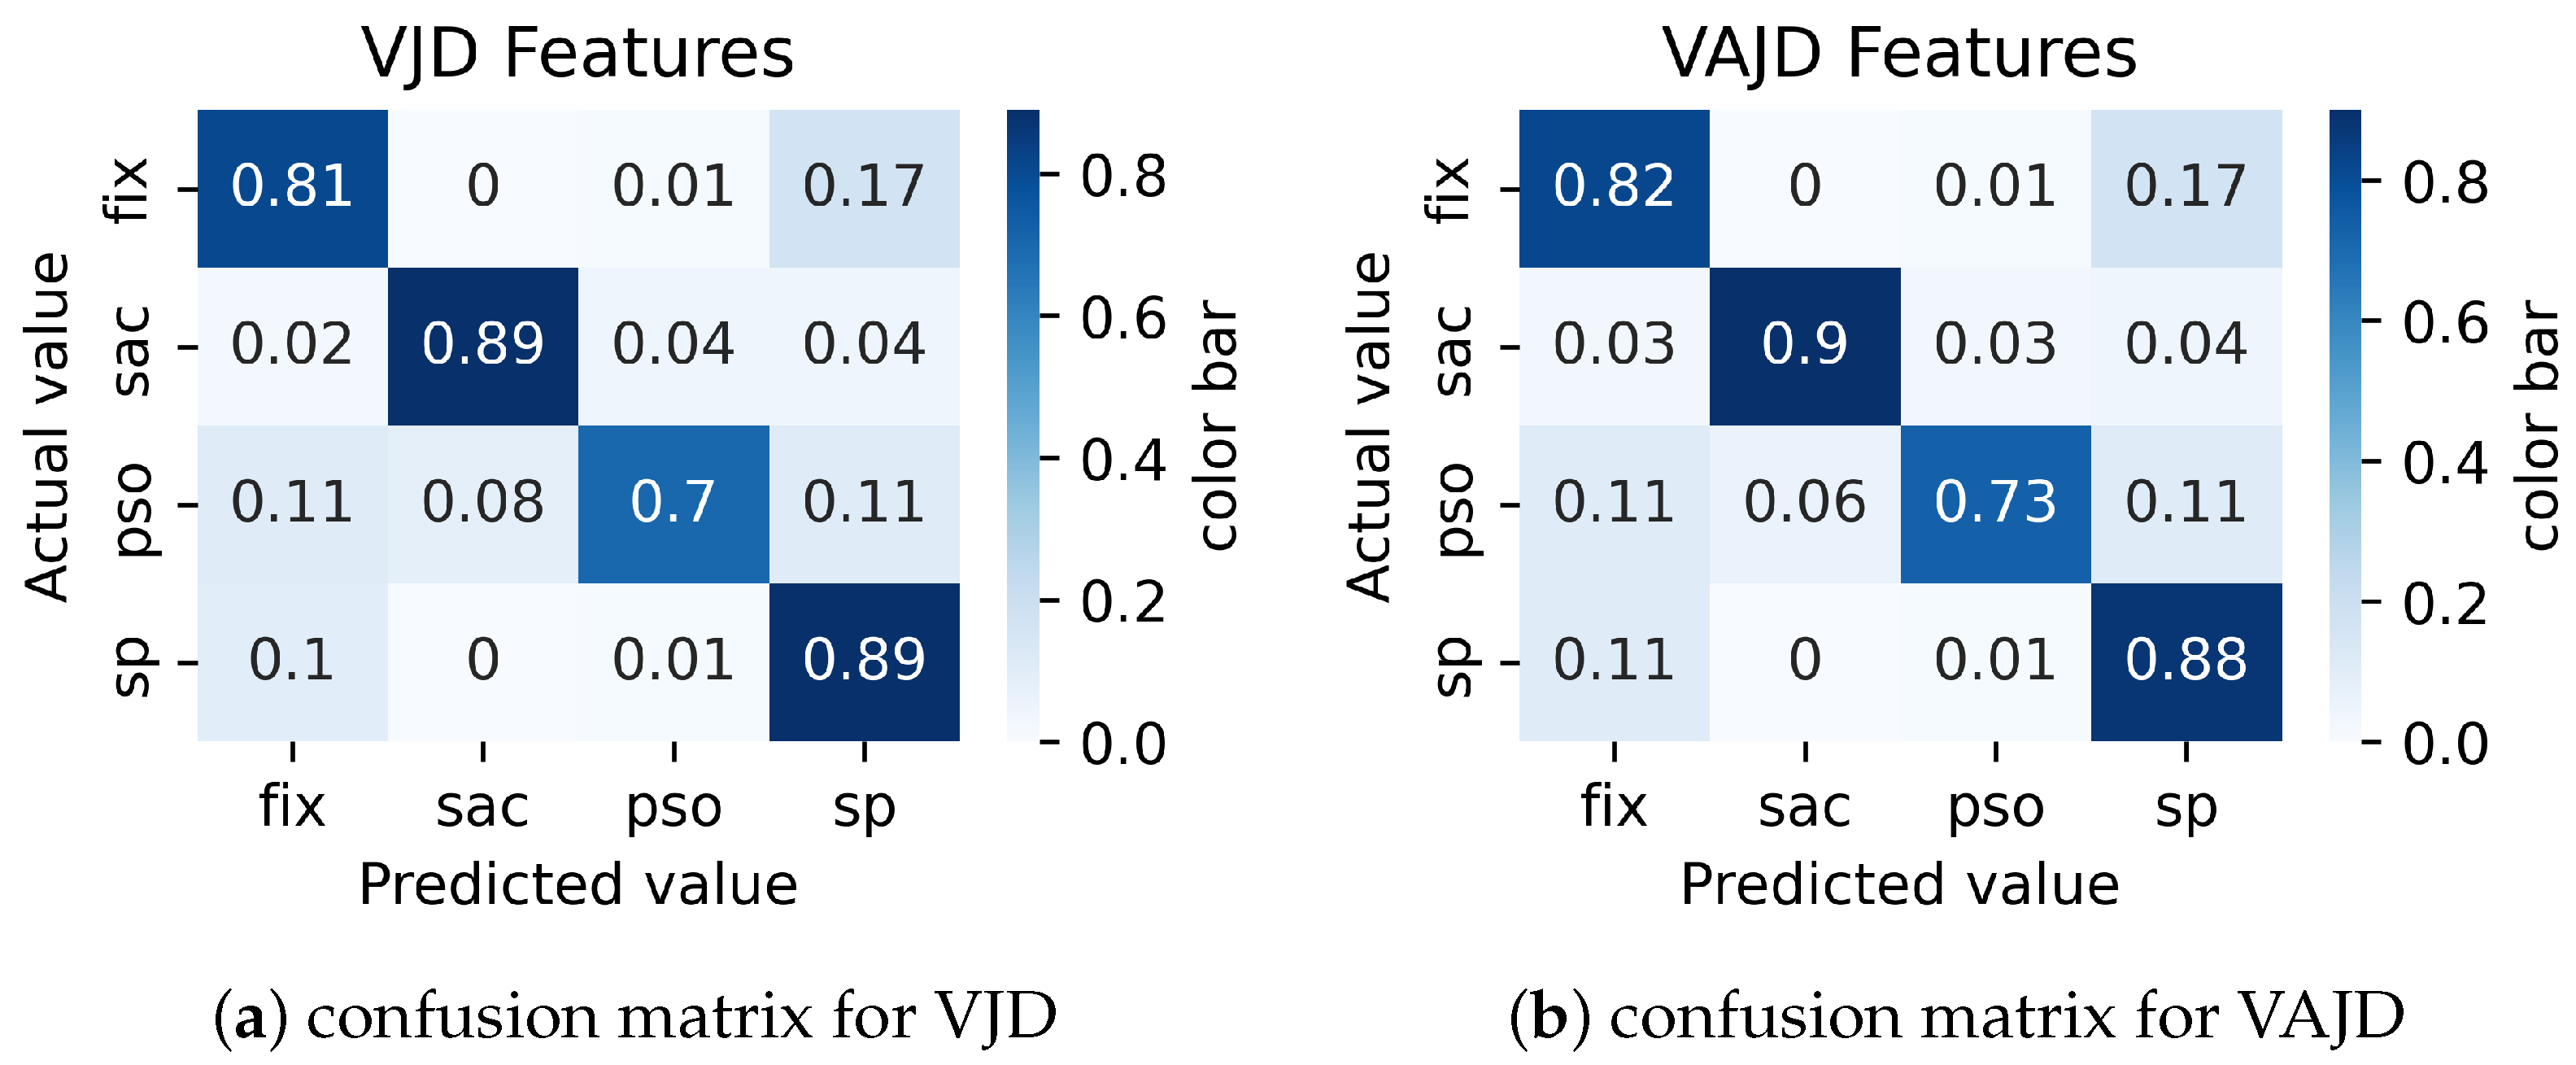
Combining velocity and direction with acceleration and/or jerk improved the overall identification performance for all event types compared to other feature combinations, especially for PSO detection. However, the performance of PSO identification is still low, and many PSO points are misclassified as fixations and smooth pursuits. The results for these feature combinations are shown in
Figure 5. For example, the results of the VAJD feature combination in
Figure 5b show that 11% of PSOs are misclassified as smooth pursuits and 11% as fixations. The VAD and VJD feature combinations perform approximately the same as VAJD.
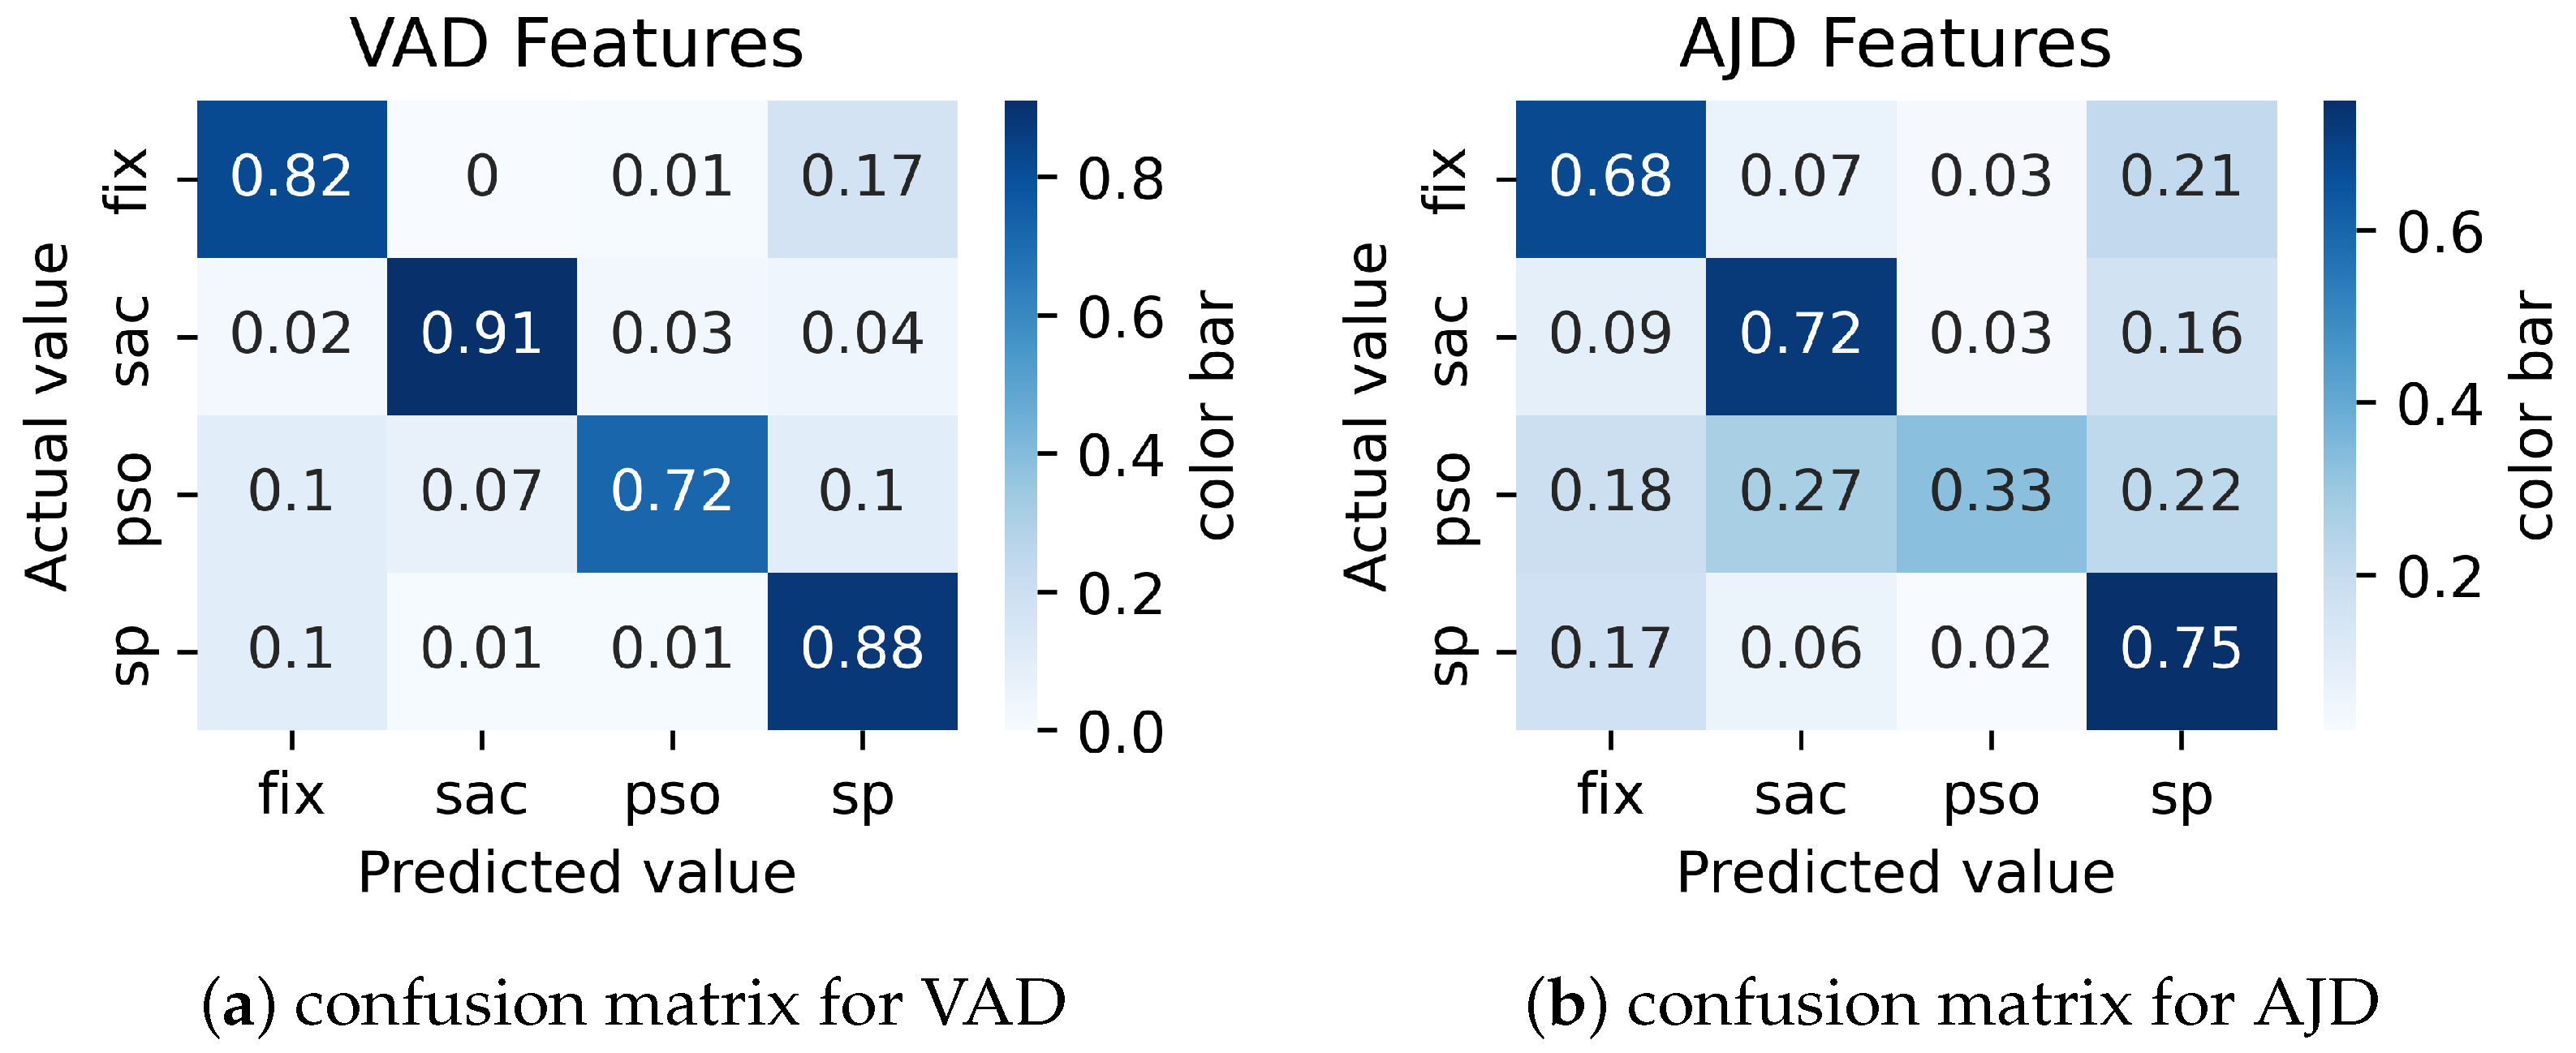
In addition, experiments were conducted with combinations without velocity or jerk. A combination of VAD and AJD features was used for the experiment. The results in
Figure 6a show that the absence of jerk in the VAD combination does not decrease performance. Regarding the effect of velocity, the AJD in
Figure 6b shows that the absence of velocity significantly affects the overall performance. The results imply that combining acceleration and jerk with direction (and with the absence of velocity) does not improve overall performance for all event types.
6. Event Measures
As stated in
Section 4.3, classifying each gaze point as a specific event was just the first step in event detection. The next step was to merge the neighboring points with the same classification into one event, as shown in
Figure 3. In this way, events with their own properties were created. For instance, fixations were characterized by a location (calculated as the mean or median of gaze points), as well as an onset and offset, while saccades and smooth pursuits were defined by their start and end points.
The main problem with all threshold-based methods is their high susceptibility to outliers. When one gaze point in the middle of a fixation is classified as any other event, it automatically divides the fixation into two separate fixations. The popular solution is to merge subsequent fixations based on their low spatial and temporal distance. However, this introduces two more thresholds that must be manually assigned.
Machine learning-based algorithms are more robust to this problem as they classify gaze points, taking into account not only the sample’s properties but also its neighborhood. However, the problem still exists. To analyze this phenomenon for our results, we merged the neighboring event points to form events. Then, for each event type, we calculated two metrics, that is, the mean number of events and the mean event duration.
The results in
Table 6 show the number of events and mean duration of events for different combinations of features and ground truth (manual coding).
Generally, our methods find more fixations than GT, which probably means that some actual fixations are classified as two or more separate fixations by the model. This is especially visible for AD and AJD combinations, where the number of detected fixations is about five times larger than it should be. A similar situation can be observed for smooth pursuits. Not surprisingly, when more separate events were detected, the mean durations of events were shorter.
The results show that the calculations of event-level statistics, such as the number and duration of events, may reveal additional information about the quality of the model. For instance, the confusion matrix of the VD model in
Figure 4b suggests that its performance is similar to (or even better than) the VAD, VJD, and VAJD models for smooth pursuit detection. However, event-measuring metrics in
Table 6 show that using the VD model resulted in the creation of much smoother pursuit events than for the VAD, VJD, and VAJD models and a shorter duration of these events. So, it may be assumed that the smooth pursuit detection performance of the VD model is lower than that of the VAD, VJD, and VAJD models, even when the sample-level accuracy is better.
As a conclusion from the results, the proposed models with feature combinations VAJD, VAD, and VJD perform approximately the same, outperforming AJD, VD, and AD feature combinations.
7. Conclusions and Future Works
A deep learning method was proposed to extract eye movement events from raw eye-tracking data. The main objective of this study was to identify the best feature sets for building a model that simultaneously classifies four event types. The velocity, acceleration, jerk, and direction characteristics were used. Combinations of these different features were used to detect events.
The classification performance of the proposed model across different feature combinations was compared with that of the state-of-the-art model. The results revealed that combining velocity and acceleration with either direction, jerk, or both jerk and acceleration features significantly improved performance compared to other feature sets. This indicated that the VAJD, VAD, and VJD feature combinations outperformed the AJD, VD, and AD feature combinations.
Furthermore, we analyzed the impact of each feature on the detection of specific events, i.e., fixations, saccades, PSOs, and smooth pursuits. To the best of our knowledge, this is the first fully automated event detection method that simultaneously classifies fixations, saccades, PSOs, and smooth pursuits. The event measures for the proposed methods were also evaluated and compared with the manual classification results. The event-measuring metrics included the number of events and the mean duration of events.
Obviously, the work carries certain limitations. Our results, even for the best-performing models, are far from perfect, and there is room for improvement. In particular, the accuracy of the PSO classification is relatively low. In this paper, we focus on the analysis of the best combinations of different features. The next step should be to use the best-performing feature combinations to build more robust models. Future work will focus on extending the research through an extensive analysis of various network architectures and hyperparameters. Furthermore, more data will be used for training to further improve the model’s performance.
As stated in the performance evaluation section, comparing different algorithms with different conditions and objectives is difficult [
33]. Therefore, we were only able to compare the proposed models with the one that was the most similar to ours. However, this model originally did not consider PSO events, so the comparison was not entirely fair. No model was found that automatically classifies all four events.
In addition, it would be valuable to test the performance of the algorithms using other datasets. Specifically, this work focuses on video stimulus datasets labeled with fixations, saccades, PSOs, and smooth pursuits. Therefore, testing the models on other types of data could tell more about the generality of our methods. Since PSOs are the most problematic, future work will analyze how they differ across different types of stimuli and attempt to develop models tailored to specific types.
The other line of enhancement is based on improving the accuracy of the PSO classification in the presence of fixations, saccades, and smooth pursuits. The proposed method improves existing methods by simultaneously classifying fixations, saccades, PSOs, and SPs. However, we believe that the proposed approach can be further optimized in such a way that the accuracy of the PSO is taken into account.


