Article

Evaluation of Moraine Sediment Dam Stability Under Permafrost Thawing in Glacial Environments: A Case Study of Gurudongmar Lake, Sikkim Himalayas

1
Department of Geology, School of Physical Sciences, Sikkim University, Gangtok 737102, Sikkim, India
2
Department of Civil Engineering, Graphic Era Deemed to be University, Dehradun 248002, Uttarakhand, India
*
Author to whom correspondence should be addressed.
Appl. Sci. 2025, 15(11), 5892; https://doi.org/10.3390/app15115892
Submission received: 20 September 2024 / Revised: 13 October 2024 / Accepted: 22 April 2025 / Published: 23 May 2025
(This article belongs to the Special Issue Soil-Structure Interaction in Structural and Geotechnical Engineering)

Abstract

:
This study assesses the risks of glacial lake outburst floods (GLOFs) from moraine sediment dams around Gurudongmar Lake in the Northern Sikkim Himalayas at an elevation of 17,800 feet. It focuses on three moraine sediment dams, analysing the implications of slope failure on the upstream side and the downstream stability under steady seepage conditions, as well as the risks posed by permafrost thawing. Using a comprehensive methodology that includes geotechnical evaluations, remote sensing, and digital elevation models (DEMs), the research employs finite element analysis via PLAXIS2D for the stability assessment. The main findings indicate a stratification of sediment types: the upper layers are loose silty sand, while the lower layers are dense silty sand, with significant variations in shear strength, permeability, and other geotechnical properties. Observations of solifluctions suggest that current permafrost conditions enhance the dams’ stability and reduce seepage. However, temperature trends show a warming climate, with the average days below 0 °C decreasing from 314 (2004–2013) to 305 (2014–2023), indicating potential permafrost thawing. This thawing could increase seepage and destabilise the dams, raising the risk of GLOFs. Numerical simulations reveal that scenarios involving water level rises of 5 and 10 m could lead to significant deformation and reduced safety factors on both the upstream lateral dams and downstream front dams. The study emphasises the urgent need for ongoing monitoring and risk assessment to address the potential hazards associated with GLOFs.

1. Introduction

In recent years, the future of Himalayan glaciers has been a subject of intense debate [1] due to their significance in shaping the water resource outlook of the Indian subcontinent [2] and the risks posed by glacial lake outburst floods (GLOFs) [3]. Glacial lakes are a widespread phenomenon in glaciated regions globally [4,5,6]. When these lakes are impacted by ice or rock masses, overtopping or breaching of their natural dams can occur, leading to GLOFs that pose significant risks to downstream infrastructure and communities [7,8]. GLOFs have caused substantial economic losses and fatalities worldwide [7,8,9,10]. GLOFs typically involve a mixture of water and sediment that can travel distances ranging from tens to over 100 km at velocities exceeding tens of kilometres per hour, posing a serious threat to downstream settlements due to their high discharge magnitude and long runout distances [11]. Such cascading events are frequent in glacial valleys, where steep topography, rapidly retreating glaciers, and slope degradation expose unstable ground, potentially leading to new mass movement zones. These events result in a loss of life and property in downstream regions.
Infrastructure, including hydroelectric facilities, has been severely damaged by floodwaters [7,12,13,14], while roads, bridges, and buildings have been swept away or demolished [10]. Debris flows, commonly triggered by GLOFs, pose significant hazards. Linsbauer et al. [15] have used predictive modelling to highlight a concerning trend for the future, identifying around 5000 over-deepenings in Himalayan glacier beds that have the potential to evolve into significant glacial lakes. It has been reported that around three million people in India are at risk of exposure to GLOFs [16].
As mountain communities increasingly settle at higher elevations, the threat posed by GLOFs is expected to grow. The retreat of glaciers due to climate change is contributing to the formation of new glacial lakes and the expansion of existing ones [17,18,19]. As glaciers recede, they leave behind voids that progressively fill with meltwater, resulting in the formation of numerous glacial lakes [20]. This transformation involves melting glacier tongues that are gradually replaced by expanding water bodies. Under the changing climate realities, the issue of GLOFs is of major concern for the people of Sikkim. A recent example of a devastating GLOF in Sikkim includes the South Lhonak Lake overtopping on [21], which caused a huge loss of life and property in Sikkim and West Bengal in India and in parts of Bangladesh.
Downstream flood risks from natural dams are fundamentally tied to the dam’s ability to retain the impounded water. This capability can be compromised through several mechanisms, like overtopping due to extreme wave events, catastrophic structural failures, or accelerated erosive processes. In some cases, these failures may occur sequentially, resulting in a two-phase outburst flood Moraine-dammed glacial lakes are particularly vulnerable to such failures, as both overtopping and structural collapse can occur in these settings [22]. Moraine dams, which are formed from accumulated debris and sediment, are prone to failure under specific conditions. The likelihood of dam failure is influenced by several factors: (1) a small width-to-height (DWH) ratio of the dam, which implies a relatively steep and narrow structure; (2) high potential energy of the impounded water, which increases the force exerted on the dam; and (3) low internal cohesion within the moraine structure, which compromises the dam’s stability [18,22]. Geomorphological aspects, such as the moraine’s volume, shape, and slope stability, also play critical roles. Moraines with a low DWH ratio are especially susceptible to failure due to their less stable geometry. Additionally, the hydraulic parameters of the lake, such as high water potential energy, coupled with poor geotechnical properties of the moraine (e.g., weak internal matrix composition), further elevate the risk of failure [23].
One of the major issues related to assessing the stability of the slope in the mountainous region is associated with “jointed rock mass”. Wang et al. [24] stated that the stability of the rock mass slopes is affected by the presence of discrete fractures, and slope stability analysis using continuum mechanics is not reliable. A discontinuous approach is then suggested, in which the effect of discrete fractures is taken into account by considering independent grids between the rock matrix and fractures, and stability evaluation is suggested through the integration of a strength reduction technique. The numerical analysis procedure is verified through case studies, and it was noted that the developed method has the capability of analysing non-circular slip surfaces. Kundu et al. [25] performed a kinematic analysis for the stability analysis of the jointed rock mass slope and suggested an approach for the slope mass rating (SMR) to assess the stability of planar, wedge, and topple-type failure modes in terms of indices. To ease the computation work, taking into account a large number of joints, a computer code, EasySMR, was developed and validated through 35 rock slopes in the Himalayan region of India. It was claimed that the numerical code provided a rigorous and accurate analysis of the jointed rock mass slope stability.
This research aims to assess the impact of lake water level increase and permafrost thaw on the stability of the moraine dams at Gurudongmar Lake and to evaluate the potential increase in GLOF hazards as a result. At first, the study area and its geological setting are presented, followed by the methodology used for geotechnical and climate trend analysis. The results from the laboratory testing are then discussed, leading to the modelling of lake level increases and an evaluation of the climate profile and its implications for permafrost thaw. The subsequent section analyses the impact of permafrost thaw on moraine dam stability, considering scenarios of melting and steady seepage conditions.

2. Study Background

Gurudongmar Lake (Figure 1), located in the Teesta basin of the Sikkim Himalayas, is one of the region’s largest glacial lakes. It is situated in a remote, rugged, high-altitude terrain above 5000 m and is currently considered stable with respect to glacial lake outburst floods (GLOFs) that could affect downstream areas over tens of kilometres. The lake is surrounded by moraine sediment dams on three sides, which play a crucial role in its stability. The sediment deposits, influenced by the presence of permafrost [26], maintain cohesion in the moraine dams and support their geotechnical stability. However, with climate change inducing permafrost thaw, concerns arise about increasing pore pressure, seepage, and subsequent reductions in the shear strength of these dams. The potential for permafrost thaw to destabilise moraine dams heightens the risk of GLOFs, making this an important area for geotechnical evaluation.

3. Research Approach
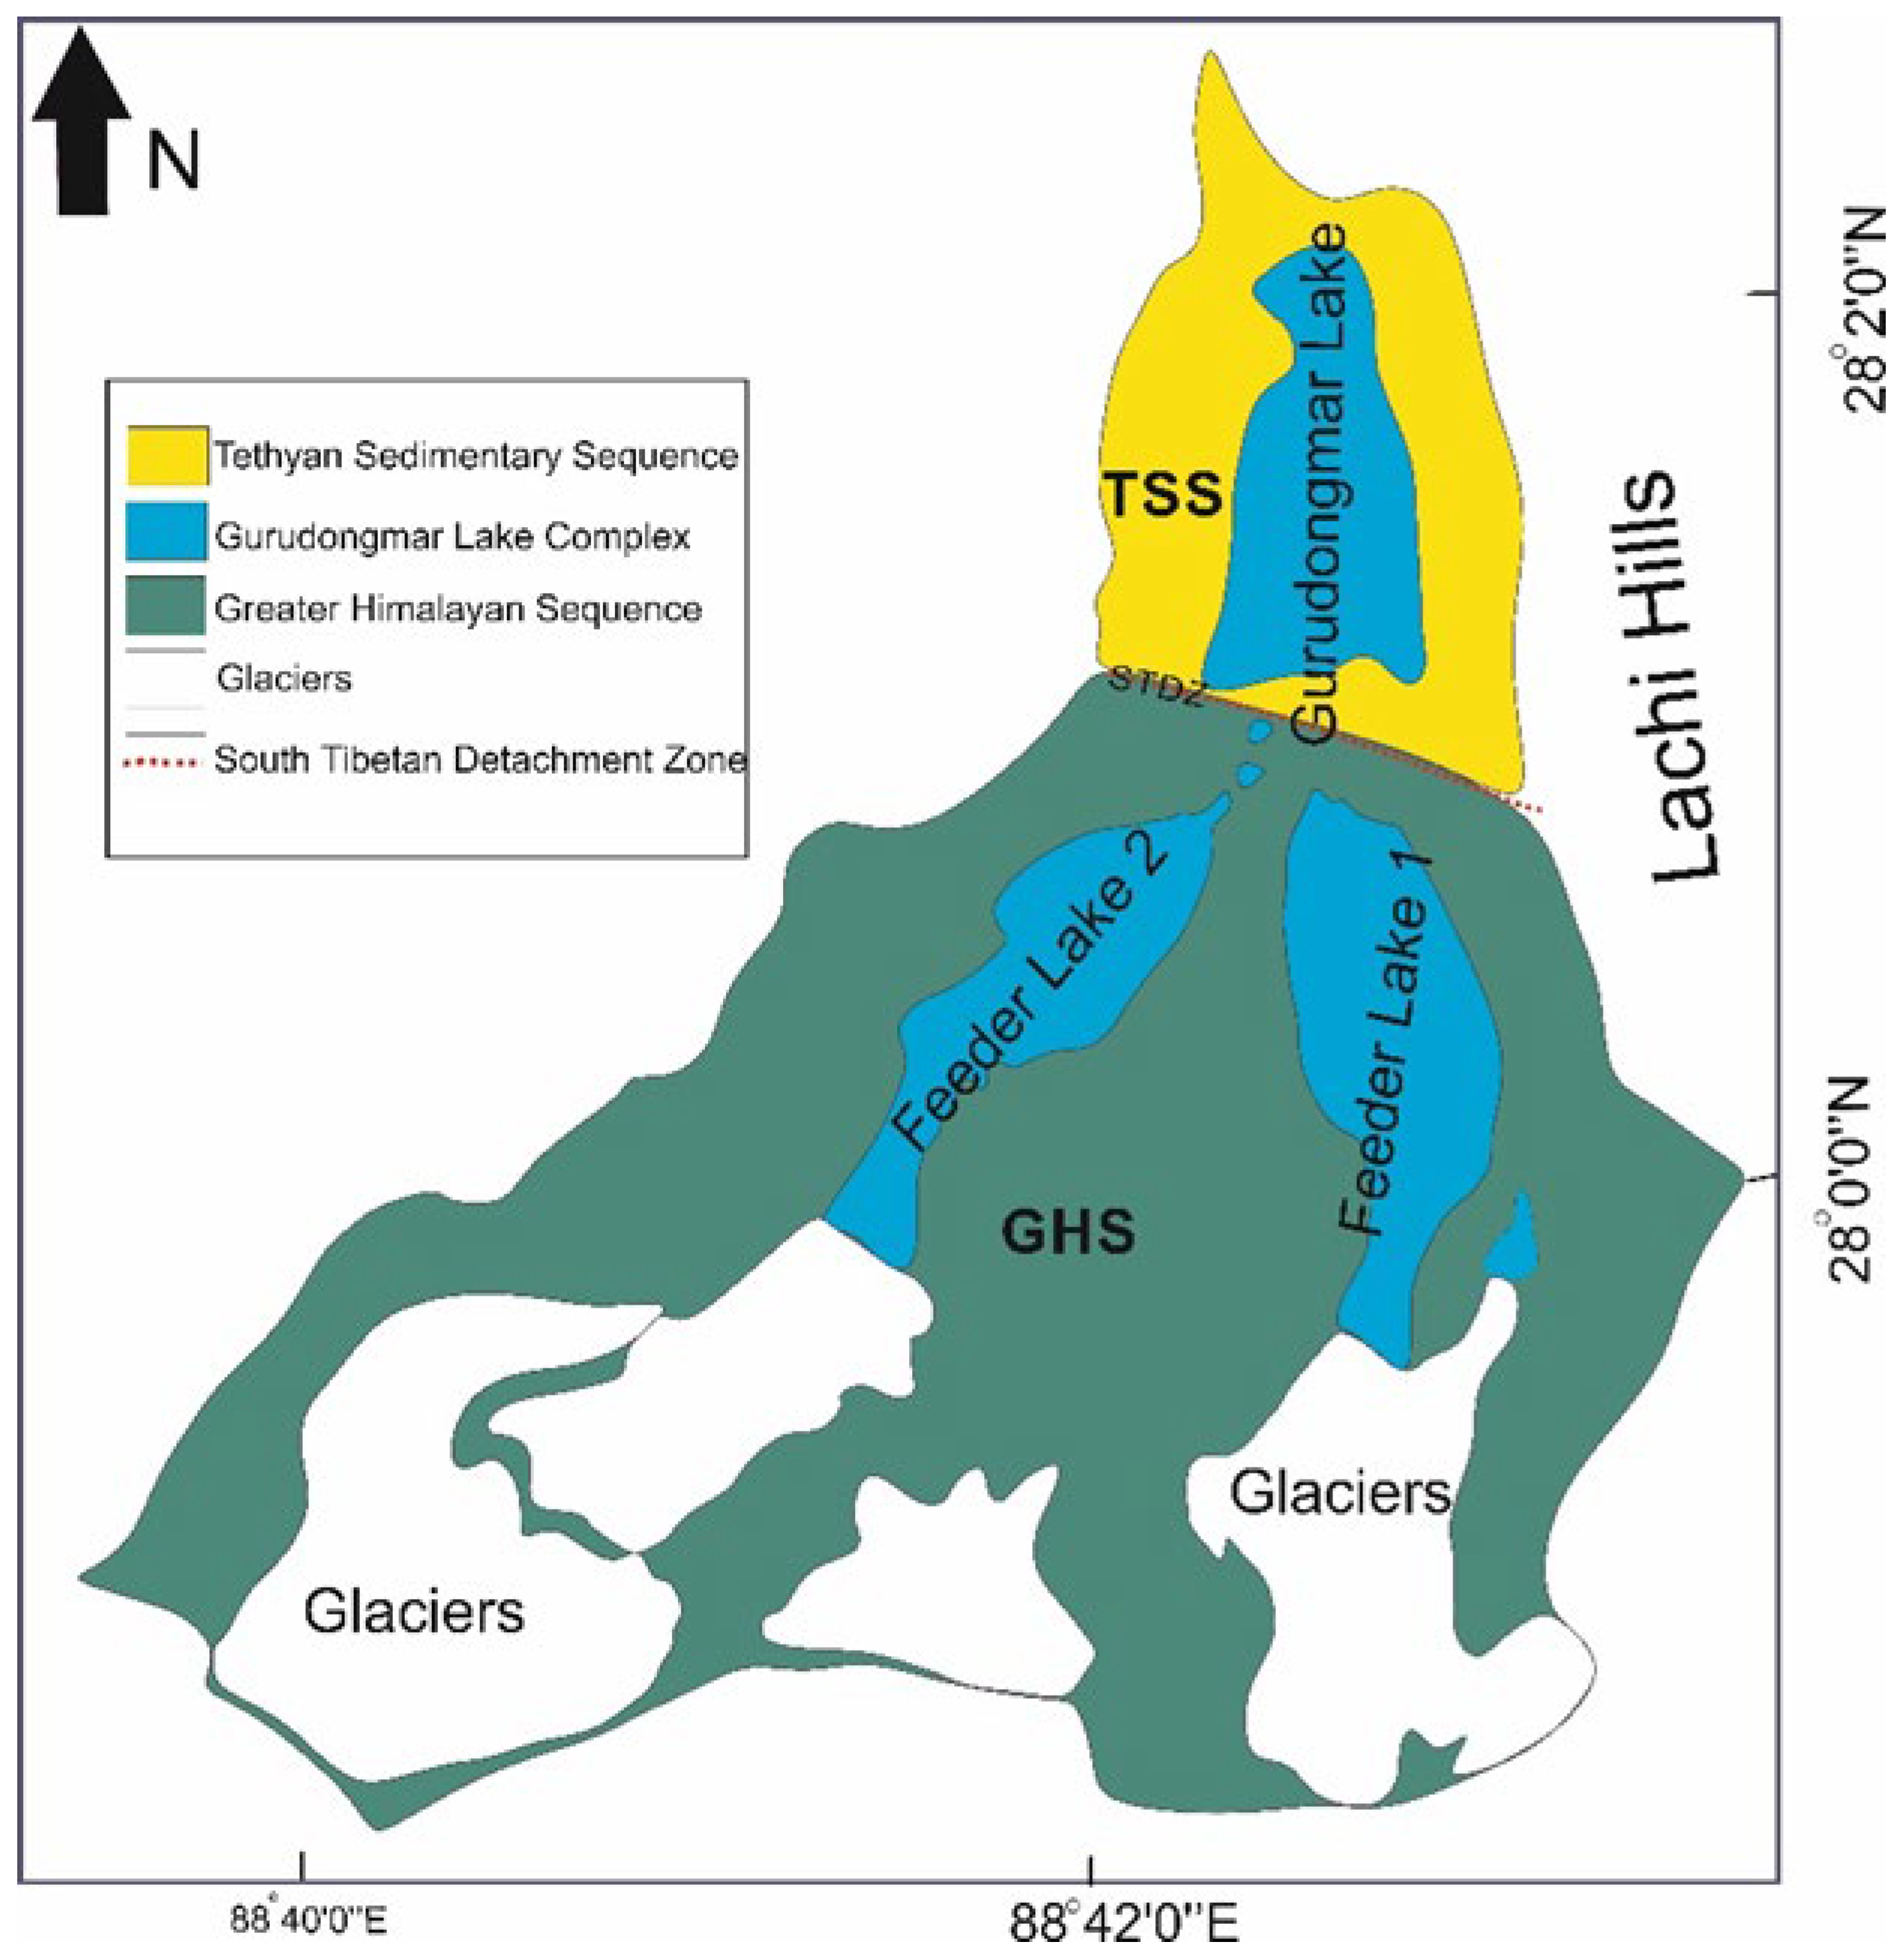
To evaluate potential future hazards associated with glacial lake outburst floods (GLOFs) at Gurudongmar Lake, numerical simulations with the PLAXIS 2D program are utilised. The research aims to assess the stability of the moraine sediment dams that confine the lake’s waters. These moraine sediment dams are formed from debris deposited by glaciers and play a critical role in maintaining the lake’s stability. The study also incorporates an analysis of the climate profile for the Gurudongmar Lake region by examining daily temperature and precipitation data from the past three decades, sourced from ERA5 Land provided by ECMWF. These climatic data are crucial for understanding how recent climate changes may impact permafrost thawing and affect moraine stability.
As permafrost within the moraine dams thaws, it can lead to increased pore pressure and reduced cohesion, potentially compromising the structural integrity of these natural barriers. Through the integration of stability assessments with climate data and examining the implications of permafrost thawing, this study aims to inform the development of proactive management strategies. The goal is to enhance preparedness and adaptive responses to the dynamic hazards posed by glacial lakes in high-altitude glacier regions such as the Sikkim Himalayas.

3.1. Study Area

The study area is located in the Sikkim Himalayas, often referred to as the “Third Pole” due to its extensive glacial coverage. This region is part of the Eastern Indian Himalayan Region (IHR), which is crucial for the freshwater supply in South and East Asia. The glaciers of the Sikkim Himalayas, highly sensitive to global climate changes, cover over 436 km2, and their retreat has led to the formation of moraine-dammed glacial lakes. Currently, there are approximately 320 glacial lakes in the region, 85 of which have formed recently due to glacial retreat and ice melt. Gurudongmar Lake exemplifies this process, having formed through the retreat of glaciers in the Chhombo Chhu watershed of the upper Teesta basin. The lake is flanked by bedrock and moraine deposits [27,28]. The Sikkim Himalayas are positioned at the convergence of the Central and Eastern Himalayas, creating a complex climatic zone influenced by the Indian Summer Monsoon (ISM), Westerlies, and Easterlies. Long-term climate data from Gangtok indicate a significant rise in minimum temperatures, increasing by approximately 0.036 °C annually from 1961 to 2017.

3.2. Geology of the Study Area
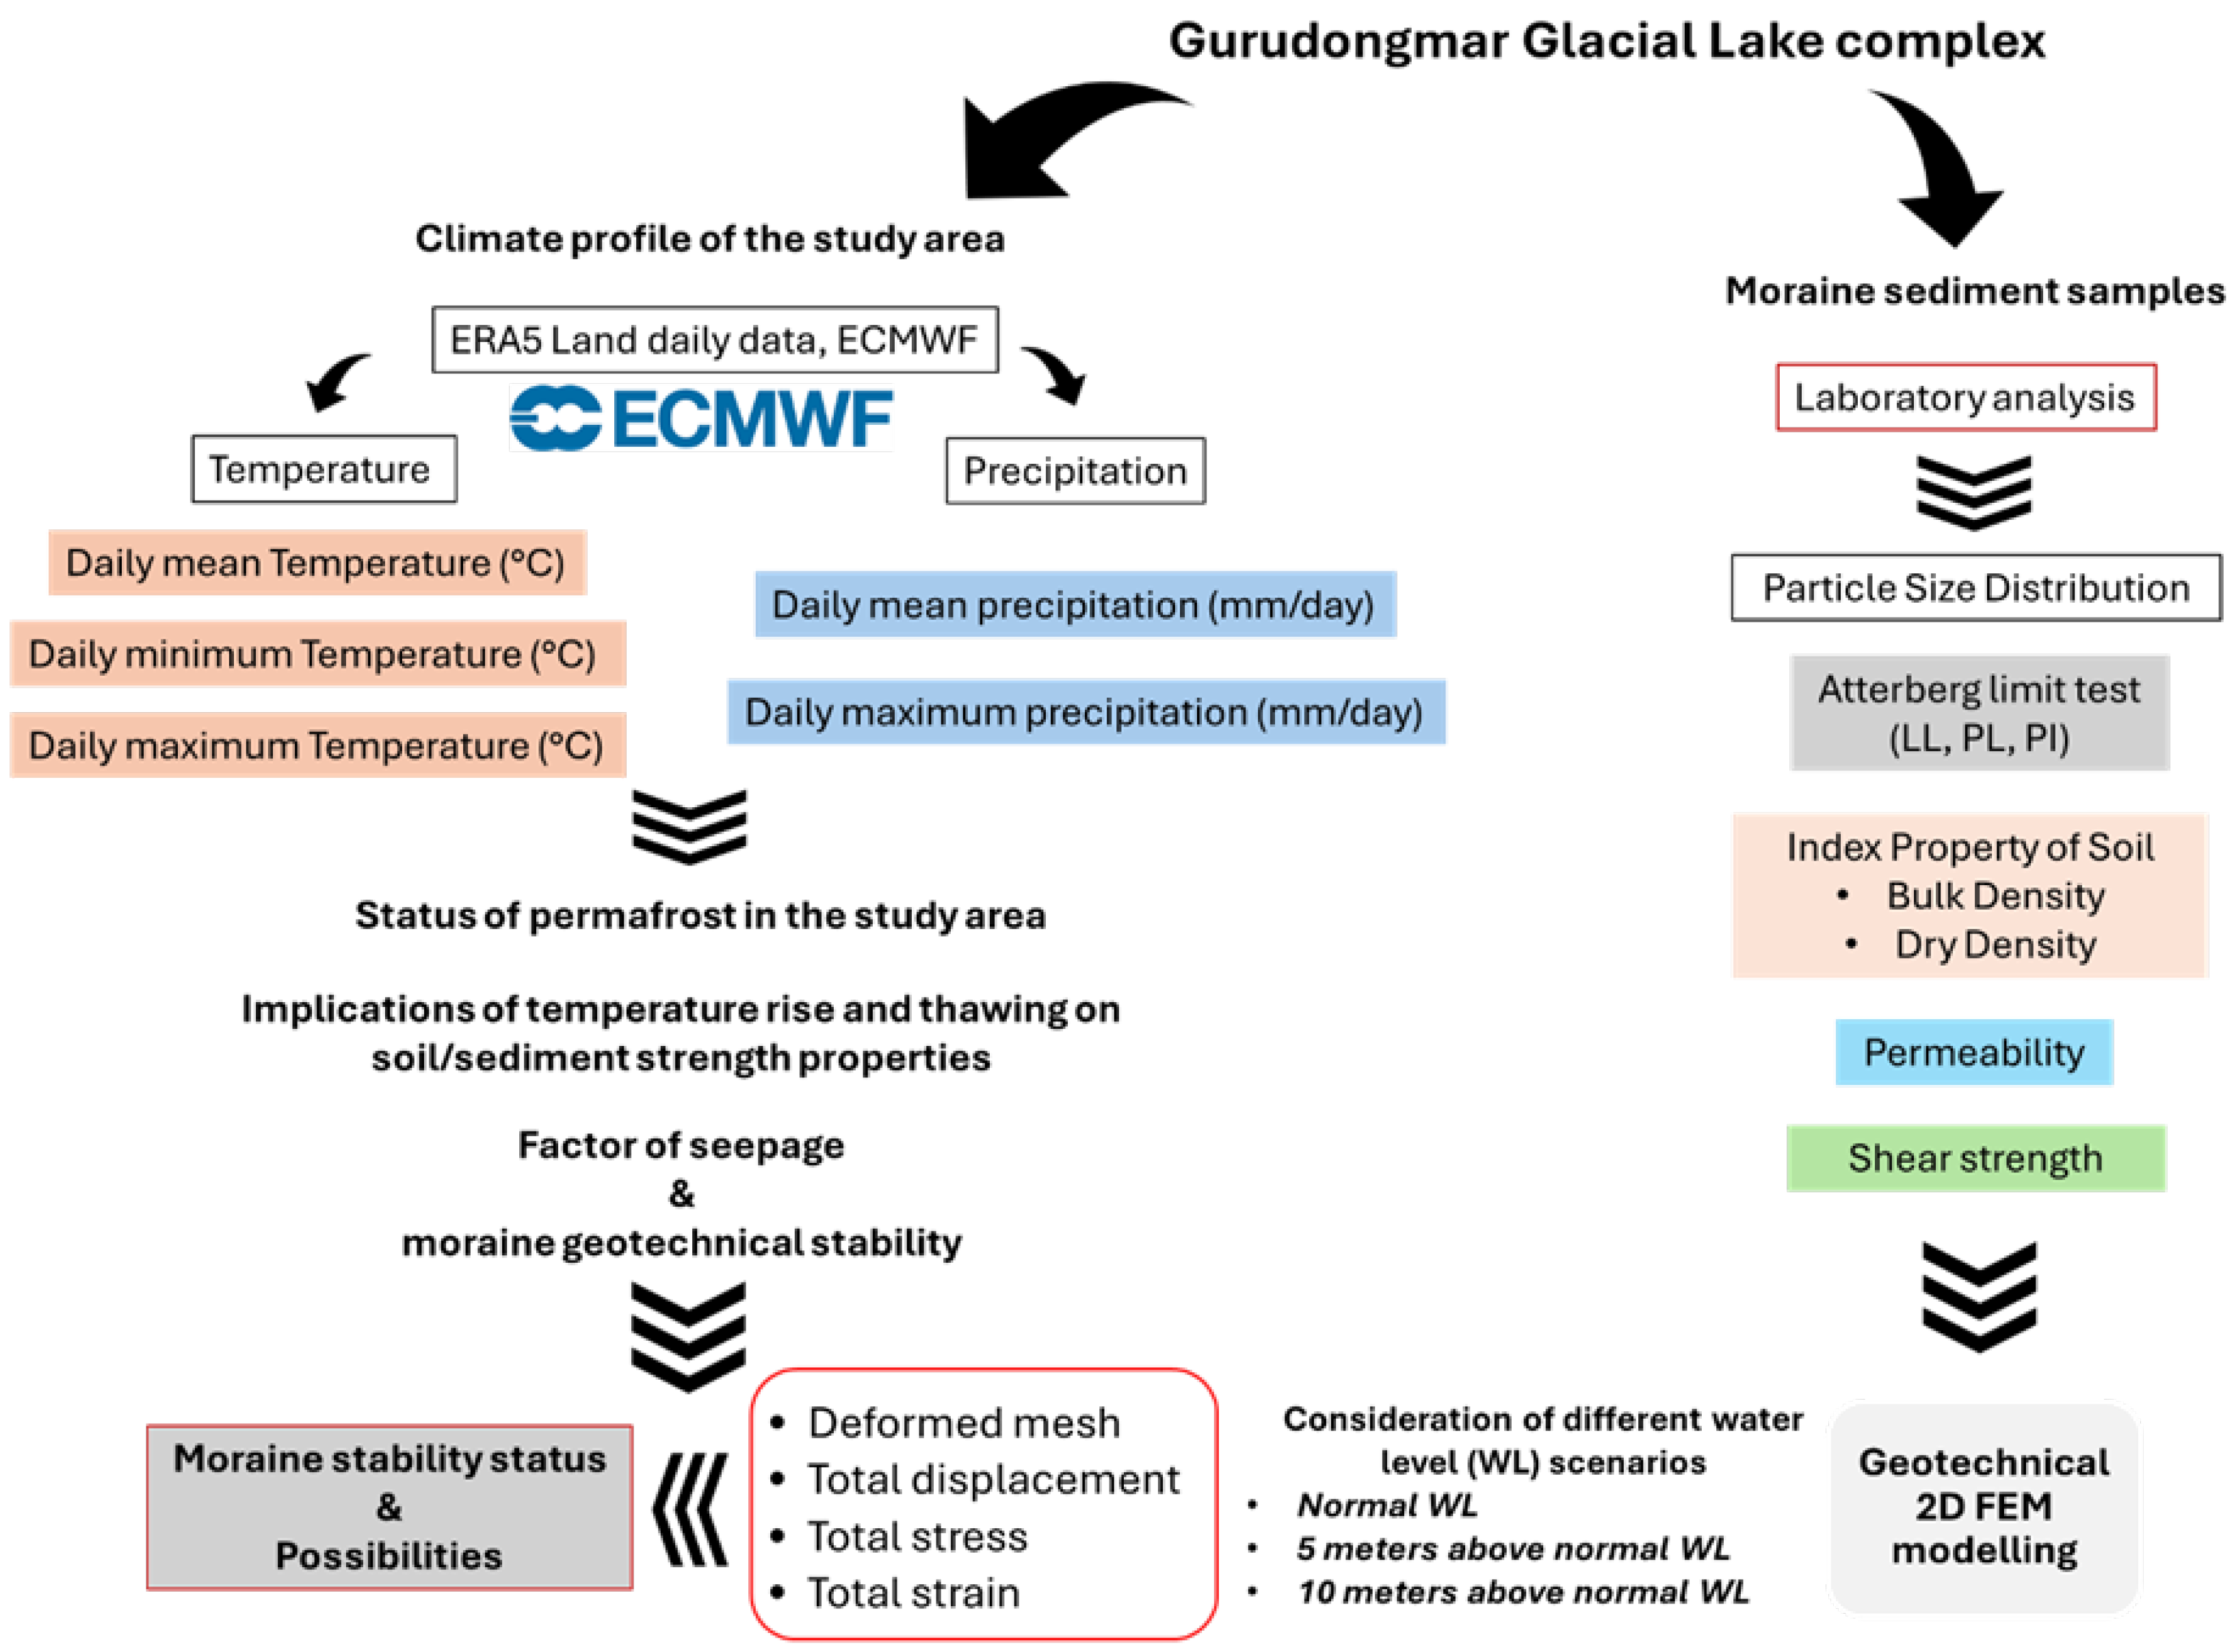
The geological setting of Gurudongmar Lake (Figure 2) is defined by its location within a transition zone between the Greater Himalayan Sequence (GHS) to the south and the Tethyan Sedimentary Sequence (TSS) to the north, separated by the South Tibetan Detachment Zone (STDZ). The lake lies within a proglacial context, where the retreat of glaciers has left behind a combination of moraine deposits and bedrock features. The sediments surrounding the lake primarily consist of silty sand, either from moraine deposits or debris transported by water. The lithology of the TSS, ranging from Cambrian to Cretaceous in age, includes ferruginous sandstone, limestone, siltstone, and shale, with fossils like graptolites and brachiopods embedded within these rocks. Though generally un-metamorphosed, some regions exhibit low-grade metamorphism, particularly in the formation of biotite-mica schist and psammites. The TSS is bounded by the STDZ [29], which separates it from the low- to medium-grade metamorphic rocks of the GHS to the south [30,31]. In the east, the lake is bordered by the Lachi Hills, consisting of quartzite, shale, and pebble beds.
Gurudongmar Lake is bounded by a series of rounded hillocks (about 300 m from the adjacent plains) called the Lachi Hills in the East Himalayas, and these are formed by an alternative sequence of quartzite and shale with some pebble beds. Rocks of the Everest limestone embody the principal lithology of the catchment area and crystalline gneissic complex formations. The region’s active tectonic setting and history of seismic events, combined with the glacial erosion of the north-facing slope of the Kangchengyao massif, have contributed to the dynamic landscape of the Gurudongmar Lake complex [33].

4. Methodology

This study involves the following components: (i) detailed geotechnical and geological investigations that involve field and laboratory testing to estimate the geotechnical properties and profile of the subsurface; (ii) a numerical stability analysis of the natural dams on the three sides of the lake, in which the outcomes of the subsurface geotechnical and geological investigations are used as inputs; and (iii) climate profiling through ERA5 Land daily data of temperature and precipitation for the study area and assessing its impact on the stability of the natural dam surrounding the lake. The step-by-step procedure, as indicated in Figure 3, involved a field visit for the visual inspection and collection of soil samples for further geotechnical investigations in the lab.

4.1. Geotechnical and Geological Investigations

The field sampling process involved a systematic evaluation of the moraine sections AB, CD, and EF surrounding Gurudongmar Lake on three sides: north, west, and east. Debris and soil material types and variations were assessed. Samples were collected systematically by digging into the upper surface to around 30 cm and scooping out moist matrix material for laboratory testing. This process was repeated on all three sides, as illustrated in Figure 1. Samples from both the upper and lower parts of the moraines were collected using the same procedure for analysis.
Soil samples collected from the site were analysed to determine their geotechnical properties, classification, estimated strength, and stiffness parameters. IS 1498:1970 (Reaffirmed Year: 2021) [34] was used for the classification of soil through a grain size analysis per IS 2720 (Part 4): 1985 (Reaffirmed Year: 2020) [35] and through a consistency limits test per (Reaffirmed Year: 2020). Other geotechnical properties like soil density and coefficient of permeability were estimated per relevant IS codes (IS 2720, Part 17—1986) [36] from the representative soil samples collected from the site. Similarly, the shear strength of the soil and its elastic properties, i.e., elastic modulus (E), were obtained from the Unconfined Compressive Strength (UCS) of soil per IS 2720 (Part 10): 1991 [37]. Poisson’s ratio was taken from the literature based on the soil type as classified.

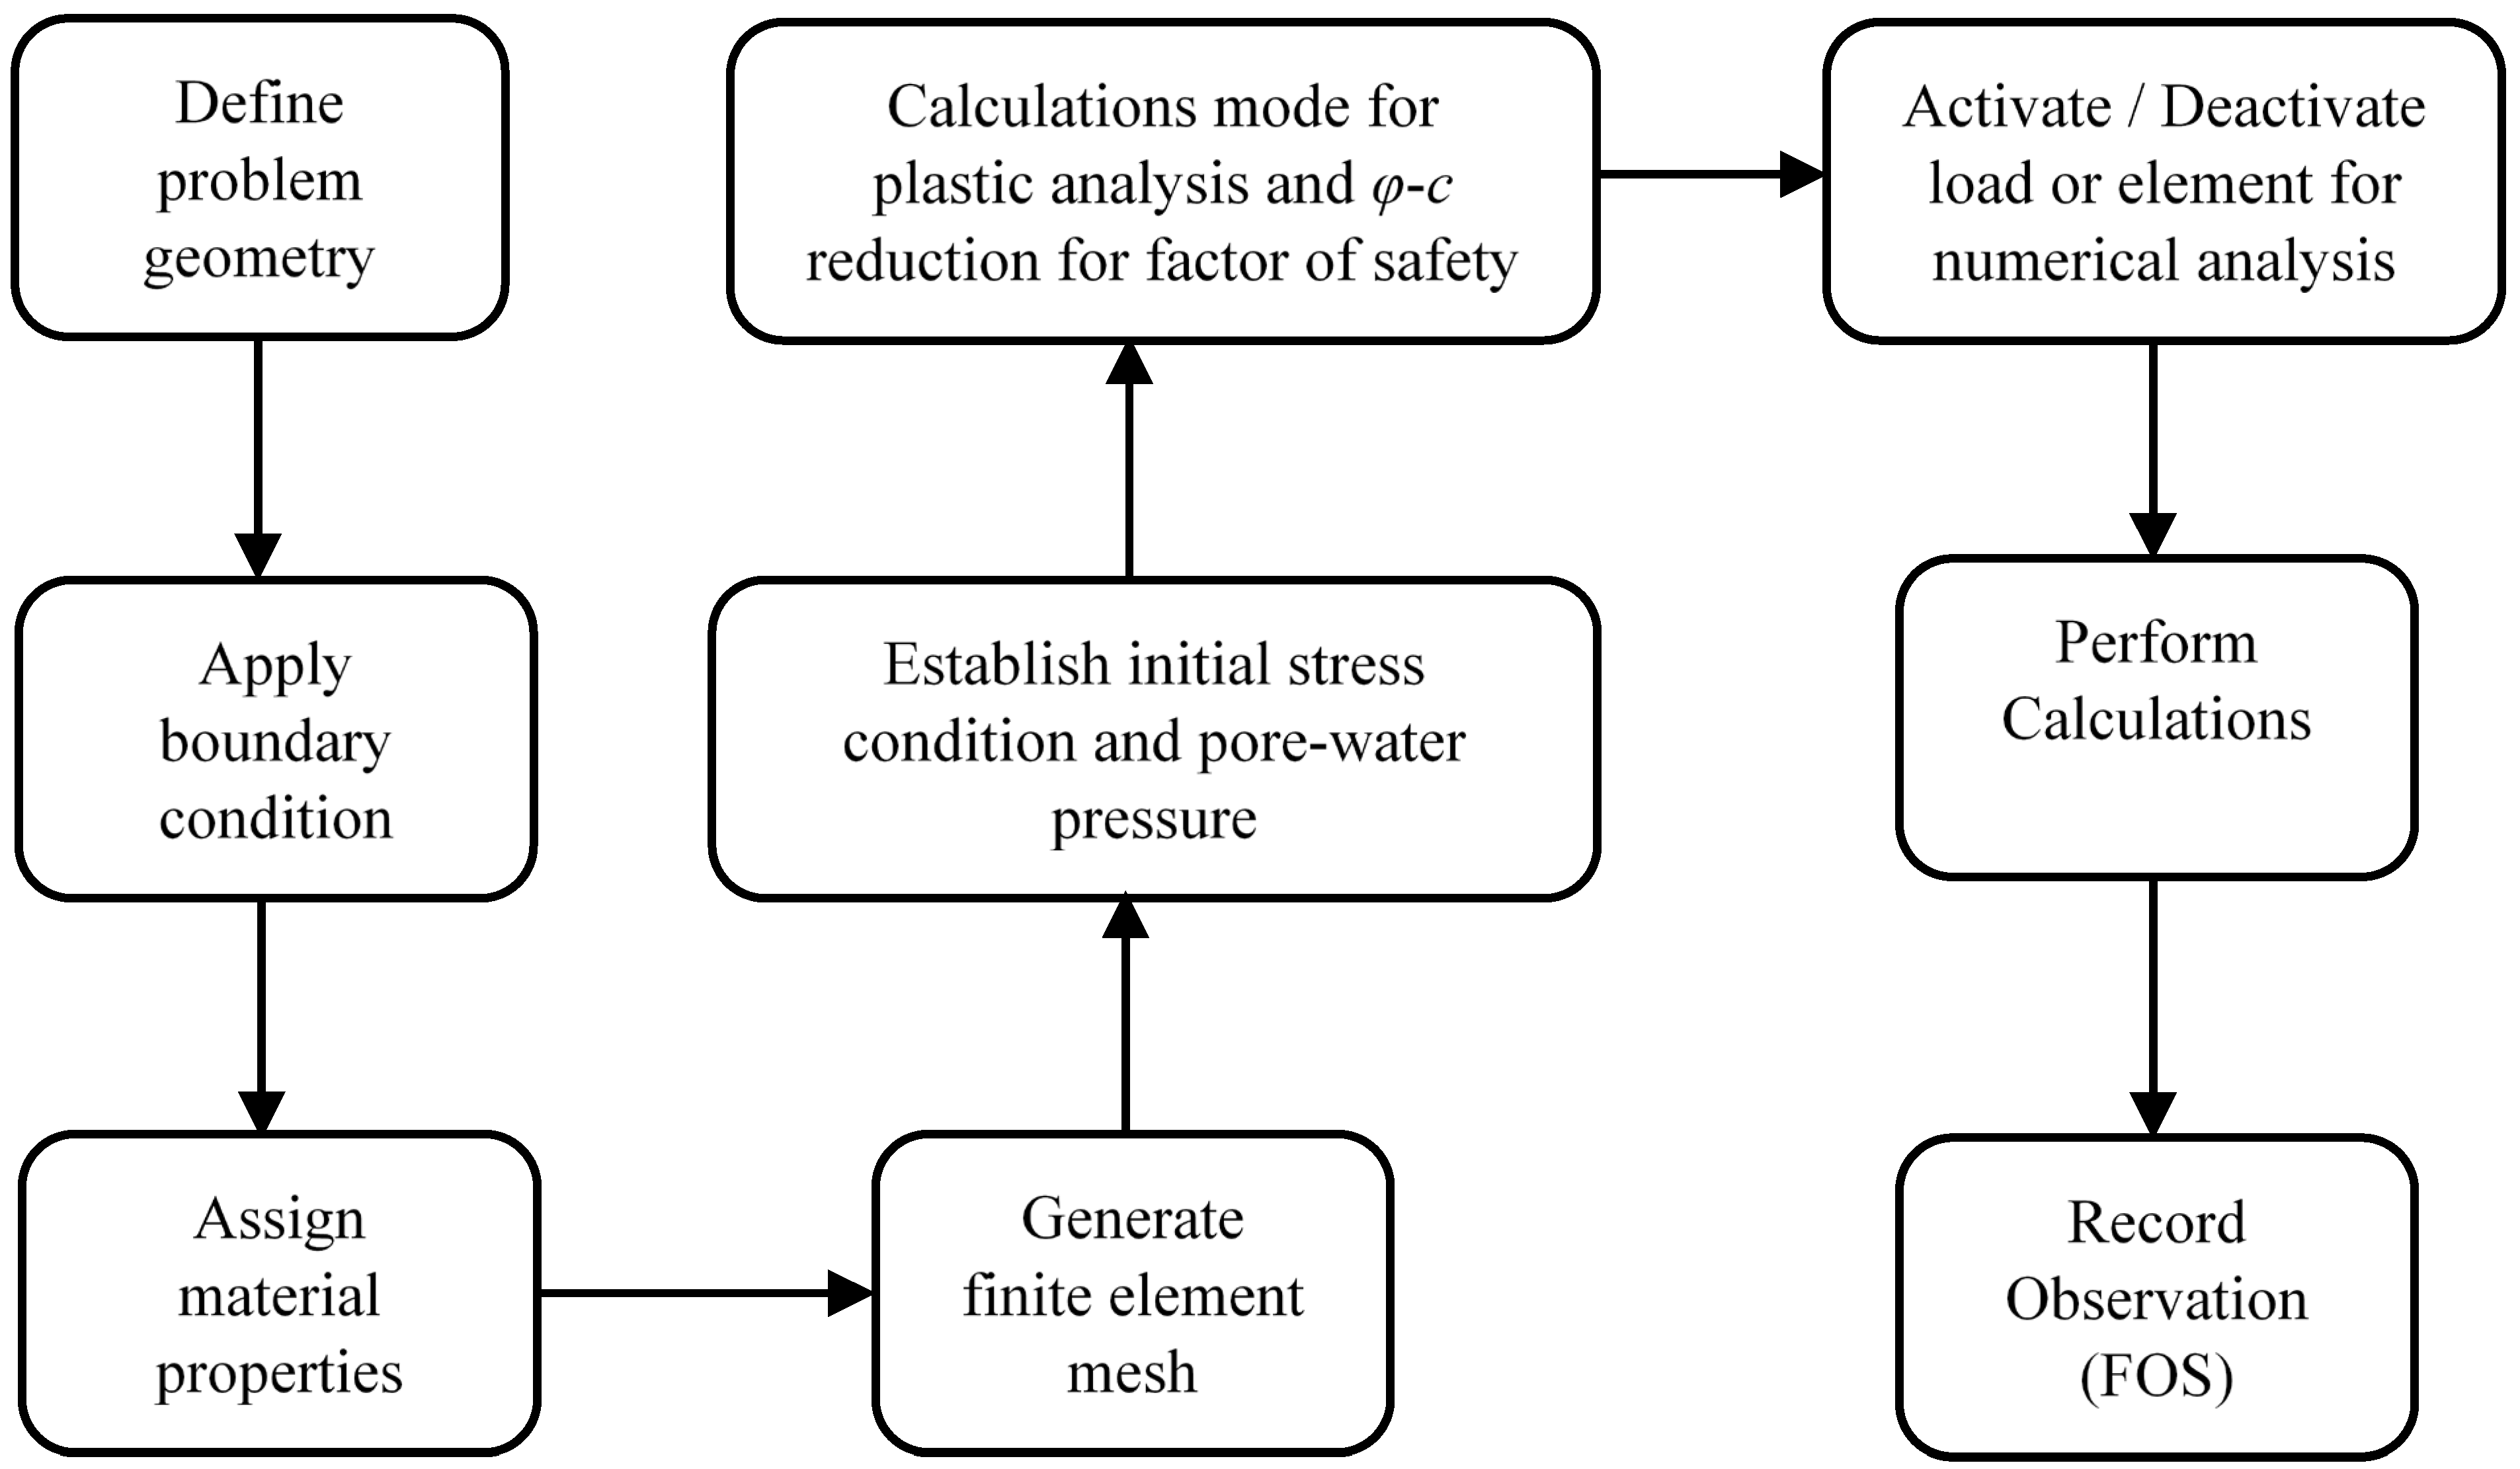
4.2. Numerical Stability Analysis of Natural Dams

The shear strength and stiffness parameters, i.e., cohesion (c), angle of internal friction (ϕ), elastic modulus (E), and Poisson’s ratio (ν), were used for the numerical analysis, assuming Mohr–Coulomb constitutive behaviour is followed by the in-situ soil. The stress–deformation analysis and estimation of the safety factor through a strength reduction technique were an integral part of the numerical analysis, and the output of the results provided insight into the problem statement and potential future stability issues if they exist. The step-by-step procedure for the numerical analysis involved is depicted in Figure 4.
The steps involve creating the geometry of the numerical model after fixing the type of model as “plain strain” and “15-node triangular element” and the units and dimensions as per the extent of details available in the sectional drawings prepared from the field study and satellite data. After creating a geometric model, the standard boundary conditions are applied, and then the material properties are assigned, assuming the material follows Mohr–Coulomb constitutive behaviour and the non-associated flow rule. Generate a finite element mesh, keeping the mesh coarseness as “fine”, and then establish the initial in situ stresses, i.e., pore water pressure through the “phreatic line” and effective stress due to gravity loading.
Now, the calculation mode involves two phases, i.e., plastic analysis for stress–deformation and ϕ-c reduction for the calculation of the factor of safety using a strength reduction technique (Matsui and San, 1992) [38]. The calculation step also allows activation or deactivation of the material and elements to simulate stage construction or studying the impact of insertion of structural elements in the soil, such as geogrids, nails, tunnels, etc. Once the calculation is performed, outputs are recorded as per the requirements of analysing the output.

4.3. Climate Profiling of the Study Area

To understand these impacts, temperature and precipitation trends in the Gurudongmar Lake area were analysed using daily data from the ECMWF ERA5 Land reanalysis dataset, accessed through the Climate Engine [39], covering the period from 1994 to 2024. The daily data were further analysed to derive the yearly number of days below 0 °C, the total annual precipitation, the yearly number of days with precipitation > 5 mm, the year-wise daily average minimum temperature, the maximum temperature, etc. The decadal changes and trends of these climatic variables were assessed.
These data provided a foundational understanding of the climatic profile of the study area, which is crucial for assessing the implications of temperature fluctuations and thawing on the stability of soil and sediment. The status of permafrost in the study area was also examined through a field visit and analysis of temporal Google Earth and Landsat imageries, as permafrost plays a significant role in influencing the stability of the moraines. The implications of temperature rise and thawing on soil and sediment strength properties were further discussed to assess the potential scenario of slope instability in the lake complex.

5. Results and Discussions

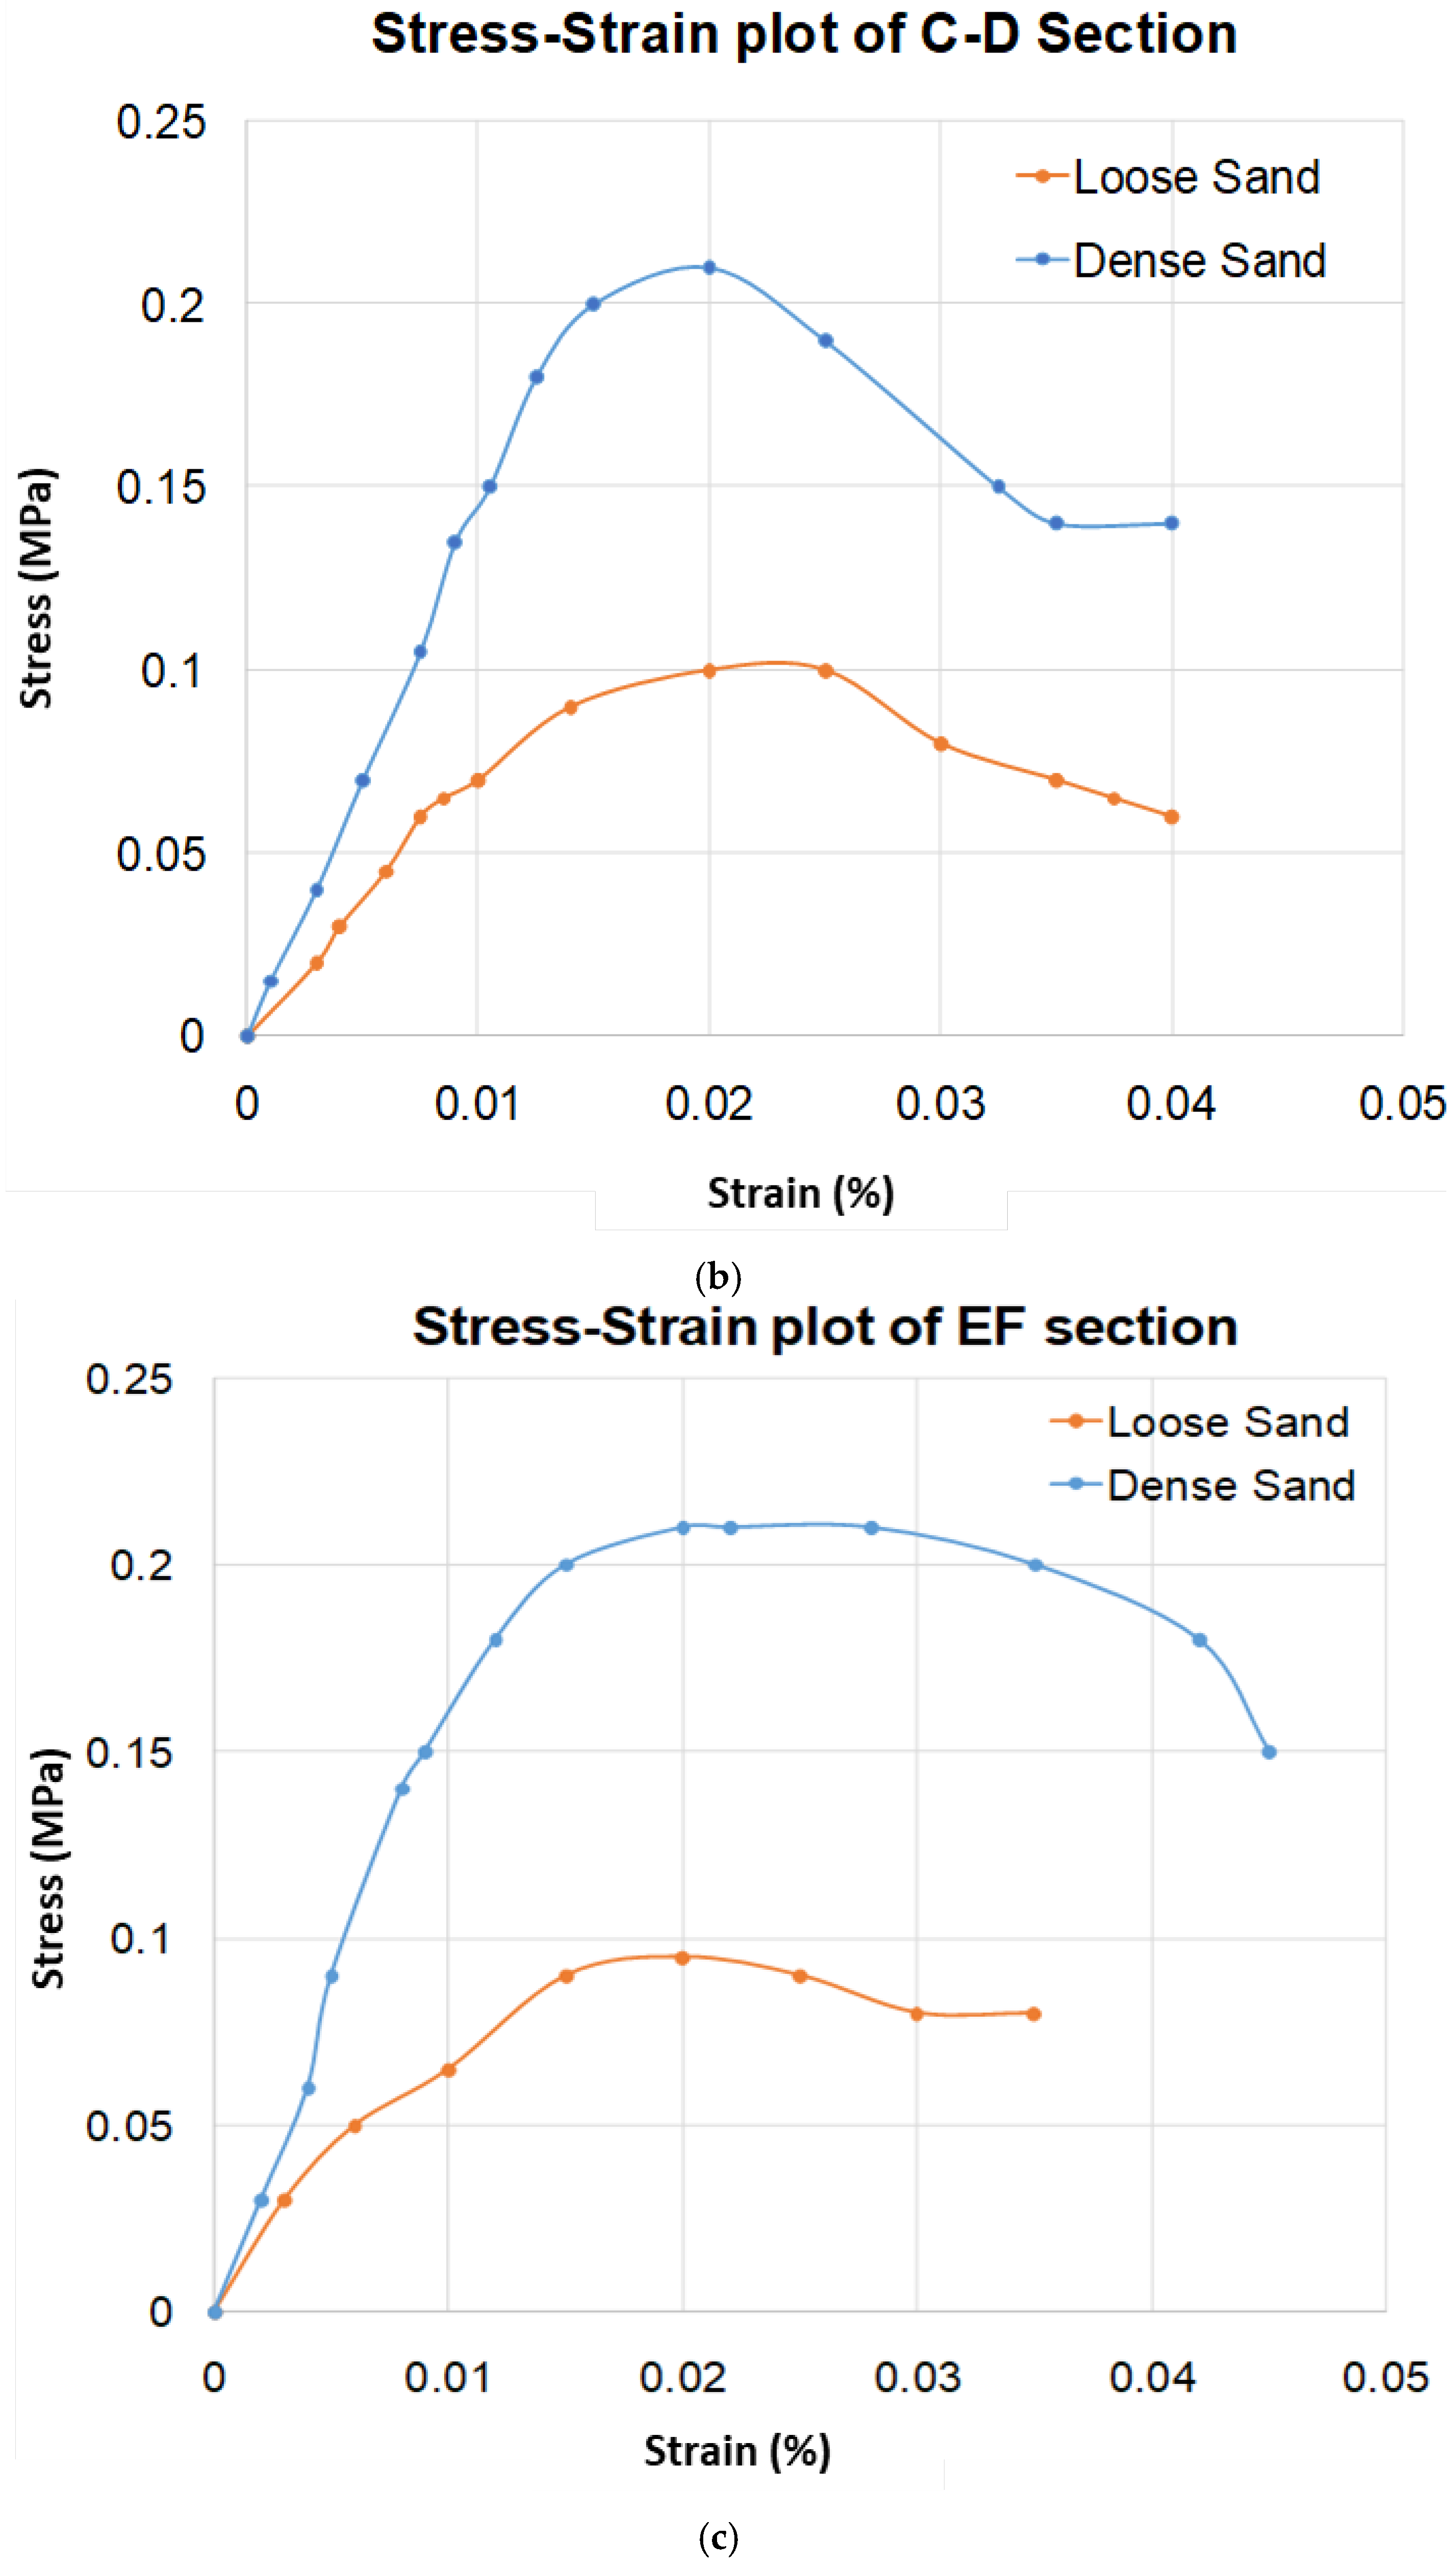
5.1. Laboratory Geotechnical Investigation

The analysis involved a detailed evaluation of the geotechnical properties of the dam materials and the structural behaviour of these dams under various conditions. The properties of the moraine sediment dams are summarised in Table 1, which provides a comprehensive overview of the geotechnical parameters for each dam. The stress–strain curves of the moraine sediment dam AB, CD, and EF sections are shown in Figure 5a–c. The upper sections of the moraine dams have a lower strength compared to the lower sections.

5.2. Numerical Stability Analysis for Increased Lake Water Level

The stability of the moraine sediment dams labelled AB, CD, and EF, as illustrated in Figure 1, was analysed. The moraine sediment dam AB, positioned towards the north of the lake, is strategically located near the lake’s discharge site. This placement has resulted in an excavation approximately in the middle of the dam, which plays a crucial role in maintaining a relatively static water level in the lake. The other two dams, CD and EF, are situated at the western and eastern edges of the lake, respectively. Among the three dams, dam AB exhibits notably higher cohesion (c) values compared to dams CD and EF.
Cohesion is a critical parameter in assessing the shear strength of soil and influences the stability of the dam structures. The higher cohesion observed in dam AB suggests that its materials have a greater internal strength, which enhances the dam’s resistance to shear forces and potential failure. This increased cohesion can be attributed to variations in the sediment composition, consolidation due to traffic load, or soil characteristics at the dam AB site.
In contrast, the lower cohesion values in dams CD and EF indicate that these dams may have relatively weaker internal bonding among the sediment particles, potentially affecting their stability under load. The differences in material properties among the dams are crucial for understanding their stability and performance, particularly in scenarios involving rising water levels or other stress factors. To assess the stability of three moraine sediment dams, designated AB, CD, and EF, and to evaluate the consequences of their potential failure due to rising water levels in Gurudongmar Lake, the non-linear finite element software PLAXIS 2D 8.6 was utilised. This widely recognised programme is extensively used by geotechnical engineers to analyse the stability of earth structures and slope stability. PLAXIS 2D offers detailed insights into the behaviour of the dams by providing crucial data on deformation, displacement, stresses, and strains under varying water levels, specifically for scenarios where the water level rises by 5 m and 10 m. The stability analysis incorporated the geotechnical properties of the moraine sediment dams into the finite element model. The Mohr–Coulomb model, an elastic-perfectly plastic constitutive model frequently used in geotechnical engineering, was chosen to represent the stress–strain behaviour of the soil. This model is valued for its practical application in design and analysis due to its simplicity and effectiveness in capturing general soil behaviour.
The Mohr–Coulomb model requires five key parameters: Young’s modulus (E′), friction angle (ϕ′), Poisson’s ratio (v′), cohesion (c′), and the dilatancy angle (ψ′). The dilatancy angle is often approximated as ϕ′—30° when the friction angle exceeds 30°, as described by Bolton (1986) [40]. The use of this model enables a comprehensive evaluation of the dams’ stability under different loading conditions, providing valuable information for predicting potential failure scenarios and their impacts.
In the finite element (FE) analysis, the impact of rising lake water levels on the stability of the moraine sediment dams was thoroughly investigated. The simulation encompassed three critical water level scenarios: the submerged base level of the dams and water levels rising by 5 m and 10 m above the submerged base level. It is important to note that the base level of the dams is generally not submerged due to the continuous discharge from the outlet of dam AB, as shown in Figure 1. The FE analysis shows the total displacement of 1.25 m, 18.72 m, and 24.67 m for dams AB, CD, and EF under all three critical scenarios.
These displacement values reveal that dam AB exhibits significantly lower displacement compared to dams CD and EF across all water level scenarios. This suggests that dam AB has considerably higher stability and resistance to deformation under varying water levels. The relatively minor displacement of dam AB, even with a water level increase of 10 m, highlights its robustness and effectiveness in maintaining structural integrity despite rising water pressures. In contrast, the much larger displacements observed in dams CD and EF under similar conditions suggest that these dams are more susceptible to deformation and instability. Figure 6 illustrates that the total displacements for all three dams were quite similar across the different water level scenarios. This uniformity indicates that while the absolute displacements differ significantly between the dams, the relative impact of water level rise is consistent in terms of how it affects the overall stability of each dam. The similarity in displacement patterns across the scenarios emphasises that dam AB remains the most stable structure, while CD and EF show greater sensitivity to water level changes.
The analysis of critical stability parameters like displacement, volumetric strains, shear strains, and deviatoric stress revealed consistent results across all three scenarios of water level rise. As shown in Table 2, the effects of water level increases, whether by 5 m or 10 m, were similar for the dams. This indicates that the dams’ stability responses remain relatively stable under varying water levels up to a 10-metre rise.
It is noteworthy that permafrost conditions are prevalent both on and within the dam structures and their surrounding sites. Permafrost plays a crucial role in enhancing the strength and stability of these dams by preventing seepage and reducing the risk of structural failure. The presence of permafrost contributes to the overall stability of the dam structures by providing additional support through its high shear strength and low permeability. As a natural insulator, permafrost helps to maintain low moisture content within the dam materials, further mitigating the risk of erosion and seepage.
However, the potential impact of changing climatic conditions on permafrost must be considered. Climate change could lead to permafrost thawing, which poses a serious risk to the stability of the dams. Thawing permafrost could weaken the dam structures, increase seepage, and compromise overall stability. Therefore, it is crucial to evaluate the effects of climate change on permafrost and implement measures to address potential risks associated with permafrost thawing.

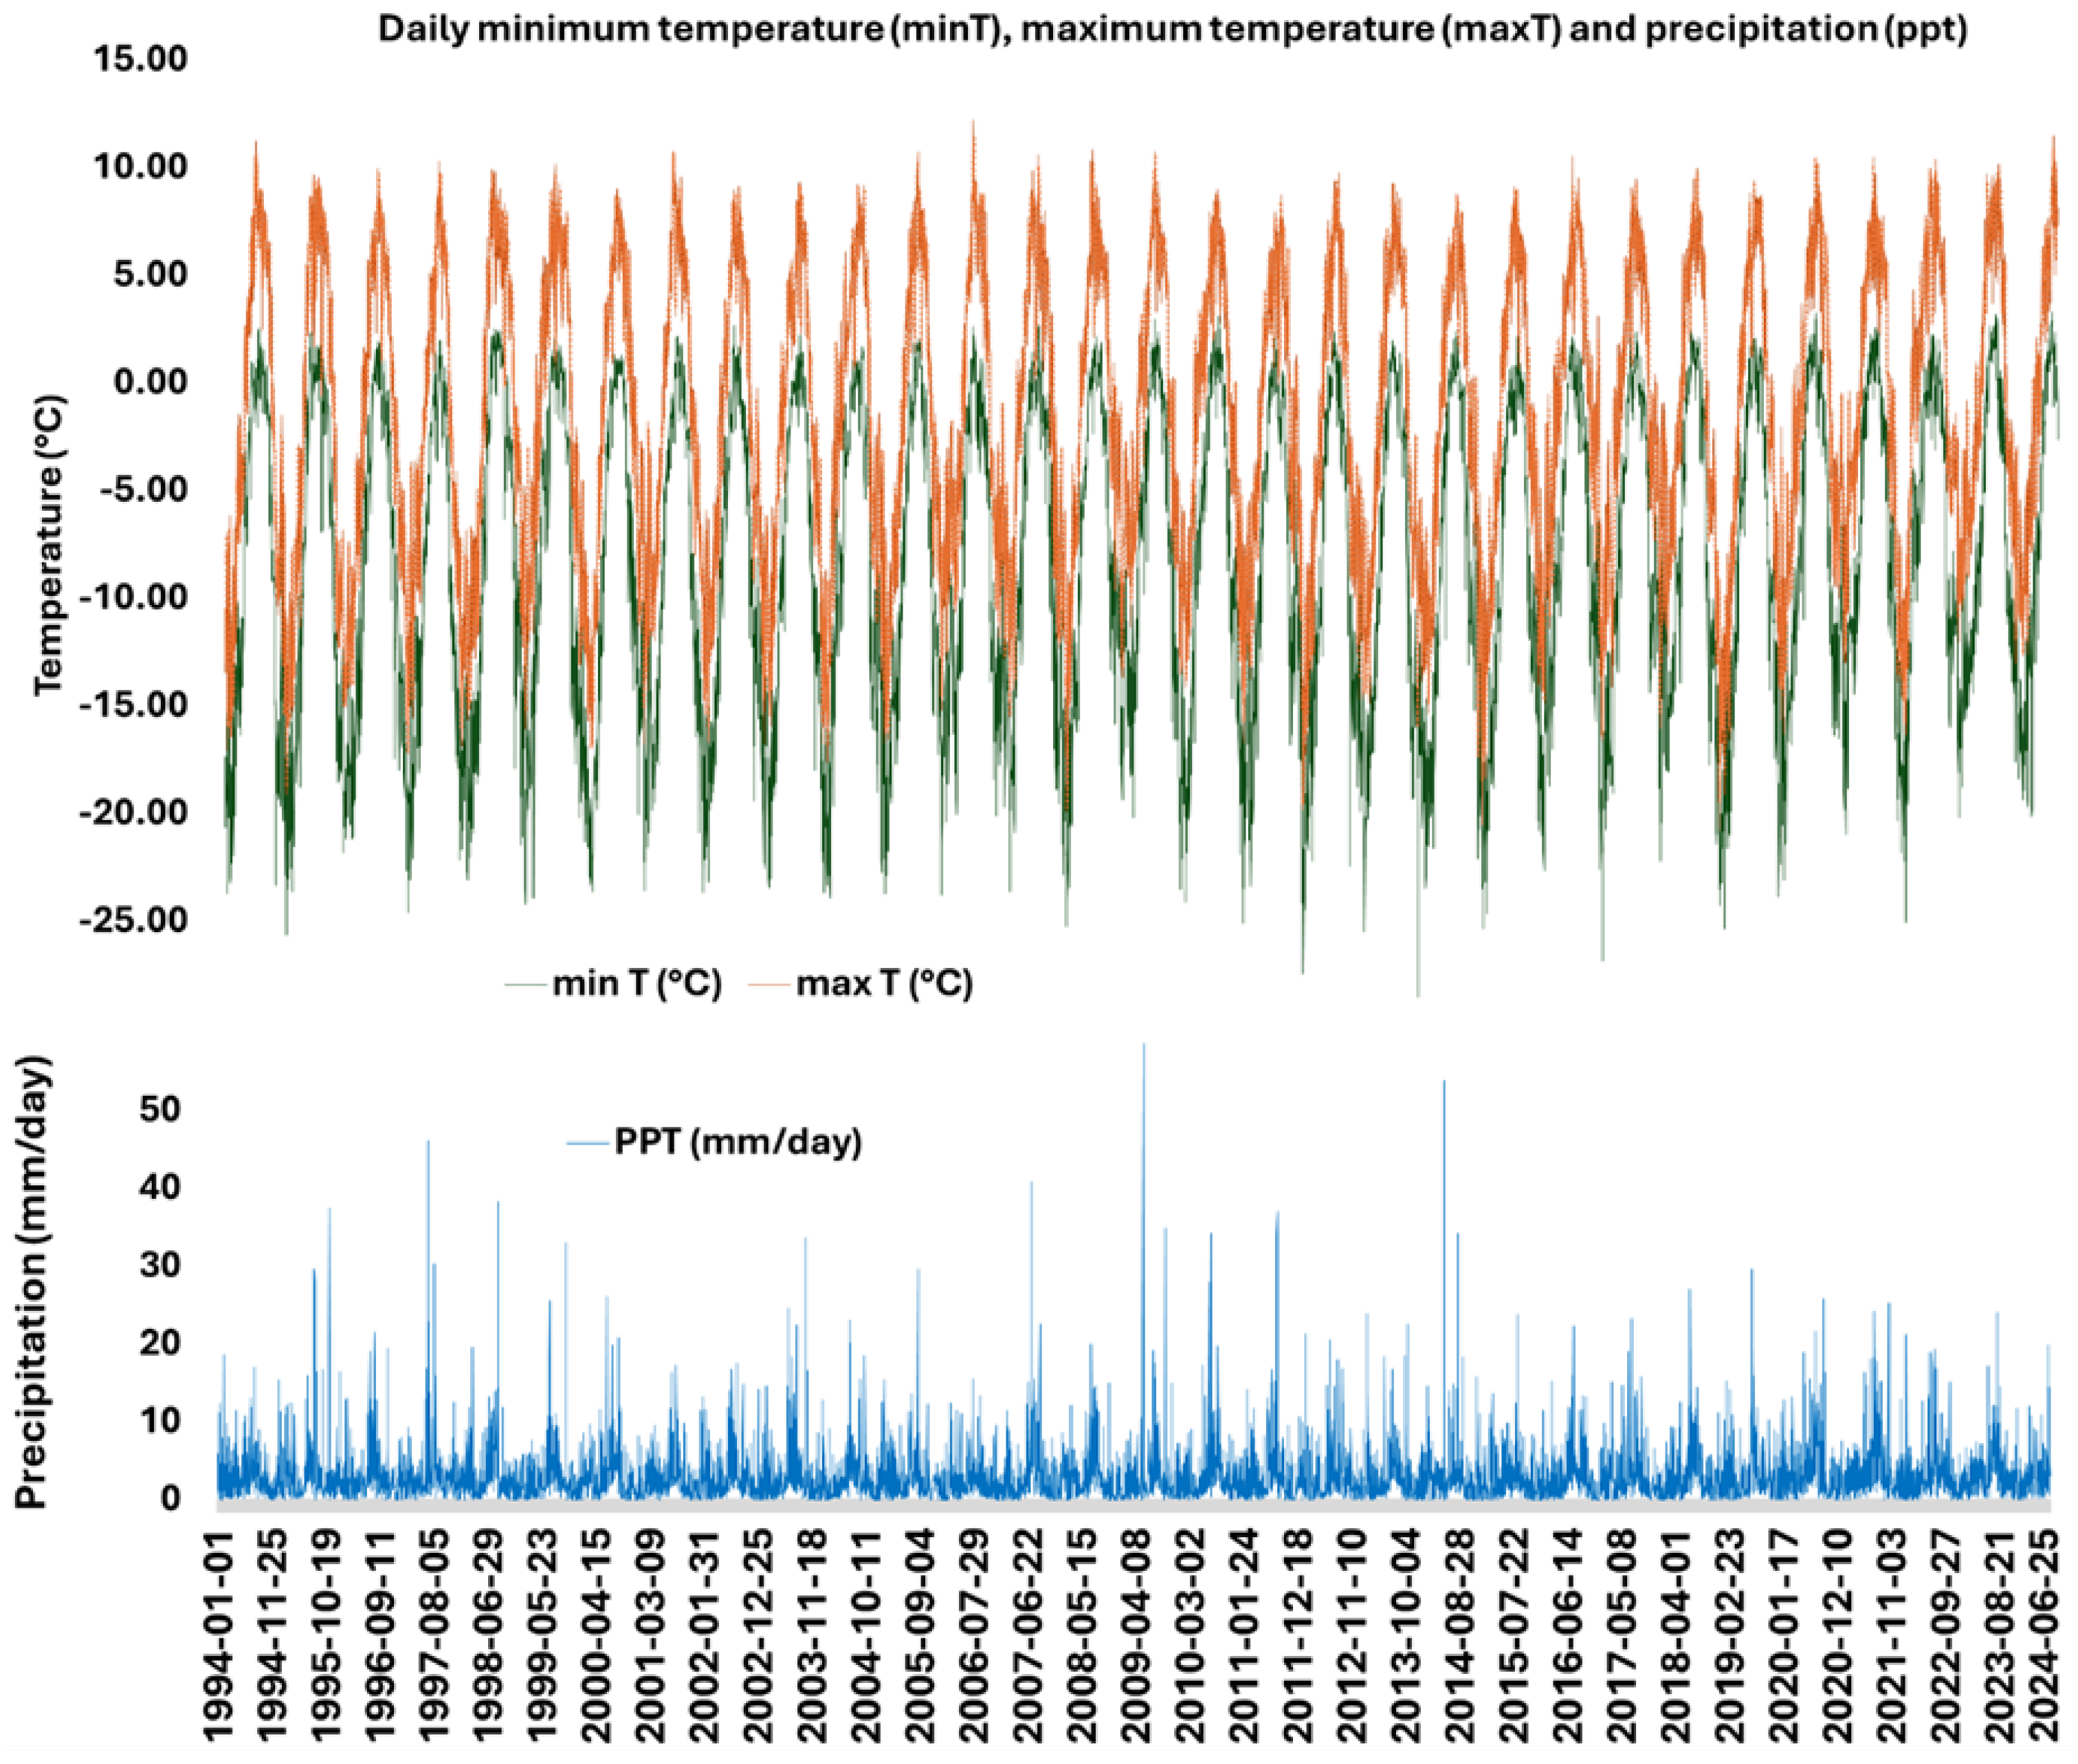
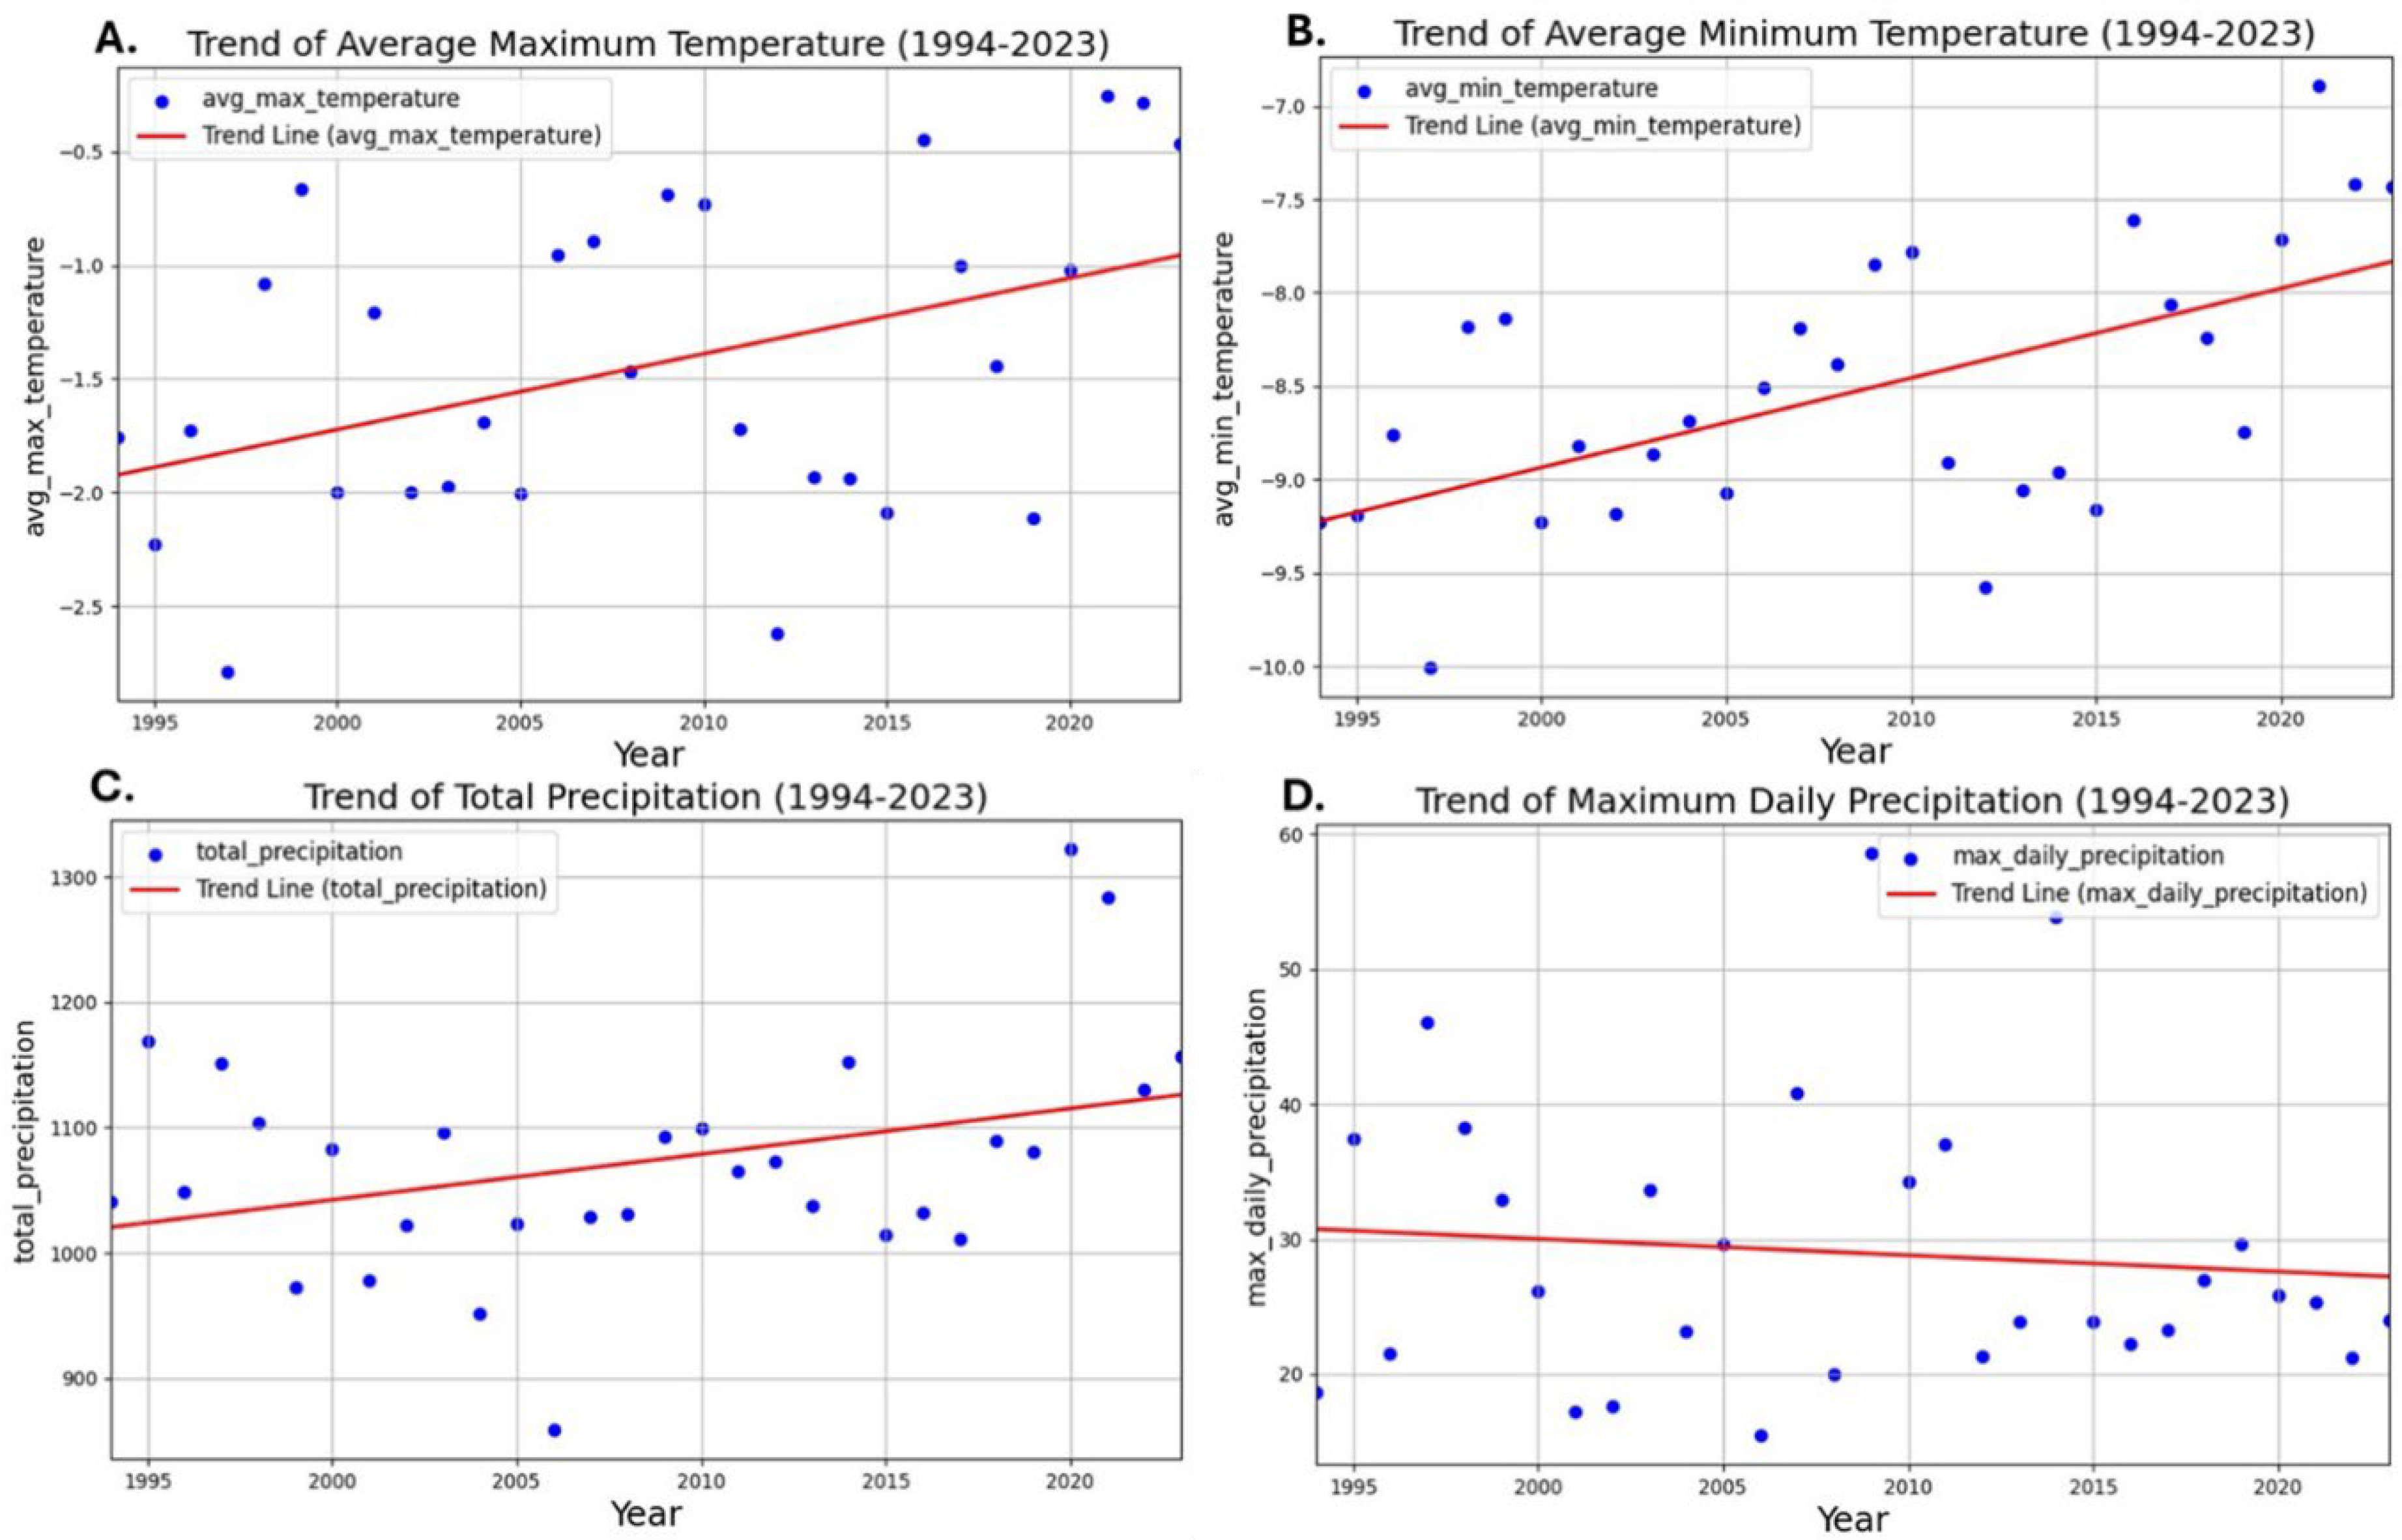
5.3. Climatic Factor and Permafrost Thawing

Assessing the impact of climatic factors and permafrost thawing on the stability of moraine sediment dams is vital for evaluating potential hazards in high-altitude glacier regions. Moraine sediment dams, created from debris deposited by glaciers, are crucial for impounding glacial lakes. However, their stability is increasingly compromised by climate change and the consequent thawing of permafrost. Several studies have shown that mountain permafrost is deteriorating due to rising global temperatures [41]. As air temperatures continue to increase and solar radiation intensifies, the extent of frozen ground is expected to shrink, leading to further warming of alpine permafrost. This will significantly impact mountain communities, regional economies, and alpine ecosystems [42]. Climate change is projected to have considerable effects on regional hydrology, geomorphology, and ecology across the high mountain regions of Asia. As a result of the potential threat of rising temperatures on moraine stability, existing strength and potential disintegration of natural dams are uncertain [43,44], but dam stability considering potentially thawing permafrost and ice cores also remains a concern
The climate analysis for the Gurudongmar Lake region, located in a high-altitude cold environment, reveals significant trends over the past three decades. The maximum recorded daily temperature in the area was 12.19 °C, while the average maximum temperature was −1.46 °C. In contrast, the lowest maximum temperature observed was −20.73 °C, typical of the harsh winter conditions. The lowest recorded daily temperature was −28.52 °C, with an average minimum temperature of −8.55 °C (Figure 7). Precipitation data from the study period show a maximum daily precipitation of 58.6 mm and an average daily precipitation of 2.94 mm, indicating a generally cold and dry climate. During the first decade of the study (1994 to 2003), the average number of days with temperatures below 0 °C was 313.7 days. This number remained relatively stable in the second decade (2004 to 2013), averaging 314 days. However, in the most recent decade (2014 to 2023), the average number of subzero days decreased to 305.3 days (Table 3). This reduction signifies a warming trend, with fewer days experiencing temperatures below freezing.
Minimum temperatures have increased from −9.23 °C in 1994 to −6.89 °C in 2021, and maximum temperatures have risen from −1.76 °C in 1994 to −0.25 °C in 2021 (Table 4 and Figure 8). Despite these changes appearing modest, 0.03 °C per year for minimum temperatures and 0.02 °C per year for maximum temperatures over time, these incremental increases can have substantial impacts on the region’s climate and permafrost conditions.
Since 2017, there has been an observed increase in mean daily precipitation, while maximum daily precipitation has decreased. This inverse relationship indicates a shift towards longer and steadier precipitation events, rather than short, intense bursts of rainfall. These climatic changes highlight a clear trend towards a milder cold season and altered precipitation patterns, which could significantly affect the stability of moraine dams and the dynamics of glacial lakes in the region.
The number of days with precipitation has shown variability over the years, with a prominent increase observed in recent years. Total annual precipitation has demonstrated substantial fluctuations, ranging from a low of 858 mm in 2006 to a high of 1322 mm in 2020 (Table 4, Figure 8C). Recent data, particularly from 2015 onwards, indicate a trend towards higher total precipitation. This suggests an increase in either the intensity of rainfall events or the duration of rainy seasons in the region. Precipitation patterns have also shifted, with the number of days receiving more than 5 mm of precipitation increasing from an average of 55.7 days in 1994–2003 and 56.2 days in 2004–2013 to 66.8 days in 2014–2023. This trend suggests a rise in the frequency of significant precipitation events. These changes in precipitation patterns may have important implications for the permafrost, the stability of moraine sediment dams, and the risk of GLOFs. There is a need for further investigation into the type of precipitation (rainfall or snowfall trend) and how these climatic shifts impact the region’s hydrological and geotechnical dynamics.
Analysis of temperature and precipitation trends for the Gurudongmar Lake region reveals notable climatic changes over the past three decades. During the first decade of the study period (1994–2003), the minimum temperature averaged −8.96°C, increasing slightly to −8.61 °C in the second decade (2004–2013). In the most recent decade (2014–2023), the minimum temperature rose further to −8.02 °C (Table 4). Similarly, the maximum temperature increased from −1.75 °C in the first decade to −1.47 °C in the second decade, reaching −1.1 °C in the most recent decade (Table 4). This upward trend in both minimum and maximum temperatures indicates a gradual warming of the region. The warming trend and changing precipitation patterns underscore the need for adaptive management strategies to address the potential impacts on high-altitude environments like Gurudongmar Lake.
Research indicates that warming has increased the depth of the active layer in mountain permafrost [45] and shifted the lower limit of permafrost to higher elevations [46]. These changes affect soil moisture, ground thermal regimes, cryo-pedogenic processes, and mass movement dynamics [47]. Consequently, the potential for widespread mass wasting activities and weakened mountain slopes is anticipated to increase due to ongoing climatic changes [48].
The area of interest for this study, situated above 5000 m near Gurudongmar Lake, shows evidence of permafrost (Figure 9C). Recent changes in temperature and precipitation in this high-altitude, climate-sensitive region are likely to increase the seasonal temperature differential between summer and winter (Figure 9A,B). Furthermore, significant changes due to permafrost thaw and related mass wasting processes have been observed at lower elevations, providing context for the potential impacts at higher altitudes (Figure 9E). Between the period of 2010 and 2022 (Figure 9F,G), the Gurudongmar area has undergone significant glacier retreat and permafrost thawing. These factors underscore the need for comprehensive assessments of permafrost dynamics and moraine dam stability in the context of ongoing climate change.
In Sikkim, permafrost is predominantly found above altitudes of 5000 m [26]. As climate change progresses, the dynamics of permafrost are shifting, with significant implications for slope stability and the integrity of natural dams. Specifically, the active layer of permafrost is undergoing changes that are contributing to an increase in shallow slope movements [49,50]. In contrast, deeper permafrost warming is likely to result in more substantial bedrock failures [51]. When such movements occur near infrastructure or close to glacial lakes, they can pose considerable risks to downstream areas.
Climate change is expected to increase the number of high-elevation lakes formed by natural dams [52]. These lakes are potentially at risk from the surrounding unstable slopes, a concern that has been highlighted at a regional scale [53]. The stability of moraine dams, particularly those affected by thawing permafrost, is therefore uncertain. The potential weakening and disintegration of these natural dams are pressing concerns [44]. Research emphasises that the stability of these dams, considering the potential impacts of thawing permafrost and ice core changes, remains an important issue.
The formation of new lakes and water accumulation in glaciated regions of Sikkim, including the area near Gurudongmar Lake, have become apparent in recent decades. A notable new lake growth has been observed in the Gurudongmar Lake complex behind Feeder Lake 1 during this period (Figure 9F,G). While mass movements into lakes are a primary cause of GLOFs, they do not always result in the breaching of the lake [54,55].
In Sikkim, as climate change progresses, it poses substantial risks to slope stability and the integrity of natural dams. For instance, the recent GLOF event at South Lhonak Lake in Sikkim saw a section of the dam slide into the lake, causing a large volume of water to overtop the dam. Specifically, the active layer of permafrost is undergoing changes, which is leading to an increase in shallow slope movements [49,50]. Near Gurudongmar Lake, the transition from permafrost solifluction conditions to thawing and soil formation, which is constantly influenced by aeolian processes, has led to the development of loose, silty sands with low cohesion (Figure 9), making the material unstable. Additionally, deeper permafrost warming is likely to trigger more severe bedrock failures [51]. The steep slopes surrounding the Gurudongmar Lake complex (Figure 10) also raise concerns about potential bedrock failures in the lake, which could cause overtopping or a breach of the dam. As glaciers retreat, they expose highly weathered bedrock that has endured long periods of cold and is now exposed to sunlight and precipitation. This condition accelerates the chemical weathering of the rock, reducing its shear strength and destabilising the steep slopes. In the event of such mass movements, the downstream areas of Gurudongmar Lake, including military establishments and other settlements, could face considerable risks.
The steep bedrock and glacier slope near Gurudongmar Lake, coupled with the presence of unstable debris moraine, are likely to contribute to the overtopping or breach of the supraglacial debris dam (in front of the feeder lake) and moraine dam (in front of the main lake) (Figure 10). Two potential scenarios have been identified that could trigger a chain reaction, ultimately resulting in a catastrophic GLOF. In Scenario 1, the failure of the steep bedrock slope could initiate a rock avalanche, which in turn may trigger an ice avalanche. This combined rock–ice avalanche would likely deposit a significant mass into the feeder lake, potentially causing overtopping or failure of the supraglacial debris dam (Figure 10). The subsequent flow of water and debris into the main lake could lead to overtopping or breach of the frontal moraine dam AB. In Scenario 2, a shallow debris slope failure into the feeder lake may initiate a similar chain of events as described in Scenario 1. Both scenarios pose a credible risk under current conditions, and proper modelling and analysis are required to anticipate these events and to reduce the downstream risk.

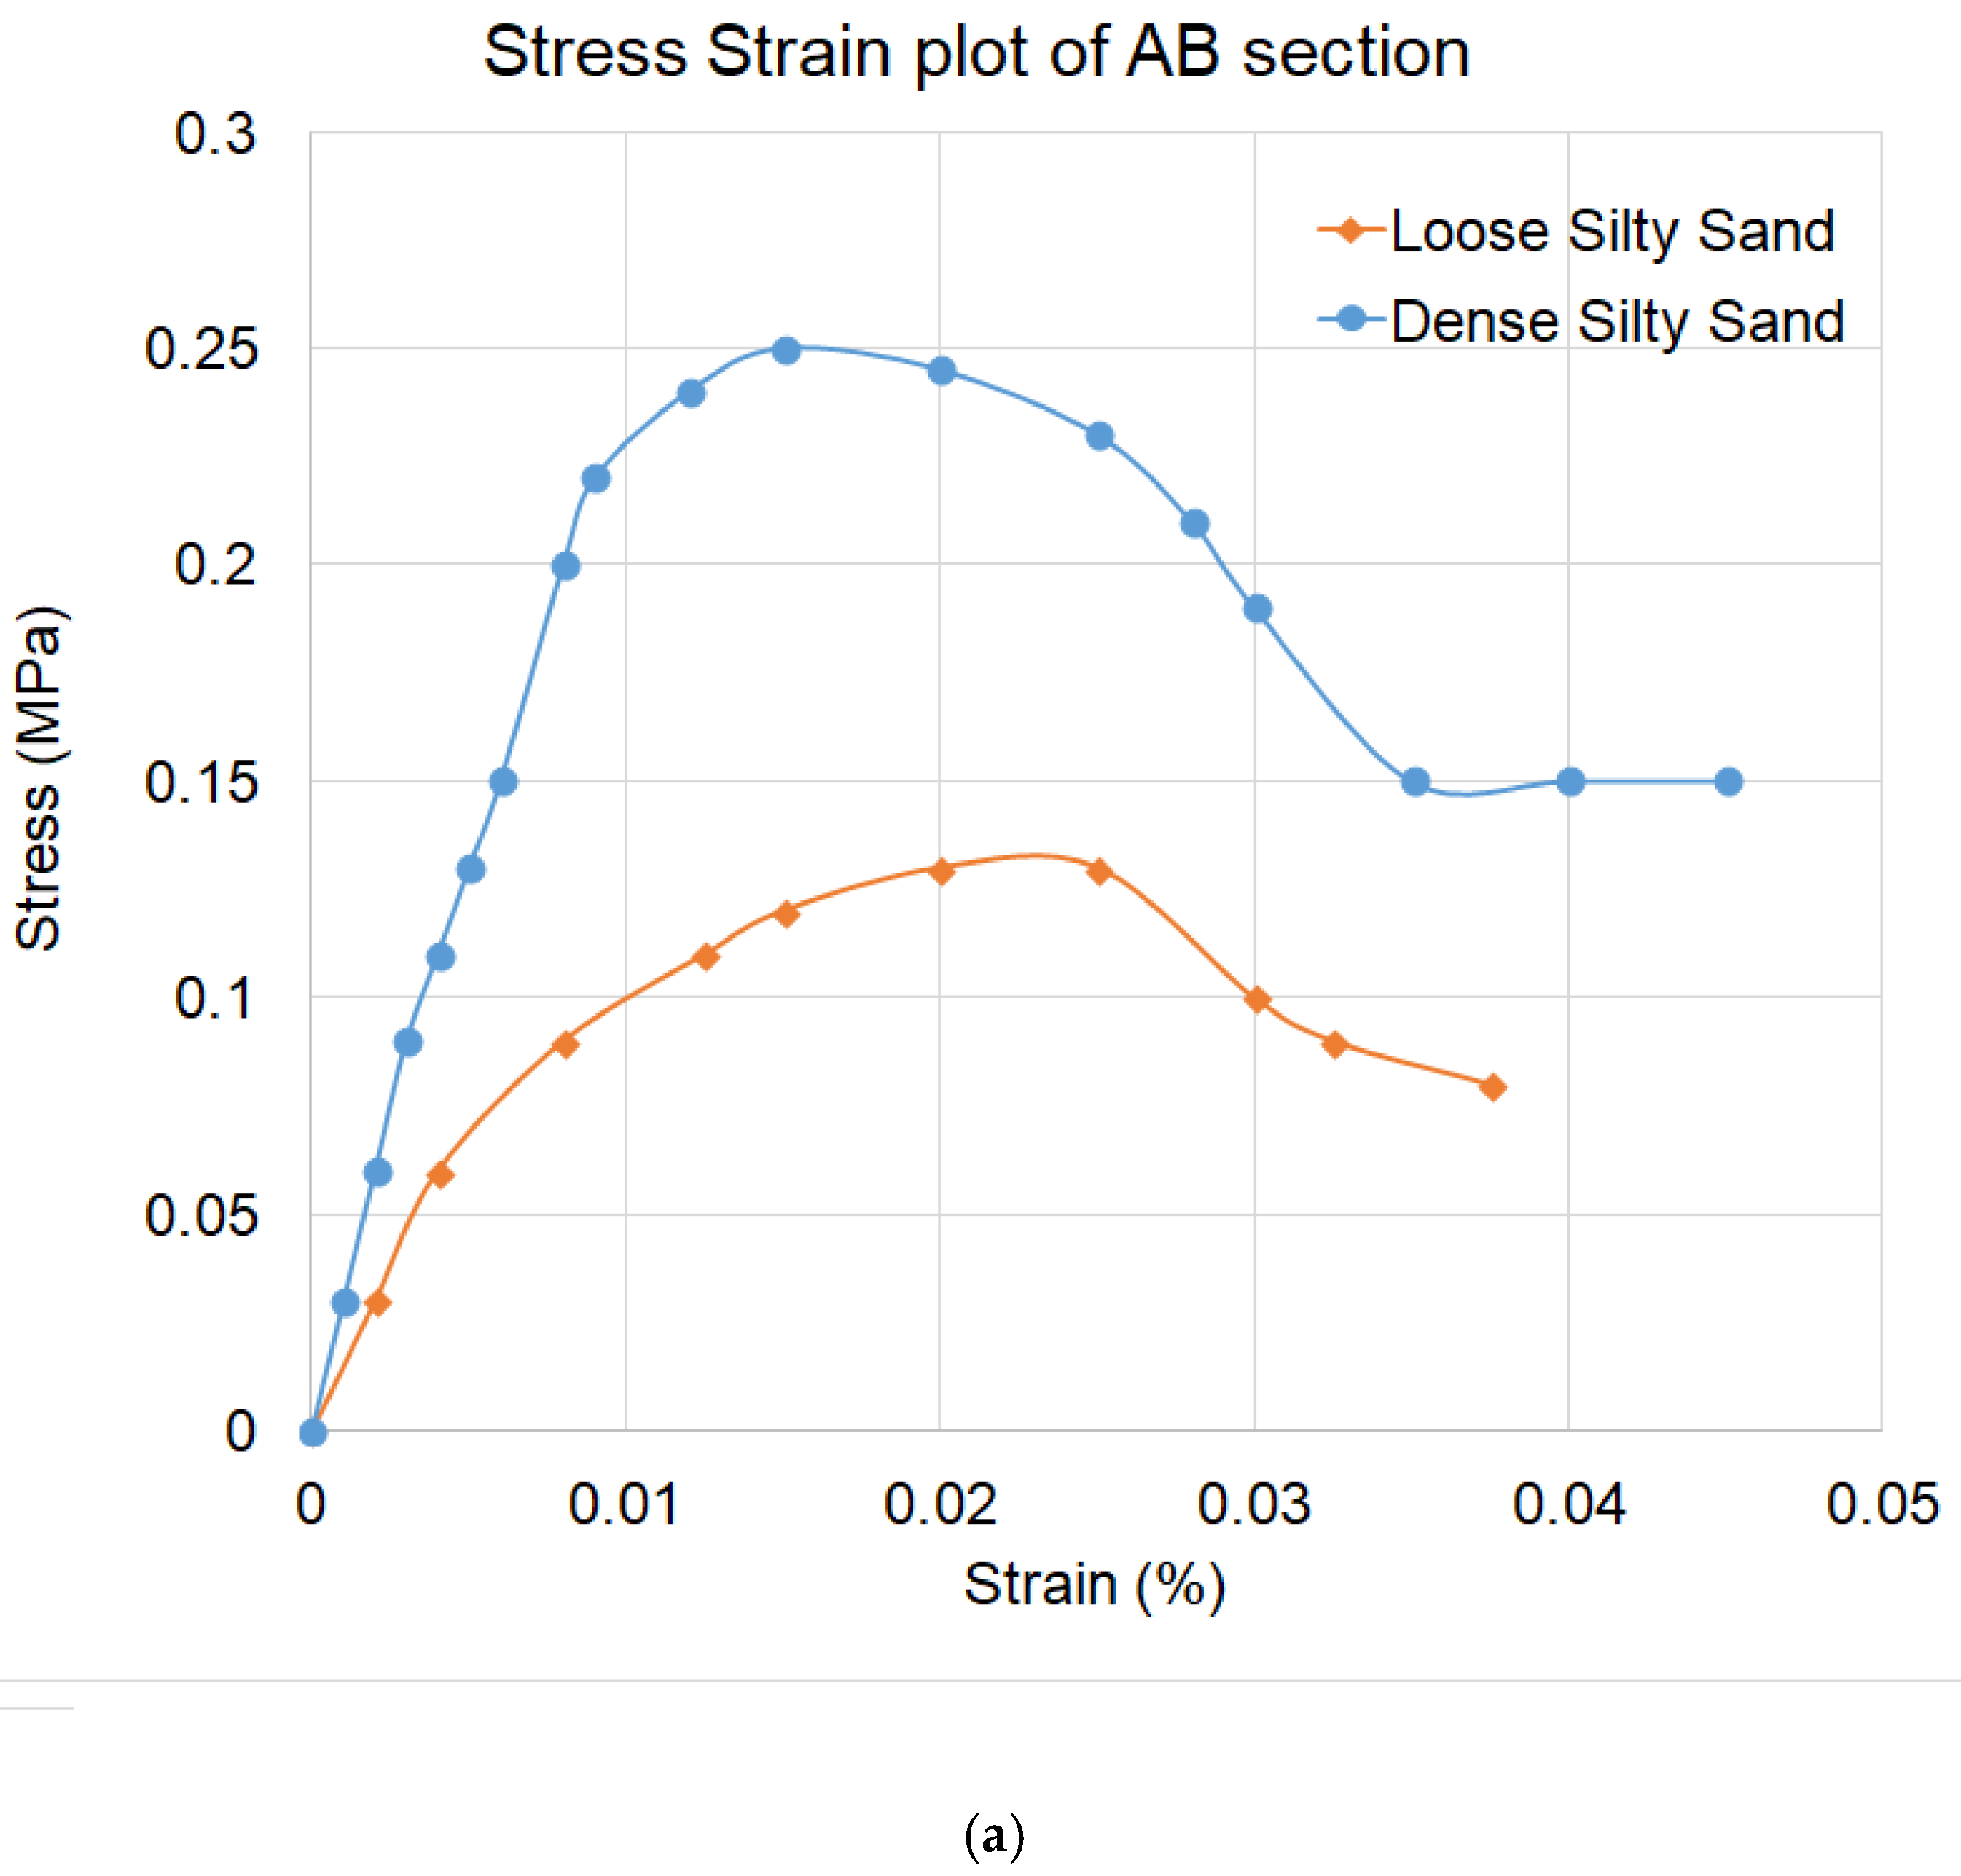
5.4. Numerical Stability Analysis of AB Cross-Section Under Permafrost Thawing

Under a permafrost condition, the water present in the pores or voids is frozen, which helps to keep the materials intact and improves stability as seepage is not allowed through the body of the natural dam. Under permafrost thawing, the water present in the voids under a frozen condition is melted, which loosens the material and allows the water to seep through the body. This future condition is simulated in the numerical modelling and analysis to assess the stability of the natural dam and the potential danger of a glacial lake outburst flood.
Considering the same scenario, in time to come, the water present in the voids of the embankments and permafrost surrounding Gurudongmar Lake will melt due to a rise in temperature under changing climate conditions. Moreover, the scenario will be aggravated if there is a sudden release of water from the feeder lake due to any mass movement. The melting of permafrost and an increase in the depth of the active layer would contribute to the build-up of pore pressure inside the dam. Under these conditions, the stability of the AB section existing on the downstream side of the lake will be more critical. The numerical analysis of the stability of the AB dam cross-section is performed considering the scenario where there is a 10 m rise in the water table going up to the crest of the dam and the pore pressure builds up due to permafrost melting. Figure 11 shows the steps involved and the output obtained from the numerical analysis.
From the results of the numerical analysis, it is anticipated that the stability of the downstream of the AB natural dam section will be compromised if there is a sudden rise in the water level in the lake or due to permafrost melting under steady seepage conditions.

6. Conclusions

Some of the important findings of the study are as follows:
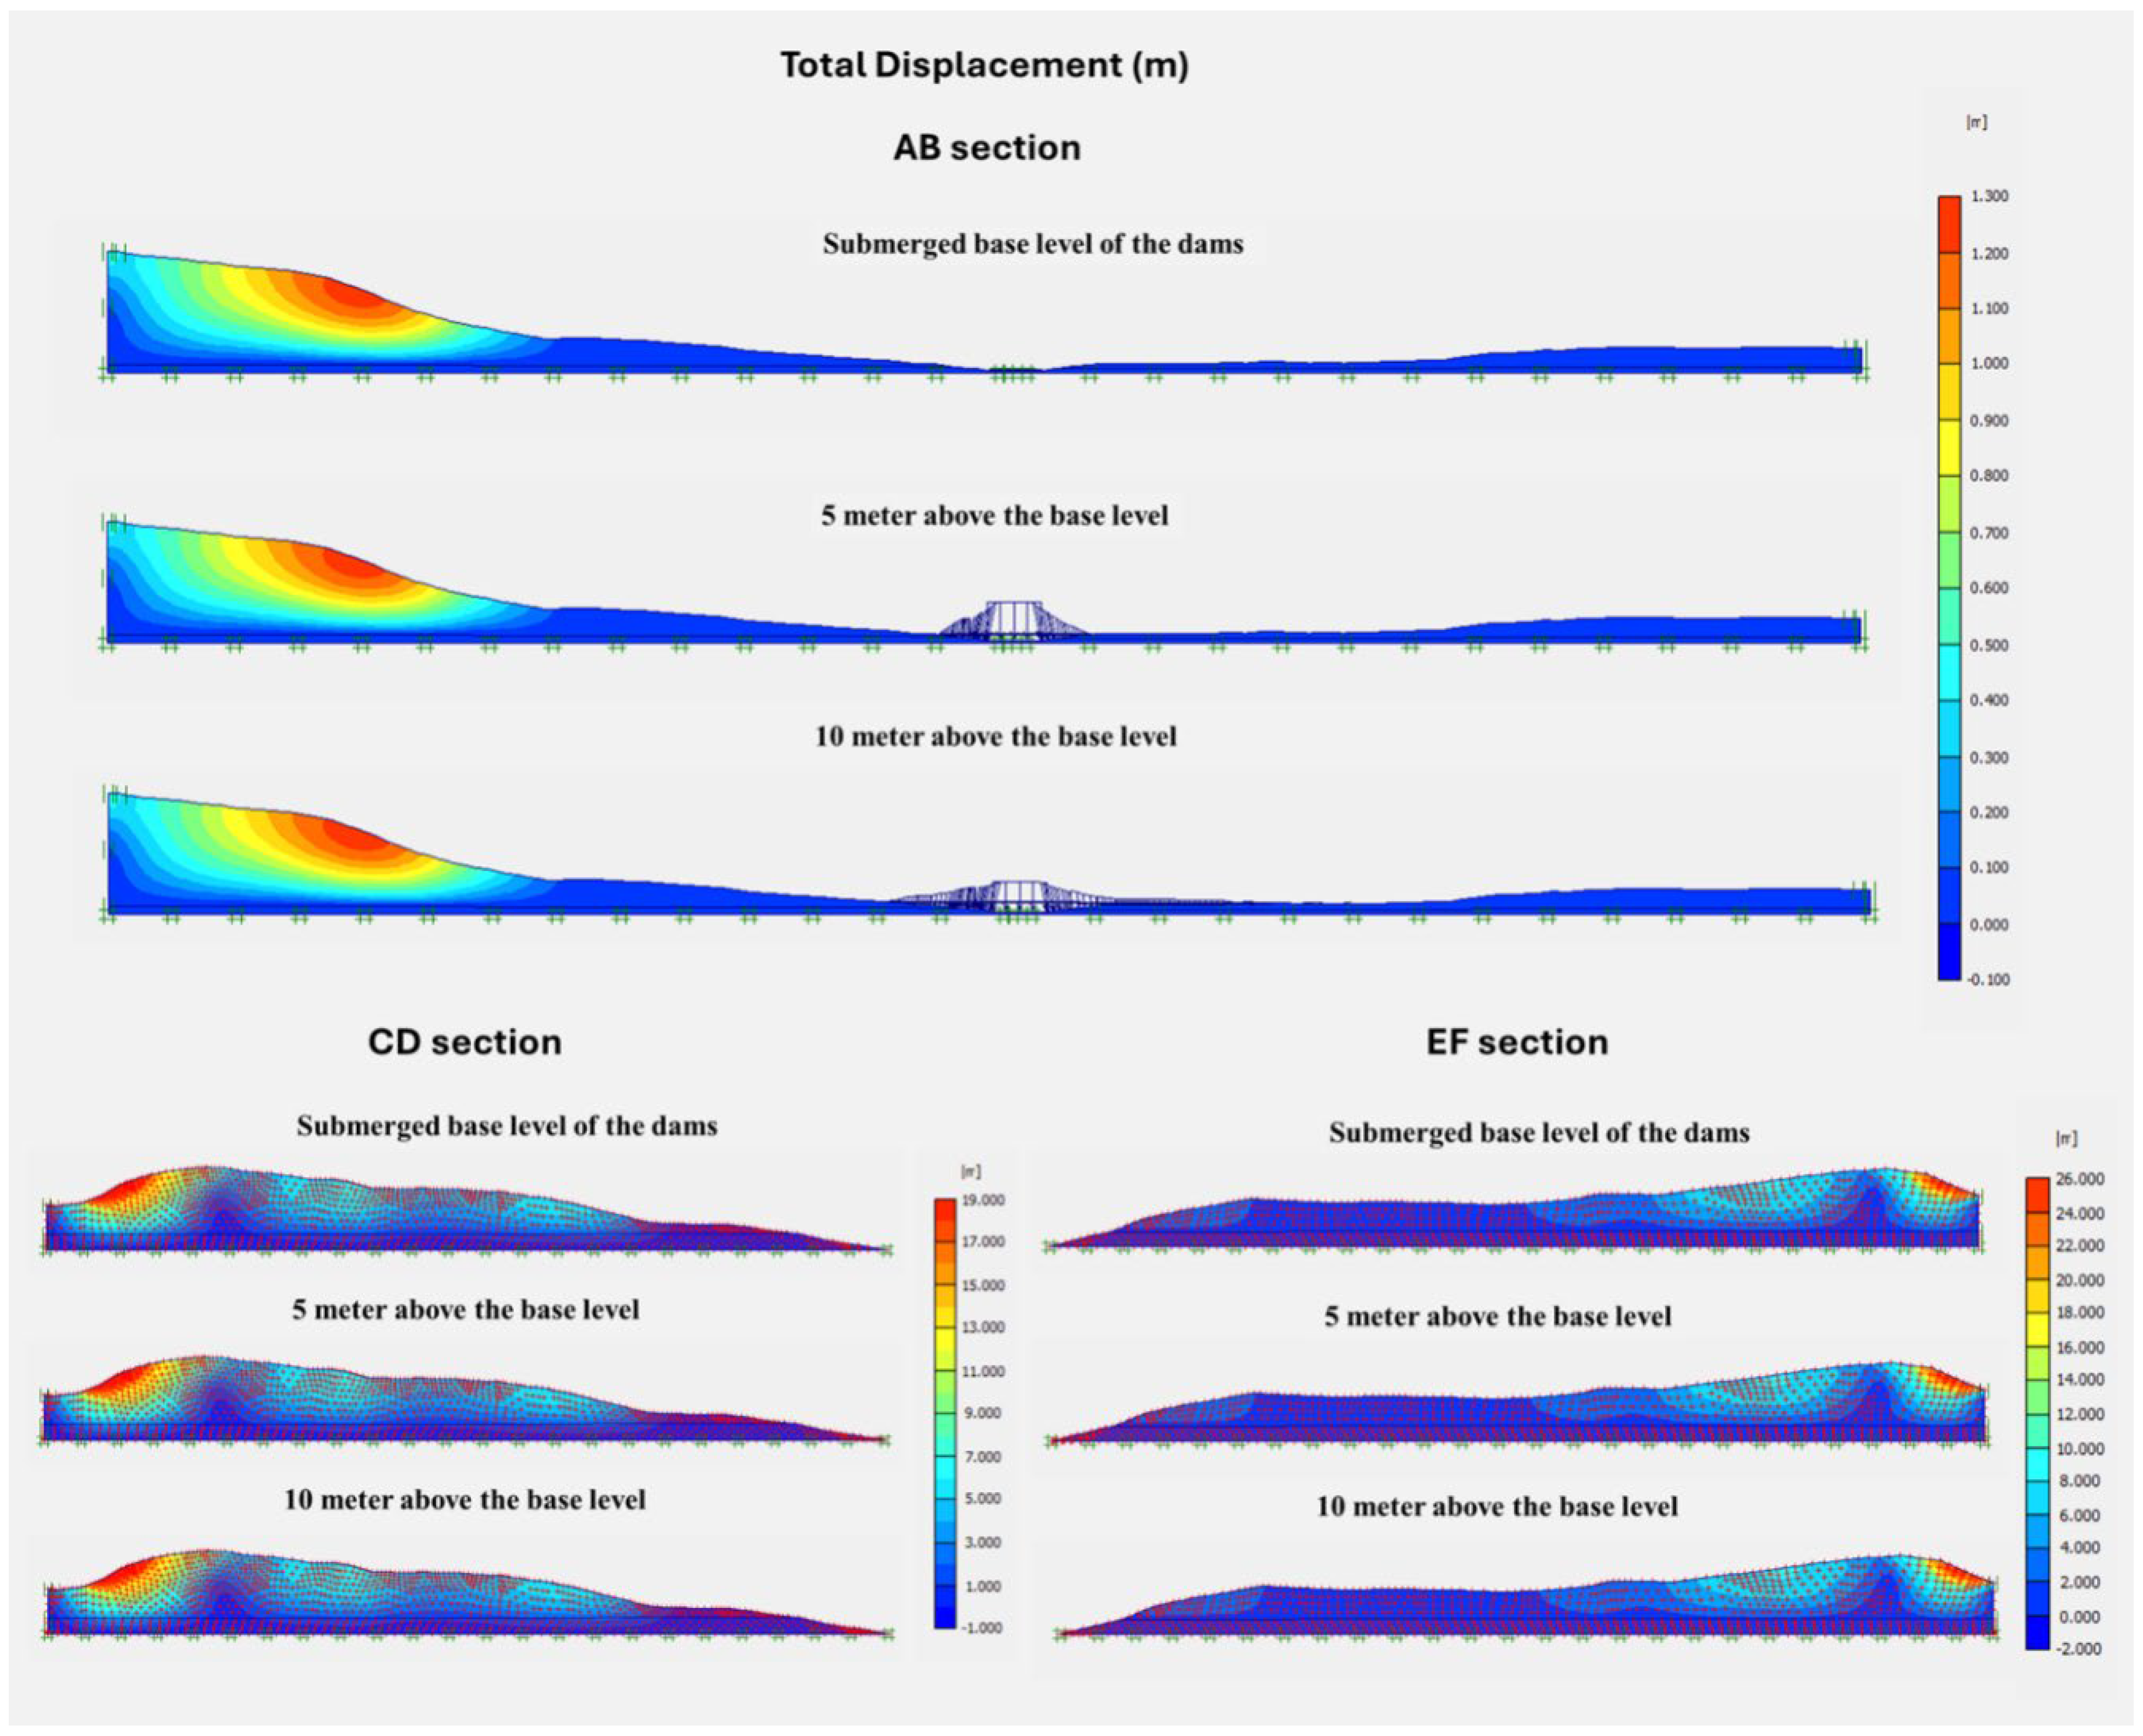
  • The findings from the finite element analysis emphasise the need to evaluate the structural responses of moraine sediment dams to changing water levels. The study reveals that, in the absence of permafrost thawing effects, the AB dam currently exhibits lower displacement values, indicating a strong design that can withstand significant water level fluctuations. In contrast, dams CD and EF may necessitate additional stability enhancements to ensure their performance under similar conditions.
  • The upstream slope of the CD and EF dam sections exhibits significant deformation, signalling a potential failure that could result in debris collapsing into the lake. This collapse may elevate the water table, leading to an overflow scenario for the AB section, ultimately threatening its stability and increasing the risk of downstream flooding.
  • The stability of the AB section of the downstream natural dam surrounding Gurudongmar Lake faces significant risks from a potential 10-metre rise in water levels and increased pore pressure resulting from permafrost melting. This situation underscores the urgent need for monitoring and risk mitigation strategies in light of climate change. As temperatures rise and permafrost thaws, future conditions could further compromise the stability of the downstream slope of the AB dam. Under steady-state seepage conditions, the factor of safety is likely to decrease, heightening the risk of structural failure.
  • To enhance safety and reduce risks associated with glacial lake outburst floods, it is recommended to install an early warning system and restrict tourism activities on the downstream side of the AB section. Additionally, implementing geotechnical measures to improve the stability of the downstream slope of the AB section will be crucial for future protection.

Author Contributions

Conceptualization, writing & review A.K.M.; Software, A.S.; Resources, R.K.R. and N.W.; Writing—review & editing, K.D. and S.S. All authors have read and agreed to the published version of the manuscript.

Funding

This research was funded by Department of Science & Technology, grant number DST/CCP/CoE/186/2019(G), dated: 3 March 2019.

Institutional Review Board Statement

Not applicable.

Informed Consent Statement

Not applicable.

Data Availability Statement

The original contributions presented in the study are included in the article, further inquiries can be directed to the corresponding author.

Acknowledgments

The authors thank and acknowledge the Climate Change Programme, Department of Science and Technology (DST), Government of India, for financially supporting (DST/CCP/CoE/186/2019(G), dated: 3 March 2019) the establishment of “DST’s Centre of Excellence on Water Resources, Cryosphere and Climate Change Studies” at the Department of Geology, Sikkim University (PI—Anil Kumar Misra). This research is part of the above-mentioned research project.

Conflicts of Interest

The authors declare no conflict of interest.

References

  1. Thompson, L.G. Past, present, and future of glacier archives from the world’s highest mountains. Proc. Am. Philos. Soc. 2017, 161, 226–243. [Google Scholar]
  2. Kaser, G.; Großhauser, M.; Marzeion, B. Contribution potential of glaciers to water availability in different climate regimes. Proc. Natl. Acad. Sci. USA 2010, 107, 20223–20227. [Google Scholar] [CrossRef] [PubMed]
  3. Bolch, T.; Kulkarni, A.; Kääb, A.; Huggel, C.; Paul, F.; Cogley, J.G.; Frey, H.; Kargel, J.S.; Fujita, K.; Scheel, M.; et al. The state and fate of Himalayan glaciers. Science 2012, 336, 310–314. [Google Scholar] [CrossRef]
  4. Emmer, A.; Vilímek, V. Review Article: Lake and breach hazard assessment for moraine-dammed lakes: An example from the Cordillera Blanca (Peru). Nat. Hazards Earth Syst. Sci. 2013, 13, 1551–1565. [Google Scholar] [CrossRef]
  5. Emmer, A.; Vilímek, V.; Klimeš, J. Glacial lake outburst floods (GLOFs) database project. In Landslide Science for a Safer Geoenvironment; The International Programme on Landslides (IPL); Springer International Publishing: Berlin/Heidelberg, Germany, 2014; Volume 1, pp. 107–111. [Google Scholar]
  6. Lliboutry, L.; Arnao, B.M.; Schneider, B. Glaciological problems set by the control of dangerous lakes in Cordillera Blanca, Peru. III. Study of moraines and mass balances at Safuna. J. Glaciol. 1977, 18, 275–290. [Google Scholar] [CrossRef]
  7. Dubey, S.; Goyal, M.K. Glacial Lake Outburst Flood Hazard, Downstream Impact, and Risk Over the Indian Himalayas. Water Resour. Res. 2020, 56, e2019WR026533. [Google Scholar] [CrossRef]
  8. Sattar, A.; Haritashya, U.K.; Kargel, J.S.; Karki, A. Transition of a small Himalayan glacier lake outburst flood to a giant transborder flood and debris flow. Sci. Rep. 2022, 12, 12421. [Google Scholar] [CrossRef]
  9. Richardson, S.D.; Reynolds, J.M. An overview of glacial hazards in the Himalayas. Quat. Int. 2000, 65–66, 31–47. [Google Scholar] [CrossRef]
  10. Veh, G.; Korup, O.; von Specht, S.; Roessner, S.; Walz, A. Unchanged frequency of moraine-dammed glacial lake outburst floodsin the Himalaya. Nat. Clim. Change 2019, 9, 379–383. [Google Scholar] [CrossRef]
  11. Worni, R.; Huggel, C.; Clague, J.J.; Schaub, Y.; Stoffel, M. Coupling glacial lake impact, dambreach, and flood processes: A modeling perspective. Geomorphology 2014, 224, 161–176. [Google Scholar] [CrossRef]
  12. Maskey, S.; Kayastha, R.B.; Kayastha, R. Glacial lakes outburst floods (GLOFs) modelling of Thulagi and lower Barun glacial lakes of Nepalese Himalaya. Prog. Disaster Sci. 2020, 7, 100106. [Google Scholar] [CrossRef]
  13. Vilca, O.; Mergili, M.; Emmer, A.; Frey, H.; Huggel, C. The 2020 glacial lake outburst flood process chain at Lake Salkantaycocha (Cordillera Vilcabamba, Peru). Landslides 2021, 18, 2211–2223. [Google Scholar] [CrossRef]
  14. Vuichard, D.; Zimmermann, M. The 1985 catastrophic drainage of a moraine-dammed lake, Khumbu Himal, Nepal: Cause and consequences. Mt. Res. Dev. 1987, 7, 91–110. [Google Scholar] [CrossRef]
  15. Linsbauer, A.; Frey, H.; Haeberli, W.; Machguth, H.; Azam, M.F.; Allen, S. Modelling glacier-bed overdeepenings and possible future lakes for the glaciers in the Himalaya—Karakoram region. Ann. Glaciol. 2016, 57, 119–130. [Google Scholar] [CrossRef]
  16. Taylor, C.; Robinson, T.R.; Dunning, S.; Rachel Carr, J.; Westoby, M. Glacial lake outburst floods threaten millions globally. Nat. Commun. 2023, 14, 487. [Google Scholar] [CrossRef]
  17. Haritashya, U.K.; Kargel, J.S.; Shugar, D.H.; Leonard, G.J.; Strattman, K.; Watson, C.S.; Shean, D.; Harrison, S.; Mandli, K.T.; Regmi, D. Evolution and Controls of Large Glacial Lakes in the Nepal Himalaya. Remote Sens. 2018, 10, 798. [Google Scholar] [CrossRef]
  18. Harrison, S.; Kargel, J.S.; Huggel, C.; Reynolds, J.; Shugar, D.H.; Betts, R.A.; Emmer, A.; Glasser, N.; Haritashya, U.K.; Klimeš, J.; et al. Climate change and the global pattern of moraine-dammed glacial lake outburst floods. Cryosphere 2018, 12, 1195–1209. [Google Scholar] [CrossRef]
  19. Zheng, G.; Allen, S.K.; Bao, A.; Ballesteros-Cánovas, J.A.; Huss, M.; Zhang, G.; Li, J.; Yuan, Y.; Jiang, L.; Yu, T.; et al. Increasing risk of glacial lake outburst floods from future Third Pole deglaciation. Nat. Clim. Change 2021, 11, 411–417. [Google Scholar] [CrossRef]
  20. King, O.; Dehecq, A.; Quincey, D.; Carrivick, J. Contrasting geometric and dynamic evolution of lake and land-terminating glaciers in the central Himalaya. Glob. Planet. Change 2018, 167, 46–60. [Google Scholar] [CrossRef]
  21. Yu, Y.; Li, B.; Li, Y.; Jiang, W. Retrospective Analysis of Glacial Lake Outburst Flood (GLOF) Using AI Earth InSAR and Optical Images: A Case Study of South Lhonak Lake, Sikkim. Remote Sens. 2024, 16, 2307. [Google Scholar] [CrossRef]
  22. Rivas, D.S.; Somos-Valenzuela, M.A.; Hodges, B.R.; McKinney, D.C. Predicting outflow induced by moraine failure in glacial lakes: The Lake Palcacocha case from an uncertainty perspective. Nat. Hazards Earth Syst. Sci. 2015, 15, 1163–1179. [Google Scholar] [CrossRef]
  23. Kalvoda, J.; Rosenfeld, C.L. (Eds.) Geomorphological Hazards in High Mountain Areas; Springer Science Business Media: Berlin/Heidelberg, Germany, 2012; Volume 46. [Google Scholar]
  24. Wang, L.Y.; Chen, W.Z.; Tan, X.Y.; Tan, X.J.; Yuan, J.Q.; Liu, Q. Evaluation of mountain slope stability considering the impact of geological interfaces using discrete fractures model. J. Mater. Sci. 2019, 16, 2184–2202. [Google Scholar] [CrossRef]
  25. Kundu, J.; Sarkar, K.; Verma, A.K.; Singh, T.N. Novel methods for quantitative analysis of kinematic stability and slope mass rating in jointed rock slopes with the aid of a new computer application. Bull Eng Geol Environ. 2022, 81, 29. [Google Scholar] [CrossRef]
  26. Haq, M.A.; Baral, P. Study of permafrost distribution in Sikkim Himalayas using Sentinel-2 satellite images and logistic regression modelling. Geomorphology 2019, 333, 123–136. [Google Scholar] [CrossRef]
  27. Aggarwal, S.; Rai, S.C.; Thakur, P.K.; Emmer, A. Inventory and recently increasing GLOF susceptibility of glacial lakes in Sikkim, Eastern Himalaya. Geomorphology 2017, 295, 39–54. [Google Scholar] [CrossRef]
  28. Govindha Raj, B.K.; Kumar, V.K.; SN, R. Remote sensing based inventory of glacial lakes in Sikkim Himalaya: Semi-automated approach using satellite data. Geomat. Nat. Hazards Risk 2013, 4, 241–253. [Google Scholar] [CrossRef]
  29. Yin, A. Cenozoic tectonic evolution of the Himalayan orogen as constrained by along-strike variation of structural geometry, exhumation history, and foreland sedimentation. Earth-Sci. Rev. 2006, 76, 1–131. [Google Scholar] [CrossRef]
  30. Carosi, R.; Montomoli, C.; Iaccarino, S.; Visonà, D. Structural evolution, metamorphism and melting in the Greater Himalayan Sequence in central-western Nepal. Geol. Soc. Lond. Spec. Publ. 2019, 483, 305–323. [Google Scholar] [CrossRef]
  31. Carosi, R.; MontoMoli, C.; Batto, D.; Visona, D. Leucogranite intruding the South Tibetan Detachment in Western Nepal; implications for exhumation models in the Himalayas. Terra Nova 2013, 25, 478–489. [Google Scholar] [CrossRef]
  32. Kellett, D.; Grujic, D.; Mot-Tram, C.; Mukul, M.; Larson, K.P. Virtual field guide for the Darjeeling-Sik-kim Himalaya India. Geological field trips in the Himalaya Kar-akoram and Tibet. J. Virtual Explor. 2014, 47, 1441–8142. [Google Scholar] [CrossRef]
  33. Chowdhury, A.; Sharma, M.C.; De, S.K.; Debnath, M. Glacier changes in the Chhombo Chhu Watershed of the Tista basin between 1975 and 2018, the Sikkim Himalaya, India. Earth Syst. Sci. Data 2021, 13, 2923–2944. [Google Scholar] [CrossRef]
  34. IS 1498:1970; (Reaffirmed 2021) Classification and Identification of Soils for General Engineering Purposes. Bureau of Indian Standards: New Delhi, India, 1970.
  35. IS 2720; (Part 4): 1985 (Reaffirmed 2020) Methods of Test for Soils: Part 4—Grain Size Analysis. Bureau of Indian Standards: New Delhi, India, 1985.
  36. IS 2720; (Part 17): 1986 (Reaffirmed 2021) Methods of Test for Soils: Part 17—Laboratory Determination of Permeability. Bureau of Indian Standards: New Delhi, India, 1986.
  37. IS 2720; (Part 10): 1991 (Reaffirmed 2020) Methods of Test for Soils: Part 10—Determination of Unconfined Compressive Strength. Bureau of Indian Standards: New Delhi, India, 1991.
  38. Matsui, T.; San, K.-C. Finite element slope stability analysis by shear strength reduction technique. Soils Found. 1992, 32, 59–70. [Google Scholar] [CrossRef]
  39. Huntington, J.L.; Hegewisch, K.C.; Daudert, B.; Morton, C.G.; Abatzoglou, J.T.; McEvoy, D.J.; Erickson, T. Climate engine: Cloud computing and visualization of climate and remote sensing data for advanced natural resource monitoring and process understanding. Bull. Am. Meteorol. Soc. 2017, 98, 2397–2410. [Google Scholar] [CrossRef]
  40. Bolton, M. The strength and dilatancy of sands. Géotechnique 1986, 36, 65–78. [Google Scholar] [CrossRef]
  41. IPCC. A special report of working groups I and II of the intergovernmental panel on climate change. In Managing the Risks of Extreme Events and Disasters to Advance Climate Change Adaptation; Field, C.B., Barros, V., Stocker, T.F., Qin, D., Dokken, D.J., Ebi, K.L., Midgley, P.M., Eds.; Cambridge University Press: Cambridge, UK, 2012. [Google Scholar] [CrossRef]
  42. Huss, M.; Bookhagen, B.; Huggel, C.; Jacobsen, D.; Bradley, R.S.; Clague, J.J.; Vuille, M.; Buytaert, W.; Cayan, D.R.; Greenwood, G.; et al. Toward mountains without permanent snow and ice. Earth’s Future 2017, 5, 418–435. [Google Scholar] [CrossRef]
  43. Knight, J.; Harrison, S. Mountain glacial and paraglacial environments under global climate change: Lessons from the past, future directions and policy implications. Geogr. Ann. Ser. A Phys. Geogr. 2014, 96, 245–264. [Google Scholar] [CrossRef]
  44. Korup, O.; Tweed, F. Ice, moraine, and landslide dams in mountainous terrain. Quat. Sci. Rev. 2007, 26, 3406–3422. [Google Scholar] [CrossRef]
  45. Jin, H.; Li, S.; Cheng, G.; Wang, S.; Li, X. Permafrost and climatic change in China. Glob. Planet. Change 2000, 26, 387–404. [Google Scholar] [CrossRef]
  46. Fukui, K.; Fujii, Y.; Mikhailov, N.; Ostanin, O.; Iwahana, G. The lower limit of mountain permafrost in the Russian Altai Mountains. Permafr. Periglac. Process. 2007, 18, 129–136. [Google Scholar] [CrossRef]
  47. Bockheim, J.G. Global distribution of cryosols with mountain permafrost: An overview. Permafr. Periglac. Process. 2015, 26, 1–12. [Google Scholar] [CrossRef]
  48. Huggel, C.; Haeberli, W.; Kääb, A.; Bieri, D.; Richardson, S. An assessment procedure for glacial hazards in the Swiss Alps. Can. Geotech. J. 2004, 41, 1068–1083. [Google Scholar] [CrossRef]
  49. Daout, S.; Dini, B.; Haeberli, W.; Doin, M.P.; Parsons, B. Ice loss in the Northeastern Tibetan Plateau permafrost as seen by 16 yr of ESA SAR missions. Earth Planet. Sci. Lett. 2020, 545, 116404. [Google Scholar] [CrossRef]
  50. Dini, B.; Daout, S.; Manconi, A.; Loew, S. Classification of slope processes based on multitemporal DInSAR analyses in the Himalaya of NW Bhutan. Remote Sens. Environ. 2019, 233, 111408. [Google Scholar] [CrossRef]
  51. Shugar, D.H.; Jacquemart, M.; Shean, D.; Bhushan, S.; Upadhyay, K.; Sattar, A.; Schwanghart, W.; McBride, S.; Van Wyk de Vries, M.; Mergili, M.; et al. A massive rock and ice avalanche caused the 2021 disaster at Chamoli, Indian Himalaya. Science 2021, 373, 300–306. [Google Scholar] [CrossRef] [PubMed]
  52. Woolway, R.I.; Kraemer, B.M.; Lenters, J.D.; Merchant, C.J.; O’Reilly, C.M.; Sharma, S. Global lake responses to climate change. Nat. Rev. Earth Environ. 2020, 1, 388–403. [Google Scholar] [CrossRef]
  53. Furian, W.; Maussion, F.; Schneider, C. Projected 21st-century glacial lake evolution in High Mountain Asia. Front. Earth Sci. 2022, 10, 821798. [Google Scholar] [CrossRef]
  54. Dubey, S.; Sattar, A.; Goyal, M.K.; Allen, S.; Frey, H.; Haritashya, U.K.; Huggel, C. Mass movement hazard and exposure in the Himalaya. Earth’s Future 2023, 11, e2022EF003253. [Google Scholar] [CrossRef]
  55. Kargel, J.S.; Leonard, G.J.; Shugar, D.H.; Haritashya, U.K.; Bevington, A.; Fielding, E.J.; Fujita, K.; Geertsema, M.; Miles, E.S.; Steiner, J.; et al. Geomorphic and geologic controls of geohazards induced by Nepal’s 2015 Gorkha earthquake. Science 2016, 351, aac8353. [Google Scholar] [CrossRef]
  56. Sattar, A.; Allen, S.; Mergili, M.; Haeberli, W.; Frey, H.; Kulkarni, A.V.; Haritashya, U.K.; Huggel, C.; Goswami, A.; Ramsankaran, R. Modeling potential glacial lake outburst flood process chains and effects from artificial lake-level lowering at Gepang Gath lake, Indian Himalaya. J. Geophys. Res. Earth Surf. 2023, 128, e2022JF006826. [Google Scholar] [CrossRef]
Figure 1. Gurudongmar Lake location in the Sikkim state and its status from 1989 to 2021; the studied moraine sedimentary dams AB, CD, and EF.
Applsci 15 05892 g001
Figure 2. Lithological map of the study area modified after [32,33].
Applsci 15 05892 g002
Figure 3. Step-by-step procedure for the stability study of the Gurudongmar Glacial Lake complex.
Applsci 15 05892 g003
Figure 4. Step-by-step procedure for the numerical analysis.
Applsci 15 05892 g004
Figure 5. Stress–strain plots from the UCS test for the (a) AB section, (b) CD section, and (c) EF section.
Applsci 15 05892 g005aApplsci 15 05892 g005b
Figure 6. Total displacement in the AB, CD, and EF moraine sediment dams of Gurudongmar Lake for scenarios where the base level of the dam was submerged and where the water was 5 m and 10 m above the submerged base level.
Applsci 15 05892 g006
Figure 7. (Upper) Plot of daily minimum temperature and maximum temperature and (Lower) plot of daily precipitation (mm/day) for the period of January 1994 to June 2024.
Applsci 15 05892 g007
Figure 8. Plot of the (A) annual average of maximum daily temperature and trend, (B) annual average of minimum daily temperature, (C) yearly total precipitation, and (D) annual maximum daily precipitation for the period of 1994 to 2023.
Applsci 15 05892 g008
Figure 9. Gurudongmar Lake during winter (A) and summer (B); Solifluction of permafrost in the study area vicinity (C); Moraine dam section EF seen in the distance (D), photograph taken standing on section AB; Permafrost thaw and mass wasting at a lower elevation (E) and changes in the glacier status and permafrost in the Feeder Lake 1 vicinity (F,G).
Applsci 15 05892 g009
Figure 10. Elevation and slope of the Gurudongmar Lake area (ALOS-PALSAR DEM). Two possible scenarios: Scenario 1 of a rock and ice avalanche into the feeder lake (A and B) causing overtopping, affecting the stability of the supraglacial debris dam and frontal moraine dam (C and D), and Scenario 2 of a shallow debris slope failure into the feeder lake (A) leading to overtopping or failure of the supraglacial dam and moraine dam (C and D) (modified after Sattar et al., 2023 [56]).
Applsci 15 05892 g010
Figure 11. (A) Numerical model of the cross-section of the AB natural dam section. (B) Finite element mesh generated using 15-node triangular elements. (C) Phreatic line for the upstream water level up to the crest of the dam for analysis. (D) Seepage flow through the body of the natural dam AB section. (E) Ground Water Head under steady seepage through the body of the dam. (F) Displacement contour indicating large deformation of the downstream slope under the prevailing condition of a rise in water level in the lake and permafrost melting.
Applsci 15 05892 g011
Table 1. Material properties of moraine sediment dams at the AB, CD, and EF sections.
ParameterSymbolUnitSilty Sand (Loose)Silty Sand (Dense)
Material modelModel-M-CM-C
AB section
Total unit weightγunsatkN/m31719
Saturate unit weightγsatkN/m32022
Young’s modulusE MPa15,000 30,000
Friction angleϕ01018
CohesionckN/m265125
DilatancyψDegree-6
Poisson’s ratioν-0.380.32
Permeabilitykm/day0.00180.00096
CD section
Total unit weightγunsatkN/m31921
Saturate unit weightγsatkN/m32223
Young’s modulusEMPa814
Friction angleϕ01220
CohesionckN/m235 kPa105 kPa
DilatancyψDegree-8
Poisson’s ratioν-0.420.34
PermeabilityKm/day0.002360.000864
EF section
Total unit weightγunsatkN/m31620
Saturate unit weightγsatkN/m31922
Young’s modulusE MPa1028
Friction angleΦ01224
CohesionckN/m247.5 kPa115 kPa
DilatancyψDegree-8
Poisson’s ratioν-0.300.24
Permeabilitykm/day0.001380.00090
Table 2. Variations in the displacement, stress, and strain in AB, CD, and EF dams in three critical scenarios.
S. No.Parameters AnalysedSubmerged Base Level of the Dam5 m Above the Base Level10 m Above the Base Level
AB section
1Total displacement (m)1.251.251.25
2Volumetric strain (%)1.641.651.65
3Shear strain (%)2.092.092.12
4Deviatoric stress (kN/m2)586577.80567.10
CD section
1Total displacement (m)18.7218.7418.71
2Volumetric strain (%)9.359.369.35
3Shear strain (%)30.2530.3030.22
4Deviatoric stress (kN/m2)172117191699
EF section
1Total displacement (m)24.6724.6724.67
2Volumetric strain (%)6.886.886.88
3Shear strain (%)87.0687.0787.06
4Deviatoric stress kN/m2)217621772160
Table 3. Year-wise number of days with a mean temperature below 0 °C from 1994 to 2023.
YearTotal DaysNo. of Days Below 0 °CYearTotal DaysNo. of Days Below 0 °CYearTotal DaysNo. of Days Below 0 °C
199436531120043663202014365310
199536530520053653232015365327
199636631820063653212016366310
199736532720073653162017365314
199836528720083663052018365292
199936530120093653052019365305
200036631220103652972020366290
200136532220113653302021365295
200236532420123663142022365315
200336532420133653092023365295
Average 313.7Average314Average305.3
Table 4. Yearly statistics of total precipitation (mm), days with precipitation > 5 mm, average daily minimum temperature (°C), and average daily maximum temperature (°C).
YearTotal PPT (mm)Days with Precipitation > 5 mmDaily Avg. Minimum T (°C)Daily Avg. Maximum T (°C)
19941040.660−9.2−1.8
19951168.955−9.2−2.2
19961048.443−8.8−1.7
19971151.753−10.0−2.8
19981103.565−8.2−1.1
1999972.448−8.1−0.7
20001083.464−9.2−2.0
2001978.548−8.8−1.2
20021022.663−9.2−2.0
20031096.658−8.9−2.0
Average1066.6655.7−8.96−1.75
2004951.546−8.7−1.7
20051022.955−9.1−2.0
2006858.741−8.5−1.0
20071028.958−8.2−0.9
20081030.860−8.4−1.5
20091092.862−7.8−0.7
20101099.360−7.8−0.7
20111064.862−8.9−1.7
20121072.464−9.6−2.6
20131037.354−9.1−1.9
Average102556.2−8.61−1.47
20141152.556−9.0−1.9
20151014.066−9.2−2.1
20161032.662−7.6−0.4
20171011.652−8.1−1.0
20181089.063−8.2−1.4
20191081.161−8.7−2.1
20201322.586−7.7−1.0
20211283.485−6.9−0.3
20221130.268−7.4−0.3
20231157.369−7.4−0.5
Average112766.8−8.02−1.1
Disclaimer/Publisher’s Note: The statements, opinions and data contained in all publications are solely those of the individual author(s) and contributor(s) and not of MDPI and/or the editor(s). MDPI and/or the editor(s) disclaim responsibility for any injury to people or property resulting from any ideas, methods, instructions or products referred to in the content.

