Article

Soil Moisture Content Prediction Using Gradient Boosting Regressor (GBR) Model: Soil-Specific Modeling with Five Depths

Department of Biosystems Engineering and Precision Technology, Albert Kázmér Mosonmagyaróvár Faculty of Agricultural and Food Sciences, Széchenyi István University, 9200 Mosonmagyarovar, Hungary
*
Author to whom correspondence should be addressed.
Appl. Sci. 2025, 15(11), 5889; https://doi.org/10.3390/app15115889
Submission received: 5 March 2025 / Revised: 15 May 2025 / Accepted: 22 May 2025 / Published: 23 May 2025
(This article belongs to the Special Issue Emerging Technologies for Precision Agriculture)

Abstract

:
Monitoring soil moisture content (SMC) remains challenging due to its spatial and temporal variability. Accurate SMC prediction is essential for optimizing irrigation and enhancing water use efficiency. In this research, a Gradient Boosting Regressor (GBR) model was developed and validated to predict SMC in two soil textures, loam and silt loam, using meteorological data from Internet of Things (IoT) sensors and gravimetric SMC field measurements collected from five different depths. The statistical analysis revealed significant variation in SMC across depths in loam soil (p < 0.05), while silt loam exhibited more stable moisture distribution. The GBR model demonstrated high performance in both soil textures, achieving R2 values of 0.98 and 0.94 for silt loam and loam soils, respectively, with low prediction errors (RMSE 0.85 and 0.97, respectively). Feature importance analysis showed that precipitation and humidity were the most influential features in loam soil, while solar radiation had the highest impact on prediction in silt loam soil. Soil depth also showed a significant contribution to SMC prediction in both soils. These results highlight the necessity for soil-specific modeling to enhance SMC prediction accuracy, optimize irrigation systems, and support water resources management approaches aligning with SDG6 objectives.

1. Introduction

Soil moisture content (SMC) plays a crucial role in hydrological and ecological processes that affect energy, water, and carbon cycles, including evaporation [1], transpiration, diversity [2], and rainfall–runoff in various ecosystems [3]. Understanding the spatiotemporal patterns of SMC is essential for water resources management, mitigating the effects of agricultural drought [4], addressing water scarcity, and improving crop production [5,6]. Moreover, the collection of high-quality soil moisture data is significant for scientific research purposes, such as weather forecasting, flood prediction, drought monitoring [7,8], precision agriculture [9], and irrigation management [10].
As the demand for high-precision soil moisture data increases, there is a growing need to develop reliable in situ soil moisture sensor networks that balance cost, complexity, and low power consumption for effective soil moisture monitoring [11]. The advancement of sensing technologies, including Internet of Things (IoT), has enabled real-time data exchange between connected devices using a wireless sensor network, allowing for constant monitoring of various environmental parameters in real time [12]. Recent studies have demonstrated the applicability of IoT-based approaches in agriculture for environmental monitoring [13], controlling greenhouse gas emissions [14], irrigation optimization, weather monitoring, product traceability, and intelligent equipment management [15]. Notably, IoT sensors address the limitations of traditional soil moisture measurement techniques, which are often time consuming and lack real-time monitoring capabilities, by providing real-time, low-maintenance, and scalable solutions [16]. In addition to in situ measurements, remote sensing approaches utilizing satellite images have been widely used for SMC monitoring and predicting model development [17]. The integration of meteorological data and soil properties monitoring in SMC prediction provides a better understanding of its variability and the types of interactions between SMC and these parameters.
Accurate SMC prediction is important for enhancing irrigation management and optimizing crop production [18]. Traditional statistical methods often struggle to capture the complex, nonlinear, and multivariate interactions among soil, environmental, and meteorological factors that influence SMC [19]. In contrast, machine learning (ML) algorithms can handle these complexities and offer high potential for accurate SMC prediction [20,21]. ML models have the capability to utilize the high-resolution dataset provided by IoT-based sensors to enhance prediction accuracy of SMC. Among these, the Gradient Boosting Regressor (GBR) algorithm has demonstrated strong performance in SMC prediction due to its ability to combine multiple weak learners (typically decision trees) to iteratively minimize loss functions, thereby improving both accuracy and interpretability [22]. For instance, Zambudio et al. [23] utilized two years of data to train a GBR model and artificial neural network (ANN) to predict SMC in top surface layers. The results showed that the GBR model performed effectively in predicting SMC with a 0.01 learning rate, 5 max depth, and 350 estimators, achieving a mean square error (MSE) of 0.027 and a 20% difference in maximum between measured and predicted values. Similarly, Ren et al. [24] utilized XGBoost to predict soil moisture, highlighting its high performance in comparison with other models, with a correlation coefficient of 0.69 and an accuracy of 88%. The primary predictors were air relative humidity, maximum air temperature, and total precipitation. Consideration of soil characteristics, particularly during the 2022 drought, led to improved prediction accuracy.
However, existing research had a lack of soil texture-specific and depth-specific modeling, which considers significant factors regarding their strong impact on SMC. For instance, soils with higher silt and clay content generally exhibit higher water-holding capacity compared to sandy soils, which leads to higher SMC [25]. Additionally, soil depth has a crucial impact on SMC, as deeper layers often retain more moisture due to lower evaporation and higher water retention. Fu et al. [26] demonstrated this in their study utilizing the water balance equation, showing that predictive model performance varied with depth, achieving lower RMSE values at 100 cm and 200 cm compared to shallow depths.
In response to these developments, international frameworks such as the UN-Water 2023 Annual Report and the EU’s “Farm to Fork” strategy have emphasized the significance of adaptive modern water resource management approaches that align with Sustainable Development Goal 6 (SDG6): Water and Sanitation for All [27]. The integration of IoT and ML in precision crop production contributes to these goals by allowing for better resource management, enabling data-driven decision making [28].
This research developed and validated soil texture-specific Gradient Boosting Regressor (GBR) models to predict SMC in two distinct soil textures, loam and silt loam. These soils differ in their moisture retention characteristics, where the loam soil exhibits moderate water-holding capacity due to its balanced sand, silt, and clay proportions, while silt loam retains more moisture because of its finer texture and higher silt content [29]. High-resolution meteorological data were collected using calibrated IoT-based sensors for model training. The key objectives of this research are to evaluate GBR model performance using multiple evaluation metrics; to identify optimal model hyperparameters by performing 5-fold cross-validation and grid search; and to identify the most influential predictors of SMC in each soil texture utilizing feature importance analysis. These will allow for better understanding of soil moisture dynamics in each soil texture, as well as better optimization of irrigation schedules and enhanced water resource use efficiency, aligning with SDG6 goals for sustainable water management.

2. Materials and Methods

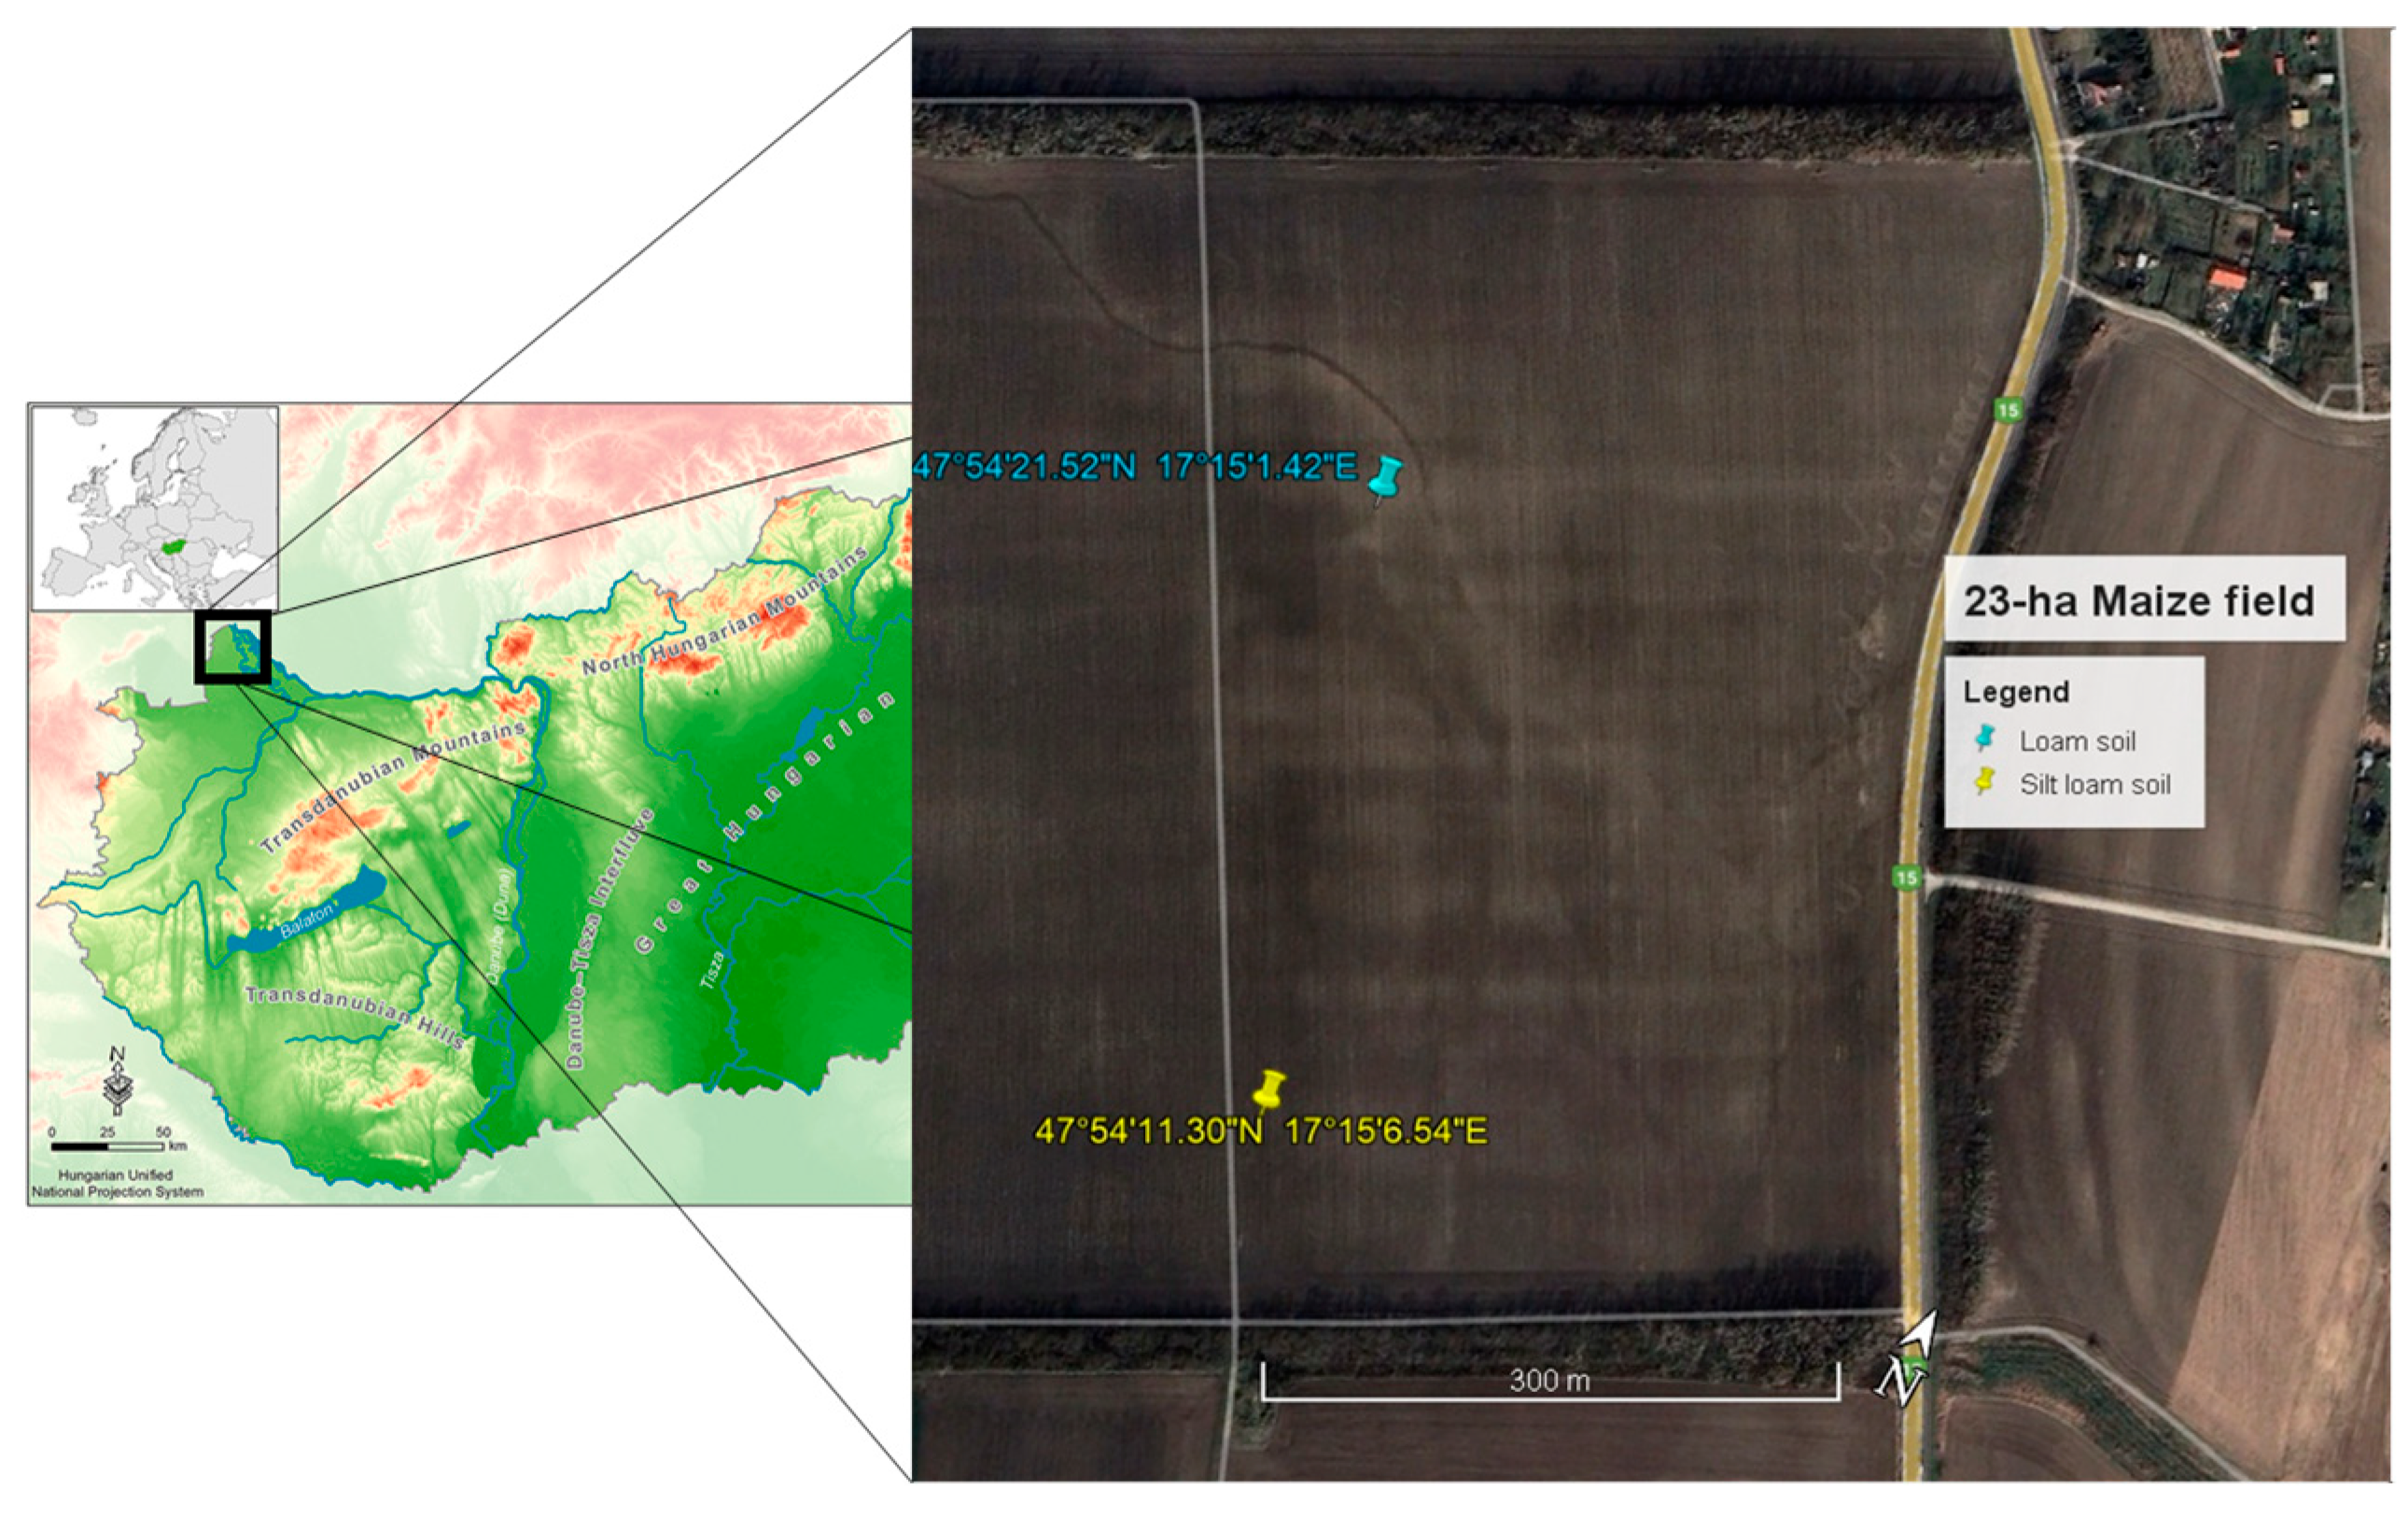
2.1. Experimental Site and Data Collection

This field experiment was conducted during the maize vegetation season at a 23-hectare field belonging to Széchenyi István University, located in Mosonmagyaróvár, Hungary. The site lies within the Little Hungarian Plain, an alluvial plain of the Leitha River, characterized by relatively flat topography with a slight slope of approximately 5% and elevation ranging from 133 to 138 m above sea level. This gradient allows for natural surface drainage while minimizing erosion risks. The region experiences a temperate climate with moderate precipitation, typical of Central Europe. During the study period, from May to October, total precipitation was approximately 400 mm, and the average air temperature ranged from 18.5 °C to 21.3 °C. Based on USDA soil classification taxonomy [30] and laboratory particle size distribution analysis using the soil texture triangle, three primary soil textures were identified in the field: loam, sandy loam, and silt loam (Figure 1). These soil textures represent more than 60% of the soils in this region [29]. The field is an alluvial plain of the Leitha River located within the little Hungarian plain and is characterized by relatively flat topography. The field has a slight slope of 5%, with elevation varying between 133 and 138 m above sea level. This slight gradient allows natural surface drainage while minimizing erosion risks. For this study, two soil textures—loam and silt loam—were selected for detailed analysis. Their specific physical and chemical properties are presented in Table 1. The field is managed under a cereal-based crop rotation system, which includes winter wheat, spring barley, maize, and soybeans.

2.2. Soil Sampling and Gravimetric Measurements

From the two selected soil textures, 300 soil samples were collected between June and October 2023 using a hand auger (Figure 2B). Sampling was conducted at five depths (5, 20, 40, 60, and 80 cm) from three sampling points near the sensor installations, following a random sampling grid approach. Soil samples were collected at 10 different dates spaced two weeks apart, resulting in a total of 150 samples from each soil texture.
Soil moisture content was calculated using the gravimetric method based on dry weight [31]. The samples from each depth and soil texture were placed in pre-weighed aluminum containers and dried in an oven at 105 °C until a consistent weight was achieved. The containers were then weighed again to calculate dry weight of the soil. The soil moisture content (θ) was calculated using the following Equation (1):
θ = M w M d × 100
where
θ = Soil Moisture Content (%);
Mw = Mass of water (g) = (Wet weight − Dry weight);
Md = Mass of dry soil (g).

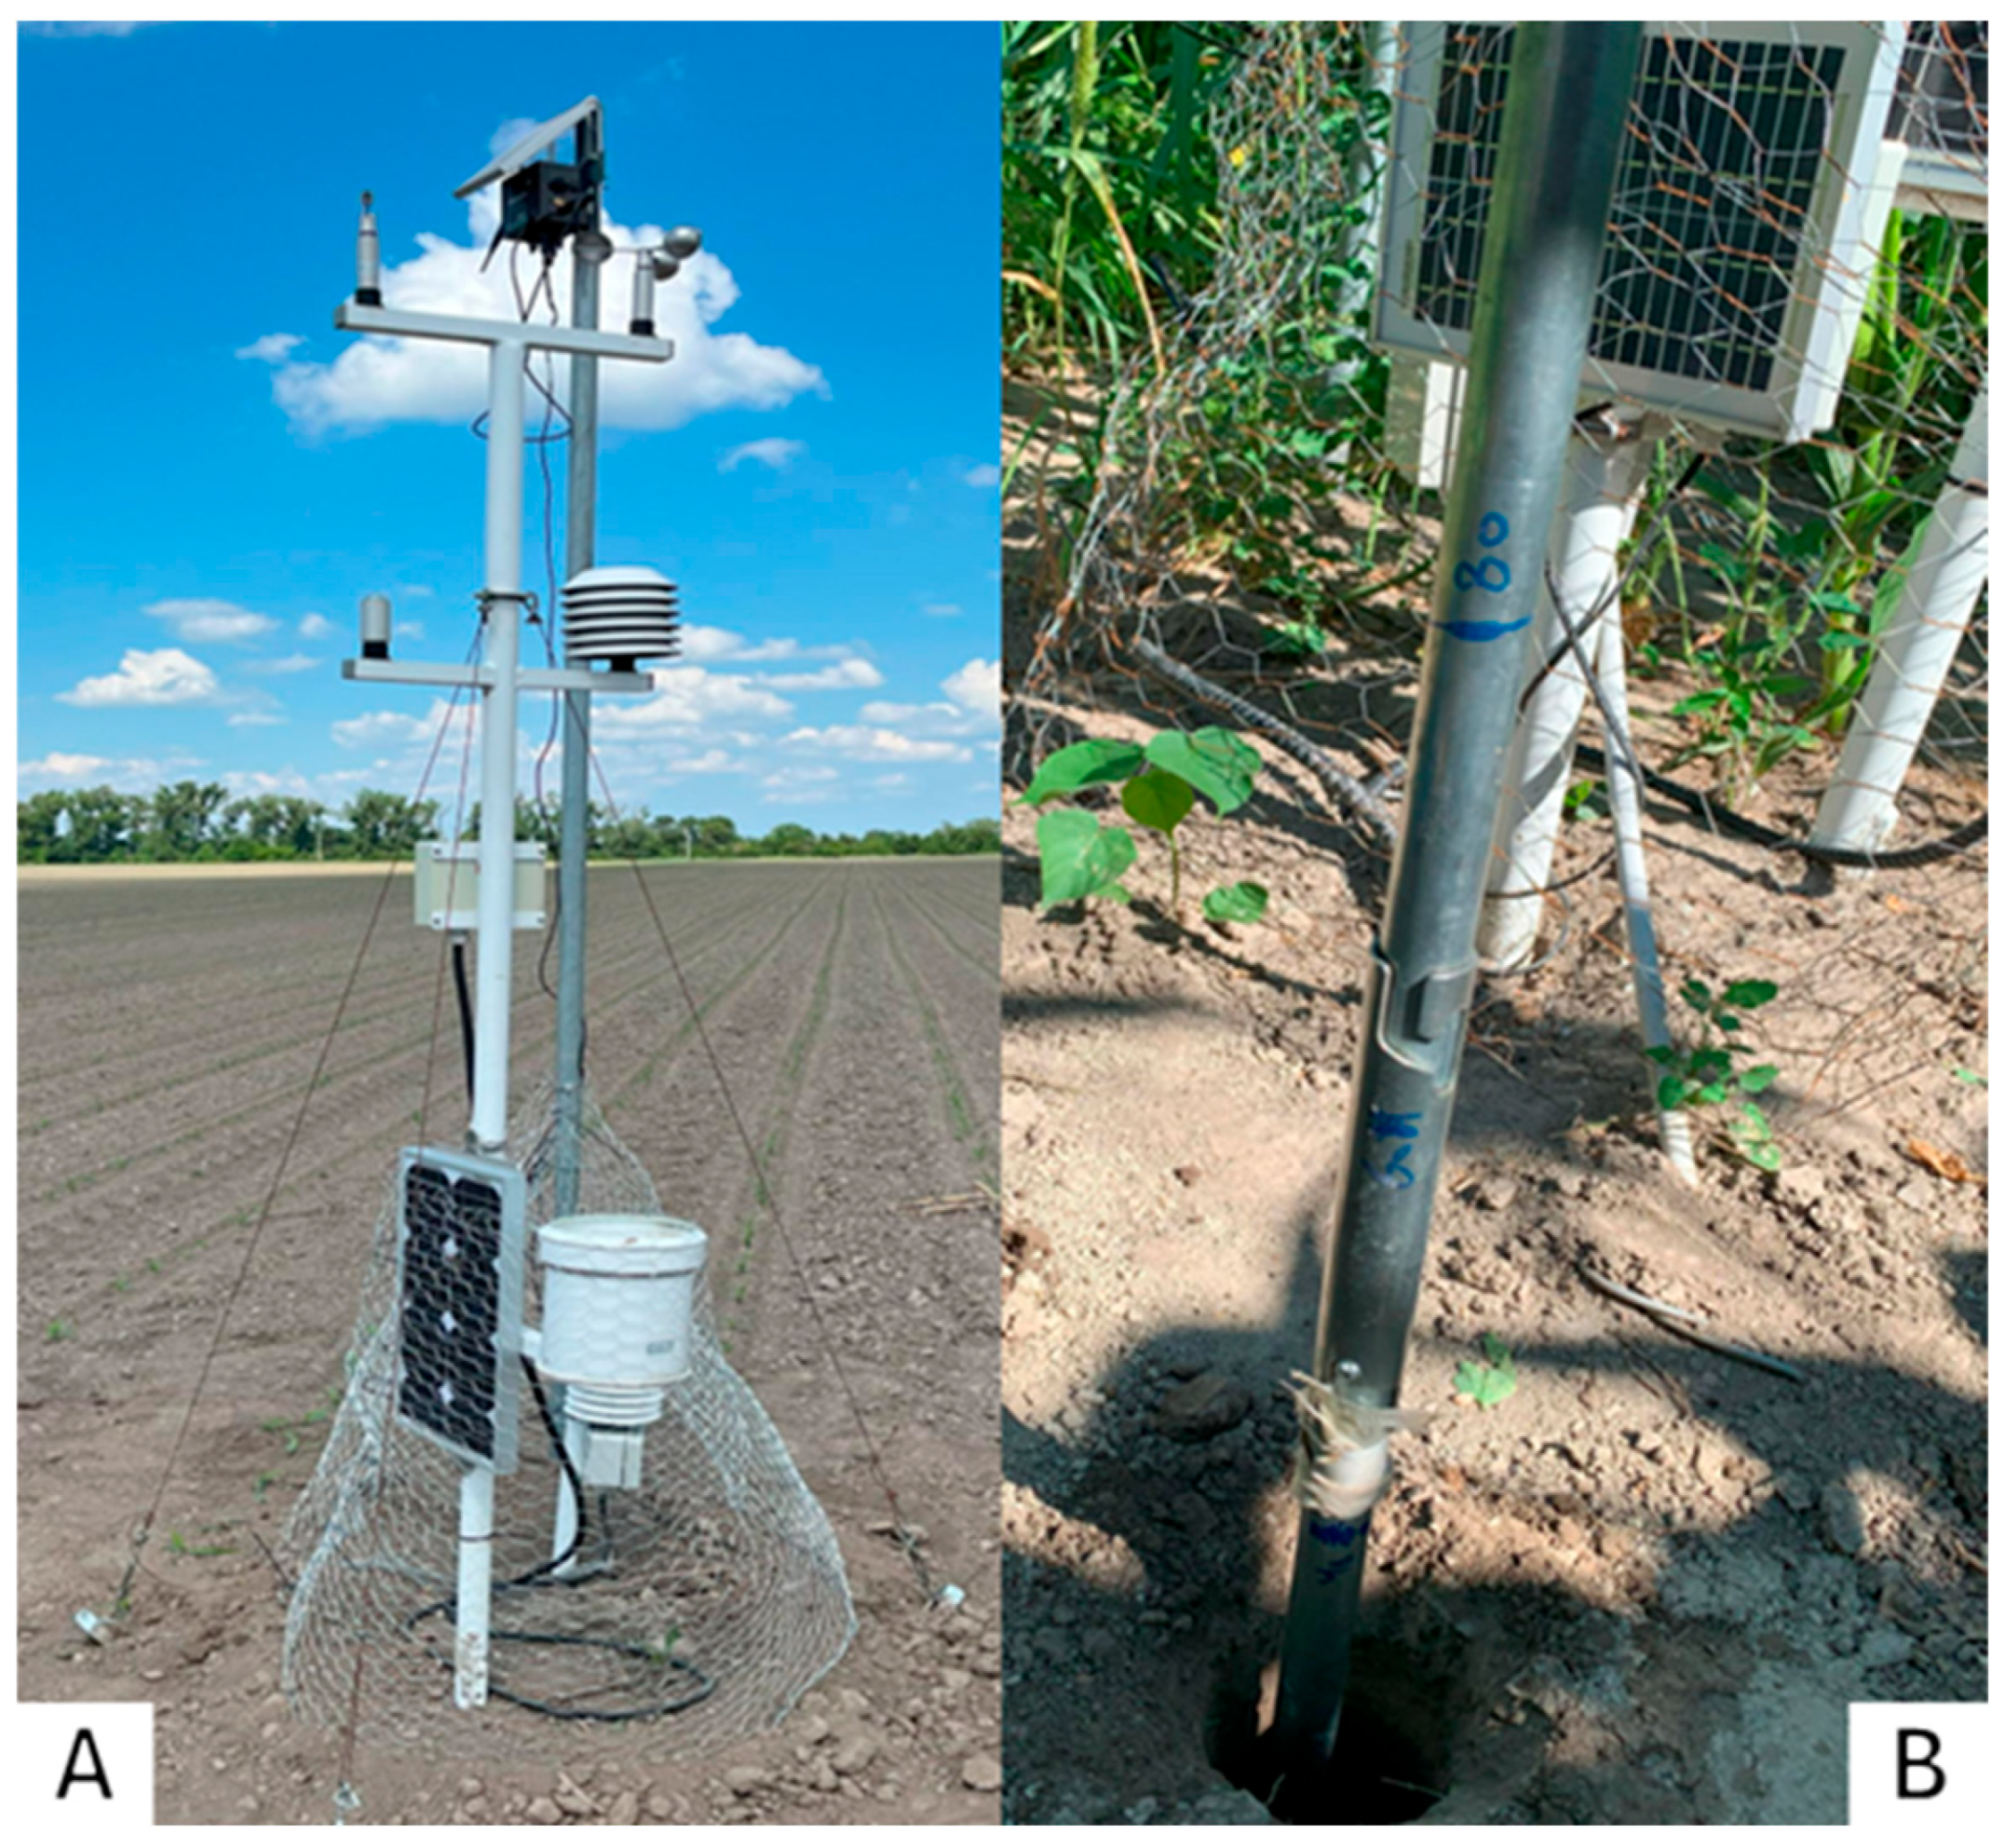
2.3. Meteorological Data Collection Utilizing IoT Sensor

Meteorological data were collected using an IoT-based meteorological sensor (Boreas Ltd., EcoLogger Boreas datalogger unit BEL-06, BHS-06 for temperature and humidity, BWS/s-06 Wind Speed Sensor, BIS-06 global solar radiation, and BPD-06 for precipitation) (Figure 2A). The manufacturer claims an accuracy of ±0.2 °C for temperature, ±2% for humidity, and ±0.1 mm for precipitation. To minimize the measurement error that could affect SMC prediction, the meteorological sensor was calibrated to ensure the accuracy of data. The data were collected at 10–15-min intervals using LoRaWAN, a low power consumption device with the capability of transmitting sensor signals up to 30–40 km away on level terrain. Meteorological parameters, including precipitation (mm), temperature (°C), humidity (%), wind speed (km/h), and solar radiation (W/m2), were used to examine how these meteorological factors influence variations in soil moisture content, considering the effects of both soil depth and soil texture. These features were selected based on their influence on soil moisture dynamics, where precipitation is considered the primary source of soil water and SMC increased with increasing precipitation [32]. Humidity, on the other hand, reflects the air moisture content, influencing the evaporation rate from the surface soil where increasing the humidity reduces the moisture losses by evaporation [33]. Solar radiation also has a significant impact on SMC depletion by its effect on available energy for evaporation and transpiration. Temperature also plays a crucial role in SMC variation; evaporation increases at higher temperatures. Also, wind speed has a role in enhancing moisture losses in the soil surface due to the increase in air movement [34,35]. The data collected represent the average of the field and were assigned to all sampling locations. Also, the data were synchronized with the dates of soil sampling to ensure accurate pairing of meteorological and SMC observations.

2.4. Data Preprocessing and Feature Engineering

Data preprocessing was performed utilizing Python (version 3.10.12) [36], and meteorological data were synchronized with the SMC data. Categorical variables such as soil texture were encoded, and missing data were handled by imputation. Data preparation, such as transformation, cleaning, and statistical testing to ensure uniformity and prevent inaccurate or missing values, was conducted using Python. Six predictive features were selected to train the model including depth (cm), precipitation (mm), temperature (°C), humidity (%), wind speed (km/h), and solar radiation (W/m2), and the target variable is SMC%. These features were chosen based on their availability from field sensors and their well-documented influence on soil moisture dynamics as reported in previous studies, highlighting their agricultural relevance in irrigation management, crop water requirements, and soil water balance assessments [37,38].
To determine whether SMC varied significantly across the five depths while accounting for repeated sampling at the same times across time, Repeated Measures ANOVA (Equation (2)) was performed independently for each soil texture using the statsmodels library’s AnovaRM. The subject was identified using sampling points, and the within-subject element was depth (cm). The statistical significance level was set to p < 0.05.
Using Python, a descriptive statistical analysis was conducted to determine the mean soil moisture content (SMC%), standard deviation (SD), and coefficient of variation (CV%) for each soil texture and depth.
Y i j k = μ + α i + S j + ε i j k
where
Y i j k = SMC measurement at depth i, samplisng point j, time k.
Μ = Overall mean, α i = Fixed effect of depth, S j = Random effect of sampling point.
ε i j k = Residual error.
The coefficient of variation (CV%) was calculated using the following formula:
C V % = S D M e a n × 100

2.5. Development and Optimization of GBR Model

A Gradient Boosting Regressor (GBR) model was used to predict SMC due to its ability to capture the nonlinear interactions between studied features. GBR considers the form of ML algorithms that produce prediction models by integrating multiple weak learners, mainly decision trees, in a sequential manner. The procedure begins with an initial model, and the succeeding models are trained to optimize the previous models’ errors, which effectively minimizes the loss function utilizing gradient descent approaches. This allowed us to develop a robust model with the ability to process complex patterns in data and enhance accuracy [39,40].
The model was trained for the two soil textures (loam and silt loam) separately to increase soil-specific prediction; the models were developed using the scikit-learn library; and the models were optimized using GridSearchCV for optimizing hyperparameters, including n_estimators, learning_rate, max_depth, and min_sample_split. A 5-fold cross-validation was utilized for performance validation to reduce overfitting and enhance robustness of the models. The dataset was split into 70% training and 30% testing sets. Feature importance analysis was carried out to determine the most important features that impact the SMC prediction in each soil texture. All modeling, analysis, and visualization were performed using Python libraries such as pandas, numpy, scikit-learn, seaborn, and matplotlib. The methodology used was developed to ensure the model’s robustness, explainability, and applicability.

2.6. Performance Evaluation Measures

Five metrics were calculated both on the hold-out test set and by cross-validation to quantify the performance of the models.
1-
MSE is the average of the squared differences between predicted and observed values [41].
M S E = 1 n t = 1 n y t y ^ t 2
2-
The root means squared error (RMSE) [41] is as follows:
R M S E = 1 n t = 1 n y t y ^ t 2
3-
Mean Absolute Error (MAE) calculates the average of the absolute differences between predictions and actual observations, as shown in Equation (6) [41]:
M A E = 1 n t = 1 n y t y ^ t
where n is the total number of observations in the dataset, t is the time index or sequence index of an observation, y t is the observed value at time t, and y ^ t is the predicted value by the model at time t.
4-
The Nash Sutcliffe efficiency metric (NSE) [42] is as follows:
N S E = 1 i = 1 n y i y ^ i 2 i = 1 n y i y ¯ 2
where n is the total number of observations in the dataset; y i is the observed value at observation i; y ^ i is the predicted value at observation i; and y ¯ is the mean of observed values.
5-
R-squared (R2) is a statistical metric that represents the proportion of the total variance in the observed data that is explained by the model. Higher R2 indicates less difference between observed and predicted values [43].
R 2 = 1 t = 1 n y t y ^ t 2 t = 1 n y t y ̲ 2

3. Results and Discussion

3.1. Statistical Analysis Results for the Two Soil Textures

The descriptive statistical analysis (Table 2) shows that in loam soil, the highest mean SMC (16.19%) was found at 20 cm with the least variability (CV = 21.7%), while the deepest layer (80 cm) had the most variability (CV = 39%) ranging from 5.49% to 20.77%. In silt loam soil, SMC was generally higher at all depths, with the highest mean SMC at 20 cm (18.27%). However, the deepest layers (60 cm and 80 cm) demonstrated higher variations (CV = 42.6% and 47.8%, respectively) with SMC ranging from 7.92% to 26.58%, indicating less consistent moisture retention at depth.
The repeated measures ANOVA revealed substantial variation in SMC across depths in both soil textures (p < 0.05). The variation in SMC across depths (Figure 3) highlights the more stable behavior of silt loam soil in the upper layers and the higher variability observed in loam soil at deeper layers.
The observed patterns confirmed the significant impact of depth on SMC variability, where deeper layers in both soil textures exhibited higher CV%, indicating less predictable moisture retention likely due to soil structural changes and lower infiltration rates. These findings highlight the impact of soil depth on SMC variability, emphasizing the importance of considering both soil texture and depth during monitoring [44,45] and the need for considering soil texture and depth in irrigation planning and management to optimize water resources and increase water use efficiency.

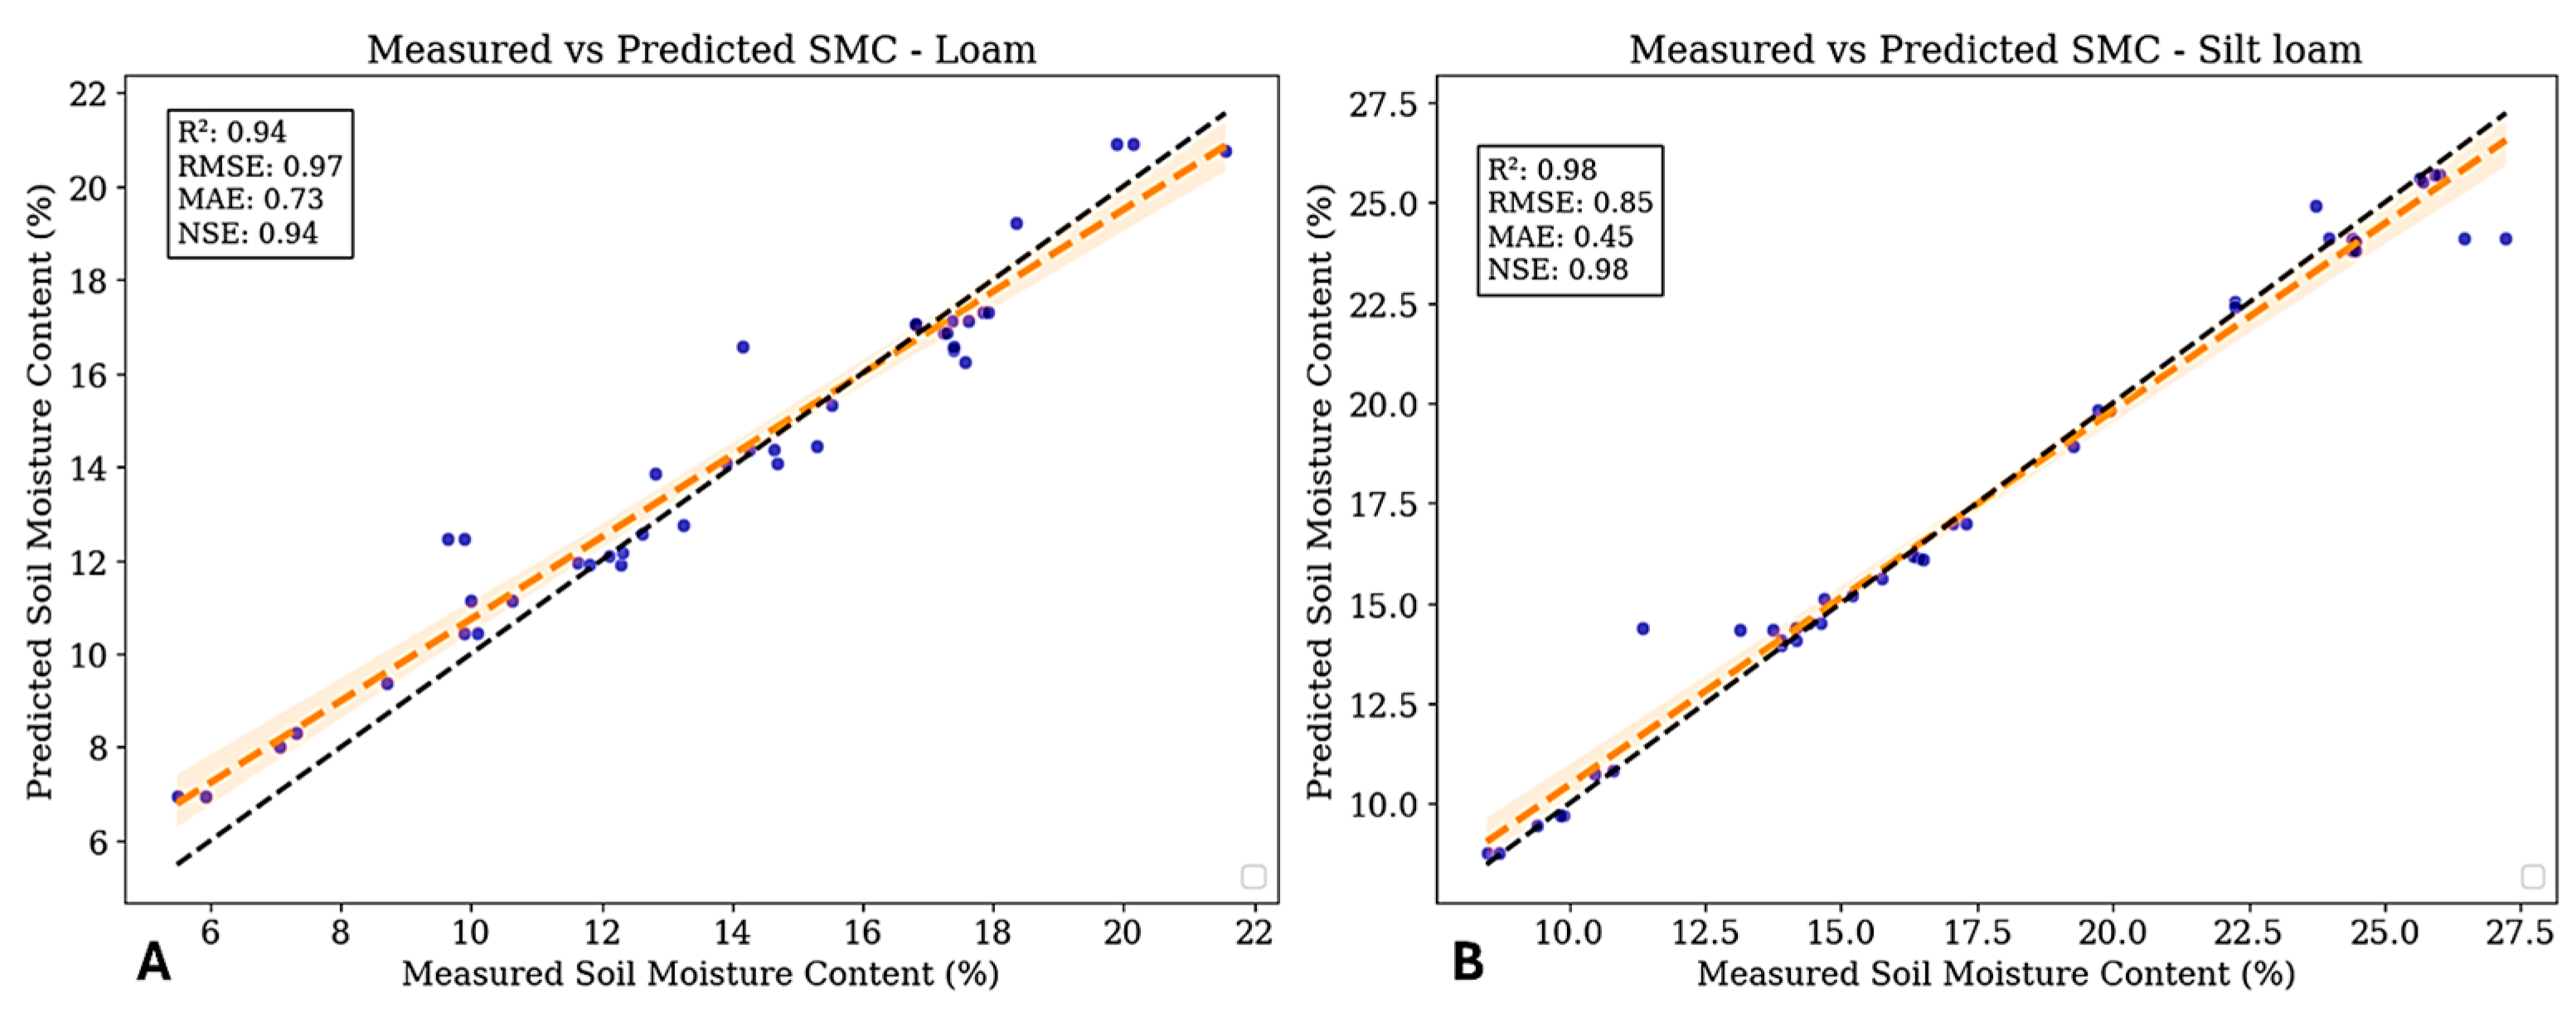
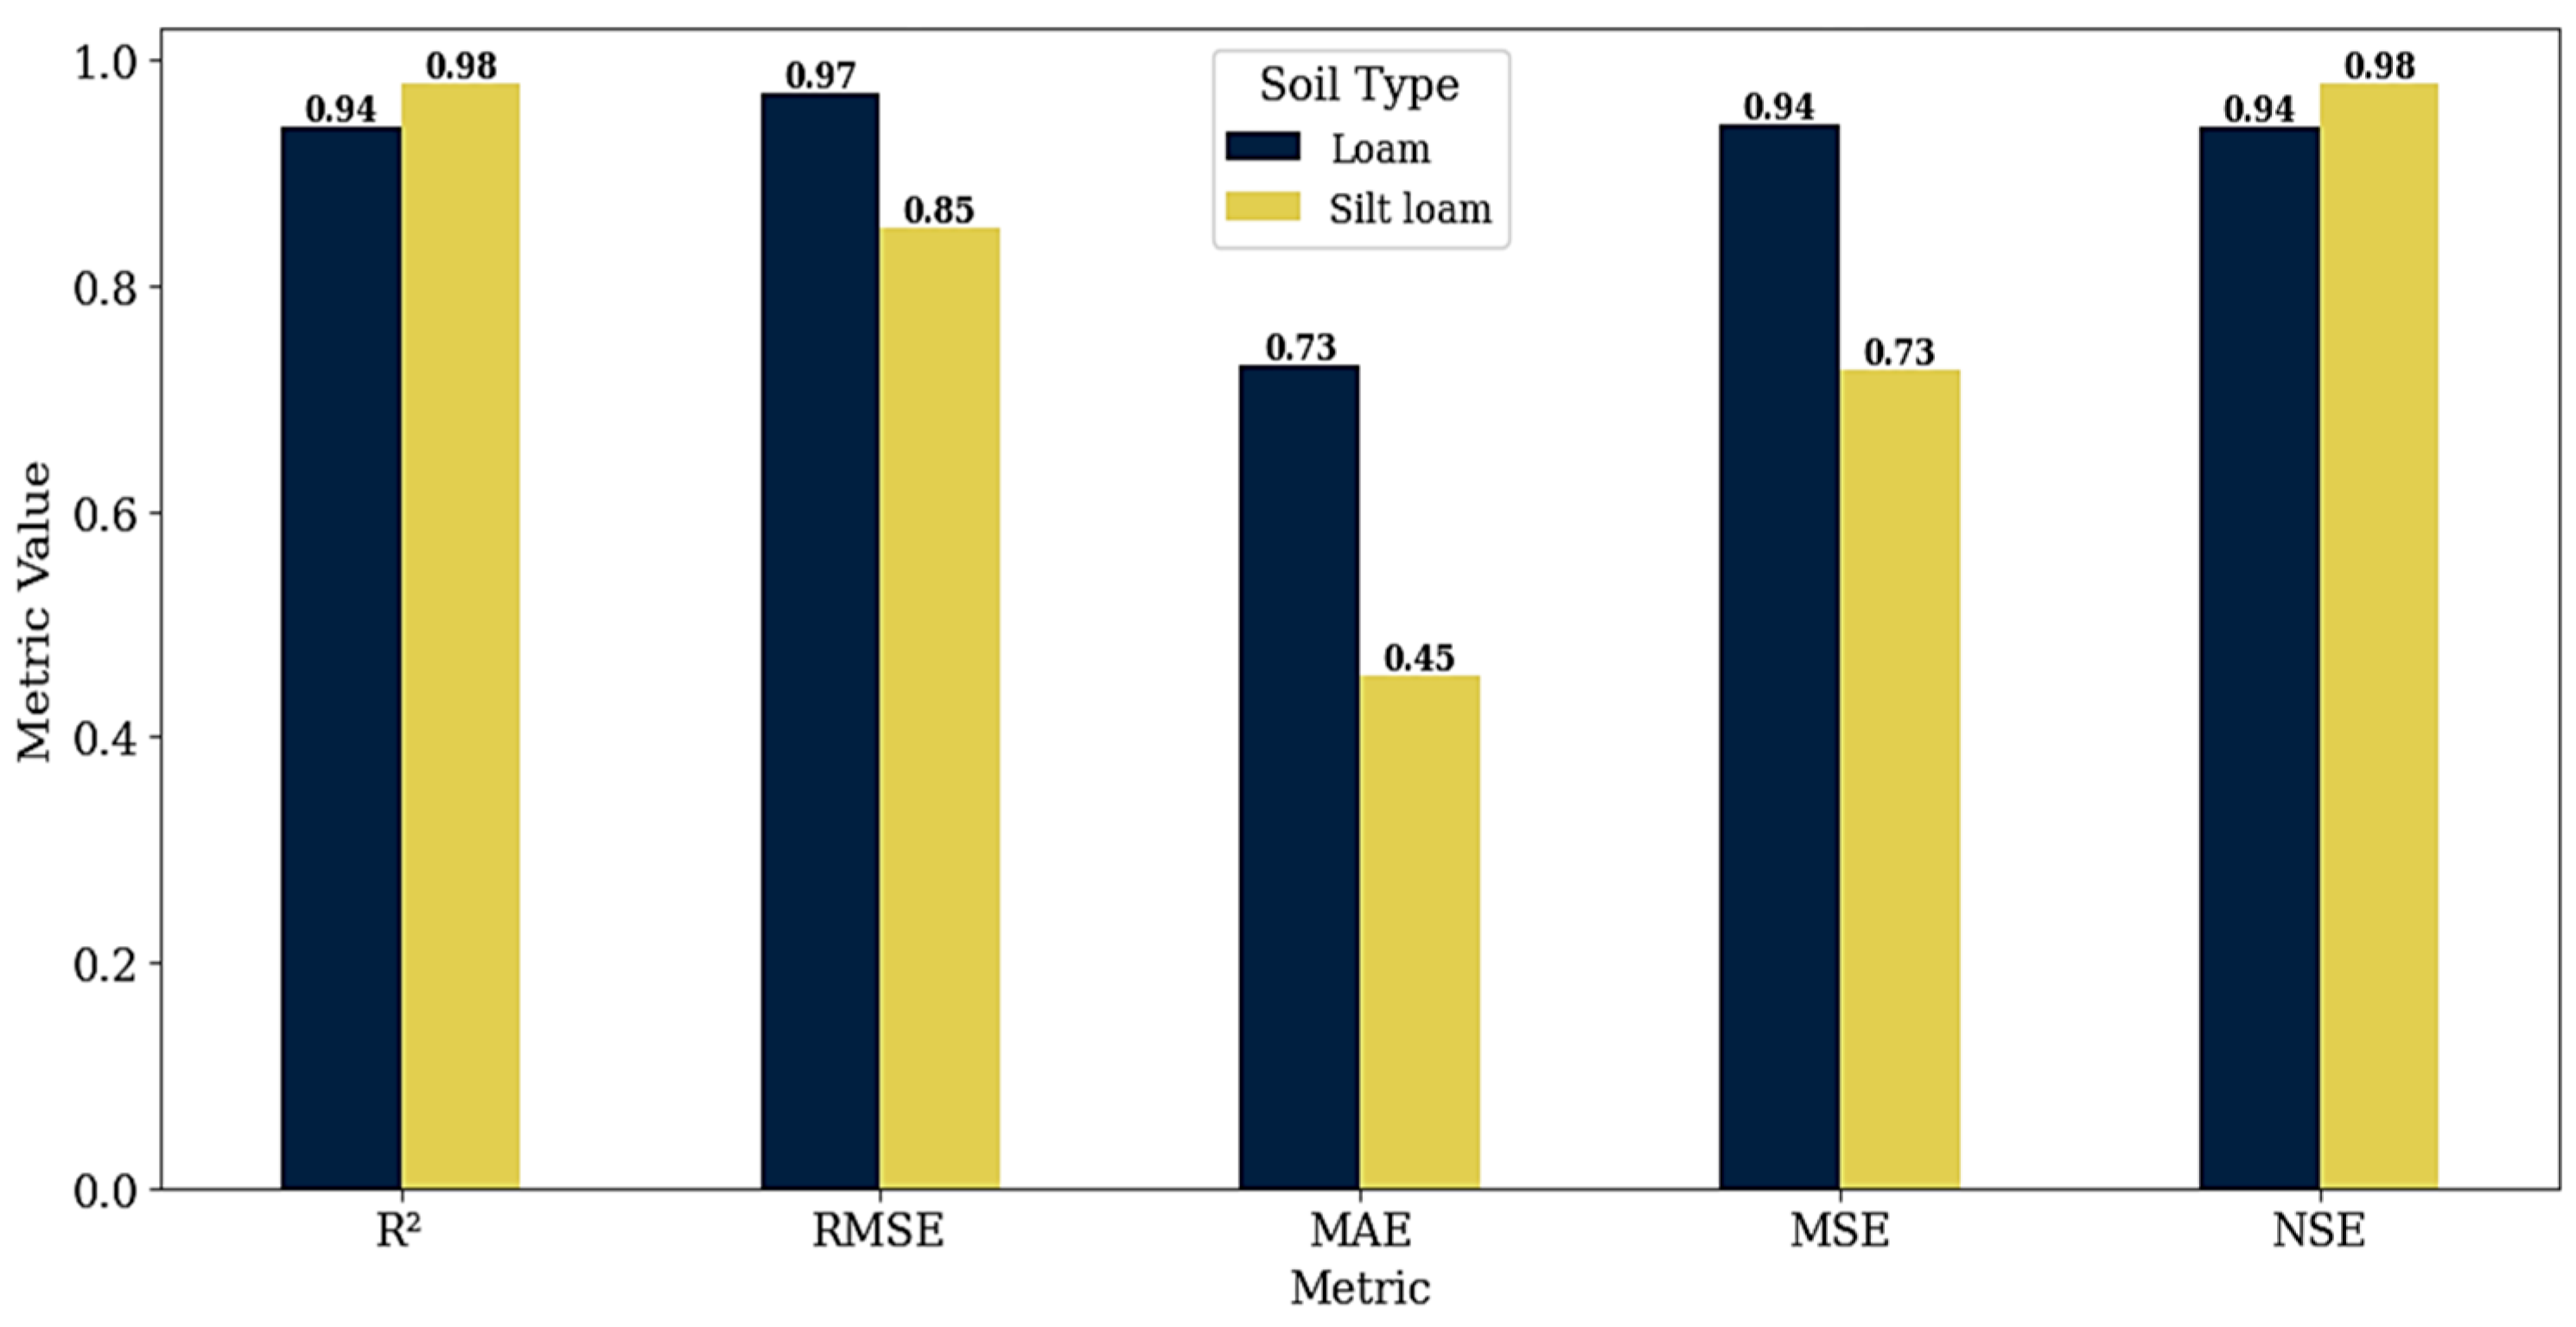
3.2. Model Performance Results

The results show that GBR model performance was highly effective in predicting SMC in both soil textures (Figure 4). The model performance was evaluated using test data and validated by using 5-fold cross-validation. In silt loam soil, the model achieved the highest accuracy, with an R2 of 0.98, MSE of 0.73, RMSE of 0.85, MAE of 0.45, and NSE of 0.95 (Figure 5), reflecting the model’s consistency and generalization capability. In loam soil, the model performance was slightly lower, likely due to the higher variation in SMC values compared with silt loam, with an R2 of 0.94, MSE of 0.94, RMSE of 0.97, MAE of 0.73, and NSE of 0.94. These results highlight the impact of soil texture on predictive model performance, where less prediction accuracy was shown in loam soil due to its higher variability in SMC compared with silt loam soil where its balanced structure and high water retention had a significant role in enhancing model accuracy. These results emphasize the need for soil-specific modeling to enhance SMC prediction [46] and the necessity for integrating more physical soil properties into models for improving prediction reliability across different soil textures.

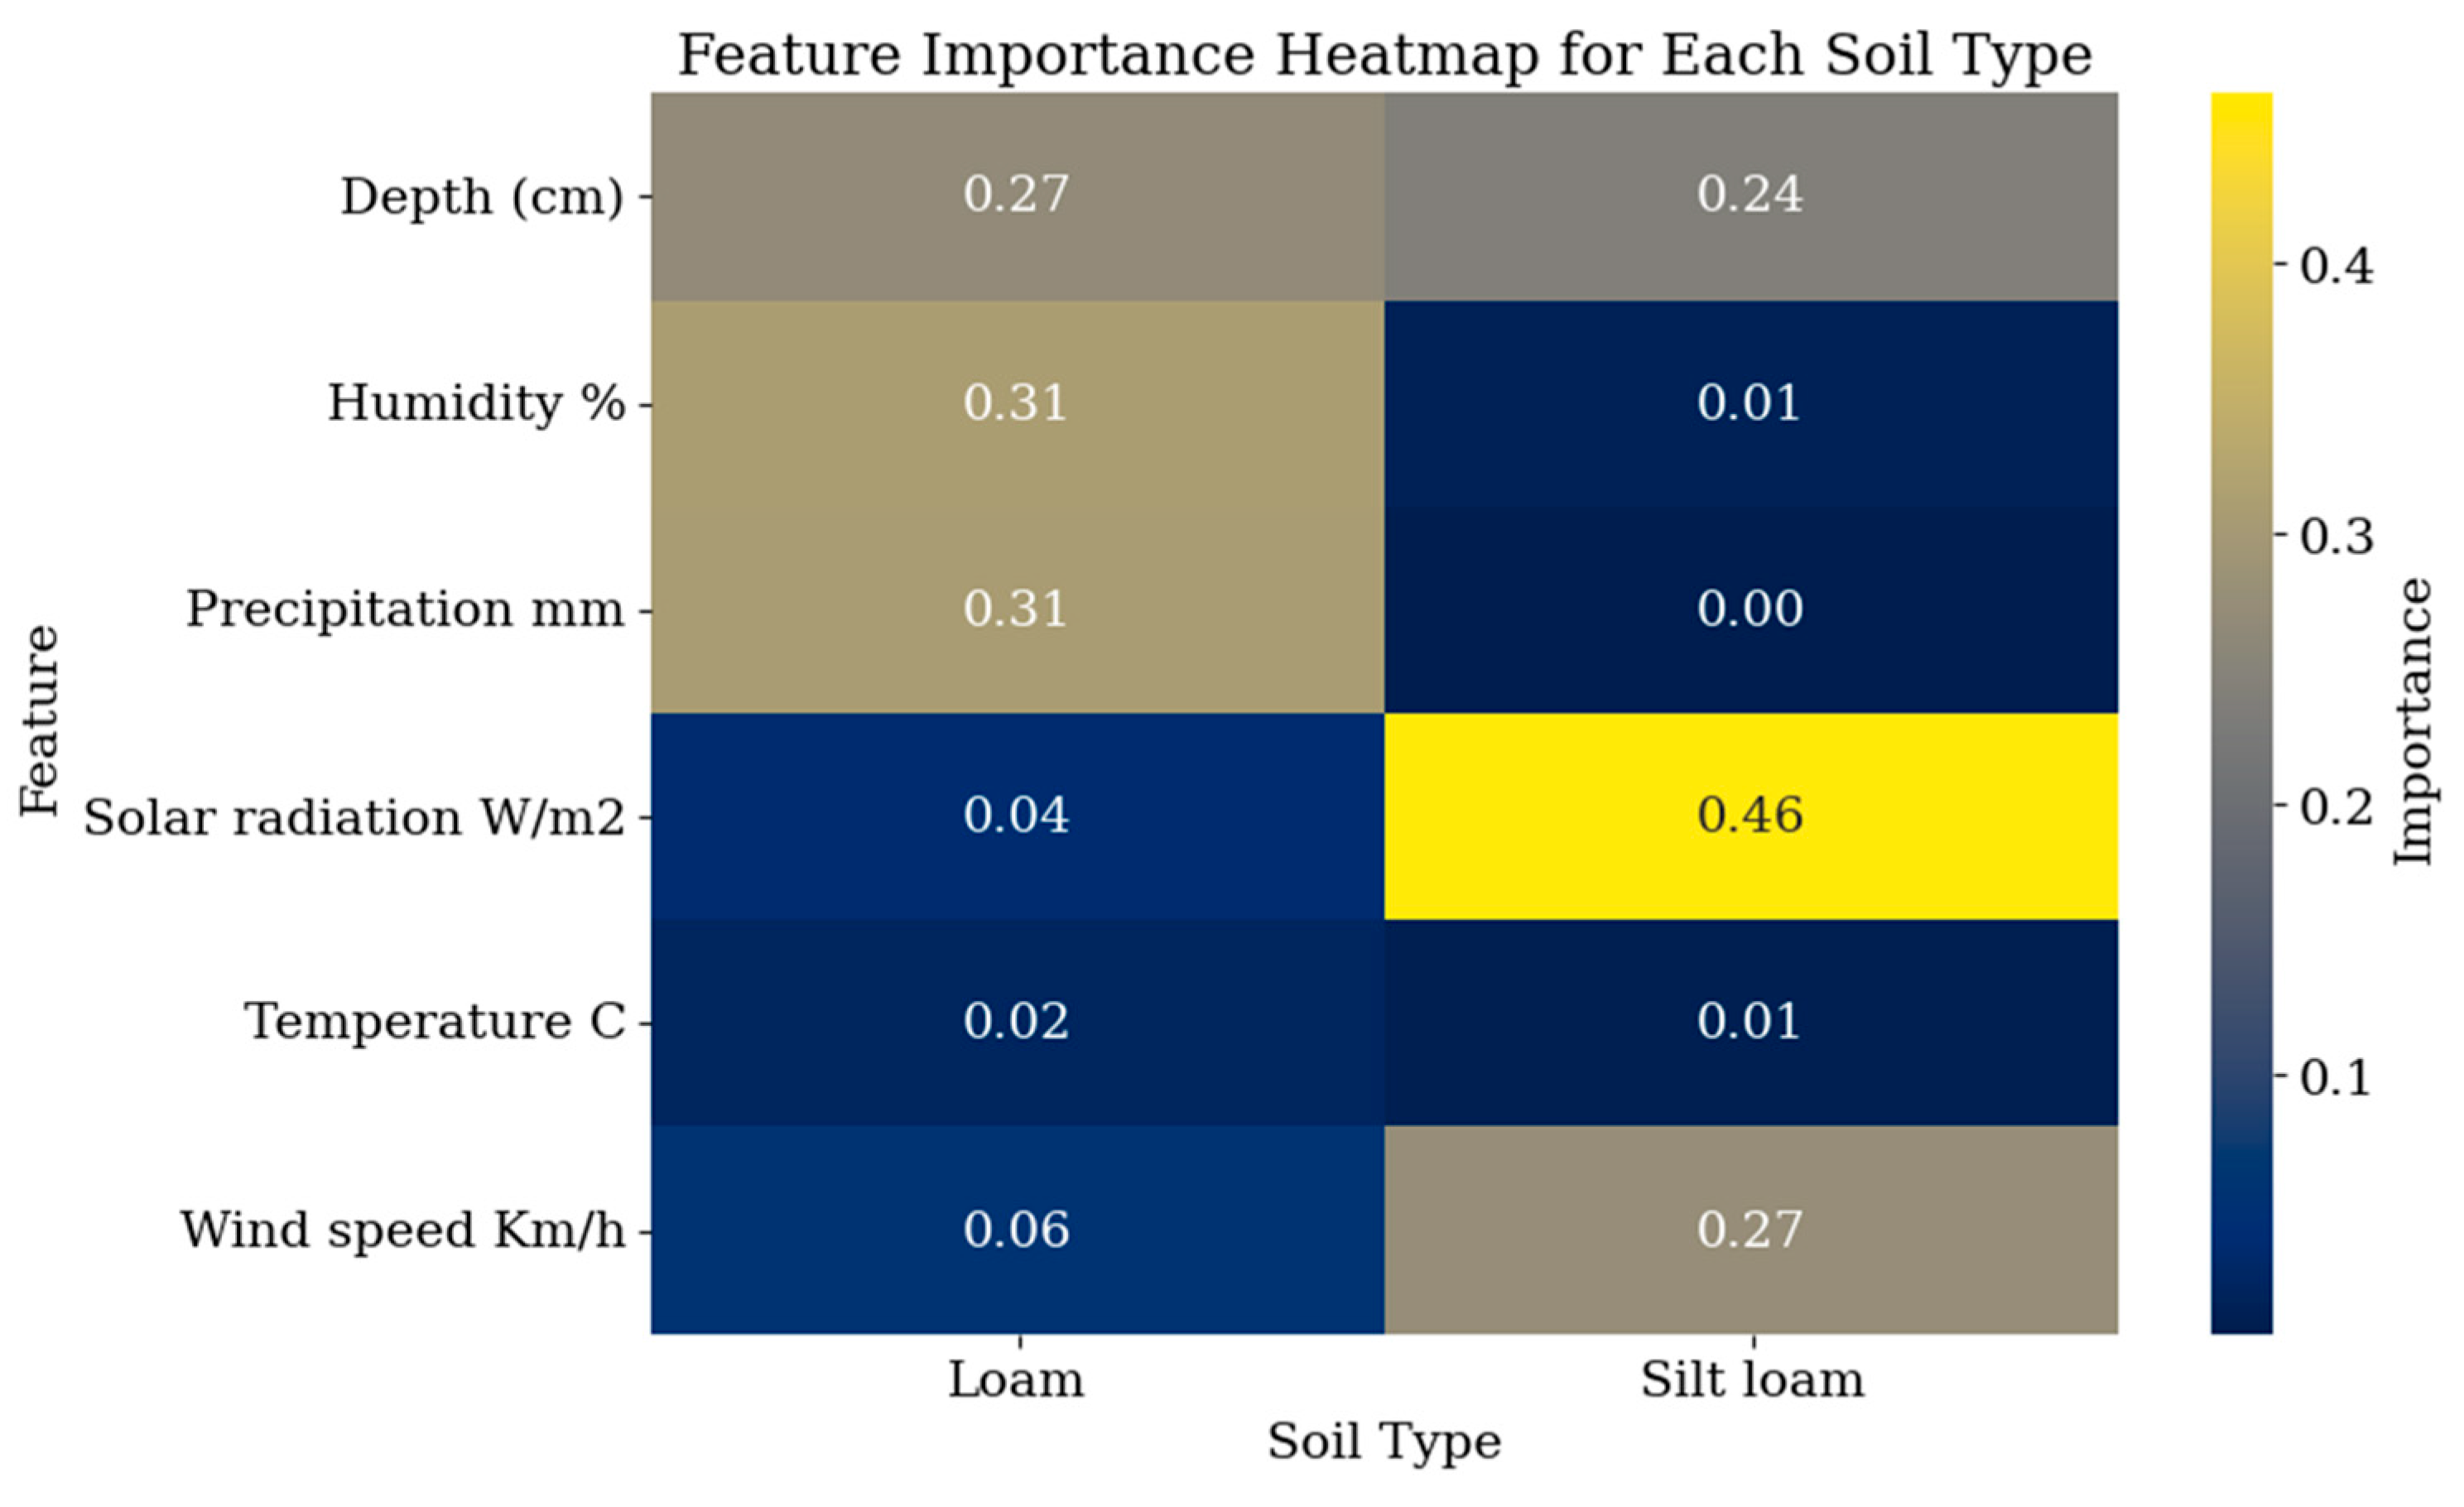
3.3. Feature Importance Analysis

To better understand the influence of meteorological features and soil depth on SMC prediction in the two examined soil textures (loam and silt loam), as well as to improve the model’s interpretability, feature importance analysis was performed for both soil textures using the GBR model. The results reveal that the impact of the analyzed variables varied with soil texture. In loam soil, precipitation and humidity were the most influential features in prediction, with values of 31% for both (Figure 6). Soil depth had a substantial impact on SMC, with an importance value of 27%, as loam soil retains water effectively due to its balanced particle size distribution. Precipitation and humidity also played crucial roles in influencing SMC in loam soil. In contrast, wind speed and solar radiation had minimal impact, both with importance values below 6%. These results emphasize the significance of considering precipitation, humidity, and soil depth when monitoring and predicting SMC in loam soils, particularly as precipitation directly contributes to replenishing soil moisture [47], and humidity indirectly affects soil air water dynamics [48]. Conversely, in silt loam soil, the results emphasize the importance of solar radiation in SMC prediction with a value of 46%, followed by wind speed and depth with values of 26% and 24%, respectively, highlighting the role of radiation-driven evapotranspiration in controlling moisture variation in silt loam soils due to their balanced texture and its high water-holding capacity compared with loam soil and the role of wind in increasing evapotranspiration.
These findings are consistent with previous research, highlighting the critical role of environmental variables such as precipitation and solar radiation in influencing soil moisture dynamics and demonstrating the complexity of soil–water interactions in the studied soils [49]. Additionally, integrating the effects of soil texture and depth provided further insights into their significance in driving the fluctuations and dynamics of SMC [29].
The results also emphasize the importance of incorporating multiple features in model training for SMC prediction across different soil textures, including vegetation indices, which offer valuable information on soil–plant interactions and their impact on soil moisture patterns [19,50]. Increasing the number of sampling locations across the field would further improve the spatial representativity of the dataset, thereby enhancing the model’s robustness and generalizability. The model effectively captured the relationships between the selected input variables and SMC in both soil textures, highlighting its potential to reduce the need for extensive field sampling and support cost-efficient soil moisture monitoring.
These findings show the complex interactions of meteorological conditions and depth with SMC [51]. In contrast, satellite-based models frequently have higher spatial resolution but limited soil penetration and temporal alignment with ground conditions, since they utilize passive microwaves signals and downscaling approaches to predict SMC in the surface soil layers [52]. These findings highlight the significance of soil-specific water management systems and real-time monitoring to improve crop production precision.

4. Conclusions

This study demonstrated that the Gradient Boosting Regressor (GBR) model is a reliable and accurate approach for predicting SMC in two distinct soil textures, loam and silt loam, using soil depth and meteorological data as input features. The GBR models achieved high prediction accuracy in both soil textures, with R2 values exceeding 0.94, and the highest performance observed in silt loam soil. These findings emphasized the robustness and generalization capability of the GBR model in capturing nonlinear interactions between SMC, depth and meteorological parameters, despite the limited sample size and spatial coverage.
The repeated measures ANOVA confirmed significant variation in SMC across depths, particularly in loam soil, where deeper layers exhibited higher variability. In contrast, silt loam soil exhibited higher overall SMC with more stable distribution across depths. The feature importance analysis provided further insights, revealing that precipitation and humidity were the most influential variables in loam soil (both contributing approximately 31%), while solar radiation was the dominant factor in silt loam soil (46%). Soil depth also had a significant effect on SMC prediction in both soil textures, emphasizing the need to consider depth-specific patterns in modeling and monitoring efforts.
These findings underscore the importance of incorporating both meteorological variables and soil-specific characteristics in SMC modeling. The model’s ability to achieve high accuracy with limited data supports its potential to reduce the need for extensive field sampling, contributing to more efficient data-driven decision making for improving water use efficiency and irrigation management, in alignment with SDG 6 goals on sustainable water use and ecosystem protection.
Additionally, the study emphasizes the necessity of soil texture-specific modeling combined with depth-sensitive predictions and explainable feature analysis. However, the study acknowledges the limitation regarding the assumption of independence in statistical analysis, which was addressed by applying a repeated measures design. Future research should further strengthen the modeling framework by incorporating more repeated sampling, integrating additional soil physical properties, and considering the impact of crop growth stages through remote sensing data to enhance the accuracy and applicability of SMC prediction models.

Author Contributions

Conceptualization, A.N. and T.A.; methodology, T.A. and A.N.; validation, T.A., M.N. and A.N.; formal analysis, T.A.; investigation, T.A.; data curation, T.A.; writing—original draft preparation, T.A.; writing—review and editing, A.N. and M.N.; visualization, T.A.; supervision, M.N. All authors have read and agreed to the published version of the manuscript.

Funding

This research received no external funding.

Institutional Review Board Statement

Not applicable.

Informed Consent Statement

Not applicable.

Data Availability Statement

The datasets for this study would be available by the authors upon request.

Acknowledgments

The research was supported by the EKÖP-24-3-I-Sze-107 University Research Fellowship Program of the Ministry for Culture and Innovation from the source of the national research, development, and innovation fund, and by the “Precision Bioengineering Research Group” supported by the “Széchenyi István University Foundation”. And by the János Bolyai Research Scholarship (Bo/00578/24) of the Hungarian Academy of Sciences.

Conflicts of Interest

The authors declare no conflicts of interest.

References

  1. Babaeian, E.; Paheding, S.; Siddique, N.; Devabhaktuni, V.K.; Tuller, M. Estimation of Root Zone Soil Moisture from Ground and Remotely Sensed Soil Information with Multisensor Data Fusion and Automated Machine Learning. Remote Sens. Environ. 2021, 260, 112434. [Google Scholar] [CrossRef]
  2. Ågren, A.M.; Larson, J.; Paul, S.S.; Laudon, H.; Lidberg, W. Use of Multiple LIDAR-Derived Digital Terrain Indices and Machine Learning for High-Resolution National-Scale Soil Moisture Mapping of the Swedish Forest Landscape. Geoderma 2021, 404, 115280. [Google Scholar] [CrossRef]
  3. Mane, S.; Das, N.; Singh, G.; Cosh, M.; Dong, Y. Advancements in Dielectric Soil Moisture Sensor Calibration: A Comprehensive Review of Methods and Techniques. Comput. Electron. Agric. 2024, 218, 108686. [Google Scholar] [CrossRef]
  4. Tarolli, P.; Zhao, W. Drought in Agriculture: Preservation, Adaptation, Migration. Innov. Geosci. 2023, 1, 100002. [Google Scholar] [CrossRef]
  5. Tsai, P.-H.; Huang, Y.; Tai, J.-H. Estimating Soil Water Content from Thermal Images with an Artificial Neural Network. Catena 2024, 241, 108029. [Google Scholar] [CrossRef]
  6. Acharya, B.; Sharma, V. Comparative analysis of soil and water dynamics in conventional and sod-based crop rotation in Florida. Front. Agron. 2025, 7, 1552425. [Google Scholar] [CrossRef]
  7. Markham, A.; Trigoni, N. Magneto-Inductive Networked Rescue System (MINERS). In Proceedings of the 11th International Conference on Information Processing in Sensor Networks, Beijing China, 16–20 April 2012; ACM: New York, NY, USA, 2012; pp. 317–328. [Google Scholar] [CrossRef]
  8. Basara, J.B. Soil Moisture Observations for Flash Flood Research and Prediction. In Coping with Flash Floods; Springer: Dordrecht, The Netherlands, 2001; pp. 231–241. [Google Scholar] [CrossRef]
  9. Zhang, X.; Andreyev, A.; Zumpf, C.; Negri, M.C.; Guha, S.; Ghosh, M. Thoreau: A Subterranean Wireless Sensing Network for Agriculture and the Environment. In Proceedings of the 2017 IEEE Conference on Computer Communications Workshops (INFOCOM WKSHPS), Atlanta, GA, USA, 1–4 May 2017; IEEE: Piscataway, NJ, USA, 2017; pp. 78–84. [Google Scholar] [CrossRef]
  10. Stroobosscher, Z.J.; Athelly, A.; Guzmán, S.M. Assessing Capacitance Soil Moisture Sensor Probes’ Ability to Sense Nitrogen, Phosphorus, and Potassium Using Volumetric Ion Content. Front. Agron. 2024, 6, 1346946. [Google Scholar] [CrossRef]
  11. Gurung, S.; Thakur, S.; Smithers, B.; Acevedo, M. Wireless Soil Moisture Sensor Networks for Agriculture. In Proceedings of the 2020 Waste-Management Education Research (WERC), Las Cruces, NM, USA, 12–15 April 2020; IEEE: Piscataway, NJ, USA, 2020; pp. 1–9. [Google Scholar] [CrossRef]
  12. Neményi, M.; Ambrus, B.; Teschner, G.; Alahmad, T.; Nyéki, A.; Kovács, A.J. Challenges of Ecocentric Sustainable Development in Agriculture with Special Regard to the Internet of Things (IoT), an ICT Perspective. Prog. Agric. Eng. Sci. 2023, 19, 113–122. [Google Scholar] [CrossRef]
  13. Alahmad, T.; Neményi, M.; Nyéki, A. Applying IoT Sensors and Big Data to Improve Precision Crop Production: A Review. Agronomy 2023, 13, 2603. [Google Scholar] [CrossRef]
  14. Maraveas, C.; Piromalis, D.; Arvanitis, K.G.; Bartzanas, T.; Loukatos, D. Applications of IoT for Optimized Greenhouse Environment and Resources Management. Comput. Electron. Agric. 2022, 198, 106993. [Google Scholar] [CrossRef]
  15. Wu, Y.; Yang, Z.; Liu, Y. Internet-of-Things-Based Multiple-Sensor Monitoring System for Soil Information Diagnosis Using a Smartphone. Micromachines 2023, 14, 1395. [Google Scholar] [CrossRef] [PubMed]
  16. Songara, J.C.; Patel, J.N. Calibration and Comparison of Various Sensors for Soil Moisture Measurement. Measurement 2022, 197, 111301. [Google Scholar] [CrossRef]
  17. Li, Z.-L.; Leng, P.; Zhou, C.; Chen, K.-S.; Zhou, F.-C.; Shang, G.-F. Soil Moisture Retrieval from Remote Sensing Measurements: Current Knowledge and Directions for the Future. Earth Sci. Rev. 2021, 218, 103673. [Google Scholar] [CrossRef]
  18. Zhu, S.; Cui, N.; Jin, H.; Jin, X.; Guo, L.; Jiang, S.; Wu, Z.; Lv, M.; Chen, F.; Liu, Q.; et al. Optimization of Multi-Dimensional Indices for Kiwifruit Orchard Soil Moisture Content Estimation Using UAV and Ground Multi-Sensors. Agric. Water Manag. 2024, 294, 108705. [Google Scholar] [CrossRef]
  19. Zheng, J.; Jin, X.; Li, Q.; Lang, J.; Yin, X. Soil Moisture Variation and Affecting Factors Analysis in the Zhangjiakou–Chengde District Based on Modified Temperature Vegetation Dryness Index. Ecol. Indic. 2024, 168, 112775. [Google Scholar] [CrossRef]
  20. Chandrappa, V.Y.; Ray, B.; Ashwatha, N.; Shrestha, P. Spatiotemporal Modeling to Predict Soil Moisture for Sustainable Smart Irrigation. Internet Things 2023, 21, 100671. [Google Scholar] [CrossRef]
  21. Li, B.; You, Z.; Ni, K.; Wang, Y. Prediction of Soil Compaction Parameters Using Machine Learning Models. Appl. Sci. 2024, 14, 2716. [Google Scholar] [CrossRef]
  22. Islam, M.N.; Logofatu, D.; Haque, M.Z. A Comparative Study on Machine Learning Methods Through Evaluating the Impact of Contributing Factors on The Accuracy of Soil Moisture Prediction. In Proceedings of the 2023 International Conference on Innovations in Intelligent Systems and Applications (INISTA), Hammamet, Tunisia, 20–23 September 2023; IEEE: Piscataway, NJ, USA, 2023; pp. 1–6. [Google Scholar] [CrossRef]
  23. Zambudio Martínez, M.; da Silveira, L.H.M.; Marin-Perez, R.; Gomez, A.F.S. Development and Comparison of Artificial Neural Networks and Gradient Boosting Regressors for Predicting Topsoil Moisture Using Forecast Data. AI 2025, 6, 41. [Google Scholar] [CrossRef]
  24. Ren, Y.; Ling, F.; Wang, Y. Research on Provincial-Level Soil Moisture Prediction Based on Extreme Gradient Boosting Model. Agriculture 2023, 13, 927. [Google Scholar] [CrossRef]
  25. Celik, M.F.; Isik, M.S.; Yuzugullu, O.; Fajraoui, N.; Erten, E. Soil Moisture Prediction from Remote Sensing Images Coupled with Climate, Soil Texture and Topography via Deep Learning. Remote Sens. 2022, 14, 5584. [Google Scholar] [CrossRef]
  26. Fu, R.; Xie, L.; Liu, T.; Zheng, B.; Zhang, Y.; Hu, S. A Soil Moisture Prediction Model, Based on Depth and Water Balance Equation: A Case Study of the Xilingol League Grassland. Int. J. Environ. Res. Public Health 2023, 20, 1374. [Google Scholar] [CrossRef] [PubMed]
  27. United Nations. UN-Water Annual Report 2023. 2024. Available online: https://www.unwater.org/publications/un-water-annual-report-2023 (accessed on 4 November 2024).
  28. Popp, J.; Oláh, J.; Neményi, M.; Nyéki, A. Global Challenges and the ‘Farm to Fork’ Strategies of the European Green Deal: Blessing or Curse. Prog. Agric. Eng. Sci. 2024, 20, 101–111. [Google Scholar] [CrossRef]
  29. Nyéki, A.; Daróczy, B.; Kerepesi, C.; Neményi, M.; Kovács, A.J. Spatial Variability of Soil Properties and Its Effect on Maize Yields within Field—A Case Study in Hungary. Agronomy 2022, 12, 395. [Google Scholar] [CrossRef]
  30. USDA. Natural Resources Conservation Service. Soil Classification; Retrieved 17 October 2020; 2020. Available online: https://www.nrcs.usda.gov/wps/portal/nrcs/main/soils/survey/class/ (accessed on 29 July 2024).
  31. Dirksen, C. Soil Physics Measurements; Catena Verlag: Stuttgart, Germany, 1999; ISBN 3923381433. [Google Scholar]
  32. Ehtasham, L.; Sherani, S.H.; Nawaz, F. Acceleration of the Hydrological Cycle and Its Impact on Water Availability over Land: An Adverse Effect of Climate Change. Meteorol. Hydrol. Water Manag. 2024, 12, 1–21. [Google Scholar] [CrossRef]
  33. Moghadas, D.; Jadoon, K.Z.; Vanderborght, J.; Lambot, S.; Vereecken, H. Effects of Near Surface Soil Moisture Profiles During Evaporation on Far-Field Ground-Penetrating Radar Data: A Numerical Study. Vadose Zone J. 2013, 12, 1–11. [Google Scholar] [CrossRef]
  34. Granata, F. Evapotranspiration Evaluation Models Based on Machine Learning Algorithms—A Comparative Study. Agric. Water Manag. 2019, 217, 303–315. [Google Scholar] [CrossRef]
  35. Du, M.; Zhang, J.; Wang, Y.; Liu, H.; Wang, Z.; Liu, C.; Yang, Q.; Hu, Y.; Bao, Z.; Liu, Y.; et al. Evaluating the Contribution of Different Environmental Drivers to Changes in Evapotranspiration and Soil Moisture, a Case Study of the Wudaogou Experimental Station. J. Contam. Hydrol. 2021, 243, 103912. [Google Scholar] [CrossRef]
  36. Python Software Foundation. Python Language Reference, Version 3.10. 2024. Available online: https://www.python.org (accessed on 11 November 2024).
  37. Hussain, M.; Sharmin, N.; Shafiul, S.B. Estimation of Soil Moisture with Meteorological Variables in Supervised Machine Learning Models. In Proceedings of the 2023 International Conference on Electrical, Computer and Communication Engineering (ECCE), Chittagong, Bangladesh, 23–25 February 2023; IEEE: Piscataway, NJ, USA, 2023; pp. 1–6. [Google Scholar] [CrossRef]
  38. Wang, S.; Fu, G. Modelling Soil Moisture Using Climate Data and Normalized Difference Vegetation Index Based on Nine Algorithms in Alpine Grasslands. Front. Environ. Sci. 2023, 11, 1130448. [Google Scholar] [CrossRef]
  39. Friedman, J.H. Greedy Function Approximation: A Gradient Boosting Machine. Ann. Stat. 2001, 29, 1189–1232. [Google Scholar] [CrossRef]
  40. Natekin, A.; Knoll, A. Gradient Boosting Machines, a Tutorial. Front. Neurorobot. 2013, 7, 21. [Google Scholar] [CrossRef]
  41. Willmott, C.J.; Ackleson, S.G.; Davis, R.E.; Feddema, J.J.; Klink, K.M.; Legates, D.R.; O’Donnell, J.; Rowe, C.M. Statistics for the Evaluation and Comparison of Models. J. Geophys. Res. Ocean. 1985, 90, 8995–9005. [Google Scholar] [CrossRef]
  42. Nash, J.E.; Sutcliffe, J.V. River Flow Forecasting through Conceptual Models Part I—A Discussion of Principles. J. Hydrol. 1970, 10, 282–290. [Google Scholar] [CrossRef]
  43. Wright, S. Correlation and Causation. J. Agric. Res. 1921, 20, 557. [Google Scholar]
  44. Guo, X.; Fu, Q.; Hang, Y.; Lu, H.; Gao, F.; Si, J. Spatial Variability of Soil Moisture in Relation to Land Use Types and Topographic Features on Hillslopes in the Black Soil (Mollisols) Area of Northeast China. Sustainability 2020, 12, 3552. [Google Scholar] [CrossRef]
  45. Zhao, W.; Fang, X.; Daryanto, S.; Zhang, X.; Wang, Y. Factors Influencing Soil Moisture in the Loess Plateau, China: A Review. Environ. Sci. Trans. R. Soc. Edinb. 2018, 109, 501–509. [Google Scholar] [CrossRef]
  46. Kandala, R.; Franssen, H.H.; Chaudhuri, A.; Sekhar, M. The Value of Soil Temperature Data versus Soil Moisture Data for State, Parameter, and Flux Estimation in Unsaturated Flow Model. Vadose Zone J. 2024, 23, e20298. [Google Scholar] [CrossRef]
  47. Sehler, R.; Li, J.; Reager, J.; Ye, H. Investigating Relationship Between Soil Moisture and Precipitation Globally Using Remote Sensing Observations. J. Contemp. Water Res. Educ. 2019, 168, 106–118. [Google Scholar] [CrossRef]
  48. McColl, K.A.; Tang, L.I. An Analytic Theory of Near-Surface Relative Humidity over Land. J. Clim. 2024, 37, 1213–1230. [Google Scholar] [CrossRef]
  49. Leng, P.; Li, Z.-L.; Duan, S.-B.; Gao, M.-F.; Huo, H.-Y. A Practical Approach for Deriving All-Weather Soil Moisture Content Using Combined Satellite and Meteorological Data. ISPRS J. Photogramm. Remote Sens. 2017, 131, 40–51. [Google Scholar] [CrossRef]
  50. Ines, A.V.M.; Das, N.N.; Hansen, J.W.; Njoku, E.G. Assimilation of Remotely Sensed Soil Moisture and Vegetation with a Crop Simulation Model for Maize Yield Prediction. Remote Sens. Environ. 2013, 138, 149–164. [Google Scholar] [CrossRef]
  51. Zhang, Z.; Chen, X.; Pan, Z.; Zhao, P.; Zhang, J.; Jiang, K.; Wang, J.; Han, G.; Song, Y.; Huang, N.; et al. Quantitative Estimation of the Effects of Soil Moisture on Temperature Using a Soil Water and Heat Coupling Model. Agriculture 2022, 12, 1371. [Google Scholar] [CrossRef]
  52. Meng, X.; Zeng, J.; Yang, Y.; Zhao, W.; Ma, H.; Letu, H.; Zhu, Q.; Liu, Y.; Wang, P.; Peng, J. High-Resolution Soil Moisture Mapping through Passive Microwave Remote Sensing Downscaling. Innov. Geosci. 2024, 2, 100105. [Google Scholar] [CrossRef]
Figure 1. Soil texture in the 23 ha maize field in Mosonmagyaróvár, Hungary, with GPS points of the sampling locations.
Applsci 15 05889 g001
Figure 2. (A) IoT-based meteorological sensor station within the field. (B) Collecting soil samples using a hand auger from sampling points around the sensor stations.
Applsci 15 05889 g002
Figure 3. Variations in soil moisture content (SMC%) across five depths and two soil textures during the studied vegetation period, based on repeated measures ANOVA.
Applsci 15 05889 g003
Figure 4. Model performance and comparison between SMC predicted and measured values in (A) loam and (B) silt loam soil.
Applsci 15 05889 g004
Figure 5. Evaluation metrics (R2, MSE, RMSE, MAE, and NSE) for soil moisture content prediction in loam and silt loam soils using the GBR model.
Applsci 15 05889 g005
Figure 6. Feature importance analysis results of GBR model in loam and silt loam soils.
Applsci 15 05889 g006
Table 1. Soil properties averages and ranges of soil content of sand, silt, and clay in the five depths in the two studied soil textures with mean SMC.
Soil TexturepHSand % RangeSilt % RangeClay % RangeMean SMC %Std of SMC %Bulk Density
Loam7.61440.99–49.0140.91–45.9710.10–14.5013.793.941.538
Silt loam7.4512.36–15.3163.70–70.1917.40–2116.955.071.52
Table 2. Descriptive statistical analysis results for both soil textures at five depths.
Soil TextureDepth (cm)Mean SMC (%)SD (%)CV (%)
Loam512.83.0824
Loam2016.193.5121.7
Loam4014.663.7625.6
Loam6012.614.3934.8
Loam8012.684.9439
Silt loam514.992.6217.5
Silt loam2018.273.5119.2
Silt loam4018.034.1122.8
Silt loam6016.977.2342.6
Silt loam8016.477.8747.8
Disclaimer/Publisher’s Note: The statements, opinions and data contained in all publications are solely those of the individual author(s) and contributor(s) and not of MDPI and/or the editor(s). MDPI and/or the editor(s) disclaim responsibility for any injury to people or property resulting from any ideas, methods, instructions or products referred to in the content.

